Embed Size (px)
Citation preview

Myelodysplastic Syndromes: Is It Time to Incorporate NGS and What
Is New in Terms of Therapy?
Rami Komrokji, MDSenior Member & Professor of Oncologic Sciences
Section Head – Leukemia & MDSVice Chair - Malignant Hematology Department
H Lee Moffitt Cancer Center & Research InstituteTampa, Florida

COI
• Relevant financial relationships in the past twelve months by presenter or spouse/partner.
Consultant: Incyte, CelgeneSpeakers Bureau: Novartis
The speaker will directly disclosure the use of products for which are not labeled (e.g., off label use) or if the product is still investigational.

Myelodysplastic Syndromes (MDS)• A group of malignant hematopoietic neoplasms
characterized by1
– Bone marrow failure with resultant cytopenia and related complications
– Evidence of clonality by cytogenetic abnormalities or somatic gene mutations.
– Dysplastic cytologic morphology is the hallmark of the disease
– Tendency to progress to AML• Overall incidence 3.7-4.8/100,0002
– In US (true estimates ≈37,000-48,000)• Median age: 70 yrs; incidence: 34-47/100,000 >75 yrs3
AML = acute myeloid leukemia.1. Bennett J, et al. The myelodysplastic syndromes. In: Abeloff MD, et al, eds. Clinical Oncology. New York, NY: Churchill Livingstone; 2004:2849-2881. 2. SEER data. 2000-2009. 3. SEER 18 data. 2000-2009.

Minimal Diagnostic Criteria
4
Cytopenia(s):
• Hb <11 g/dL, or
• ANC <1500/μL, or
• Platelets <100 x 109/L
MDS “decisive” criteria:
• >10% dysplastic cells in 1 or more lineages, or
• 5-19% blasts, or
• Abnormal karyotype typical for MDS, or
• Evidence of clonality
EXCLUDE other causes of cytopenias and morphological changes:
• Vitamin B12/folate deficiency
• HIV or other viral infection
• Copper deficiency
• Alcohol abuse
• Medications (esp. methotrexate, azathioprine, recent chemotherapy)
• Autoimmune conditions (ITP, Felty syndrome, SLE etc.)
• Congenital syndromes (Fanconi anemia etc.)
• Other hematological disorders (aplastic anemia, LGL disorders, MPN etc.)

MDS pathogenesis model

KaryotypeArray CGHSNP Array Karyotype/FISH
GenotypingSequencing
Observed Frequency in MDS
Genetic Abnormalities in MDS
6
Translocations/Rearrangements
Uniparental Disomy/ Microdeletions
Copy Number Change
Point Mutations
Rare in MDS Rare – often at sites of point mutations About 50% of cases Most common
t(6;9)
i(17q)
t(1;7)
t(3;?)
t(11;?)
inv(3)
idic(X)(q13)
4q - TET2
7q - EZH2
11q - CBL
17p - TP53
del(5q)-7/del(7q)
del(20q)
del(17p)
del(11q)
+8
-Y
Likely in all cases
~80% of cases have mutations in a known gene
Vardiman,JW, et al. Blood. 2009;114(5): 937-951. Tiu R, et al. Blood. 2011;117(17):4552-4560. Schanz, J, et al. J Clin Oncol. 2011; 29(15):1963-1970. Bejar R, et al. N Engl J Med. 2011;364(26):2496-2506. Bejar R, et al. J Clin Oncol. 2012;30(27):3376-3382.

What is a mutation?
…TTGAGTCG….
…TTGAGTAG….
• Germline or somatic• Synonymous versus non-synonymous• SNV/polymorphism vs pathological• Driver vs passenger
Type of mutations• Missense• Non-sense• Insertion• Deletion• Frame shift• duplication

RUNX1ETV6
WT1 PHF6
GATA2
DNMT3AEZH2
ASXL1
IDH1 & 2
UTX
TP53
Transcription FactorsTyrosine Kinase Pathway
Epigenetic Dysregulation
SF3B1
Splicing Factors
JAK2
NRAS
BRAFKRAS
RTKs
PTPN11
NOTCH?MAML?ZSWIM4?UMODL1?
CBL
NPM1
ATRX
Others
SRSF2
U2AF1ZRSF2
SETBP1
SF1SF3A1
PRPF40B
U2AF2
PRPF8
BCOR
TET2
Genes Recurrently Mutated in MDS
Courtesy of Bejar R.

Haferlach et al., Leukemia (2014) 28, 241–247; doi:10.1038/leu.2013.336.
~89% of patients had a mutation by NGS
Recurrent Genetic Mutations in MDS

MDS DIAGNOSIS

MyelodysplasticSyndromes (MDS)
Aplastic Anemia
Acute MyeloidLeukemia (AML)
Paroxysmal Nocturnal Hematuria
T-LGL
FanconiAnemia
MyeloproliferativeNeoplasms
Vitamin DeficiencyCopper Deficiency
Iron Deficiency
HIVEBV
Hepatitis
AlcoholAbuse
Medications
AutoimmuneDisorders
Non-Clonal Clonal
Diagnostic Overlap
Hepatic or Renal Disease

National Comprehensive Cancer Network (NCCN). NCCN Clinical Practice Guidelines in Oncology: Myelodysplastic Syndromes. v2.2015.
Mutations in MDS
• MDS-associated gene mutations can establish the presence of clonal hematopoiesis, which can help exclude benign causes of cytopenias in cases with non-diagnostic morphology
• Mutations may not establish a diagnosis of MDS in the absence of clinical diagnostic criteria
• In the appropriate context (e.g., cytopenias present without AML defining criteria, no evidence of other malignancy), they could aid in the determination of diagnosis

NGS Myeloid Panels can efficiently identify clonality
At least one
mutation
No mutation
97% Specificity for CMML
93%
Meggendorfer et al Blood 2013Malcovati L Blood 2014

Mutations in certain genes may favor related myeloid neoplasms or possible mimics of MDS
Klampfl T, Gisslinger H, Harutyunyan AS, et al. Somatic mutations of calreticulin in myeloproliferative neoplasms. N Engl J Med. 2013;369(25):2379-2390.; Kiladjian JJ. The spectrum of JAK2-positive myeloproliferative neoplasms. Hematology Am Soc Hematol Educ Program. 2012;2012:561-6. ; Tefferi A. Novel mutations and their functional and clinical relevance in myeloproliferative neoplasms: JAK2, MPL, TET2, ASXL1, CBL, IDH and IKZF1. Leukemia. 2010;24:1128-1138.; Damm F, Itzykson R, Kosmider O, et al. SETBP1 mutations in 658 patients with myelodysplastic syndromes, chronic myelomonocytic leukemia and secondary acute myeloid leukemias. Leukemia. 2013;27:1401-1403.; Thol F, Suchanek KJ, Koenecke C, et al. SETBP1 mutation analysis in 944 patients with MDS and AML. Leukemia. 2013;27:2072-2075.; Tefferi A, Thiele J, VannucchiAM, et al. An overview on CALR and CSF3R mutations and a proposal for revision of WHO diagnostic criteria for myeloproliferative neoplasms. Leukemia. 2014;28:1407-1413.

MDS CLASSIFICATION

14%
33%40%
37%
84%91%
0%
10%
20%
30%
40%
50%
60%
70%
80%
90%
100%
Cytogenetics Sequencing Sequencing & Cytogenetics
% o
f coh
ort w
ith ≥
1 ge
netic
abn
orm
ality
ICUS-Total (N=250)
MDS-Lower Risk (N=90)
Hall J, et al. ASH 2014, Abstract 3272

17

Risk of acquiring mutations increases with age

Allele frequency is rarely over 20%
19

Acquisition of somatic clones is not benign
20

Non-clonal ICUSCHIP CCUS LR-MDS HR-MDS
Traditional ICUS MDS by WHO 2008
Clonality
Dysplasia
Cytopenias
Overall Risk
+ – ++ ++ ++
–/+ – – + ++
– + + + ++
Very Low Very Low Low (?) Low High
BM Blast % < 5% < 5% < 5% < 5% 5-19%
Are these two the same?Does morphologic dysplasia matter?
CCUS = clonal cytopenias of undetermined significance; ICUS = idiopathic cytopenias of undetermined significance; CHIP = clonal hematopoiesis of indeterminate potential; LR = lower risk, HR = higher risk
How do we classify these patients?

New Proposed WHO classification
• Eliminate non-erythroid blast count if erythroid cells > 50%• RS > 5% and SF3B1 mutation MDS-RS-SLD
ASH 2015 Educational book

MDS RISK STRATIFICATION

IPSS Int2 Mut Absent (n=61)IPSS Int2 Mut Present (n=40)
p = 0.02IPSS High (n=32)
1.0
0.9
0.8
0.7
0.6
0.5
0.4
0.3
0.2
0.1
0.00 1 2 3 4 5 6 7 8 9 10 11 12 13
Ove
rall
Surv
ival
Years
IPSS Int1 Mut Absent (n=128)IPSS Int1 Mut Present (n=57)
p < 0.001IPSS Int2 (n=101)
1.0
0.9
0.8
0.7
0.6
0.5
0.4
0.3
0.2
0.1
0.00 1 2 3 4 5 6 7 8 9 10 11 12 13
Ove
rall
Surv
ival
Years
IPSS Low (n=110)0.9
0.8
0.7
0.6
0.5
0.4
0.3
0.2
0.1
0.00 1 2 3 4 5 6 7 8 9 10 11 12 13
Ove
rall
Surv
ival
Years
1.0IPSS Low (n=110)IPSS Int1 (n=185)IPSS Int2 (n=101)IPSS High (n=32)
1.0
0.9
0.8
0.7
0.6
0.5
0.4
0.3
0.2
0.1
0.00 1 2 3 4 5 6 7 8 9 10 11 12 13
Ove
rall
Surv
ival
Years
IPSS Low Mut Absent (n=87)IPSS Low Mut Present (n=23)
p < 0.001
1.0
0.9
0.8
0.7
0.6
0.5
0.4
0.3
0.2
0.1
0.00 1 2 3 4 5 6 7 8 9 10 11 12 13
Ove
rall
Surv
ival
Years
IPSS Low Mut Absent (n=87)IPSS Low Mut Present (n=23)
p < 0.001IPSS Int1 (n=185)
Impact of Mutations by IPSS Group
RUNX1
ETV6
EZH2
ASXL1
TP53
24

Somatic Gene Mutations Improve Precisionof the IPSS-R
Bejar R. Haematologica 2014; 99: 956.

IWG Molecular analysis
HR p-valueIPSS-R Risk Groups (vs. Very Low)
Low 1.08 0.542Intermediate 1.97 <0.0001High 2.56 <0.0001Very High 4.36 <0.0001
Mutated Genes (vs. Unmutated)TP53 2.35 <0.0001RUNX1 1.51 0.0002EZH2 1.58 0.0006NRAS 1.44 0.019SF3B1 0.82 0.041CBL 1.35 0.056U2AF1 1.22 0.069ASXL1 1.17 0.090TET2 0.88 0.104IDH2 1.31 0.111KRAS 1.22 0.362NPM1 1.2 0.546
Hazard Ratio (95% CI)

Complex Karyotype
TP53 Mutated
The adverse prognostic impact of the complex karyotype is entirely driven by its frequent association with mutations of TP53
TP53 Mutations and Complex Karyotypes

Clonal burden of TP53 Mutation Predicts for Inferior Survival
TP53 VAF > 40%
TP53 VAF < 20%P = .01
Time (days)
Ove
rall
Surv
ival
b
TP53 Mutant
TP53 Wild-typeP < .0001
Ove
rall
Surv
ival
a
Time (days)
Sallman et al., Leukemia journal

Number of Mutations and Prognosis
Papaemmanuil E, et al. Clinical and biological implications of driver mutations in myelodysplastic syndromes. Blood 2013.

THERAPEUTIC IMPLICATIONS

Gene (n)VAF ≥ 0.1
UnadjustedOR (95% CI)
p-valueAdjusted
OR (95% CI)p-value
TET2 (50) 1.99 (1.05, 3.80) 0.036 1.98 (1.02, 3.85) 0.044
TET2 mut + ASXL1 wt (23)
3.65 (1.38, 9.67) 0.009 3.64 (1.35, 9.79) 0.011
Response by Variant Abundance

Can we tailor therapy accordingly?
Sallman, et. al. ASH 2016

MDS with Founder TP53 Mutations are Highly Responsive to Decitabine
• Welch JS, et. al. NEJM 2016; 375:2023. – 116 MDS/AML treated with decitabine 20 mg/m2/d x 10d q 28d– exome sequencing pretreatment & serially– Higher ORR in TP53 mutant vs. Wt (21/21 [100%] vs. 32/78 [41%], P
<0.001)– CR/Cri higher in TP53 mutant vs. Wt (13/21 [62%] vs. 26/78 [33%],
P=0.04)
• Chang CK, et. al. Brit J Haematol 2016; Epub. – 109 MDS treated with decitabine 20 mg/m2/d x 5d q 28d– exome sequencing pretreatment – CR rate higher in TP53 mutant vs. Wt (10/15 [66.7%] vs. 20/94 [21%], P
=0.001)– No difference in ORR (TP53 mutant, 11/15 [73%] vs. 63/94 [67%] Wt)– Poor OS in TP53mu MDS (median, 14 vs. 39 mos; P=0.012)

Median follow-up: 40 monthsProgression = blasts >10% or complex karyotype.
N=7
Probability of AML Progression in Low/Int-1 del(5q) MDS by TP53 mutation
Jädersten M, et. al. JCO April 2011 epub
[n=55]
Prob
abilit
y of
free
dom
from
AM
L
TP53 with median clone size of 11% was detected in 18% of pts.
5 out of 12 patients who progressed to AML had TP53 mutation.
8 out of 10 mutated Tp53 patients received lenalidomide where a trend toward AML progression was noted.
no complete CCR observed among p53 mutated pts.
Time to 25% AML evolution 151+ months vs 34 mo
N=10
N=45
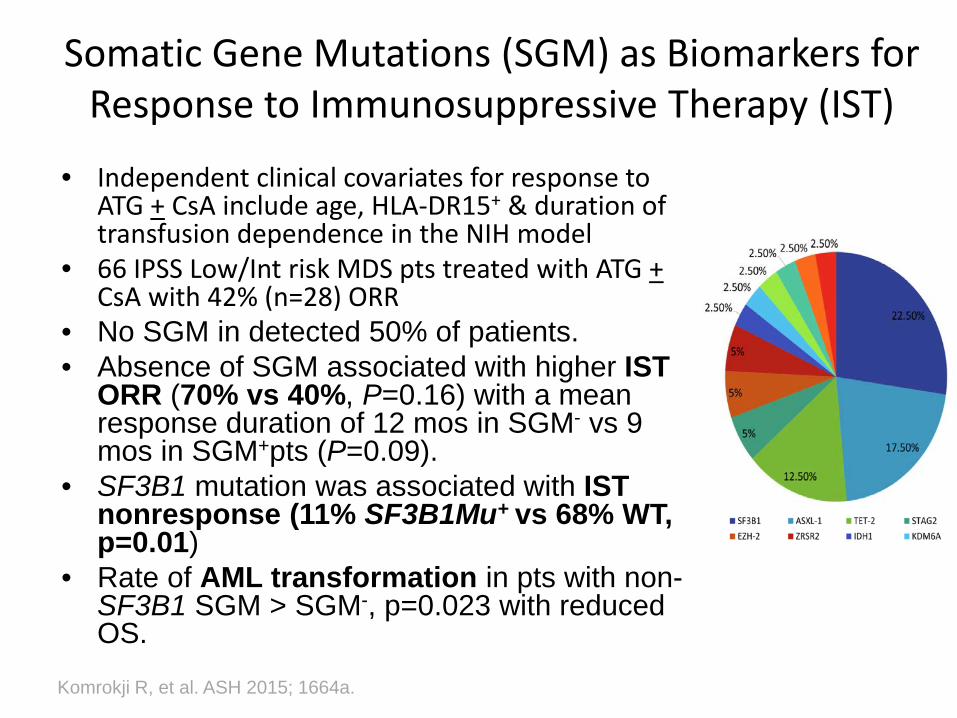
Somatic Gene Mutations (SGM) as Biomarkers for Response to Immunosuppressive Therapy (IST)
• Independent clinical covariates for response to ATG + CsA include age, HLA-DR15+ & duration of transfusion dependence in the NIH model
• 66 IPSS Low/Int risk MDS pts treated with ATG +CsA with 42% (n=28) ORR
• No SGM in detected 50% of patients.• Absence of SGM associated with higher IST
ORR (70% vs 40%, P=0.16) with a mean response duration of 12 mos in SGM- vs 9 mos in SGM+pts (P=0.09).
• SF3B1 mutation was associated with IST nonresponse (11% SF3B1Mu+ vs 68% WT, p=0.01)
• Rate of AML transformation in pts with non-SF3B1 SGM > SGM-, p=0.023 with reduced OS.
Komrokji R, et al. ASH 2015; 1664a.

Impact of TP53 Mutation & Age on AlloHCTOS by TP53 Mutation Status OS by TP53 Mutation & Age
Lindsley RC, et. al. NEJM 2017; 376: 536.

LRMDS

0
5
10
15
20
25
30
RBC-TI ≥ 8 weeks RBC-TI ≥ 24 weeks
Patie
nts
(%)
Would you use lenalidomide or HMAs?
17.5%
0%
26.9%
2.5%
Placebo (n = 79)LEN (n = 160)
Median duration of response 32.9 weeks (95%CI, 20.7–71.1) among RBC-TI ≥ 8 weeks
Lineage HI in Evaluable Pts,* n/N (%)
5-2-2 (n = 50)
5-2-5 (n =51)
5d (n = 50)
ErythroidMa
19/43 (44)
19/43 (44)
20/44 (46)
RBC-TI 12/24 (50)
12/22 (55)
15/25 (64))
PlateletMa 12/28 (43)
8/30 (27)
11/22(50)
Any HI 22/50 (44)
23/51 (45)
28/50 (56)
NeutrophilMa
4/23 (17)
4/23 (17)
9/24 (38)
AzacitidineLenalidomide
Santini V, et al. JCO 2016; Lyons RM, et al. J Clin Oncol. 2009;27:1850-1856.

Phase III Intergroup Study of Lenalidomide + Epoetin Alpha After ESA Failure [ECOG 2905]
• Eligibility: Low/Int-1 IPSS, ESA failure or low response profile, Hgb <9.5 g/dL• Stratification: serum EPO (> vs. <500mU/ml), prior ESA (EA vs. DA vs. None) • Epoetin alfa 60,000 units SC weekly • Primary Endpoint (EP): MER• Secondary EP: Time to MER, MER duration, LEN cross-over response,
candidate response biomarkers (CD45 isoform profile)
Week: 0 16
Randomize [n=250]
Lenalidomide10 mg/day x 21d
Lenalidomide + Epoetin α
IWG MERContinue
NRCross-overLEN Arm
only
List A, et. al. ASH 2016; #223a.

Response Analysis
List A, et. al. ASH 2016; #223a.
Response & Cohort Arm A (%)LEN
Arm B (%)LEN+Epo
P value
ITT Analysis [n=163] N=81 N=82
MER 9 (11.1) 21 (25.6) P=0.025
Minor ER 15 (18.5) 13 (15.9) P=0.68
Overall ER 24 (29.6) 34 (41.5) P=0.14
Arm A Crossover MER N=34 7 (21%)
Week 16 Evaluable [n=117] N=56 N=60
MER 8 (14.3) 20 (32.8) P=0.029
Minor ER 13 (23.1) 13 (21.3) P=0.83
Overall ER 21 (37.5) 33 (54.1) P=0.09

Duration of MER
List A, et. al. ASH 2016; #223a.

TP53 Genotype Impacts Primary Response to Lenalidomide Treatment in Del(5q) MDS
• GFM [n=62] & Spanish [n=45] compassionate treatment data [n=107]
• muTP53 detected in 21 patients (20%), wtTP53 in 86 (80%) prior to lenalidomide treatment
• TI Erythroid Response - muTP53 9/21 (43%) vs. wtTP53 63/86 (73%) [P=0.029]
• Cytogenetic Response – muTP53 12% vs. wtTP53 73% [P=0.020]
• Effective disease altering therapy in del5q MDS should also modify muTP53
Mallo M, et al. Brit J Haematol 2013; 162(1):74-86Bally C, et al. MDSF Int Symp 2013; P-024]
Res
pons
e Pe
rcen
t TI, Transfusion independence.
73% 73%
43%
12%

Type of IST used (N=217) and responses
ATG + Prednisone
43%
CysA13%
Tacrolimus4%
ATG+Tacrolimus
4%
ATG + CysA21%
ATG + CysA +
Etanercept8%
Others7%
Prednisone only: 150 (41%) patients -> Excluded from analysis
Horse38%Rabbit
62%
Response % 95%CI
CR 11.2 6.5-18.4
PR 5.6 2.5-11.6
HI 32.0 24.1-41.0
SD 39.2 30.7-48.4
PD 12.0 7.1-19.3
ORR 48.8 39.8-57.9
Stahl M et al. ASH 2017 [Abstract # 422]

Transfusion independence (TI)
TI achieved
30%
TI not achieved
70%
0 5 10 15 20 25
Duration of TI(months)
Time to TI (weeks)
19.9 months (95%CI 12.8-27)
9.4 weeks (95%CI 6.3-12.6)
Stahl M et al. ASH 2017 [Abstract # 422]

Excess Smad2/3 Signaling Suppresses Late-Stage RBC Maturation in MDS
TGF-β ligands (e.g. GDF15,GDF11, BMP6, activin A) negatively regulate late
erythropoiesis
Bone marrow microenvironment
Luspatercept releases maturation block
Baso E Poly E Ortho E Reticulocyte RBC
SCFIL-3EPO
BFU-E CFU-E Pro-E
EPO-responsive
EPO-
dependent
EPO
8–64 cells500 cells
Sustained Hb increase Rapid Hb increase
• Mobilizes cells from precursor pools into blood
• Effect relies on continuous formation of late-stage precursors from earlier progenitors

ACE-011 (Sotatercept) and ACE-536 (Luspatercept)
Novel Ligand Traps for TGFβ Superfamily Ligands
GDF11, GDF8,Activin-B,BMP6, BMP10
ACE-536(Luspatercept)
ExtracellularDomainof ActRIIA
GDF11, Activin-A
ACE-011 (Sotatercept)
Heme effect
Bone effect
++
+–
Fusion proteinwith ligand trap activity
Receptor ligand interaction
ModifiedExtracellular
ActRIIBDomain
Suragani R, et. al. Nat Med 2014; 20: 408.

Luspatercept PACE-MDS Phase 2 Clinical Trials Overview
EPO: erythropoietin; ESA: erythropoiesis-stimulating agent; HI-E: hematologic improvement erythroid; RS: ring sideroblast
Patient Population Efficacy Endpoints
Multiple cohorts enrollinglow/intermediate-1 risk (IPSS) MDS patients including:• Non-transfusion dependent and
transfusion dependent patients• ESA-naïve and ESA-experienced patients• Patients with a range of baseline EPO
levels• RS+ and non-RS patients
• IWG (2006) HI-E:• Hb increase ≥ 1.5 g/dL for all values
over 8 weeks for patients with < 4 units/8 wk and Hb < 10 g/dL
• ≥ 4 RBC unit decrease over 8 weeks for patients with ≥ 4 units/8 wk
Treatment Other Efficacy Endpoints
• Luspatercept 0.125 – 1.75 mg/kg (base study); 1.0 – 1.75 mg/kg (extension) SC q3 weeks
• All patients followed up for 2 months post last dose or early discontinuation
• RBC-TI: RBC-transfusion independence ≥ 8 weeks (RBC evaluable patients, ≥2U/8 weeks)
• Time to/duration of HI-E response
A Phase 2, multicenter, open-label, 3-month dose-escalation study in adults with lower-risk MDS followed by a 5-year extension study
Base Study (N=106)
3 monthsNCT01749514
Extension Study (N=70)
5 years (ongoing)NCT02268383
Platzbecker U et al. ASH 2017 [Abstract # 2982]

IWG HI-E and RBC-TI Response Rates by ESA, EPO, RS Status Patients Treated at Dose Levels ≥ 0.75 mg/kg
Response RatesIWG-HI-E, n/N (%)(N=99)
RBC-TI, n/N (%)
(N=67)All patients 52/99 (53%) 29/67 (43%)
ESA-naïve 28/53 (53%) 17/31 (55%)Prior ESA 24/46 (52%) 12/36 (33%)
Baseline EPO <200 U/LRS+ 25/39 (64%) 16/24 (67%)Non-RS 7/13 (54%) 3/7 (43%)
Baseline EPO 200-500 U/LRS+ 10/14 (71%) 4/9 (44%)Non-RS 4/8 (50%) 3/5 (60%)
RS StatusRS+ 40/62 (65%) 22/42 (52%)Non-RS 12/35 (34%) 7/23 (30%)Unknown 0/2 (0%) 0/2 (0%)
Platzbecker U et al. ASH 2017 [Abstract # 2982]

Months-3 0 2 4 6 8 10 14 18 22 26 30 34 38
Durability of Response in RBC-TI RespondersPatients Treated at ≥ 0.75 mg/kg with Baseline RBC ≥2U/8 weeks
Data as of 08 Sept 2017
Platzbecker U et al. ASH 2017 [Abstract # 2982]

MEDALIST: Phase 3 Randomized Double-blind Study of Luspatercept vs Placebo in Transfusion-
Dependent LR-MDS With Ring Sideroblasts [ACE-536-MDS-001]
Eligibility: Non-del(5q) MDS with >15% RS, VL-Int. IPSS-R, 2 U PRBC/8 wks, prior ESAKey Exclusions: Prior treatment with IMiDs, azanucleosides or IST; ANC < 500, plat<50K Stratification: RBC transfusion burden (< 6 vs >6 U/8wk), IPSS-R VL/Low vs. Int.Primary end-point: Transfusion Independence x > 8 weeks
Week: 0 24
Randomize 2:1[n=210]
Response- Continue DB x 2 yr- No cross-over for non-responders
Luspatercept1-1.75 mg/kg q3 wk
[n=140]
PlaceboSC q 3 wks
[n=70]

Epo<200mU/ml<2U RBC/mo
ESA
Non-del5q
Anemia Management Algorithm in LR-MDS
<1.5>1.5
AZA 5 dayLEN+Epo
Daco
Del (5q)Iso- or +1
LenalidomideDel5q
Wt, Mu VAF<20%
TP53Mu
VAF>40%
LEN
HSCT
Epo>200mU/ml>2U RBC/mo
Age
>60 <60SF3B1 Mu+ No SGM or SF3B1
Mu-
MDS >6 mos HLA-DR15+,+8
ISTNon-del5qpathway
*SGM, somatic gene mutation.

HR-MDS

Allogeneic Hematopoietic Stem Cell Transplantation remains the only curative option for MDS patients
Koreth J, et al. J Clin Oncol. 2013;31:2662-2671.

Impact of TP53 Mutation & Age on AlloHCTOS by TP53 Mutation Status OS by TP53 Mutation & Age
Lindsley RC, et. al. NEJM 2017; 376: 536.

0
1.0
5 10 15 20 25 30 35 40Time From Randomization (Mos)
00.10.20.30.40.50.60.70.80.9
Prop
ortio
n Su
rviv
ing
CCRAzacitidine
HR: 0.58 (95% CI: 0.43-0.77; log-rank P = .0001)
24.5 mos15 mos
Fenaux P, et al. Lancet Oncol. 2009;10:223-232.
AZA-001 Trial: Azacitidine SignificantlyImproves Overall Survival

Treatment With AZA OR ICT Prior AHSCT
Damaj G, et al. J of Clin Oncol. 2012;30:4533-4540.
1.0
0.8
0.6
0.4
0.4
00 200 400 600 800 1000
Days
OS
(Pro
babi
lity)
AZA alone: HR = 1ICT alone v AZA alone: HR = 1.41 (95% CI: 0.83-2.42; P = NS)ICT-AZA v AZA alone: HR = 3.08 (95% CI: 1.38-6.85; P = .006)
1.0
0.8
0.6
0.4
0.4
00 200 400 600 800 1000
Days
Even
t-Fre
e Su
rviv
al(P
roba
bilit
y)
AZA alone: HR = 1ICT alone v AZA alone: HR = 1.48 (95% CI: 0.90-2.44; P = NS)ICT-AZA v AZA alone: HR = 2.72 (95% CI: 1.38-5.34; P = .01)
1.0
0.8
0.6
0.4
0.4
00 200 400 600 800 1000
Days
3-Ye
ar R
elap
se(P
roba
bilit
y)
AZA alone: HR = 1ICT alone v AZA alone: HR = 1.35 (95% CI: 0.73-2.46; P = NS)ICT-AZA v AZA alone: HR = 1.87 (95% CI: 0.69-5.06; P = NS)
1.0
0.8
0.6
0.4
0.4
00 200 400 600 800 1000
Days
3-Yr
NR
M S
urvi
val
(Pro
babi
lity)
AZA alone: HR = 1ICT alone v AZA alone: HR = 1.23 (95% CI: 0.55-2.76);P = NS)ICT-AZA v AZA alone: HR = 2.50 (95% CI: 0.89-7.05; P = .08)

Azacitidine Maintenance after AHSCT• N= 45, majority AML patients (n=37).• Excluded active disease, active GVHD, active infections.• MTD AZA 32mg/m2 SQ for 5 days SQ X 4 cycles.• Median EFS 18.2 mo (95% CI: 11.9-NR), One year EFS and OS 58% and 77%
• De Lima, et al. Cancer 2010; 116(23)
(Months)
AZA Maintenance (n=11)
No Maintenance (n=188)
P=.027
• Mishra et al. Leukemia Research, vol 55, S1, April 2017, Page S48

How do HMAs perform in the real-life setting?
• A retrospective analysis of 636 HR-MDS in the MDS Clinical Research Consortium database (6 tertiary centers, no single center accounted for > 39%).
• 69.6% INT-2, 30.4% high IPSS. • Median follow-up 15.7 months (95% CI:
14.6, 16.8). • Median time from diagnosis to HMA
initiation 0.95 months (95%CI: 0.86, 1.06). • 67.9% azacitidine, 32.1% decitabine. • Median number of cycles 5.0 (IQR: 3.0,
8.0)• 72.2% received ≥ 4 cycles.
Median OS from diagnosis 17.0 months (95%CI: 15.8, 18.4).
Zeidan et al, Leukemia, 2016

MDS with Founder TP53 Mutations are Highly Responsive to Decitabine
• Welch JS, et. al. NEJM 2016; 375:2023. – 116 MDS/AML treated with decitabine 20 mg/m2/d x 10d q 28d– exome sequencing pretreatment & serially– ORR higher in fav/int cytogenetic risk vs. unfavorable (29/43 [67%] vs. 24/71
[34%], P <0.001)– Higher ORR in TP53 mutant vs. Wt (21/21 [100%] vs. 32/78 [41%], P <0.001)– CR/Cri higher in TP53 mutant vs. Wt (13/21 [62%] vs. 26/78 [33%], P=0.04) – No relation between response & change in cytosine methylation or subclonal
TP53 mutation
• Chang CK, et. al. Brit J Haematol 2016; Epub. – 109 MDS treated with decitabine 20 mg/m2/d x 5d q 28d– exome sequencing pretreatment – CR rate higher in TP53 mutant vs. Wt (10/15 [66.7%] vs. 20/94 [21%], P =0.001)– No difference in ORR (TP53 mutant, 11/15 [73%] vs. 63/94 [67%] Wt)– Poor OS in TP53mu MDS (median, 14 vs. 39 mos; P=0.012)

Rate of Clearance of Somatic Gene Mutations in Decitabine Treated Patients
Welch JS, et. al. NEJM 2016; 375:2023.
Clearance of TP53mu Clones Change in VAF bySomatic Mutation

Overall Survival by TP53 Mutation Status
Welch JS, et. al. NEJM 2016; 375:2023.
OS in TP53mu vs. Wt OS with HSCT by TP53 Mutation
Median OSTP53Mu 12.7 mosTP53Wt 15.4 mos

APR-246 Restores Wild-type p53 Function
Khoo et al., Nature Reviews Drug Discovery; 2014, 13, 217-36

Response, n/N (%) MDS Pts (N = 17)
ORR* 10/17 (59)CR† 1/11 (9)PR† 1/11 (9)mCR† 3/11 (27)Any HIErythrocytesPlateletsNeutrophilsTrilineage improvementBilineage improvement
5/17 (29)3/15 (20)4/12 (33)4/10 (40)2/5 (40)2/5 (40)
Enasidenib in mIDH2 MDS: Response
• 7 of 13 pts (54%) with prior HMA responded to enasidenib
• Median time to response: 21 days (range: 10-87)
Slide credit: clinicaloptions.comStein EM, et al. ASH 2016. Abstract 343.
*CR + PR + mCR + HI.†Investigator-assessed; pts had ≥ 5% BM blasts at BL.

AHSCT candidate
? AHSCT at time of HMA failure
HMA
Clinical trial
NO
Proposal for HR-MDS Treatment Algorithm
TET-2 MT VAF > 10%/ASXL-1 WT
Post AHSCT HMA• Prior response or no prior HMA• Loss of CD33 donor chimerism
P53 VAF > 40% P53 VAF < 20%
YES
YES NO
HMACytopenia/ Myeloblasts > 10%
HMA prior to AHSCT
YESNO
Observe prior to AHSCT
Decitabine
AHSCT
P53 clearance