Embed Size (px)
Citation preview
1
2 3
Introduc on Until the Covid-19 pandemic and the 2021 political crisis, Myanmar had been developing fast and had been offering a great potential of growth since its opening in 2011. Its demography and work force were some of its main assets:
One of the largest populations in Asean. A young and active population (25% between 0 and 14 years old, 67.5% under 64 years old). 2.5% of annual urban population growth rate and 2% of annual population growth rate. A very low unemployment rate under 2%. A relatively cheap work force.
Despite all this, the country was still facing challenges, especially due its lack of skilled and experienced labour, to its low average level of education, to its lack of standards, to its challenging legal framework and to a still fragile economy after decades of isolation.
These challenges were, of course, nothing compared to those that Myanmar and its population now face following the pandemic and the political crisis. These two crises have dramatically impacted all companies, as CCI France Myanmar detailed in the report on the survey published in last May 2021 (https://bit.ly/reportsurvey2021).
Our report shows that these crises especially impacted the human resources of all companies, regardless of their sectors, nationalities, sizes, or years of operating in the country. Their cumulative effects led to hundreds of thou-sands of terminations of employment contracts, to drastic reductions in salaries, to the implementation of unpaid leaves, part-time work, without mentioning their toll on the physical and mental health of employees.
These events are completely rewriting the anticipated evolution of the Myanmar economy as it was forecast before 2020 based on 10 years of continuous growth. The full extent of their disastrous effects on companies and on their employees is still unclear and will continue to be felt in the years to come.
Now, the present 2021 Myanmar Salary Survey was launched in January 2021, after almost one year of Covid, but just before the starting point of the political crisis. Therefore, it is safe to say that the data it presents is already obso-lete and belongs to history.
In addition, this fourth edition of our annual Myanmar Salary Survey registered 30% less answers than previous years, with a total number of 302 respondents. Because of this, we were unable to provide an update on all posi-tions in all sectors this year.
Still, this report remains extremely useful to all companies operating in Myanmar for the following reasons:
It is the only survey of its kind available for free in Myanmar to provide data to employers and employees on the level of salaries per position and per sector.
It provides a point of reference to companies on the overall state of the market in January 2021, before the beginning of the political crisis.
It will be especially useful when we launch the fifth edition of our Myanmar Salary Survey in January 2022, since it will offer a way to compare and study the evolution of the market in 2021, following the political crisis.
To conclude, we remind you that this Myanmar Salary Survey should only be viewed as a guide. Our sample was spread across a variety of sectors and we received 302 responses, mostly from companies from the Yangon region.
The small number of answers received for some positions in some sectors may affect the reliability of some data in this guide, but still manage to provide information on the rough level of salaries in main sectors in Myanmar.
We thank you in advance for participating in the next edition of our annual Myanmar Salary Survey in 2022, to make sure that the results are as accurate as possible.

4 5
Contents
Introduction
Methodology
Executive Summary
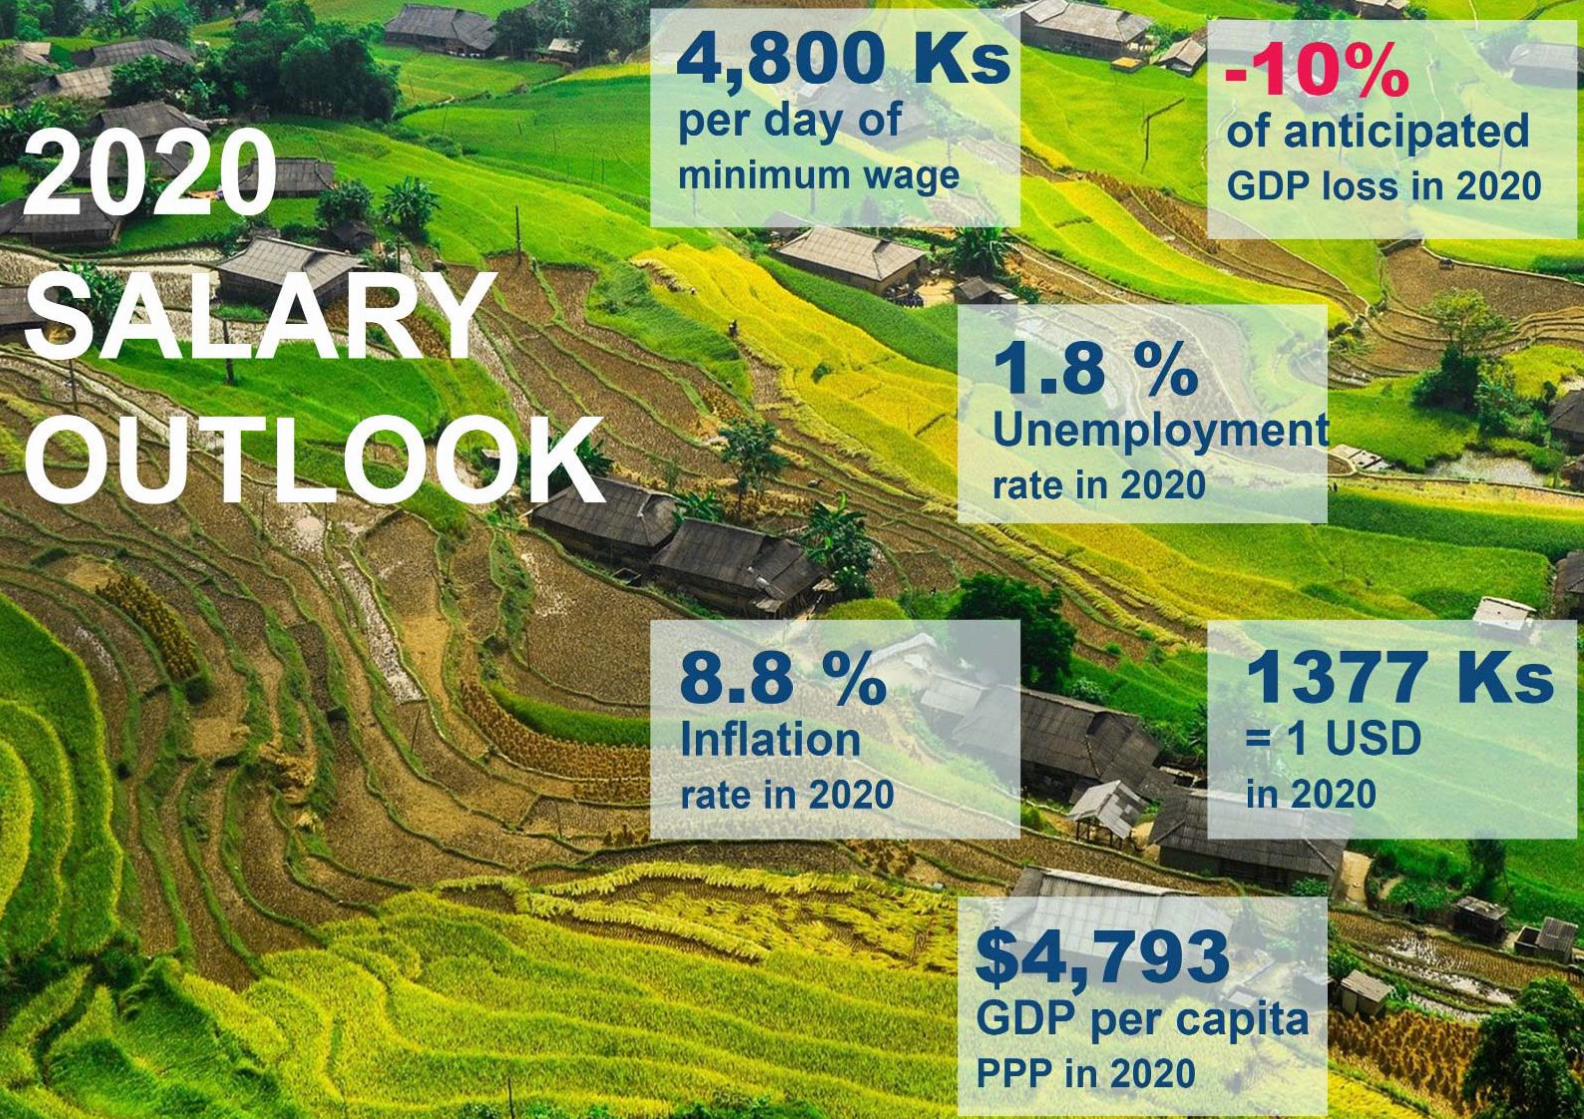
2020 Salary Outlook
Key trends
Construction bui ding services, construction
Consumer goods F&B, consumer e ectronics, auto-mobi e, retai
Education schoo s
Financia services banks, insurance, investment
Healthcare hospitals, medical centers
Hospitality hotels, restaurants
Logistics warehouse operations, deliv-ery services
Manufacturing Textile, steel
NGO / NPO
Services IT services, audit firms, busi-ness services

6
This salary survey 2021 is the third edition of our annual Myanmar Salary Survey. Invitations to complete the survey were sent in January 2021. Respondents were invited to submit their re-sponses online, anonymously, in MMK (Myanmar Kyat).
The average exchange rate used for this survey was the following: 1 USD = 1,377 MMK.
A user guide was provided to explain to participants how to take the survey.
Participants were asked to provide information about the industry to which they belong, the size of the organization in which they work, the minimum and maximum amounts of salaries, the an-nual bonus, the commission for salespersons, the allowances and salary increase percentage for previous year, according to their respective departments and industries.
Participants were not asked any other personal/company details or company’s confidential in-formation, so that employees feel comfortable giving the accurate information. Therefore, this survey is 100% anonymous and free.
METHODOLOGY
7
In the present document, results are set out by industry in alphabetical order. Each job category and level is listed but, in some cases, positions or levels were removed or changed, if didn’t exist in the category or industry, to improve the presentation of the survey.
This survey only concerns gross salaries (allowances and benefits excluded) for employees working in Myanmar under local contracts, both Myanmar Nationals and Foreigners.
In some cases, we noticed that salaries were extremely low or high and we therefore realized that some members in the survey group may not have understood the goal and rules of the sur-vey. Therefore, we decided to remove these corrupted data to ensure the integrity of the results.
This survey was launched one year after the beginning of the covid-19 pandemic. Therefore, it does show its impact on employment and on salaries in Myanmar.
Yet, this survey was launched in January 2021, before the beginning of the political crisis. There-fore, it doesn’t show its impact on employment and on salaries in Myanmar.
If you have any questions about this survey and the results, please contact Mrs. Su Eaindar Moe Myint at [email protected].

8
EXECUTIVE SUMMARY The answers provided in the questionnaire launched in April 2021 showed that the political crisis that followed February 2021, had a stronger negative impact on companies and on the Myanmar economy than one full year of Covid pandemic.
The report on this survey is available here for free: https://bit.ly/reportsurvey2021.
Now, the results of the present 2021 Myanmar Salary Survey confirm this analysis. Indeed, the answers provided by the 302 respondents show that most companies from all sectors had not im-plemented any reduction in salaries in January 2021.
As the graph here below demonstrates, only a majority of companies from industries which were the most directly and severely hit by the pandemic, like education, healthcare and hospitality, had to decrease their employee’s salaries. It also shows that when they did it, they avoided reducing the lowest wages and chose to mostly target managers instead.
While our Myanmar Salary Survey doesn’t show a comparison between years, the median salaries presented in the present document for each position in each sector, show indeed that most sala-ries remain almost the same compared to those of the previous year. Except, again, in some spe-cific sectors or for some specific positions, in relation to the impact of the pandemic.
Data for the survey also shows that other measures were taken by companies because of the pan-demic, mostly in the same industries which had been the most impacted by the pandemic. Yet, in addition to the sectors of education, healthcare and hospitality, we can see that the construction sector, which was not concerned by reductions in salaries, appears to be the second one in which most alternative measures have been implemented by companies because of the Covid.
9
These measures include the cancellation of allowances and bonuses, and the freezing of all re-cruitment. Hotels, restaurants and companies in the tourist sectors were almost the only ones which had to temporarily close and/or cease all their activities for most of the year.
All in all, we can see that the Covid pandemic already had an impact on human resources in My-anmar. In January 2021, after almost one full year of pandemic, the impact still remained limited according to the answers gathered for the survey.
It was mostly concentrated in 3 to 4 sectors, the ones which had to terminate or temporarily stop their activities because of the health crisis. In most sectors apart from these ones, no general re-duction of salaries had been implemented and no other drastic measures impacting the standard of living of employees had been taken.
The only common decision made by a large number of companies in all sectors was to cancel all recruitments.
In conclusion, it is fair to say that while it is interesting that the survey shows the limited impact of the Covid on salaries in Myanmar after one year, the data which the present report contains has already been made obsolete by the political crisis which started in February 2021.
The present document cannot serve as a reference for the levels of salaries in the current state of the Myanmar market. But it will be useful when the fifth edition of the Salary Survey is launched in January 2022, to show the impact that the political crisis, in addition to 2 years of pandemic, had on the salaries in particular and the human resources in general in the country.
10 11

12
KEY TRENDS Salary Increments 28% of all respondents said they saw salary increases of between 1 to 5% of salary for previ-ous year 2020.
Company Size by Industry
The below table shows the sizes of organizations we reached out to by Industry.
Industry Size of the Organization
Construction 0-10 – 1,000+
Consumer Goods 0-10 – 1,000+
Education 0 - 10 - 500
Financial Services 0-10 – 1,000+
Healthcare 0-10 – 1,000+
Hospitality 0-10 – 1,000+
Logistics 0-10 – 1,000+
Manufacturing 0-10 – 1,000+
NGO / NPO 0 - 10 - 1,000
Services 0-10 – 1,000+
Industry Salary Increase Percentage for previous year
Percentage for previous year
Construction 6 - 20% 21%
Consumer Goods 1 - >20% 31%
Education 11 - 20% 25%
Financial Services 1 - 15% 28%
Healthcare 1 - 10% 18%
Hospitality 6 - 15% 45%
Logistics 1 - 15% 35%
Manufacturing 1 - 10% 27%
NGO / NPO 1 - 20% 41%
Services 1 - 15% 25%
13
Benefits and Allowances
For allowances like travel allowance, medical allowance and meal allowance, 18% of respond-ents provide transport allowance, 7% provide meal allowance and 18% provide medical allow-ance. In the table below we have broken this down by industry.
Repatriate Remuneration
18% of the organizations in this survey employ repatriates.
Industry Transport Allowance
2021
Meal Allowance
2021
Medical Allowance
2021
Construction 18% 6% 18%
Consumer Goods 20% 7% 15%
Education 12.5% 12.5% 12.5%
Financial Services 19% 6% 22%
Healthcare 9% 9% 9%
Hospitality 27% 27% 27%
Logistics 12% 6% 12%
Manufacturing 22% 5% 13%
NGO / NPO 18% 5% 27%
Services 18% 5% 17%
Industry Repat Employment
Rate 2021
What is the average difference in sal-ary you pay a repat over a local for the
same position? 2021
Construction 18% 9%
Consumer Goods 13% 18%
Education 25% 12.5%
Financial Services 22% 19%
Healthcare 9% 9%
Hospitality 27% 27%
Logistics 12% 12%
Manufacturing 18% 13%
NGO / NPO 23% 18%
Services 18% 13%

14
Commission or Incentive Bonus Directly Related to their Performance / Revenue Generated for Sales Staff
23% of companies from this survey pay their Sales Staff commissions or an incentive bonus directly related to their performance / revenue generated
Are bonuses fixed or variable?
Industry What is the rough percentage of revenue they are entitled to re-
ceive? 2021
Commission or incentive bonus paid directly related to their performance /
revenue generated 2021
Construction <1% - 20% 18%
Consumer Goods < 1% - 100% 38%
Education 11% - 20% 29%
Financial Services 1 - 100% 17%
Healthcare 1 - 100% 36%
Hospitality < 1% - 5% 18%
Logistics 1 - 100% 18%
Manufacturing 1% - 5% 10%
NGO-NPO 1% - 5% 18%
Services <1% - 20% 20%
Industry Fixed
2021
Variable
2021
Construction 9% 12%
Consumer Goods 7% 31%
Education 100% 100%
Financial Services 6% 16%
Healthcare 9% 36%
Hospitality 9% 27%
Logistics 12% 24%
Manufacturing 5% 29%
NGO / NPO 18% 9%
Services 4% 16%
15
Impact on Covid ‐ 19
Salaries Reduction in 2020
Industry No reduction Reduction of all
salaries except the lowest ones
Construction 42% 27%
Consumer Goods 70% 11%
Education 14% 28%
Financial Services 84% 3%
Healthcare 9% 18%
Hospitality 9% 18%
Logistics 71% 6%
Manufacturing 70% 11%
NGO-NPO 87% 5%
Services 67% 10%
Reduction for all management
6%
2%
28%
43%
9%
9%
6%
2%
5%
4%
Reduction of all salaries
18%
4%
28%
3%
45%
72%
18%
4%
5%
18%
Reduction only for the top man-
agement
3%
3.6%
14%
3%
9%
9%
6%
9%
10%
5%
Industry In average, what was the general percentage of reduc-tion applied to salaries in your company?
Was the percentage of reduction in salaries the same for all levels?
Construction 5 - 70% 21%
Consumer Goods 5 - 50% 13%
Education 5 - < 70% 43%
Financial Services 10 - 50% 3%
Healthcare >5% - 70% 27%
Hospitality 10 - < 70% 55%
Logistics 5 - 50% 24%
Manufacturing 10 - 50% 5%
NGO-NPO 5 - 50% 5%
Services >5% - 70% 20%
General percentage of reduction applied to salaries

16
Industry Cancellation of allowances
Cancellation of bonuses
Cancellation of new recruit-
ments
Temporary/seasonal closing of your company
and activity
Cancellation of other benefits
Construction 30% 33% 3% 18% 33%
Consumer Goods 2% 11% 18% 5% 7%
Education 14% 14% 28% 14% 27%
Financial Services 3% 6% 22% 16% 6%
Healthcare 55% 36% 33% 0% 9%
Hospitality 27% 55% 73% 63% 27%
Logistics 12% 12% 24% 12% 18%
Manufacturing 5% 19% 14% 10% 0%
NGO-NPO 5% 9% 14% 9% 4%
Services 8% 17% 2% 8% 7%
Other additional specific measures in 2020 because of the Covid-19 crisis?
Industry Part-time work Mandatory earned leaves
Mandatory un-paid leaves
Voluntary un-paid leaves
Termination of employment con-
tracts
Construction 9% 6% 6% 3% 36%
Consumer Goods 9% 4% 4% 0% 13%
Education 14% 14% 14% 14% 14%
Financial Services 0% 0% 0% 0% 0%
Healthcare 18% 0% 0% 0% 18%
Hospitality 18% 9% 9% 9% 36%
Logistics 12% 6% 12% 0% 12%
Manufacturing 0% 0% 0% 0% 5%
NGO-NPO 9% 5% 0% 0% 23%
Services 5% 4% 1% 6% 17%
17
Expected duration before the other specific measures will be lifted?
Industry We didn't im-plement other
specific measures
In 3 months
Construction 15% 0%
Consumer Goods 14% 4%
Education 14% 0%
Financial Services 16% 6%
Healthcare 18% 9%
Hospitality 0% 9%
Logistics 18% 12%
Manufacturing 10% 14%
NGO-NPO 18% 5%
Services 14% 7%
In 9 months
6%
2%
0%
0%
0%
9%
0%
0%
0%
0%
In 1 year
6%
5%
0%
6%
9%
9%
6%
5%
9%
9%
In 1 month
3%
4%
43%
6%
0%
0%
6%
0%
0%
4%
In 6 months
12%
8%
14%
0%
9%
27%
0%
10%
0%
6%
In more than 1 year
12%
2%
0%
0%
0%
27%
6%
0%
9%
2%
Industry We didn't
reduce sala-ries
In 1 month
Construction 21% 6%
Consumer Goods 14% 1%
Education 29% 14%
Financial Services 44% 0%
Healthcare 27% 0%
Hospitality 0% 0%
Logistics 41% 12%
Manufacturing 24% 0%
NGO-NPO 27% 0%
Services 17% 5%
In 1 year
3%
2%
0%
14%
9%
9%
6%
0%
0%
1%
In 6 months
12%
2%
0%
0%
18%
9%
5%
0%
5%
8%
In 3 months
12%
1%
29%
6%
0%
18%
0%
0%
9%
4%
In more than 1 year
3%
0%
0%
0%
18%
0%
0%
6%
0%
1%
In 9 months
0%
0%
0%
0%
0%
18%
0%
0%
0%
2%
Expected duration before salaries can be increased back to their original level after the Covid-19 crisis (Salaries Reduction Companies Responses)

18
CONSTRUCTION
19
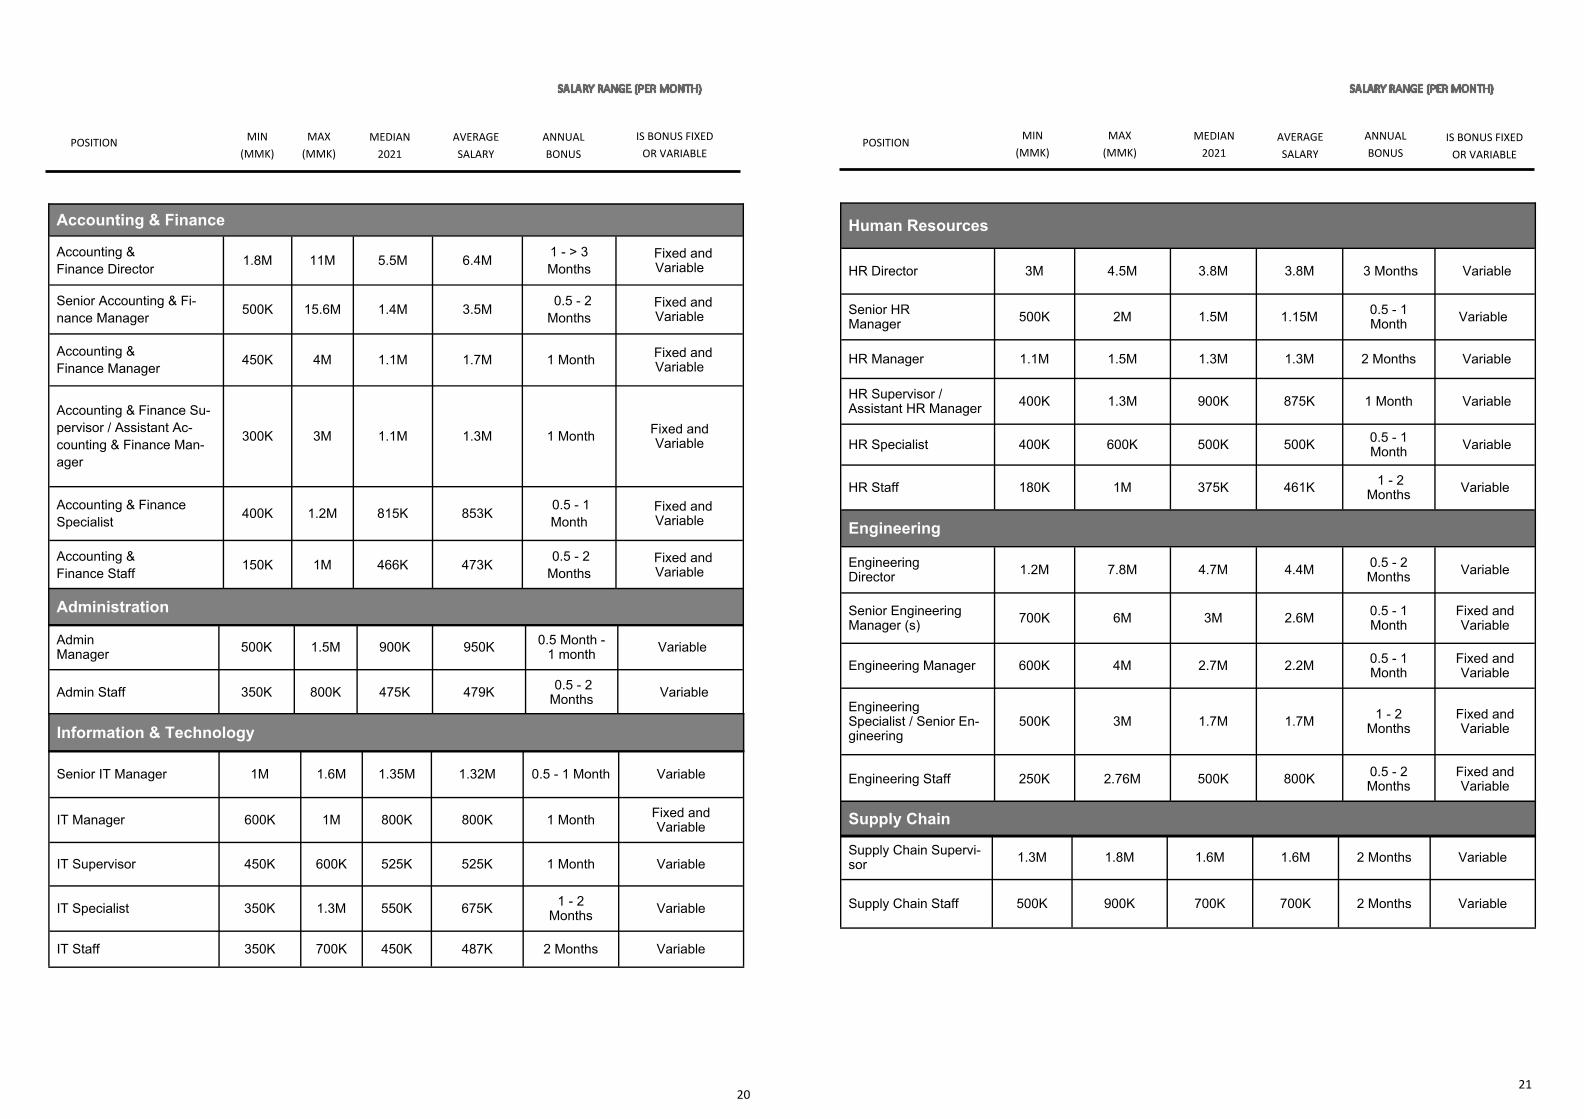
CONSTRUCTION ‐ 33 respondents
POSITION MIN
(MMK) MAX
(MMK) MEDIAN
2021 AVERAGE SALARY
ANNUAL BONUS
IS BONUS FIXED OR VARIABLE
Executive Management
Country Manager / CEO 1M 75M 6M 14M 0.5 - > 3 Months
Fixed and Variable
CFO / COO / CTO 1M 12M 5.8M 6.6M 0.5 - > 3 Months Variable
Sales
Sales Director 700K 11M 4M 5M 1 - > 3 Months
Fixed and Variable
Senior Sales Manager 400K 4M 2.2M 2.4M 0.5 - 2
Months Fixed and Variable
Sales Manager 400K 3.5M 2M 1.8M 0.5 - > 3 Months
Fixed and Variable
Sales Supervisor / Assistant Sales Manager 350K 3M 900K 1.2M 0.5 - 2
Months Fixed and Variable
Sales Specialist 350K 2.5M 760K 1M 1 - > 3 Months
Fixed and Variable
Sales Staff 200K 1.5M 525K 638K 0.5 - > 3 Months
Fixed and Variable
Marketing
Marketing Manager 500K 2M 700K 1M 1 Month Fixed and Variable
Marketing Supervisor 400K 1.2M 725K 762K 1 Month Fixed and Variable
Marketing Specialist 350K 400K 375K 375K 1 Month Variable
Marketing Staff 300K 600K 375K 412K 1 Month Fixed and Variable
20
Accounting & Finance
Accounting & Finance Director 1.8M 11M 5.5M 6.4M 1 - > 3
Months Fixed and
Variable
Senior Accounting & Fi-nance Manager 500K 15.6M 1.4M 3.5M 0.5 - 2
Months Fixed and
Variable
Accounting & Finance Manager 450K 4M 1.1M 1.7M 1 Month Fixed and
Variable
Accounting & Finance Su-pervisor / Assistant Ac-counting & Finance Man-ager
300K 3M 1.1M 1.3M 1 Month Fixed and Variable
Accounting & Finance Specialist 400K 1.2M 815K 853K 0.5 - 1
Month Fixed and
Variable
Accounting & Finance Staff 150K 1M 466K 473K 0.5 - 2
Months Fixed and
Variable
POSITION MIN (MMK)
MAX(MMK)
MEDIAN2021
AVERAGE SALARY
ANNUAL BONUS
IS BONUS FIXED OR VARIABLE
Administration
Admin Manager 500K 1.5M 900K 950K 0.5 Month -
1 month Variable
Admin Staff 350K 800K 475K 479K 0.5 - 2 Months Variable
Information & Technology
Senior IT Manager 1M 1.6M 1.35M 1.32M 0.5 - 1 Month Variable
IT Manager 600K 1M 800K 800K 1 Month Fixed and Variable
IT Supervisor 450K 600K 525K 525K 1 Month Variable
IT Specialist 350K 1.3M 550K 675K 1 - 2 Months Variable
IT Staff 350K 700K 450K 487K 2 Months Variable
21
Human Resources
HR Director 3M 4.5M 3.8M 3.8M 3 Months Variable
Senior HR Manager 500K 2M 1.5M 1.15M 0.5 - 1
Month Variable
HR Manager 1.1M 1.5M 1.3M 1.3M 2 Months Variable
HR Supervisor / Assistant HR Manager 400K 1.3M 900K 875K 1 Month Variable
HR Specialist 400K 600K 500K 500K 0.5 - 1 Month Variable
HR Staff 180K 1M 375K 461K 1 - 2 Months Variable
Engineering
Engineering Director 1.2M 7.8M 4.7M 4.4M 0.5 - 2
Months Variable
Senior Engineering Manager (s) 700K 6M 3M 2.6M 0.5 - 1
Month Fixed and Variable
Engineering Manager 600K 4M 2.7M 2.2M 0.5 - 1 Month
Fixed and Variable
Engineering Specialist / Senior En-gineering
500K 3M 1.7M 1.7M 1 - 2 Months
Fixed and Variable
Engineering Staff 250K 2.76M 500K 800K 0.5 - 2 Months
Fixed and Variable
POSITION MIN (MMK)
MAX(MMK)
MEDIAN2021
AVERAGE SALARY
ANNUAL BONUS
IS BONUS FIXED OR VARIABLE
Supply Chain
Supply Chain Supervi-sor 1.3M 1.8M 1.6M 1.6M 2 Months Variable
Supply Chain Staff 500K 900K 700K 700K 2 Months Variable
22
CONSUMER GOODS
23
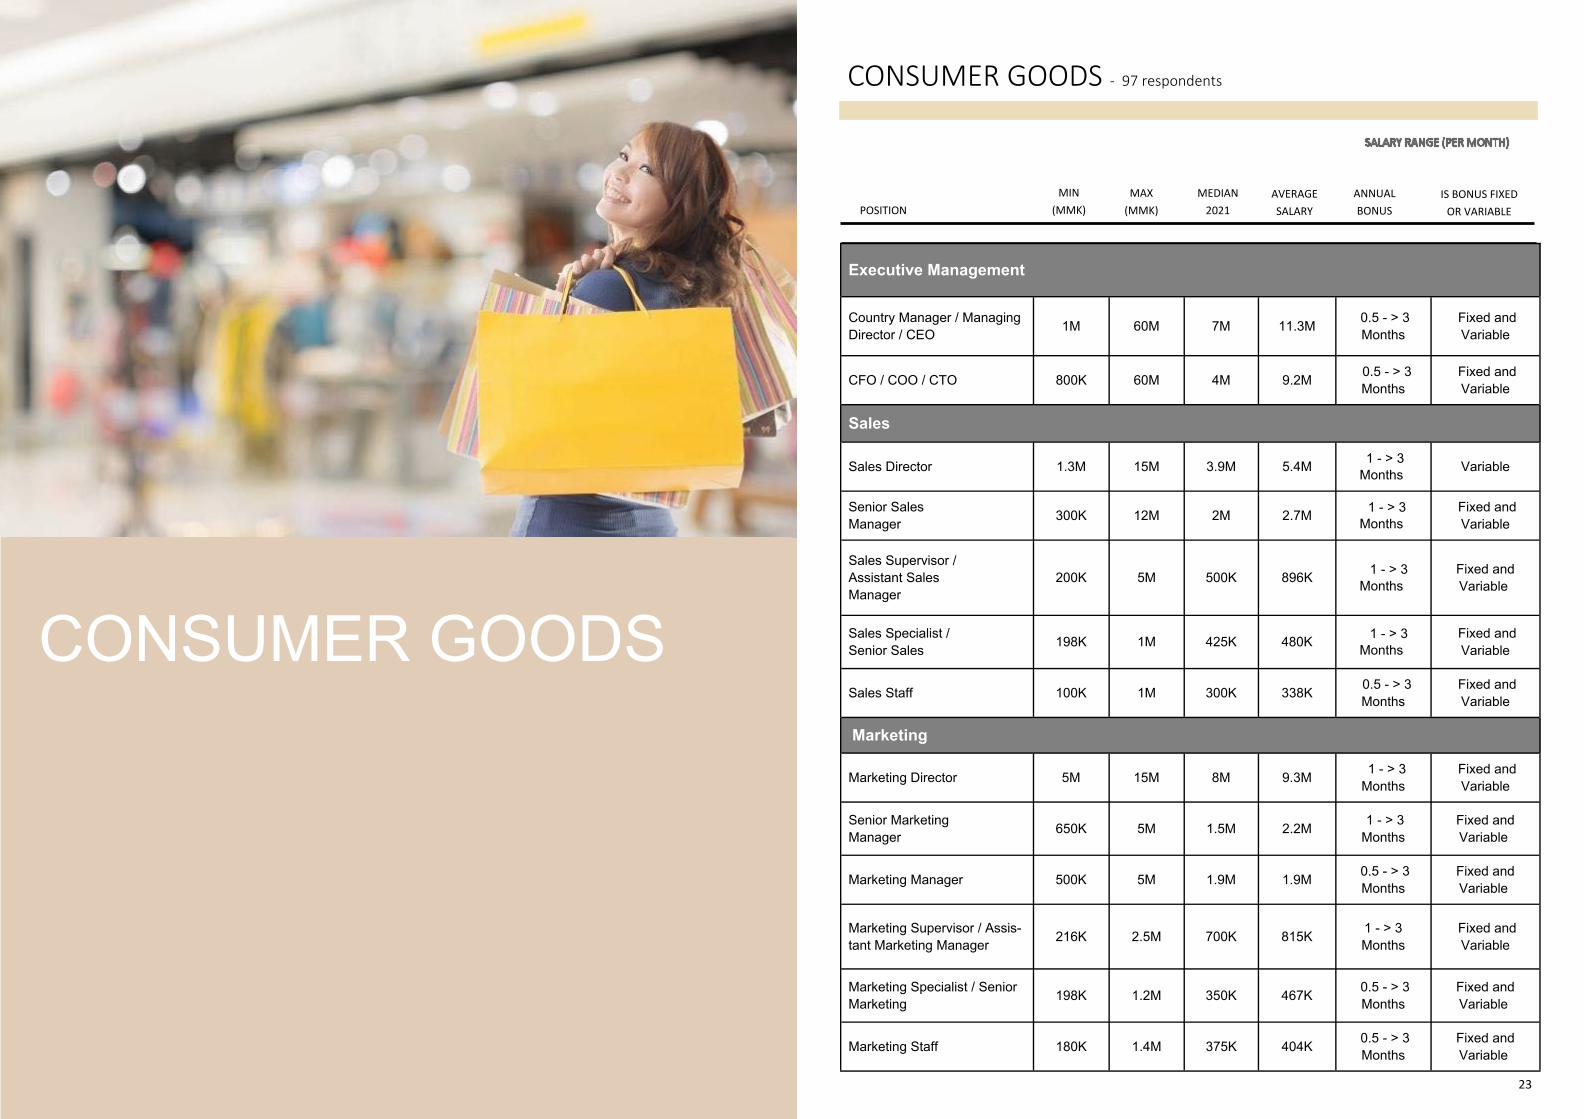
CONSUMER GOODS ‐ 97 respondents
POSITION MIN
(MMK) MAX
(MMK) ANNUAL BONUS
IS BONUS FIXED OR VARIABLE
MEDIAN2021
AVERAGE SALARY
Executive Management
Country Manager / Managing Director / CEO 1M 60M 7M 11.3M 0.5 - > 3
Months Fixed and Variable
CFO / COO / CTO 800K 60M 4M 9.2M 0.5 - > 3 Months
Fixed and Variable
Sales
Sales Director 1.3M 15M 3.9M 5.4M 1 - > 3 Months Variable
Senior Sales Manager 300K 12M 2M 2.7M 1 - > 3
Months Fixed and Variable
Sales Supervisor / Assistant Sales Manager
200K 5M 500K 896K 1 - > 3 Months
Fixed and Variable
Sales Specialist / Senior Sales 198K 1M 425K 480K 1 - > 3
Months Fixed and Variable
Sales Staff 100K 1M 300K 338K 0.5 - > 3 Months
Fixed and Variable
Marketing
Marketing Director 5M 15M 8M 9.3M 1 - > 3 Months
Fixed and Variable
Senior Marketing Manager 650K 5M 1.5M 2.2M 1 - > 3
Months Fixed and Variable
Marketing Manager 500K 5M 1.9M 1.9M 0.5 - > 3 Months
Fixed and Variable
Marketing Supervisor / Assis-tant Marketing Manager 216K 2.5M 700K 815K 1 - > 3
Months Fixed and Variable
Marketing Specialist / Senior Marketing 198K 1.2M 350K 467K 0.5 - > 3
Months Fixed and Variable
Marketing Staff 180K 1.4M 375K 404K 0.5 - > 3 Months
Fixed and Variable

24
Accounting & Finance
Accounting & Finance Director 5.5M 20M 12.5M 12M 2 - 3
Months Fixed and Variable
Senior Accounting & Fi-nance Manager
500K 10M 2M 2.4M 0.5 - > 3 Months
Fixed and Variable
Accounting & Finance Manager 275K 3.5M 1.5M 1.5M 1 - 2
Months Fixed and Variable
Accounting & Finance Supervisor / As-sistant Accounting & Finance Manager
300K 2M 550K 744K 0.5 - > 3 Months
Fixed and Variable
Accounting & Finance Specialist / Senior Ac-counting & Finance
198K 5M 655K 1M 0.5 - > 3 Months
Fixed and Variable
Accounting & Finance Staff 180K 1.4M 300K 370K 0.5 - > 3
Months Fixed and Variable
Information & Technology
Senior IT Manager 975K 4.5M 1.5M 1.1M 1 - 2 Months
Fixed and Variable
IT Manager 800K 1.5M 1M 1M 1 Month Fixed and Variable
IT Supervisor / Assistant IT Manager 450K 2M 525K 787K 1 - 2
Months Fixed
IT Specialist / Senior IT 350K 1.6M 600K 665K 1 - > 3
Months Fixed and Variable
IT Staff 200K 505K 300K 310K 1 Month Fixed and Variable
POSITION MIN
(MMK) MAX
(MMK) ANNUAL BONUS
IS BONUS FIXED OR VARIABLE
MEDIAN2021
AVERAGE SALARY
25
MAX(MMK)
Human Resources
HR Director 5.1M 15M 6.6M 8.3M 1.5 - 3 Months
Fixed and Variable
Senior HR Manager 1M 5M 2.4M 2.5M 1 - 2
Months Fixed and Variable
HR Manager 500K 3.5M 1.1M 1.4M 1 - 2 Months
Fixed and Variable
HR Supervisor / Assis-tant HR Manager 200K 2.5M 800K 925K 1 - 2
Months Fixed and Variable
HR Specialist / Senior HR 400K 900K 600K 606K 1 Month Fixed and
Variable
HR Staff 150K 650K 300K 338K 0.5 - 1 Month
Fixed and Variable
Supply Chain
Supply Chain Director 7M 15M 11M 11M 3 Months Fixed
Supply Chain Manager 450K 3.5M 1.3M 1.6M 1 - 2
Months Fixed and Variable
Supply Chain Supervisor / Assistant Supply Chain Manager
330K 2.5M 500K 946K 1 - 2 Months Fixed
Supply Chain Staff 180K 842K 375K 476K 1 - 2
Months Fixed
Procurement
Senior Procurement Manager 3.5M 5M 4.2M 4.2M 3 Months Fixed
Procurement Supervi-sor / Assistant Procure-ment Manager
300K 2.5M 910K 1.16M 1 - > 3 Months
Fixed and Variable
Procurement Staff 230K 650K 340K 390K 1 - >3 Months
Fixed and Variable
POSITION MIN
(MMK) MEDIAN
2021 AVERAGE SALARY
ANNUAL BONUS
IS BONUS FIXED OR VARIABLE

26
Engineering
Engineering Manager 900K 3.5M 2M 2.1M 1 - 2 Months
Fixed and Variable
Engineering Staff 350K 800K 575K 583K 0.5 - 1 Month Variable
Operations
Operations Director 1.8M 2M 1.9M 1.9M 1 Month Variable
Operations Manager 500K 1.3M 850K 875K 1 Month Variable
Operations Supervisor 400K 550K 475K 475K 1 Month Fixed
Operations Staff 200K 400K 300K 300K 1 Month Fixed
POSITION MIN
(MMK) MAX
(MMK) MEDIAN
2021 AVERAGE SALARY
ANNUAL BONUS
IS BONUS FIXED OR VARIABLE
Admin
Admin Director 8M 15M 11.5M 11.5M 3 Months Fixed
Senior Admin Manager 1M 2.5M 1.3M 1.4M 1 - >3 Months Variable
Admin Manager 700K 2.5M 1.3M 3.6M 2 - 3 Months Fixed
Admin Staff 200K 1.2M 350K 401K 1 - > 3 Months
Fixed and Variable
Admin Supervisor 320K 1.6M 1.3M 1.1M 1 - 3 Months
Fixed and Variable
27
POSITION MIN
(MMK) MAX
(MMK) MEDIAN
2021 AVERAGE SALARY
ANNUAL BONUS
IS BONUS FIXED OR VARIABLE
Facility & Property Management
F&P Manager 620K 1.5M 925K 992K 0.5 - 1 Month
Fixed and Variable
F&P Staff 150K 550K 365K 357K 0.5 - 1 Month
Fixed and Variable
Legal
Senior Legal Manager 2.6M 2.6M 2.6M 2.6M 1.5 Months Variable
Legal 5.4M 5.4M 5.4M 5.4M 1 Months Fixed
Food & Beverages
F& B Director 1.5M 2M 1.7M 1.7M 1 Month Fixed
Senior F&B Manager 1M 1.3M 1.1M 1.1M 1 Month Variable
F&B Manager 500K 800K 650K 650K 1 Month Variable
F&B Supervisor 500K 600K 550K 550K 1 Month Fixed
F&B Staff 150K 200K 175K 175K 1 Month Fixed

28 29
EDUCATION

30
EDUCATION ‐ 7 respondents
Executive Management
Country Manager / CEO 1.2M 15M 3.7M 4.7M 1 - 3 Months Fixed and Variable
CFO / COO / CTO 1.9M 1.9M 1.9M 1.9M 1 Month Variable
Sales
Sales Director 2.5M 5M 3.7M 3.7M 1 Month Variable
Sales Manager 700K 2.5M 775K 1.2M 1 Month Variable
Sales Specialist 300K 2M 475K 812K 1 - 2 Months
Fixed and Variable
Sales Staff 180K 1.5M 325K 582K 1 - 2 Months
Fixed and Variable
POSITION
Accounting & Finance
Finance Director 10M 17M 13.5M 13.5M 2 Months Variable
Accounting & Finance Manager 700K 5M 2.4M 2.6M 1 - 2
Months Fixed and Variable
Accounting & Staff 250K 1.5M 375K 625K 1 Month Fixed and Variable
Information & Technology
IT Manager 500K 2M 1M 1.1M 1 Month Fixed and Variable
IT Specialist 800K 1.2M 1M 1M 1 Month Variable
MIN (MMK)
MAX(MMK)
MEDIAN2021
AVERAGE SALARY
ANNUAL BONUS
IS BONUS FIXED OR VARIABLE
31
POSITION MIN
(MMK) MAX
(MMK) MEDIAN
2021 AVERAGE SALARY
ANNUAL BONUS
IS BONUS FIXED OR VARIABLE
Marketing
Senior Marketing Manager 3.5M 5M 4.2M 4.2M 1.5 Months Variable
Marketing Manager 750K 2.2M 1.2M 1.3M 1 Month Fixed and Variable
Marketing Staff 600K 1.5M 1M 1M 1 Month Variable
Administration
Senior Admin Manager 750K 750K 750K 750K 0.5 Month Variable
Admin Staff 180K 1M 500K 513K 0.5 - 1 Month
Fixed and Variable
Human Resources
HR Senior Manager 2M 3.5M 2.7M 2.7M 1.5 Months Variable
HR Supervisor 800K 1M 900K 900K 1 Month Fixed and Vari-able
HR Staff 180K 800K 400K 445K 1 - 1.5 Month
Fixed and Vari-able

32
FINANCIAL SERVICES
33
FINANCIAL SERVICES ‐ 32 respondents
Executive Management
Country Manager / CEO 900K 40M 3.5M 8.5M 0.5 - > 3 Months
Fixed and Variable
CFO / COO / CTO 1.25M 30M 8M 10.4M 0.5 - > 3 Months
Fixed and Variable
Sales
Sales Director 800K 20M 6M 7M 1 - 3 Months
Fixed and Variable
Senior Sales Manager 490K 7M 2.5M 3.1M 1 - > 3
Months Fixed and Variable
Sales Manager 800K 4M 2.1M 2.2M 1 - > 3 Months
Fixed and Variable
Sales Supervisor / Assis-tant Sales Manager 300K 2.1M 1.1M 1.1M 0.5 - 2.5
Months Fixed and Variable
Sales Specialist / Senior Sales 300K 2.1M 950K 1M 0.5 - 1.5
Months Fixed and Variable
Sales Staff 150K 1.5M 325K 461K 0.5 - 3 Months
Fixed and Variable
Marketing Director 4M 10M 5.4M 6.2M 0.5 - 1.5 months
Fixed and Variable
Senior Marketing Manag-er 1.5M 7M 4M 4.2M 0.5 - 2
Months Fixed and Variable
Marketing Manager 800K 3.5M 2M 2.1M 0.5 - > 3 Months
Fixed and Variable
Marketing Supervisor 500K 2.5M 1.2M 1.3M 0.5 - 2 Months
Fixed and Variable
Marketing
Marketing Specialist 500K 2.3M 1.2M 1.3M 0.5 - 2 Months
Fixed and Variable
Marketing Staff 200K 1M 500K 510K 0.5 - > 3 Months
Fixed and Variable
POSITION MIN (MMK)
MAX(MMK)
MEDIAN2021
AVERAGE SALARY
ANNUAL BONUS
IS BONUS FIXED OR VARIABLE

34
Accounting & Finance
Accounting & Finance Director 2M 15M 7M 7.4M 1 - 1.5
Months Fixed and Variable
Senior Accounting & Finance Manager 800K 10M 2.5M 3.4M 1 - 3
Months Fixed and Variable
Accounting & Finance Manager 800K 3.5M 1.1M 1.4M 1 Month Fixed and
Variable
Accounting & Finance Supervisor / Assistant Accounting & Finance Manager
400K 1.5M 1M 940K 1 - 3 Months
Fixed and Variable
Accounting & Finance Specialist / Senior Ac-counting & Finance
300K 2.5M 900K 1M 1 - > 3 Months
Fixed and Variable
Accounting & Finance Staff 200K 1.3M 500K 577K 1 - 2
Months Fixed and Variable
Information & Technology
IT Director 3M 4M 3.5M 3.5M 1 Month Fixed
IT Manager 600K 2M 900K 1.1M 1 - 2.5 Months
Fixed and Variable
IT Supervisor / Assistant IT Manager 500K 1.5M 800K 883K 1 - 2
Months Fixed and Variable
IT Specialist / Senior IT 500K 1.5M 725K 792K 1 - > 3
Months Fixed and Variable
IT Staff 200K 1.5M 300K 485K 1 - 2 Months
Fixed and Variable
Operations Director 2M 3M 2.5M 2.5M 1 month Fixed
Operations Manager 1.2M 1.5M 1.3M 1.3M 1 month Fixed
Operations
POSITION MIN
(MMK) MAX
(MMK) MEDIAN
2021 AVERAGE SALARY
ANNUAL BONUS
IS BONUS FIXED OR VARIABLE
35
Human Resources
HR Director 3.8M 15M 8M 8.1M 1 - 2 Months
Fixed and Variable
Senior HR Manager 3M 4M 3.5M 3.5M 1 - 2
Months Fixed and Variable
HR Manager 570K 3M 1.4M 1.5M 1 - 2 Months
Fixed and Variable
HR Supervisor / Assis-tant HR Manager 350K 2.1M 750K 882K 1 - 2
Months Fixed and Variable
HR Specialist / Senior HR 500K 650K 575K 575K 1 Month Fixed
HR Staff 200K 1.2M 425K 501K 1 - 2 Months
Fixed and Variable
Legal
Senior Legal Manager 2M 3M 2.5M 2.5M 1 Month Fixed
Legal Manager 400K 4M 1.3M 1.5M 1 - 2 Months
1 - 2 Months
Legal Staff Senior Legal 200K 1.5M 1.1M 981K 1.5 - 2
Months Fixed and Variable
POSITION MIN
(MMK) MAX
(MMK)
MEDIAN2021
AVERAGE SALARY
ANNUAL BONUS
IS BONUS FIXED OR VARIABLE
Supply Chain
Supply Chain Staff 250K 450K 350K 350K 1 Month Variable
Administration
Senior Admin Manager 2M 3.5M 2.7M 2.7M 2 Months Variable
Admin Manager 700K 3.5M 1.6M 1.7M 1 - 2 Months
Fixed and Variable
Admin Supervisor / As-sistant Admin Manager 1.5M 2M 2M 1.7M 1 - > 3
Months Fixed and Variable
Admin Staff 200K 800K 425K 438K 1 - 2 Months
Fixed and Variable

36
HEALTHCARE
37
HEALTHCARE ‐ 11 respondents
Executive Management
Country Manager / Man-aging Director / CEO 2M 16.3M 4.5M 6.4M 0.5 - 3
Months Fixed and Variable
CFO / COO / CTO 2M 9.2M 6M 5.8M 0.5 - 1 Month Variable
Sales
Sales Director 3M 3.5M 3.3M 3.3M 1 Month Fixed
Senior Sales Manager 2.5M 4.5M 4M 3.9M 0.5 - 1 Month
Fixed and Variable
Sales Manager 1.2M 2.5M 1.5M 1.7M 1 - 3 Months Variable
Sales Supervisor / As-sistant Sales Manager 450K 1.5M 1M 1.01M 0.5 - 2
Months Fixed and Variable
Sales Specialist / Senior Sales 500K 2.5M 1.2M 1.3M 1 - > 3
Months Variable
Sales Staff 200K 1M 600K 575K 0.5 - 2 Months Variable
Information & Technology
IT Manager 2M 2.3M 2.1M 2.1M 0.5 Month Variable
Marketing Director 5.1M 6.4M 5.8M 5.8M 0.5 - 1 Month Variable
Senior Marketing Man-ager 2.5M 3.5M 3M 3M 0.5 - 1
Month Variable
Marketing Manager 1M 4M 2.1M 2.2M 1 - 3 Months Variable
Marketing Staff 200K 1.4M 590K 695K 0.5 Month Variable
Accounting Accounting & Finance Manager 1.8M 3.1M 2.45M 2.45M 0.5 month Fixed
Accounting & Finance Supervisor 1.2M 2.1M 1.65M 1.65M 0.5 month Variable
Accounting & Finance Specialist 420K 1M 710K 710K 0.5 month Variable
Accounting & Finance Staff 200K 480K 340K 340K 0.5 month Variable
Marketing
POSITION MIN
(MMK) MAX
(MMK) MEDIAN
2021 AVERAGE SALARY
ANNUAL BONUS
IS BONUS FIXED OR VARIABLE
38
HOSPITALITY
39
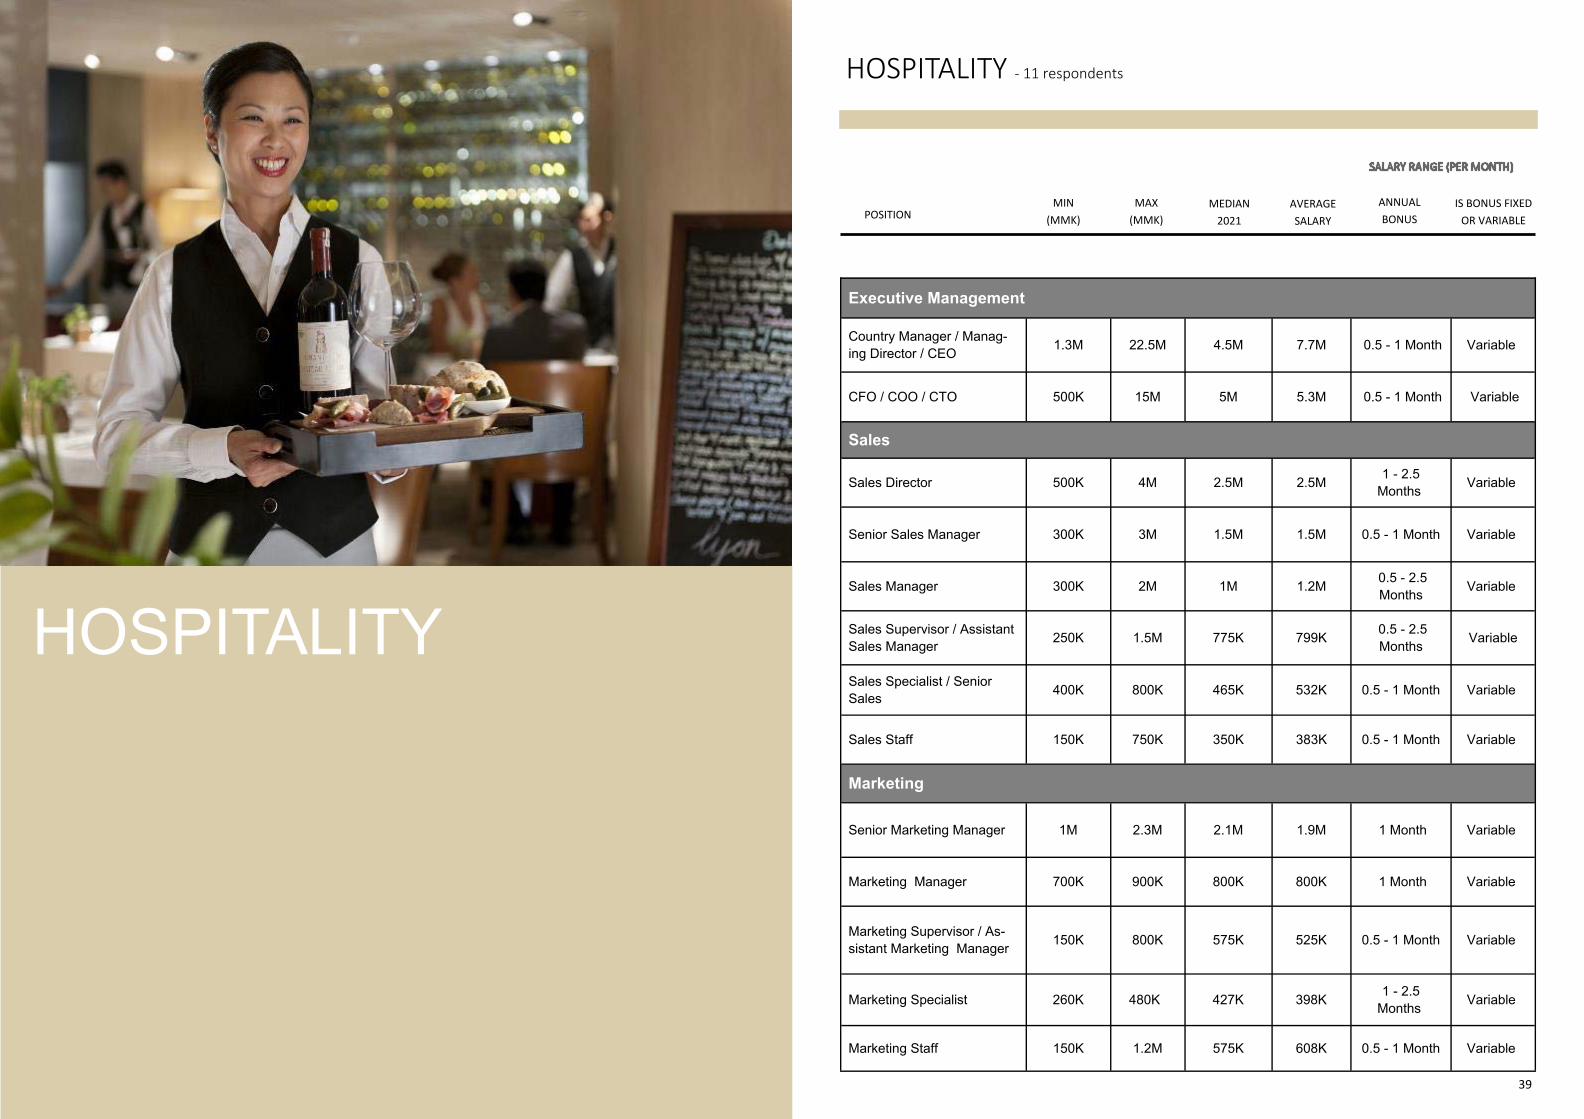
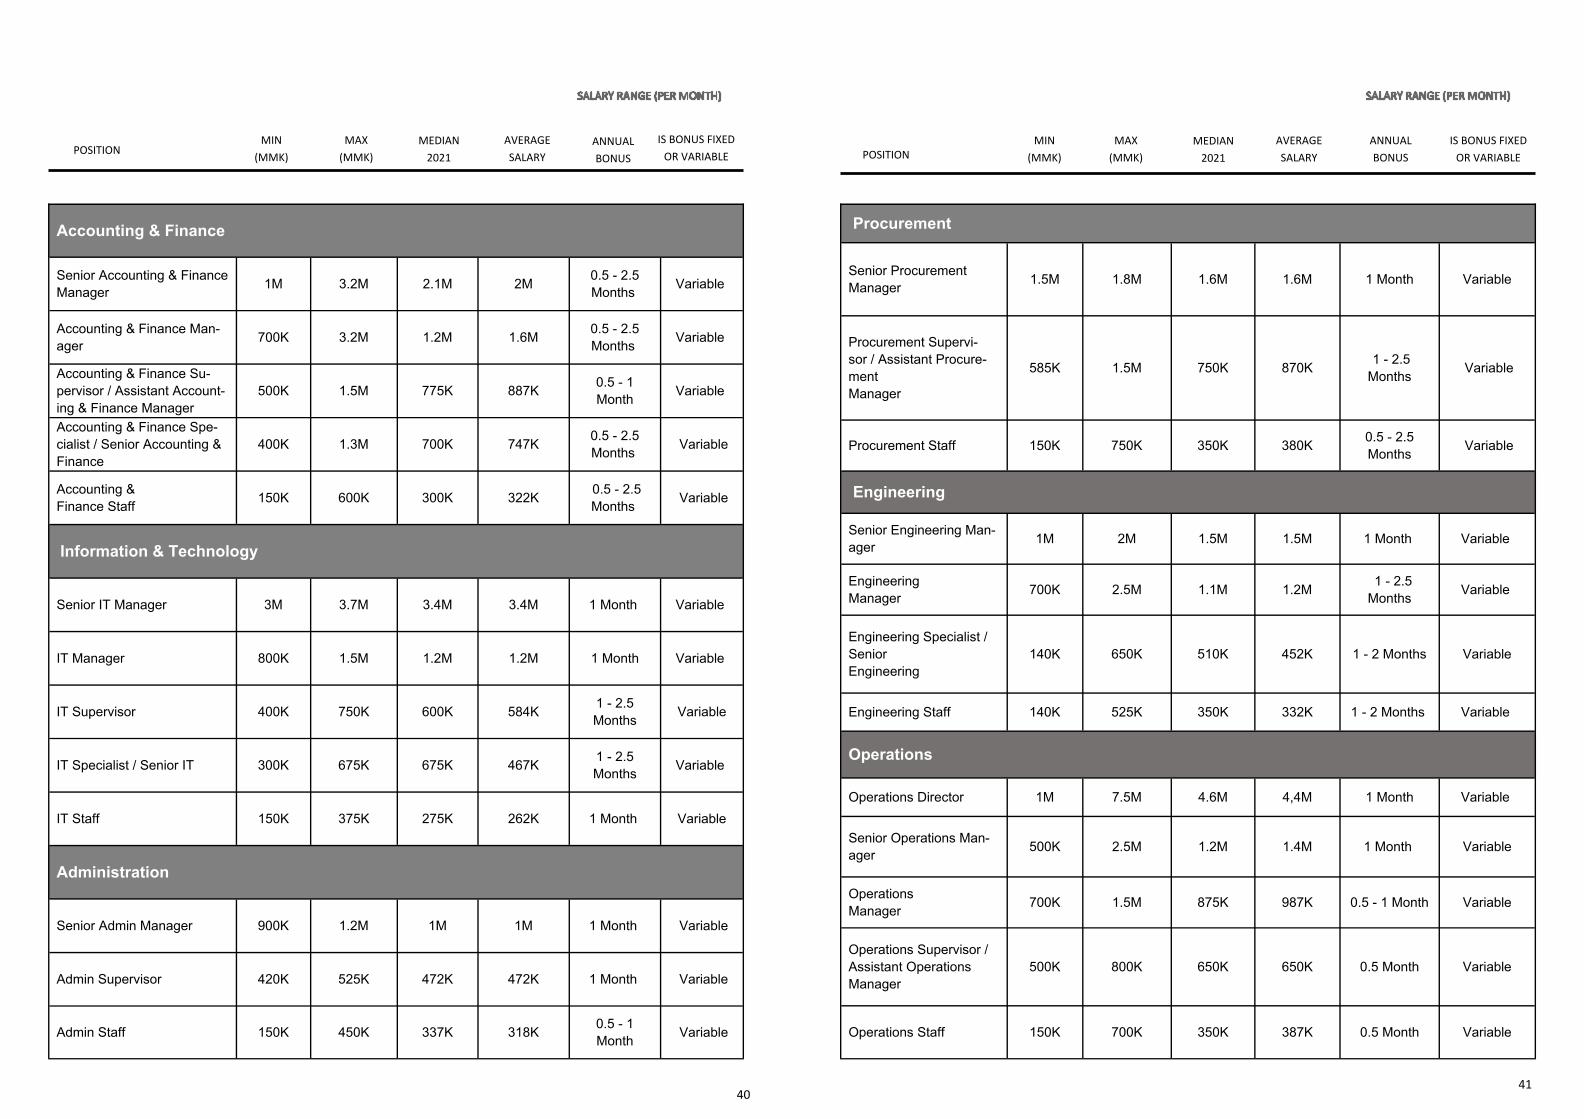
HOSPITALITY ‐ 11 respondents
Executive Management
Country Manager / Manag-ing Director / CEO 1.3M 22.5M 4.5M 7.7M 0.5 - 1 Month Variable
CFO / COO / CTO 500K 15M 5M 5.3M 0.5 - 1 Month Variable
Sales
Sales Director 500K 4M 2.5M 2.5M 1 - 2.5 Months Variable
Senior Sales Manager 300K 3M 1.5M 1.5M 0.5 - 1 Month Variable
Sales Manager 300K 2M 1M 1.2M 0.5 - 2.5 Months Variable
Sales Supervisor / Assistant Sales Manager 250K 1.5M 775K 799K 0.5 - 2.5
Months Variable
Sales Specialist / Senior Sales 400K 800K 465K 532K 0.5 - 1 Month Variable
Sales Staff 150K 750K 350K 383K 0.5 - 1 Month Variable
Marketing
Senior Marketing Manager 1M 2.3M 2.1M 1.9M 1 Month Variable
Marketing Manager 700K 900K 800K 800K 1 Month Variable
Marketing Supervisor / As-sistant Marketing Manager 150K 800K 575K 525K 0.5 - 1 Month Variable
Marketing Specialist 260K 480K 427K 398K 1 - 2.5 Months Variable
Marketing Staff 150K 1.2M 575K 608K 0.5 - 1 Month Variable
POSITION MIN
(MMK) MAX
(MMK) MEDIAN
2021 AVERAGE SALARY
ANNUAL BONUS
IS BONUS FIXED OR VARIABLE
40
Accounting & Finance
Senior Accounting & Finance Manager 1M 3.2M 2.1M 2M 0.5 - 2.5
Months Variable
Accounting & Finance Man-ager 700K 3.2M 1.2M 1.6M 0.5 - 2.5
Months Variable
Accounting & Finance Su-pervisor / Assistant Account-ing & Finance Manager
500K 1.5M 775K 887K 0.5 - 1 Month
Variable
Accounting & Finance Spe-cialist / Senior Accounting & Finance
400K 1.3M 700K 747K 0.5 - 2.5 Months Variable
Accounting & Finance Staff 150K 600K 300K 322K 0.5 - 2.5
Months Variable
Information & Technology
Senior IT Manager 3M 3.7M 3.4M 3.4M 1 Month Variable
IT Manager 800K 1.5M 1.2M 1.2M 1 Month Variable
IT Supervisor 400K 750K 600K 584K 1 - 2.5 Months Variable
IT Specialist / Senior IT 300K 675K 675K 467K 1 - 2.5 Months Variable
IT Staff 150K 375K 275K 262K 1 Month Variable
Administration
Senior Admin Manager 900K 1.2M 1M 1M 1 Month Variable
Admin Supervisor 420K 525K 472K 472K 1 Month Variable
Admin Staff 150K 450K 337K 318K 0.5 - 1 Month Variable
POSITION MIN
(MMK) MAX
(MMK) MEDIAN
2021 AVERAGE SALARY
ANNUAL BONUS
IS BONUS FIXED OR VARIABLE
41
POSITION MIN
(MMK) MAX
(MMK) MEDIAN
2021 AVERAGE SALARY
ANNUAL BONUS
IS BONUS FIXED OR VARIABLE
Procurement
Senior Procurement Manager 1.5M 1.8M 1.6M 1.6M 1 Month Variable
Procurement Supervi-sor / Assistant Procure-ment Manager
585K 1.5M 750K 870K 1 - 2.5 Months Variable
Procurement Staff 150K 750K 350K 380K 0.5 - 2.5 Months Variable
Engineering
Senior Engineering Man-ager 1M 2M 1.5M 1.5M 1 Month Variable
Engineering Manager 700K 2.5M 1.1M 1.2M 1 - 2.5
Months Variable
Engineering Specialist / Senior Engineering
140K 650K 510K 452K 1 - 2 Months Variable
Engineering Staff 140K 525K 350K 332K 1 - 2 Months Variable
Operations
Operations Director 1M 7.5M 4.6M 4,4M 1 Month Variable
Senior Operations Man-ager 500K 2.5M 1.2M 1.4M 1 Month Variable
Operations Manager 700K 1.5M 875K 987K 0.5 - 1 Month Variable
Operations Supervisor / Assistant Operations Manager
500K 800K 650K 650K 0.5 Month Variable
Operations Staff 150K 700K 350K 387K 0.5 Month Variable

42
POSITION MIN
(MMK) MAX
(MMK) MEDIAN
2021 AVERAGE SALARY
ANNUAL BONUS
IS BONUS FIXED OR VARIABLE
HR
HR Director 7.5M 12.7M 10.1M 10.1M 1 Month Variable
HR Senior Manager 1M 2M 1.6M 1.6M 1 Month Variable
HR Manager 700K 6M 1.3M 1.8M 0.5 - 2.5 Months Variable
HR Supervisor 500K 900K 625K 654K 0.5 - 1 Month Variable
HR Specialist 400K 700K 490K 528K 0.5 - 2.5 Months Variable
HR Staff 150K 520K 280K 321K 0.5 - 2.5 Months Variable
Facility & Property Management
F&P Manager 2M 3.2M 2.6M 2.6M 2.5 Months Variable
F&P Supervisor 900K 1.5M 1.2M 1.2M 2.5 Months Variable
F&P Staff 300K 520K 410K 410K 2 Months Variable
Food & Beverages
F&B Director 2M 4M 3M 3M 0.5 - 1 Month Variable
Senior F&B Manager 1M 4M 1.6M 2M 1 Month Variable
F&B Manager 350K 2M 750K 900K 1 - 2.5 Month Variable
F&B Supervisor 250K 1.05M 575K 600K 1 - > 3 Months Variable
F&B Staff 144K 480K 240K 257K 1 Month Variable
43
LOGISTICS

44
LOGISTICS ‐ 17 respondents
Executive Management
Country Manager / Man-aging Director / CEO 1M 15M 6M 6.5M 1 - > 3
Months Fixed and Var-
iable
CFO / COO / CTO 1.5M 5M 3.2M 3.4M 1 - > 3 Months Variable
Sales
Sales Director 3M 7M 5M 4.8M 0.5 - 1 Month
Fixed and Var-iable
Senior Sales Manager 2M 3M 2.5M 2.5M 1 - > 3 Months
Fixed and Var-iable
Sales Manager 600K 2.5M 1.3M 1.4M 0.5 - > 3 Months Variable
Sales Supervisor 400K 900K 550K 583K 1 - > 3 Months Variable
Sales Staff 300K 1M 515K 567K 0.5 - 2 Months
Fixed and Variable
Marketing
Marketing Director 4M 5M 4.5M 4.5M 1 Month Variable
Senior Marketing Manager 1.5M 2M 1.7M 1.7M 1 Month Variable
Marketing Manager 500K 1.2M 1M 950K 1 Month Fixed and Variable
Marketing Supervisor / Assistant Marketing Manager
700K 900K 800K 800K 1 Month Variable
Marketing Staff 300K 500K 400K 400K 1 Month Variable
Procurement Manager 600K 1M 800K 800K 0.5 Month Variable
Procurement Staff 300K 600K 450K 450K 1 Month Fixed and Variable
Procurement
POSITION MIN
(MMK) MAX
(MMK) MEDIAN
2021 AVERAGE SALARY
ANNUAL BONUS
IS BONUS FIXED OR VARIABLE
45
POSITION MIN
(MMK) MAX
(MMK) MEDIAN
2021 AVERAGE SALARY
ANNUAL BONUS
IS BONUS FIXED OR VARIABLE
Accounting & Finance
Senior Accounting & Finance Manager 1.2M 2M 1.6M 1.6M 1 - > 3
Months Fixed and Variable
Accounting & Finance Manager 1.2M 3M 1.7M 1.8M 1 Month Fixed and
Variable
Accounting & Finance Supervisor 1M 1.5M 1.5M 972K 1 - 2
Months Fixed and Variable
Accounting & Finance Spe-cialist / Senior Accounting & Finance
500K 1.2M 900K 916K 0.5 - 2.5 Months
Fixed and Variable
Accounting & Finance Staff 210K 800K 400K 450K 0.5 - 2.5
Months Fixed and Variable
Information & Technology
Senior IT Manager 3M 4M 3.5M 3.5M 1 Month Fixed and Variable
IT Specialist 600K 800K 700K 700K 2 Months Fixed
Administration
Admin Manager 800K 3.5M 2.3M 2.2M 0.5 Month Variable
Admin Supervisor 700K 1M 850K 850K 1 Month Variable
Admin Staff 300K 500K 350K 366K 0.5 - 1 Month Variable
Human Resources
HR Senior Manager 1.5M 3.5M 2.5M 2.5M 0.5 Month Variable
HR Manager 1M 3.5M 1.4M 1.8M 0.5 - 2 Months
Fixed and Variable
HR Supervisor 400K 600K 500K 500K 1 Month Fixed
HR Specialist 300K 800K 500K 525K 0.5 - 1 Month Variable
HR Staff 250K 400K 300K 312K 0.5 - 1 Month Variable
Operations Manager 1.5M 1.7M 1.6M 1.6M 2 Months Fixed
Operations Supervisor 600K 1M 650K 725K 1 Month Variable
Operations Staff 400K 1M 550K 625K 1 - 2 Months
Fixed and Variable
Operations

46 47
MANUFACTURING
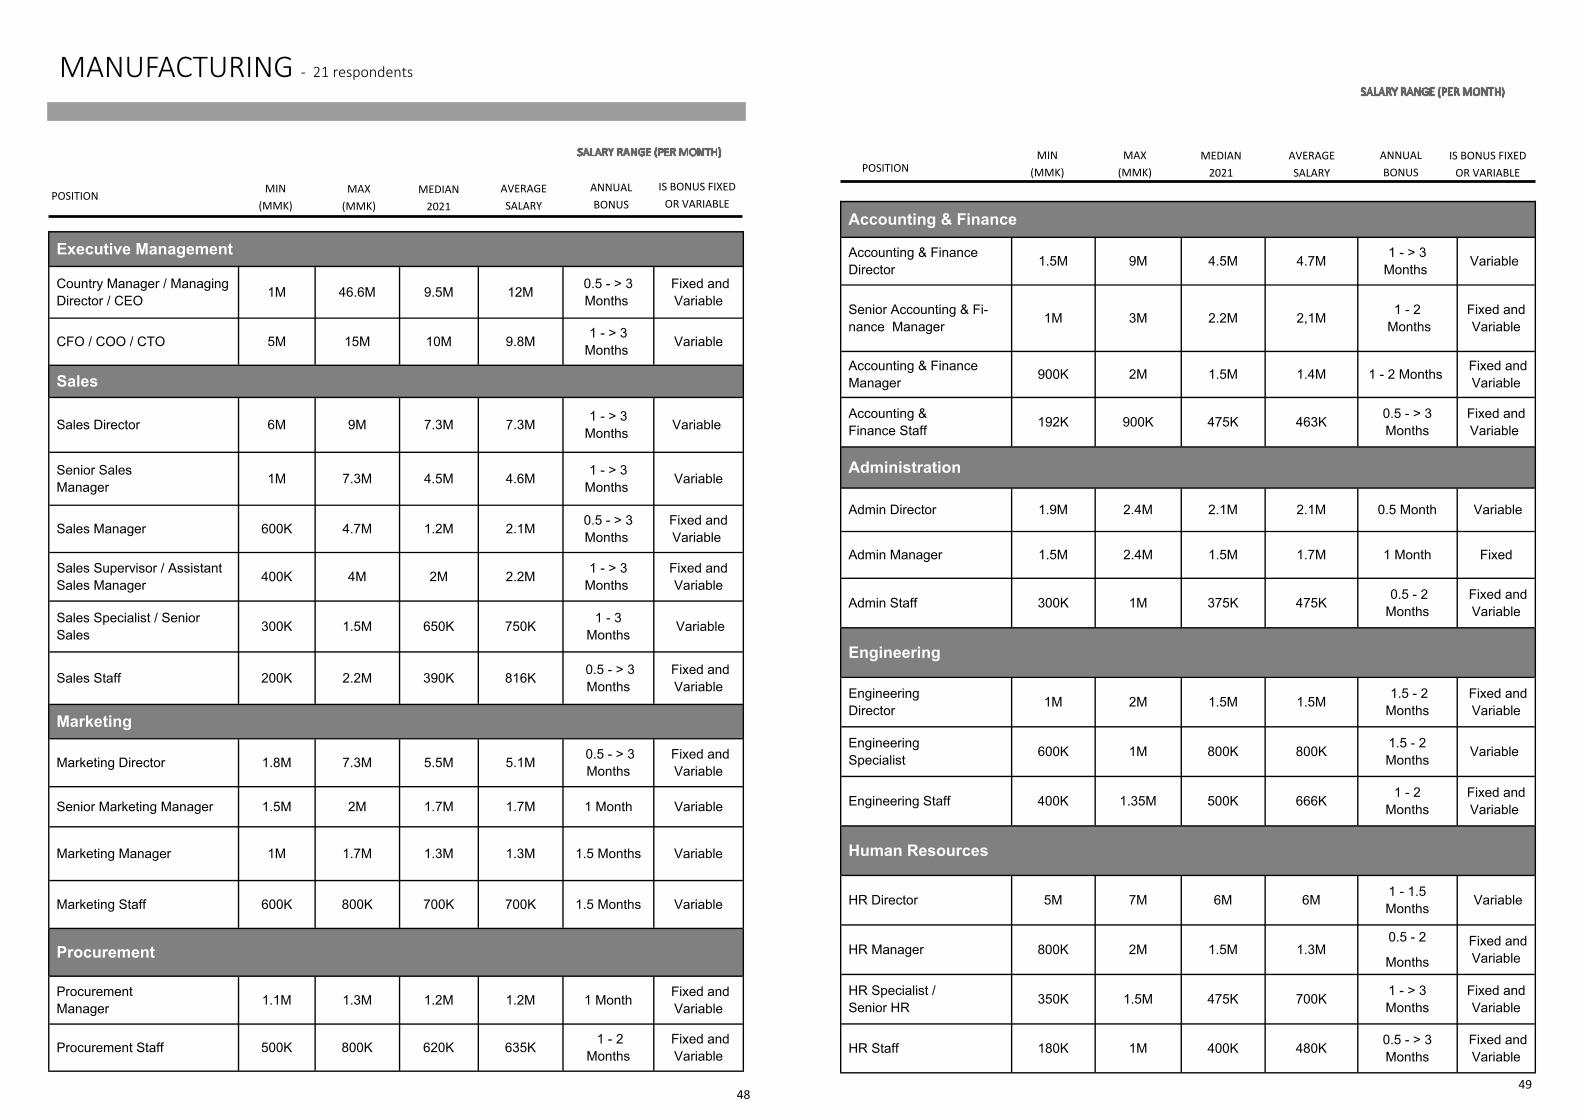
48
MANUFACTURING ‐ 21 respondents
POSITION MIN (MMK)
MAX(MMK)
AVERAGE SALARY
MEDIAN2021
ANNUAL BONUS
IS BONUS FIXED OR VARIABLE
Executive Management
Country Manager / Managing Director / CEO 1M 46.6M 9.5M 12M 0.5 - > 3
Months Fixed and Variable
CFO / COO / CTO 5M 15M 10M 9.8M 1 - > 3 Months Variable
Sales
Sales Director 6M 9M 7.3M 7.3M 1 - > 3 Months Variable
Senior Sales Manager 1M 7.3M 4.5M 4.6M 1 - > 3
Months Variable
Sales Manager 600K 4.7M 1.2M 2.1M 0.5 - > 3 Months
Fixed and Variable
Sales Supervisor / Assistant Sales Manager 400K 4M 2M 2.2M 1 - > 3
Months Fixed and Variable
Sales Specialist / Senior Sales 300K 1.5M 650K 750K 1 - 3
Months Variable
Sales Staff 200K 2.2M 390K 816K 0.5 - > 3 Months
Fixed and Variable
Marketing
Marketing Director 1.8M 7.3M 5.5M 5.1M 0.5 - > 3 Months
Fixed and Variable
Senior Marketing Manager 1.5M 2M 1.7M 1.7M 1 Month Variable
Marketing Manager 1M 1.7M 1.3M 1.3M 1.5 Months Variable
Marketing Staff 600K 800K 700K 700K 1.5 Months Variable
Procurement Manager 1.1M 1.3M 1.2M 1.2M 1 Month Fixed and
Variable
Procurement Staff 500K 800K 620K 635K 1 - 2 Months
Fixed and Variable
Procurement
49
Accounting & Finance
Accounting & Finance Director 1.5M 9M 4.5M 4.7M 1 - > 3
Months Variable
Senior Accounting & Fi-nance Manager 1M 3M 2.2M 2,1M 1 - 2
Months Fixed and Variable
Accounting & Finance Manager 900K 2M 1.5M 1.4M 1 - 2 Months Fixed and
Variable
Accounting & Finance Staff 192K 900K 475K 463K 0.5 - > 3
Months Fixed and Variable
Administration
Admin Director 1.9M 2.4M 2.1M 2.1M 0.5 Month Variable
Admin Manager 1.5M 2.4M 1.5M 1.7M 1 Month Fixed
Admin Staff 300K 1M 375K 475K 0.5 - 2 Months
Fixed and Variable
Engineering
Engineering Director 1M 2M 1.5M 1.5M 1.5 - 2
Months Fixed and Variable
Engineering Specialist 600K 1M 800K 800K 1.5 - 2
Months Variable
Engineering Staff 400K 1.35M 500K 666K 1 - 2 Months
Fixed and Variable
HR Director 5M 7M 6M 6M 1 - 1.5 Months Variable
HR Manager 800K 2M 1.5M 1.3M 0.5 - 2
Months Fixed and Variable
HR Specialist / Senior HR 350K 1.5M 475K 700K 1 - > 3
Months Fixed and Variable
Human Resources
HR Staff 180K 1M 400K 480K 0.5 - > 3 Months
Fixed and Variable
POSITION MIN
(MMK) MAX
(MMK) MEDIAN
2021 AVERAGE SALARY
ANNUAL BONUS
IS BONUS FIXED OR VARIABLE

50
Information Technology
IT Manager 800K 2.5M 1.2M 1.4M 0.5 - 1.5 Months Variable
IT Supervisor / Assistant IT Manager
400K 500K 425K 437K 0.5 - 1 Months
Fixed and Variable
IT Specialist / Senior IT 400K 1M 500K 600K 1 - 1.5
Months Fixed and Variable
IT Staff 300K 480K 390K 390K 0.5 Month Variable
Supply Chain
Supply Chain Director 5M 8M 6.5M 6.5M 1.5 Months Variable
Supply Chain Manager 1M 1.5M 1.25M 1.25M 1.5 Months Variable
Supply Chain Staff 400K 1M 700K 700K 1.5 Months Variable
POSITION MIN
(MMK) MAX
(MMK) MEDIAN
2021 AVERAGE SALARY
ANNUAL BONUS
IS BONUS FIXED OR VARIABLE
51
NGO / NPO
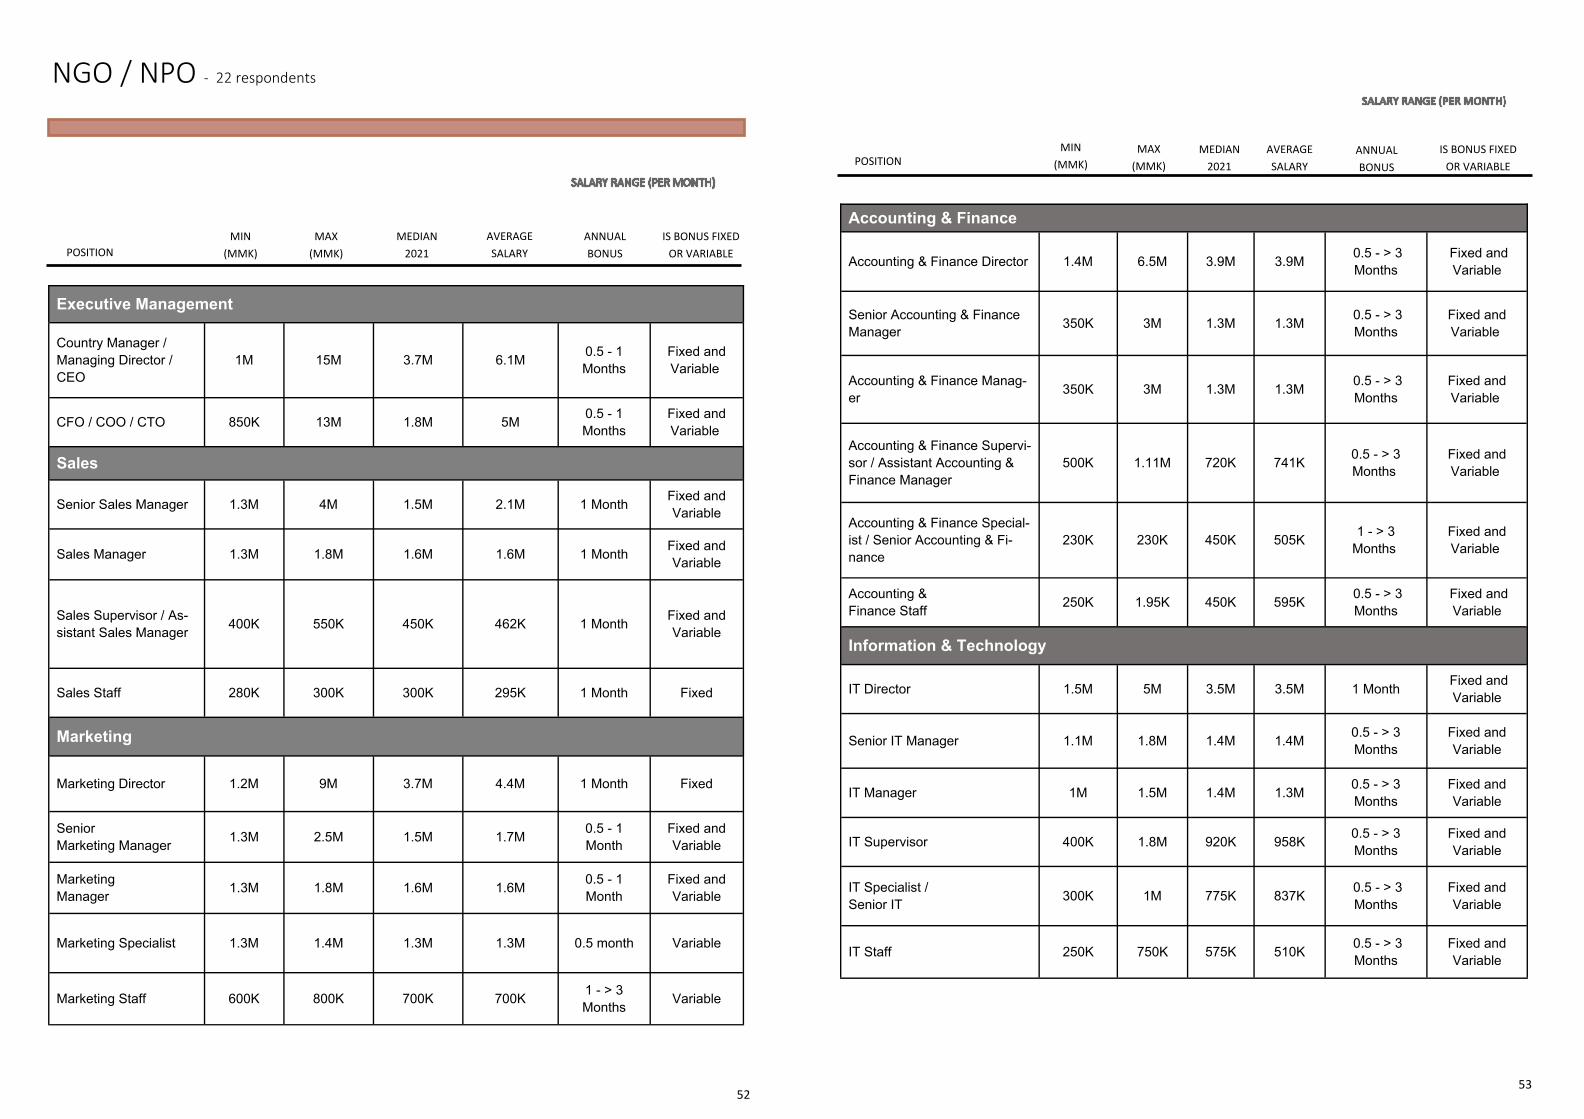
52
NGO / NPO ‐ 22 respondents
Executive Management
Country Manager / Managing Director / CEO
1M 15M 3.7M 6.1M 0.5 - 1 Months
Fixed and Variable
CFO / COO / CTO 850K 13M 1.8M 5M 0.5 - 1 Months
Fixed and Variable
Sales
Senior Sales Manager 1.3M 4M 1.5M 2.1M 1 Month Fixed and Variable
Sales Manager 1.3M 1.8M 1.6M 1.6M 1 Month Fixed and Variable
Sales Supervisor / As-sistant Sales Manager 400K 550K 450K 462K 1 Month Fixed and
Variable
Sales Staff 280K 300K 300K 295K 1 Month Fixed
Marketing
Marketing Director 1.2M 9M 3.7M 4.4M 1 Month Fixed
Senior Marketing Manager 1.3M 2.5M 1.5M 1.7M 0.5 - 1
Month Fixed and Variable
Marketing Manager 1.3M 1.8M 1.6M 1.6M 0.5 - 1
Month Fixed and Variable
Marketing Specialist 1.3M 1.4M 1.3M 1.3M 0.5 month Variable
Marketing Staff 600K 800K 700K 700K 1 - > 3 Months Variable
POSITION MIN
(MMK) MAX
(MMK) MEDIAN
2021 AVERAGE SALARY
ANNUAL BONUS
IS BONUS FIXED OR VARIABLE
53
Accounting & Finance
Accounting & Finance Director 1.4M 6.5M 3.9M 3.9M 0.5 - > 3 Months
Fixed and Variable
Senior Accounting & Finance Manager 350K 3M 1.3M 1.3M 0.5 - > 3
Months Fixed and Variable
Accounting & Finance Manag-er 350K 3M 1.3M 1.3M 0.5 - > 3
Months Fixed and Variable
Accounting & Finance Supervi-sor / Assistant Accounting & Finance Manager
500K 1.11M 720K 741K 0.5 - > 3 Months
Fixed and Variable
Accounting & Finance Special-ist / Senior Accounting & Fi-nance
230K 230K 450K 505K 1 - > 3 Months
Fixed and Variable
Accounting & Finance Staff 250K 1.95K 450K 595K 0.5 - > 3
Months Fixed and Variable
Information & Technology
Senior IT Manager 1.1M 1.8M 1.4M 1.4M 0.5 - > 3 Months
Fixed and Variable
IT Manager 1M 1.5M 1.4M 1.3M 0.5 - > 3 Months
Fixed and Variable
IT Specialist / Senior IT 300K 1M 775K 837K 0.5 - > 3
Months Fixed and Variable
IT Staff 250K 750K 575K 510K 0.5 - > 3 Months
Fixed and Variable
IT Director 1.5M 5M 3.5M 3.5M 1 Month Fixed and Variable
IT Supervisor 400K 1.8M 920K 958K 0.5 - > 3 Months
Fixed and Variable
POSITION MIN
(MMK) MAX
(MMK) AVERAGE SALARY
MEDIAN2021
ANNUAL BONUS
IS BONUS FIXED OR VARIABLE
54
POSITION MIN
(MMK) MAX
(MMK) MEDIAN
2021 AVERAGE SALARY
ANNUAL BONUS
IS BONUS FIXED OR VARIABLE
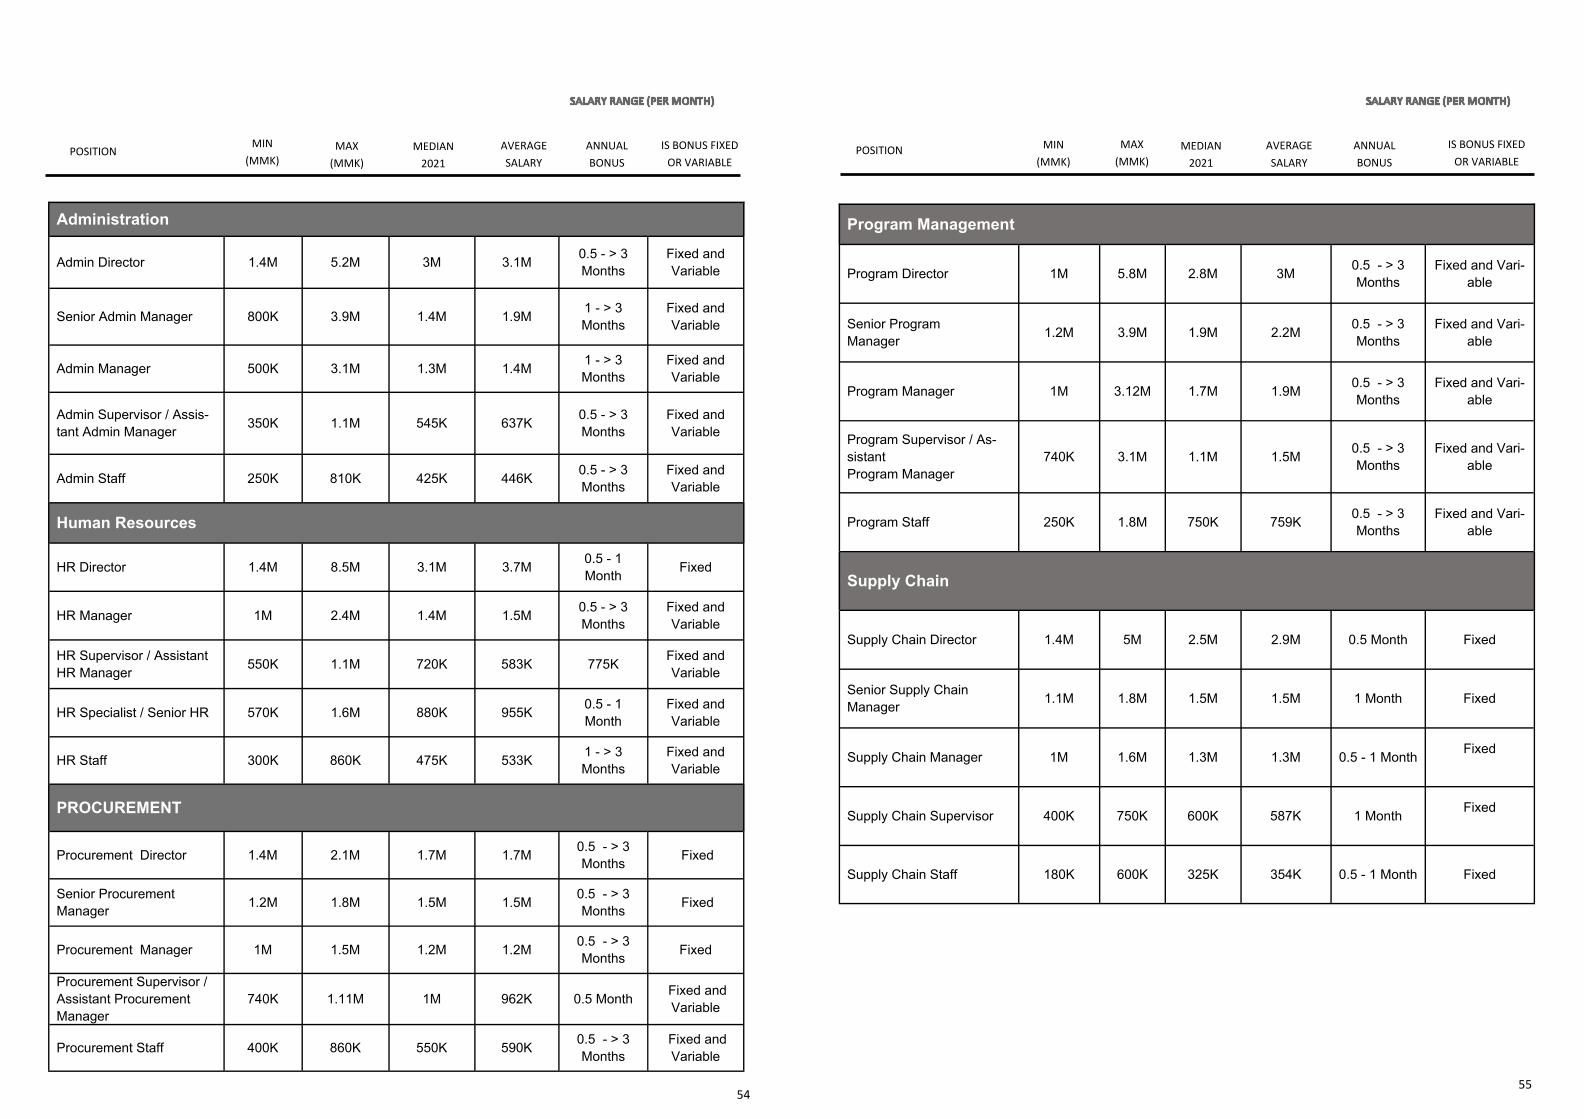
Administration
Admin Director 1.4M 5.2M 3M 3.1M 0.5 - > 3 Months
Fixed and Variable
Senior Admin Manager 800K 3.9M 1.4M 1.9M 1 - > 3 Months
Fixed and Variable
Admin Manager 500K 3.1M 1.3M 1.4M 1 - > 3 Months
Fixed and Variable
Admin Supervisor / Assis-tant Admin Manager 350K 1.1M 545K 637K 0.5 - > 3
Months Fixed and Variable
Admin Staff 250K 810K 425K 446K 0.5 - > 3 Months
Fixed and Variable
Human Resources
HR Director 1.4M 8.5M 3.1M 3.7M 0.5 - 1 Month Fixed
HR Manager 1M 2.4M 1.4M 1.5M 0.5 - > 3 Months
Fixed and Variable
HR Supervisor / Assistant HR Manager 550K 1.1M 720K 583K 775K Fixed and
Variable
HR Specialist / Senior HR 570K 1.6M 880K 955K 0.5 - 1 Month
Fixed and Variable
HR Staff 300K 860K 475K 533K 1 - > 3 Months
Fixed and Variable
Procurement Director 1.4M 2.1M 1.7M 1.7M 0.5 - > 3 Months Fixed
Senior Procurement Manager 1.2M 1.8M 1.5M 1.5M 0.5 - > 3
Months Fixed
Procurement Manager 1M 1.5M 1.2M 1.2M 0.5 - > 3 Months Fixed
Procurement Supervisor / Assistant Procurement Manager
740K 1.11M 1M 962K 0.5 Month Fixed and Variable
Procurement Staff 400K 860K 550K 590K 0.5 - > 3 Months
Fixed and Variable
PROCUREMENT
55
POSITION IS BONUS FIXED OR VARIABLE
AVERAGE SALARY
Program Management
Program Director 1M 5.8M 2.8M 3M 0.5 - > 3 Months
Fixed and Vari-able
Senior Program Manager 1.2M 3.9M 1.9M 2.2M 0.5 - > 3
Months Fixed and Vari-
able
Program Manager 1M 3.12M 1.7M 1.9M 0.5 - > 3 Months
Fixed and Vari-able
Program Supervisor / As-sistant Program Manager
740K 3.1M 1.1M 1.5M 0.5 - > 3 Months
Fixed and Vari-able
Program Staff 250K 1.8M 750K 759K 0.5 - > 3 Months
Fixed and Vari-able
Supply Chain
Supply Chain Director 1.4M 5M 2.5M 2.9M 0.5 Month Fixed
Senior Supply Chain Manager 1.1M 1.8M 1.5M 1.5M 1 Month Fixed
Supply Chain Manager 1M 1.6M 1.3M 1.3M 0.5 - 1 Month Fixed
Supply Chain Supervisor 400K 750K 600K 587K 1 Month Fixed
Supply Chain Staff 180K 600K 325K 354K 0.5 - 1 Month Fixed
MIN (MMK)
MAX(MMK)
MEDIAN2021
ANNUAL BONUS

56 57
SERVICES
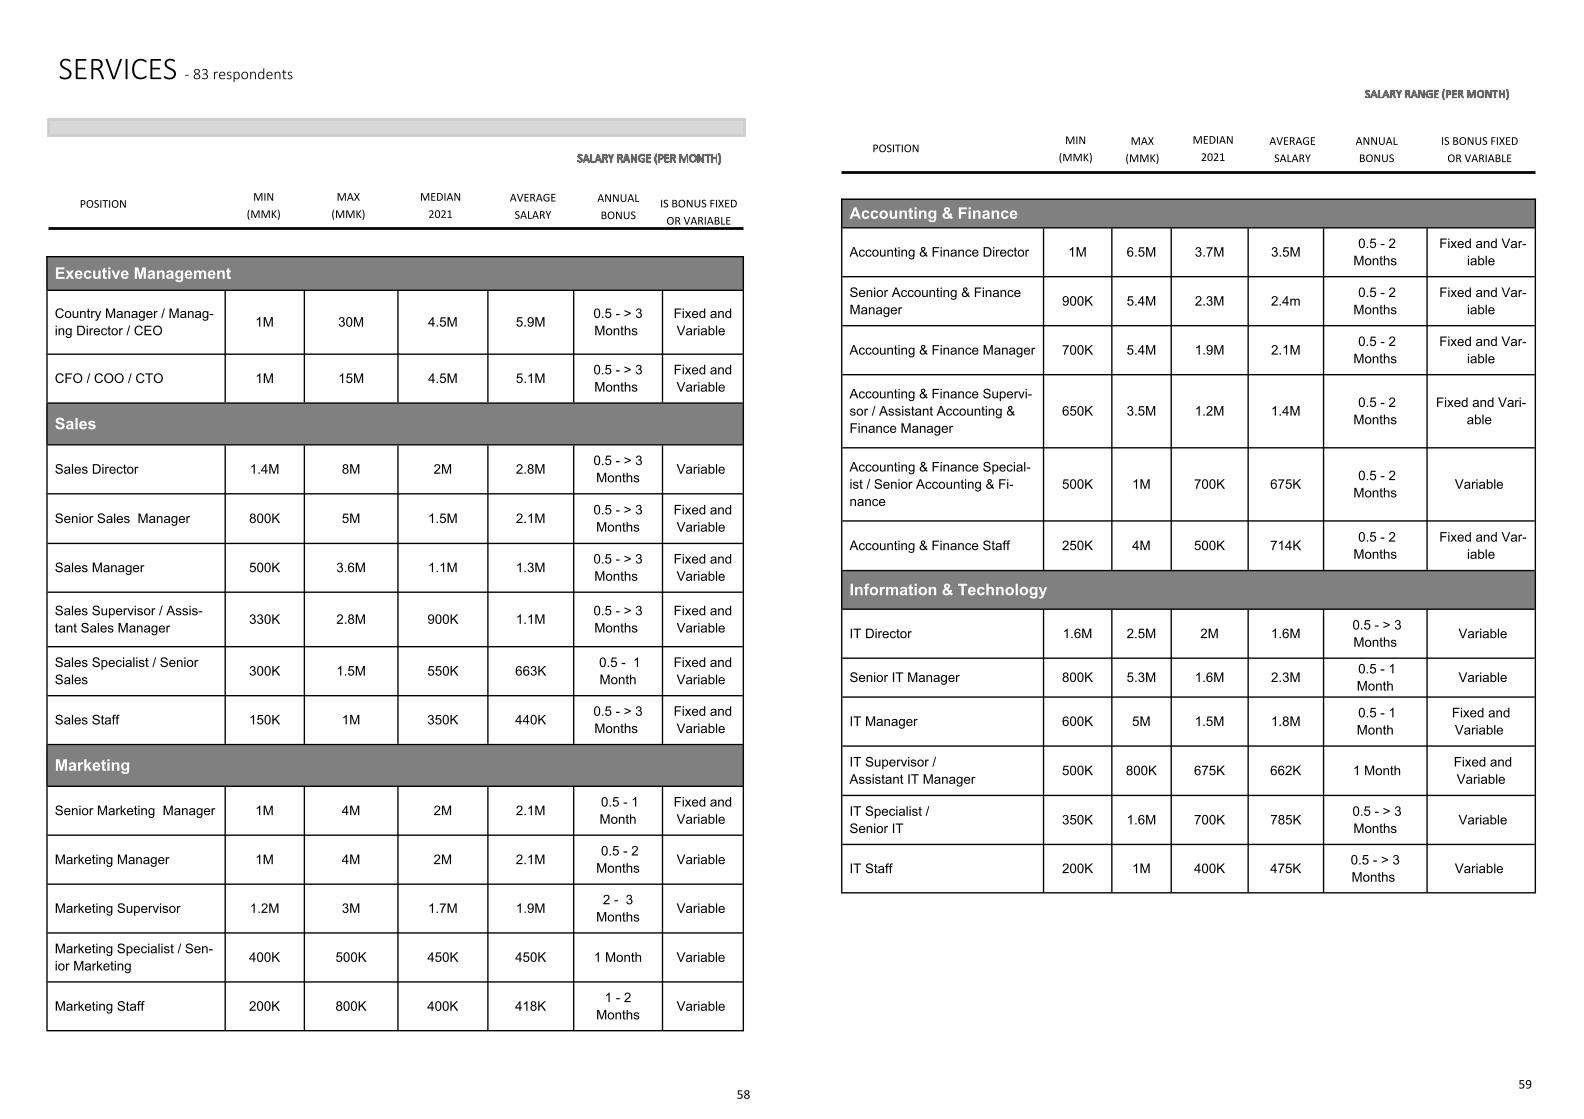
58
SERVICES ‐ 83 respondents
POSITION
Executive Management
Country Manager / Manag-ing Director / CEO 1M 30M 4.5M 5.9M 0.5 - > 3
Months Fixed and Variable
CFO / COO / CTO 1M 15M 4.5M 5.1M 0.5 - > 3 Months
Fixed and Variable
Sales
Sales Director 1.4M 8M 2M 2.8M 0.5 - > 3 Months Variable
Senior Sales Manager 800K 5M 1.5M 2.1M 0.5 - > 3 Months
Fixed and Variable
Sales Manager 500K 3.6M 1.1M 1.3M 0.5 - > 3 Months
Fixed and Variable
Sales Supervisor / Assis-tant Sales Manager 330K 2.8M 900K 1.1M 0.5 - > 3
Months Fixed and Variable
Sales Specialist / Senior Sales 300K 1.5M 550K 663K 0.5 - 1
Month Fixed and Variable
Sales Staff 150K 1M 350K 440K 0.5 - > 3 Months
Fixed and Variable
Marketing
Senior Marketing Manager 1M 4M 2M 2.1M 0.5 - 1 Month
Fixed and Variable
Marketing Manager 1M 4M 2M 2.1M 0.5 - 2 Months Variable
Marketing Supervisor 1.2M 3M 1.7M 1.9M 2 - 3 Months Variable
Marketing Specialist / Sen-ior Marketing 400K 500K 450K 450K 1 Month Variable
Marketing Staff 200K 800K 400K 418K 1 - 2 Months Variable
MIN (MMK)
MAX(MMK)
MEDIAN2021
AVERAGE SALARY
ANNUAL BONUS
IS BONUS FIXED OR VARIABLE
59
POSITION
Accounting & Finance
Accounting & Finance Director 1M 6.5M 3.7M 3.5M 0.5 - 2 Months
Fixed and Var-iable
Senior Accounting & Finance Manager 900K 5.4M 2.3M 2.4m 0.5 - 2
Months Fixed and Var-
iable
Accounting & Finance Manager 700K 5.4M 1.9M 2.1M 0.5 - 2 Months
Fixed and Var-iable
Accounting & Finance Supervi-sor / Assistant Accounting & Finance Manager
650K 3.5M 1.2M 1.4M 0.5 - 2 Months
Fixed and Vari-able
Accounting & Finance Special-ist / Senior Accounting & Fi-nance
500K 1M 700K 675K 0.5 - 2 Months Variable
Accounting & Finance Staff 250K 4M 500K 714K 0.5 - 2 Months
Fixed and Var-iable
Information & Technology
IT Director 1.6M 2.5M 2M 1.6M 0.5 - > 3 Months Variable
Senior IT Manager 800K 5.3M 1.6M 2.3M 0.5 - 1 Month Variable
IT Manager 600K 5M 1.5M 1.8M 0.5 - 1 Month
Fixed and Variable
IT Supervisor / Assistant IT Manager 500K 800K 675K 662K 1 Month Fixed and
Variable
IT Specialist / Senior IT 350K 1.6M 700K 785K 0.5 - > 3
Months Variable
IT Staff 200K 1M 400K 475K 0.5 - > 3 Months Variable
MIN (MMK)
MAX(MMK)
AVERAGE SALARY
MEDIAN2021
ANNUAL BONUS
IS BONUS FIXED OR VARIABLE
60
Human Resources
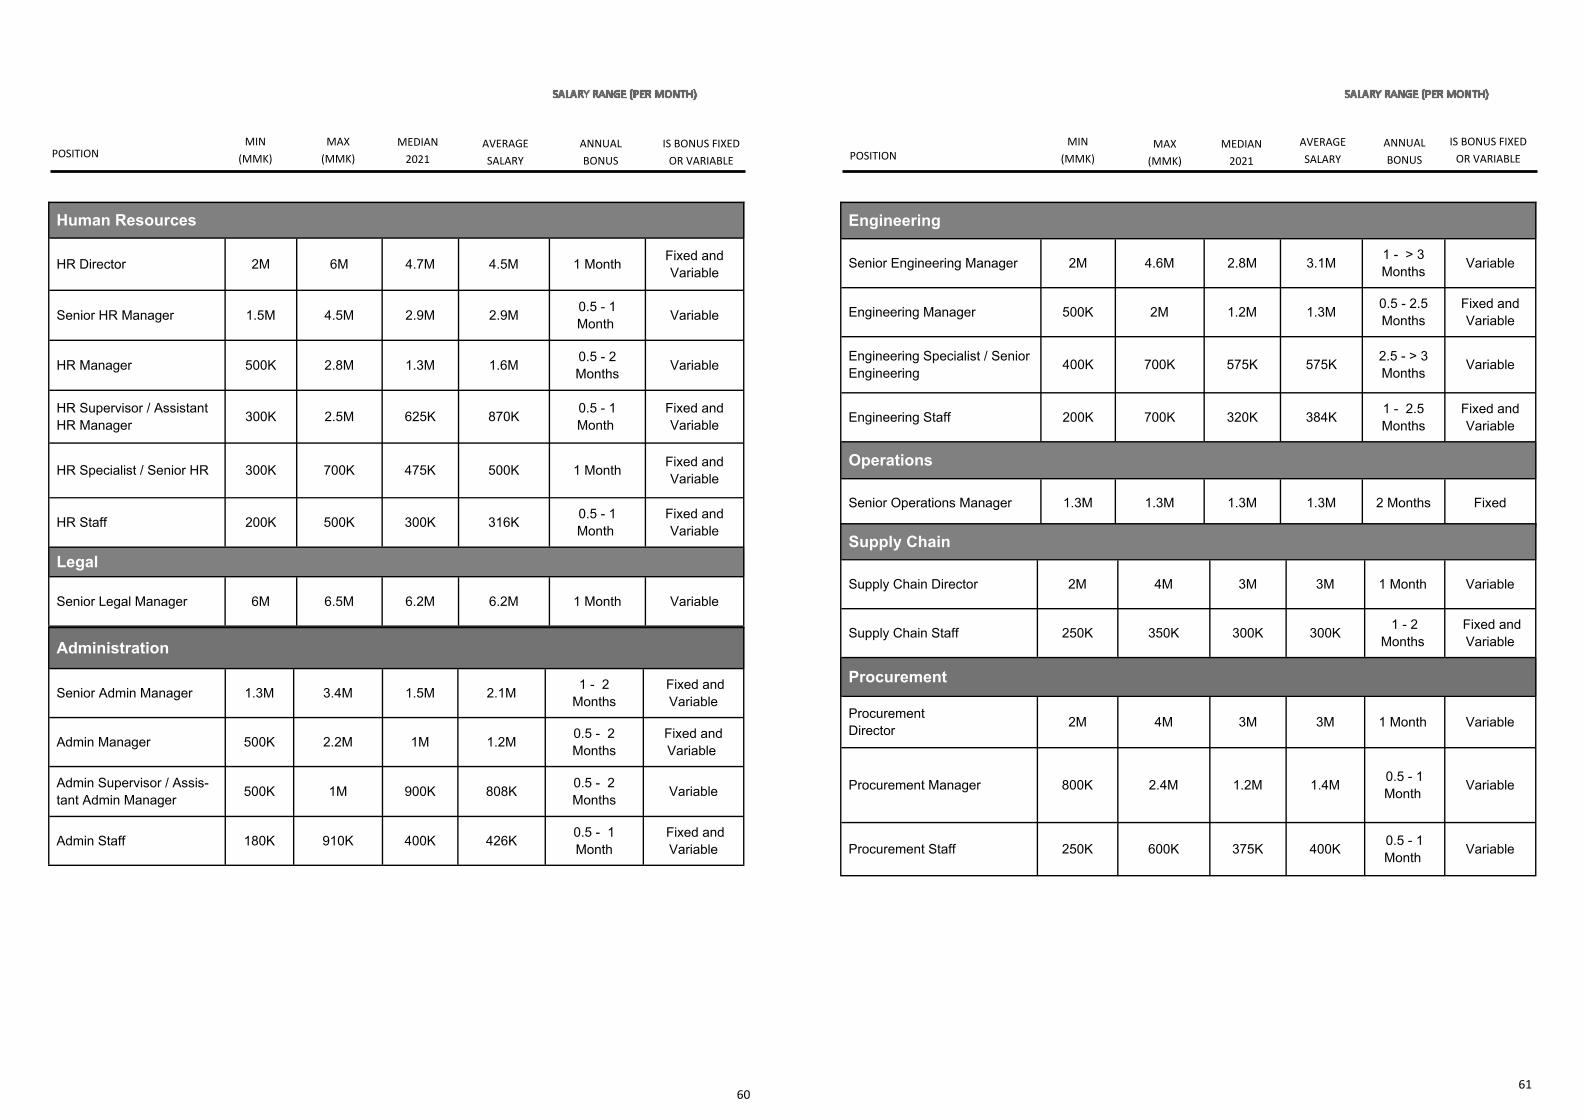
HR Director 2M 6M 4.7M 4.5M 1 Month Fixed and Variable
Senior HR Manager 1.5M 4.5M 2.9M 2.9M 0.5 - 1 Month Variable
HR Manager 500K 2.8M 1.3M 1.6M 0.5 - 2 Months Variable
HR Supervisor / Assistant HR Manager 300K 2.5M 625K 870K 0.5 - 1
Month Fixed and Variable
HR Specialist / Senior HR 300K 700K 475K 500K 1 Month Fixed and Variable
HR Staff 200K 500K 300K 316K 0.5 - 1 Month
Fixed and Variable
Legal
Senior Legal Manager 6M 6.5M 6.2M 6.2M 1 Month Variable
POSITION MIN
(MMK) MAX
(MMK) MEDIAN
2021 AVERAGE SALARY
ANNUAL BONUS
IS BONUS FIXED OR VARIABLE
Administration
Senior Admin Manager 1.3M 3.4M 1.5M 2.1M 1 - 2
Months Fixed and Variable
Admin Manager 500K 2.2M 1M 1.2M 0.5 - 2 Months
Fixed and Variable
Admin Supervisor / Assis-tant Admin Manager 500K 1M 900K 808K
0.5 - 2 Months
Variable
Admin Staff 180K 910K 400K 426K 0.5 - 1 Month
Fixed and Variable
61
Engineering
Senior Engineering Manager 2M 4.6M 2.8M 3.1M 1 - > 3 Months Variable
Engineering Manager 500K 2M 1.2M 1.3M 0.5 - 2.5 Months
Fixed and Variable
Engineering Specialist / Senior Engineering 400K 700K 575K 575K 2.5 - > 3
Months Variable
Engineering Staff 200K 700K 320K 384K 1 - 2.5 Months
Fixed and Variable
Operations
Senior Operations Manager 1.3M 1.3M 1.3M 1.3M 2 Months Fixed
MIN (MMK)
MAX(MMK)
MEDIAN2021
AVERAGE SALARY
ANNUAL BONUS
IS BONUS FIXED OR VARIABLE POSITION
Supply Chain
Supply Chain Director 2M 4M 3M 3M 1 Month Variable
Supply Chain Staff 250K 350K 300K 300K 1 - 2 Months
Fixed and Variable
Procurement
Procurement Director 2M 4M 3M 3M 1 Month Variable
Procurement Manager 800K 2.4M 1.2M 1.4M 0.5 - 1 Month Variable
Procurement Staff 250K 600K 375K 400K 0.5 - 1 Month Variable

62
Times City Office Tower n°2, 16th Floor, Units 1611 & 1612
Corner of Hanthawaddy Road & Kyun Taw Roads,
Kamayu Township, 11041 Yangon, Myanmar
+ 95 9 425 450 546
contact@ccifrance‐myanmar.org
www.ccifrance‐myanmar.org