Embed Size (px)
Citation preview
1
The relationship between parents’ perceived physical and
social neighbourhood environment and the outdoor play
duration of the child: results from the ChecKid study
Name: Marrit W. van der Burgh
Master Program: Master Health Sciences
Master Specialization: Prevention and Public Health
Organization: Research Centre for the Prevention of Overweight (OPOZ)
Address: VU-Windesheim, Campus 2-6, Building F1, 8017 CA Zwolle
Supervisor: Dr. Carry Renders
On-site supervisors Dr. Ingrid Bakker, Dr. Elske de Jong
2
Abstract
Background: Outdoor play (OP) is an important component of children’s daily physical activity (PA). Parents have
a decisive role in stimulating children’s OP. Parents’ perceptions regarding their child’s OP are influenced by the
parental perceived physical neighbourhood environment (PPPNE) and parental perceived social neighbourhood
environment (PPSNE). Therefore, the aim of this study was to investigate the relationship between the PPPNE
and PPSNE and the parents’ perceived OP duration of the child.
Method: Data of the ChecKid 2012 study was used. A total of 5676 parents of children aged between four and
thirteen, from 35 primary schools in Zwolle, participated in the current study. A multilevel design was used with
neighbourhood as random factor. Data was available from parental questionnaires and from children’s measured
height and weight. Models were used to investigate OP duration with socio-demographic variables (model 1),
PPPNE (model 2) and PPSNE (model 3) variables and the remaining relations when combined in one model
(model 4). The dependent variable was minutes of OP after school for children per week (OP duration). The
models were stratified by gender.
Results: The current study found that three reasons not to play outdoors were related with children’s OP
duration according to parents. First, absence of friends in the neighbourhood environment was the most
common reason for boys and girls not to play outdoors. Girls played 40 minutes less outdoors (95% C.I.= 20.3 to
59.6) and boys played 46 minutes less outdoors (95% C.I.= 25.3 to 67.2), compared to children from parents who
disagreed with absence of friends as a reason. Second, absence of adult supervision was also negatively related
with OP duration for both boys and girls. Third, this instead of presence of loitering youth which was positively
related with children’s OP duration. Children from parents who agreed with this played more minutes outdoors
compared to children from parents who disagreed. Furthermore, children whose parents were dissatisfied with
traffic safety, played more minutes outdoors compared to children whose parents were satisfied. For boys,
neighbourhood satisfaction was positively associated with OP duration. For girls, agreement with a sufficient
number of OP areas was negatively associated with OP duration.
Conclusion: The results of the current study emphasize the importance of traffic safety (PPPNE), the presence of
friends and adult supervision and the absence of loitering youth (PPSNE) for children’s OP duration.
Keywords: outdoor play, safety, neighbourhood, physical environment, social environment, parents’ perception.
Introduction
Overweight and obesity in children and adolescents are serious public health problems worldwide (1–3).
According to the World Health Organization (WHO), childhood overweight and obesity have reached epidemic
proportions in most industrialized countries over the past three decades (4). Also in the Netherlands, the
prevalence of overweight children and adolescents has increased. Compared to 1980, the prevalence of
childhood overweight in 2009 has increased two to three fold reaching approximately 14% and the prevalence
of obesity increased four to six fold, to 2% (3).
3
Overweight and especially obesity are associated with several severe physical consequences such as
diabetes mellitus type 2, reduced physical fitness, sleep apnea, cardiovascular risk factors and elevated blood
pressure (5–7). Besides, there are psychological consequences such as depression, mental stress and a negative
body image (5–7). Furthermore, bullying and stigmatization can result in decreased quality of life (8,9). Serious
consequences of overweight and obesity in children have been known to recur during later stages of life (10–
12). Important causes of overweight and obesity in children include a lack of physical activity (PA) and unhealthy
eating habits, including an unhealthy diet (5–7). Therefore, it is important to stimulate a healthy lifestyle already
in childhood.
To improve and encourage a healthy weight, it is important to be physically active (13). One of the PA
recommendations includes that children up to seventeen should engage in at least one hour of moderately
intense PA per day (14). However, 79% of the Dutch children from the age of four to seventeen do not meet the
recommended guidelines for PA (16). Children’s total PA level has been shown to be associated with outdoor
play (OP) (17–20). Playing outdoors is an important part of children’s daily activity (21). Moreover, an average of
22% of Dutch children between six and twelve years old play outdoors just once a week or not at all (16). Thereby,
OP has many benefits such as improving the social skills by learning how to pay attention to others (21–23) and
improving motor skills by accepting challenges (24).
Another important social factor that influences children’s OP are the parents. Parents have an important
and decisive role in stimulating children’s OP behaviour (25). Parents can directly influence children’s PA by
providing transport, supervision, and also engaging in PA with the child (26,27). But parents can also influence
their children’s PA behaviour indirectly by being the role model for their child (26,27). Children from active
parents are more physically active compared to children from non-active parents (28). Because of the important
direct and indirect parental role in stimulating the OP behaviour in children, parents’ perceptions regarding
children’s OP and the neighbourhood environment are very important to investigate (25). Thereby, different
studies show that the perceptions of parents are influenced by the physical and social environment (29–31).
Several studies found that there is a relation between the physical environment and outdoor PA in adults
and children (32–34). Because the environmental influences on the parents’ perceptions, it is important to
provide a clear definition of the environment. Definitions for the physical environment vary but are often clearly
defined. Physical environment entails most of the time: road safety, access to green spaces and recreational
facilities (29,35–37). According to Sallis et. al. (2000, 2006) when there is access to safe places for being physically
active, such as walkable neighborhoods, this stimulates people to be more active (29,30). Furthermore, focusing
on children’s PA, living close to a playground is positively correlated with PA in children (21).
Not only the physical environment affects children’s PA but also the social environment. Even though
there is no universally agreed definition of the social environment, many studies included variables according to
social contact, social safety and rules (37–41). According to the study of Veitch et. al. (2010) presence of friends
is related to OP duration in children (42). The study of Remmers et. al. (2014) showed that parental rules
influence children’s OP duration (37). Additionally, parents’ concerns about the safety can play a role in
restricting children from playing outdoors (43). Thereby, safety from crime is positive associated with children’s
4
PA and (33,36) Safety is broadly defined using stranger danger, crime or presence of loitering youth. Many studies
therefore use different definitions and includes different variables regarding social safety.
Up until know, not many studies have investigated the remaining associations of the parents’ perceived
physical (PPPNE) and social neighbourhood environment (PPSNE) with children’s OP duration after combining
PPPNE and PPSNE with the socio-demographic variables. Therefore, the current study aims to determine the
PPPNE and PPSNE in relation to the parents’ perceived OP duration of the child. By investigating this relationship
it may contribute to the existing literature and provide more knowledge about parents neighbourhood
perceptions and children’s OP duration.
Methods
Design
To examine the relationship between PPPNE and PPSNE and OP duration, results of the ChecKid study were used.
ChecKid is designed to monitor the overweight and (un)healthy behaviour on primary schools within children
aged 4-13 years old, living in Zwolle (40). With the results of ChecKid, existing programs can be improved and
new programs can be developed that contribute to a healthy lifestyle and a healthy environment in
neighbourhoods, schools and families (40). ChecKid was carried out in the months October and November 2006,
2009 and 2012 (40). In the current cross sectional study, data from the most recent wave has been used. The
ChecKid study was approved by the Medical Ethics Committee of the VU Medical Centre (40).
Population and data collection
In ChecKid 2012, all 49 primary schools (60 venues) in Zwolle were approached to participate by letter, including
schools for special education. All age groups (group 1-8) were included in ChecKid. The schools were contacted
by phone to ensure participation. Reasons for schools not to participate were mostly demanding school programs
and invasion of privacy. All parents (n=9846) of the participating primary schools (38 schools, 49 venues) were
approached by means of a letter to participate. The participating parents (n=6040) provided informed consent.
Data were collected by measuring children’s height and weight and by the parental questionnaire. According to
the protocol for the National Dutch Growth Study (19), trained students from the University of Applied Sciences
Windesheim measured body weight, height and waist circumference in 9675 children. For designing the ChecKid
questionnaire, several questions from validated health behaviour questionnaires were used which were suitable
for the ChecKid study population (44,45). The parental questionnaire included (among others) questions about
socio-demographic characteristics, PPPNE and PPSNE and children’s physical activity, such as time spent playing
outdoors. The questions about PPPNE and PPSNE were not validated. In the current study, schools for special
education (n=3) were excluded because the PA duration of these children compared to children from regular
education schools can be expected to be different (46,47). Finally, a total of 5676 participants were included in
the study because of complete questionnaires and complete height and weight data. The data of the parental
reported questionnaire was matched with children’s height and weight data by use of respondent numbers of
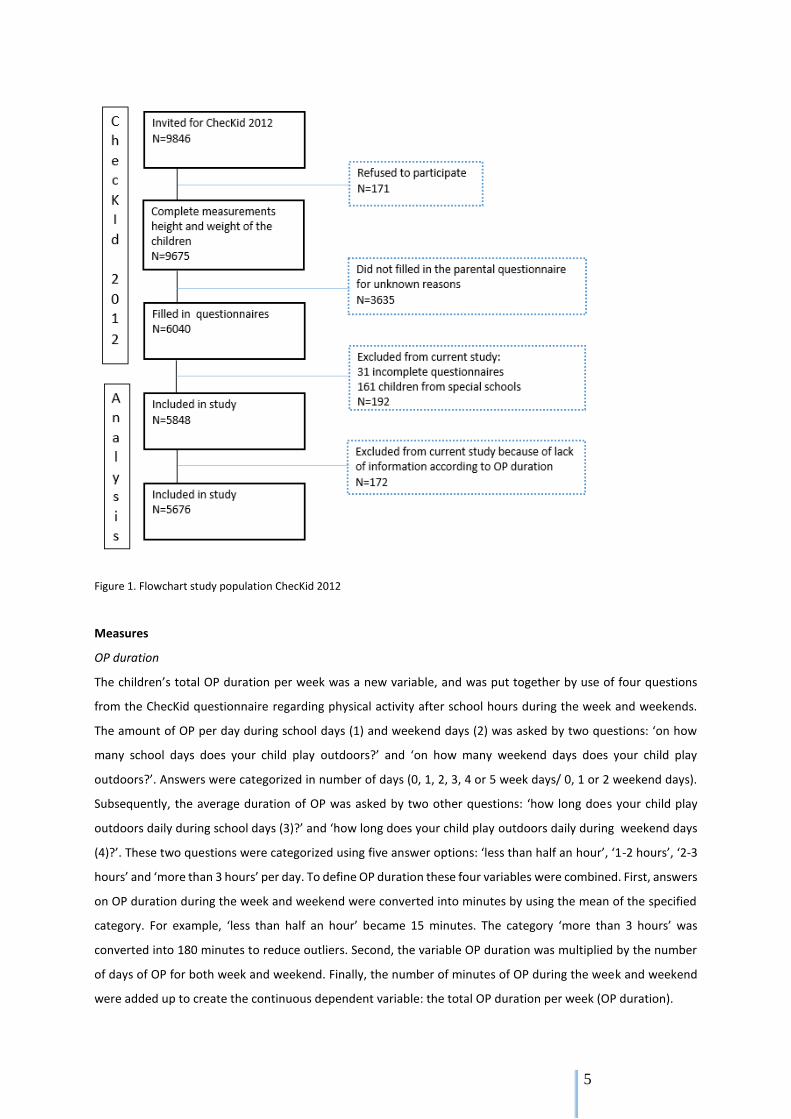
the children. Figure 1 shows the study population details, number of drop-outs and excluded participants.
5
Figure 1. Flowchart study population ChecKid 2012
Measures
OP duration
The children’s total OP duration per week was a new variable, and was put together by use of four questions
from the ChecKid questionnaire regarding physical activity after school hours during the week and weekends.
The amount of OP per day during school days (1) and weekend days (2) was asked by two questions: ‘on how
many school days does your child play outdoors?’ and ‘on how many weekend days does your child play
outdoors?’. Answers were categorized in number of days (0, 1, 2, 3, 4 or 5 week days/ 0, 1 or 2 weekend days).
Subsequently, the average duration of OP was asked by two other questions: ‘how long does your child play
outdoors daily during school days (3)?’ and ‘how long does your child play outdoors daily during weekend days
(4)?’. These two questions were categorized using five answer options: ‘less than half an hour’, ‘1-2 hours’, ‘2-3
hours’ and ‘more than 3 hours’ per day. To define OP duration these four variables were combined. First, answers
on OP duration during the week and weekend were converted into minutes by using the mean of the specified
category. For example, ‘less than half an hour’ became 15 minutes. The category ‘more than 3 hours’ was
converted into 180 minutes to reduce outliers. Second, the variable OP duration was multiplied by the number
of days of OP for both week and weekend. Finally, the number of minutes of OP during the week and weekend
were added up to create the continuous dependent variable: the total OP duration per week (OP duration).
6
Socio-demographics
Several variables were used to measure socio-demographics: age (1), ethnicity (2), child’s BMI (3), BMI of the
mother (4), BMI of the father (5), and SES (6). These socio-demographic variables represent model 1 in the
analysis. According to many studies, these socio-demographic characteristics can influence the children’s PA or
OP duration (34,37,39,42,43,48–50). Age was asked by date of birth and included as a continuous variable.
Ethnicity was asked by: ‘in which country are you, any other parent/carer and your child born?’. Ethnicity was
dichotomized as Dutch and non-Dutch (reference). Height and weight of the children was measured by the
students of Windesheim and used to calculate BMI. BMI of the mother and father were asked by: ‘what is your
current height and current weight, and what is the current height and the current weight of any other
parent/carer?’. Cut-off points for the body mass index (BMI) defined by Cole et al. (51,52) were used to define
thinness, healthy weight, overweight and obesity (reference). Parental education level was used to define
socioeconomic status (SES) and asked by: ‘what is the highest completed education of yourself and the other
parent/carer?’ (53). In model 1, just these six variables were included.
Parents’ perceived physical neighbourhood environment
In the current study, the parental perceived physical neighbourhood environment (PPPNE) included the traffic
safety, safety of the streets and OP areas. The PPPNE represent model 2 in the analysis. Information about PPPNE
was gathered by several questions. First, parental perceived importance of and satisfaction with traffic safety (1)
and green spaces (2) in the neighbourhood was assessed using three point Likert scales. The questions about
traffic safety and green spaces were asked by: ‘would you tick the themes below whether you think they are
important and if you are satisfied?’. Because it was assumed that the level of satisfaction is only important in
those who find it important, ‘importance of’ and ‘satisfaction with’ were combined (important/satisfied: 1,
important/neutral: 0, important/not satisfied: -1 as reference). Second, reasons for children not to play outdoors
(according to their parents) were dichotomous questions concerning presence of dog faeces (3), absence of OP
areas (4) and traffic safety (5). This was asked by: ‘can you indicate whether the following statements are true or
not true?’ followed by: ‘when my child does no play outdoors, this is because of’ (true: 1, not true: 0 as reference).
Third, the level of agreement on having a sufficient number of OP areas in the neighbourhood (6) was asked by:
‘can you indicate to what extent you agree with the statement: there are a sufficient number of playgrounds in
my neighbourhood where my child could go out to play?’. This was assessed by using a five point Likert scale
(‘totally agree’, ‘agree’, ‘neutral’, ‘disagree’, ‘totally disagree’ as reference). Finally, OP safety and neighbourhood
satisfaction were included. Because parental perceived OP safety and neighbourhood satisfaction are addressing
both the physical as well as the social aspects of the neighbourhood environment, these two variables were
included in model 2 as well as model 3. OP safety (7) was asked by: ‘how safe do you think it is in the
neighbourhood environment for your child to play outdoors?’ and was assessed by using a five point Likert scale
(ranging from 0: very safe, to 5: very unsafe as reference). Neighbourhood satisfaction (8) was asked by: ‘can you
give a score (1 = very dissatisfied, 10 = very satisfied), how satisfied you are with living in your neighbourhood
environment?’ and was assessed by using rates (ranging from 0: not satisfied, to 10: very satisfied as reference).
In model 2, these eight variables were included.
7
Parents’ perceived social neighbourhood environment
In the current study, the parents’ perception of the social neighbourhood environment (PPSNE) included
questions about social cohesion such as absence of friends, absence of adult supervision and presence of loitering
youth. But also neighbourhood satisfaction and OP safety were included. The PPSNE represent model 3 in the
analysis. Parents were asked about any social reasons for the child not to play outdoors: absence of friends (1),
absence of adult supervision (2) and presence of loitering youth (3) (‘true’, ‘not true’ as reference). This was the
same question as mentioned in the PPPNE method description: ‘can you indicate whether the following
statements are true or not true?’ followed by: ‘when my child does no play outdoors, this is because of’. Finally,
the variables: OP safety (4) and neighbourhood satisfaction (5) were included as described in the PPPNE method
section. Model 3 included these five variables.
Neighbourhood environment
This study has taken into account the possible differences in parents’ perceptions about the neighbourhood
environment they live in. Neighbourhoods were operationalized according to the 17 neighbourhoods of the city
of Zwolle (54). This was based on the parental reported postal code. Because the environmental variables (PPPNE
and PPSNE) were measured at neighbourhood level, no information about the schools was needed for the
current study.
Analysis
Characteristics of the population were analysed and checked for normality using descriptive statistics including
means and standard deviations. All analyses were conducted separately for boys and girls as there are gender
differences in PA (55,56). Thereby, linearity of OP and the PPPNE and PPSNE variables were explored using
scatterplots. Mixed models linear regression analysis was used to investigate univariate associations of OP
duration using neighbourhood as random factor. The correlation matrix of the independent variables was used
to check for multicollinearity and did not show any correlates above 0.8/0.9. Thereby, VIF and tolerance statistics
were acceptable and far below limit (VIF <3 and tolerance >0,20) (57). Therefore, centering of the independent
variables was not necessary. Participants with missing values of OP duration were not included. The missing
values were not exceeding ten percent of the participants.
The eleven variables about the perceived environment were regarded as the independent variables. Per
category of variables three models were created, namely socio-demographics (model 1), physical environment
(PPPNE model 2) and social environment (PPSNE model 3). In model 4, all variables were included at once to
investigate the remained associated variables. The relationship between socio-demographics, PPPNE and PPSNE,
and the OP duration of the child were investigated using multilevel linear regression analyses (level 1: individual;
level 2:neighbourhood) with a random intercept for neighbourhood to allow differences in parents’ perceptions
about their neighbourhood. Maximum Likelihood estimation procedure was used when comparing models in
SPSS (version 20) (58). Table 2 shows the regression estimates (b), standard errors (SE) and 95% confidence
intervals (95% CI). Statistical analysis were performed using SPSS software (version 20) (58).
8
Results
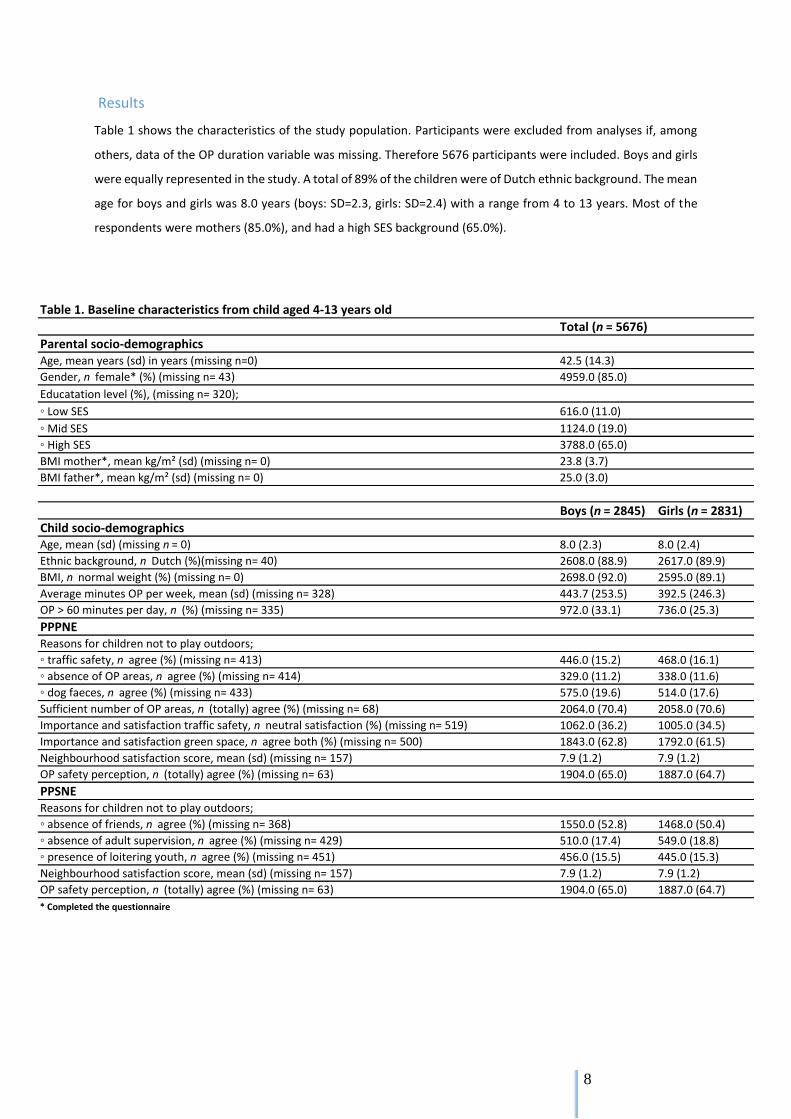
Table 1 shows the characteristics of the study population. Participants were excluded from analyses if, among
others, data of the OP duration variable was missing. Therefore 5676 participants were included. Boys and girls
were equally represented in the study. A total of 89% of the children were of Dutch ethnic background. The mean
age for boys and girls was 8.0 years (boys: SD=2.3, girls: SD=2.4) with a range from 4 to 13 years. Most of the
respondents were mothers (85.0%), and had a high SES background (65.0%).
Table 1. Baseline characteristics from child aged 4-13 years old
Total (n = 5676)
Parental socio-demographicsAge, mean years (sd) in years (missing n=0) 42.5 (14.3)
Gender, n female* (%) (missing n= 43) 4959.0 (85.0)
Educatation level (%), (missing n= 320);
◦ Low SES 616.0 (11.0)
◦ Mid SES 1124.0 (19.0)
◦ High SES 3788.0 (65.0)
BMI mother*, mean kg/m² (sd) (missing n= 0) 23.8 (3.7)
BMI father*, mean kg/m² (sd) (missing n= 0) 25.0 (3.0)
Boys (n = 2845) Girls (n = 2831)
Child socio-demographics Age, mean (sd) (missing n = 0) 8.0 (2.3) 8.0 (2.4)
Ethnic background, n Dutch (%)(missing n= 40) 2608.0 (88.9) 2617.0 (89.9)
BMI, n normal weight (%) (missing n= 0) 2698.0 (92.0) 2595.0 (89.1)
Average minutes OP per week, mean (sd) (missing n= 328) 443.7 (253.5) 392.5 (246.3)
OP > 60 minutes per day, n (%) (missing n= 335) 972.0 (33.1) 736.0 (25.3)
PPPNEReasons for children not to play outdoors;
◦ traffic safety, n agree (%) (missing n= 413) 446.0 (15.2) 468.0 (16.1)
◦ absence of OP areas, n agree (%) (missing n= 414) 329.0 (11.2) 338.0 (11.6)
◦ dog faeces, n agree (%) (missing n= 433) 575.0 (19.6) 514.0 (17.6)
Sufficient number of OP areas, n (totally) agree (%) (missing n= 68) 2064.0 (70.4) 2058.0 (70.6)
Importance and satisfaction traffic safety, n neutral satisfaction (%) (missing n= 519) 1062.0 (36.2) 1005.0 (34.5)
Importance and satisfaction green space, n agree both (%) (missing n= 500) 1843.0 (62.8) 1792.0 (61.5)
Neighbourhood satisfaction score, mean (sd) (missing n= 157) 7.9 (1.2) 7.9 (1.2)
OP safety perception, n (totally) agree (%) (missing n= 63) 1904.0 (65.0) 1887.0 (64.7)
PPSNEReasons for children not to play outdoors;
◦ absence of friends, n agree (%) (missing n= 368) 1550.0 (52.8) 1468.0 (50.4)
◦ absence of adult supervision, n agree (%) (missing n= 429) 510.0 (17.4) 549.0 (18.8)
◦ presence of loitering youth, n agree (%) (missing n= 451) 456.0 (15.5) 445.0 (15.3)
Neighbourhood satisfaction score, mean (sd) (missing n= 157) 7.9 (1.2) 7.9 (1.2)
OP safety perception, n (totally) agree (%) (missing n= 63) 1904.0 (65.0) 1887.0 (64.7)
* Completed the questionnaire
9
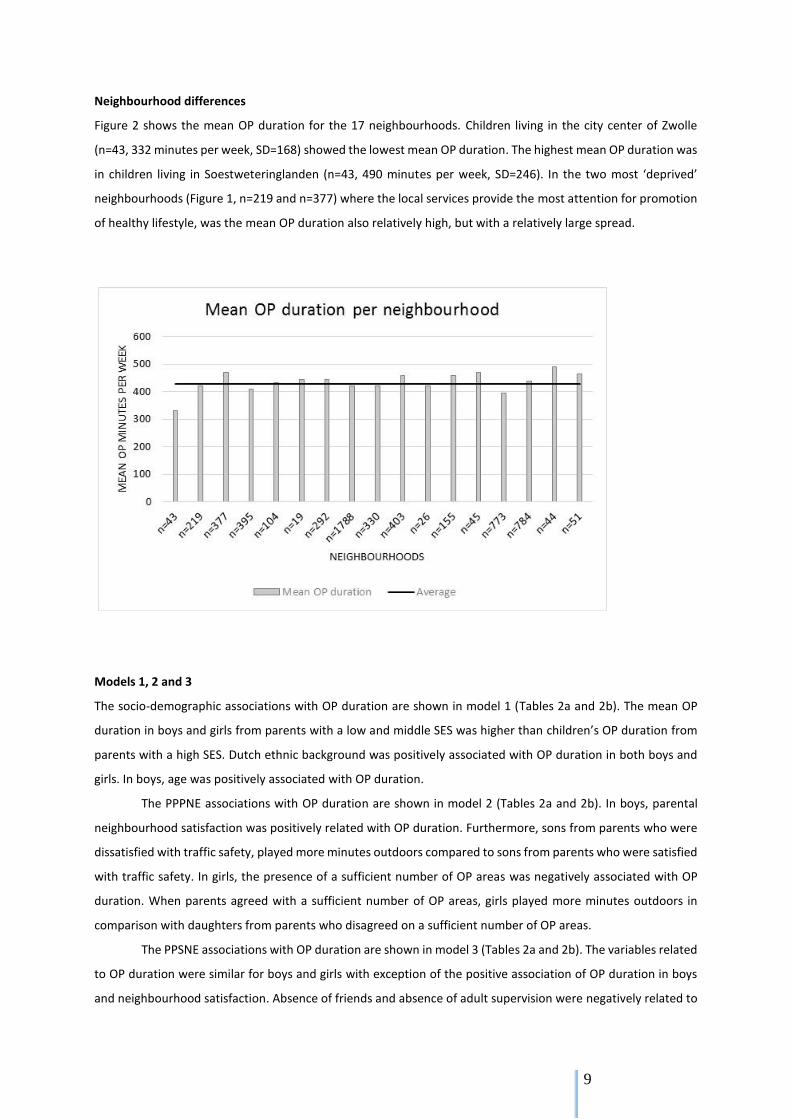
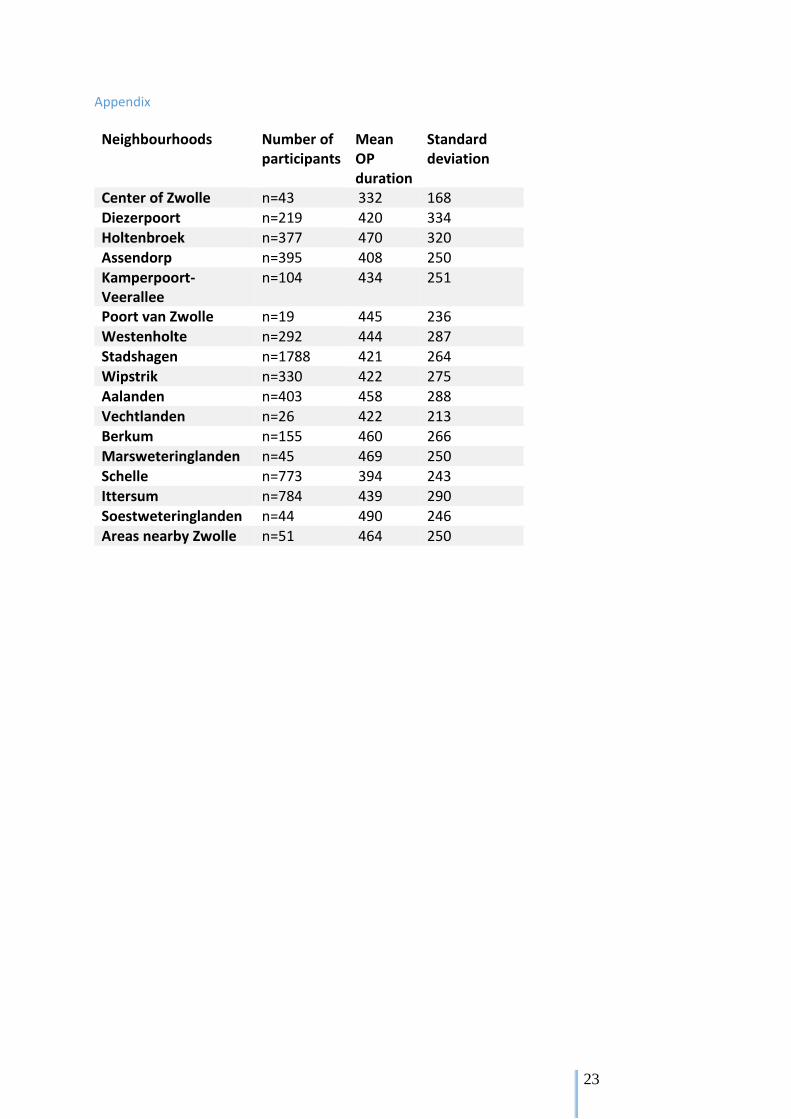
Neighbourhood differences
Figure 2 shows the mean OP duration for the 17 neighbourhoods. Children living in the city center of Zwolle
(n=43, 332 minutes per week, SD=168) showed the lowest mean OP duration. The highest mean OP duration was
in children living in Soestweteringlanden (n=43, 490 minutes per week, SD=246). In the two most ‘deprived’
neighbourhoods (Figure 1, n=219 and n=377) where the local services provide the most attention for promotion
of healthy lifestyle, was the mean OP duration also relatively high, but with a relatively large spread.
Models 1, 2 and 3
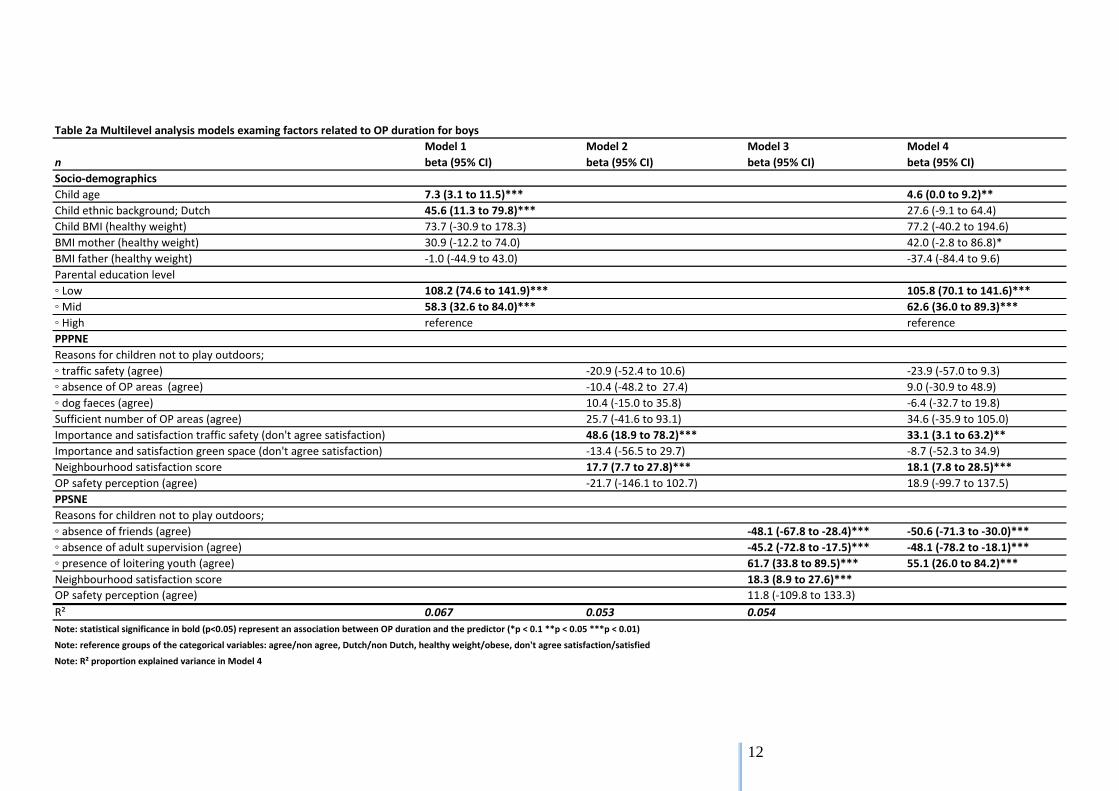
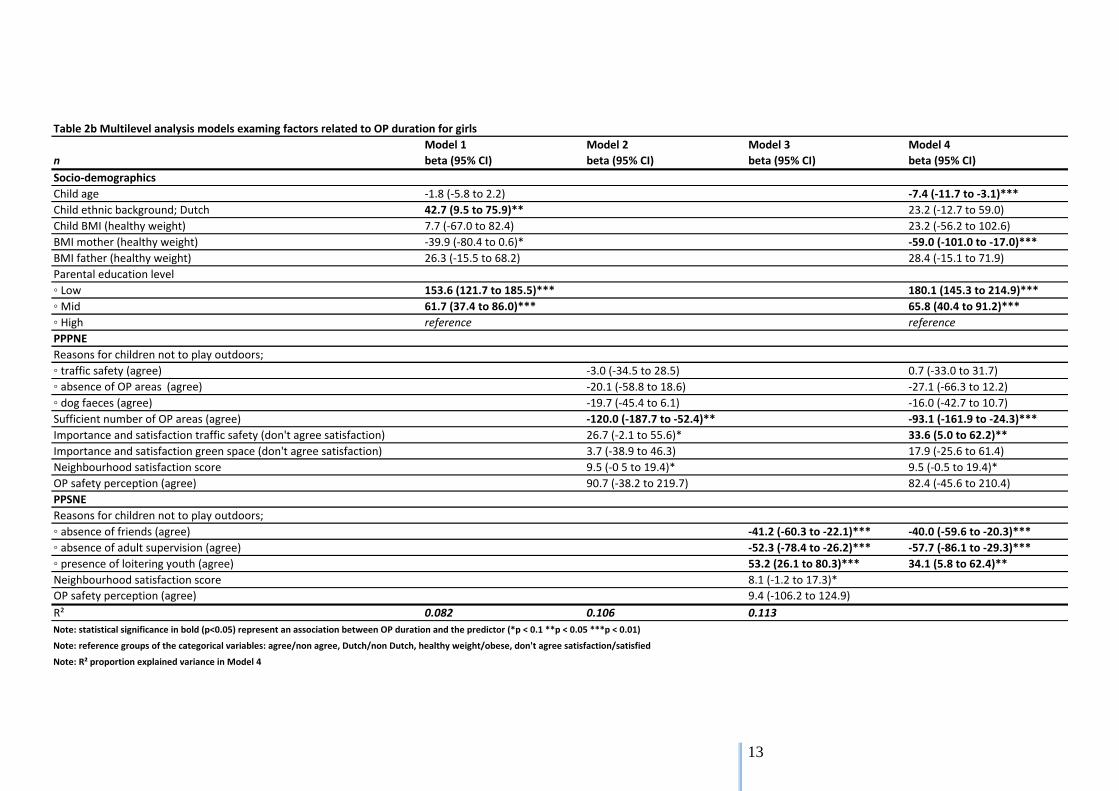
The socio-demographic associations with OP duration are shown in model 1 (Tables 2a and 2b). The mean OP
duration in boys and girls from parents with a low and middle SES was higher than children’s OP duration from
parents with a high SES. Dutch ethnic background was positively associated with OP duration in both boys and
girls. In boys, age was positively associated with OP duration.
The PPPNE associations with OP duration are shown in model 2 (Tables 2a and 2b). In boys, parental
neighbourhood satisfaction was positively related with OP duration. Furthermore, sons from parents who were
dissatisfied with traffic safety, played more minutes outdoors compared to sons from parents who were satisfied
with traffic safety. In girls, the presence of a sufficient number of OP areas was negatively associated with OP
duration. When parents agreed with a sufficient number of OP areas, girls played more minutes outdoors in
comparison with daughters from parents who disagreed on a sufficient number of OP areas.
The PPSNE associations with OP duration are shown in model 3 (Tables 2a and 2b). The variables related
to OP duration were similar for boys and girls with exception of the positive association of OP duration in boys
and neighbourhood satisfaction. Absence of friends and absence of adult supervision were negatively related to
10
OP duration. In short, children whose parents agreed with the absence of friends as a reason for their child not
to play outdoors, played 41.2 (girls) or 48.1 (boys) minutes less outdoors than children whose parents disagreed
on this. On the contrary, presence of loitering youth was positively related to children’s OP duration. Specifically,
children whose parents agreed with presence of loitering youth as reason for children not to play outdoors,
played 61.7 minutes more outdoors for boys and 53.2 minutes for girls, compared to children whose parents
disagreed.
Model with all variables
Model 4 shows the statistically significant remained associations with OP duration (Tables 2a and 2b). For both
boys and girls, SES, absence of friends, absence of adult supervision and presence of loitering youth all remained
related to OP duration. Children’s mean OP duration in low SES was higher for girls (β= 180.1, 95% C.I= 145.3 to
214.9) than for boys (β=105.8, 95% C.I.= 70.1 to 141.6). Children from parents who were dissatisfied with traffic
safety (and perceive it as important) played more minutes outdoors compared to children from parents who
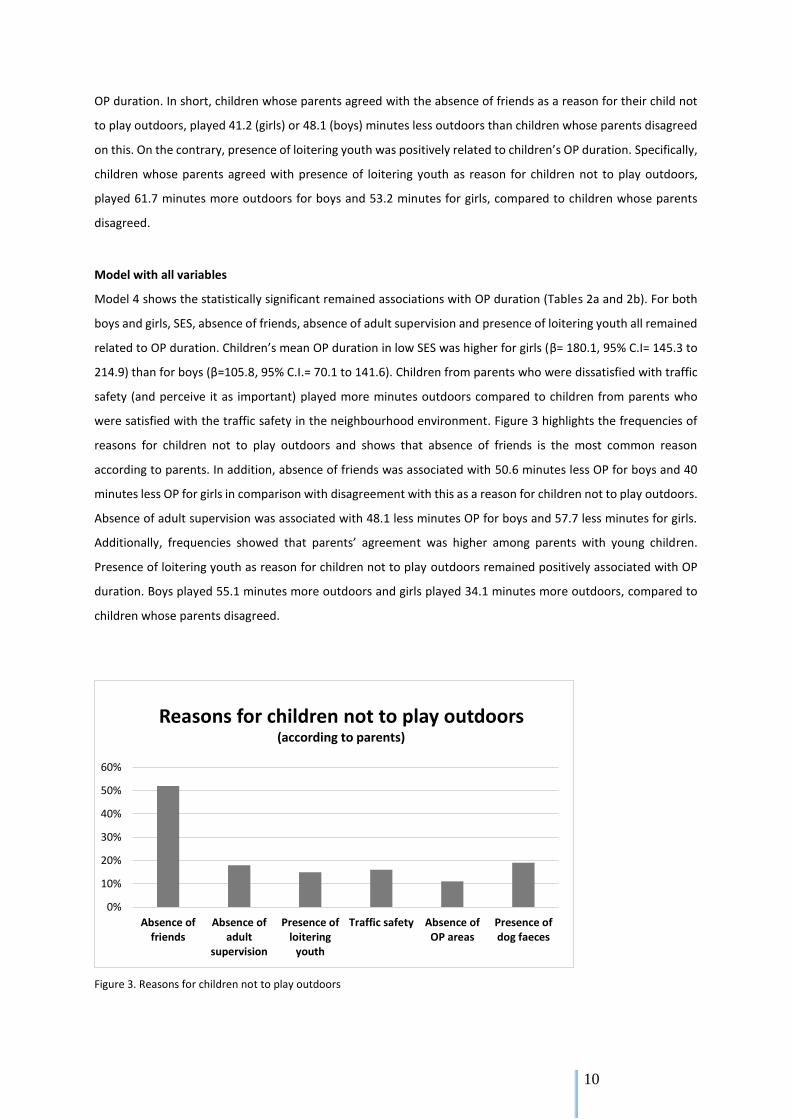
were satisfied with the traffic safety in the neighbourhood environment. Figure 3 highlights the frequencies of
reasons for children not to play outdoors and shows that absence of friends is the most common reason
according to parents. In addition, absence of friends was associated with 50.6 minutes less OP for boys and 40
minutes less OP for girls in comparison with disagreement with this as a reason for children not to play outdoors.
Absence of adult supervision was associated with 48.1 less minutes OP for boys and 57.7 less minutes for girls.
Additionally, frequencies showed that parents’ agreement was higher among parents with young children.
Presence of loitering youth as reason for children not to play outdoors remained positively associated with OP
duration. Boys played 55.1 minutes more outdoors and girls played 34.1 minutes more outdoors, compared to
children whose parents disagreed.
Figure 3. Reasons for children not to play outdoors
0%
10%
20%
30%
40%
50%
60%
Absence offriends
Absence ofadult
supervision
Presence ofloitering
youth
Traffic safety Absence ofOP areas
Presence ofdog faeces
Reasons for children not to play outdoors(according to parents)
11
There were also differences in gender. The age of boys remained positively related to OP duration. More
specifically, a one-year increment in age at baseline was associated with 4.6 minutes more OP. In girls, age was
negatively associated with OP duration in model 4, even though age was not related in model 1. Thereby, for
girls, a healthy BMI of the mother was negatively related to OP duration. Model 4 shows that daughters from
mothers with a healthy weight played 59 minutes less outdoors (95% C.I.=-101 to -17) compared to daughters
from mothers with obesity. A healthy BMI of the boys’ mother was positively associated with OP duration,
however, it was not a statistically significant association. Furthermore, the presence of a sufficient number of OP
areas remained negatively associated with OP duration for girls in model 4. Specifically, agreement with a
sufficient number of OP areas was associated with 93 minutes (95% C.I.=-161.9 to -24.3) less OP compared to
totally disagreement. This instead of 120 minutes (95% C.I.=-187.7 to -52.4) less OP in model 2. Thereby, parents’
neighbourhood satisfaction was statistically significant for boys in all models instead of girls, which showed a p-
value lower than 0.1.
Finally, the proportion explained variance (R²) of the PPPNE and PPSNE models in the combined model
4 was also investigated (Tables 2a and 2b). Moreover, PPSNE model 3 explained 11.3% of the variance in model
4 for girls and 5.4% for boys. The PPSNE model for both boys and girls showed slightly higher percentages in
comparison with PPPNE model 2. Furthermore, the models for girls explained the variance almost twice as much
compared to boys models. The boys socio-demographic model 1 showed the highest proportion explained
variance in boys models. For girls, PPSNE model 3 showed the highest proportion explained variance.
12
Table 2a Multilevel analysis models examing factors related to OP duration for boys
Model 1 Model 2 Model 3 Model 4
n beta (95% CI) beta (95% CI) beta (95% CI) beta (95% CI)
Socio-demographics
Child age 7.3 (3.1 to 11.5)*** 4.6 (0.0 to 9.2)**
Child ethnic background; Dutch 45.6 (11.3 to 79.8)*** 27.6 (-9.1 to 64.4)
Child BMI (healthy weight) 73.7 (-30.9 to 178.3) 77.2 (-40.2 to 194.6)
BMI mother (healthy weight) 30.9 (-12.2 to 74.0) 42.0 (-2.8 to 86.8)*
BMI father (healthy weight) -1.0 (-44.9 to 43.0) -37.4 (-84.4 to 9.6)
Parental education level
◦ Low 108.2 (74.6 to 141.9)*** 105.8 (70.1 to 141.6)***
◦ Mid 58.3 (32.6 to 84.0)*** 62.6 (36.0 to 89.3)***
◦ High reference reference
PPPNE
Reasons for children not to play outdoors;
◦ traffic safety (agree) -20.9 (-52.4 to 10.6) -23.9 (-57.0 to 9.3)
◦ absence of OP areas (agree) -10.4 (-48.2 to 27.4) 9.0 (-30.9 to 48.9)
◦ dog faeces (agree) 10.4 (-15.0 to 35.8) -6.4 (-32.7 to 19.8)
Sufficient number of OP areas (agree) 25.7 (-41.6 to 93.1) 34.6 (-35.9 to 105.0)
Importance and satisfaction traffic safety (don't agree satisfaction) 48.6 (18.9 to 78.2)*** 33.1 (3.1 to 63.2)**
Importance and satisfaction green space (don't agree satisfaction) -13.4 (-56.5 to 29.7) -8.7 (-52.3 to 34.9)
Neighbourhood satisfaction score 17.7 (7.7 to 27.8)*** 18.1 (7.8 to 28.5)***
OP safety perception (agree) -21.7 (-146.1 to 102.7) 18.9 (-99.7 to 137.5)
PPSNE
Reasons for children not to play outdoors;
◦ absence of friends (agree) -48.1 (-67.8 to -28.4)*** -50.6 (-71.3 to -30.0)***
◦ absence of adult supervision (agree) -45.2 (-72.8 to -17.5)*** -48.1 (-78.2 to -18.1)***
◦ presence of loitering youth (agree) 61.7 (33.8 to 89.5)*** 55.1 (26.0 to 84.2)***
Neighbourhood satisfaction score 18.3 (8.9 to 27.6)***
OP safety perception (agree) 11.8 (-109.8 to 133.3)
R² 0.067 0.053 0.054
Note: statistical significance in bold (p<0.05) represent an association between OP duration and the predictor (*p < 0.1 **p < 0.05 ***p < 0.01)
Note: reference groups of the categorical variables: agree/non agree, Dutch/non Dutch, healthy weight/obese, don't agree satisfaction/satisfied
Note: R² proportion explained variance in Model 4
13
Table 2b Multilevel analysis models examing factors related to OP duration for girls
Model 1 Model 2 Model 3 Model 4
n beta (95% CI) beta (95% CI) beta (95% CI) beta (95% CI)
Socio-demographics
Child age -1.8 (-5.8 to 2.2) -7.4 (-11.7 to -3.1)***
Child ethnic background; Dutch 42.7 (9.5 to 75.9)** 23.2 (-12.7 to 59.0)
Child BMI (healthy weight) 7.7 (-67.0 to 82.4) 23.2 (-56.2 to 102.6)
BMI mother (healthy weight) -39.9 (-80.4 to 0.6)* -59.0 (-101.0 to -17.0)***
BMI father (healthy weight) 26.3 (-15.5 to 68.2) 28.4 (-15.1 to 71.9)
Parental education level
◦ Low 153.6 (121.7 to 185.5)*** 180.1 (145.3 to 214.9)***
◦ Mid 61.7 (37.4 to 86.0)*** 65.8 (40.4 to 91.2)***
◦ High reference reference
PPPNE
Reasons for children not to play outdoors;
◦ traffic safety (agree) -3.0 (-34.5 to 28.5) 0.7 (-33.0 to 31.7)
◦ absence of OP areas (agree) -20.1 (-58.8 to 18.6) -27.1 (-66.3 to 12.2)
◦ dog faeces (agree) -19.7 (-45.4 to 6.1) -16.0 (-42.7 to 10.7)
Sufficient number of OP areas (agree) -120.0 (-187.7 to -52.4)** -93.1 (-161.9 to -24.3)***
Importance and satisfaction traffic safety (don't agree satisfaction) 26.7 (-2.1 to 55.6)* 33.6 (5.0 to 62.2)**
Importance and satisfaction green space (don't agree satisfaction) 3.7 (-38.9 to 46.3) 17.9 (-25.6 to 61.4)
Neighbourhood satisfaction score 9.5 (-0 5 to 19.4)* 9.5 (-0.5 to 19.4)*
OP safety perception (agree) 90.7 (-38.2 to 219.7) 82.4 (-45.6 to 210.4)
PPSNE
Reasons for children not to play outdoors;
◦ absence of friends (agree) -41.2 (-60.3 to -22.1)*** -40.0 (-59.6 to -20.3)***
◦ absence of adult supervision (agree) -52.3 (-78.4 to -26.2)*** -57.7 (-86.1 to -29.3)***
◦ presence of loitering youth (agree) 53.2 (26.1 to 80.3)*** 34.1 (5.8 to 62.4)**
Neighbourhood satisfaction score 8.1 (-1.2 to 17.3)*
OP safety perception (agree) 9.4 (-106.2 to 124.9)
R² 0.082 0.106 0.113
Note: statistical significance in bold (p<0.05) represent an association between OP duration and the predictor (*p < 0.1 **p < 0.05 ***p < 0.01)
Note: reference groups of the categorical variables: agree/non agree, Dutch/non Dutch, healthy weight/obese, don't agree satisfaction/satisfied
Note: R² proportion explained variance in Model 4
14
Discussion
The aim of this study was to determine the relationship between PPPNE and PPSNE and parents’ perceived OP
duration of the child. The current study found that, regarding PPPNE, dissatisfaction with traffic safety was
related with more minutes OP in both boys and girls. Girls from parents who agreed with a sufficient number of
OP areas in the neighbourhood played less minutes outdoors compared to girls from parents who disagreed.
Boys from parents who were satisfied with the neighbourhood played more minutes outdoors compared to boys
from parents who were dissatisfied. Regarding PPSNE, were three reasons for children not to play outdoors
related with children’s OP duration. Absence of adult supervision and absence of friends were related with less
minutes OP in both boys and girls. However, presence of loitering youth was related with more minutes OP in
both boys and girls. The socio-demographic variable SES showed that children from low SES families play
outdoors more minutes compared to children from high SES families. In girls there was a relation between
mothers’ BMI and girls’ OP duration. Daughters from mothers with a healthy BMI played less minutes outdoors
compared to daughters from mothers with obesity.
Concerning traffic safety were two questions included in the current study. Dissatisfaction with traffic safety was
positive related with children’s OP duration. More specifically, children from parents who were dissatisfied with
traffic safety, played more minutes outdoors than children from parents who were satisfied with traffic safety.
This finding is in line with results of other studies showing that the parents are more aware of an unsafe traffic
situation when children are outdoors often (59,60). However, the other question was about traffic safety as
reason not to play outdoors, and was not associated with OP duration. A possible explanation is that parents do
not consciously link the traffic situation at OP, because they use OP rules such as that children are only allowed
to play nearby the home or only at safe places instead of close to an unsafe traffic situation (43).
Concerning PPSNE, the current study showed that reasons for children not to play outdoors, namely
absence of friends, absence of adult supervision and presence of loitering youth, were related with children’s OP
duration. Different studies from Veitch et. al. (2006, 2010) showed that the absence of friends was related to
less minutes OP (42,43). The participants from the qualitative study of Veitch were parents from primary school
children aged 4 to 13 years old same as in the current study. The qualitative study shows that 40% of the parents
perceive absence of friends as important influence on children’s OP duration (43). In the current study, 52% of
the parents reported absence of friends as reason for their child not to play outdoors. This shows that absence
of friends is an important factor for children’s OP according to parents. In accordance with the qualitative study
from Veitch (3), the current study showed that absence of supervision was negatively associated with children’s
OP duration. Regarding the finding that presence of loitering youth was related to more minutes OP was
inconsistent with findings in other studies that loitering youth was related to less minutes OP in children
(43,61,62). However, Veitch et. al. (2006) showed that presence of loitering youth was a reason for parents to
let the children play outdoors elsewhere (43). Despite the lack of additional information, this could explain the
results of the current study.
In addition to the environmental variables, the current study showed that the socio-demographic SES
was associated with children’s OP duration. Meaning, on average low SES children played more minutes outdoors
15
than high SES children. However, many studies across different countries showed that low SES children are less
PA in comparison with high SES children (48,63,64). Nevertheless, these studies did not take the characteristics
of the physical environment into account. In the current study, the low SES neighbourhoods did not showed low
means of OP duration. A possible explanation could be the improvements in the deprived neighbourhoods
concerning safety, social cohesion and play equipment (65–69).
Differences in gender
The current study showed differences between boys and girls in associations with OP duration. First, regarding
PPPNE, neighbourhood satisfaction was positively related to OP duration for boys. The study of Björk et. al. (2008)
showed that the amount of green and possibilities to be physically active in the environment, is associated with
a positive rating of the neighbourhood and PA duration in adults (35). Other studies showed that when parents
are satisfied with the neighbourhood environment, they could indirectly or directly influence the child’s OP
duration (26,27,70). Despite no information is available from the current study about parents direct or indirect
influence, it seems a reasonable explanation that when parents are satisfied with the neighbourhood they
encourage their children to play outdoors. A possible explanation why this was not an association for girls is that
being satisfied with the neighbourhood may be irrelevant for OP duration in girls. This because girls play most
often at playgrounds or close to the home instead of boys who use the natural environment in a larger surface
(39,56).
Second, regarding PPPNE, daughters from parents who agreed with a sufficient number of OP areas in
the neighbourhood played less minutes outdoors, compared to daughters from parents who disagreed with a
sufficient number of OP areas. Concerning this result, the number of OP areas does not seem as an important
stimulus of children’s OP duration. Additionally, just like other studies (26,33,43,62), the current study showed
other important aspects such as safety in the neighbourhood, associated with children’s OP duration. Thereby,
OP area is a broad topic that could include many different aspects such as green fields or playgrounds. Girls play
most of the time at playgrounds, school courts and in the backyard while boys need more space to be PA and a
natural environment to play in (39,56). Therefore no further conclusions can be made on why a sufficient number
of OP areas was only associated for girls.
Third, regarding the socio-demographics, a healthy BMI of the mother was negatively associated with
OP duration in girls. More specifically, daughters from mothers with a healthy weight played less minutes
outdoors compared to daughters from mothers with obesity. A positive association was expected because
parents serve as role models, and active parents more likely to have active children (28). Nevertheless,
questioning the amount of PA triggers social desirable responding and thereby overestimation of self-reported
PA (71,72). The result of the current study could therefore be explained as social desirable responding from
mothers with a high BMI score. A possible explanation why healthy BMI of the mother was not an association for
boys in the current study is gender typing (26). Conversely, boys are expected and already more encouraged to
be more PA instead of girls (26,70). Therefore it is possible that mothers’ BMI is not statistically significant related
to boys’ OP duration.
16
Strengths and weaknesses
The current study has several important strengths. The first strength of this study that need to be mentioned is
the large sample size. Second, the majority of primary schools in Zwolle participated. Third, the participating
schools were equally spread across the different neighbourhoods of the city Zwolle. These three strengths
amplified the representativeness of the study population. The fourth strength is the broad scope of the topics
examined, namely socio-demographic, physical environment and social environment characteristics. Not many
studies have investigated this combination of characteristics and investigated the remained associations when
these three subjects were combined. Because both PPPNE and PPSNE were investigated, there was adjusted for
several environmental factors and more information about associations with children’s OP duration could be
provided. Fifth, trained students collected data within a three week time period which could have reduced
seasonal bias. Thereby, parents were clearly questioned to report the child’s PA of the last month which also
reduced the change of seasonal bias.
There were a few limitations that need to be acknowledged. First, generalizability of the results from
the current study to the Dutch population is limited because of the underrepresented low SES group and only a
few non-Dutch participants within the study. However, regarding SES and ethnicity, the current study’s
population is a representation of the population of Zwolle (73,74). Second, it should also be mentioned that most
of the participants were mothers. There are differences between fathers’ and mothers’ influence, method of
support, and beliefs on children’s OP duration (33,75,76). Therefore, if more fathers would have filled in the
questionnaires, the results could have been different compared to the reported results by the mothers.
Nevertheless, it is common within lifestyle related studies that most of the participants are mothers (37,42,43).
Third, no objective measurements were used in the current study. Objective measurements can provide different
and additional objective information about children’s OP duration compared to the subjective parental reported
questionnaires. When objective measurements were used, the validity of the OP duration results could have
been higher because social desirable answering on children’s OP duration questions can be excluded.
Additionally, because of overestimation of self-reported PA due to social desirability, the children’s OP duration
could have been lower than in the current study (71,72). Fourth, despite the ChecKid questionnaire itself was
not validated, several questions from validated questionnaires were included in the ChecKid questionnaire.
However, the questions about parents’ perceptions of the environment were not validated. This could have led
to social desirable answers and difficulties in interpreting the questions in one and the same way (71,72). Finally,
no conclusions can be made on causality because a cross sectional study was used. However, despite no
influences on OP duration can be stated, using cross sectional data is an efficient design to determine
associations with children’s OP duration (77).
17
Recommendations
The current study only used a parental reported questionnaire to measure PA in children. No objective data was
available. Using an objective measurement tool, such as an accelerometer with included global positioning
system (GPS), can provide more details about children’s PA pattern, intensity and movement within the
neighbourhood (37,78,79). The use of accelerometers with included GPS can be expensive especially when a
large amount of participants are included in the study. On the contrary, parental reported questionnaires are
less expensive and provide more describing information. Therefore, when choosing the most appropriate and
useful measurement tool for future research, the pros and cons of these different types of measurement tools
must be taken into account. Furthermore, to reduce bias in the interpretation of questions and obtain additional
relevant information, it is recommended to improve and extent the ChecKid questionnaire. An option for
improving and extending ChecKid is to combine it with interviews with a small group of parents, representative
for the study population. This type of qualitative research can provide additional and broadening information
(80). Finally, because the current study was a cross-sectional design, no causal relationships could be
investigated. Therefore, causal relationships and the effects of changes in the neighbourhood environment over
time could be investigated by using a longitudinal research approach. The ChecKid studies 2006, 2009 and 2012,
could be used to investigate the influences on OP in children. The influence of the improvements in the deprived
neighbourhoods of Zwolle on the children’s OP duration could be investigated. Furthermore, the influence of
parents’ perceived safety within the neighbourhoods on the children’s OP duration could be investigated. This
could provide more information about the influence of safety and improvements within the different
neighbourhoods in Zwolle, on children’s OP.
Conclusion
Although we need to be careful interpreting the results, safety in many aspects plays an important role in
children’s OP duration according to parents. Important determinants of OP duration are: traffic safety (PPPNE),
the absence of loitering youth, presence of friends and adult supervision (PPSNE). Therefore, improving safety
of the physical and social neighbourhood environment is an important factor in stimulating children’s OP
duration.
18
Bibliography
1. Singh a S, Mulder C, Twisk JWR, van Mechelen W, Chinapaw MJM. Tracking of childhood overweight into adulthood: a systematic review of the literature. Obes Rev. 2008 Sep;9(5):474–88.
2. Freedman DS, Khan LK, Serdula MK, Dietz WH, Srinivasan SR, Berenson GS. The relation of childhood BMI to adult adiposity: the Bogalusa Heart Study. Pediatrics. 2005 Jan;115(1):22–7.
3. Schönbeck Y, Talma H, van Dommelen P, Bakker B, Buitendijk SE, Hirasing R a, et al. Increase in prevalence of overweight in Dutch children and adolescents: a comparison of nationwide growth studies in 1980, 1997 and 2009. PLoS One. 2011 Jan;6(11):e27608.
4. World Health Organisation. On a global strategy on diet physical activity and health. World Heal Assem Resolut WHA57. 2004;17.
5. Engeland A, Bjorge T, Sogaard AJ TA. Body mass index in adolescence in relation to total mortality: 32-year follow-up of 227,000 Norwegian boys and girls. Am J Epidemiol. 2003;157(9):517–23.
6. Engeland A, Bjorge T, Tverdal A SA. Obesity in adolescence and adulthood and the risk of adult mortality. Am J Epidemiol. 2004;15:79–85.
7. Must A, Strauss RS. Risks and consequences of childhood and adolescent obesity. Int J Obes. 1999 Mar;23:S2–11.
8. Pinhas-Hamiel O, Singer S, Pilpel N, Fradkin a, Modan D, Reichman B. Health-related quality of life among children and adolescents: associations with obesity. Int J Obes (Lond). 2006;30(2):267–72.
9. Zhang Y, Gan Y, Cham H, Wang M-T, Willett JB, Eccles JS, et al. School Engagement Trajectories and Their Differential Predictive Relations to Dropout. J Adolesc. 2012;74(4):274–83.
10. Craigie AM, Lake AA, Kelly SA, Adamson AJ, Mathers JC. Tracking of obesity-related behaviours from childhood to adulthood: a systematic review. Durham Res Online. 2012;44(November):47.
11. Biddle SJH, Pearson N, Ross GM, Braithwaite R. Tracking of sedentary behaviours of young people: a systematic review. Prev Med (Baltim). Elsevier Inc.; 2010 Nov;51(5):345–51.
12. Telama R. Tracking of physical activity from childhood to adulthood: a review. Obes Facts. 2009 Jan;2(3):187–95.
13. Warburton DER, Nicol CW, Bredin SSD. R eview Health benefits of physical activity : the evidence. 2006;
14. Aarts, M.-J., van de Goor, I. A. M., van Oers, H. A. M. & Schuit AJ. Towards translation of environmental determinants of physical activity in children into multi-sector policy measures: study design of a Dutch project. BMC Public Health. 2009;9(396).
15. Kemper, H., Ooijendijk, W. & Stiggelbout M. Consensus over de Nederlandse norm voor gezond bewegen. Tijdschr voor gezondheidswetenschappen. 2000;87:180–3.
16. Timmermans P MW& SN. Kwaliteit van de speelomgeving in de eigen buurt. 2013.
17. Schaefer L, Plotnikoff RC, Majumdar SR, Mollard R, Woo M, Sadman R, et al. Outdoor Time Is Associated with Physical Activity, Sedentary Time, and Cardiorespiratory Fitness in Youth. J Pediatr. 2014;1–6.
19
18. Hinkley T, Crawford D, Salmon J, Okely AD, Hesketh K. Preschool Children and Physical Activity. A Review of Correlates. Am J Prev Med. 2008;34(5).
19. Stone MR, Faulkner GEJ. Outdoor play in children: Associations with objectively-measured physical activity, sedentary behavior and weight status. Prev Med (Baltim). Elsevier Inc.; 2014;65:122–7.
20. Page AS, Cooper AR, Griew P, Davis L, Hillsdon M. Independent mobility in relation to weekday and weekend physical activity in children aged 10-11 years: The PEACH Project. Int J Behav Nutr Phys Act. 2009;6:2.
21. Burdette HL, Whitaker RC. Resurrecting free play in young children: looking beyond fitness and fatness to attention, affiliation, and affect. Arch Pediatr Adolesc Med. 2005;159(1):46–50.
22. Blatchford P, Baines E, Pellegrini A. The social context of school playground games: Sex and ethnic differences, and changes over time after entry to junior school. 2003;(August 2002):481–505.
23. Staempfli MB. Reintroducing adventure into children’s outdoor play environments. Evironment Behav. 2009;41(2):286–280.
24. Little H, Wyver S. Outdoor play: Does avoiding the risks reduce the benefits? Aust J Early Child. 2008;33(2):33–40.
25. Panter JR, Jones AP, van Sluijs EM. Environmental determinants of active travel in youth: a review and framework for future research. Int J Behav Nutr Phys Act. 2008;5:34.
26. Cheatom O, Borden LM, Hawkey KR, Wittcoff Kuhl M, Pinna KM. Parental Influence on Children’s Physical Activity Motivation. Reach Support Mil Fam Through Res Outreach. 2014;(June).
27. Beets MW, Cardinal BJ, Alderman BL. Parental social support and the physical activity-related behaviors of youth: a review. Health Educ Behav. 2010;37(5):621–44.
28. Moore LL, Lombardi D a, White MJ, Campbell JL, Oliveria S a, Ellison RC. Influence of parents’ physical activity levels on activity levels of young children. J Pediatr. 1991;118(2):215–9.
29. Sallis JF, Glanz K. The Role of Built Environments in Physical Activity, Eating, and Obesity in Childhood. Futur Child. 2006;16(1):89–108.
30. Sallis JF, Prochaska JJ, Taylor WC. A review of correlates of physical activity. Med Sci Sports Exerc. 2000;(1):19–21.
31. Verloigne M, Van Lippevelde W, Maes L, Brug J, De Bourdeaudhuij I. Family- and school-based correlates of energy balance-related behaviours in 10-12-year-old children: a systematic review within the ENERGY (EuropeaN Energy balance Research to prevent excessive weight Gain among Youth) project. Public Health Nutr. 2012 Aug;15(8):1380–95.
32. Davison KK, Lawson CT. Do attributes in the physical environment influence children ’ s physical activity ? A review of the literature. 2006;17.
33. Ferreira I, Van Der Horst K, Wendel-Vos W, Kremers S, Van Lenthe FJ, Brug J. Environmental correlates of physical activity in youth - A review and update. Obes Rev. 2007;8(39):129–54.
34. Hunter RF, Christian H, Veitch J, Astell-Burt T, Hipp JA, Schipperijn J. The impact of interventions to promote physical activity in urban green space: A systematic review and recommendations for future research. Soc Sci Med. Elsevier Ltd; 2015;124:246–56.
20
35. Björk J, Albin M, Grahn P, Jacobsson H, Ardö J, Wadbro J, et al. Recreational values of the natural environment in relation to neighbourhood satisfaction, physical activity, obesity and wellbeing. J Epidemiol Community Health. 2008;62(4):e2.
36. Tappe K a, Glanz K, Sallis JF, Zhou C, Saelens BE. Children’s physical activity and parents' perception of the neighborhood environment: neighborhood impact on kids study. Int J Behav Nutr Phys Act. International Journal of Behavioral Nutrition and Physical Activity; 2013 Jan;10(1):39.
37. Remmers T, Broeren SML, Renders CM, Hirasing R a, van Grieken A, Raat H. A longitudinal study of children’s outside play using family environment and perceived physical environment as predictors. Int J Behav Nutr Phys Act. 2014;11(1):76.
38. Barnett E, Casper M. A definition of “Social Environment.” J Orthop Trauma. 2010;91(3):465.
39. Aarts MJ, Wendel-Vos W, Van Oers H a M, Van De Goor I a M, Schuit AJ. Environmental determinants of outdoor play in children: A large-scale cross-sectional study. Am J Prev Med. Elsevier Inc.; 2010;39(3):212–9.
40. Jong E de. Parenting and home environment as targets in childhood overweight prevention : results from the ChecKid study. 2013. 137 p.
41. McNeill LH, Kreuter MW, Subramanian S V. Social Environment and Physical activity: A review of concepts and evidence. Soc Sci Med. 2006;63(4):1011–22.
42. Veitch J, Salmon J, Ball K. Individual, social and physical environmental correlates of children’s active free-play: a cross-sectional study. Int J Behav Nutr Phys Act. 2010;7(FEBRUARY):11.
43. Veitch J, Bagley S, Ball K, Salmon J. Where do children usually play? A qualitative study of parents’ perceptions of influences on children's active free-play. Heal Place. 2006;12(4):383–93.
44. Vries S De, Bakker I, Overbeek K Van, Boer NB, Hopman-Rock M. Kinderen in prioriteitswijken: lichamelijke (in) activiteit en overgewicht. TNO Kwaliteit van leven. 2005.
45. Singh AS, Chin A Paw MJM, Kremers SPJ, Visscher TLS, Brug J, van Mechelen W. Design of the Dutch Obesity Intervention in Teenagers (NRG-DOiT): systematic development, implementation and evaluation of a school-based intervention aimed at the prevention of excessive weight gain in adolescents. BMC Public Health. 2006;6:304.
46. Pan C-Y, Frey GC. Physical activity patterns in youth with autism spectrum disorders. J Autism Dev Disord. 2006;36(5):597–606.
47. Sandt DDR, Frey GC. Comparison of physical activity levels between children with and without autistic spectrum disorders. Adapt Phys Act Q. 2005;22(2):146–59.
48. Hanson MD, Chen E. Socioeconomic status and health behaviors in adolescence: A review of the literature. J Behav Med. 2007;30:263–85.
49. Davison L, Birch K. Obesigenic families: parents’ physical activity and dietary intake patterns predicts girls' risk of overweight. Int J Obes Relat Metab Disord. 2008;26(9):1186–93.
50. Wijtzes AI, Jansen W, Bouthoorn SH, Pot N, Hofman A, Jaddoe VW V, et al. Social inequalities in young children’s sports participation and outdoor play. Int J Behav Nutr Phys Act. 2014;11(1):1–10.
51. Cole TJ, Flegal KM, Nicholls D, Jackson A a. Body mass index cut offs to define thinness in children and adolescents: international survey. BMJ. 2007;335(7612):194.
21
52. Cole TJ, Bellizzi MC, Flegal KM, Dietz WH. and obesity worldwide : international survey. 2000;(table 1):1–6.
53. Statistiek CB voor. The Dutch economy 2009 [Internet]. CBS. 2009. Available from: http://www.cbs.nl/nl-NL/menu/themas/macro-economie/publicaties/artikelen/archief/2010/2010-806-pb.htm
54. Districts in the centre of Zwolle [Internet]. Municipality of Zwolle. Available from: www.zwolle.nl/wijken
55. Trost SG, Pate RR, Sallis JF, Freedson PS, Taylor WC, Dowda M, et al. Age and gender differences in objectively measured physical activity in youth. Med Sci Sports Exerc. 2002;34:350–5.
56. Harten N, Olds T, Dollman J. The effects of gender, motor skills and play area on the free play activities of 8-11 year old school children. Heal Place. 2008;14:386–93.
57. Field A. Discovering Statistics Using IBM SPSS Statistics. 4th editio. SAGE publications ltd.; 2013. 952 p.
58. IBM, Corporation. IBM SPSS Statistics for Windows, Version 20.0. 2011.
59. Alton D, Adab P, Roberts L, Barrett T. Relationship between walking levels and perceptions of the local neighbourhood environment. Arch Dis Child. 2007;92(1):29–33.
60. Romero a J, Robinson TN, Kraemer HC, Erickson SJ, Haydel KF, Mendoza F, et al. Are perceived neighborhood hazards a barrier to physical activity in children? Arch Pediatr Adolesc Med. 2001;155(10):1143–8.
61. Burdette HL, Whitaker RC. A national study of neighborhood safety, outdoor play, television viewing, and obesity in preschool children. Pediatrics. 2005;116(3):657–62.
62. Carver A, Timperio A, Crawford D. Playing it safe: The influence of neighbourhood safety on children’s physical activity-A review. Heal Place. 2008;14(2):217–27.
63. Tandon PS, Zhou C, Sallis JF, Cain KL, Frank LD, Saelens BE. Home environment relationships with children’s physical activity, sedentary time, and screen time by socioeconomic status. Int J Behav Nutr Phys Act. ???; 2012;9(1):88.
64. Stalsberg R, Pedersen a. V. Effects of socioeconomic status on the physical activity in adolescents: A systematic review of the evidence. Scand J Med Sci Sport. 2010;20(3):368–83.
65. Veenstra E. Jaarverslag 2011. Woningstichting SWZ. 2011;114.
66. Van der Poot B, Koops L, Veurink G, van Rooijen R, Dijkshoorn A, Klooster T, et al. Samen gaan voor de Palestrinalaan. 2009.
67. Visscher T, Güner Ö, ten Dam J, Schwartz D. Zwolle gezonde stad: Evaluatie Programma Zwolle Gezonde Stad 2010-2013. 2014. p. 87.
68. Holt NL, Spence JC, Sehn ZL, Cutumisu N. Neighborhood and developmental differences in children’s perceptions of opportunities for play and physical activity. Heal Place. 2008;14(1):2–14.
69. Franzini L, Taylor W, Elliott MN, Cuccaro P, Tortolero SR, Janice Gilliland M, et al. Neighborhood characteristics favorable to outdoor physical activity: Disparities by socioeconomic and racial/ethnic composition. Heal Place. Elsevier; 2010;16(2):267–74.
22
70. Welk G, Wood K, Morss G. Parental influences on physical activity in children. an exploration of potential mechanisms.pdf. 2003.
71. Hochdorn A, Baldi I, Paramesh EC, Kumar M, Gulati A, Gregori D. Is My Kid Out of Size? Indian Mothers’ Desirability Bias in Evaluation of Their Children's Weight. Indian J Pediatr. 2014;81(September).
72. Klesges LM, Baranowski T, Beech B, Cullen K, Murray DM, Rochon J, et al. Social desirability bias in self-reported dietary, physical activity and weight concerns measures in 8- to 10-year-old African-American girls: Results from the Girls health Enrichment Multisite Studies (GEMS). Prev Med (Baltim). 2004;38(SUPPL.):78–87.
73. Gemeente Z. Cijfers over Zwolle [Internet]. Gemeente Zwolle. 2015. Available from: http://www.zwolle.buurtmonitor.nl
74. Mulder M. Sociaaleconomische status 2010 [Internet]. Volksgezondheid Toekomst Verkenning, Nationale Atlas Volksgezondheid. 2013 [cited 2015 Jun 12]. Available from: http://www.zorgatlas.nl
75. Bois J, Sarrazin P, Brustad R, Trouilloud D, Bois J, Sarrazin P, et al. Elementary Schoolchildren’ s Perceived Competence and Physical Activity Involvement: The Influence of Parents’ Role Modelling Behaviours and Perceptions of their Child’s Competence. 2009;(May):381–97.
76. Davison KK, Cutting TM, Birch LL. Parents’ Activity-Related Parenting Practices Predict Girls’ Physical Activity. NIH Public Access. 2008;35(9):1589–95.
77. Mann CJ. Observational research methods. Research design II: cohort, cross sectional, and case-control studies. Emerg Med J. 2003;20:54–61.
78. Klinker CD, Schipperijn J, Christian H, Kerr J, Ersbøll AK, Troelsen J. Using accelerometers and global positioning system devices to assess gender and age differences in children’s school, transport, leisure and home based physical activity. Int J Behav Nutr Phys Act. 2014;11:8.
79. Maddison R, Ni Mhurchu C. Global positioning system: a new opportunity in physical activity measurement. Int J Behav Nutr Phys Act. 2009;6:73.
80. Maxwell JA. Qualitative Research Design: an interactive approach. Third edit. Bickman L, Rog DJ, editors. SAGE publications; 2013.
23
Appendix
Neighbourhoods Number of participants
Mean OP duration
Standard deviation
Center of Zwolle n=43 332 168 Diezerpoort n=219 420 334 Holtenbroek n=377 470 320 Assendorp n=395 408 250 Kamperpoort-Veerallee
n=104 434 251
Poort van Zwolle n=19 445 236 Westenholte n=292 444 287
Stadshagen n=1788 421 264 Wipstrik n=330 422 275 Aalanden n=403 458 288 Vechtlanden n=26 422 213 Berkum n=155 460 266 Marsweteringlanden n=45 469 250 Schelle n=773 394 243 Ittersum n=784 439 290 Soestweteringlanden n=44 490 246 Areas nearby Zwolle n=51 464 250