Embed Size (px)
Citation preview
SECURING WATER FOR TODAY AND TOMORROW…
Planning, Resource, and Technology Committee
October 14, 2021
MWA Water Supply Sustainability Series: Part 2
1
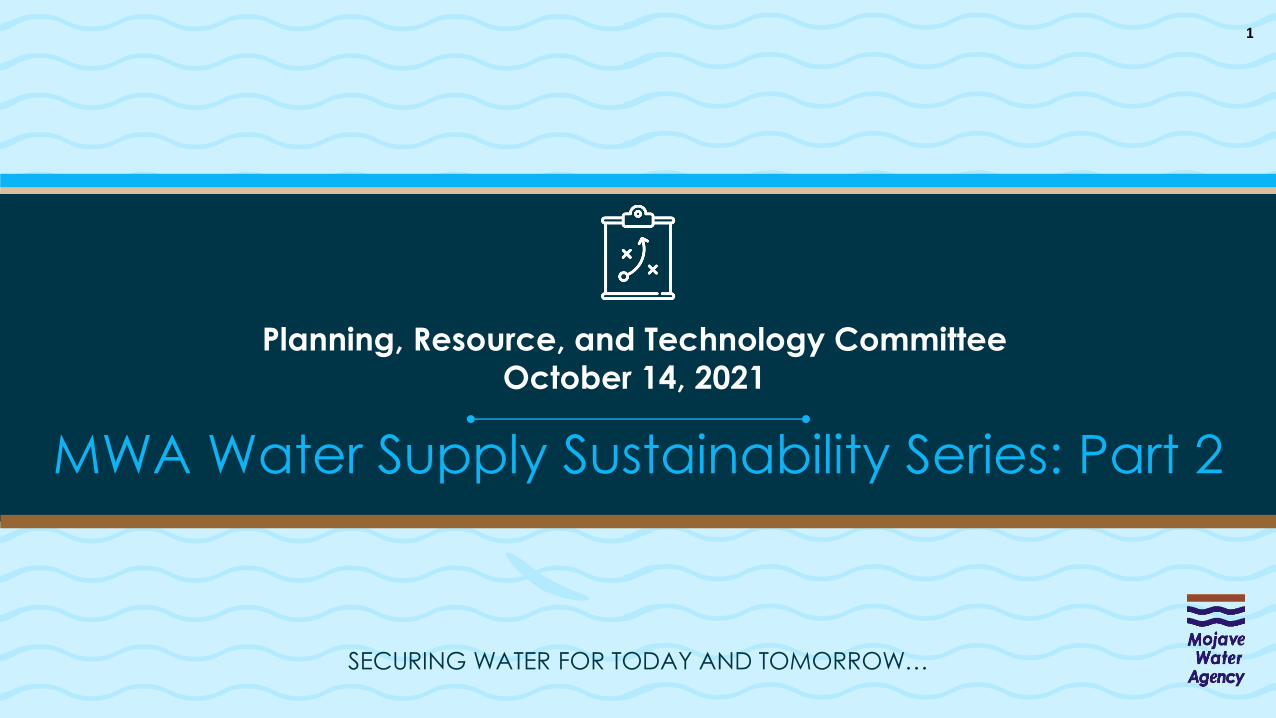
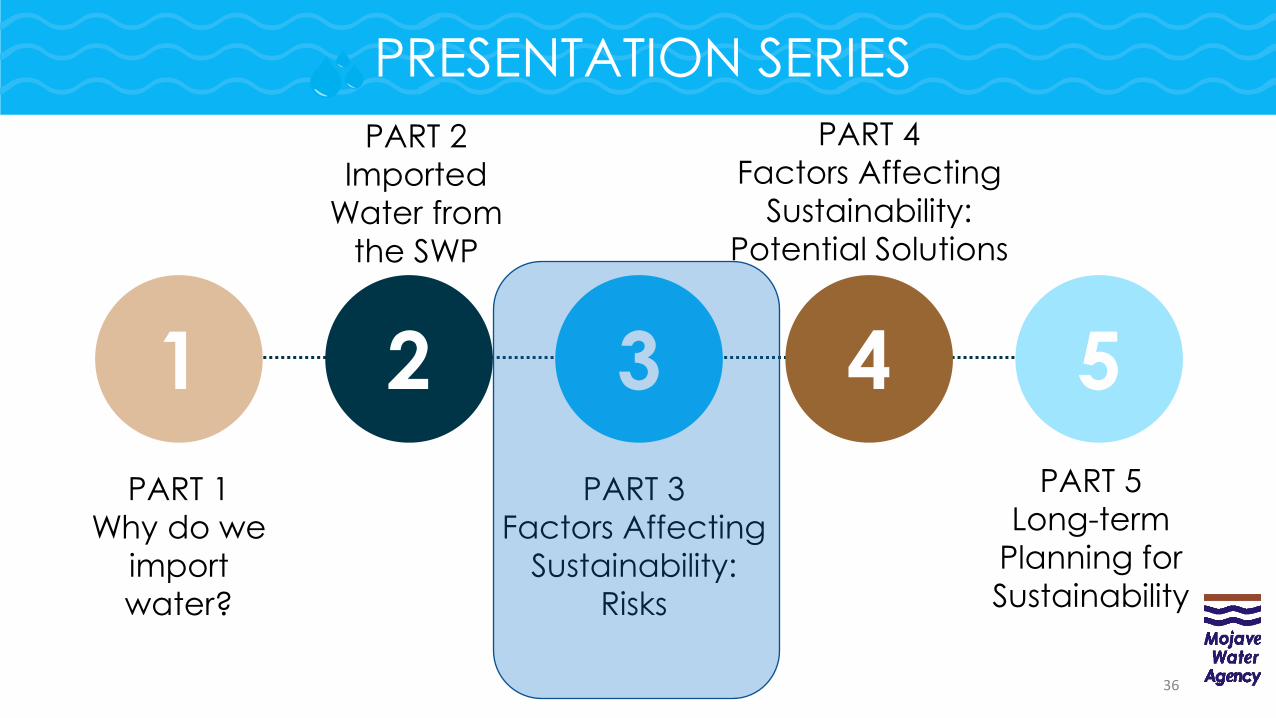
PRESENTATION SERIES
PART 1
Why do we
import
water?
1 2 3 4 5
PART 2
Imported
Water from
the SWP
PART 3
Factors Affecting
Sustainability:
Risks
PART 5
Long-term
Planning for
Sustainability
PART 4
Factors Affecting
Sustainability:
Potential Solutions
2
3
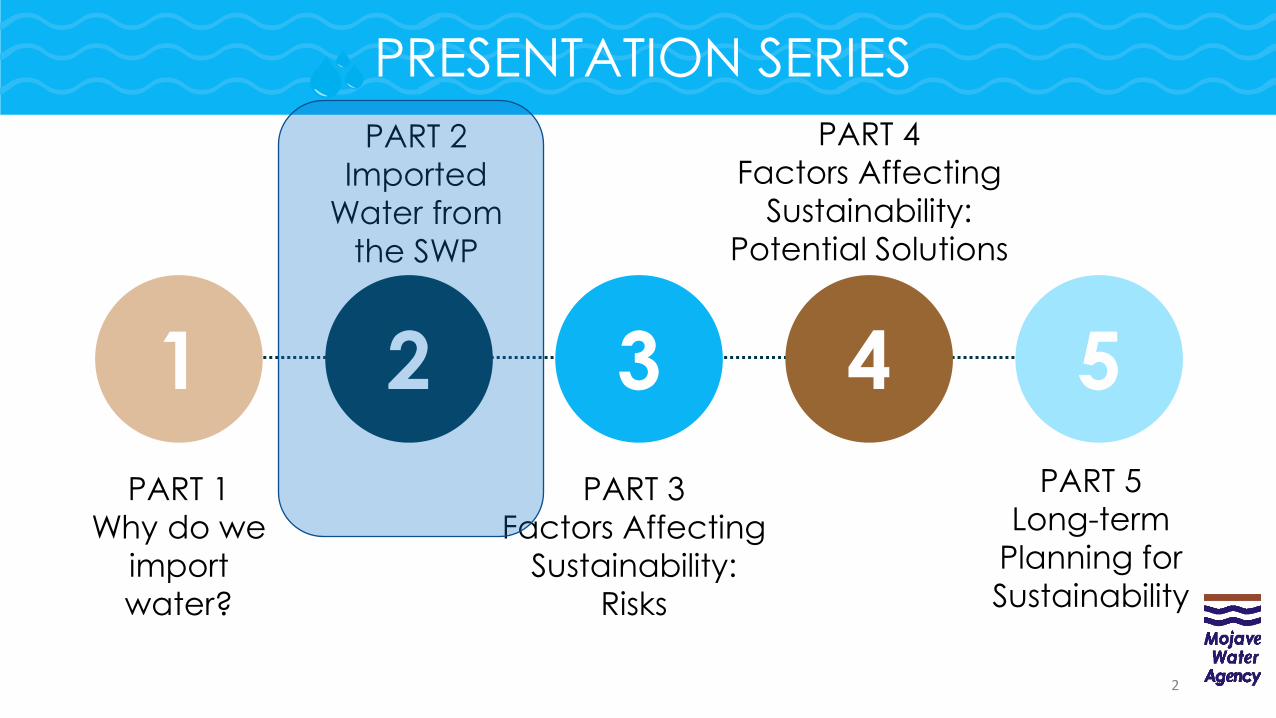
MWA’s purpose and roles
Natural local supplies
The Mojave River Basin Adjudication
Support for current and future local economic health
MWA Water Supply Sustainability: Imported Water
Why do we
import water?
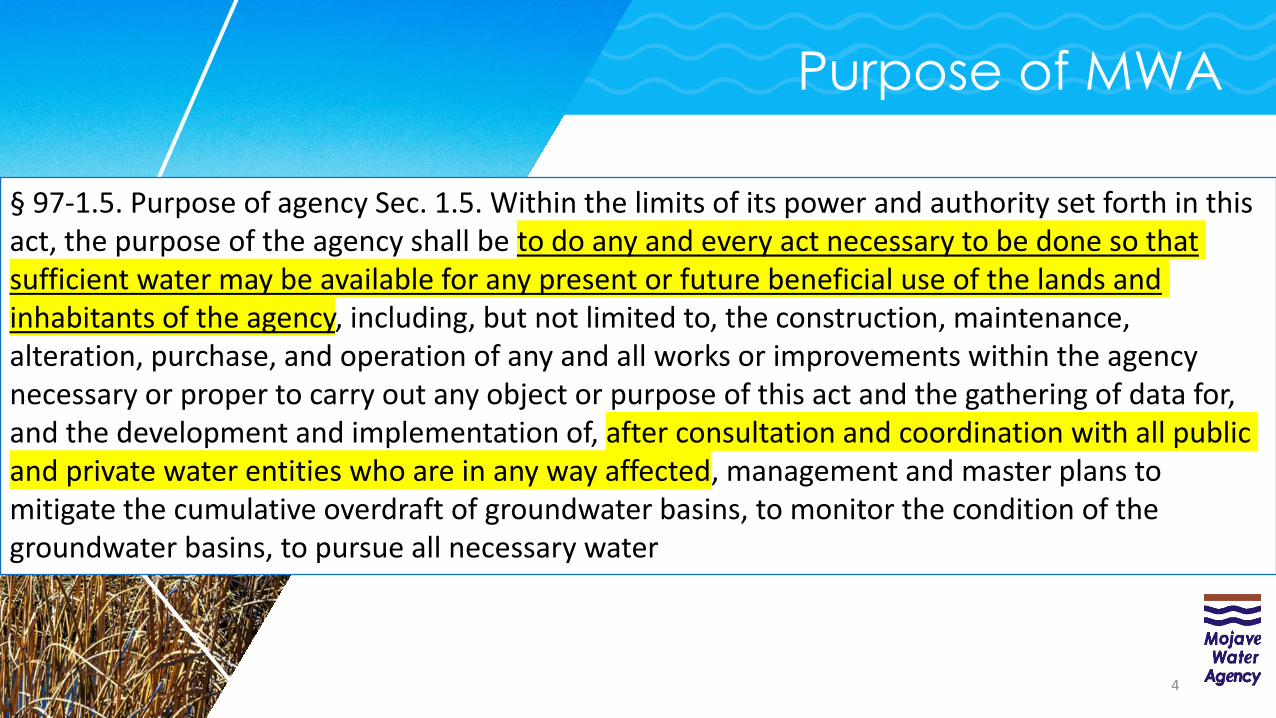
Purpose of MWA
4
§ 97-1.5. Purpose of agency Sec. 1.5. Within the limits of its power and authority set forth in this act, the purpose of the agency shall be to do any and every act necessary to be done so that sufficient water may be available for any present or future beneficial use of the lands and inhabitants of the agency, including, but not limited to, the construction, maintenance, alteration, purchase, and operation of any and all works or improvements within the agency necessary or proper to carry out any object or purpose of this act and the gathering of data for, and the development and implementation of, after consultation and coordination with all public and private water entities who are in any way affected, management and master plans to mitigate the cumulative overdraft of groundwater basins, to monitor the condition of the groundwater basins, to pursue all necessary water
5
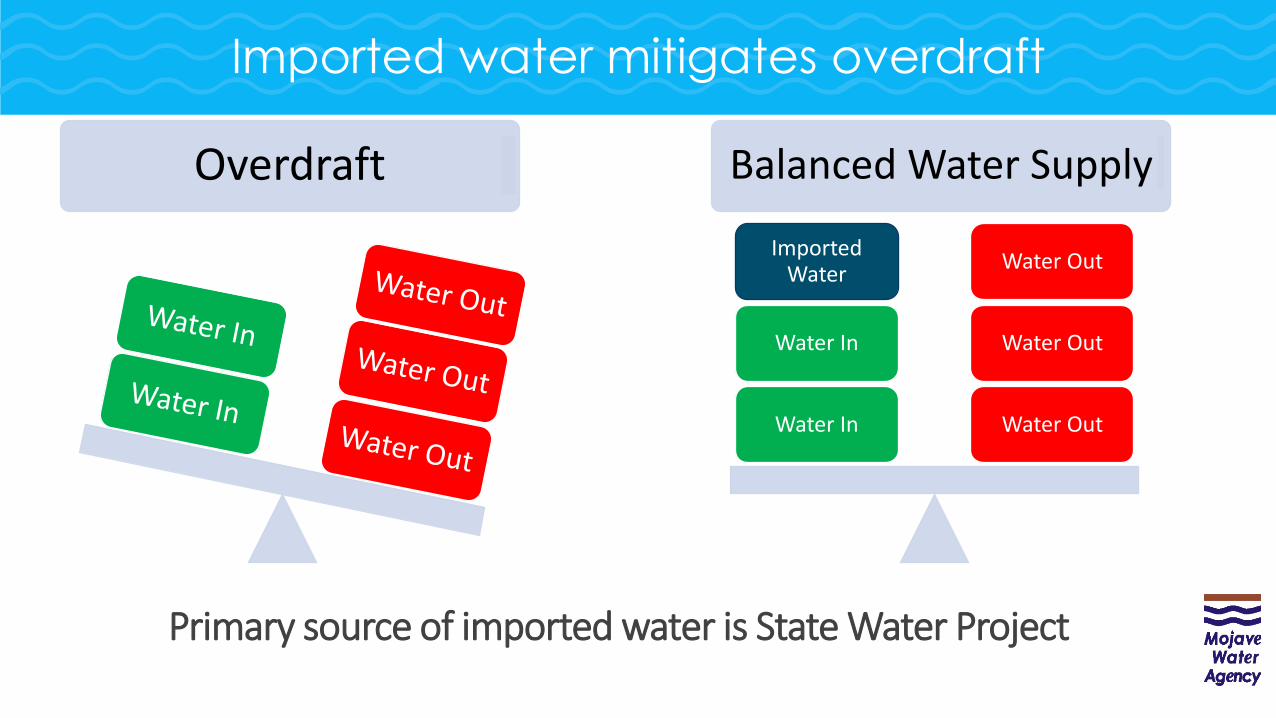
Imported water mitigates overdraft
Overdraft Balanced Water Supply
Water Out
Water Out
Water Out
Water In
Water In
Imported Water
Primary source of imported water is State Water Project
6
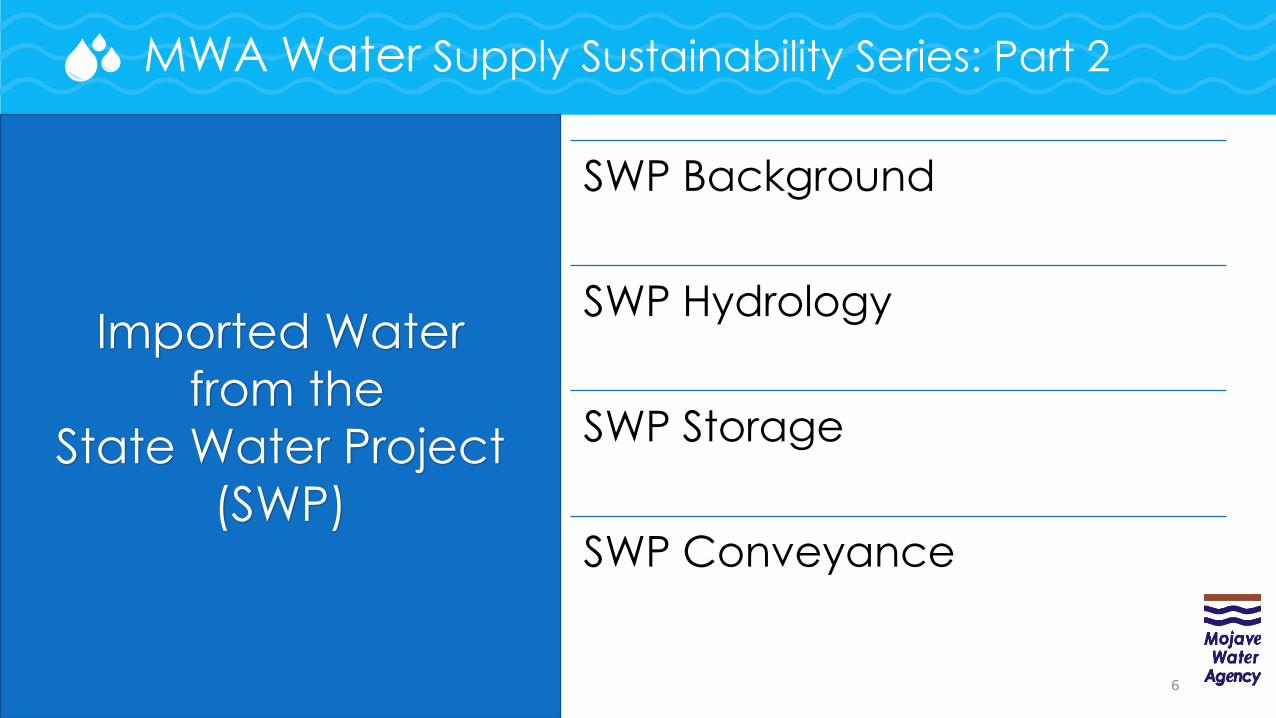
SWP Background
SWP Hydrology
SWP Storage
SWP Conveyance
MWA Water Supply Sustainability Series: Part 2
Imported Water
from the
State Water Project
(SWP)
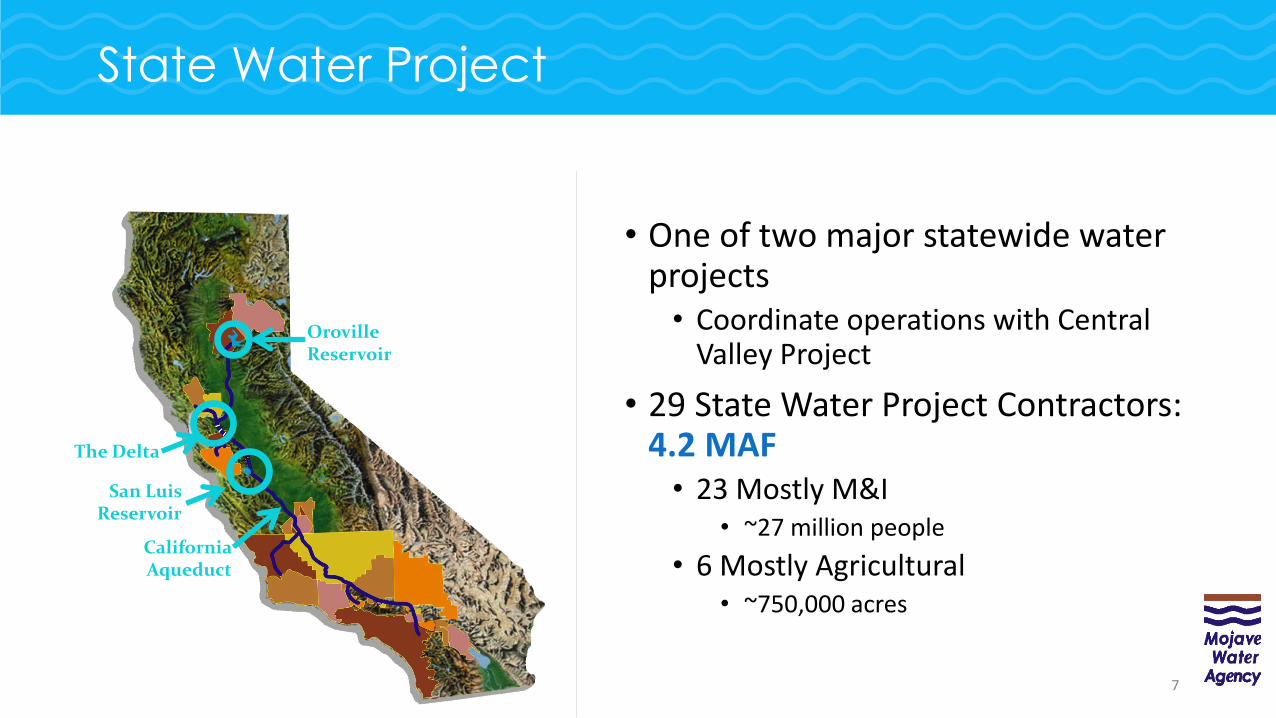
State Water Project
• One of two major statewide water projects• Coordinate operations with Central
Valley Project
• 29 State Water Project Contractors: 4.2 MAF• 23 Mostly M&I
• ~27 million people
• 6 Mostly Agricultural• ~750,000 acres
Oroville Reservoir
The Delta
California Aqueduct
San Luis Reservoir
7
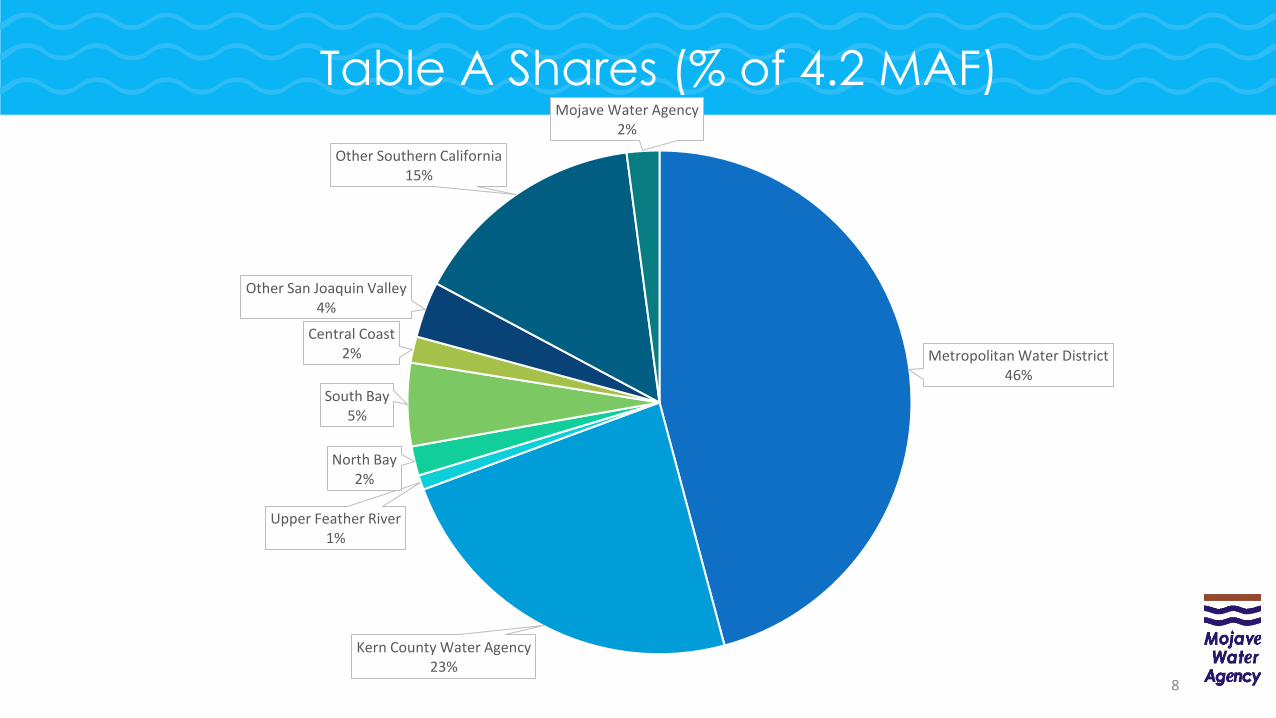
Metropolitan Water District46%
Kern County Water Agency23%
Upper Feather River1%
North Bay2%
South Bay5%
Central Coast2%
Other San Joaquin Valley4%
Other Southern California15%
Mojave Water Agency2%
Table A Shares (% of 4.2 MAF)
8
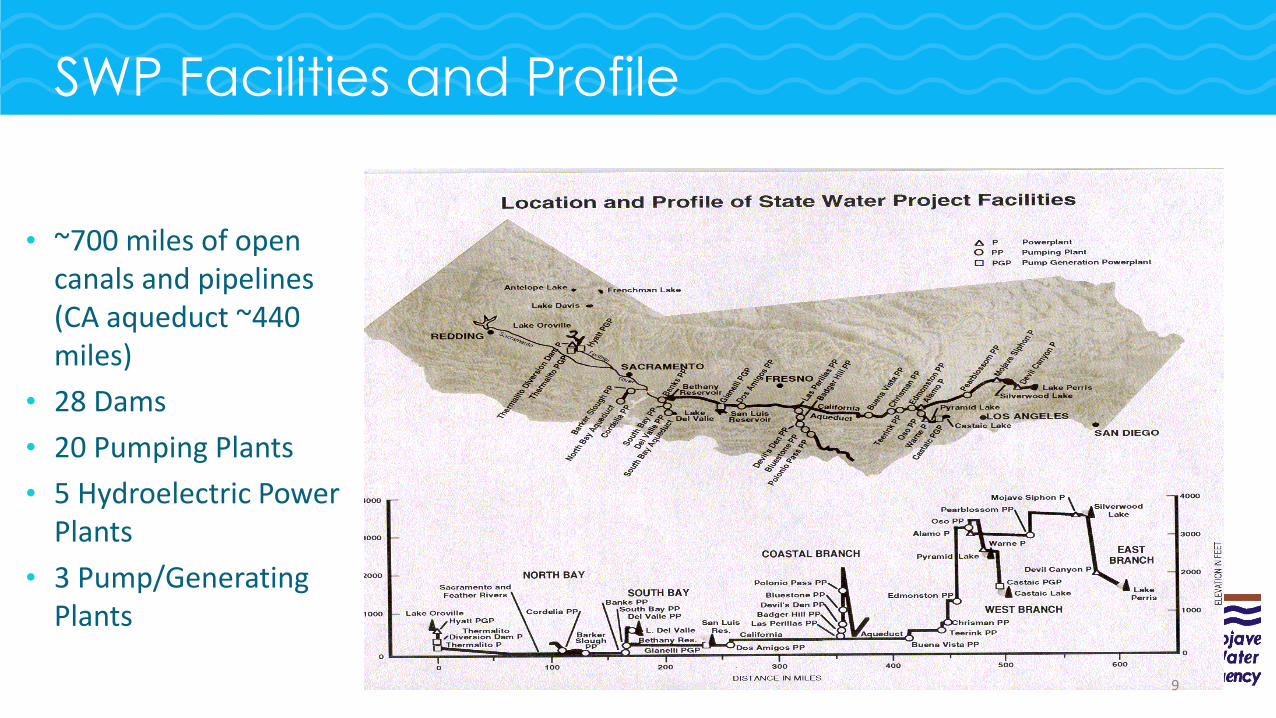
SWP Facilities and Profile
• ~700 miles of open canals and pipelines (CA aqueduct ~440 miles)
• 28 Dams
• 20 Pumping Plants
• 5 Hydroelectric Power Plants
• 3 Pump/Generating Plants
9
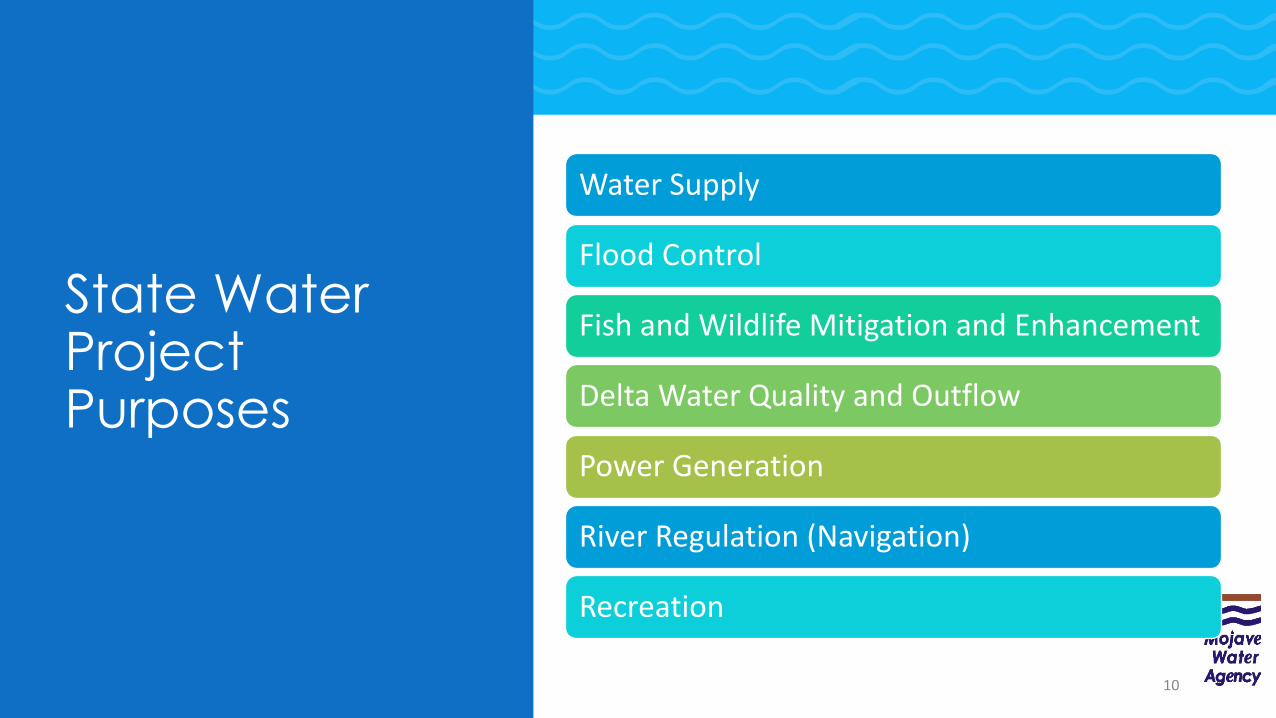
State Water Project Purposes
10
Water Supply
Flood Control
Fish and Wildlife Mitigation and Enhancement
Delta Water Quality and Outflow
Power Generation
River Regulation (Navigation)
Recreation
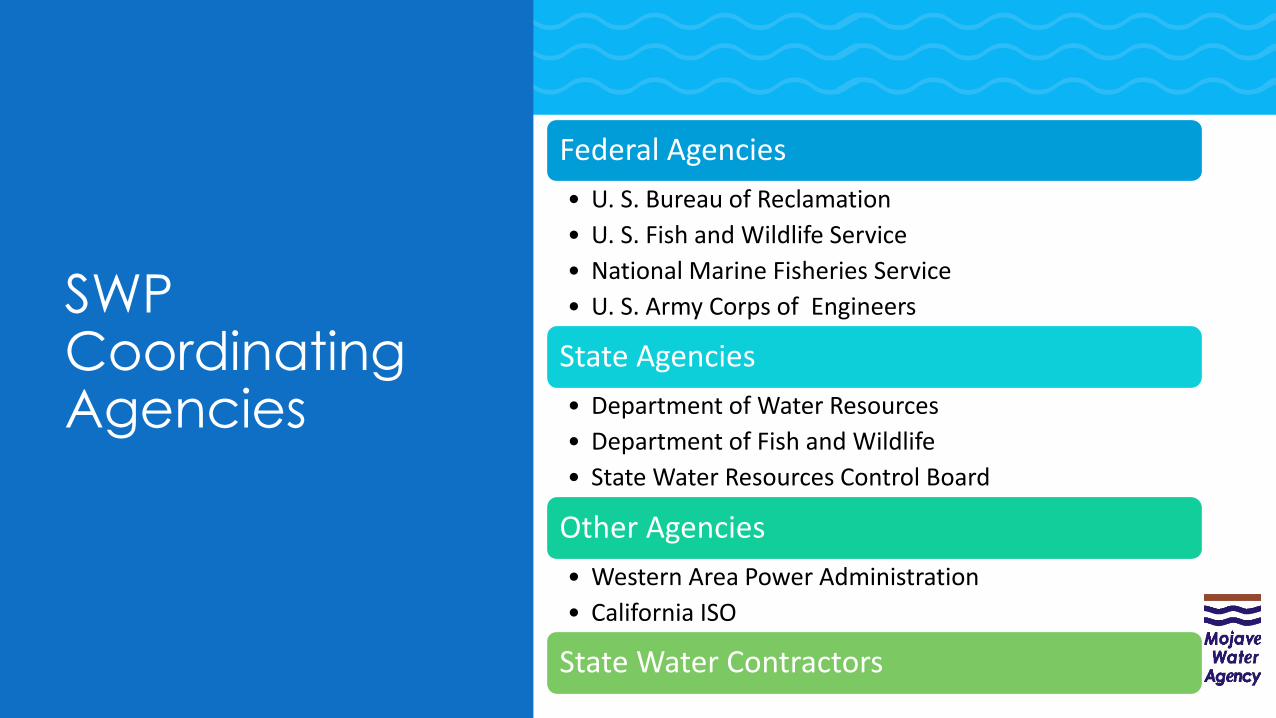
SWP Coordinating Agencies
11
Federal Agencies
• U. S. Bureau of Reclamation
• U. S. Fish and Wildlife Service
• National Marine Fisheries Service
• U. S. Army Corps of Engineers
State Agencies
• Department of Water Resources
• Department of Fish and Wildlife
• State Water Resources Control Board
Other Agencies
• Western Area Power Administration
• California ISO
State Water Contractors
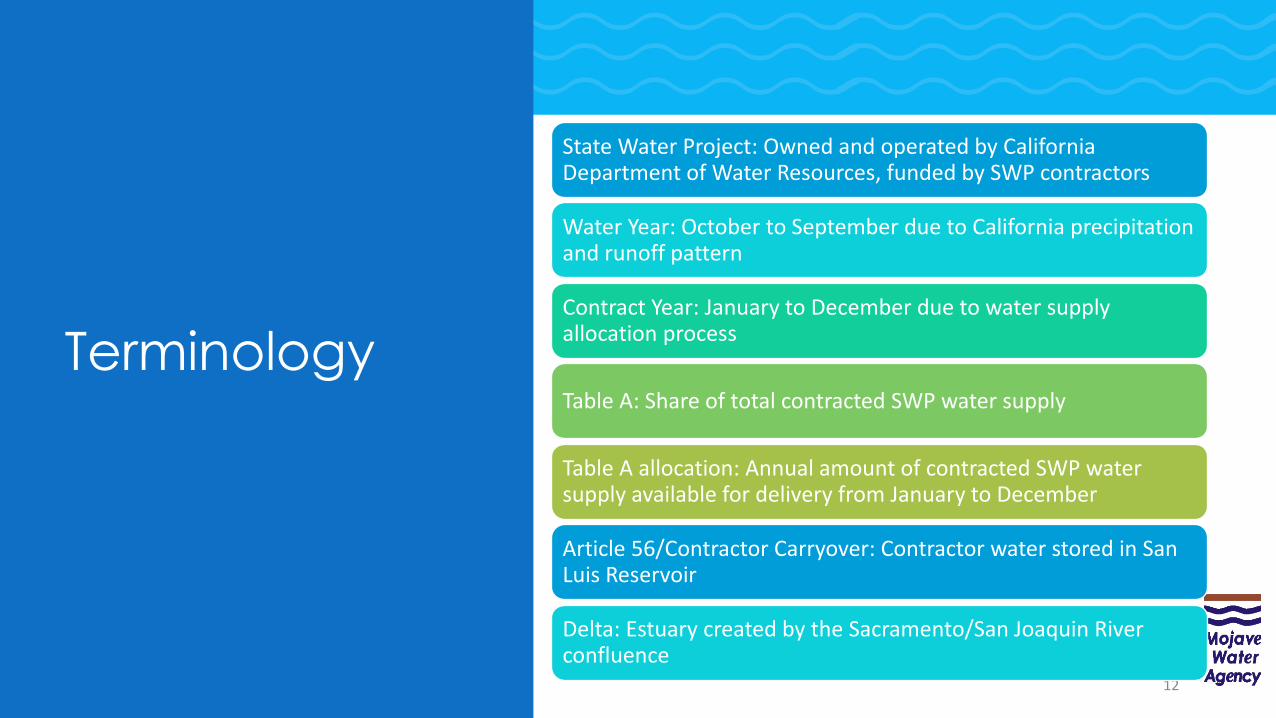
Terminology
12
State Water Project: Owned and operated by California Department of Water Resources, funded by SWP contractors
Water Year: October to September due to California precipitation and runoff pattern
Contract Year: January to December due to water supply allocation process
Table A: Share of total contracted SWP water supply
Table A allocation: Annual amount of contracted SWP water supply available for delivery from January to December
Article 56/Contractor Carryover: Contractor water stored in San Luis Reservoir
Delta: Estuary created by the Sacramento/San Joaquin River confluence
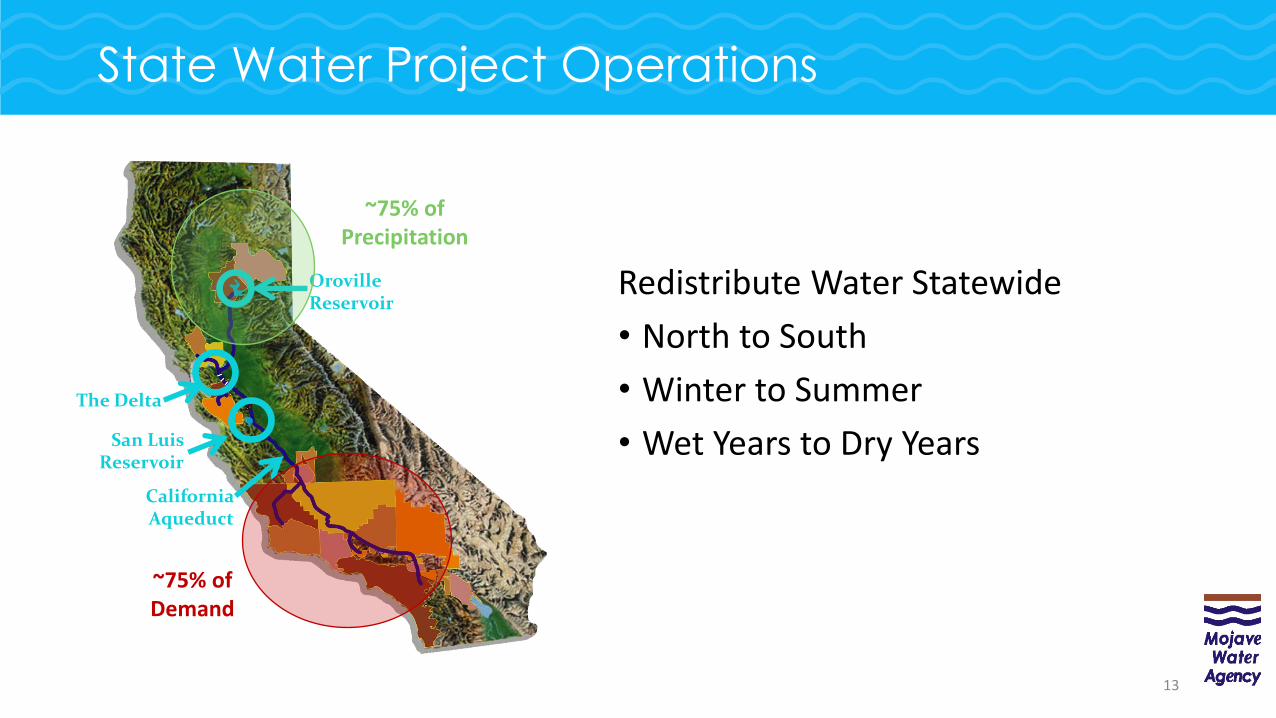
State Water Project Operations
Redistribute Water Statewide
• North to South
• Winter to Summer
• Wet Years to Dry Years
Oroville Reservoir
The Delta
California Aqueduct
San Luis Reservoir
~75% of Precipitation
~75% of Demand
13
0
5
10
15
20
25
30
35
40
19
05
19
10
19
15
19
20
19
25
19
30
19
35
19
40
19
45
19
50
19
55
19
60
19
65
19
70
19
75
19
80
19
85
19
90
19
95
20
00
20
05
20
10
Ru
no
ff (
MA
F)
Water Year
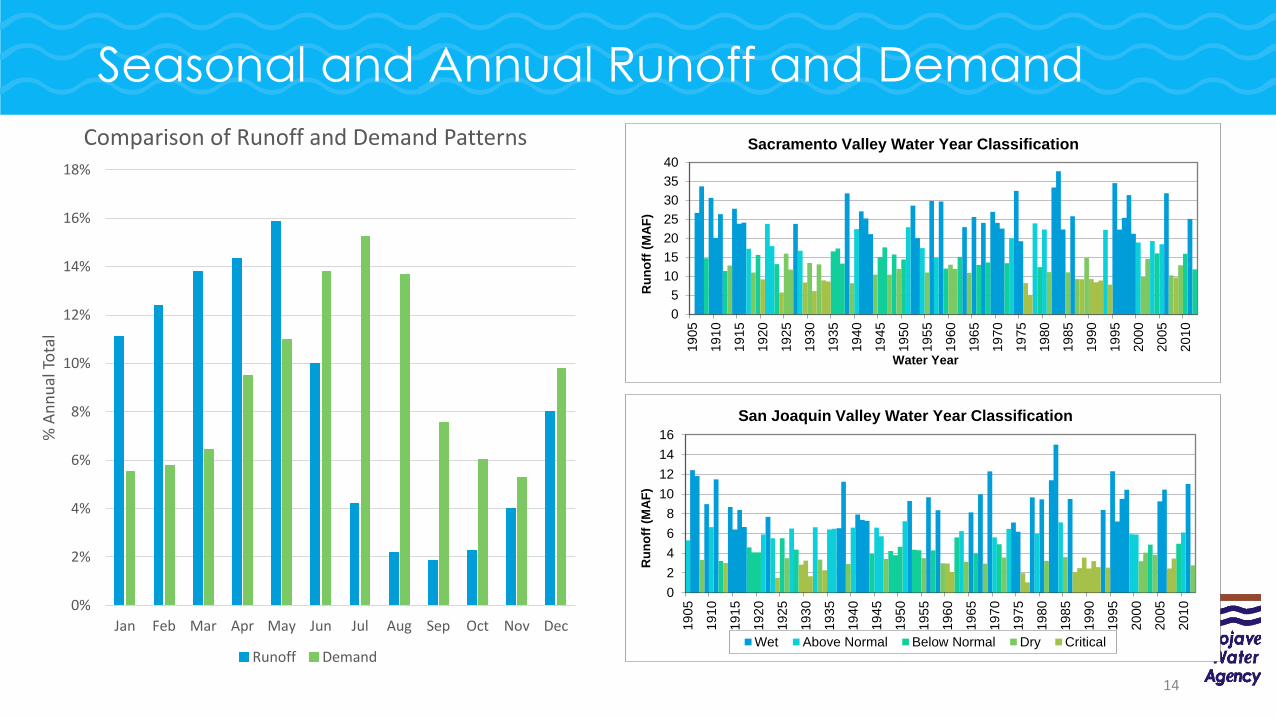
Sacramento Valley Water Year Classification
0
2
4
6
8
10
12
14
16
19
05
19
10
19
15
19
20
19
25
19
30
19
35
19
40
19
45
19
50
19
55
19
60
19
65
19
70
19
75
19
80
19
85
19
90
19
95
20
00
20
05
20
10
Ru
no
ff (
MA
F)
Water Year
San Joaquin Valley Water Year Classification
Wet Above Normal Below Normal Dry Critical
14
Seasonal and Annual Runoff and Demand
0%
2%
4%
6%
8%
10%
12%
14%
16%
18%
Jan Feb Mar Apr May Jun Jul Aug Sep Oct Nov Dec
% A
nn
ual
To
tal
Comparison of Runoff and Demand Patterns
Runoff Demand
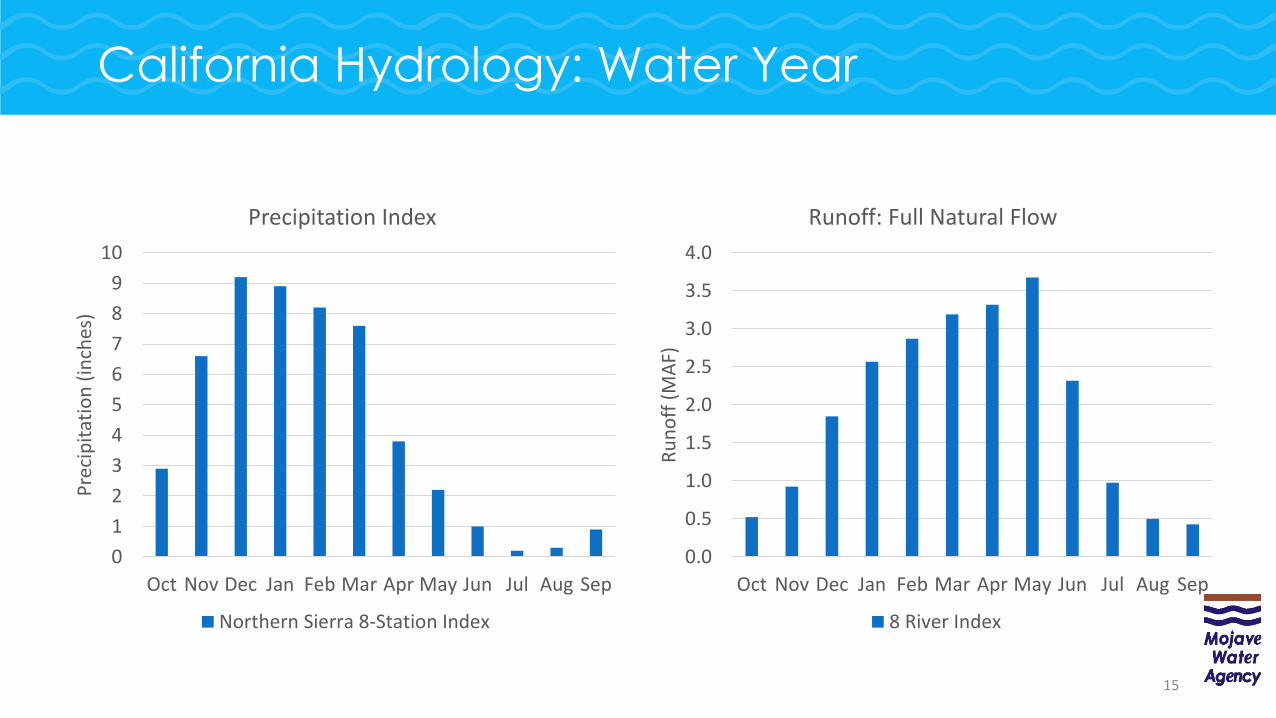
California Hydrology: Water Year
0
1
2
3
4
5
6
7
8
9
10
Oct Nov Dec Jan Feb Mar Apr May Jun Jul Aug Sep
Pre
cip
itat
ion
(in
ches
)
Precipitation Index
Northern Sierra 8-Station Index
0.0
0.5
1.0
1.5
2.0
2.5
3.0
3.5
4.0
Oct Nov Dec Jan Feb Mar Apr May Jun Jul Aug Sep
Ru
no
ff (
MA
F)
Runoff: Full Natural Flow
8 River Index
15
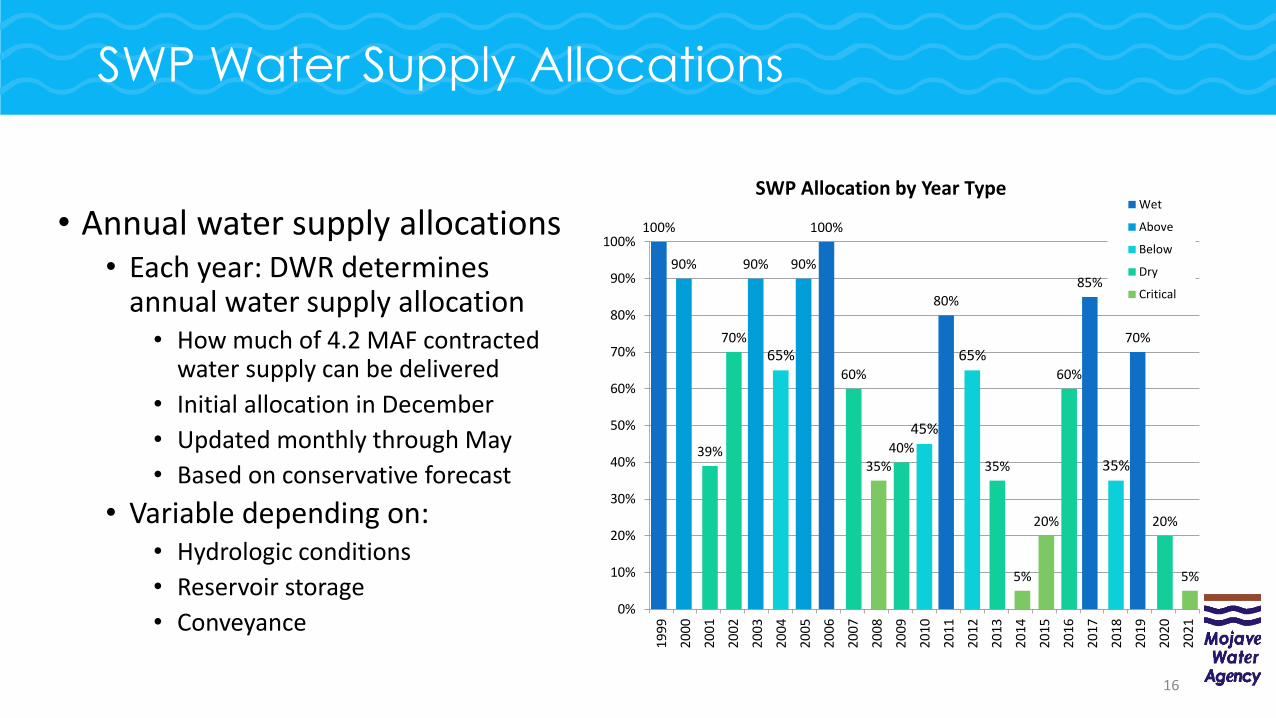
SWP Water Supply Allocations
• Annual water supply allocations• Each year: DWR determines
annual water supply allocation• How much of 4.2 MAF contracted
water supply can be delivered
• Initial allocation in December
• Updated monthly through May
• Based on conservative forecast
• Variable depending on:• Hydrologic conditions
• Reservoir storage
• Conveyance
100% 100%
80%85%
70%
90% 90% 90%
65%
45%
65%
35%39%
70%
60%
40%
35%
60%
20%
35%
5%
20%
5%
0%
10%
20%
30%
40%
50%
60%
70%
80%
90%
100%
1999
2000
2001
2002
2003
2004
2005
2006
200
7
2008
2009
2010
2011
2012
2013
2014
2015
2016
2017
2018
2019
2020
202
1
SWP Allocation by Year TypeWet
Above
Below
Dry
Critical
16
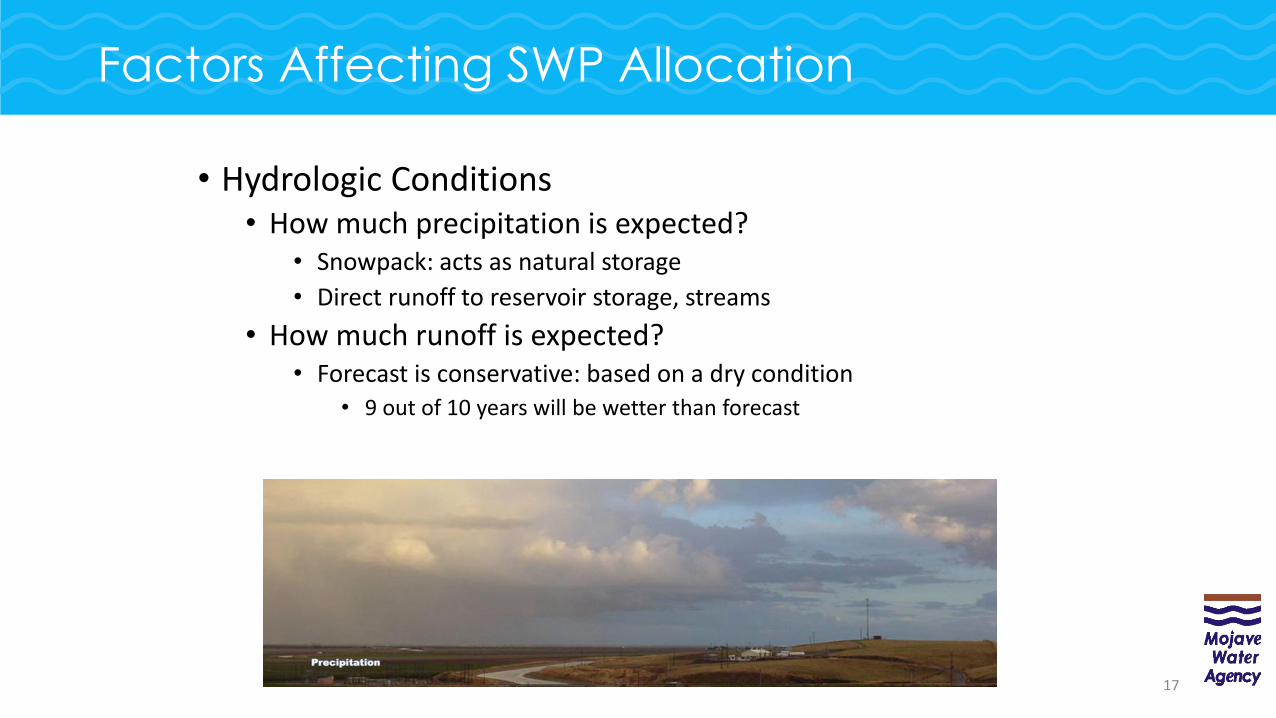
Factors Affecting SWP Allocation
• Hydrologic Conditions• How much precipitation is expected?
• Snowpack: acts as natural storage
• Direct runoff to reservoir storage, streams
• How much runoff is expected?• Forecast is conservative: based on a dry condition
• 9 out of 10 years will be wetter than forecast
17
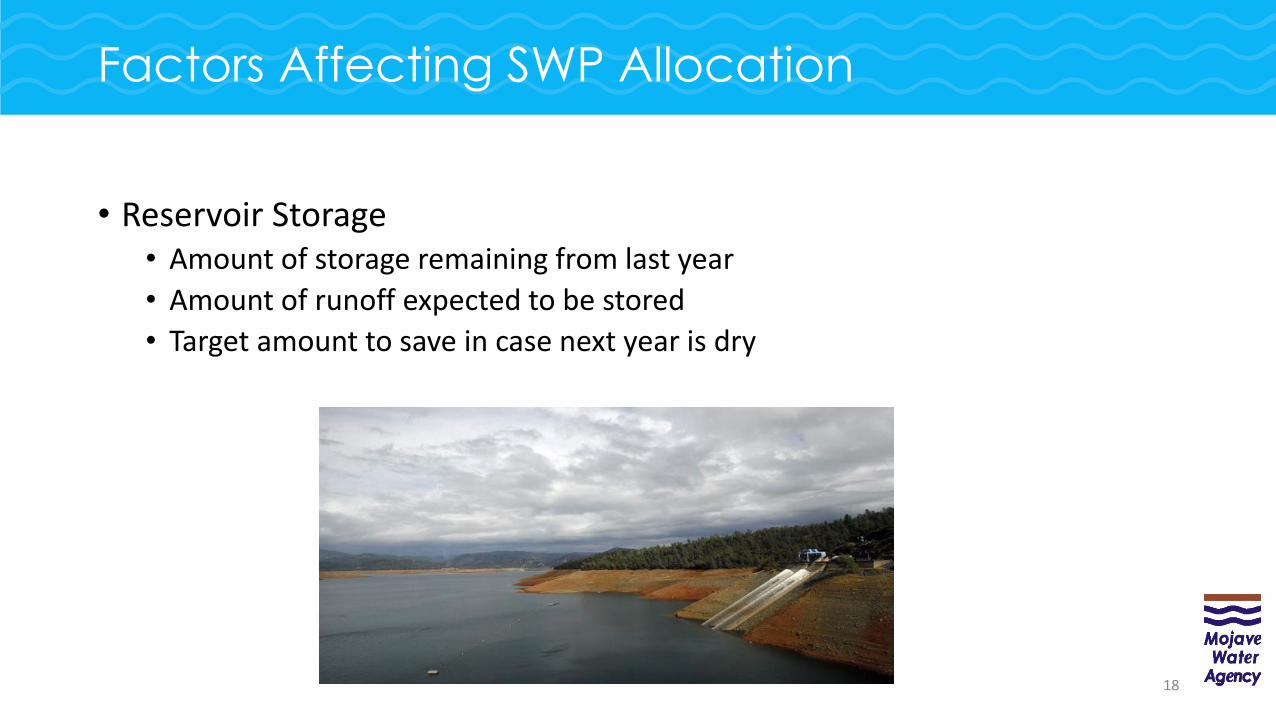
Factors Affecting SWP Allocation
• Reservoir Storage• Amount of storage remaining from last year
• Amount of runoff expected to be stored
• Target amount to save in case next year is dry
18
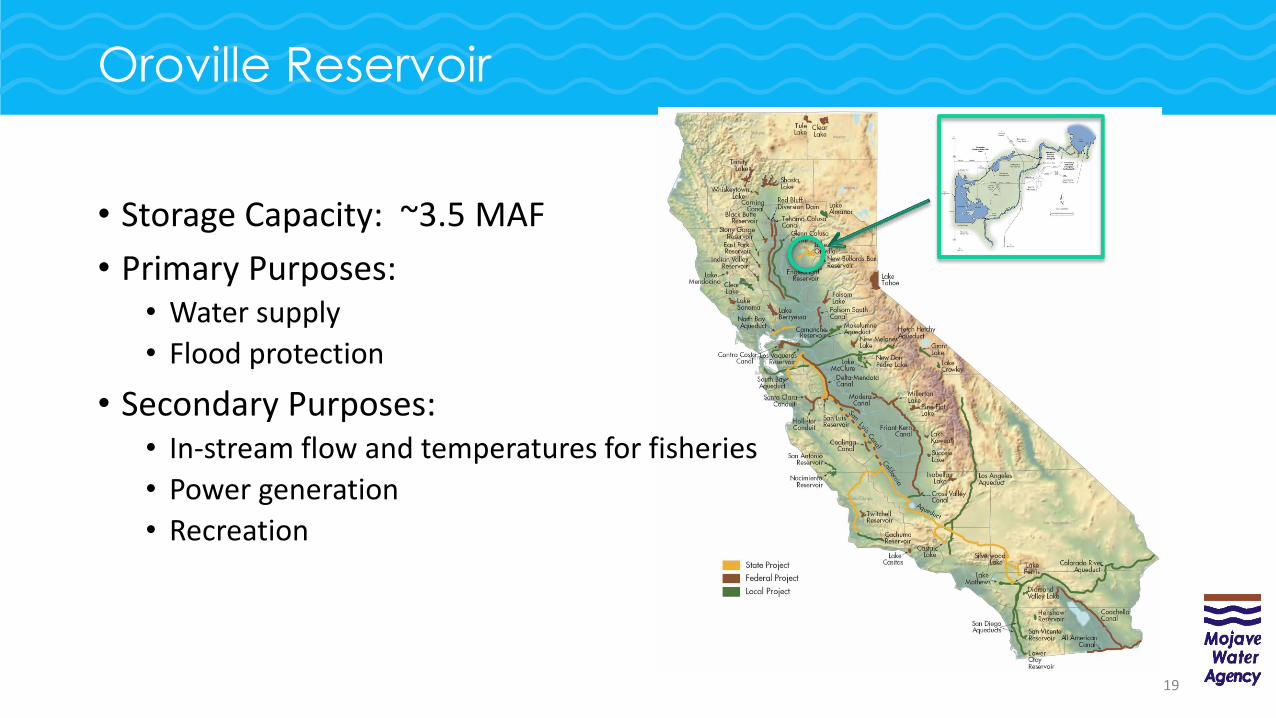
Oroville Reservoir
• Storage Capacity: ~3.5 MAF
• Primary Purposes: • Water supply
• Flood protection
• Secondary Purposes: • In-stream flow and temperatures for fisheries
• Power generation
• Recreation
19
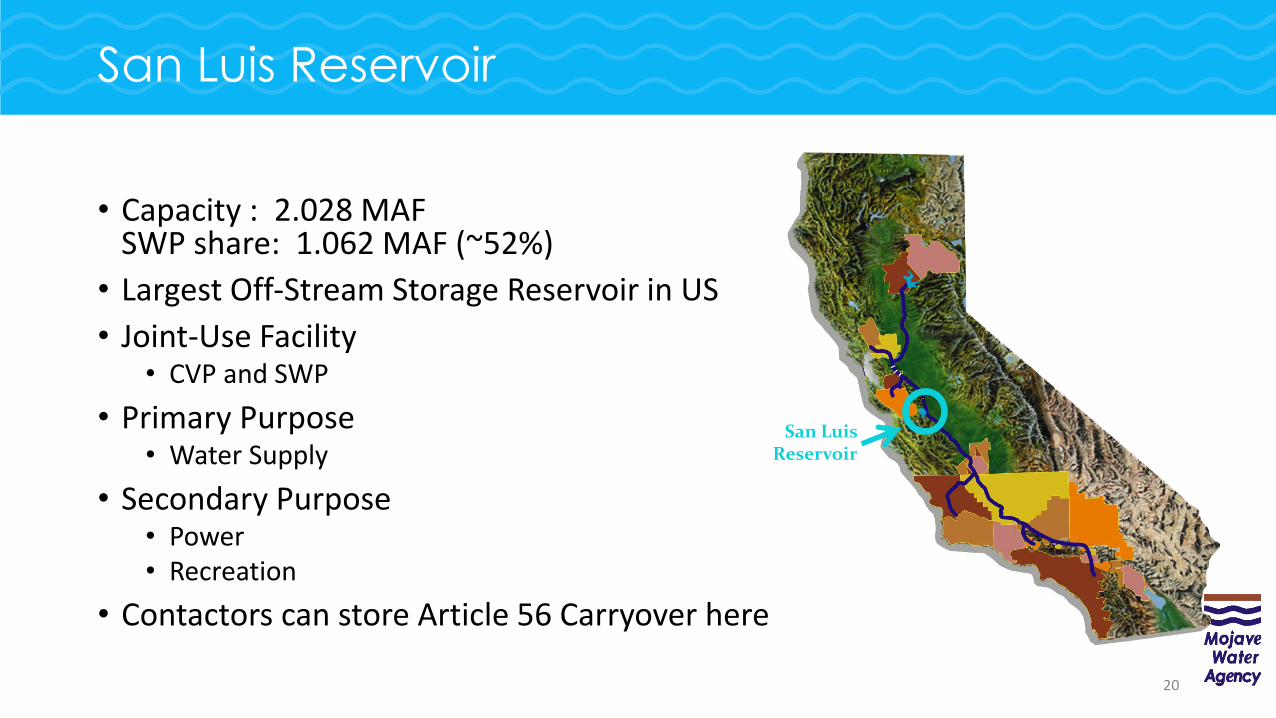
San Luis Reservoir
• Capacity : 2.028 MAF SWP share: 1.062 MAF (~52%)
• Largest Off-Stream Storage Reservoir in US
• Joint-Use Facility• CVP and SWP
• Primary Purpose• Water Supply
• Secondary Purpose• Power• Recreation
• Contactors can store Article 56 Carryover here
San Luis Reservoir
20
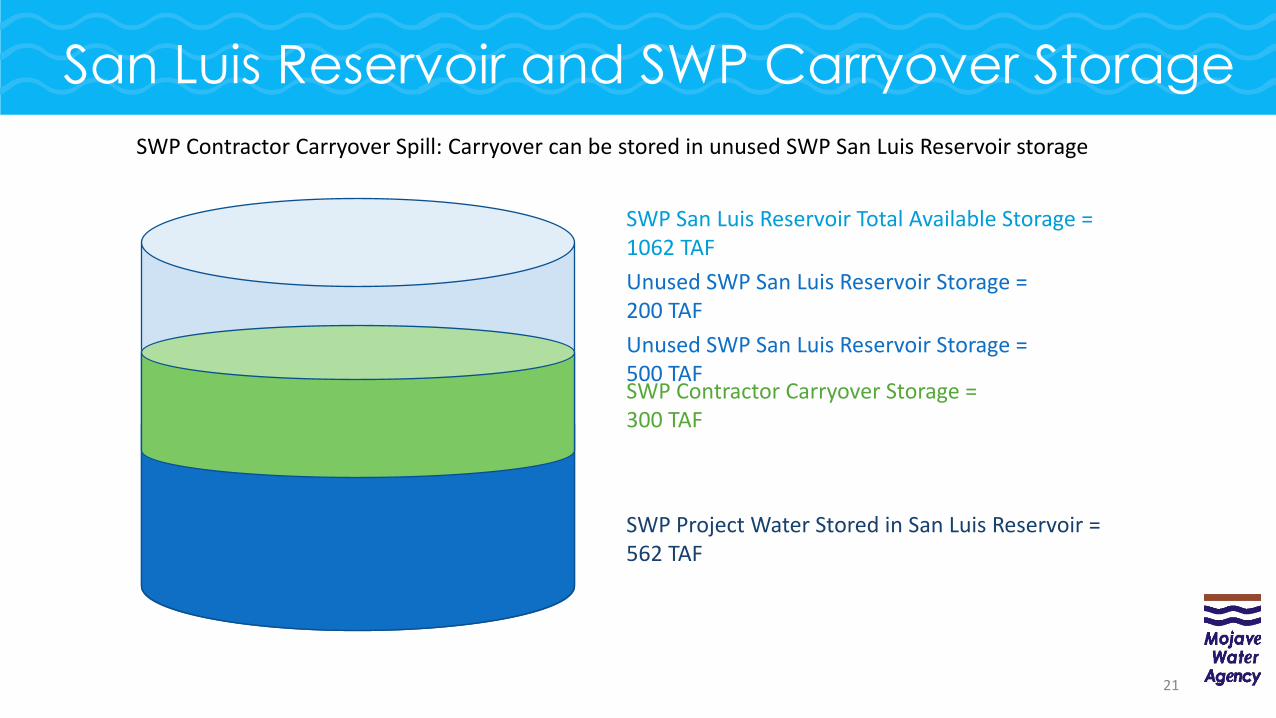
San Luis Reservoir and SWP Carryover Storage
21
SWP San Luis Reservoir Total Available Storage = 1062 TAF
SWP Project Water Stored in San Luis Reservoir = 562 TAF
Unused SWP San Luis Reservoir Storage = 500 TAFSWP Contractor Carryover Storage = 300 TAF
Unused SWP San Luis Reservoir Storage = 200 TAF
SWP Contractor Carryover Spill: Carryover can be stored in unused SWP San Luis Reservoir storage
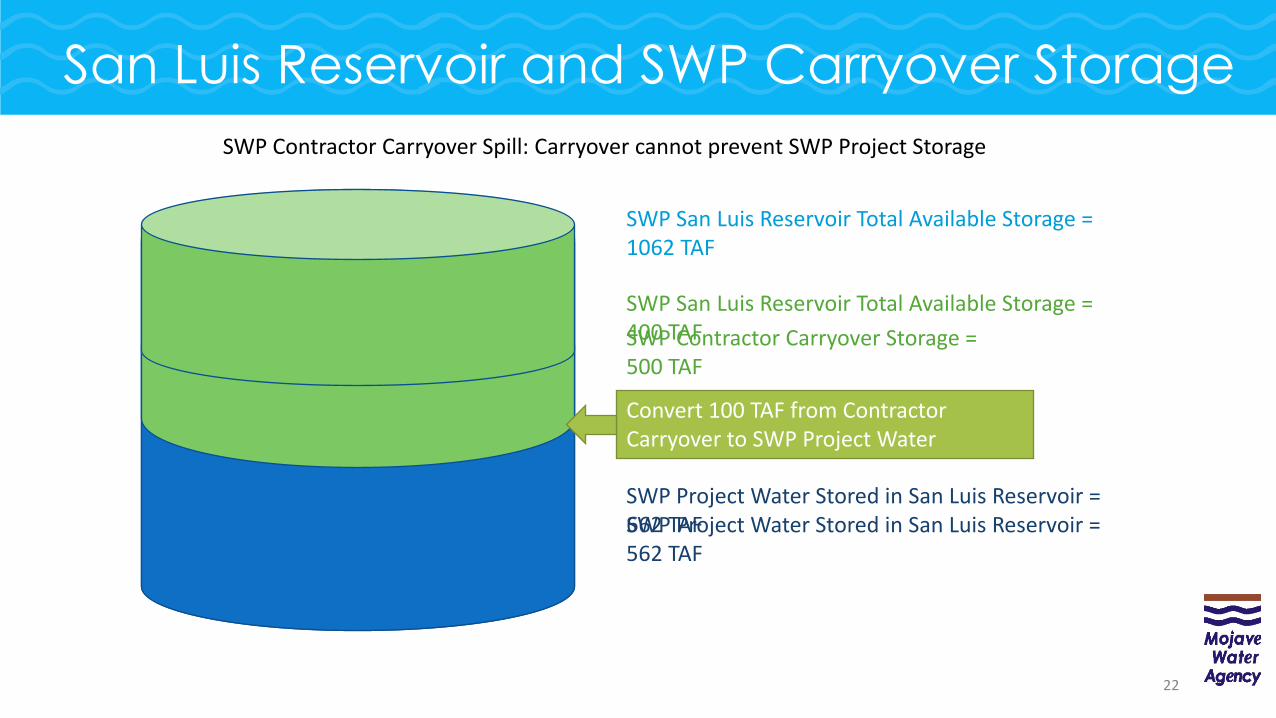
San Luis Reservoir and SWP Carryover Storage
22
SWP San Luis Reservoir Total Available Storage = 1062 TAF
SWP Project Water Stored in San Luis Reservoir = 562 TAF
SWP Contractor Carryover Storage = 500 TAF
SWP San Luis Reservoir Total Available Storage = 400 TAF
SWP Project Water Stored in San Luis Reservoir = 662 TAF
Convert 100 TAF from Contractor Carryover to SWP Project Water
SWP Contractor Carryover Spill: Carryover cannot prevent SWP Project Storage
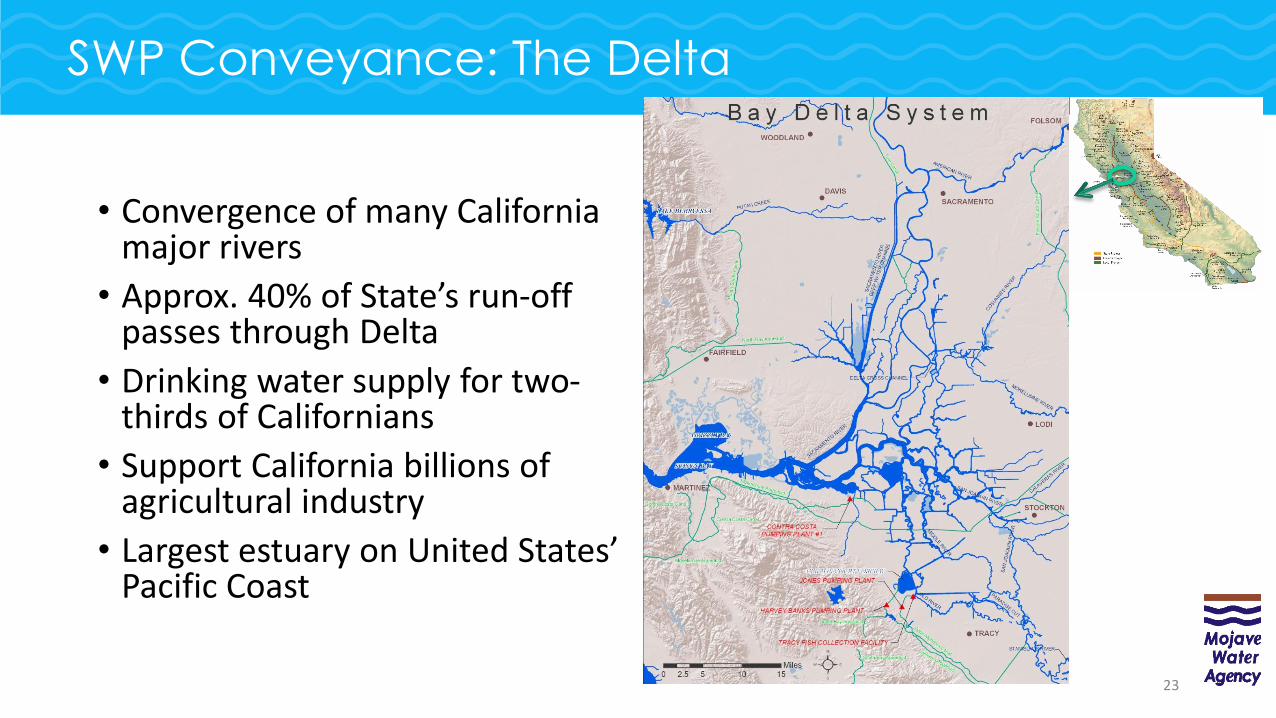
SWP Conveyance: The Delta
• Convergence of many California major rivers
• Approx. 40% of State’s run-off passes through Delta
• Drinking water supply for two-thirds of Californians
• Support California billions of agricultural industry
• Largest estuary on United States’ Pacific Coast
23
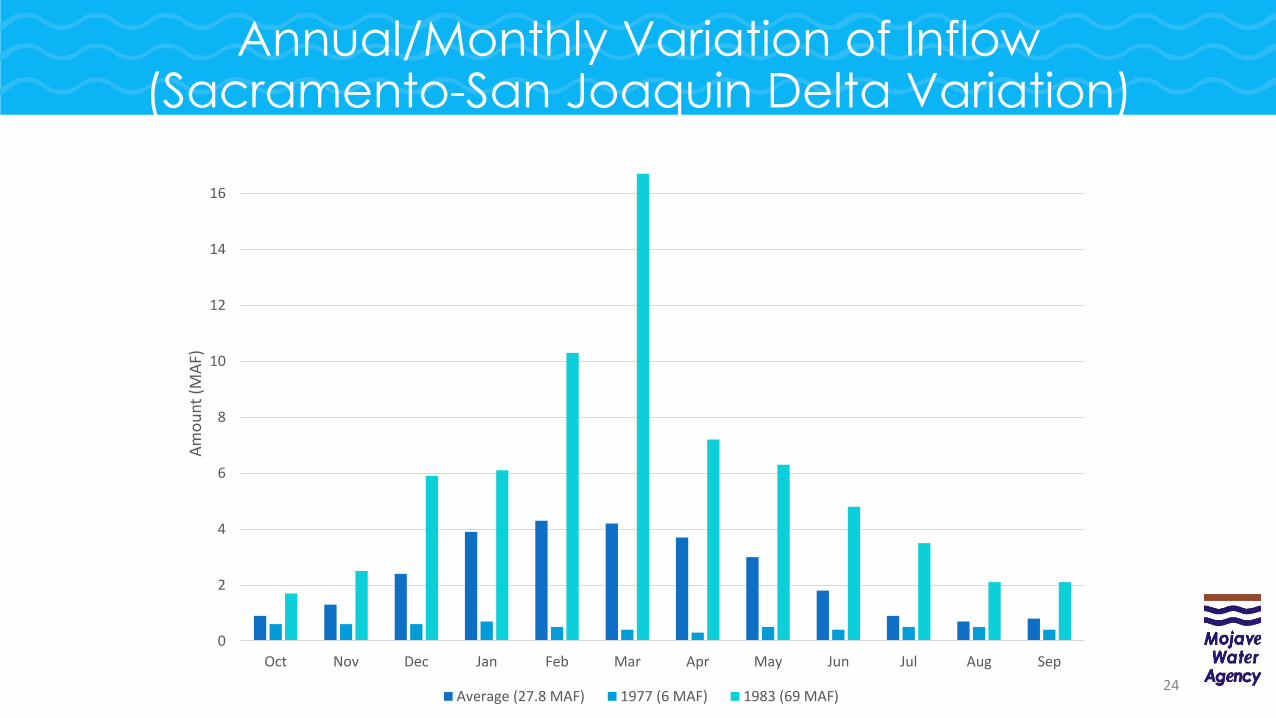
0
2
4
6
8
10
12
14
16
Oct Nov Dec Jan Feb Mar Apr May Jun Jul Aug Sep
Am
ou
nt
(MA
F)
Average (27.8 MAF) 1977 (6 MAF) 1983 (69 MAF)
Annual/Monthly Variation of Inflow(Sacramento-San Joaquin Delta Variation)
24
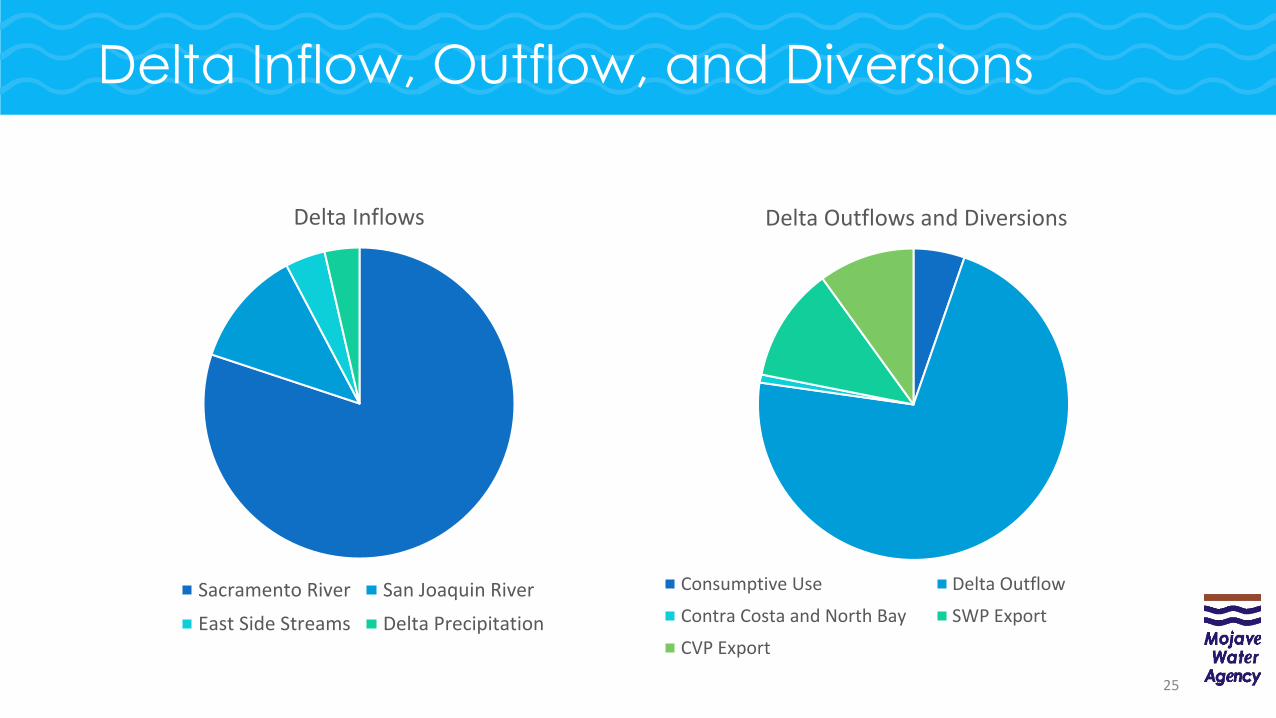
Delta Inflow, Outflow, and Diversions
Delta Inflows
Sacramento River San Joaquin River
East Side Streams Delta Precipitation
Delta Outflows and Diversions
Consumptive Use Delta Outflow
Contra Costa and North Bay SWP Export
CVP Export
25
Key Delta Operating Agreements and Regulations
• SWRCB Permits and Conditions - Water Rights Decision 1641
• Endangered Species Act (ESA) / California ESA Requirements• U.S. Fish and Wildlife Service Biological Opinion (2019)
• N.O.A.A. Fisheries (NMFS) Biological Opinion (2019)
• CDFW Incidental Take Permit (2020)
• Coordinated Operations Agreement – SWP and CVP Sharing Formulas
26
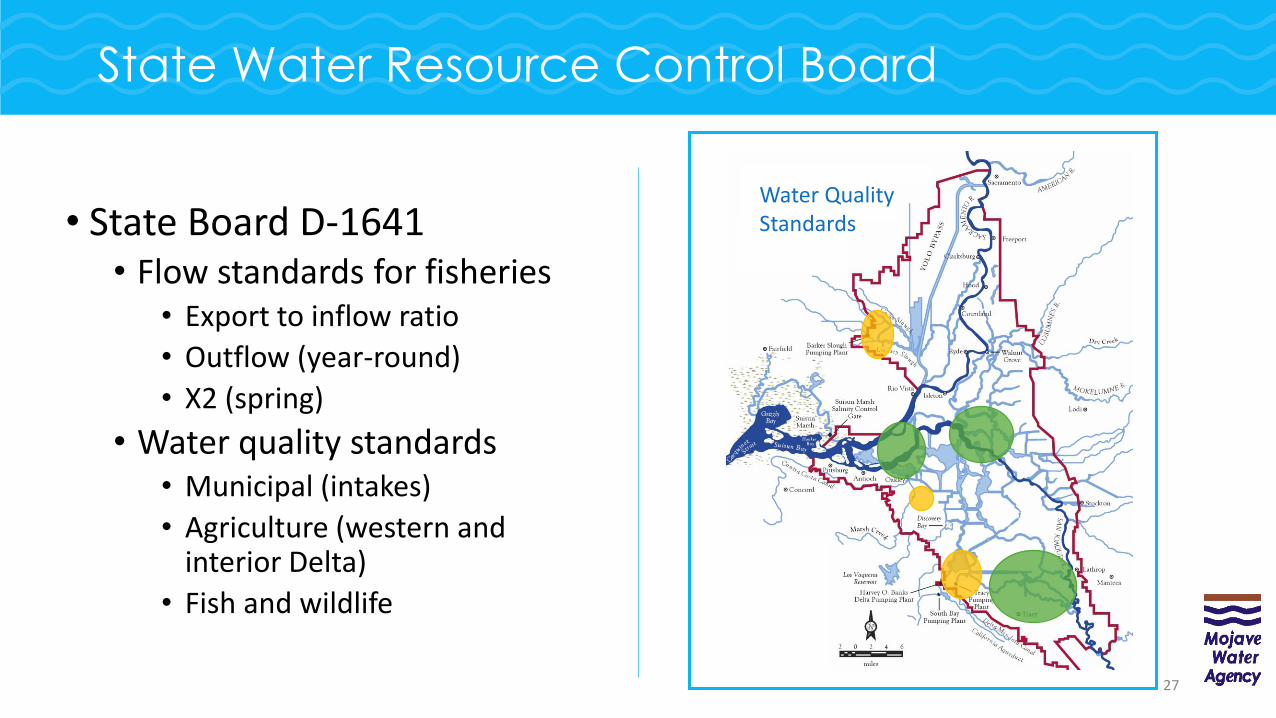
• State Board D-1641• Flow standards for fisheries
• Export to inflow ratio
• Outflow (year-round)
• X2 (spring)
• Water quality standards• Municipal (intakes)
• Agriculture (western and interior Delta)
• Fish and wildlife
State Water Resource Control Board
27
Water Quality Standards
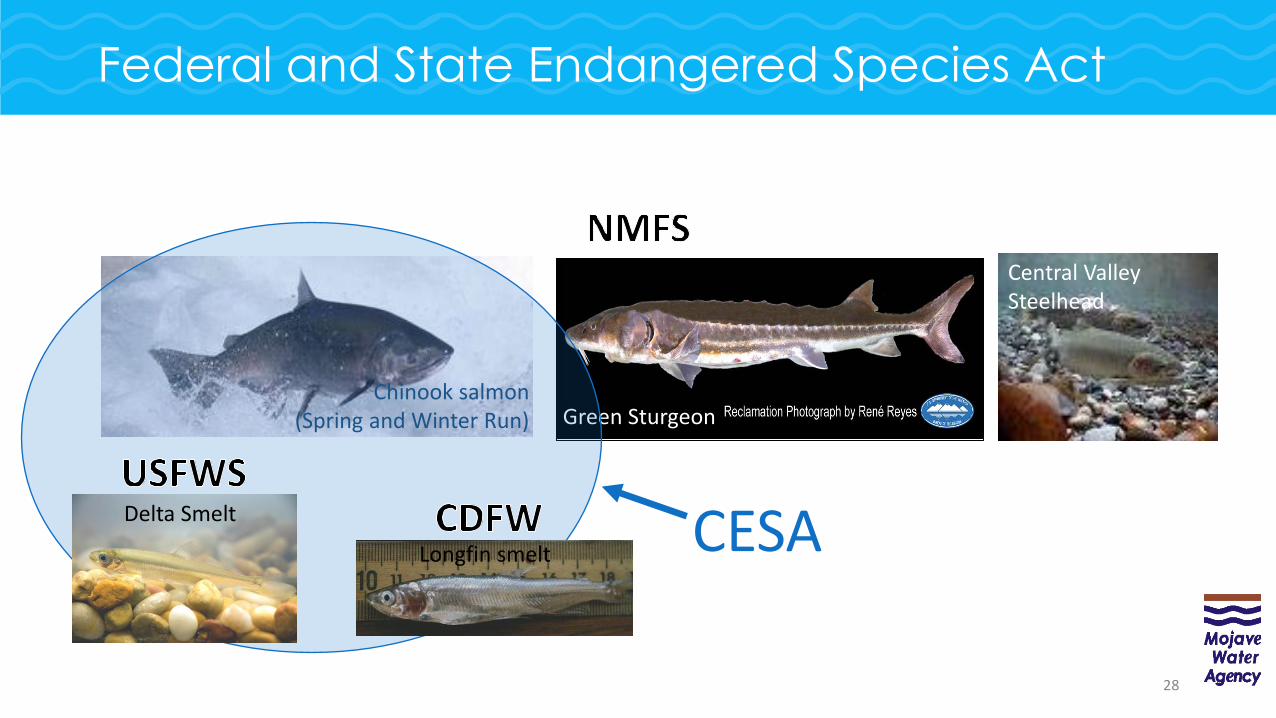
Federal and State Endangered Species Act
28
Chinook salmon(Spring and Winter Run)
Central Valley Steelhead
Green Sturgeon
CESADelta Smelt
Longfin smelt
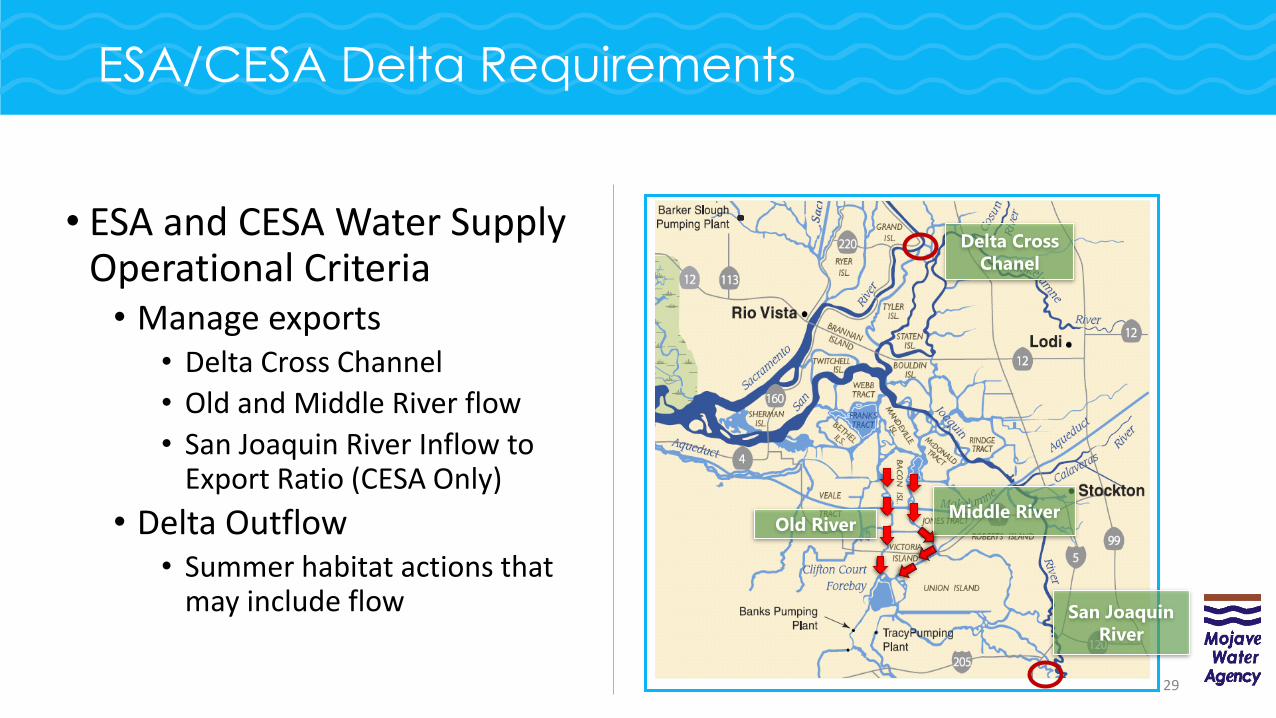
• ESA and CESA Water Supply Operational Criteria• Manage exports
• Delta Cross Channel
• Old and Middle River flow
• San Joaquin River Inflow to Export Ratio (CESA Only)
• Delta Outflow• Summer habitat actions that
may include flow
ESA/CESA Delta Requirements
29
Old RiverMiddle River
Delta Cross
Chanel
San Joaquin
River
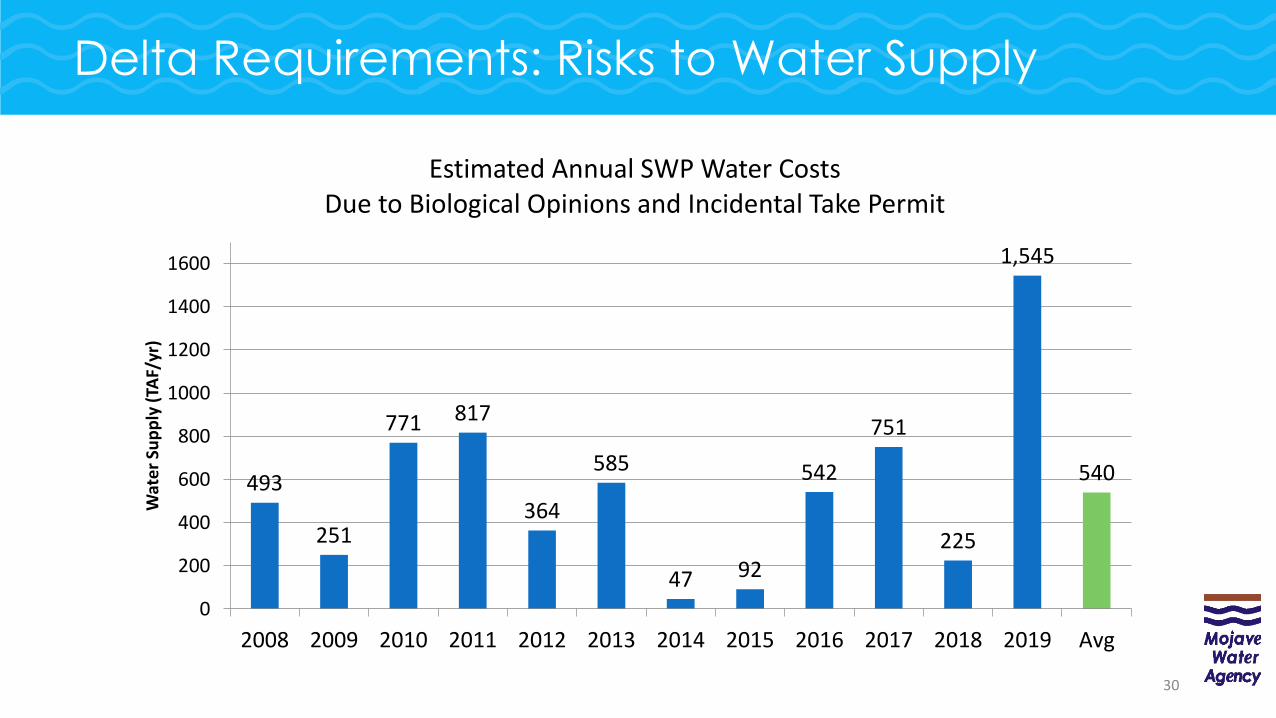
Delta Requirements: Risks to Water Supply
493
251
771 817
364
585
47 92
542
751
225
1,545
540
0
200
400
600
800
1000
1200
1400
1600
2008 2009 2010 2011 2012 2013 2014 2015 2016 2017 2018 2019 Avg
Wat
er
Sup
ply
(TA
F/yr
)Estimated Annual SWP Water Costs
Due to Biological Opinions and Incidental Take Permit
30
SWP Delivery Capability
• SWP Delivery Capability• Long-term expected SWP water supply allocation over range of hydrology
• Delivery Capability Report• Provides information about the key factors affecting the operation of the SWP
• Evaluates long-term capability as a source of water for beneficial use
• Meets the requirements of Attachment B to the Monterey Plus Settlement Agreement of May 2003
• Evaluation of SWP delivery capability• Assumes static land use, infrastructure, and regulations
• Evaluates over historical 82-year hydrologic sequence
31
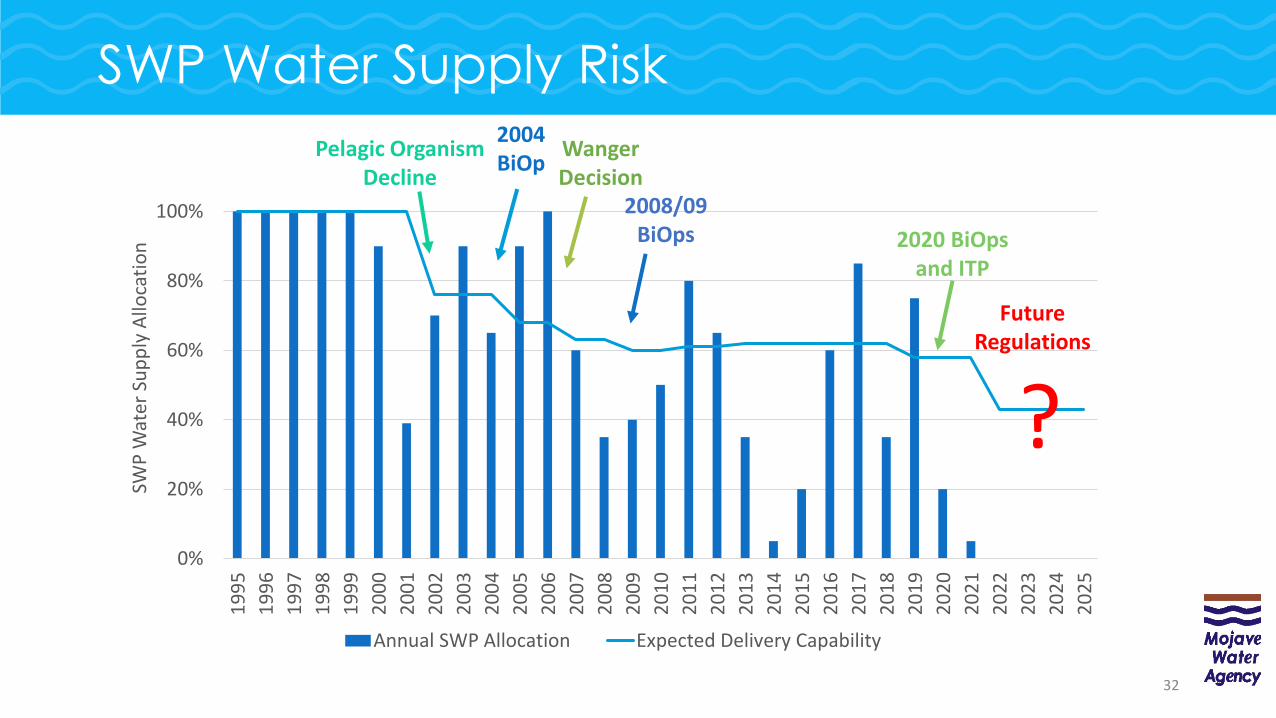
SWP Water Supply Risk
32
0%
20%
40%
60%
80%
100%
19
95
19
96
19
97
19
98
19
99
20
00
20
01
20
02
20
03
20
04
20
05
20
06
20
07
20
08
20
09
20
10
20
11
20
12
20
13
20
14
20
15
20
16
20
17
20
18
20
19
20
20
20
21
20
22
20
23
20
24
20
25
SWP
Wat
er S
up
ply
Allo
cati
on
Annual SWP Allocation Expected Delivery Capability
Pelagic Organism Decline
Wanger Decision
2008/09 BiOps 2020 BiOps
and ITP
Future Regulations
?
2004 BiOp
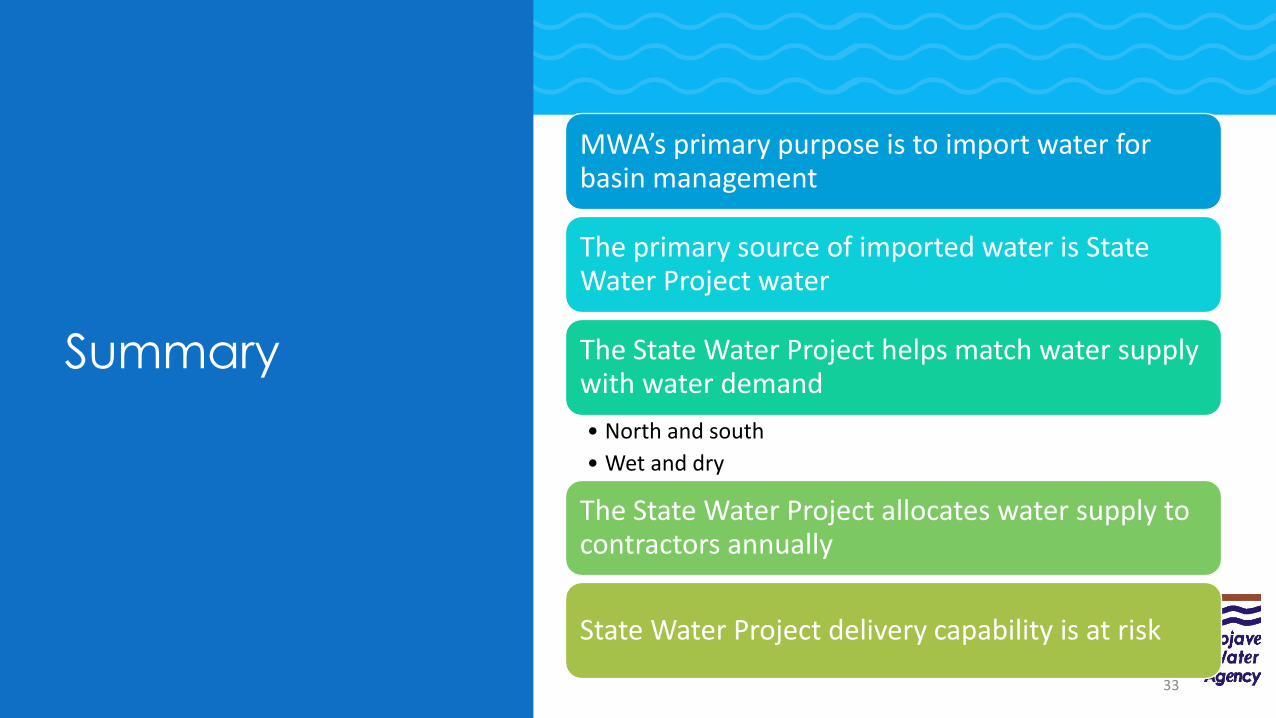
Summary
33
MWA’s primary purpose is to import water for basin management
The primary source of imported water is State Water Project water
The State Water Project helps match water supply with water demand
• North and south
• Wet and dry
The State Water Project allocates water supply to contractors annually
State Water Project delivery capability is at risk
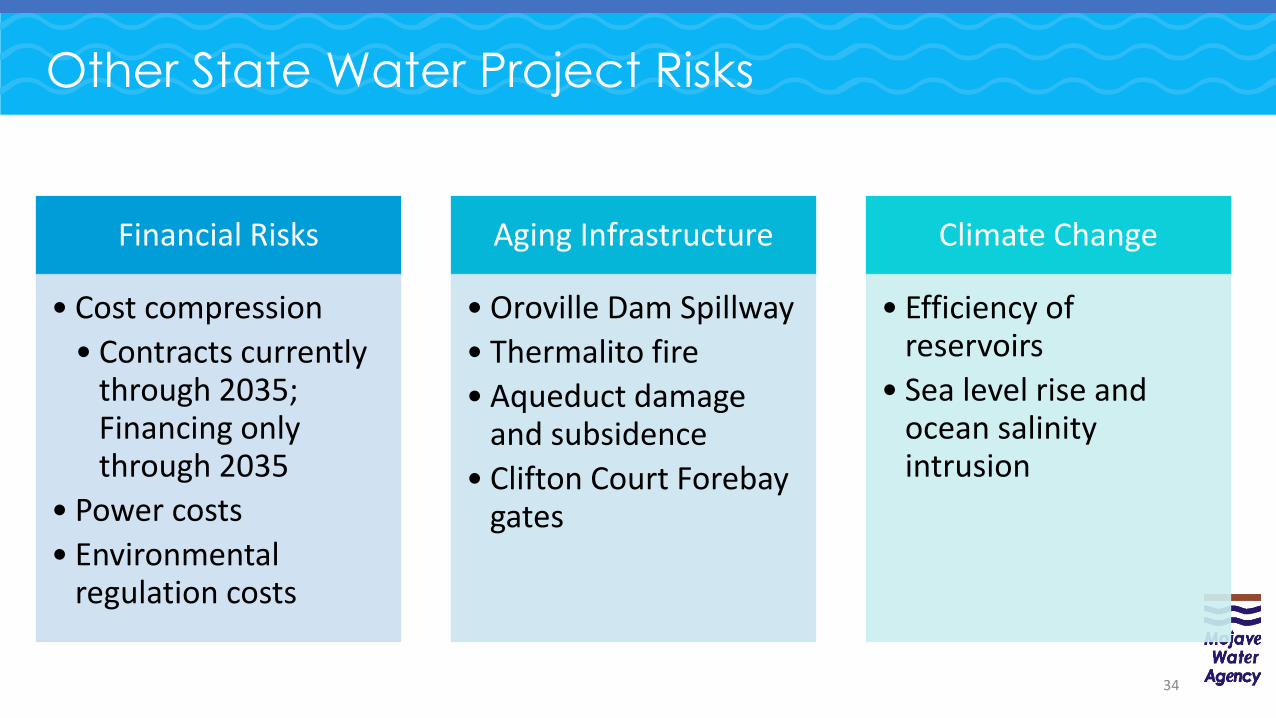
Other State Water Project Risks
34
Financial Risks
• Cost compression
• Contracts currently through 2035; Financing only through 2035
• Power costs
• Environmental regulation costs
Aging Infrastructure
• Oroville Dam Spillway
• Thermalito fire
• Aqueduct damage and subsidence
• Clifton Court Forebay gates
Climate Change
• Efficiency of reservoirs
• Sea level rise and ocean salinity intrusion
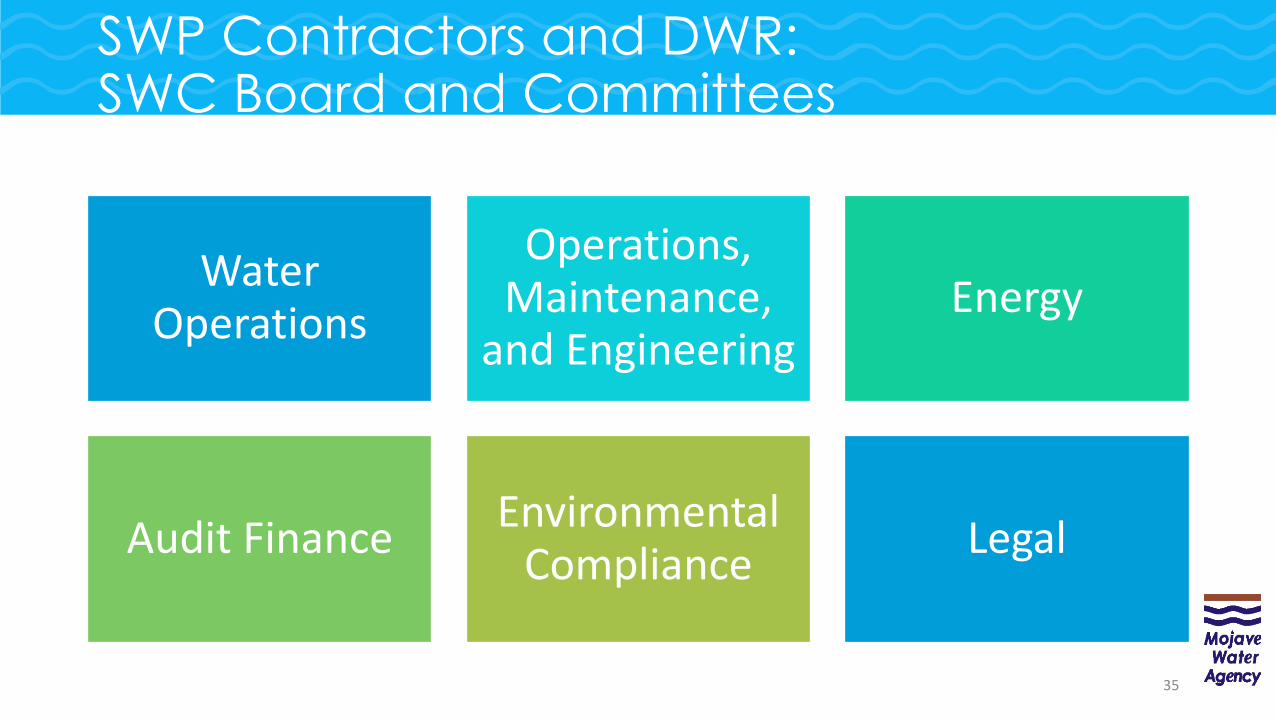
SWP Contractors and DWR:SWC Board and Committees
35
Water Operations
Operations, Maintenance,
and EngineeringEnergy
Audit FinanceEnvironmental
ComplianceLegal
PRESENTATION SERIES
PART 1
Why do we
import
water?
1 2 3 4 5
PART 2
Imported
Water from
the SWP
PART 3
Factors Affecting
Sustainability:
Risks
PART 5
Long-term
Planning for
Sustainability
PART 4
Factors Affecting
Sustainability:
Potential Solutions
36
Questions?
37