Embed Size (px)
Citation preview
MVP: a model to simulate the spatial patterns of photosynthetically active radiation under discrete
forest canopies
Conghe Song and Lawrence E. Band
Presented by Dahl WintersGeog 595, February 12, 2007
Outline
Introduction – why modeling the spatial variance of PAR is important
Background – other models for calculating PAR on the forest floor, and why MVP is needed
Model Description – the equations used to create the MVP model, which simulates the mean and variance of PAR
Model Validation – testing MVP with BOREAS data to see if the model works as it should
Model Simulation – running the model using stand data generated by ZELIG, an individual-based model
Conclusion
Introduction
The spatial pattern of PAR on the forest floor, not just the total amount, is a critical determinant to numerous forest ecosystem processes.
Crown size and shape, stem density, and tree spatial arrangement all determine the forest floor light regime.
Despite the importance of the spatial variation of PAR, simulation of PAR transmittance through plant canopies is primarily based on Beer’s law, which assumes horizontal homogeneity of leaves throughout the canopy.
This assumption usually leads to overestimation of absorbed PAR by the canopy, and thus an underestimation of PAR on the forest floor.
Introduction
To improve the measurement of LAI using Beer’s law, a foliage clumping index can be added. Problems:
- it only reduces the effective LAI to allow more PAR to pass through. This accounts for canopy gaps to a limited extent; in actuality, gap fractions vary continuously with solar zenith angle.
- a clumping index does not improve characterizations of spatial variations of PAR; horizontal homogeneity assumption of Beer’s law remains
Accounting for the effects of gaps in the forest canopy is key to an improved simulation of both the mean and variance of PAR (MVP) under a forest canopy.
Objective: to develop a simple and computationally efficient model to simulate MVP under forest canopies over different durations, for use in ecological models, with explicit consideration of the effects of between-crown gaps on the spatial patterns of PAR.
Background
Several model types are available for simulating photon transport through plant canopies:
Classical canopy radiative transfer model – based on theory of radiative transfer through the atmosphere; leaves assumed to be infinitesimally small and uniformly distributed throughout the canopy; light intensity varies only vertically (a 1D model)
- Beer’s law the simplest version of such a model
Modified 1D canopy radiative transfer model – clumping indices, separating canopy into vertical layers and accounting for leaf angle distribution; segregating canopy gaps and treating them separately
3D radiative transfer models – represent canopies by 3D cells; represents leaf clumpiness in canopies well, but numerically solved and thus too computationally intensive
Background
Models based on the geometric optical theory can also account for canopy discontinuities:
- Li-Strahler the most popular; considers canopy as 3D assemblage of structures with prespecified shape. Describes single scattering of photons.
- Hybrid geometric radiative transfer model (GORT) – characterizes multiple scattering, but too complicated to be used in ecological models and does not account for spatial variation in PAR.
- Need a model that is like GORT, but accounts for spatial variation in PAR and is computationally effective enough for use in ecological models.
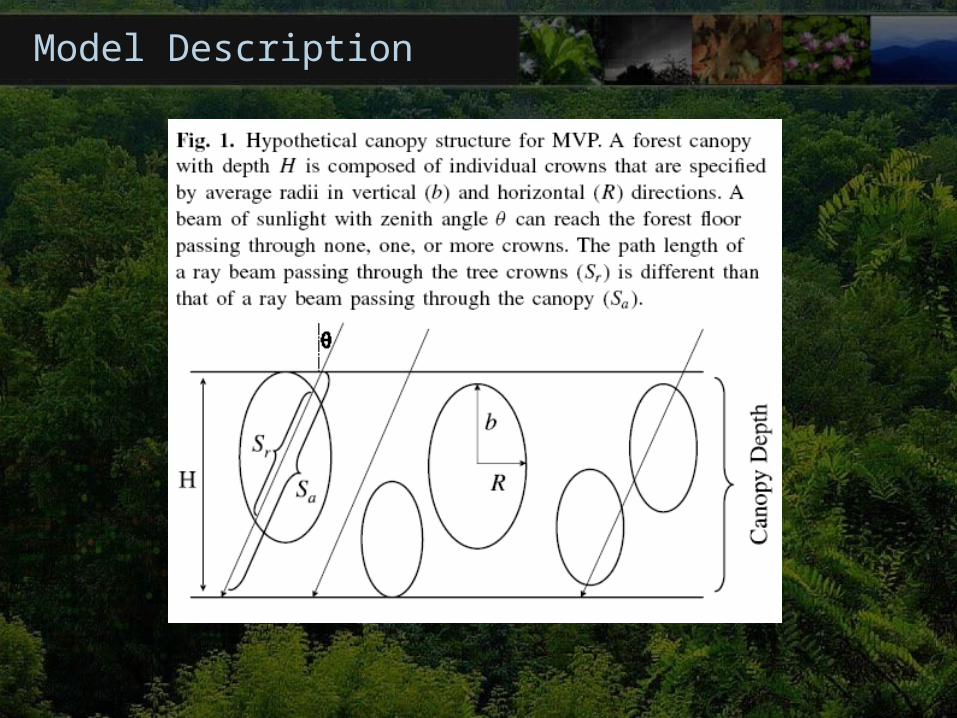
Model Description
MVP is developed on the basis of GORT (geometric optical-radiative transfer) by Li et al. (1995). It simplifies for multiple scattering of PAR, so it is only useful at visible wavelengths where the leaf single-scattering albedo is low.
The purpose of MVP is to simulate understory mean and variation of PAR for both instantaneous and accumulated time steps from hours up to a day by accounting for the gaps in the canopy.
The model can be easily modified to simulate canopy interception of PAR. Thus, MVP holds the potential to be used by ecological models for both the canopy-intercepted PAR and the spatial patterns of PAR for a forest stand.
Model Description
Model Description
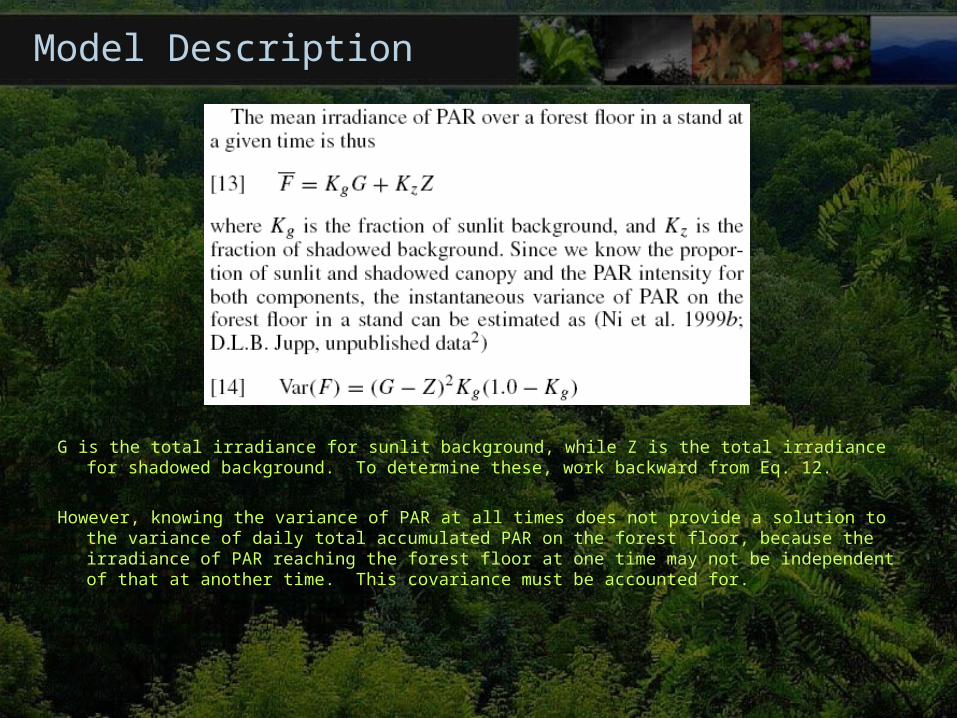
G is the total irradiance for sunlit background, while Z is the total irradiance for shadowed background. To determine these, work backward from Eq. 12.
However, knowing the variance of PAR at all times does not provide a solution to the variance of daily total accumulated PAR on the forest floor, because the irradiance of PAR reaching the forest floor at one time may not be independent of that at another time. This covariance must be accounted for.
Model Description
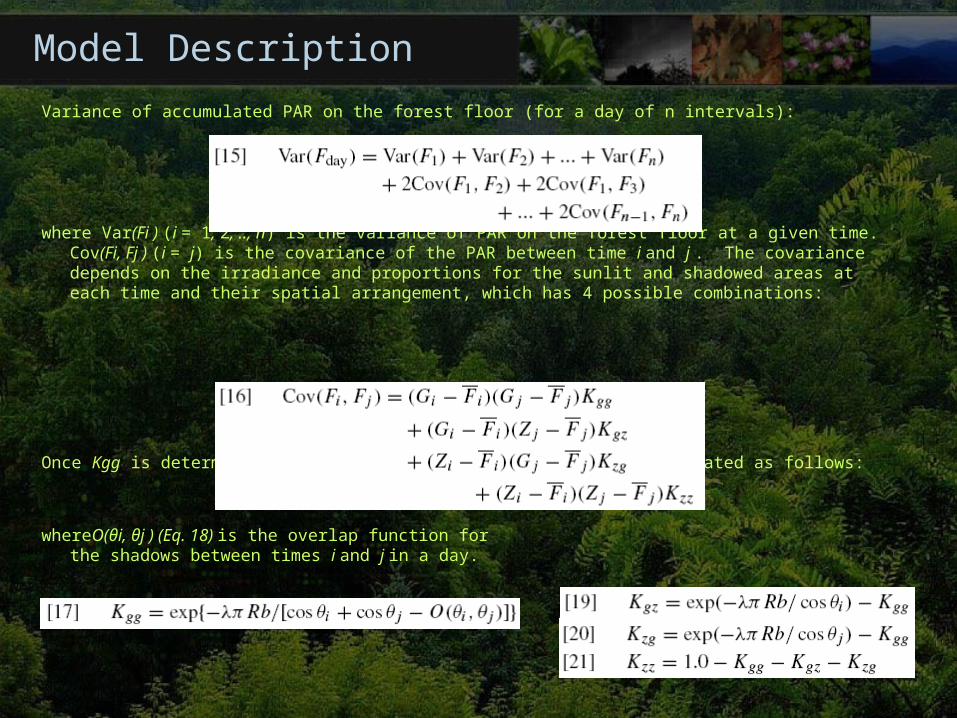
Variance of accumulated PAR on the forest floor (for a day of n intervals):
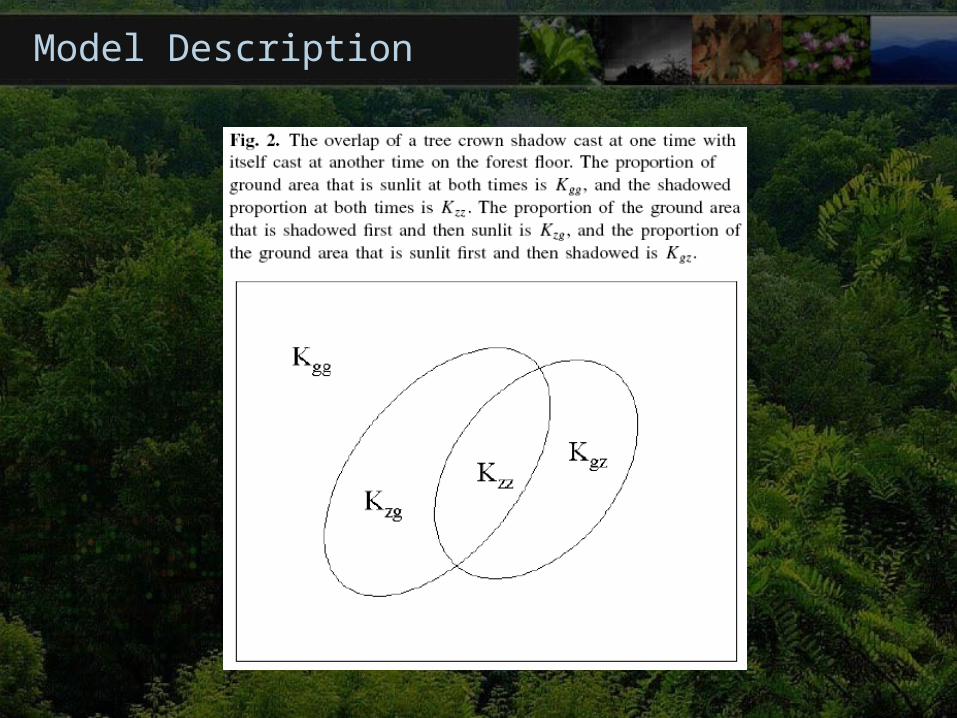
where Var(Fi ) (i = 1, 2, .., n) is the variance of PAR on the forest floor at a given time. Cov(Fi, Fj ) (i = j) is the covariance of the PAR between time i and j . The covariance depends on the irradiance and proportions for the sunlit and shadowed areas at each time and their spatial arrangement, which has 4 possible combinations:
Once Kgg is determined, the other three combinations can be calculated as follows:
whereO(θi, θj ) (Eq. 18) is the overlap function for the shadows between times i and j in a day.
Model Description
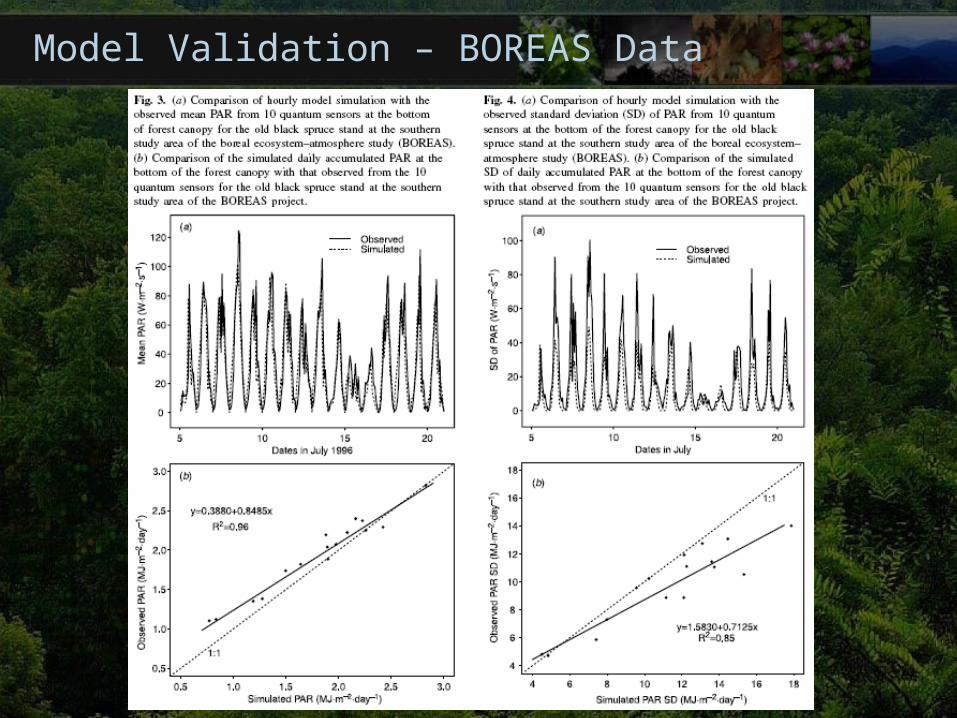
Model Validation – BOREAS Data
Model Validation
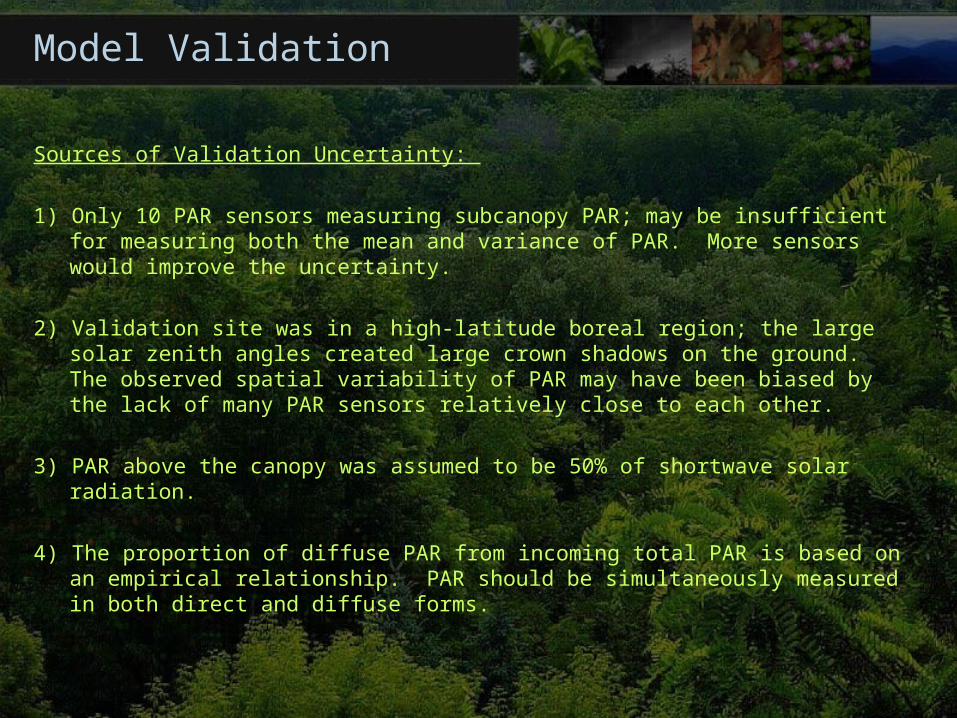
Sources of Validation Uncertainty:
1) Only 10 PAR sensors measuring subcanopy PAR; may be insufficient for measuring both the mean and variance of PAR. More sensors would improve the uncertainty.
2) Validation site was in a high-latitude boreal region; the large solar zenith angles created large crown shadows on the ground. The observed spatial variability of PAR may have been biased by the lack of many PAR sensors relatively close to each other.
3) PAR above the canopy was assumed to be 50% of shortwave solar radiation.
4) The proportion of diffuse PAR from incoming total PAR is based on an empirical relationship. PAR should be simultaneously measured in both direct and diffuse forms.
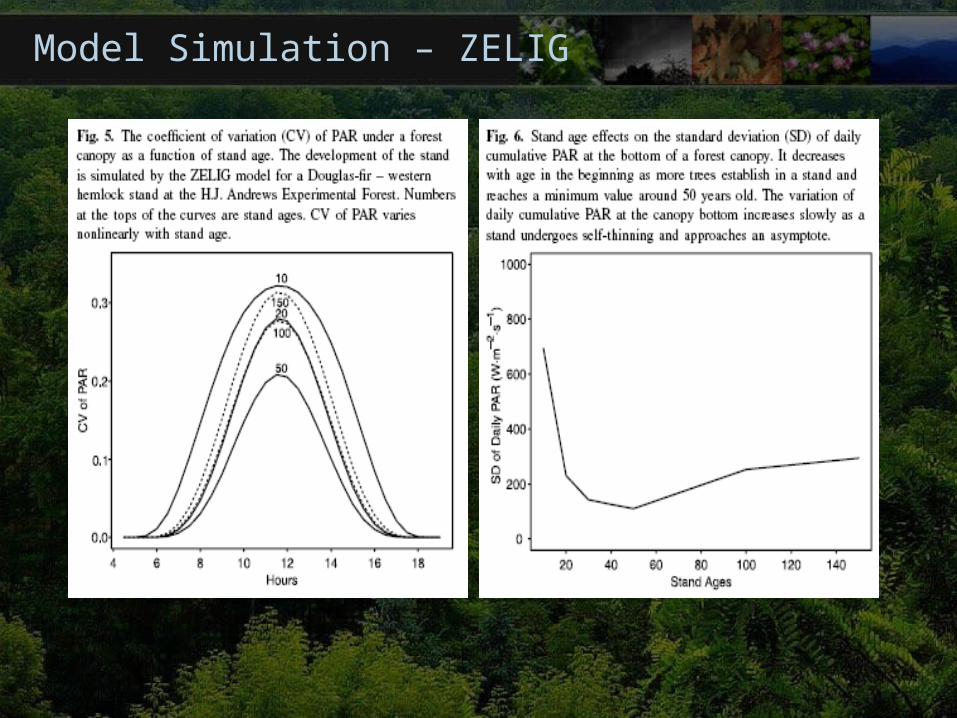
Model Simulation – ZELIG
Model Simulation
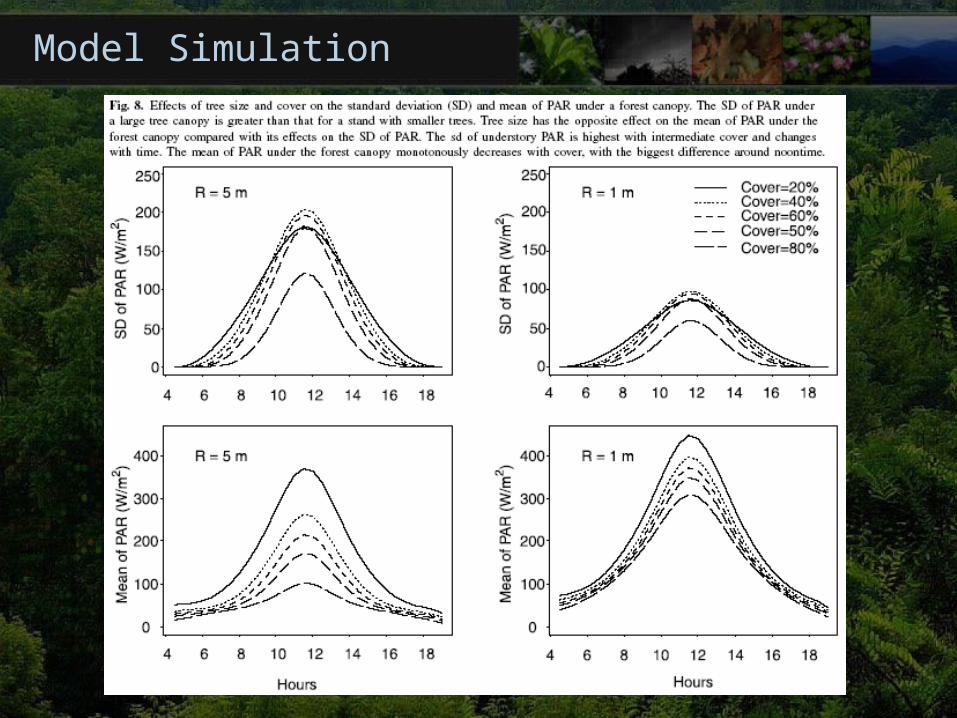
Model Simulation
Model Simulation
Conclusions
Study developed a simple and computationally efficient model (MVP) to simulate the mean and variation of PAR under a stand-scale forest canopy.
MVP can be adapted by other ecological models to improve their performance, such as in predicting understory species replacement dynamics and seedling growth.
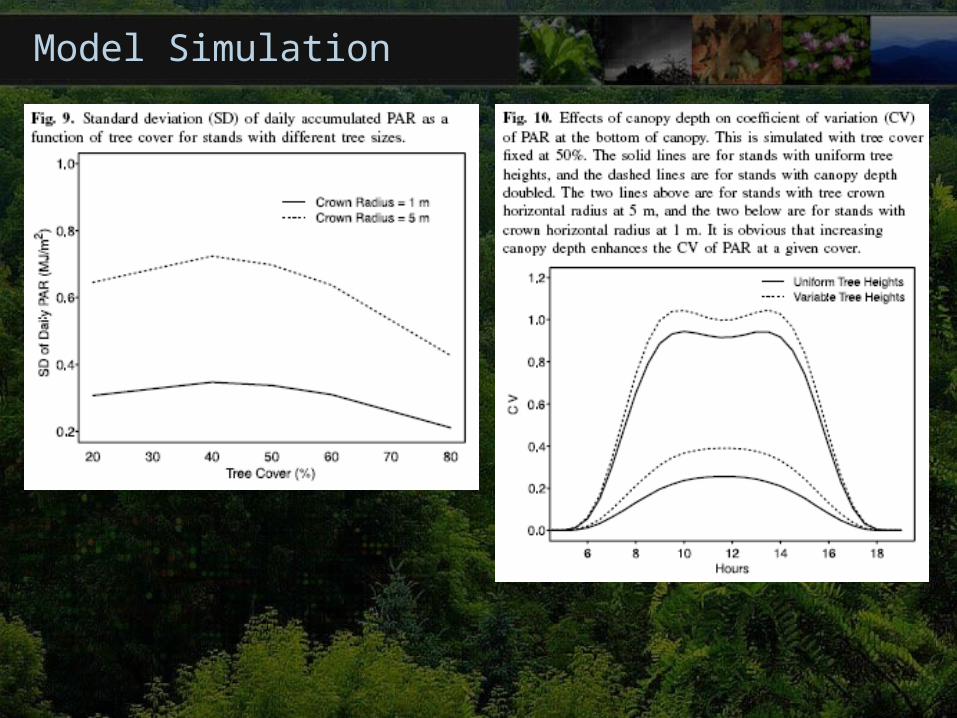
Simulated CV of PAR under a forest canopy varies nonlinearly with stand ages.
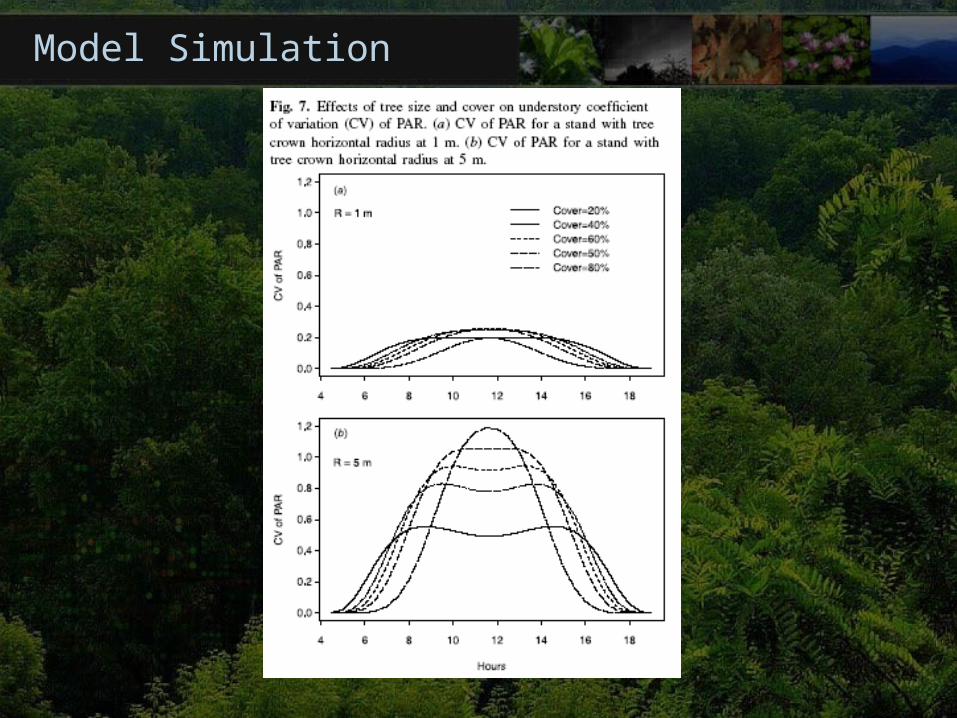
Understory CV of PAR is determined by canopy structure (tree size, cover, and canopy depth).
CV of PAR is much more sensitive to cover change when trees are larger; a deeper canopy leads to larger CV of PAR at fixed tree cover.
Validation of MVP with observed BOREAS data shows some overestimation of accumulated subcanopy variance, but shows reasonably good model performance in simulating the mean and variation of PAR.