Embed Size (px)
Citation preview
J. Chem. Thermodynamics 59 (2013) 35–42
Contents lists available at SciVerse ScienceDirect
J. Chem. Thermodynamics
journal homepage: www.elsevier .com/locate / jc t
Mutual influence of cetyltrimethylammonium bromide and Triton X-100 ontheir adsorption at the water–air interface
Katarzyna Szymczyk, Anna Zdziennicka ⇑, Joanna Krawczyk, Bronisław JanczukDepartment of Interfacial Phenomena, Faculty of Chemistry, Maria Curie-Skłodowska University, Maria Curie-Skłodowska Sq. 3, 20-031 Lublin, Poland
a r t i c l e i n f o
Article history:Received 1 October 2012Received in revised form 29 November 2012Accepted 8 December 2012Available online 19 December 2012
Keywords:Nonionic surfactantCationic surfactantSurface excess concentrationStandard Gibbs free energy of adsorption
0021-9614/$ - see front matter � 2012 Elsevier Ltd. Ahttp://dx.doi.org/10.1016/j.jct.2012.12.004
⇑ Corresponding author. Tel.: +48 81 537 56 70; faxE-mail address: [email protected] (A. Zd
a b s t r a c t
On the basis of surface tension values of the aqueous solution of cetyltrimethylammonium bromide(CTAB) and Triton X-100 (TX-100) mixtures measured at 293 K as a function of CTAB or TX-100 concen-tration at constant TX-100 or CTAB concentration, respectively, the real surface area occupied by thesesurfactants at the water–air interface was established which is inaccessible in the literature. It appearedthat at the concentration of the CTAB and TX-100 mixture in the bulk phase corresponding to the unsat-urated monolayer at the water air-interface this area is the same as in the monolayer formed by the singlesurfactant at the same concentration as in the mixture. In the saturated mixed monolayer at this interfacethe area occupied by both surfactants is lower than that in the single surfactant monolayer correspondingto the same concentration in the aqueous solution. However, the decrease of the CTAB adsorption is lowerthan that of TX-100 and the total area occupied by the mixture of surfactants is also lower than that of thesingle one. The area of particular surfactants in the mixed saturated monolayer changes as a function ofTX-100 and CTAB mixture concentration and at the concentrations close to CMC or higher the area occu-pied by both surfactants is the same. The changes of the composition of the mixed surface monolayer areconnected with the synergetic effect in the reduction of the water surface tension by the adsorption ofCTAB and TX-100 at the water–air interface. This effect was confirmed by the values of the standard Gibbsfree energy of adsorption of both individual surfactants and their mixtures with different compositions inthe bulk phase determined by using the Langmuir equation if RT instead of nRT was applied in thisequation.
� 2012 Elsevier Ltd. All rights reserved.
1. Introduction
The adsorption of surfactants at the water–air interface controlsthe dynamic behaviour of many important systems [1,2]. The sur-factants adsorption influences the stability of foams, droplet size injets and sprays, spreading of drops on solid surfaces and smoothcoating of multiple layers [3]. In this regard, for many cases, theaddition of the individual surfactants is not sufficient to reducethe water surface tension by their adsorption at the water–airinterface to a value guaranteeing its usefulness for practical appli-cation and this property must be reached on a desired level by theaddition of mixture of different surfactants [4]. Mixtures of two ormore different types of surfactants often show a synergisticinteraction, i.e. the interfacial properties of the mixture are morepronounced than those of the individual components [1,4–9].
A study of the adsorption of the individual surface activecomponents in the mixture and the interaction between them af-fords understanding of the role of each component and makes
ll rights reserved.
: +48 81 533 3348.ziennicka).
the selection of components for optimal properties in a rationalsystematic manner possible.
When the absolute concentration of the surfactants at the inter-face is not required, but only their relative concentration, i.e. theirrelative effectiveness of adsorption, then this can be determined ina convenient fashion from the Rosen and Hua equations derived onthe basis of the non-ideal solution theory [1,10,11].
In the literature it is possible to find many studies dealing withthe adsorption behaviour of mixed monolayers at the water–airinterface on the basis of these equations [1,5,6,10–16]. However,the data of the relative concentration determined from the Rosenand Hua equations allow us only to compare the composition ofthe surfactant mixture in the surface layer to that in the bulkphase. These equations do not give the possibility to compare theconcentration of each surfactant in the mixed monolayer with itstendency to adsorb at the water–air interface in the absence ofthe other one. For such comparison many measurements of thesurface tension of aqueous solutions of surfactants mixture mustbe made establishing the constant concentration of one surfactantand changing the concentration of the other at a given tempera-ture. The results obtained in this way should be more adequatefor the explanation of the synergetic effect of the surfactant
36 K. Szymczyk et al. / J. Chem. Thermodynamics 59 (2013) 35–42
mixture in the reduction of the water surface tension, but in liter-ature it is difficult to find such results even for the mixture ofcetyltrimethylammonium bromide (CTAB) and p-(1,1,3,3-tetra-methylbutyl) phenoxypoly(ethylene glycol) Triton X-100, TX-100.In our previous studies [6] the relative concentration of TX-100and CTAB was determined in the mixed monolayer at the water–air interface on the basis of the Rosen and Hua equations [4,10].
It was shown that there is synergism in the reduction of watersurface tension by the mixture of CTAB and TX-100 including0.2 mole fraction of CTAB in the bulk phase. It was also found thatthe mole fraction of TX-100 in the mixed monolayer is higher thanin the bulk phase for each composition of the studied mixture.However, the relative composition of TX-100 and CTAB mixturedoes not give the real value of the area occupied by each surfactantand does not inform in which degree the adsorption of TX-100 andCTAB is changed in comparison to their adsorption from singlesolution. In the literature it is also impossible to find such informa-tion. This can be obtained from the data of the measurements ofthe surface tension of aqueous solutions of TX-100 and CTAB mix-tures at constant CTAB or TX-100 concentration in the concentra-tion range of the surfactants corresponding to the unsaturated,saturated monolayers at the water–air interface and CMC or higherconcentrations. These data also allowed us to establish the mutualinfluence of the surfactants on the Gibbs surface free energy beingthe measure of the surfactant tendency to adsorb at the water–airinterface. The Gibbs surface free energy of adsorption of such mix-tures has not been precisely established so far. In the studies,which can be found in the literature [6] only the tendency to ad-sorb the mixture at the water–air interface in comparison to thesingle one was considered and it was not related to the coverageof the water–air interface by particular surfactants. On the otherhand, the investigators used different ways for the standard Gibbsfree energy of adsorption determination. So, it was impossible todraw univocal conclusions referring to the efficiency of the givensurfactants to adsorb at the water–air interface. Therefore the mea-surements of the surface tension of the aqueous solutions of CTABand TX-100 mixtures under the above mentioned conditions wereperformed. The range of the TX-100 and CTAB concentrations wasthe same as in their mixtures including the mole fraction of CTABin the bulk phase equal to 0.2, 0.4, 0.6, and 0.8 [6] and the total con-centration of these mixtures changing from zero to that corre-sponding to the constant minimal value of the surface tension oftheir aqueous solutions. The obtained results were compared tothose of the individual surfactants as well as used for the determi-nation of the activity of the surfactants in the mixed monolayer atthe water–air interface and the correlation between the composi-tion of this monolayer and the standard Gibbs free energy ofadsorption.
2. Experimental
2.1. Materials
Doubly distilled and deionized water (Destamat Bi18E) wasused for solutions preparation.
p-(1,1,3,3-tetramethylbutyl)-phenoxypolyoxyethylene glycol,Triton X-100 (TX-100) was used without further purification.Cetyltrimethylammonium bromide (CTAB) before application was
TABLE 1Compounds used in this study with their empirical formula, molar mass (Mr), source (S =
Compound Formula Mr/g mol�1
CTAB C19H42BrN 364.46TX-100 C14H21(CH2CH2O)10OH 646.80
purified by the method described in the literature [17] (table 1).All the aqueous solutions of CTAB and TX-100 mixture at a givenconcentration and composition lower than 1 mM were preparedfrom the stock solution (1 mM). Then from it the solutions in theconcentration range from 1 � 10�4 M to 1 � 10�3 M were prepared.Next from the solution at the concentration equal to 1 � 10�4 Mthe solutions in the concentration range from 1 � 10�5 M to1 � 10�4 M were prepared and so on. The stock solution and thoseat the concentration higher than 1 mM were prepared by massusing an analytical balance (model XA105, Mettler-Toledo) withthe error ±0.01 mg. The standard uncertainties (u(C)) changed from1.5 � 10�12 to 1.5 � 10�7 and from 1.3 � 10�12 to 1.3 � 10�7 M forCTAB and TX-100, respectively in the range of the studiedconcentration.
2.2. Measurements
The surface tension of the aqueous solutions of the above men-tioned surfactant mixtures was measured at 293 K by a Krüss K9tensiometer according to the platinum ring tensiometer method(du Nouy’s method). Krüss K9 tensiometer calibrated especiallyby taking into account the local earth’s gravitational accelerationallows to measure the surface tension both without and withcorrections of the obtained values programmed according to theprocedure of Harkins and Jordan [18]. The ring was cleaned withdistilled water and heated to red colour with a Bunsen burnerbefore each measurement. In all cases more than 10 successivemeasurements were performed. The standard deviation dependingon the surfactant concentration range was from ±0.1 to ±0.2 mN/mand that of the standard uncertainties (u(c)) from 0.025 to 0.063,respectively. The temperature was controlled by a jacketed vesseljoined to the thermostatic water bath with the accuracy ±0.01 K.
3. Results and discussion
3.1. Isotherm of surface tension
The surface tension of the aqueous solutions of surfactantmixture depends on the adsorption of each mixture component,however, contribution of individual surfactants to the reductionof the water surface tension is difficult to establish in many cases.In the literature there are many approaches to predict the surfacetension of such solution based on the ideal behaviour of the surfac-tant in the bulk phase and the surface region of solution [19–22].The lack of detailed data about the surface tension of the aqueoussolutions of the surfactant mixture in the wide range of surfactantconcentrations does not make it possible to find out why there aresome deviations between the measured and calculated values ofthe surface tension of such a kind of solutions. If we assume thatthe adsorption of each surfactant in the mixture at the water–airinterface occurs independently, then the decrease of water surfacetension should be described by the following equation:
cRð12Þ ¼ cRð1Þ þ cRð2Þ � cW ; ð1Þ
where cR(12) is the surface tension of the aqueous solution of TX-100and CTAB mixture and cR(1), cR(2) and cW are the surface tension ofthe aqueous solution of CTAB, TX-100 and water, respectively.
Sigma -Aldrich, F = Fluka) and their mole fraction purity (x).
Source x Purification
S >0.98 crystallisationF >0.99 None
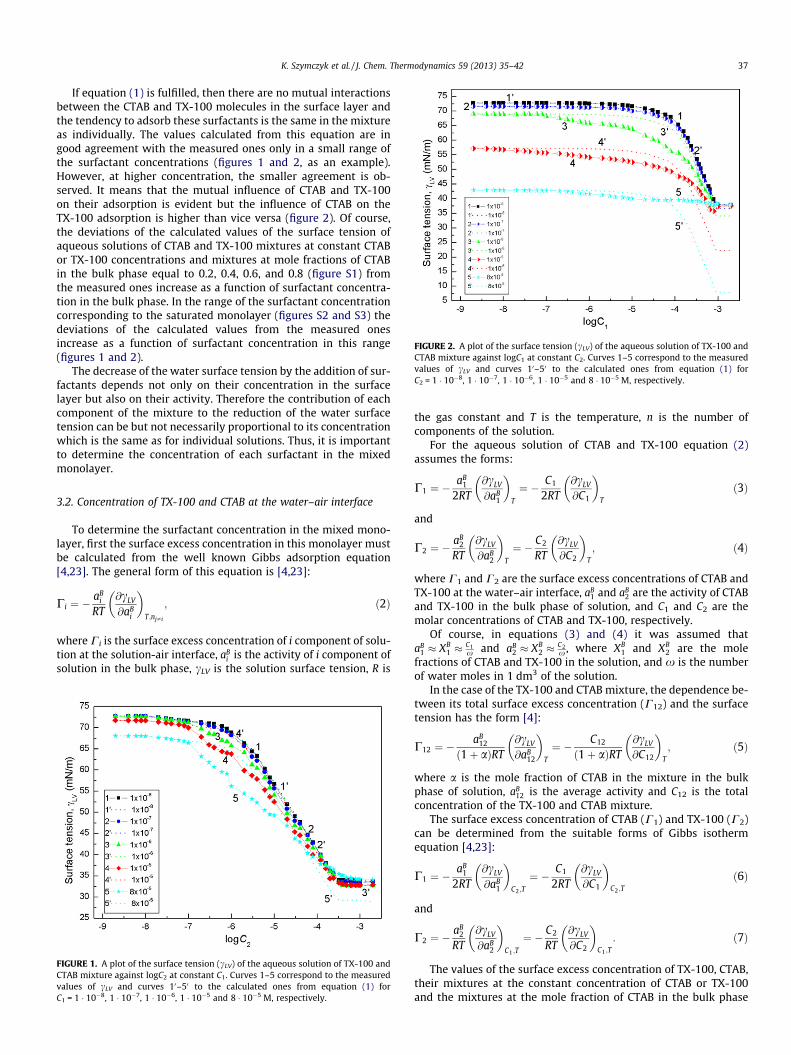
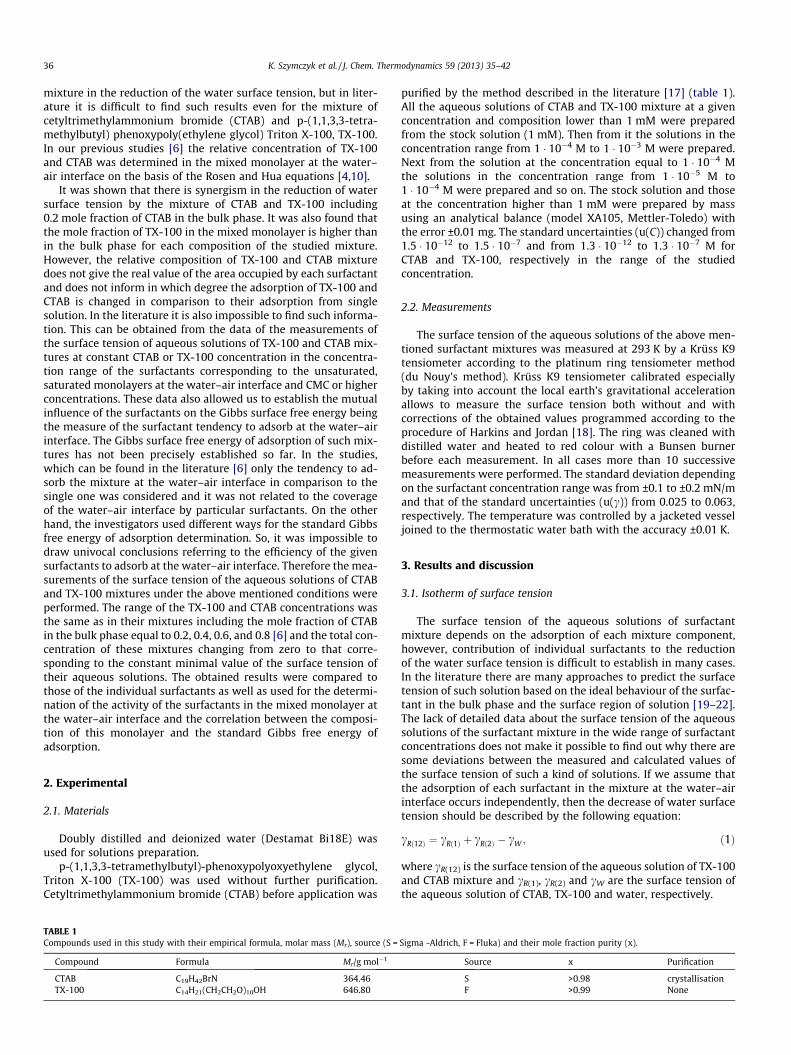
FIGURE 2. A plot of the surface tension (cLV) of the aqueous solution of TX-100 andCTAB mixture against logC1 at constant C2. Curves 1–5 correspond to the measuredvalues of cLV and curves 10–50 to the calculated ones from equation (1) forC2 = 1 � 10�8, 1 � 10�7, 1 � 10�6, 1 � 10�5 and 8 � 10�5 M, respectively.
K. Szymczyk et al. / J. Chem. Thermodynamics 59 (2013) 35–42 37
If equation (1) is fulfilled, then there are no mutual interactionsbetween the CTAB and TX-100 molecules in the surface layer andthe tendency to adsorb these surfactants is the same in the mixtureas individually. The values calculated from this equation are ingood agreement with the measured ones only in a small range ofthe surfactant concentrations (figures 1 and 2, as an example).However, at higher concentration, the smaller agreement is ob-served. It means that the mutual influence of CTAB and TX-100on their adsorption is evident but the influence of CTAB on theTX-100 adsorption is higher than vice versa (figure 2). Of course,the deviations of the calculated values of the surface tension ofaqueous solutions of CTAB and TX-100 mixtures at constant CTABor TX-100 concentrations and mixtures at mole fractions of CTABin the bulk phase equal to 0.2, 0.4, 0.6, and 0.8 (figure S1) fromthe measured ones increase as a function of surfactant concentra-tion in the bulk phase. In the range of the surfactant concentrationcorresponding to the saturated monolayer (figures S2 and S3) thedeviations of the calculated values from the measured onesincrease as a function of surfactant concentration in this range(figures 1 and 2).
The decrease of the water surface tension by the addition of sur-factants depends not only on their concentration in the surfacelayer but also on their activity. Therefore the contribution of eachcomponent of the mixture to the reduction of the water surfacetension can be but not necessarily proportional to its concentrationwhich is the same as for individual solutions. Thus, it is importantto determine the concentration of each surfactant in the mixedmonolayer.
3.2. Concentration of TX-100 and CTAB at the water–air interface
To determine the surfactant concentration in the mixed mono-layer, first the surface excess concentration in this monolayer mustbe calculated from the well known Gibbs adsorption equation[4,23]. The general form of this equation is [4,23]:
Ci ¼ �aB
i
RT@cLV
@aBi
� �T;nj–i
; ð2Þ
where Ci is the surface excess concentration of i component of solu-tion at the solution-air interface, aB
i is the activity of i component ofsolution in the bulk phase, cLV is the solution surface tension, R is
FIGURE 1. A plot of the surface tension (cLV) of the aqueous solution of TX-100 andCTAB mixture against logC2 at constant C1. Curves 1–5 correspond to the measuredvalues of cLV and curves 10–50 to the calculated ones from equation (1) forC1 = 1 � 10�8, 1 � 10�7, 1 � 10�6, 1 � 10�5 and 8 � 10�5 M, respectively.
the gas constant and T is the temperature, n is the number ofcomponents of the solution.
For the aqueous solution of CTAB and TX-100 equation (2)assumes the forms:
C1 ¼ �aB
1
2RT@cLV
@aB1
� �T
¼ � C1
2RT@cLV
@C1
� �T
ð3Þ
and
C2 ¼ �aB
2
RT@cLV
@aB2
� �T
¼ � C2
RT@cLV
@C2
� �T; ð4Þ
where C1 and C2 are the surface excess concentrations of CTAB andTX-100 at the water–air interface, aB
1 and aB2 are the activity of CTAB
and TX-100 in the bulk phase of solution, and C1 and C2 are themolar concentrations of CTAB and TX-100, respectively.
Of course, in equations (3) and (4) it was assumed thataB
1 � XB1 �
C1x and aB
2 � XB2 �
C2x , where XB
1 and XB2 are the mole
fractions of CTAB and TX-100 in the solution, and x is the numberof water moles in 1 dm3 of the solution.
In the case of the TX-100 and CTAB mixture, the dependence be-tween its total surface excess concentration (C12) and the surfacetension has the form [4]:
C12 ¼ �aB
12
ð1þ aÞRT@cLV
@aB12
� �T
¼ � C12
ð1þ aÞRT@cLV
@C12
� �T; ð5Þ
where a is the mole fraction of CTAB in the mixture in the bulkphase of solution, aB
12 is the average activity and C12 is the totalconcentration of the TX-100 and CTAB mixture.
The surface excess concentration of CTAB (C1) and TX-100 (C2)can be determined from the suitable forms of Gibbs isothermequation [4,23]:
C1 ¼ �aB
1
2RT@cLV
@aB1
� �C2 ;T
¼ � C1
2RT@cLV
@C1
� �C2 ;T
ð6Þ
and
C2 ¼ �aB
2
RT@cLV
@aB2
� �C1 ;T
¼ � C2
RT@cLV
@C2
� �C1 ;T
: ð7Þ
The values of the surface excess concentration of TX-100, CTAB,their mixtures at the constant concentration of CTAB or TX-100and the mixtures at the mole fraction of CTAB in the bulk phase
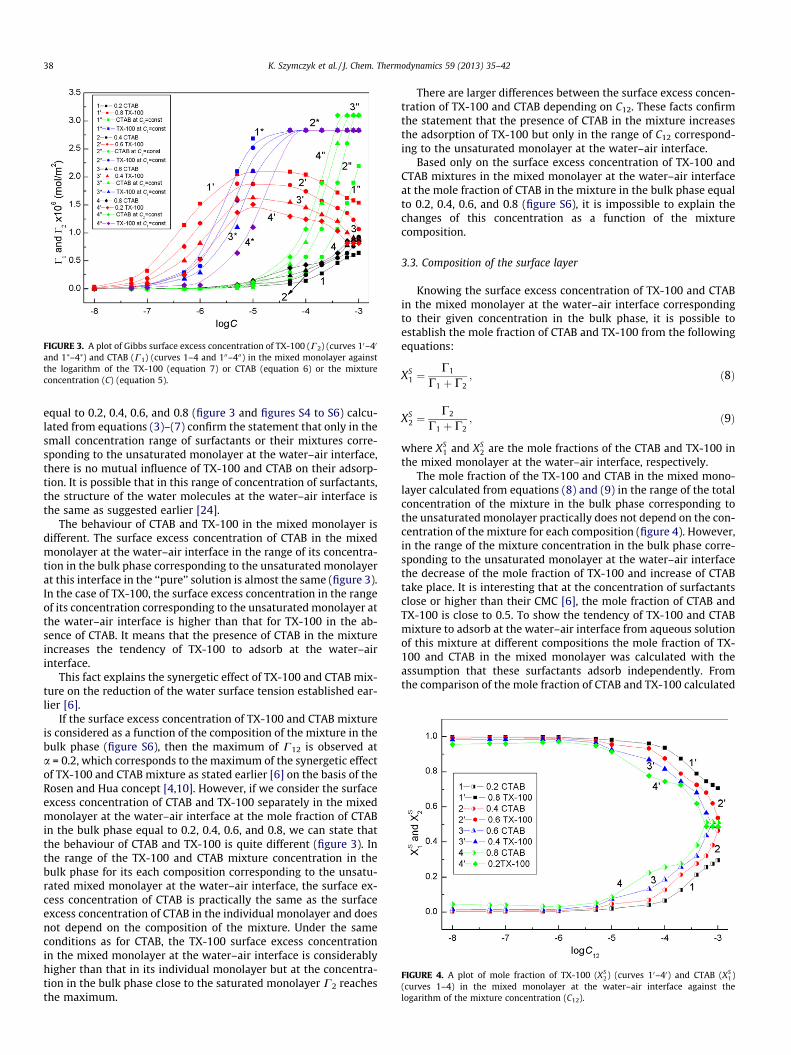
FIGURE 3. A plot of Gibbs surface excess concentration of TX-100 (C2) (curves 10–40
and 1⁄–4⁄) and CTAB (C1) (curves 1–4 and 100–400) in the mixed monolayer againstthe logarithm of the TX-100 (equation 7) or CTAB (equation 6) or the mixtureconcentration (C) (equation 5).
FIGURE 4. A plot of mole fraction of TX-100 (XS2) (curves 10–40) and CTAB (XS
1)(curves 1–4) in the mixed monolayer at the water–air interface against thelogarithm of the mixture concentration (C12).
38 K. Szymczyk et al. / J. Chem. Thermodynamics 59 (2013) 35–42
equal to 0.2, 0.4, 0.6, and 0.8 (figure 3 and figures S4 to S6) calcu-lated from equations (3)–(7) confirm the statement that only in thesmall concentration range of surfactants or their mixtures corre-sponding to the unsaturated monolayer at the water–air interface,there is no mutual influence of TX-100 and CTAB on their adsorp-tion. It is possible that in this range of concentration of surfactants,the structure of the water molecules at the water–air interface isthe same as suggested earlier [24].
The behaviour of CTAB and TX-100 in the mixed monolayer isdifferent. The surface excess concentration of CTAB in the mixedmonolayer at the water–air interface in the range of its concentra-tion in the bulk phase corresponding to the unsaturated monolayerat this interface in the ‘‘pure’’ solution is almost the same (figure 3).In the case of TX-100, the surface excess concentration in the rangeof its concentration corresponding to the unsaturated monolayer atthe water–air interface is higher than that for TX-100 in the ab-sence of CTAB. It means that the presence of CTAB in the mixtureincreases the tendency of TX-100 to adsorb at the water–airinterface.
This fact explains the synergetic effect of TX-100 and CTAB mix-ture on the reduction of the water surface tension established ear-lier [6].
If the surface excess concentration of TX-100 and CTAB mixtureis considered as a function of the composition of the mixture in thebulk phase (figure S6), then the maximum of C12 is observed ata = 0.2, which corresponds to the maximum of the synergetic effectof TX-100 and CTAB mixture as stated earlier [6] on the basis of theRosen and Hua concept [4,10]. However, if we consider the surfaceexcess concentration of CTAB and TX-100 separately in the mixedmonolayer at the water–air interface at the mole fraction of CTABin the bulk phase equal to 0.2, 0.4, 0.6, and 0.8, we can state thatthe behaviour of CTAB and TX-100 is quite different (figure 3). Inthe range of the TX-100 and CTAB mixture concentration in thebulk phase for its each composition corresponding to the unsatu-rated mixed monolayer at the water–air interface, the surface ex-cess concentration of CTAB is practically the same as the surfaceexcess concentration of CTAB in the individual monolayer and doesnot depend on the composition of the mixture. Under the sameconditions as for CTAB, the TX-100 surface excess concentrationin the mixed monolayer at the water–air interface is considerablyhigher than that in its individual monolayer but at the concentra-tion in the bulk phase close to the saturated monolayer C2 reachesthe maximum.
There are larger differences between the surface excess concen-tration of TX-100 and CTAB depending on C12. These facts confirmthe statement that the presence of CTAB in the mixture increasesthe adsorption of TX-100 but only in the range of C12 correspond-ing to the unsaturated monolayer at the water–air interface.
Based only on the surface excess concentration of TX-100 andCTAB mixtures in the mixed monolayer at the water–air interfaceat the mole fraction of CTAB in the mixture in the bulk phase equalto 0.2, 0.4, 0.6, and 0.8 (figure S6), it is impossible to explain thechanges of this concentration as a function of the mixturecomposition.
3.3. Composition of the surface layer
Knowing the surface excess concentration of TX-100 and CTABin the mixed monolayer at the water–air interface correspondingto their given concentration in the bulk phase, it is possible toestablish the mole fraction of CTAB and TX-100 from the followingequations:
XS1 ¼
C1
C1 þ C2; ð8Þ
XS2 ¼
C2
C1 þ C2; ð9Þ
where XS1 and XS
2 are the mole fractions of the CTAB and TX-100 inthe mixed monolayer at the water–air interface, respectively.
The mole fraction of the TX-100 and CTAB in the mixed mono-layer calculated from equations (8) and (9) in the range of the totalconcentration of the mixture in the bulk phase corresponding tothe unsaturated monolayer practically does not depend on the con-centration of the mixture for each composition (figure 4). However,in the range of the mixture concentration in the bulk phase corre-sponding to the unsaturated monolayer at the water–air interfacethe decrease of the mole fraction of TX-100 and increase of CTABtake place. It is interesting that at the concentration of surfactantsclose or higher than their CMC [6], the mole fraction of CTAB andTX-100 is close to 0.5. To show the tendency of TX-100 and CTABmixture to adsorb at the water–air interface from aqueous solutionof this mixture at different compositions the mole fraction of TX-100 and CTAB in the mixed monolayer was calculated with theassumption that these surfactants adsorb independently. Fromthe comparison of the mole fraction of CTAB and TX-100 calculated
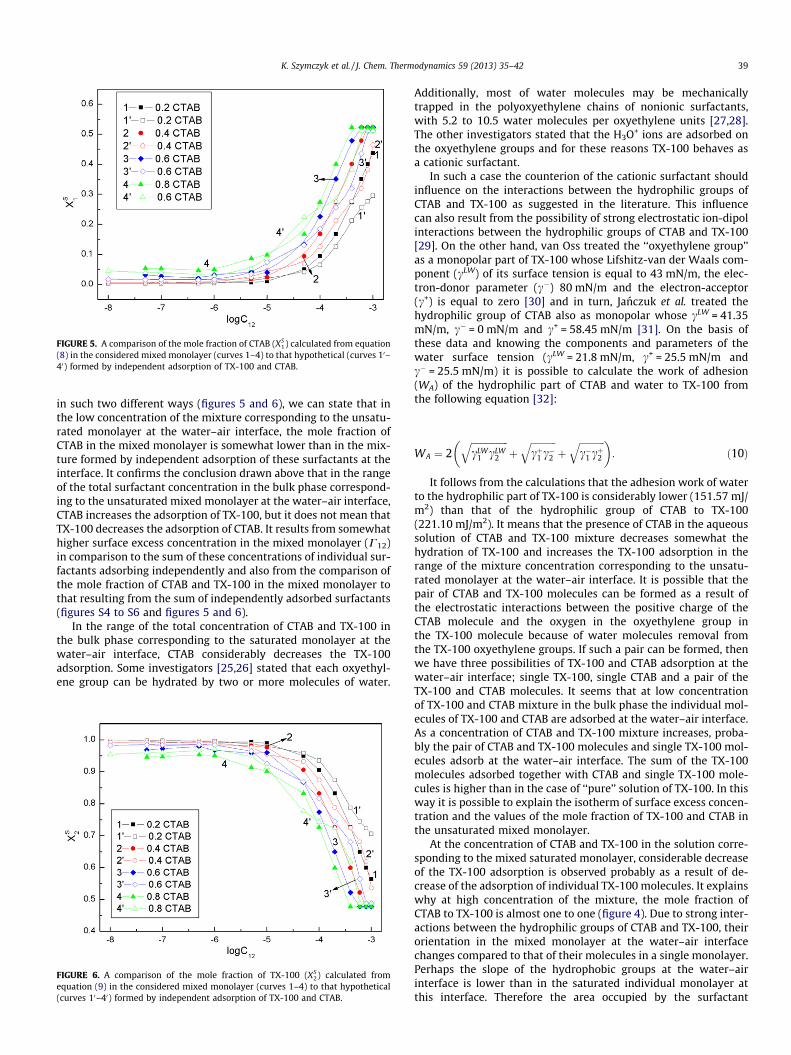
FIGURE 5. A comparison of the mole fraction of CTAB (XS1) calculated from equation
(8) in the considered mixed monolayer (curves 1–4) to that hypothetical (curves 10–40) formed by independent adsorption of TX-100 and CTAB.
K. Szymczyk et al. / J. Chem. Thermodynamics 59 (2013) 35–42 39
in such two different ways (figures 5 and 6), we can state that inthe low concentration of the mixture corresponding to the unsatu-rated monolayer at the water–air interface, the mole fraction ofCTAB in the mixed monolayer is somewhat lower than in the mix-ture formed by independent adsorption of these surfactants at theinterface. It confirms the conclusion drawn above that in the rangeof the total surfactant concentration in the bulk phase correspond-ing to the unsaturated mixed monolayer at the water–air interface,CTAB increases the adsorption of TX-100, but it does not mean thatTX-100 decreases the adsorption of CTAB. It results from somewhathigher surface excess concentration in the mixed monolayer (C12)in comparison to the sum of these concentrations of individual sur-factants adsorbing independently and also from the comparison ofthe mole fraction of CTAB and TX-100 in the mixed monolayer tothat resulting from the sum of independently adsorbed surfactants(figures S4 to S6 and figures 5 and 6).
In the range of the total concentration of CTAB and TX-100 inthe bulk phase corresponding to the saturated monolayer at thewater–air interface, CTAB considerably decreases the TX-100adsorption. Some investigators [25,26] stated that each oxyethyl-ene group can be hydrated by two or more molecules of water.
FIGURE 6. A comparison of the mole fraction of TX-100 (XS2) calculated from
equation (9) in the considered mixed monolayer (curves 1–4) to that hypothetical(curves 10–40) formed by independent adsorption of TX-100 and CTAB.
Additionally, most of water molecules may be mechanicallytrapped in the polyoxyethylene chains of nonionic surfactants,with 5.2 to 10.5 water molecules per oxyethylene units [27,28].The other investigators stated that the H3O+ ions are adsorbed onthe oxyethylene groups and for these reasons TX-100 behaves asa cationic surfactant.
In such a case the counterion of the cationic surfactant shouldinfluence on the interactions between the hydrophilic groups ofCTAB and TX-100 as suggested in the literature. This influencecan also result from the possibility of strong electrostatic ion-dipolinteractions between the hydrophilic groups of CTAB and TX-100[29]. On the other hand, van Oss treated the ‘‘oxyethylene group’’as a monopolar part of TX-100 whose Lifshitz-van der Waals com-ponent (cLW) of its surface tension is equal to 43 mN/m, the elec-tron-donor parameter (c�) 80 mN/m and the electron-acceptor(c+) is equal to zero [30] and in turn, Janczuk et al. treated thehydrophilic group of CTAB also as monopolar whose cLW = 41.35mN/m, c� = 0 mN/m and c+ = 58.45 mN/m [31]. On the basis ofthese data and knowing the components and parameters of thewater surface tension (cLW = 21.8 mN/m, c+ = 25.5 mN/m andc� = 25.5 mN/m) it is possible to calculate the work of adhesion(WA) of the hydrophilic part of CTAB and water to TX-100 fromthe following equation [32]:
WA ¼ 2ffiffiffiffiffiffiffiffiffiffiffiffiffiffiffifficLW
1 cLW2
qþ
ffiffiffiffiffiffiffiffiffiffifficþ1 c�2
qþ
ffiffiffiffiffiffiffiffiffiffiffic�1 cþ2
q� �: ð10Þ
It follows from the calculations that the adhesion work of waterto the hydrophilic part of TX-100 is considerably lower (151.57 mJ/m2) than that of the hydrophilic group of CTAB to TX-100(221.10 mJ/m2). It means that the presence of CTAB in the aqueoussolution of CTAB and TX-100 mixture decreases somewhat thehydration of TX-100 and increases the TX-100 adsorption in therange of the mixture concentration corresponding to the unsatu-rated monolayer at the water–air interface. It is possible that thepair of CTAB and TX-100 molecules can be formed as a result ofthe electrostatic interactions between the positive charge of theCTAB molecule and the oxygen in the oxyethylene group inthe TX-100 molecule because of water molecules removal fromthe TX-100 oxyethylene groups. If such a pair can be formed, thenwe have three possibilities of TX-100 and CTAB adsorption at thewater–air interface; single TX-100, single CTAB and a pair of theTX-100 and CTAB molecules. It seems that at low concentrationof TX-100 and CTAB mixture in the bulk phase the individual mol-ecules of TX-100 and CTAB are adsorbed at the water–air interface.As a concentration of CTAB and TX-100 mixture increases, proba-bly the pair of CTAB and TX-100 molecules and single TX-100 mol-ecules adsorb at the water–air interface. The sum of the TX-100molecules adsorbed together with CTAB and single TX-100 mole-cules is higher than in the case of ‘‘pure’’ solution of TX-100. In thisway it is possible to explain the isotherm of surface excess concen-tration and the values of the mole fraction of TX-100 and CTAB inthe unsaturated mixed monolayer.
At the concentration of CTAB and TX-100 in the solution corre-sponding to the mixed saturated monolayer, considerable decreaseof the TX-100 adsorption is observed probably as a result of de-crease of the adsorption of individual TX-100 molecules. It explainswhy at high concentration of the mixture, the mole fraction ofCTAB to TX-100 is almost one to one (figure 4). Due to strong inter-actions between the hydrophilic groups of CTAB and TX-100, theirorientation in the mixed monolayer at the water–air interfacechanges compared to that of their molecules in a single monolayer.Perhaps the slope of the hydrophobic groups at the water–airinterface is lower than in the saturated individual monolayer atthis interface. Therefore the area occupied by the surfactant
40 K. Szymczyk et al. / J. Chem. Thermodynamics 59 (2013) 35–42
molecules in the mixed saturated monolayer is lower than that inthe single monolayer of both surfactants.
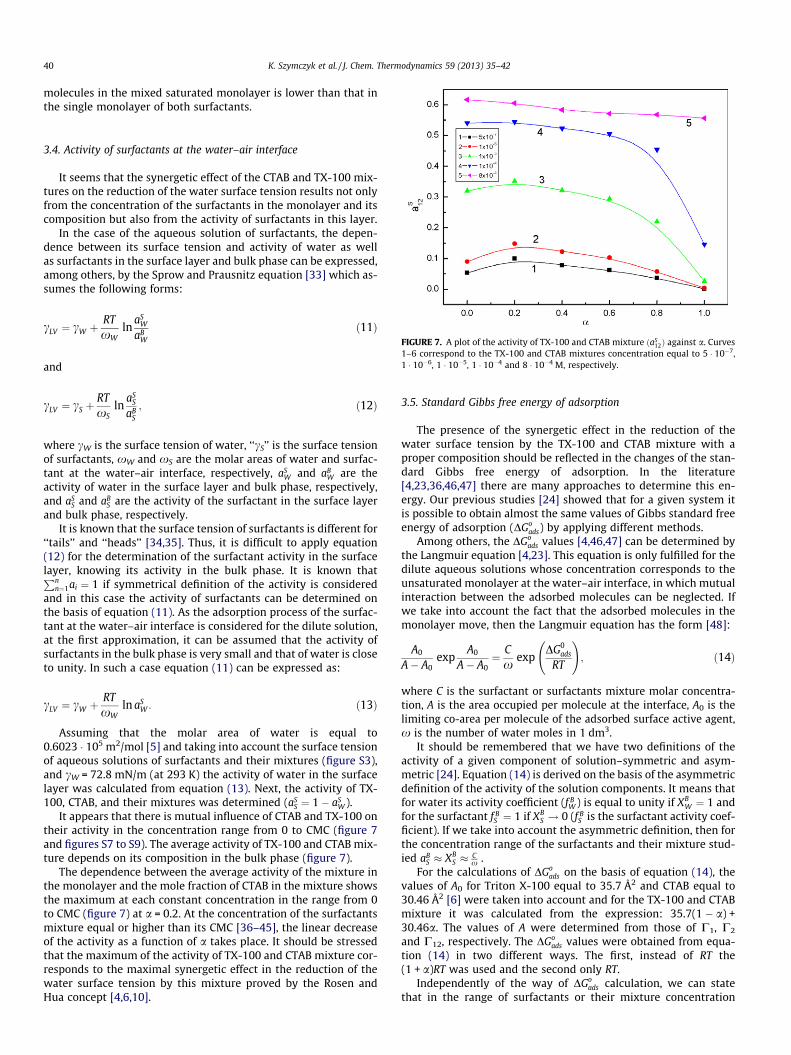
FIGURE 7. A plot of the activity of TX-100 and CTAB mixture ðaS12Þ against a. Curves
1–6 correspond to the TX-100 and CTAB mixtures concentration equal to 5 � 10�7,1 � 10�6, 1 � 10�5, 1 � 10�4 and 8 � 10�4 M, respectively.
3.4. Activity of surfactants at the water–air interface
It seems that the synergetic effect of the CTAB and TX-100 mix-tures on the reduction of the water surface tension results not onlyfrom the concentration of the surfactants in the monolayer and itscomposition but also from the activity of surfactants in this layer.
In the case of the aqueous solution of surfactants, the depen-dence between its surface tension and activity of water as wellas surfactants in the surface layer and bulk phase can be expressed,among others, by the Sprow and Prausnitz equation [33] which as-sumes the following forms:
cLV ¼ cW þRTxW
lnaS
W
aBW
ð11Þ
and
cLV ¼ cS þRTxS
lnaS
S
aBS
; ð12Þ
where cW is the surface tension of water, ‘‘cS’’ is the surface tensionof surfactants, xW and xS are the molar areas of water and surfac-tant at the water–air interface, respectively, aS
W and aBW are the
activity of water in the surface layer and bulk phase, respectively,and aS
S and aBS are the activity of the surfactant in the surface layer
and bulk phase, respectively.It is known that the surface tension of surfactants is different for
‘‘tails’’ and ‘‘heads’’ [34,35]. Thus, it is difficult to apply equation(12) for the determination of the surfactant activity in the surfacelayer, knowing its activity in the bulk phase. It is known thatPn
n¼1ai ¼ 1 if symmetrical definition of the activity is consideredand in this case the activity of surfactants can be determined onthe basis of equation (11). As the adsorption process of the surfac-tant at the water–air interface is considered for the dilute solution,at the first approximation, it can be assumed that the activity ofsurfactants in the bulk phase is very small and that of water is closeto unity. In such a case equation (11) can be expressed as:
cLV ¼ cW þRTxW
ln aSW : ð13Þ
Assuming that the molar area of water is equal to0.6023 � 105 m2/mol [5] and taking into account the surface tensionof aqueous solutions of surfactants and their mixtures (figure S3),and cW = 72.8 mN/m (at 293 K) the activity of water in the surfacelayer was calculated from equation (13). Next, the activity of TX-100, CTAB, and their mixtures was determined (aS
S ¼ 1� aSW ).
It appears that there is mutual influence of CTAB and TX-100 ontheir activity in the concentration range from 0 to CMC (figure 7and figures S7 to S9). The average activity of TX-100 and CTAB mix-ture depends on its composition in the bulk phase (figure 7).
The dependence between the average activity of the mixture inthe monolayer and the mole fraction of CTAB in the mixture showsthe maximum at each constant concentration in the range from 0to CMC (figure 7) at a = 0.2. At the concentration of the surfactantsmixture equal or higher than its CMC [36–45], the linear decreaseof the activity as a function of a takes place. It should be stressedthat the maximum of the activity of TX-100 and CTAB mixture cor-responds to the maximal synergetic effect in the reduction of thewater surface tension by this mixture proved by the Rosen andHua concept [4,6,10].
3.5. Standard Gibbs free energy of adsorption
The presence of the synergetic effect in the reduction of thewater surface tension by the TX-100 and CTAB mixture with aproper composition should be reflected in the changes of the stan-dard Gibbs free energy of adsorption. In the literature[4,23,36,46,47] there are many approaches to determine this en-ergy. Our previous studies [24] showed that for a given system itis possible to obtain almost the same values of Gibbs standard freeenergy of adsorption (DGo
ads) by applying different methods.Among others, the DGo
ads values [4,46,47] can be determined bythe Langmuir equation [4,23]. This equation is only fulfilled for thedilute aqueous solutions whose concentration corresponds to theunsaturated monolayer at the water–air interface, in which mutualinteraction between the adsorbed molecules can be neglected. Ifwe take into account the fact that the adsorbed molecules in themonolayer move, then the Langmuir equation has the form [48]:
A0
A� A0exp
A0
A� A0¼ C
xexp
DG0ads
RT
!; ð14Þ
where C is the surfactant or surfactants mixture molar concentra-tion, A is the area occupied per molecule at the interface, A0 is thelimiting co-area per molecule of the adsorbed surface active agent,x is the number of water moles in 1 dm3.
It should be remembered that we have two definitions of theactivity of a given component of solution–symmetric and asym-metric [24]. Equation (14) is derived on the basis of the asymmetricdefinition of the activity of the solution components. It means thatfor water its activity coefficient (f B
W ) is equal to unity if XBW ¼ 1 and
for the surfactant f BS ¼ 1 if XB
S ! 0 (f BS is the surfactant activity coef-
ficient). If we take into account the asymmetric definition, then forthe concentration range of the surfactants and their mixture stud-ied aB
S � XBS � C
x .For the calculations of DGo
ads on the basis of equation (14), thevalues of A0 for Triton X-100 equal to 35.7 Å2 and CTAB equal to30.46 Å2 [6] were taken into account and for the TX-100 and CTABmixture it was calculated from the expression: 35.7(1 � a) +30.46a. The values of A were determined from those of C1, C2
and C12, respectively. The DGoads values were obtained from equa-
tion (14) in two different ways. The first, instead of RT the(1 + a)RT was used and the second only RT.
Independently of the way of DGoads calculation, we can state
that in the range of surfactants or their mixture concentration
K. Szymczyk et al. / J. Chem. Thermodynamics 59 (2013) 35–42 41
corresponding to the unsaturated monolayer at the water–airinterface its values are almost constant (figures S10 to S15). Itmeans that in such a case the Langmuir equation is fulfilled. Thepresence of one surfactant in the solution at low concentrationdoes not influence on the tendency to adsorb another surfactant(figures. S11 and S12). At higher concentration the mutual influ-ence of TX-100 and CTAB adsorption at the water–air interface isevident. However, the changes of DGo
ads for CTAB as a function ofTX-100 concentration are more reasonable in the light of the sur-face excess concentration of CTAB in the mixed monolayer at thewater–air interface and its mole fraction. In such a case the influ-ence of CTAB on the adsorption of TX-100 is higher than TX-100on CTAB. The DGo
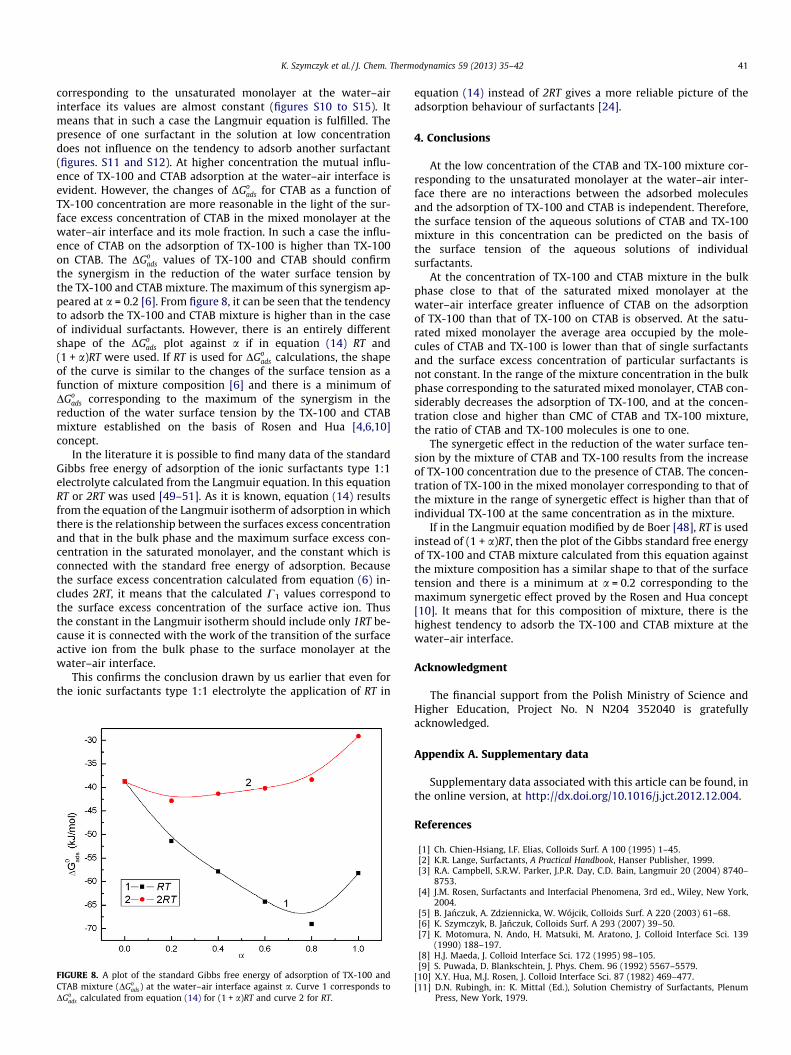
ads values of TX-100 and CTAB should confirmthe synergism in the reduction of the water surface tension bythe TX-100 and CTAB mixture. The maximum of this synergism ap-peared at a = 0.2 [6]. From figure 8, it can be seen that the tendencyto adsorb the TX-100 and CTAB mixture is higher than in the caseof individual surfactants. However, there is an entirely differentshape of the DGo
ads plot against a if in equation (14) RT and(1 + a)RT were used. If RT is used for DGo
ads calculations, the shapeof the curve is similar to the changes of the surface tension as afunction of mixture composition [6] and there is a minimum ofDGo
ads corresponding to the maximum of the synergism in thereduction of the water surface tension by the TX-100 and CTABmixture established on the basis of Rosen and Hua [4,6,10]concept.
In the literature it is possible to find many data of the standardGibbs free energy of adsorption of the ionic surfactants type 1:1electrolyte calculated from the Langmuir equation. In this equationRT or 2RT was used [49–51]. As it is known, equation (14) resultsfrom the equation of the Langmuir isotherm of adsorption in whichthere is the relationship between the surfaces excess concentrationand that in the bulk phase and the maximum surface excess con-centration in the saturated monolayer, and the constant which isconnected with the standard free energy of adsorption. Becausethe surface excess concentration calculated from equation (6) in-cludes 2RT, it means that the calculated C1 values correspond tothe surface excess concentration of the surface active ion. Thusthe constant in the Langmuir isotherm should include only 1RT be-cause it is connected with the work of the transition of the surfaceactive ion from the bulk phase to the surface monolayer at thewater–air interface.
This confirms the conclusion drawn by us earlier that even forthe ionic surfactants type 1:1 electrolyte the application of RT in
FIGURE 8. A plot of the standard Gibbs free energy of adsorption of TX-100 andCTAB mixture (DGo
ads) at the water–air interface against a. Curve 1 corresponds toDGo
ads calculated from equation (14) for (1 + a)RT and curve 2 for RT.
equation (14) instead of 2RT gives a more reliable picture of theadsorption behaviour of surfactants [24].
4. Conclusions
At the low concentration of the CTAB and TX-100 mixture cor-responding to the unsaturated monolayer at the water–air inter-face there are no interactions between the adsorbed moleculesand the adsorption of TX-100 and CTAB is independent. Therefore,the surface tension of the aqueous solutions of CTAB and TX-100mixture in this concentration can be predicted on the basis ofthe surface tension of the aqueous solutions of individualsurfactants.
At the concentration of TX-100 and CTAB mixture in the bulkphase close to that of the saturated mixed monolayer at thewater–air interface greater influence of CTAB on the adsorptionof TX-100 than that of TX-100 on CTAB is observed. At the satu-rated mixed monolayer the average area occupied by the mole-cules of CTAB and TX-100 is lower than that of single surfactantsand the surface excess concentration of particular surfactants isnot constant. In the range of the mixture concentration in the bulkphase corresponding to the saturated mixed monolayer, CTAB con-siderably decreases the adsorption of TX-100, and at the concen-tration close and higher than CMC of CTAB and TX-100 mixture,the ratio of CTAB and TX-100 molecules is one to one.
The synergetic effect in the reduction of the water surface ten-sion by the mixture of CTAB and TX-100 results from the increaseof TX-100 concentration due to the presence of CTAB. The concen-tration of TX-100 in the mixed monolayer corresponding to that ofthe mixture in the range of synergetic effect is higher than that ofindividual TX-100 at the same concentration as in the mixture.
If in the Langmuir equation modified by de Boer [48], RT is usedinstead of (1 + a)RT, then the plot of the Gibbs standard free energyof TX-100 and CTAB mixture calculated from this equation againstthe mixture composition has a similar shape to that of the surfacetension and there is a minimum at a = 0.2 corresponding to themaximum synergetic effect proved by the Rosen and Hua concept[10]. It means that for this composition of mixture, there is thehighest tendency to adsorb the TX-100 and CTAB mixture at thewater–air interface.
Acknowledgment
The financial support from the Polish Ministry of Science andHigher Education, Project No. N N204 352040 is gratefullyacknowledged.
Appendix A. Supplementary data
Supplementary data associated with this article can be found, inthe online version, at http://dx.doi.org/10.1016/j.jct.2012.12.004.
References
[1] Ch. Chien-Hsiang, I.F. Elias, Colloids Surf. A 100 (1995) 1–45.[2] K.R. Lange, Surfactants, A Practical Handbook, Hanser Publisher, 1999.[3] R.A. Campbell, S.R.W. Parker, J.P.R. Day, C.D. Bain, Langmuir 20 (2004) 8740–
8753.[4] J.M. Rosen, Surfactants and Interfacial Phenomena, 3rd ed., Wiley, New York,
2004.[5] B. Janczuk, A. Zdziennicka, W. Wójcik, Colloids Surf. A 220 (2003) 61–68.[6] K. Szymczyk, B. Janczuk, Colloids Surf. A 293 (2007) 39–50.[7] K. Motomura, N. Ando, H. Matsuki, M. Aratono, J. Colloid Interface Sci. 139
(1990) 188–197.[8] H.J. Maeda, J. Colloid Interface Sci. 172 (1995) 98–105.[9] S. Puwada, D. Blankschtein, J. Phys. Chem. 96 (1992) 5567–5579.
[10] X.Y. Hua, M.J. Rosen, J. Colloid Interface Sci. 87 (1982) 469–477.[11] D.N. Rubingh, in: K. Mittal (Ed.), Solution Chemistry of Surfactants, Plenum
Press, New York, 1979.
42 K. Szymczyk et al. / J. Chem. Thermodynamics 59 (2013) 35–42
[12] F.A. Siddiqui, E.I. Franses, Langmuir 12 (1996) 354–362.[13] J.A. McDonald, A.R. Rennie, Langmuir 11 (1995) 1493–1499.[14] M. Bujan, N. Vdovic, N. Filipovic-Vincekovic, Colloids Surf. 118 (1996) 121–
126.[15] F. Li, G.Z. Li, J. Chen, B. Colloids Surf. A: Physicochem. Eng. Asp. 145 (1998)
167–174.[16] A. Murphy, G. Taggart, Colloids Surf., A: Physicochem. Eng. Asp. 205 (2002)
237–248.[17] T.R. Desai, S. Dixit, J. Colloid Interface Sci. 179 (1996) 544–551.[18] W.D. Harkins, H.F. Jordan, J. Am. Chem. Soc. 52 (1930) 1751–1772.[19] P. Joos, Bull. Soc. Chim. Belg. 76 (1967) 591–600.[20] R. Miller, V.B. Fainerman, A.V. Makievski, G. Czichocki, Tenside Surf. Det. 38
(2001) 3–8.[21] V.B. Fainerman, R. Miller, J. Phys. Chem. B 105 (2001) 11432–11438.[22] V.B. Fainerman, R. Miller, E.V. Aksenenko, Adv. Colloids Interface Sci. 96 (2002)
339–359.[23] A.W. Adamson, Physical Chemistry of Surfaces, 5th ed., Wiley, New York, 1990.[24] A. Zdziennicka, K. Szymczyk, J. Krawczyk, B. Janczuk, Fluid Phase Equilib. 318
(2012) 25–33.[25] K. Beyer, J. Colloid Interface Sci. 86 (1982) 73–89.[26] N. Kimura, J. Umemura, S. Hayashi, J. Colloid Interface Sci. 182 (1996) 356–364.[27] D.I. El Eini, B.W. Barry, J. Rhodes, J. Colloid Interface Sci. 54 (1976) 348–351.[28] T.R. Desai, S.G. Dixit, J. Colloid Interface Sci. 177 (1996) 471–477.[29] Y. Zhu, G. Xu, X. Xin, H. Zhang, X. Shi, J. Chem. Eng. Data 54 (2009) 989–995.[30] C.J. van Oss, R.F. Giese, J. Dispersion Sci. Technol. 31 (2010) 1697–1703.[31] B. Janczuk, A. Zdziennicka, W. Wójcik, Eur. Polym. 33 (1997) 1093–1098.[32] C.J. van Oss, Interfacial Forces in Aqueous Media, Mercel Dekker, New York,
1994.[33] F.B. Sprow, J.M. Prausnitz, Can. J. Chem. Eng. 45 (1967) 25–28.
[34] C.J. van Oss, P.M. Constanzo, J. Adhesion Sci. Technol. 4 (1992) 477–487.[35] B. Janczuk, J.A. Méndez Sierra, M.L. González-Martín, J.M. Bruque, W. Wójcik, J.
Colloid Interface Sci. 184 (1996) 607–613.[36] A. Zdziennicka, K. Szymczyk, J. Krawczyk, B. Janczuk, Fluid Phase Equilib. 322–
323 (2012) 126–134.[37] M. Czerniawski, Roczniki Chem. 40 (1966) 1265–1271 (in polish).[38] P. Carpena, J. Agular, P.B. Bernaola-Galván, C. Carnero Ruiz, Langmuir 18 (2002)
6054–6058.[39] R. Barchini, R. Pottel, J. Phys. Chem. 98 (1994) 7899–7905.[40] Ch. Das, B. Das, J. Chem. Eng. Data 54 (2009) 559–565.[41] R. Nagarajan, Ch. Wang, Langmuir 16 (2000) 5242–5251.[42] M. Kumbhakar, S. Nath, T. Mukhrjee, H. Pal, J. Chem. Phys. 121 (2004) 6026–
6033.[43] Y. Rharbi, M.A. Winnik, Adv. Colloid Interface Sci. 89–90 (2001) 25–46.[44] S.W. Musselman, S. Chander, J. Colloid Interface Sci. 256 (2002) 91–99.[45] M.N. Jones, Int. J. Pharm. 177 (1999) 137–159.[46] C. Gamboa, A. F. Olea, Colloids Surf., A: Physicochem. Eng. Asp. 278 (2006)
241–245.[47] V.G. Babak, G.A. Vikhoreva, I.G. Lukina, Colloids Surf., A: Physicochem. Eng.
Asp. 128 (1997) 75–89.[48] J.H. de Boer, The Dynamical Character of Adsorption, Oxford University Press,
London, 1953.[49] J. Dey, U. Thapa, K. Ismail, J. Colloid Interface Sci. 367 (2012) 305–310.[50] P. Parekh, D. Varade, J. Parikh, P. Bahadur, Colloids Surf., A: Physicochem. Eng.
Asp. 385 (2011) 111–120.[51] M.S. Alam, A.B. Mandal, J. Mol. Liq. 168 (2012) 75–79.
JCT 12-568