Embed Size (px)
Citation preview

February 2017
Mutual Funds Report – Feb 2017
2
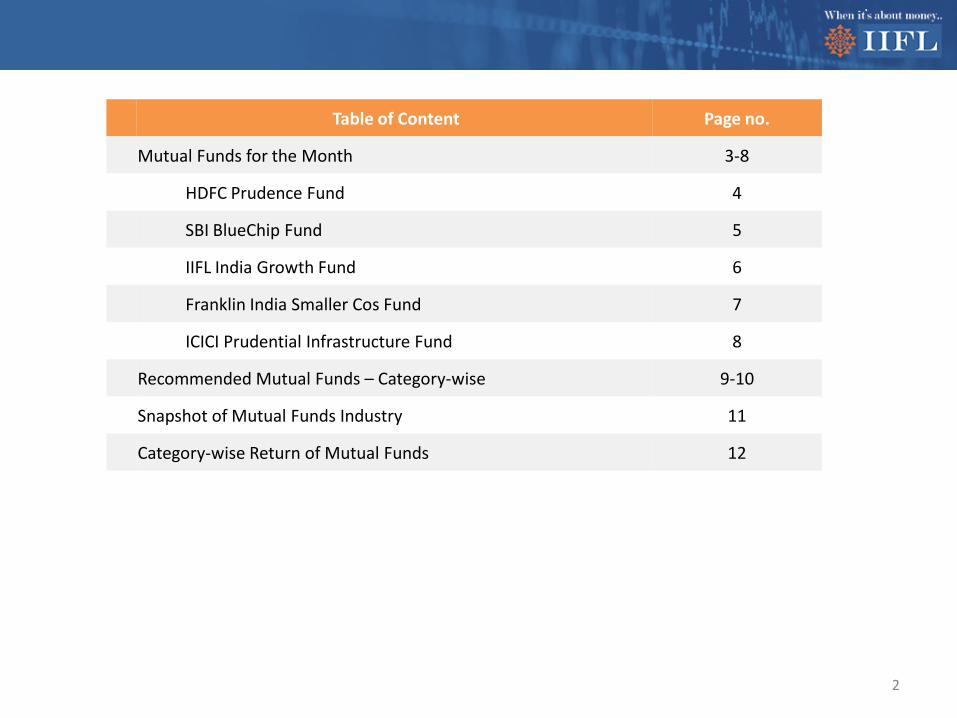
Table of Content Page no.
Mutual Funds for the Month 3-8
HDFC Prudence Fund 4
SBI BlueChip Fund 5
IIFL India Growth Fund 6
Franklin India Smaller Cos Fund 7
ICICI Prudential Infrastructure Fund 8
Recommended Mutual Funds – Category-wise 9-10
Snapshot of Mutual Funds Industry 11
Category-wise Return of Mutual Funds 12
Mutual Funds for the Month
3
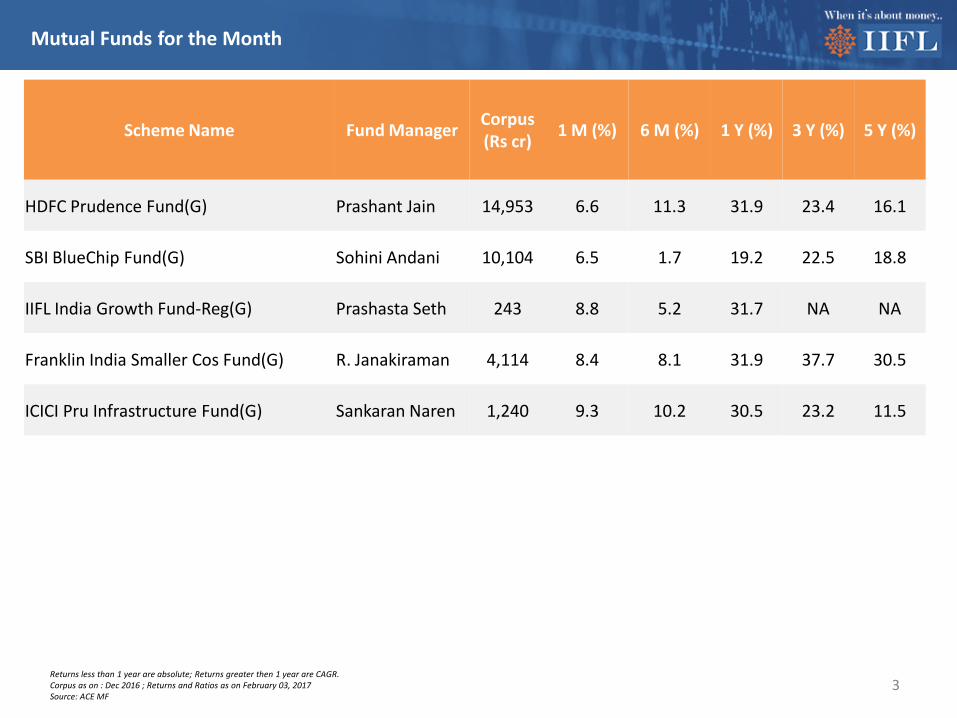
Scheme Name Fund Manager Corpus (Rs cr) 1 M (%) 6 M (%) 1 Y (%) 3 Y (%) 5 Y (%)
HDFC Prudence Fund(G) Prashant Jain 14,953 6.6 11.3 31.9 23.4 16.1
SBI BlueChip Fund(G) Sohini Andani 10,104 6.5 1.7 19.2 22.5 18.8
IIFL India Growth Fund-Reg(G) Prashasta Seth 243 8.8 5.2 31.7 NA NA
Franklin India Smaller Cos Fund(G) R. Janakiraman 4,114 8.4 8.1 31.9 37.7 30.5
ICICI Pru Infrastructure Fund(G) Sankaran Naren 1,240 9.3 10.2 30.5 23.2 11.5
Returns less than 1 year are absolute; Returns greater then 1 year are CAGR. Corpus as on : Dec 2016 ; Returns and Ratios as on February 03, 2017Source: ACE MF
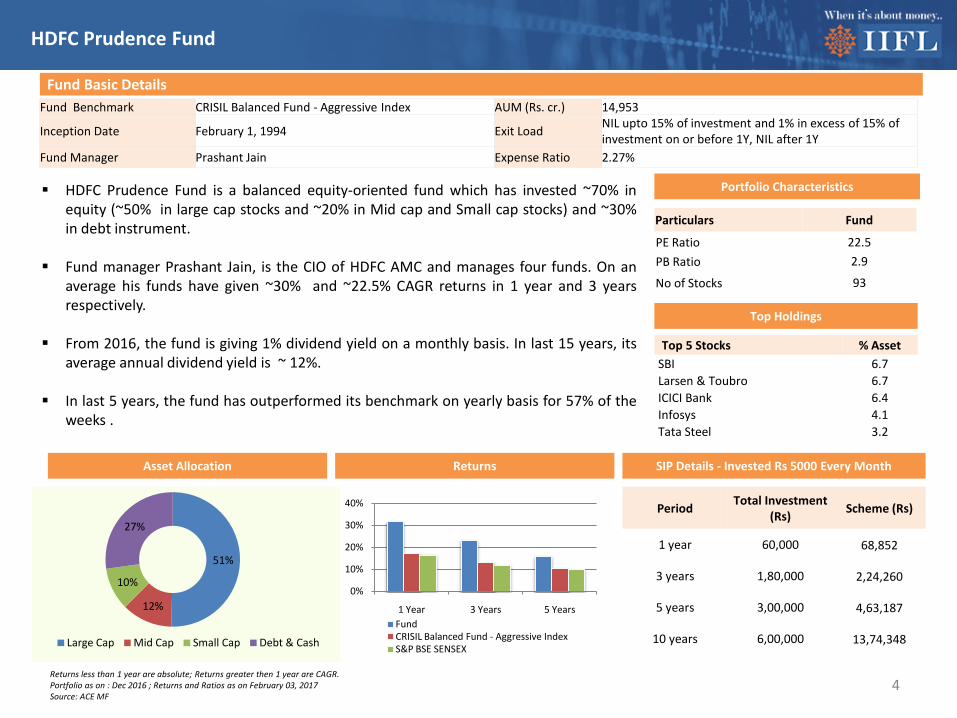
Fund Benchmark CRISIL Balanced Fund - Aggressive Index AUM (Rs. cr.) 14,953
Inception Date February 1, 1994 Exit Load NIL upto 15% of investment and 1% in excess of 15% of investment on or before 1Y, NIL after 1Y
Fund Manager Prashant Jain Expense Ratio 2.27%
Fund Basic Details
Top 5 Stocks % Asset SBI 6.7Larsen & Toubro 6.7ICICI Bank 6.4Infosys 4.1Tata Steel 3.2
Top Holdings
Portfolio Characteristics
Particulars Fund
PE Ratio 22.5PB Ratio 2.9
No of Stocks 93
HDFC Prudence Fund is a balanced equity-oriented fund which has invested ~70% inequity (~50% in large cap stocks and ~20% in Mid cap and Small cap stocks) and ~30%in debt instrument.
Fund manager Prashant Jain, is the CIO of HDFC AMC and manages four funds. On anaverage his funds have given ~30% and ~22.5% CAGR returns in 1 year and 3 yearsrespectively.
From 2016, the fund is giving 1% dividend yield on a monthly basis. In last 15 years, itsaverage annual dividend yield is ~ 12%.
In last 5 years, the fund has outperformed its benchmark on yearly basis for 57% of theweeks .
SIP Details - Invested Rs 5000 Every MonthReturns
0%
10%
20%
30%
40%
1 Year 3 Years 5 YearsFundCRISIL Balanced Fund - Aggressive IndexS&P BSE SENSEX
51%
12%
10%
27%
Large Cap Mid Cap Small Cap Debt & Cash
4
HDFC Prudence Fund
Asset Allocation
Period Total Investment (Rs) Scheme (Rs)
1 year 60,000 68,852
3 years 1,80,000 2,24,260
5 years 3,00,000 4,63,187
10 years 6,00,000 13,74,348
Returns less than 1 year are absolute; Returns greater then 1 year are CAGR.Portfolio as on : Dec 2016 ; Returns and Ratios as on February 03, 2017Source: ACE MF
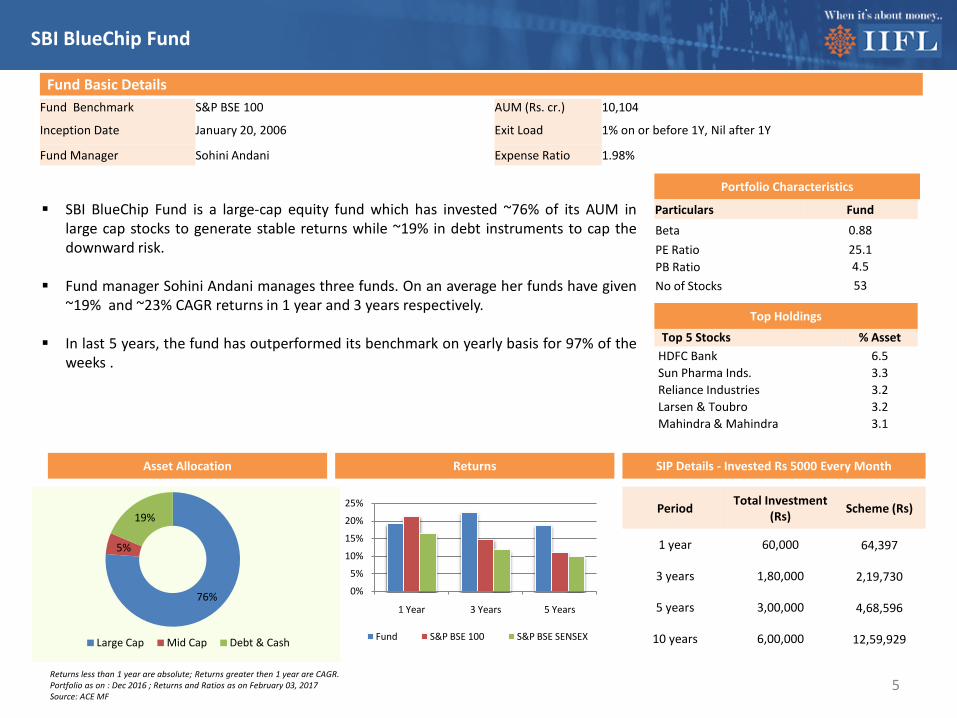
Fund Benchmark S&P BSE 100 AUM (Rs. cr.) 10,104
Inception Date January 20, 2006 Exit Load 1% on or before 1Y, Nil after 1Y
Fund Manager Sohini Andani Expense Ratio 1.98%
Fund Basic Details
Top 5 Stocks % Asset HDFC Bank 6.5Sun Pharma Inds. 3.3Reliance Industries 3.2Larsen & Toubro 3.2Mahindra & Mahindra 3.1
Top Holdings
Portfolio Characteristics
SBI BlueChip Fund is a large-cap equity fund which has invested ~76% of its AUM inlarge cap stocks to generate stable returns while ~19% in debt instruments to cap thedownward risk.
Fund manager Sohini Andani manages three funds. On an average her funds have given~19% and ~23% CAGR returns in 1 year and 3 years respectively.
In last 5 years, the fund has outperformed its benchmark on yearly basis for 97% of theweeks .
SIP Details - Invested Rs 5000 Every MonthReturns
0%
5%
10%
15%
20%
25%
1 Year 3 Years 5 Years
Fund S&P BSE 100 S&P BSE SENSEX
5
SBI BlueChip Fund
Asset Allocation
Period Total Investment (Rs) Scheme (Rs)
1 year 60,000 64,397
3 years 1,80,000 2,19,730
5 years 3,00,000 4,68,596
10 years 6,00,000 12,59,929
Particulars FundBeta 0.88PE Ratio 25.1PB Ratio 4.5No of Stocks 53
76%
5%
19%
Large Cap Mid Cap Debt & Cash
Returns less than 1 year are absolute; Returns greater then 1 year are CAGR.Portfolio as on : Dec 2016 ; Returns and Ratios as on February 03, 2017Source: ACE MF
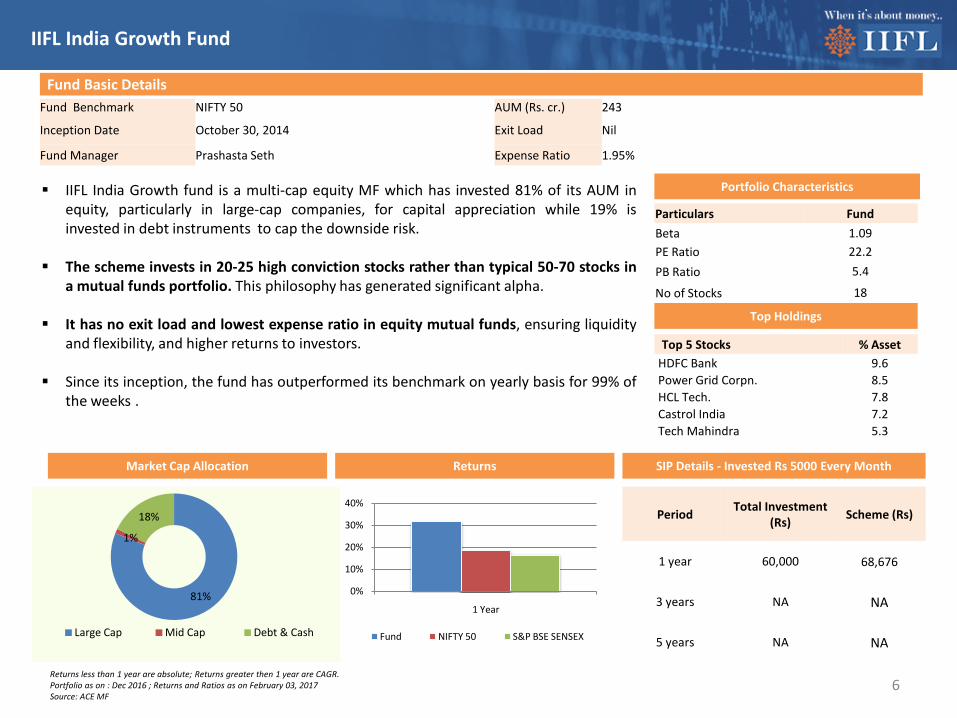
Fund Benchmark NIFTY 50 AUM (Rs. cr.) 243
Inception Date October 30, 2014 Exit Load Nil
Fund Manager Prashasta Seth Expense Ratio 1.95%
Fund Basic Details
Top 5 Stocks % Asset HDFC Bank 9.6Power Grid Corpn. 8.5HCL Tech. 7.8Castrol India 7.2Tech Mahindra 5.3
Top Holdings
Portfolio Characteristics
Particulars FundBeta 1.09PE Ratio 22.2PB Ratio 5.4
No of Stocks 18
IIFL India Growth fund is a multi-cap equity MF which has invested 81% of its AUM inequity, particularly in large-cap companies, for capital appreciation while 19% isinvested in debt instruments to cap the downside risk.
The scheme invests in 20-25 high conviction stocks rather than typical 50-70 stocks ina mutual funds portfolio. This philosophy has generated significant alpha.
It has no exit load and lowest expense ratio in equity mutual funds, ensuring liquidityand flexibility, and higher returns to investors.
Since its inception, the fund has outperformed its benchmark on yearly basis for 99% ofthe weeks .
SIP Details - Invested Rs 5000 Every MonthReturns
0%
10%
20%
30%
40%
1 Year
Fund NIFTY 50 S&P BSE SENSEX
6
IIFL India Growth Fund
Market Cap Allocation
Period Total Investment (Rs) Scheme (Rs)
1 year 60,000 68,676
3 years NA NA
5 years NA NA
81%
1%
18%
Large Cap Mid Cap Debt & Cash
Returns less than 1 year are absolute; Returns greater then 1 year are CAGR.Portfolio as on : Dec 2016 ; Returns and Ratios as on February 03, 2017Source: ACE MF
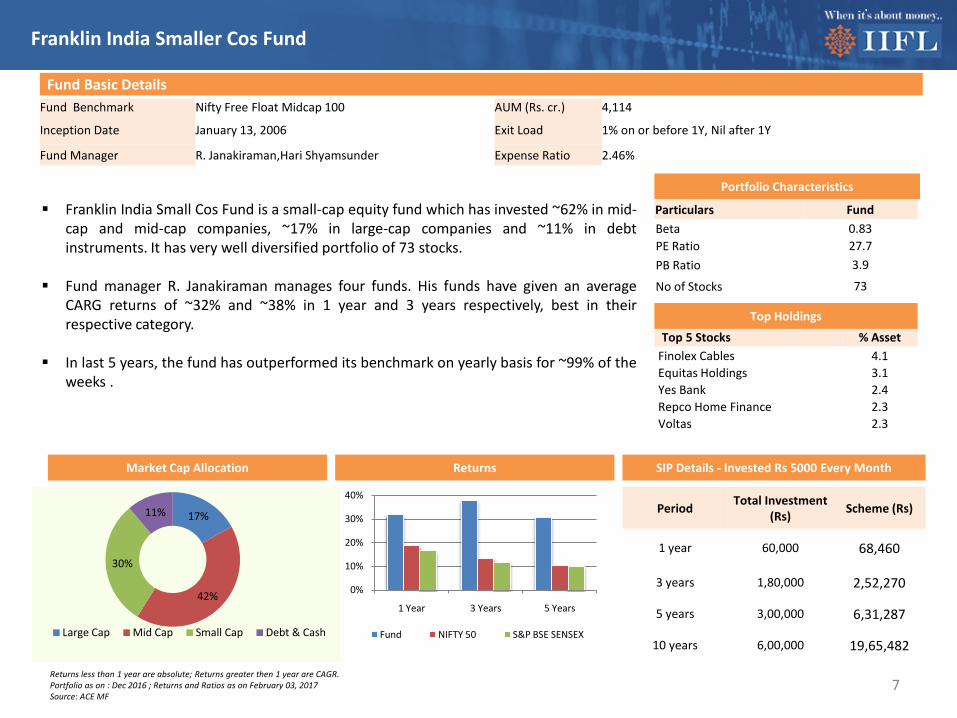
Fund Benchmark Nifty Free Float Midcap 100 AUM (Rs. cr.) 4,114
Inception Date January 13, 2006 Exit Load 1% on or before 1Y, Nil after 1Y
Fund Manager R. Janakiraman,Hari Shyamsunder Expense Ratio 2.46%
Fund Basic Details
Top 5 Stocks % Asset Finolex Cables 4.1Equitas Holdings 3.1Yes Bank 2.4Repco Home Finance 2.3Voltas 2.3
Top Holdings
Portfolio Characteristics
Particulars FundBeta 0.83PE Ratio 27.7PB Ratio 3.9
No of Stocks 73
Franklin India Small Cos Fund is a small-cap equity fund which has invested ~62% in mid-cap and mid-cap companies, ~17% in large-cap companies and ~11% in debtinstruments. It has very well diversified portfolio of 73 stocks.
Fund manager R. Janakiraman manages four funds. His funds have given an averageCARG returns of ~32% and ~38% in 1 year and 3 years respectively, best in theirrespective category.
In last 5 years, the fund has outperformed its benchmark on yearly basis for ~99% of theweeks .
SIP Details - Invested Rs 5000 Every MonthReturns
0%
10%
20%
30%
40%
1 Year 3 Years 5 Years
Fund NIFTY 50 S&P BSE SENSEX
17%
42%
30%
11%
Large Cap Mid Cap Small Cap Debt & Cash
7
Franklin India Smaller Cos Fund
Market Cap Allocation
Returns less than 1 year are absolute; Returns greater then 1 year are CAGR.Portfolio as on : Dec 2016 ; Returns and Ratios as on February 03, 2017Source: ACE MF
Period Total Investment (Rs) Scheme (Rs)
1 year 60,000 68,460
3 years 1,80,000 2,52,270
5 years 3,00,000 6,31,287
10 years 6,00,000 19,65,482
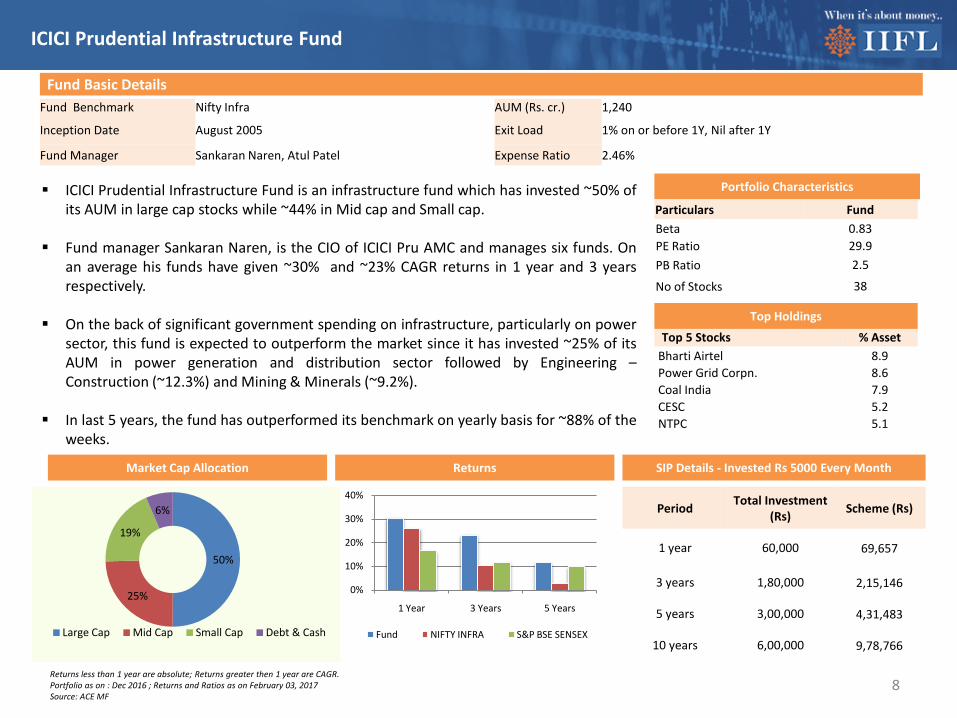
Fund Benchmark Nifty Infra AUM (Rs. cr.) 1,240
Inception Date August 2005 Exit Load 1% on or before 1Y, Nil after 1Y
Fund Manager Sankaran Naren, Atul Patel Expense Ratio 2.46%
Fund Basic Details
Top 5 Stocks % Asset Bharti Airtel 8.9Power Grid Corpn. 8.6Coal India 7.9CESC 5.2NTPC 5.1
Top Holdings
Portfolio Characteristics
Particulars FundBeta 0.83PE Ratio 29.9PB Ratio 2.5
No of Stocks 38
ICICI Prudential Infrastructure Fund is an infrastructure fund which has invested ~50% ofits AUM in large cap stocks while ~44% in Mid cap and Small cap.
Fund manager Sankaran Naren, is the CIO of ICICI Pru AMC and manages six funds. Onan average his funds have given ~30% and ~23% CAGR returns in 1 year and 3 yearsrespectively.
On the back of significant government spending on infrastructure, particularly on powersector, this fund is expected to outperform the market since it has invested ~25% of itsAUM in power generation and distribution sector followed by Engineering –Construction (~12.3%) and Mining & Minerals (~9.2%).
In last 5 years, the fund has outperformed its benchmark on yearly basis for ~88% of theweeks.
SIP Details - Invested Rs 5000 Every MonthReturns
0%
10%
20%
30%
40%
1 Year 3 Years 5 Years
Fund NIFTY INFRA S&P BSE SENSEX
50%
25%
19%
6%
Large Cap Mid Cap Small Cap Debt & Cash
8
ICICI Prudential Infrastructure Fund
Market Cap Allocation
Returns less than 1 year are absolute; Returns greater then 1 year are CAGR.Portfolio as on : Dec 2016 ; Returns and Ratios as on February 03, 2017Source: ACE MF
Period Total Investment (Rs) Scheme (Rs)
1 year 60,000 69,657
3 years 1,80,000 2,15,146
5 years 3,00,000 4,31,483
10 years 6,00,000 9,78,766
Recommended Mutual Funds – Category-wise
9
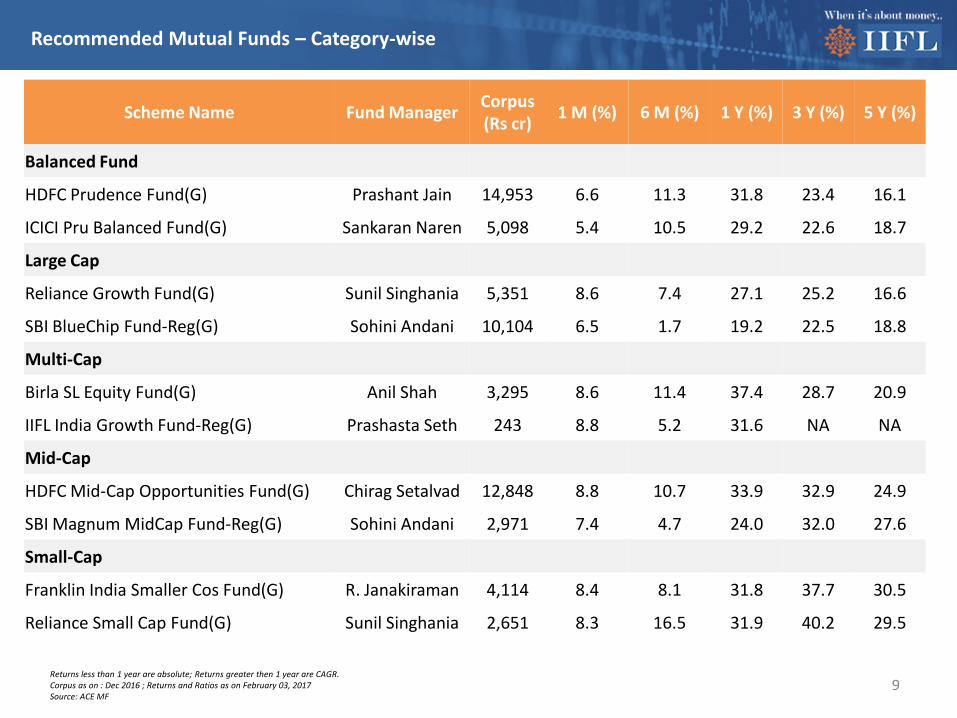
Scheme Name Fund Manager Corpus (Rs cr) 1 M (%) 6 M (%) 1 Y (%) 3 Y (%) 5 Y (%)
Balanced Fund
HDFC Prudence Fund(G) Prashant Jain 14,953 6.6 11.3 31.8 23.4 16.1
ICICI Pru Balanced Fund(G) Sankaran Naren 5,098 5.4 10.5 29.2 22.6 18.7
Large Cap
Reliance Growth Fund(G) Sunil Singhania 5,351 8.6 7.4 27.1 25.2 16.6
SBI BlueChip Fund-Reg(G) Sohini Andani 10,104 6.5 1.7 19.2 22.5 18.8
Multi-Cap
Birla SL Equity Fund(G) Anil Shah 3,295 8.6 11.4 37.4 28.7 20.9
IIFL India Growth Fund-Reg(G) Prashasta Seth 243 8.8 5.2 31.6 NA NA
Mid-Cap
HDFC Mid-Cap Opportunities Fund(G) Chirag Setalvad 12,848 8.8 10.7 33.9 32.9 24.9
SBI Magnum MidCap Fund-Reg(G) Sohini Andani 2,971 7.4 4.7 24.0 32.0 27.6
Small-Cap
Franklin India Smaller Cos Fund(G) R. Janakiraman 4,114 8.4 8.1 31.8 37.7 30.5
Reliance Small Cap Fund(G) Sunil Singhania 2,651 8.3 16.5 31.9 40.2 29.5
Returns less than 1 year are absolute; Returns greater then 1 year are CAGR. Corpus as on : Dec 2016 ; Returns and Ratios as on February 03, 2017Source: ACE MF
Recommended Mutual Funds – Category-wise
10
Scheme Name Fund Manager Corpus (Rs cr) 1 M (%) 6 M (%) 1 Y (%) 3 Y (%) 5 Y (%)
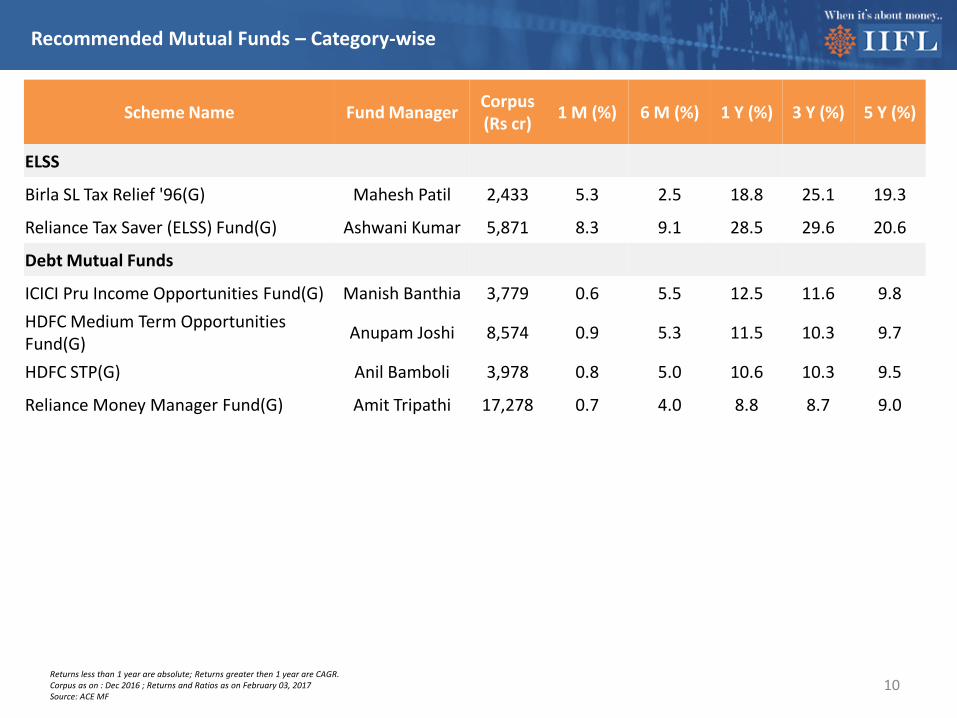
ELSS
Birla SL Tax Relief '96(G) Mahesh Patil 2,433 5.3 2.5 18.8 25.1 19.3
Reliance Tax Saver (ELSS) Fund(G) Ashwani Kumar 5,871 8.3 9.1 28.5 29.6 20.6
Debt Mutual Funds
ICICI Pru Income Opportunities Fund(G) Manish Banthia 3,779 0.6 5.5 12.5 11.6 9.8HDFC Medium Term Opportunities Fund(G) Anupam Joshi 8,574 0.9 5.3 11.5 10.3 9.7
HDFC STP(G) Anil Bamboli 3,978 0.8 5.0 10.6 10.3 9.5
Reliance Money Manager Fund(G) Amit Tripathi 17,278 0.7 4.0 8.8 8.7 9.0
Returns less than 1 year are absolute; Returns greater then 1 year are CAGR. Corpus as on : Dec 2016 ; Returns and Ratios as on February 03, 2017Source: ACE MF
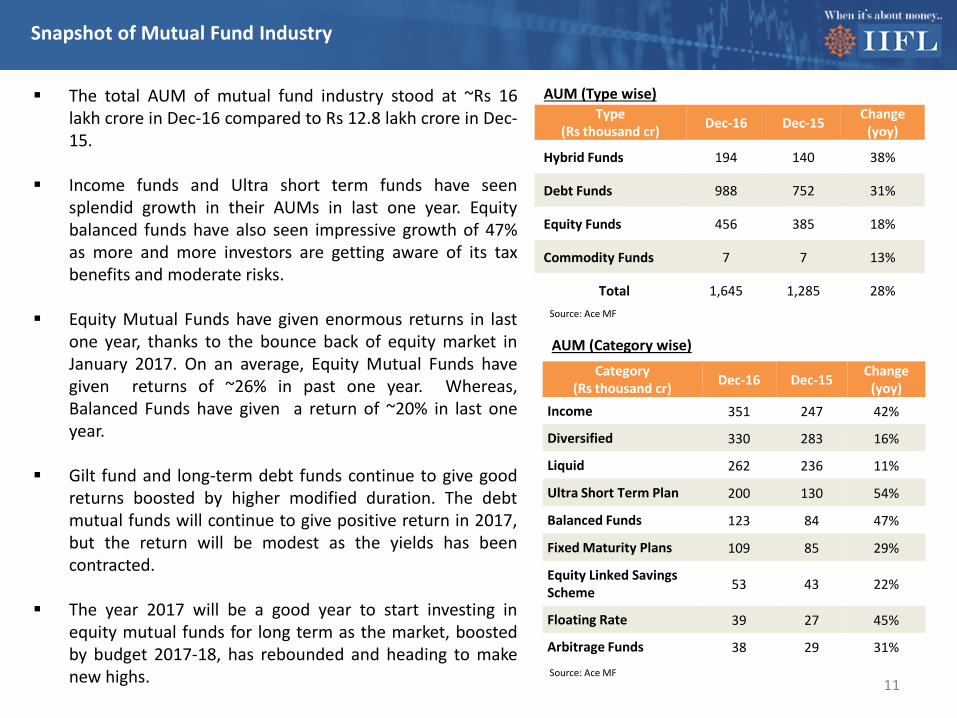
Type (Rs thousand cr) Dec-16 Dec-15 Change
(yoy)
Hybrid Funds 194 140 38%
Debt Funds 988 752 31%
Equity Funds 456 385 18%
Commodity Funds 7 7 13%
Total 1,645 1,285 28%
11
Category (Rs thousand cr) Dec-16 Dec-15 Change
(yoy)Income 351 247 42%
Diversified 330 283 16%
Liquid 262 236 11%
Ultra Short Term Plan 200 130 54%
Balanced Funds 123 84 47%
Fixed Maturity Plans 109 85 29%
Equity Linked Savings Scheme 53 43 22%
Floating Rate 39 27 45%
Arbitrage Funds 38 29 31%
The total AUM of mutual fund industry stood at ~Rs 16lakh crore in Dec-16 compared to Rs 12.8 lakh crore in Dec-15.
Income funds and Ultra short term funds have seensplendid growth in their AUMs in last one year. Equitybalanced funds have also seen impressive growth of 47%as more and more investors are getting aware of its taxbenefits and moderate risks.
Equity Mutual Funds have given enormous returns in lastone year, thanks to the bounce back of equity market inJanuary 2017. On an average, Equity Mutual Funds havegiven returns of ~26% in past one year. Whereas,Balanced Funds have given a return of ~20% in last oneyear.
Gilt fund and long-term debt funds continue to give goodreturns boosted by higher modified duration. The debtmutual funds will continue to give positive return in 2017,but the return will be modest as the yields has beencontracted.
The year 2017 will be a good year to start investing inequity mutual funds for long term as the market, boostedby budget 2017-18, has rebounded and heading to makenew highs.
AUM (Type wise)
AUM (Category wise)
Snapshot of Mutual Fund Industry
Source: Ace MF
Source: Ace MF
12
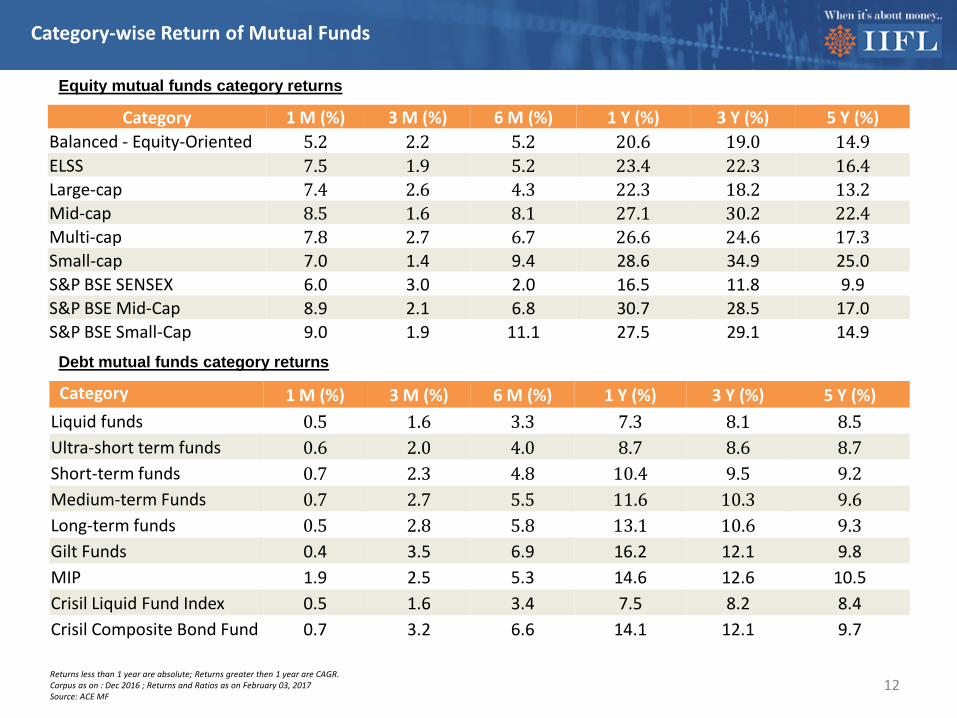
Equity mutual funds category returns
Category 1 M (%) 3 M (%) 6 M (%) 1 Y (%) 3 Y (%) 5 Y (%)Liquid funds 0.5 1.6 3.3 7.3 8.1 8.5Ultra-short term funds 0.6 2.0 4.0 8.7 8.6 8.7Short-term funds 0.7 2.3 4.8 10.4 9.5 9.2Medium-term Funds 0.7 2.7 5.5 11.6 10.3 9.6Long-term funds 0.5 2.8 5.8 13.1 10.6 9.3Gilt Funds 0.4 3.5 6.9 16.2 12.1 9.8MIP 1.9 2.5 5.3 14.6 12.6 10.5Crisil Liquid Fund Index 0.5 1.6 3.4 7.5 8.2 8.4Crisil Composite Bond Fund 0.7 3.2 6.6 14.1 12.1 9.7
Debt mutual funds category returns
Category-wise Return of Mutual Funds
Category 1 M (%) 3 M (%) 6 M (%) 1 Y (%) 3 Y (%) 5 Y (%)Balanced - Equity-Oriented 5.2 2.2 5.2 20.6 19.0 14.9ELSS 7.5 1.9 5.2 23.4 22.3 16.4Large-cap 7.4 2.6 4.3 22.3 18.2 13.2Mid-cap 8.5 1.6 8.1 27.1 30.2 22.4Multi-cap 7.8 2.7 6.7 26.6 24.6 17.3Small-cap 7.0 1.4 9.4 28.6 34.9 25.0S&P BSE SENSEX 6.0 3.0 2.0 16.5 11.8 9.9S&P BSE Mid-Cap 8.9 2.1 6.8 30.7 28.5 17.0S&P BSE Small-Cap 9.0 1.9 11.1 27.5 29.1 14.9
Returns less than 1 year are absolute; Returns greater then 1 year are CAGR. Corpus as on : Dec 2016 ; Returns and Ratios as on February 03, 2017Source: ACE MF
Disclosure
• Mutual Fund investments are subject to market risks, read all scheme related documents carefully.• Nothing in this document constitutes investment, legal, accounting or tax advice or a representation that any investment or strategy is suitable or appropriate to the investor's specific
circumstances. The details included are based on information obtained from public sources and sources believed to be reliable, but no independent verification has been made nor is its accuracy or completeness guaranteed.
• Investors should consult their financial advisers if in doubt about whether the product is suitable for them. The fund may or may not be suitable for all investors, who must make their own investment decisions, based on their own investment objectives, financial positions and needs. This document may not be taken in substitution for the exercise of independent judgment by any investor. The investor should independently evaluate the investment risks.
• India Infoline Ltd. or any of its director/s or principal officer/employees and associate companies (IIFL) does not assure/give guarantee for accuracy of any of the facts/interpretations in this document, and shall not be liable to any person including the beneficiary for any claim or demand for damages or otherwise in relation to this opinion or its contents.
• The aimed returns mentioned anywhere in this document are purely indicative and are not promised or guaranteed in any manner. Returns are dependent on prevalent market factors, liquidity and credit conditions. Instrument returns depicted are in the current context and may be significantly different in the future.
• The group company of India Infoline Limited, IIFL Wealth Management Limited is the Sponsor of IIFL Mutual Fund and holding company of the Investment Manager & Trustee Company of IIFL Mutual Fund.
• IIFL or its subsidiaries & affiliates may be holding all or any of the units of the scheme(s), referred in the document. The information contained herein is strictly confidential and meant solely for the selected recipient and may not be altered in any way, transmitted to, copied or distributed, in part or in whole, to any other person or to the media or reproduced in any form, without prior written consent of IIFL. While due care has been taken in preparing this document, IIFL and its affiliates accept no liabilities for any loss or damage of any kind arising out of any inaccurate, delayed or incomplete information nor for any actions taken in reliance thereon.
• This document is not directed or intended for distribution to, or use by, any person or entity who is a citizen or resident of or located in any locality, state, country or other jurisdiction, where such distribution, publication, availability or use would be contrary to law, regulation or which would subject IIFL or its affiliates to any registration or licensing requirement within such jurisdiction. IIFL and/or its associates receive compensation/ commission for distribution of Mutual Funds from various Asset Management Companies (AMCs).
• IIFL hosts the details of the commission rates earned by IIFL from Mutual Fund houses on our website https://ttweb.indiainfoline.com/trade/downloads/brokerage%20file.pdf. Hence, IIFL or its associates may have received compensation from AMCs whose funds are mentioned in the report during the period preceding twelve months from the date of this report for distribution of Mutual Funds or for providing marketing advertising support to these AMCs. IIFL group, associate and subsidiary companies are engaged in providing various financial services and for the said services (including the service for acquiring and sourcing the units of the fund) may earn fees or remuneration in form of arranger fees, referral fees, advisory fees, management fees, trustee fees, Commission, brokerage, transaction charges, underwriting charges, issue management fees and other fees.
• Please refer to http://www.indiainfoline.com/research/disclaimer for additional recommendation parameter, analyst disclaimer and other disclosures. • Published in 2017. © India Infoline Ltd 2017• India Infoline Limited (Formerly “India Infoline Distribution Company Limited”), CIN No.: U99999MH1996PLC132983, Corporate Office – IIFL Centre, Kamala City, Senapati Bapat Marg, Lower Parel,
Mumbai – 400013 Tel: (91-22) 4249 9000 Fax: (91-22) 40609049, Regd. Office – IIFL House, Sun Infotech Park, Road No. 16V, Plot No. B-23, MIDC, Thane Industrial Area, Wagle Estate, Thane –400604 Tel: (91-22) 25806650 Fax: (91-22) 25806654, E-mail: [email protected], Website: www.indiainfoline.com, refer www.indiainfoline.com for detail of Associates.
• National Stock Exchange of India Ltd. SEBI Regn. No. : INB231097537/ INF231097537/ INE231097537, BSE Ltd. SEBI Regn. No.:INB011097533/ INF011097533/ BSE-Currency, MCX Stock Exchange Ltd. SEBI Regn. No.: INB261097530/ INF261097530/ INE261097537, PMS SEBI Regn. No. INP000002213, IA SEBI Regn. No. INA000000623, SEBI RA Regn.:- INH000000248, ARN No.47791
• For Research related queries, write at [email protected] • For Sales and Account related information, write to customer care: [email protected] or call on 91-22 4007 1000
13