Embed Size (px)
Citation preview
Munich Personal RePEc Archive
Mutual funds performance appraisal
using stochastic multicriteria
acceptability analysis
Babalos, Vassilios and Philippas, Nikolaos and Doumpos,
Michael and Zompounidis, Constantin
2012
Online at https://mpra.ub.uni-muenchen.de/42051/
MPRA Paper No. 42051, posted 19 Oct 2012 17:45 UTC
MUTUAL FUNDS PERFORMANCE APPRAISAL USING STOCHASTIC
MULTICRITERIA ACCEPTABILITY ANALYSIS
Vassilios Babalos1, Nikolaos Philippas
2, Michael Doumpos
3*, Constantin Zopounidis
3
1 University of Piraeus Department of Banking & Financial Management
80, Karaoli and Dimitriou Str, Piraeus, Greece
2 University of Piraeus Department of Business Administration
80, Karaoli and Dimitriou Str, Piraeus, Greece
3 Technical University of Crete Dept. of Production Engineering and Management
Financial Engineering Laboratory University Campus, 73100 Chania, Greece
Abstract
Mutual fund investors are concerned with the selection of the best fund in terms of
performance among the set of alternative funds. This paper proposes an innovative mutual
funds performance evaluation measure in the context of multicriteria decision making. We
implement a multicriteria methodology using stochastic multicriteria acceptability analysis,
on Greek domestic equity funds for the period 2000–2009. Combining a unique dataset of
risk-adjusted returns such as Carhart’s alpha with funds’ cost variables, we obtain a
multicriteria performance evaluation and ranking of the mutual funds, by means of an additive
value function model. The main conclusion is that among employed variables, the
sophisticated Carhart’s alpha plays the most important role in determining fund rankings. On
the other hand, funds’ rankings are affected only marginally by operational attributes. We
believe that our results could have serious implications either in terms of a fund rating system
or for constructing optimal combinations of portfolios.
Keywords: Mutual funds, Performance appraisal, Multicriteria analysis, Simulation
* Corresponding author. Phone: +30-28210-37318, Fax: +30-28210-69410, email: [email protected]
1
1. INTRODUCTION
Traditional mutual funds are probably the most preferred investment vehicle in modern
financial markets. Their large scale success is due to the unique advantages that they offer to
investors such as access to professional management with minimum initial capital and
efficient risk diversification. Global investments in open-end mutual funds have almost
doubled during the last 10 years, reaching $24.7 trillion at the end of the fourth quarter of
2010 compared to $11.87 trillion in 2000 (Investment Company Institute, 2011). Most
interestingly, the number of offered funds has steadily increased through time amounting, by
the end of fourth quarter of 2010, to 69,500 funds. Thus, in light of the plethora of available
funds the evaluation and selection of the proper fund constitutes a very demanding task. The
Greek fund industry, following a period of significant expansion fueled mainly by
institutional reforms and thriving stock market has undergone a substantial decline. Currently,
22 fund companies offer 303 funds and manage almost €8 billion (Association of Greek
Institutional Investors, 2011).
Despite the tremendous growth of the delegated asset management industry the issue of
whether professional money managers add value to their portfolios remains central to the
investment process. From a social perspective, the evaluation of fund performance is of
particular significance because we need to know if money managers, as a group, add value to
portfolios they manage or simply engage in wasteful active portfolio management. On the
other hand, at the investor-level it is very important for a shareholder to evaluate the
performance of his fund relative to its peer group.
According to mean-variance performance measures, marginal investor’s main concern
is the return from and the associated risk to his investment. However, there is significant
evidence that other various quantitative and qualitative attributes might be involved in the
investors’ fund selection process. Apart from risk-return characteristics, investors should also
be concerned about funds’ performance over various time-horizons, management fees,
transaction costs and perhaps about other qualitative criteria. Moreover, although investors
may indeed share the same selection rules, it is possible that they rank each criterion
differently due to budget, investment horizon or diversification considerations. Still, even if
investors base their fund selection solely on risk and return characteristics, given the existence
of various return and risk measures without no measure absolutely superior, an investor may
wish to take into account several of them at the same time, with or without particular
preference a priori for one or more among them.
2
The various performance measures can roughly be classified according to the reward to
variability ratios such as Sharpe ratio (1966) and Treynor ratio (1965) and to models of
regression based abnormal return. Distinguishing between managers that possess pure skills
and systematically deliver superior risk adjusted returns, and those that just follow mechanical
investment strategies exploiting market inefficiencies (size, value and momentum effect) is
the ultimate purpose of the performance evaluation measures. For this reason, evaluation
models have been developed to address the market-timing and stock selection abilities of fund
managers. These models include the Treynor and Mazuy (1966) model, Jensen’s alpha (1968)
and Henriksson and Merton’s model (1981). However, traditional performance measures that
rely on the mean variance framework (Markowitz 1952) and the capital asset pricing model
(CAPM) have received a lot of criticism for their conceptual and econometric attributes (Roll
1977, 1978). As a result, multi factor models that incorporate additional risk factors in the
spirit of Ross (1976) have been introduced with Fama and French (1996) and Carhart (1997)
models being the most prominent.
Both single and multi-factor performance evaluation models adjust fund returns for
common sources of investment risk such as market risk, small size risk, value risk etc. Since
the early studies of Treynor (1965) and Sharpe (1966) to the most recent of Gruber (1996),
Carhart (1997) and lately that of Fama and French (2010), all share a common finding, that is
on average active funds underperform their passive benchmarks1. It is very intriguing that, in
many cases, the documented funds’ underperformance equals the amount of expenses charged
to shareholders constituting the relation between fund performance and costs a rather
interesting research area. A related issue is that of performance persistence which exhibits
rather controversial results. Hendricks et al. (1993), Goetzmann and Ibbotson (1994), Gruber
(1996), as well as Cremers and Petajisto (2010) found evidence of performance persistence
whereas Jensen (1968), Malkiel (1995), Carhart (1997) for US funds and Babalos et al. (2007,
2008) for the Greek market have documented the absence of patterns in funds’ performance
after proper risk adjustment. Furthermore, it should be noted that performance studies may be
plagued by a data selection bias called survivorship bias (Brown et al., 1992; Rohleder et al.,
2010) that could lead to spurious inferences.
Another strand of literature stems from the time varying nature of investment risk
(Merton, 1971), which should be incorporated into the funds’ performance evaluation process.
This belief gave rise to a new class of conditional performance evaluation models (Ferson and
1 Tendency of investors to prefer actively managed funds despite their systematic underperformance remains an
unsolved puzzle (Gruber 1996).
3
Schadt 1996; Ferson and Warther 1996; Christopherson et al. 1998) that allow both funds’
expected returns and risk to vary through time. It has been documented that the use of
conditional performance measures could result in neutral fund performance as compared to
significant underperformance reported by their unconditional counterparts.
As has already been mentioned, financial theory has developed a set of scientific
measures for fund evaluation purposes. However, understanding or even calculating these
rather complicated measures could be a very difficult task for individual investors. Rating
agencies such as Morningstar or Standard & Poor’s offer specialized knowledge and services
to both individuals and institutional investors, in response to the growing need of reliable
investment information. Morningstar’s main contribution lies in the introduction of a star
rating system that identifies the best funds within a peer group in a concise and meaningful
way. A number of studies have documented the influence of Morningstar star rating on the
investment allocation decisions of retail mutual fund investors (Blake and Morey 2000; Del
Guercio and Tkac, 2008). In other words, five star funds that are ranked top by Morningstar
have been found to enjoy significant higher inflows.
Literature on the evaluation of investment funds’ performance by means of a non-
parametric approach is rather limited. Among the most popular non-parametric methods is
data envelopment analysis (DEA). Most of the approaches consider various mutual funds’
cost and risk variables as inputs and a proper measure of return as one of the outputs. Studies
evaluating traditional funds’ performance using the DEA framework could be grouped into
those that focus on US funds and those on non-US funds. Murthi et al. (1997) were the first to
apply the DEA method to fund performance evaluation in the US funds’ market with standard
deviation of returns, expense ratio, loads and turnover as inputs and mean gross return as
output. They detected a significant positive relation between their efficiency index and
Jensen’s alpha for all categories of funds. Murthi and Choi (2001), considering the same
inputs and outputs as in Murthi et al. (1997), established a relation between mean-variance
and cost-return efficiency by linking their new non-parametric, DEA-based performance
measure to the traditional Sharpe index (1966). Sengupta (2003) found that 70% of the
examined portfolios were relatively efficient, but with significant deviations depending on the
category of funds. He employed raw returns as output and loads, expenses, turnover, risk
(standard deviation or beta) and skewness of returns as inputs in his model. Other studies
focusing on US funds include Anderson et al. (2004) who examined the efficiency of real
estate funds employing a series of inputs such as loads, various costs and a standard measure
of funds' risk (the standard deviation) and raw return as output. Daraio & Simar (2006) using
4
standard deviation, expense ratio, turnover and fund size as inputs and mean return as output
proposed a robust non-parametric performance measure based on the concept of order-m
frontier. In the same vein, Gregoriou (2003) and Gregoriou et al. (2005) extended the DEA
based performance evaluation concept into the hedge fund industry considering asymmetric
risk and return metrics (semi-variance, semi-skewness) to measure inputs and outputs. With
respect to the rest of fund markets, Basso and Funari (2001) examined the relative efficiency
of Italian funds employing different formulations of DEA-based models along with various
risk measures (standard deviation, standard semi-deviation and beta) and sales charges as
inputs and the mean return and the fraction of periods in which the mutual fund was not
dominated as outputs. Galagadera and Silvapulle (2002) employed a DEA formulation to
assess the relative performance of Australian mutual funds with sales charges, expense ratios,
minimum initial investment and standard deviation of returns for several time horizons as
inputs and gross performance for different time horizons as output. Lozano and Gutierez
(2008) performed a relative efficiency analysis for a sample of Spanish funds using six
different DEA-like linear programming models and certain return and risk variables to
measure inputs and outputs. Measuring technical efficiency of Portuguese pension fund
management companies by means of DEA analysis was the objective of Garcia (2010).
The need for simultaneously considering several criteria while incorporating investors’
own preferences is particularly important for the delegated nature of professional money
management such as pension funds, mutual funds etc., whose clients do not usually share the
same investment preferences (e.g., financial goals, risk aversion, investment horizon etc.).
Non-parametric alternative evaluation techniques such as DEA can be helpful in this context.
However efficiency evaluation methods such as DEA, are only restricted in distinguishing
between (relatively) efficient and inefficient mutual funds, thus not allowing for direct
comparisons between the mutual funds, which are needed in order to build a ranked list of the
funds in terms of their overall performance2. Such a ranking would be useful for investors in
selecting the best performing funds to add to their portfolios, as well as for mutual fund
managers in order to track their performance over time and in comparison to their peers. On
the basis of such a ranking evaluation model, rating systems (similar to the one of
Morningstar) could also be constructed.
2 Several DEA-based approaches have been proposed for ranking problems (Adler et al., 2002), but such
techniques are set-dependent and often suffer from considerable shortcomings with respect to the properties of
the obtained results (Bouyssou, 1999).
5
Multi-criteria decision making (MCDM) provides an arsenal of techniques for
aggregating multiple criteria in performance evaluation problems in order to select, rank,
classify, and describe a set of alternative options. In this study, we employ an additive
multicriteria evaluation model in the context of fund performance appraisal. The additive
model retains the simplicity and comprehensibility of linear models often used in regression
and DEA-based techniques, while allowing non-linear preferences to be taken into
consideration. A similar modeling approach was implemented by Pendaraki et al. (2005) who
used an additive model in a regression-like framework combining multiple risk and return
measures for fund classification based solely on their excess returns. The purpose of this
classification was to select funds for constructing a mutual fund investment portfolio.
The purpose of this study, however, is different from the one of Pendaraki et al. (2005).
In particular, the main goal of this paper is to analyze the performance of Greek mutual funds
over the period from 2000 to 2009, during which the Greek market has undergone major
changes (e.g., introduction to the Eurozone, emergence of the recent crisis). Our objective is
not to build an excess return prediction and fund classification model, but to obtain an
evaluation of the funds’ performance aggregating modern risk adjusted return measures (e.g.,
Carhart’s alpha) as well as cost variables (which were not considered in the study of
Pendaraki et al., 2005). The ranking model introduced in this study enables the analysis of the
Greek fund market over the past decade, and provides the basis for screening the performance
of funds in the future. On the methodological side, instead of using the regression-based
disaggregation approach of Pendaraki et al. (2005), a simulation approach is employed in this
study, based on the framework of stochastic multicriteria acceptability analysis (Lahdelma et
al. 1998). In the absence of an expert fund analyst who could provide specific preferential
information, the simulation process enables consideration and combination of multiple
scenarios with respect to preferences of the decision maker (fund manager or investor). This is
particularly useful in decision making situations where preference information is partly or
totally unavailable, as in the case of fund appraisal. Moreover, we extend the work of
Bechmann & Rangvid (2007) for Danish funds developing a more robust fund rating system
that encompasses both return and cost attributes of the funds.
The remainder of the paper is structured as follows. Section 2 describes the employed
data, the risk adjusted returns along with the basic concepts of the multicriteria evaluation
framework. Section 3 presents the results from the application on Greek equity funds. Finally,
section 4 concludes the paper and discusses some future research directions.
6
2. EMPIRICAL FRAMEWORK
2.1 Data and Variables
The data used in the empirical analysis involve Greek domestic equity funds that operate for
at least one year during the period 2000–2009. The sample consists of 485 fund-year
observations. The number of funds varies through the time period since we are interested in
eliminating any potential survivorship bias (Brown et al., 1992; Carhart, 2002) resulting from
omitting funds that cease to exist. The criteria employed in the funds appraisal process can be
roughly classified into risk/return variables and cost variables. The risk/return variables
include deviation of a fund’s return from each year median return (DMR), annualized
Jensen’s alpha, and annualized abnormal return resulting from Carhart’s multi factor model,
respectively. The latter measure, that is widely used in modern studies, is considered superior
since it adjusts funds’ returns for common risk factors other than market risk that are priced in
financial markets such as size, value (Fama and French 1993, 1996) and momentum effect
(Jegadeesh and Titman 1993). We followed Otten and Bams (2002) in constructing the
strategy-mimicking portfolios while all stocks included in the Worldscope for Greek market
were utilized.
Jensen’s alpha measures the ability of a fund manager to generate excess returns over
and above the return that would be justified by the exposure of his portfolio to market or
systematic risk. Formally, this is given by the intercept pα of the regression of the fund
excess returns on the market index excess returns (Jensen, 1968):
pt p p mt pt
R Rα β= + + ε (1)
where is the stock market excess return. mtR
In order to capture excess returns generated by tactical asset allocation strategies
exploiting the inconsistencies of the CAPM such as size or value strategies, we employ a
multi-index performance evaluation model. More specifically, we use Carhart’s multifactor
model which decomposes excess fund returns into excess market returns, returns generated by
buying small size stocks and selling big size stocks (Small Minus Big - SMB), returns
generated by buying stocks with high book-to-market ratios and selling stocks with low book-
to-market ratios (High Minus Low - HML), returns generated by buying and selling stocks
with high and low past year’s returns (MOM), respectively. The four-factor model of
7
abnormal return is given by the intercept (pCARHARTα ) in the following regression (Carhart,
1997):
0 1 2 3pt pCARHART p mt p p p ptR R SMB HML MOMα β β β β= + + + + ε+ (2)
where
• ptR is the fund’s excess return,
• mt
R is market’s excess return
• is the difference in returns between a portfolio of small and big stocks, respectively, SMB
• HML is the difference in returns between a portfolio of high book-to-market and low
book-to-market ratio stocks,
• MOM is the difference in returns between a portfolio of winners and losers stocks during
the previous year, respectively.
Another key feature of the fund evaluation process is total risk for each fund that is
measured by the annualized standard deviation of the returns in each year. Regarding cost
variables, a fund’s annual total expense ratio refers to the general overall costs including
management fees and other operational and administrative costs charged by the fund and is
typically expressed as a ratio over its average net assets for the year. Annual mutual fund data
such as total expenses, total net assets (in €) have been collected from the funds’ annual
reports. We also include the fund’s front-end loads which are paid by shareholders once and
are not included as part of the expense ratio.
Table 1 summarizes all appraisal criteria used in the analysis, whereas Tables 2 and 3
present some relevant statistics (yearly averages and correlations).
Insert Tables 1–3 here
2.2 Multicriteria Methodology
The evaluation of the performance of funds in this study is based on a multicriteria approach
implemented within the SMAA-2 framework (Stochastic Multicriteria Acceptability Analysis;
Lahdelma and Salminen, 2001). SMAA-2 provides a rather general context for multicriteria
evaluation problems under uncertainty, but it is also applicable in deterministic problems. The
basic underlying idea of SMAA-2 is that the uncertainties involved in multicriteria evaluation
problems can be taken into consideration through simulation approaches. Such simulations
8
enable the decision maker to obtain a holistic view of the evaluation results under different
scenarios with regard to the parameters of the decision model and/or the evaluation data.
SMAA-2 extends the original framework of the SMAA method (Lahdelma et al., 1998) into
ranking problems, where a discrete set of alternatives should be ranked in terms of their
overall performance from the best to the worst. A review of SMAA, its extensions, and
applications can be found in the work of Tervonen and Figueira (2008).
In the context of this study, SMAA-2 is used to obtain a multicriteria performance
evaluation and ranking of the mutual funds. The lack of a particular decision maker (fund
manager or investor) that could provide specific preferential information on the relative
importance of the appraisal criteria and their aggregation, make the adopted simulation
approach particularly useful. Such an approach enables a comprehensive evaluation of the
funds’ performance under different scenarios with respect to the parameters of the evaluation
model. In that regard, the evaluation takes into account different settings and hypotheses with
respect to the investment policy and risk attitude of a potential fund manager or individual
investor.
In this study we apply the SMAA-2 simulation framework with an additive value
function evaluation model:
(3) 1
( ) ( )n
i j j
j
V w v=
=∑x ijx
where 1 2( , , , )i i i in
x x x= …x
1 2, , , nw w w…
is the vector with the data for mutual fund i on evaluation
criteria, and are non-negative trade-off constants for the criteria, which are
assumed to sum up to 1, and
n
1 2, , ,n
v v v… are the marginal value function of the criteria
normalized in [0, 1].
In order to avoid posing any restrictions (other than monotonicity) on the form of the
marginal value functions, we employ a piecewise linear modeling approach (Jacquet-Lagrèze
and Siskos, 1982). In particular, the scale of each criterion j is divided into subintervals
defined by breakpoints
jk
10 1 j
j j j j
kb b b b−<jk<< <L , where b and are the minimum and
maximum value, respectively, of criterion
0
j
jkb
j in the data set. Then, assuming that the
performance ijx of mutual fund i on criterion j falls in a subinterval 1[ , ]j j
blb − l (for some
), its marginal value can be expressed as follows: {1, , }jk∈ …l
1
1 1
1
( ) ( ) [ ( ) ( )]
j
ijj j j
j ij j j j j j
x bv x v b v b v b
b b
−− −
−
−= + −
−l
l l l
l l
(4)
9
With this modeling approach, the simulation framework of SMAA-2 is implemented to
evaluate the mutual funds on the basis of different scenarios for the additive evaluation model.
In contrast to the original SMAA-2 methodology, the simulation process is not restricted to
the trade-off constants. Instead, random scenarios are constructed for all the parameters of
the additive evaluation model, including both the trade-offs and the marginal value functions.
In particular, each scenario ( ) involves the construction of a random additive
value function
S
s
(
1, 2, ,s = …
) (
S
1 1 1( ) )s s s n
V w xxns ns
w v= +…+v x through the following two-step process:
1. For each criterion j , a random marginal value function is first constructed by generating
uniformly distributed random numbers in (0, 1), which are sorted and then assigned
to
1jk −
1( )j
jsv b , 2( )j
jsv b , …, . For normalization, 1(j
j
js kv b − ) 0( )j
jsv b and ( )j
j
js kv b are set equal to
0 and 1, respectively. In all simulations, four subintervals are used for the criteria (i.e.,
, for all ) defined on the basis of the 25%, 50%, and the 75% percentile
of the data.
4jk = 1,j = …, n
2. Random trade-off constants 1 , ,s nsw w… are generated, such that jsw ε≥ (for all
) and . In the present analysis, 1, ,j n= … 1sw w+ +L 1
ns= ε is set equal to 0.01 in order to
exclude unrealistic scenarios, where a criterion becomes almost irrelevant for the
evaluation.
The resulting additive value model is used to evaluate the mutual funds and rank
them according to their global values (in descending order), i.e., the best mutual fund with the
highest global value receives a rank 1 and the worst one (with the lowest global value)
receives a rank (assuming no ties). The results of all simulation runs can be aggregated to
obtain a global evaluation for each fund. In this study three aggregation procedures are
considered, including two procedures that take into account the rankings of the funds over all
simulation runs as well as a procedure that aggregates the evaluation scores (global values) of
the mutual funds. In particular, the first aggregation measure is the holistic acceptability
index, which is a weighted average of the probabilities that a mutual fund receives different
ranks. Lahdelma and Salminen (2001) proposed this acceptability index in the context of the
SMAA-2 method. In the second approach, the ranks are aggregated using the Borda count
method. Finally, the third aggregation rule involves the average of the scores (global values)
for each mutual fund over all simulation runs. The use of these three aggregation procedures
enables the consideration of the robustness of the results under different schemes for
( )sV x
( )sV x
m
10
aggregating the results of simulation scenarios. The corresponding aggregate evaluation
measures are defined as follows:
1 1
1
1
1 1Holistic acceptability: ( )
1Borda score: ( ( )
1
1Average score: ( )
)
( )
= = =
=
=
⎛ ⎞= ⎜ ⎟
⎝ ⎠
−−
=
=
∑ ∑ ∑
∑
∑
l ll l
m m m
i i
r r
m
i
r
S
i s i
s
H p
B mm
V VS
x
x
x x
r
irr p
where is the percentage of scenarios in which fund i receives a rank . The Borda score
is normalized over its maximum value, which is equal to
irp r
1−m . Thus, all measures range in
[0, 1] with higher scores corresponding to better performing funds.
3. RESULTS
The multicriteria evaluation methodology described in the previous section was applied on the
panel data set consisting of 485 fund-year observations for the period 2000–2009. The
simulation analysis was performed considering 10,000 scenarios. With regard to the input
data (i.e., fund performance evaluation criteria), two settings are considered. In the first
setting, the evaluation is based on Jensen’s alpha, the expense ratio, the front-end loads, the
standard deviation of the returns, and the deviation of a funds’ annual return from the
corresponding year sample median. Henceforth, this evaluation will be referred as setting J.
The difference in the second setting (setting C), is that Carhart’s alpha is used instead of the
Jensen’s alpha. As for Jensen’s alpha, this is rooted in the CAPM framework. However, the
CAPM is, in principle, a static model of capital markets ignoring their time-varying
component. In fact, a manager exploiting size, value (Fama and French, 1993, 1996), or
momentum strategies (Jegadeesh and Titman, 1993) could deliver abnormal returns without
any CAPM beta exposure. In other words, Carhart’s multi factor model decomposes the part
of fund’s abnormal return that is due to pure managerial skill so it is a more complete and
accurate performance measure.
3.1 Overall evaluation results
The overall results are summarized in Table 4. For each year the funds’ averages for the
three aggregate evaluation measures are presented (under both settings J and C). As a measure
11
of the dispersion of the funds’ performance in each year, the coefficient of variation is also
reported in parentheses. Table 4 also presents (for comparison purposes) the average annual
return of the MFs as well as the annual return of the composite share price index of the
Athens Stock Exchange (ASE-GI).
Insert Table 4 here
According to the results of Table 4, the overall performance of the mutual funds in the
sample improved from 2000 to 2002, followed by a minor decrease and stabilization in 2003
and 2004. In 2005 the funds achieved their best performance, followed by a decline in 2006–
2007. In 2008 the performance of the mutual funds dropped considerably, but in 2009 some
improvement was achieved. These findings are verified with all evaluation measures under
both settings (J and C). The only discrepancies between the two evaluation settings involve
years 2004 and 2007, where using the Carhart’s index (setting C) an improvement is found
compared to the preceding years vs. a decrease found with the Jensen’s index (setting J). The
Kendall’s τ rank correlation coefficient (Table 5) for the results obtained with the three
evaluation measures clearly indicates that the differences due to the use of different
aggregation procedures are limited. The rank correlations between the results of the two
settings are also very high with the Kendall’s τ being approximately equal to 0.9.
In the results of Table 4 it is also interesting to note that the coefficients of variation in
years 2000–2004 are lower compared to the subsequent years 2005–2009. This indicates that
the differences in the performance of the mutual funds are clearer in the first years of the
analysis. The documented absence of deviations in performance in particular during the last 5
years could be attributed to the competition between fund management companies. As part of
its aggressive sales policy, one of the three largest domestic fund companies has waived sales
fees for its family funds forcing other companies to follow in the fear of a potential lost
market share.
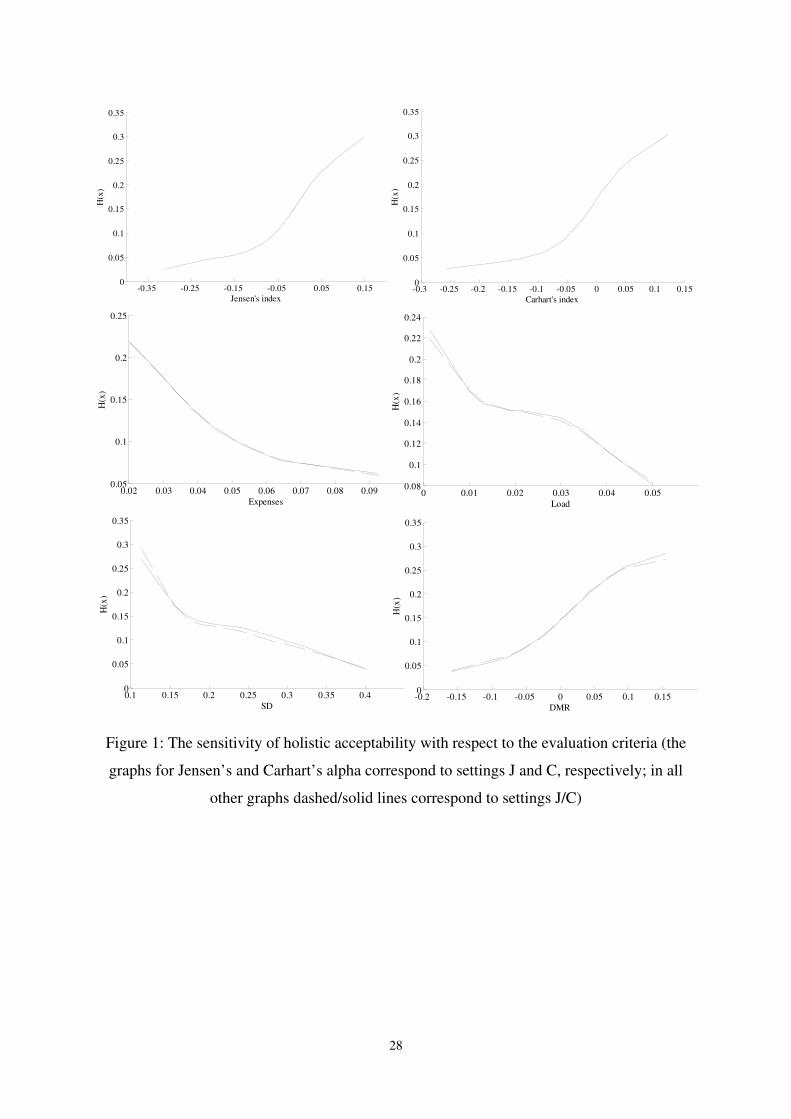
3.2 The importance of the criteria
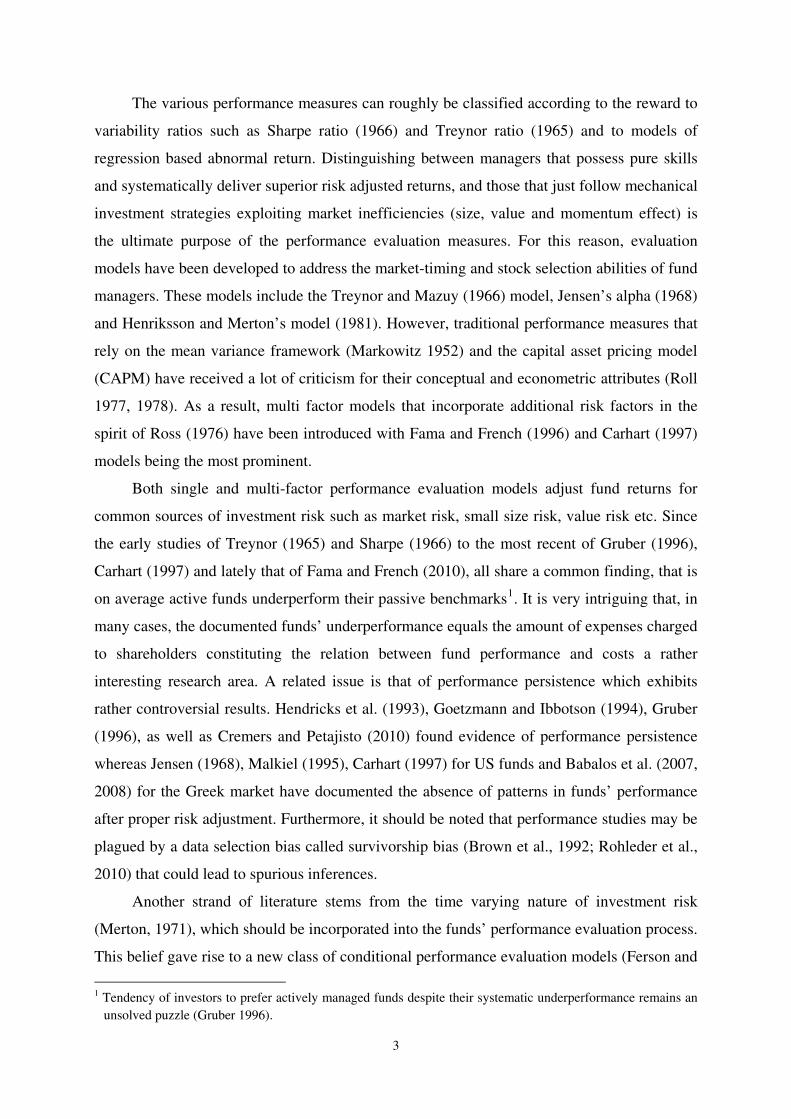
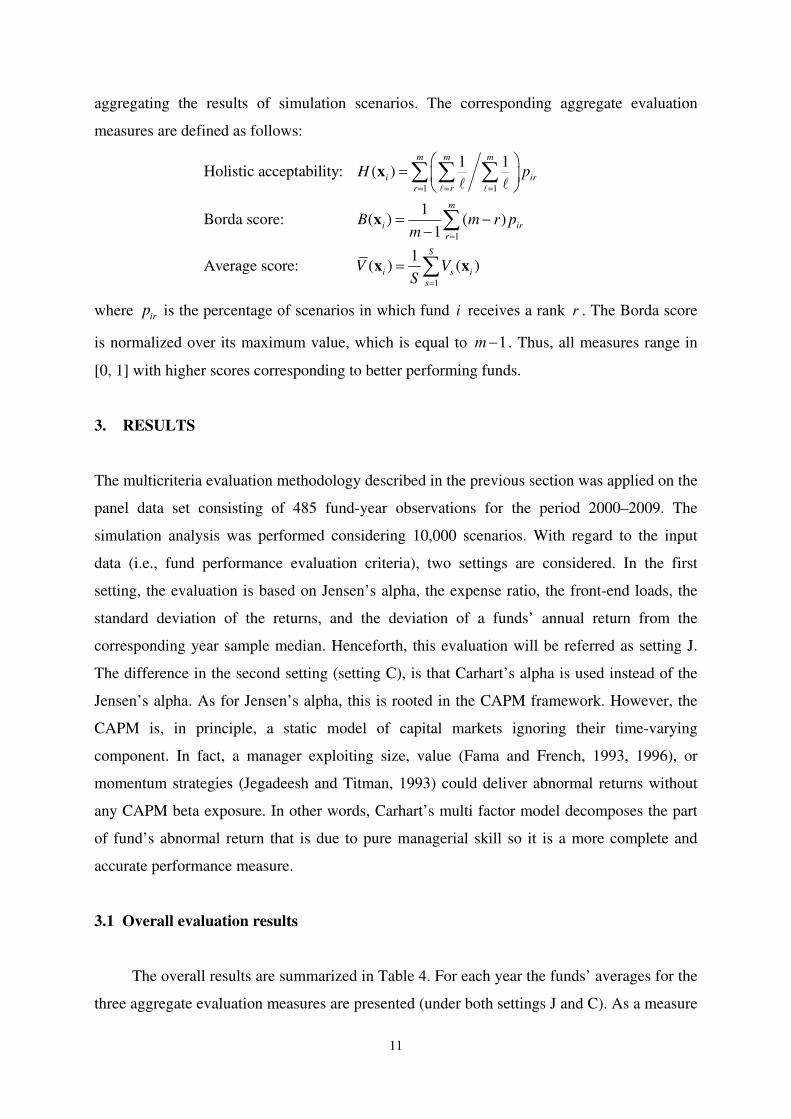
In order to get some insight on the role of the criteria on the evaluation of the mutual funds,
the sensitivity of the obtained holistic acceptability indices was measured with respect to each
criterion. In particular, the funds’ data on each criterion j were binned into 20 subintervals
12
defined with by the 5th, 10th, …, percentiles of the data values. The average appraisal results
(i.e., holistic acceptabilities, Borda scores, mean scores) for the funds in
each bin were then expressed as a function of the associated averages of criterion
1 2 ,2, ,ˆ ˆ ˆ,…j j j
A A A 0
j . Figure 1
illustrates the obtained smoothing spline approximation for the holistic acceptability index. It
is apparent that the differences between the two settings (J and C) are hardly noticeable
(similar results were obtained with the other aggregation procedures). As a measure of the
relative importance of the criteria the standard deviation jσ of was used,
normalized so that
1 2, ,ˆ ˆ ˆ,…j j
A A A ,20j
1 1nσ σ+ + =L . As shown from the results of Table 6 the Jensen’s alpha
and the Carhart’s alpha have the most significant impact on the estimated holistic evaluation
of the mutual funds, followed by DMR and the standard deviation. On the other hand, the two
variables related to the operation of the mutual funds (i.e., expenses, loads) are found to have
the weaker impact on the evaluation of the funds. These findings are verified by all three
aggregation procedures (holistic acceptabilities, Borda scores, mean scores).
The invisibility of operational costs such as expense ratio to individual investors as
documented by Barber et al. (2005) for US funds and Babalos et al. (2009) for Greek funds,
together with the reduction of participation fees implemented by specific domestic fund
companies might be responsible for the marginal association between operational attributes
and fund evaluation. Our findings are consistent with the notion that multi factor performance
measures namely Carhart’s alpha are superior compared to Jensen’s alpha since they capture
managers’ exposure to common sources of risk other than market risk.
Insert Figure 1 and Table 6 here
3.3 The dynamics of the evaluation
Table 7 presents some statistics on the dynamics of the evaluations. The table presents
the percentage of mutual funds that improved their performance from a year t to year 1t + ,
together with the Kendall’s τ coefficient of the rank correlation between the evaluations in
each pair of successive years. Given the very limited differences between the three
aggregation procedures, we only report the results for the holistic acceptability index. The
vast majority (about 80%) of the mutual funds performed better in 2002 and 2005 than the
corresponding preceding years 2001 and 2004. On the other hand, 2008 was clearly the worst
13
year, as less than 3% of the funds managed to improve their performance compared to 2007.
The values for the Kendall’s τ coefficient indicate that the rankings of the mutual funds in
each pair of successive years are positively correlated. All correlations are significant at the
1% level, except for the pairs 2001–2002 and 2008–2009, which are significant at the 5%
level. It is interesting to observe that the lowest correlations involve pairs of years with high
improvements in the overall performance of the mutual funds (e.g., 2001–2002, 2004–2005,
and 2008–2009). On the other hand, the evaluations and rankings of the funds in 2006 and
2008 (i.e., the two years with the largest annual decrease in the funds’ evaluation) show a high
correlation with the evaluations in the corresponding preceding years 2005 and 2007.
Insert Table 7 here
In order to analyze the factors that best describe the dynamics of the obtained
evaluations a binary classification of the mutual funds was performed. In particular, for each
year the funds whose holistic acceptability index increased compared to year were
distinguished from the funds whose holistic acceptability index decreased compared to year
. The annual changes of the variables were then tested against this classification, using
the area under the receiver operating characteristic curve (AUC), which is equivalent to the
Wilcoxon-Mann-Whitney statistic (Fawcett, 2006). AUC ranges in [0, 1] with values close to
0 or 1 indicating stronger association between an explanatory measure (i.e., independent
variable) and a binary classification of a set of observations (AUC values close to 0.5 indicate
no association). The corresponding results are reported in
t 1t −
1t −
Table 8 for all lagged variables in
both evaluation settings. All variables are found to be significant at the 1% level except for
the change in expenses which is significant at the 5% level under setting C. In both settings,
the annual change in the Carhart’s alpha has the highest predictive power of shifts in the
performance of the mutual funds3. As expected, under setting J, the change in the Jensen’s
alpha also has a strong association with the classification of the mutual funds, followed by
DMR. Under setting C, except for the Carhart’s alpha, DMR and the standard deviation are
also found quite important. Similarly to the results of Table 6, the two variables related to the
operation of the mutual funds (i.e., expenses, load) are found to have the weaker association
3 This finding is consistent with previous fund performance studies such as Elton et al (1996), Gruber (1996),
Carhart (1997)
14
with the classification of the funds. As it has already been stated, Carhart’s alpha conveys
valuable information compared to the rest of the variables regarding fund managers’
investment strategies and their attitude towards specific risk sources. In other words, Carhart’s
alpha highlights important aspects of managers’ assessment of the returns for specific stock
sectors or styles such as small size companies as it is reflected in their relevant risk exposures.
Insert Table 8 here
4. CONCLUSIONS
This paper illustrated the implementation of a multicriteria methodology for mutual fund
performance appraisal, applied on Greek equity funds. A series of original return and risk
measures along with cost variables were employed. The proposed additive value function
model was implemented in the context of the SMAA-2 simulation-based framework in order
to assess the mutual funds’ performance on the basis of different evaluation scenarios. The
evaluation was performed under two different settings incorporating either Jensen’s alpha
(1968) or Carhart’s (1997) more sophisticated performance measure.
The results from the two employed settings do not exhibit noticeable differences.
According to the overall results, average performance in terms of our proposed measure
exhibits significant variation throughout the period under examination reflecting different
market phases. Further, the robustness of the results was verified using different procedures
for aggregating the results of the SMAA-2 simulation analysis.
Delving further into the sensitivity of fund rankings we reach some intriguing findings.
Carhart’s alpha and the Jensen’s alpha appear to have the most significant impact on the
estimated holistic evaluation of the mutual funds, followed by the return of the funds and the
total risk as measured by standard deviation of returns. On the other hand, operational
attributes such as expense ratio and front-end loads seem to play a marginal only role in the
evaluation process.
Another key finding of our study pertains to the influence of Carhart’s alpha in
predicting shift of funds’ rankings. Among employed variables, Carhart’s alpha exhibits the
strongest predictive power regarding future variations in funds’ performance. This finding
highlights the significance of proper risk adjustment in determining fund rankings and
15
confirms the conjecture that investors should not rely solely on raw returns in terms of fund
evaluation.
On the decision support side, the proposed multicriteria performance evaluation of
mutual funds could be useful for fund managers and investors as a screening tool for
constructing fund portfolios with desirable characteristics. The multicriteria evaluation and
ranking scheme also allows a complete evaluation of all mutual funds under consideration and
the tracking of their performance over different time periods (e.g., as a benchmarking tool).
Future research could focus on extending the proposed methodology towards subsets of
equity funds formed on the basis of style or even for different types of funds such as balanced
or bond funds. The potential of constructing a fund rating system on the basis of the
multicriteria evaluation results could also be explored, together with the development of a
decision support system that would provide the users with the ability to perform real-time
analysis of market and historical data and take decisions on portfolio allocation and
monitoring.
Acknowledgements
We would like to thank an anonymous referee for his valuable comments that helped improve
the paper.
REFERENCES
Adler N, Friedman L and Sinuany-Stern Z (2002). Review of ranking methods in the data
envelopment analysis context. European Journal of Operational Research 140: 249–
265.
Anderson R, Brockman C, Giannikos C and McLeod R (2004). A non-parametric
examination of real estate mutual fund efficiency. International Journal of Business and
Economics 3: 225–238.
Babalos V, Caporale GM, Kostakis A and Philippas N (2008). Testing for persistence in
mutual fund performance and the ex-post verification problem: Evidence from the
Greek market. The European Journal of Finance 14: 735–753.
Babalos V, Kostakis A and Philippas N (2009). Managing mutual funds or managing expense
ratios? Evidence from the Greek fund industry. Journal of Multinational Financial
Management 19: 256–272.
16
Basso A and Funari S (2001). A data envelopment analysis approach to measure the mutual
fund performance. European Journal of Operational Research 135: 477–492.
Bechmann K.L & Rangvid J., (2007), Rating mutual funds: Construction and information
content of an investor-cost based rating of Danish mutual funds. Journal of Empirical
Finance 14: 662-693
Blake CR and Morey MR (2000). Morningstar ratings and mutual fund performance. Journal
of Financial and Quantitative Analysis 35: 451–483.
Bollen NPB and Busse JA (2005). Short term persistence in mutual fund performance. Review
of Financial Studies 18: 569–597.
Bouyssou, D (1999). Using DEA as a tool for MCDM: Some remarks. Journal of the
Operational Research Society 50: 974–978.
Brown SJ, Goetzmann W, Ibbotson R and Ross S (1992). Survivorship bias in performance
studies. Review of Financial Studies 5: 553–580.
Carhart M (1997). On persistence in mutual fund performance. Journal of Finance 52: 52–82.
Carhart MM, Carpenter JN, Lynch AW and Musto DK (2002). Mutual fund survivorship.
Review of Financial Studies 15: 1439–1463.
Christopherson J, Ferson W and Glassman D (1998). Conditioning manager alphas on
economic information: Another look at the persistence of performance. Review of
Financial Studies 11: 111–142.
Cremers M and Petajisto A (2009). How active is your fund manager? A new measure that
predicts performance. Review of Financial Studies 22: 3329–3365.
Daraio C and Simar L (2006). A robust nonparametric approach to evaluate and explain the
performance of mutual funds. European Journal of Operational Research 175: 516–
542.
Del Guercio D and Tkac PA (2007). Star power: The effect of Morningstar ratings on mutual
fund flow. Journal of Financial and Quantitative Analysis 43: 907–936.
Fama EF and French KR (1993). Common risk factors in the returns on bonds and stocks.
Journal of Financial Economics 33: 3–53.
Fama EF. and French KR (1996). Multifactor explanations of asset pricing anomalies.
Journal of Finance 51: 55–84.
Fama E and French K (2010). Luck versus skill in the cross section of mutual fund returns.
Journal of Finance 65: 1915–1947.
Ferson W and Schadt R (1996). Measuring fund strategy and performance in changing
economic conditions. Journal of Finance 51: 425–461.
17
Ferson W and Warther V (1996). Evaluating fund performance in a dynamic market.
Financial Analysts Journal 52: 20–28.
Fawcett T (2006). An introduction to ROC analysis. Pattern Recognition Letters 27: 861–874.
Galagadera UA and Silvapulle P (2002). Australian mutual fund performance appraisal using
data envelopment analysis. Managerial Finance 28: 60–73.
Garcia MT (2010). Efficiency evaluation of the Portuguese pension funds management
companies. Journal of International Financial Markets, Institutions & Money 20: 259–
266.
Gregoriou GN (2003). Performance appraisal of funds of hedge funds using data envelopment
analysis. Journal of Wealth Management 5: 88–95.
Gregoriou GN, Sedzro K and Zhu J (2005). Hedge fund performance appraisal using data
envelopment analysis. European Journal of Operational Research 164: 555–571.
Gruber MJ (1996). Another puzzle: The growth in actively managed mutual funds. Journal of
Finance 51: 783–810.
Hendricks D, Patel J. and Zeckhauser R (1993). Hot hands in mutual funds: Short-run
persistence of relative performance, 1974–88. Journal of Finance 48: 93–130.
Henriksson RD and Merton RC (1981). On market timing and investment performance II:
Statistical procedures for evaluating forecasting skills. Journal of Business 54: 513–533.
Jacquet-Lagrèze E and Siskos Y (1982). Assessing a set of additive utility functions for
multicriteria decision making: The UTA method. European Journal of Operational
Research 10: 151–164.
Jegadeesh N and Titman S (1993). Returns to buying winners and selling losers: Implications
for stock market efficiency. Journal of Finance 48: 65–91.
Jensen M (1968). The performance of mutual funds in the period 1945–64, Journal of
Finance 23: 389–416.
Lahdelma R and Salminen P (2001). SMAA-2: Stochastic multicriteria acceptability analysis
for group decision making. Operations Research 49: 444–454.
Lahdelma R, Hokkanen J and Salminen P (1998). SMAA-stochastic multiobjective
acceptability analysis. European Journal of Operational Research 106: 137–143.
Lozano S and Gutierez E (2008). Data envelopment analysis of mutual funds based on second
order stochastic dominance. European Journal of Operational Research 189: 230–244.
Malkiel BG (1995). Returns from investing in equity mutual funds 1971–91. Journal of
Finance 50: 549–572.
Markowitz H (1952). Portfolio selection. Journal of Finance 7: 77–91.
18
Merton R (1973). An intertemporal capital asset pricing model . Econometrica 41: 867–887.
Murthi BPS, Choi YK and Desai P (1997). Efficiency of mutual funds and portfolio
performance measurement: A non-parametric approach. European Journal of
Operational Research 98: 408–418.
Murthi BPS and Choi YK (2001). Relative performance evaluation of mutual funds: A non-
parametric approach. Journal of Business Finance and Accounting 28: 853–876.
Otten R and Bams D (2002). European mutual fund performance. European Financial
Management 8: 75–101.
Pendaraki K, Zopounidis C and Doumpos M (2005). On the construction of mutual fund
portfolios: A multicriteria methodology and an application to the Greek market of
equity mutual funds. European Journal of Operational Research 163: 462–481.
Rohleder M, Scholz H and Wilkens M (2010). Survivorship bias and mutual fund
performance: Relevance, significance, and methodical differences. Review of Finance
(in press).
Roll R (1977). A critique of the asset pricing theory’s tests: part I: On past and potential
testability of the theory. Journal of Financial Economics 4: 129–176.
Roll R (1978). Ambiguity when performance is measured by the security market line. Journal
of Finance 33: 1051–1069.
Ross S (1976). The arbitrage theory of capital asset pricing. Journal of Economic Theory 13:
341–360.
Sengupta J (2003). Efficiency tests for mutual fund portfolios. Applied Financial Economics
13: 869–876.
Sharpe WF (1964). Capital asset prices: A theory of market equilibrium under conditions of
risk. Journal of Finance 19: 425–442.
Sharpe WF (1966). Mutual fund performance. Journal of Business 39: 119–138.
Tervonen T and Figueira J (2008). A survey on stochastic multicriteria acceptability analysis
methods. Journal of Multi-Criteria Decision Analysis 15: 1–14.
Treynor J (1965). How to rate management of investment funds. Harvard Business Review
43: 63–75.
Treynor J and Mazuy K (1966). Can mutual funds outguess the market?. Harvard Business
Review 44: 131–136.
19

Table 1: List of evaluation criteria
Funds appraisal criteria Abbreviation
Jensen’s alpha JENSEN
Carhart’s alpha CARHART
Total expense ratio EXPENSES
Front-end loads LOAD
Annualized standard deviation of the returns SD
Deviation of a fund’s return from each year median return DMR
20
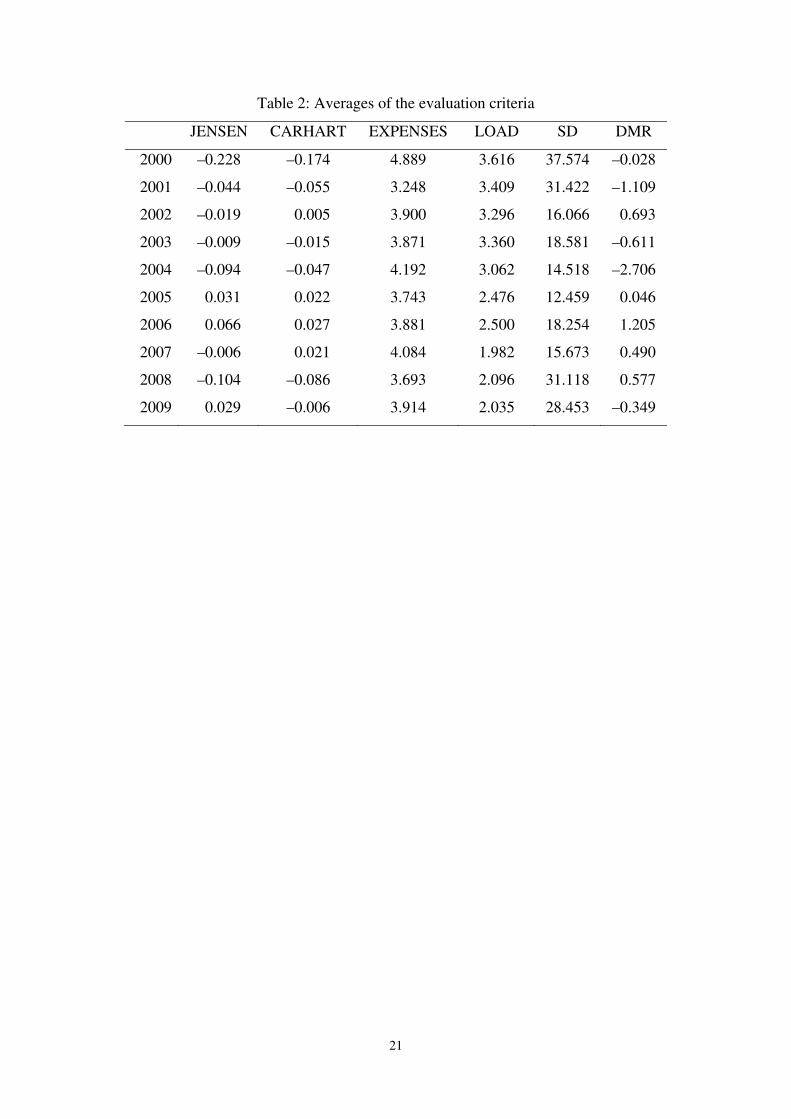
Table 2: Averages of the evaluation criteria
JENSEN CARHART EXPENSES LOAD SD DMR
2000 –0.228 –0.174 4.889 3.616 37.574 –0.028
2001 –0.044 –0.055 3.248 3.409 31.422 –1.109
2002 –0.019 –0.005 3.900 3.296 16.066 –0.693
2003 –0.009 –0.015 3.871 3.360 18.581 –0.611
2004 –0.094 –0.047 4.192 3.062 14.518 –2.706
2005 –0.031 –0.022 3.743 2.476 12.459 –0.046
2006 –0.066 –0.027 3.881 2.500 18.254 –1.205
2007 –0.006 –0.021 4.084 1.982 15.673 –0.490
2008 –0.104 –0.086 3.693 2.096 31.118 –0.577
2009 –0.029 –0.006 3.914 2.035 28.453 –0.349
21
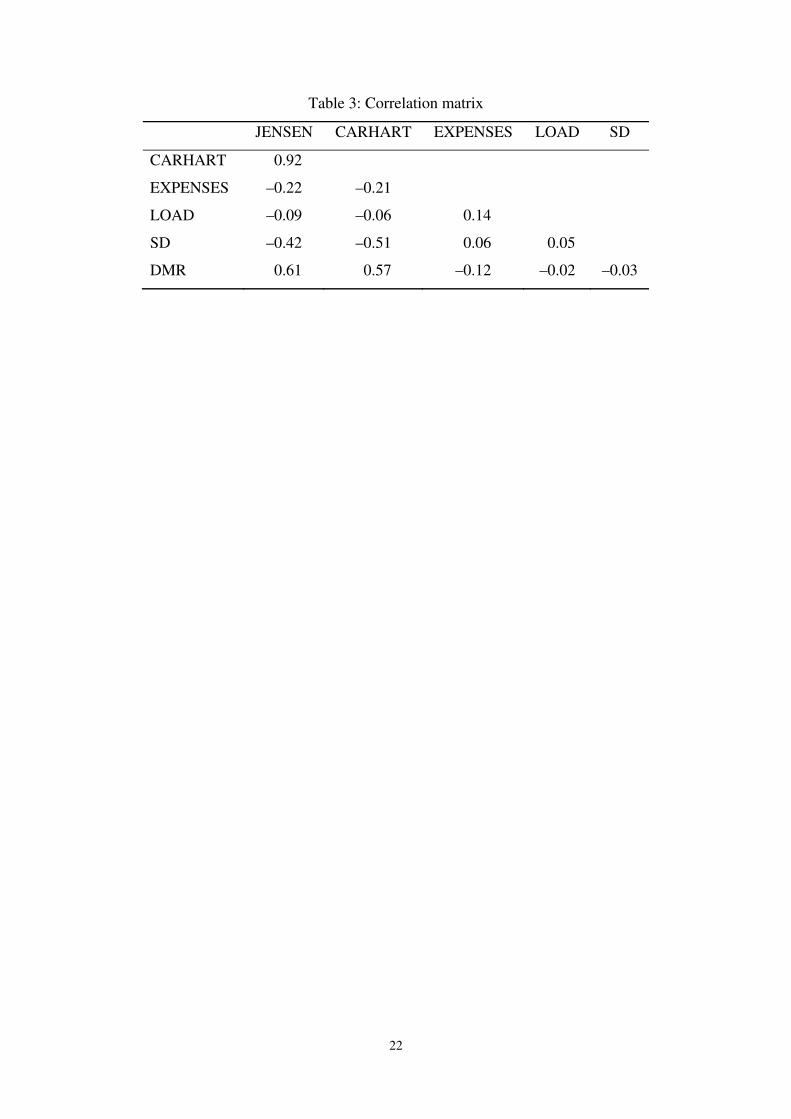
Table 3: Correlation matrix
JENSEN CARHART EXPENSES LOAD SD
CARHART –0.92
EXPENSES –0.22 –0.21
LOAD –0.09 –0.06 –0.14
SD –0.42 –0.51 –0.06 –0.05
DMR –0.61 –0.57 –0.12 –0.02 –0.03
22
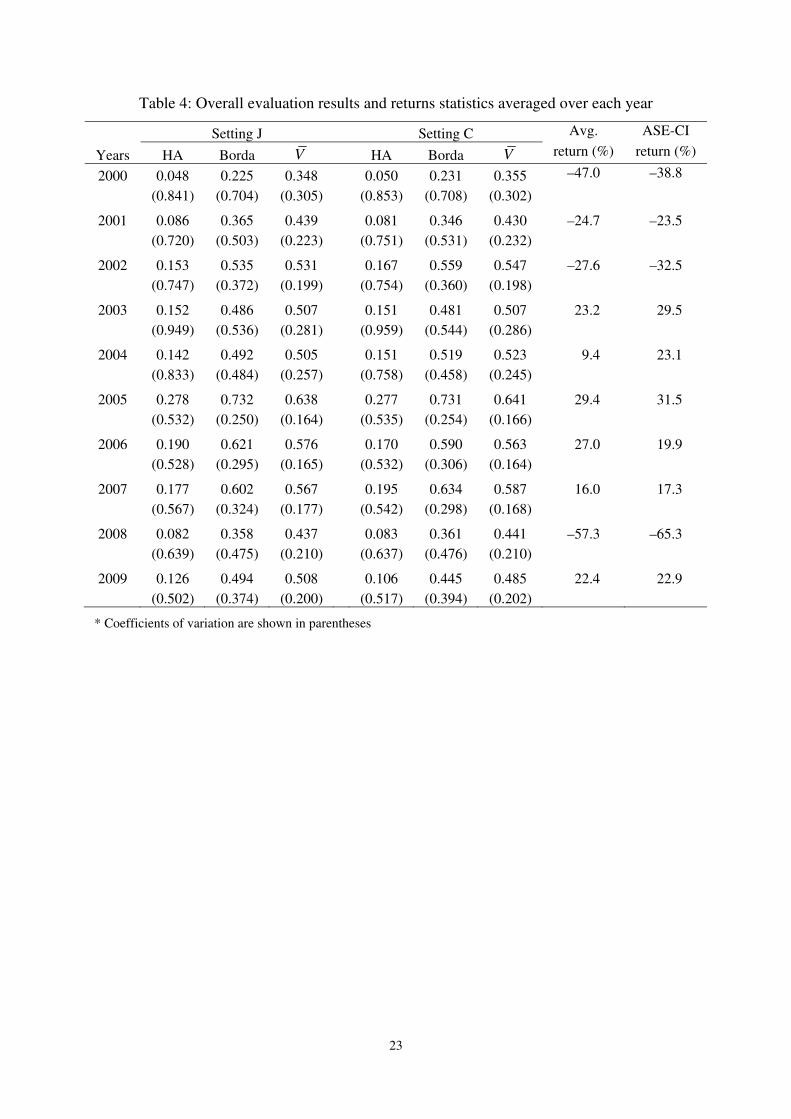
Table 4: Overall evaluation results and returns statistics averaged over each year
Setting J Setting C Avg. ASE-CI
Years HA Borda V HA Borda V return (%) return (%)
2000 0.048 0.225 0.348 0.050 0.231 0.355 –47.0 –38.8
(0.841) (0.704) (0.305) (0.853) (0.708) (0.302)
2001 0.086 0.365 0.439 0.081 0.346 0.430 –24.7 –23.5
(0.720) (0.503) (0.223) (0.751) (0.531) (0.232)
2002 0.153 0.535 0.531 0.167 0.559 0.547 –27.6 –32.5
(0.747) (0.372) (0.199) (0.754) (0.360) (0.198)
2003 0.152 0.486 0.507 0.151 0.481 0.507 –23.2 –29.5
(0.949) (0.536) (0.281) (0.959) (0.544) (0.286)
2004 0.142 0.492 0.505 0.151 0.519 0.523 –09.4 –23.1
(0.833) (0.484) (0.257) (0.758) (0.458) (0.245)
2005 0.278 0.732 0.638 0.277 0.731 0.641 –29.4 –31.5
(0.532) (0.250) (0.164) (0.535) (0.254) (0.166)
2006 0.190 0.621 0.576 0.170 0.590 0.563 –27.0 –19.9
(0.528) (0.295) (0.165) (0.532) (0.306) (0.164)
2007 0.177 0.602 0.567 0.195 0.634 0.587 –16.0 –17.3
(0.567) (0.324) (0.177) (0.542) (0.298) (0.168)
2008 0.082 0.358 0.437 0.083 0.361 0.441 –57.3 –65.3
(0.639) (0.475) (0.210) (0.637) (0.476) (0.210)
2009 0.126 0.494 0.508 0.106 0.445 0.485 –22.4 –22.9
(0.502) (0.374) (0.200) (0.517) (0.394) (0.202)
* Coefficients of variation are shown in parentheses
23
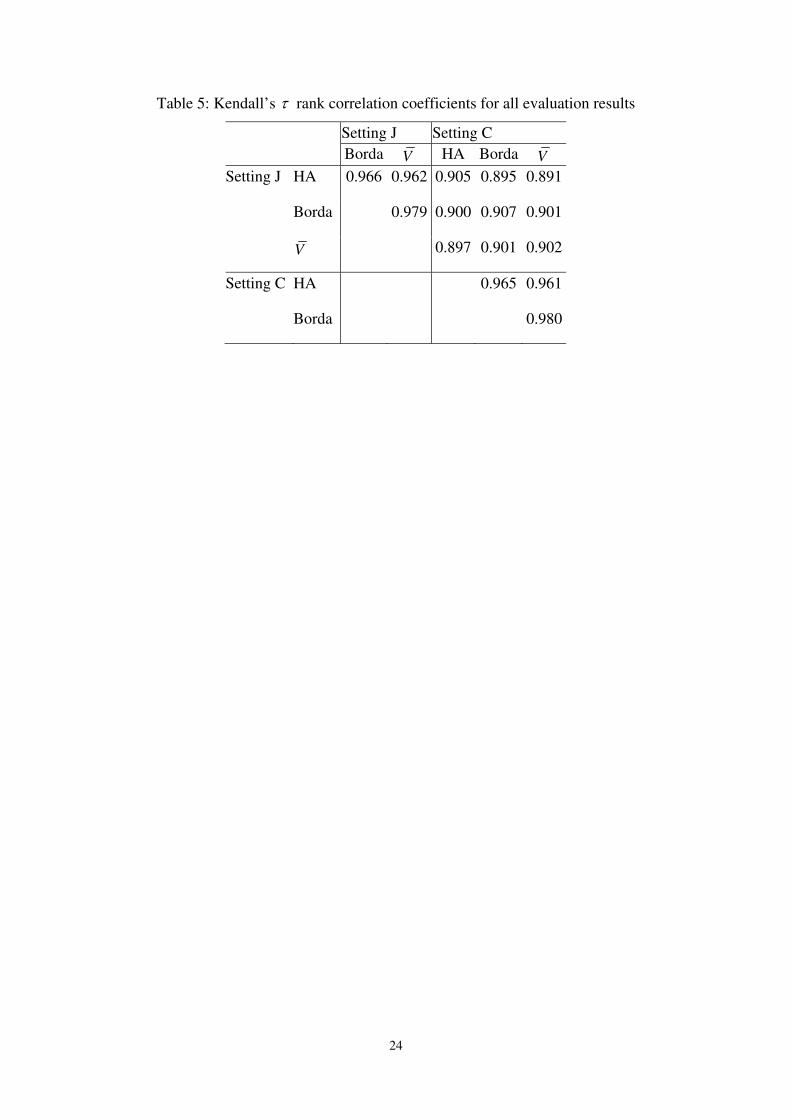
Table 5: Kendall’s τ rank correlation coefficients for all evaluation results
Setting J Setting C
Borda V HA Borda V
Setting J HA 0.966 0.962 0.905 0.895 0.891
Borda 0.979 0.900 0.907 0.901
V 0.897 0.901 0.902
Setting C HA 0.965 0.961
Borda 0.980
24
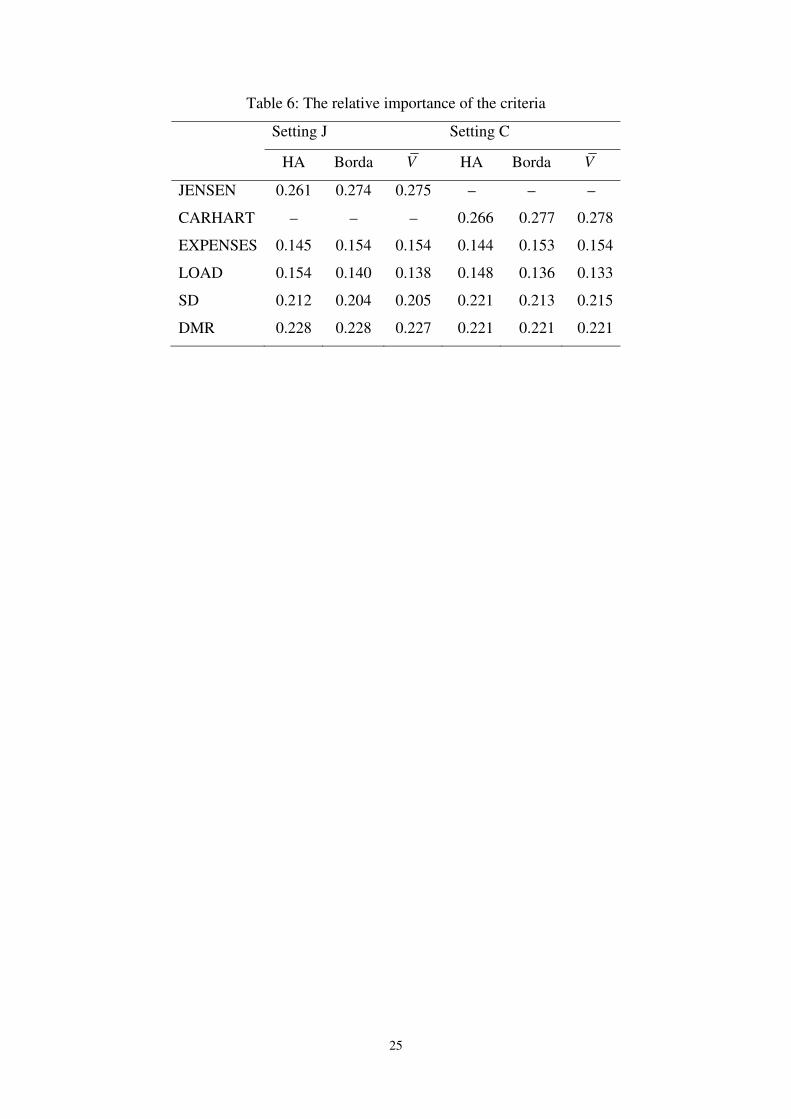
Table 6: The relative importance of the criteria
Setting J Setting C
HA Borda V HA Borda V
JENSEN 0.261 0.274 0.275 – – –
CARHART – – – 0.266 0.277 0.278
EXPENSES 0.145 0.154 0.154 0.144 0.153 0.154
LOAD 0.154 0.140 0.138 0.148 0.136 0.133
SD 0.212 0.204 0.205 0.221 0.213 0.215
DMR 0.228 0.228 0.227 0.221 0.221 0.221
25
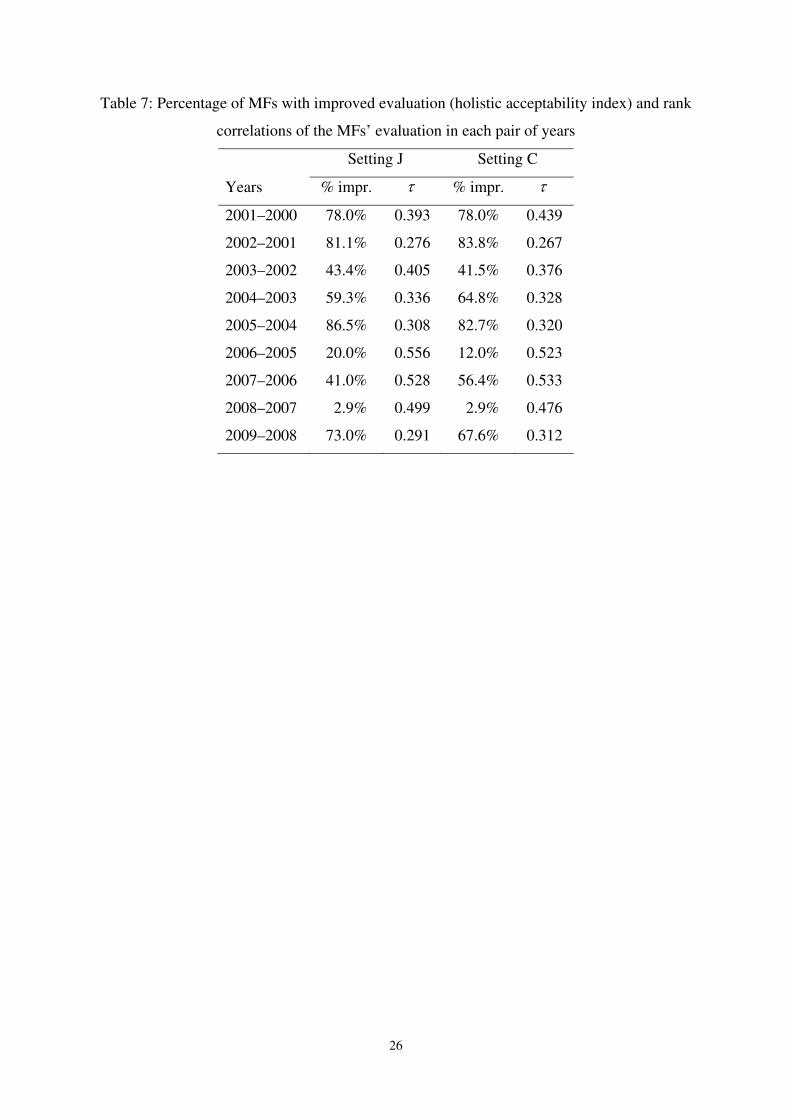
Table 7: Percentage of MFs with improved evaluation (holistic acceptability index) and rank
correlations of the MFs’ evaluation in each pair of years
Setting J Setting C
Years % impr. τ % impr. τ
2001–2000 78.0% 0.393 78.0% 0.439
2002–2001 81.1% 0.276 83.8% 0.267
2003–2002 43.4% 0.405 41.5% 0.376
2004–2003 59.3% 0.336 64.8% 0.328
2005–2004 86.5% 0.308 82.7% 0.320
2006–2005 20.0% 0.556 12.0% 0.523
2007–2006 41.0% 0.528 56.4% 0.533
2008–2007 02.9% 0.499 02.9% 0.476
2009–2008 73.0% 0.291 67.6% 0.312
26
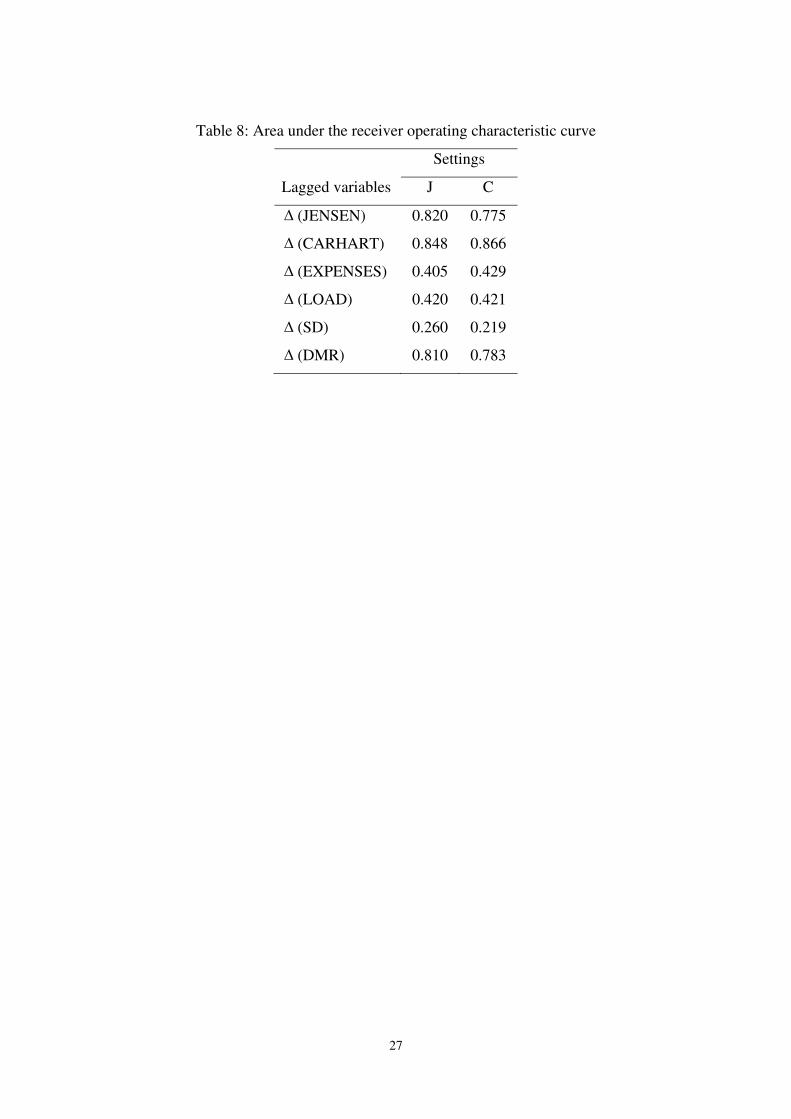
Table 8: Area under the receiver operating characteristic curve
Settings
Lagged variables J C
(JENSEN) 0.820 0.775
(CARHART) 0.848 0.866
(EXPENSES) 0.405 0.429
(LOAD) 0.420 0.421
(SD) 0.260 0.219
(DMR) 0.810 0.783
Δ
Δ
Δ
Δ
Δ
Δ
27
-0.35 -0.25 -0.15 -0.05 0.05 0.150
0.05
0.1
0.15
0.2
0.25
0.3
0.35
Jensen's index
H(x
)
-0.3 -0.25 -0.2 -0.15 -0.1 -0.05 0 0.05 0.1 0.150
0.05
0.1
0.15
0.2
0.25
0.3
0.35
Carhart's index
H(x
)
0.02 0.03 0.04 0.05 0.06 0.07 0.08 0.090.05
0.1
0.15
0.2
0.25
Expenses
H(x
)
0 0.01 0.02 0.03 0.04 0.050.08
0.1
0.12
0.14
0.16
0.18
0.2
0.22
0.24
Load
H(x
)
0.1 0.15 0.2 0.25 0.3 0.35 0.40
0.05
0.1
0.15
0.2
0.25
0.3
0.35
SD
H(x
)
-0.2 -0.15 -0.1 -0.05 0 0.05 0.1 0.150
0.05
0.1
0.15
0.2
0.25
0.3
0.35
DMR
H(x
)
Figure 1: The sensitivity of holistic acceptability with respect to the evaluation criteria (the
graphs for Jensen’s and Carhart’s alpha correspond to settings J and C, respectively; in all
other graphs dashed/solid lines correspond to settings J/C)
28