Embed Size (px)
Citation preview

Queensland University of Technology School of Life Sciences
Mutation Frequency of Non-ESBL Phenotype SENTRY (Asia-Pacific) Isolates of Klebsiella pneumoniae
Conversion to an ESBL Positive Phenotype
Submitted by Farshid Dakh, M.Sc, School of Life Sciences, Queensland University
of Technology in partial fulfillment of the requirements of the degree of
Master of Applied Science (Research)
December 2008

ii

iii
Keywords β-lactamase, extended spectrum β-lactamase, ESBL, SENTRY, SHV, blaSHV,
IS26, mutation frequency, mutation rate, Klebsiella pneumoniae, real-time
PCR, MSS maximum likelihood

iv
v
Abstract
Extended spectrum β-lactamases or ESBLs, which are derived from non-
ESBL precursors by point mutation of β-lactamase genes (bla), are
spreading rapidly all over the world and have caused considerable problems
in the treatment of infections caused by bacteria which harbour them. The
mechanism of this resistance is not fully understood and a better
understanding of these mechanisms might significantly impact on choosing
proper diagnostic and treatment strategies. Previous work on SHV β-
lactamase gene, blaSHV, has shown that only Klebsiella pneumoniae strains
which contain plasmid-borne blaSHV are able to mutate to phenotypically
ESBL-positive strains and there was also evidence of an increase in blaSHV
copy number. Therefore, it was hypothesised that although specific point
mutation is essential for acquisition of ESBL activity, it is not yet enough, and
blaSHV copy number amplification is also essential for an ESBL-positive
phenotype, with homologous recombination being the likely mechanism of
blaSHV copy number expansion. In this study, we investigated the mutation
rate of non-ESBL expressing K. pneumoniae isolates to an ESBL-positive
status by using the MSS-maximum likelihood method. Our data showed that
blaSHV mutation rate of a non-ESBL expressing isolate is lower than the
mutation rate of the other single base changes on the chromosome, even
with a plasmid-borne blaSHV gene. On the other hand, mutation rate from a
low MIC ESBL-positive (≤ 8 µg/mL for cefotaxime) to high MIC ESBL-positive
(≥16 µg/mL for cefotaxime) is very high. This is because only gene copy
number increase is needed which is probably mediated by homologous
recombination that typically takes place at a much higher frequencies than
point mutations. Using a subinhibitory concentration of novobiocin, as a
homologous recombination inhibitor, revealed that this is the case.

vi

vii
Contents
1 Introduction and History ...................................................................... 1
1.1 β-lactams .......................................................................................... 2
1.2 Classes of β-lactams ........................................................................ 2
1.3 β-lactamses ...................................................................................... 5
1.4 Nomenclature and Classification of β-lactamses .............................. 5
1.5 ESBLs ............................................................................................. 11
1.6 SHV β-lactamases .......................................................................... 12
1.7 ESBL Detection Methods ................................................................ 16
1.7.1 Phenotypic Tests or Clinical Microbiology Techniques ............. 16
1.7.2 Genotypic Tests or Molecular Detection Methods .................... 21
1.8 Epidemiology and Dissemination of β-lactamase ........................... 24
1.8.1 Global Epidemiology ................................................................ 24
1.8.2 Molecular Epidemiology of Nosocomial Infections ................... 26
1.9 Bacterial Resistance to β-lactam Antibiotics ................................... 27
1.10 blaSHV Gene Evolution ..................................................................... 27
1.11 Origin of Mutations .......................................................................... 29
1.12 Gene Amplification .......................................................................... 32
1.13 Heteroresistance ............................................................................. 33
1.14 Treatment of Infections with ESBL-Producing Organisms .............. 34
1.15 Mutation Rate Determination .......................................................... 35
1.15.1 Mutation Rate versus Mutation Frequency ............................... 35
1.15.2 Poisson Distribution .................................................................. 37
1.15.3 The MSS Maximum-Likelihood (MSS-MLL) Method ................ 38
1.15.4 Calculation of Mutation Rate .................................................... 40
1.16 Summary ........................................................................................ 42
1.17 Aims ................................................................................................ 44

viii
2 Mutation Rate Determination ............................................................. 45
2.1 Materials and Methods .................................................................... 45
2.1.1 Bacterial Isolates ...................................................................... 45
2.1.2 Determination of Mutation Rates .............................................. 47
2.1.3 ESBL Phenotypic Detection ..................................................... 49
2.1.4 DNA Extraction for Real-Time PCR Analysis ........................... 49
2.1.5 Real-Time PCR and Relative Quantitation of blaSHV ................ 49
2.2 Results ............................................................................................ 51
2.3 Mutation Rate from a Low MIC ESBL-Positive Phenotype to a High
MIC ESBL-Positive Phenotype .......................................................... 56
3 Detection of Heteroresistance to Cefotaxime in K. pneumoniae
Isolates by Population Analysis Profile (PAP) Method ....................... 59
3.1 PAP Experiments for Cefotaxime-Resistant K. pneumoniae Strains ....... 59
3.2 Results ............................................................................................ 60
4 Evaluation of the Effect of Novobiocin on the blaSHV Copy Number Expansion ............................................................................................... 69
5 Discussion ........................................................................................... 73
Appendices ................................................................................................. 79
A. MSS-MLE Program in MATLAB R2007a Software ......................... 79
B. nllike_m.m Program ........................................................................ 80
References.................................................................................................. 81

ix
List of Figures Figure 1. A β-lactam ring ................................................................................ 3
Figure 2. A cephem nucleus .......................................................................... 3
Figure 3. Tertiary structure of a class A TEM β-lactamase .......................... 10
Figure 4. ESBL Etest® results ...................................................................... 19
Figure 5. Comparison between mutation frequency and mutation rate ........ 36
Figure 6. Maximum likelihood estimate of one mutant colony in twenty
parallel cultures ............................................................................................ 41
Figure 7. Determination of mutation rate by fluctuation analysis method ..... 48
Figure 8. ESBL Etest® experiments of K2 three mutant colonies ................. 55
Figure 9. F1 mutant colonies in different cefotaxime concentration ............. 58
Figure 10. Phenotypic (Etest®) and genotypic (blaSHV relative copy number)
experiments of F1 and B1 isolates of the PAH collection ............................. 62
Figure 11. Total blaSHV relative copy number of B1 and F1 isolates ............ 64
Figure 12. PAP results of isolates A1 and D1 of the PAH collection ............ 66
Figure 13. PAP results of isolates E1 and F1 of the PAH collection ............ 67
Figure 14. Population analysis profile for cefotaxime-resistant Klebsiella
pneumoniae strains from PAH isolates ........................................................ 68
Figure 15. Effect of novobiocin on the colony size and distribution of F1 strain
..................................................................................................................... 71
Figure 16. Effect of novobiocin on PAH F1 isolate growth and blaSHV copy
number ......................................................................................................... 72
x
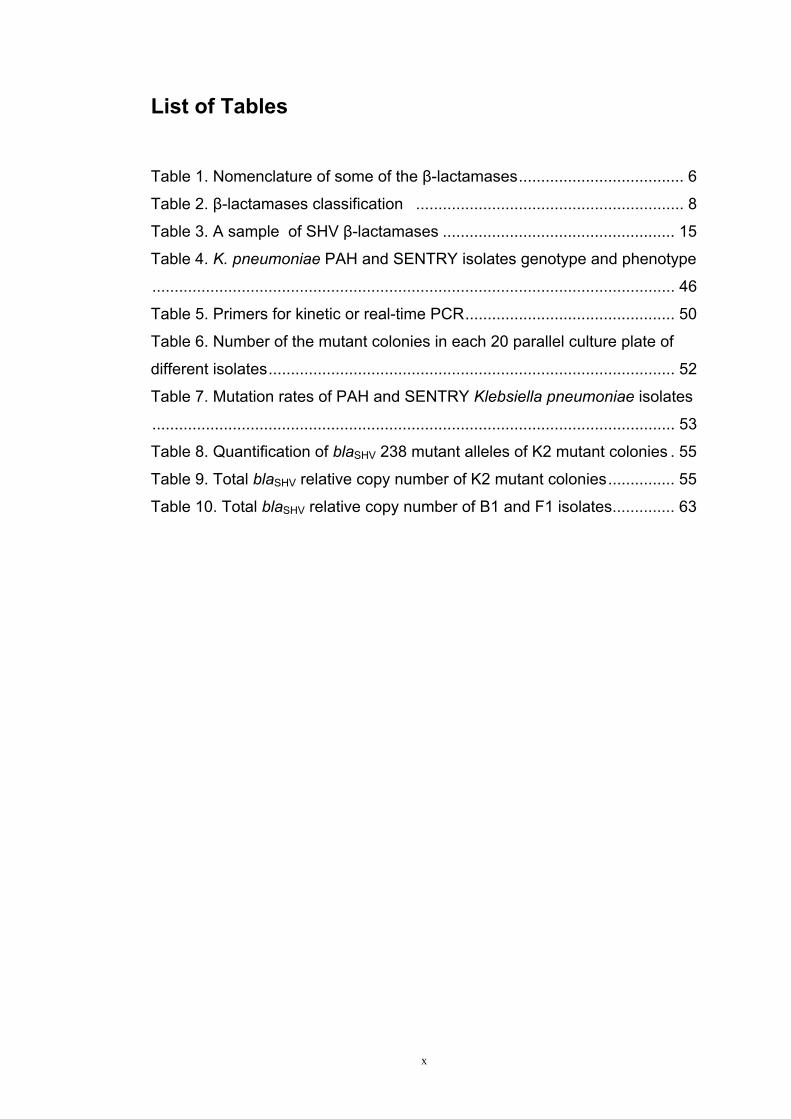
List of Tables Table 1. Nomenclature of some of the β-lactamases ..................................... 6
Table 2. β-lactamases classification ............................................................ 8
Table 3. A sample of SHV β-lactamases .................................................... 15
Table 4. K. pneumoniae PAH and SENTRY isolates genotype and phenotype
..................................................................................................................... 46
Table 5. Primers for kinetic or real-time PCR ............................................... 50
Table 6. Number of the mutant colonies in each 20 parallel culture plate of
different isolates ........................................................................................... 52
Table 7. Mutation rates of PAH and SENTRY Klebsiella pneumoniae isolates
..................................................................................................................... 53
Table 8. Quantification of blaSHV 238 mutant alleles of K2 mutant colonies . 55
Table 9. Total blaSHV relative copy number of K2 mutant colonies ............... 55
Table 10. Total blaSHV relative copy number of B1 and F1 isolates .............. 63

xi
Statement of original authorship
“The work contained in this thesis has not been previously submitted to meet
requirements for an award at this or any other higher education institution. To
the best of my knowledge and belief, the thesis contains no material
previously published or written by another person except where due
reference is made.”
Farshid Dakh
15/12/2008

xii

xiii
Acknowledgments
My thanks go to:
• My supervisors, Prof Philip Giffard and Dr Mark Turner, for their
guidance and encouragement
• A/Prof Terry Walsh, for his great support
• Dr Jan Bell and Dr John Turnidge, for the bacterial isolates
• Joshua Chan and Dr David Hammond, for the computer program
• All of our research team, Tegan Harris, Alex Stephens, Daniel Barry,
Raquel Lo, Shreema Merchant, for their great help
• My lovely family, Fariba ,Kosar, my Mum and Dad, for their support
and patience
And special thanks to QUT Research Students Centre and School of Life
Sciences, for supporting me by scholarships

xiv

1
Chapter 1
1 Introduction and History
Penicillin, the first β-lactam antibiotic, was discovered by chance by Sir
Alexander Fleming, the Scottish microbiologist, at St. Mary’s Hospital in
London in 1928 (Fleming 1929) but it was not used in clinics until 1940. The
main development of penicillin as a clinically relevant chemotherapeutic was
done in 1939 by an Australian scientist Howard Florey and his team. They
published a report describing “penicillin as a chemotherapeutic agent” (Chain
et al. 1940; Florey and Abraham 1951). During World War II, penicillin made
a major difference in the number of deaths and amputations caused by
infected wounds in Allied Forces. Before penicillin became clinically used as
an antibiotic, in 1940, Abraham and Chain identified the ability of bacteria to
produce an enzyme that destroys penicillin. They called it penicillinase
(Abraham and Chain 1940; Mascaretti 2003; Turner 2005). Since these
enzymes can inactivate other β-lactams such as cephalosporins,
carbapenems, and monobactams, they are now called β-lactamases. These
groups of enzymes hydrolyse the β-lactam ring of β-lactam antibiotics.
Bacterial resistance to antibiotics and worldwide dissemination of these
resistant strains is one of the major problems encountered in clinics.
Production of β-lactamases is one of the most common sources of resistance
in bacteria against these types of antimicrobial agents. The history of the
development of antibiotics shows an “arms race” in which resistance is
circumvented by new β-lactams which in turn are circumvented by the
evolution of new β-lactamases.

2
1.1 β-lactams
A β-lactam is a four member cyclic amide and the common structural feature
among β-lactam antibiotics and β-lactamase inhibitors (Demarco and
Nagarajan 1972; Mascaretti 2003). The major resistance mechanism to
β-lactam antibiotics is the enzymatic cleavage of the β-lactam ring by
β-lactamases (Figure 1).
1.2 Classes of β-lactams
β-lactam antibiotics are divided into two groups: traditional group (penicillins
and cephalosporins) and non-classical or non-traditional group
(cephamycins, carbapenems and monobactams) with the latter being
discovered since 1971 (Mascaretti 2003). In this literature review, because of
the usage, only cephalosporins are described below.
Cephalosporins have a cephem nucleus (7-aminocephalosporanic acid),
which consists of a β-lactam ring fused to a dihydrothiazine ring (Figure 2).
Cephalosporins are not inactivated by many bacterial β-lactamases.
Therefore they have a broader spectrum of activity than other low spectrum
β-lactams.

3
Figure 1. A β-lactam ring
Figure 2. A cephem nucleus

4
Depending on the spectrum of antimicrobial activity, cephalosporins can be
classified into four major groups or generations which are summarized below
(Chambers 2007; Mascaretti 2003).
1. First generation cephalosporins include cefadroxyl, cefazolin,
cephalexin, cephalothin, cephapirin and cephradine. They have a narrow
spectrum of activity and relatively nontoxic.
2. Second generation cephalosporins include cefaclor, cefamandole,
cefonicid, cefuroxime, cefprozil, loracarbef, and ceforanide and structurally
related cephamycins such as cefoxitin, cefmetazole, and cefotetan. They are
less effective than first generation against Gram-positive bacteria but have
extended activity against Gram-negative bacteria.
3. Third generation cephalosporins include cefoperazone, cefotaxime,
ceftazidime, ceftizoxime, ceftriaxone, cefixime, cefpodoxime proxetil, cefdinir,
cefditoren pivoxil, ceftibuten, and moxalactam. These drugs have more
extended Gram-negative coverage than second generation and some are
able to cross blood brain barrier. They are used to treat a wide variety of
serious infections caused by organisms that are resistant to most other
drugs.
4. Fourth generation cephalosporins include cefepime and cefpirome.
Their potencies against members of Enterobacteriaceae are higher than
those of the earlier broad-spectrum cephalosporins. In addition, both
antibiotics remain effective against β-lactamase-overproducing gram-
negative bacterial strains resistant to other extended-spectrum
cephalosporins.
5
1.3 β-lactamses
Production of β-lactamases is one of the important bacterial defense
mechanisms against β-lactam antibiotics. The number, diversity, and
substrate specificity of β-lactamases have been increased considerably over
60 years and the problem of resistance to β-lactam antibiotics has been
expanded. β-lactamases (EC 3.5.2.6) has been designated by the
Nomenclature Committee of International Union of Biochemistry and
Molecular Biology (NC-IUBMB) as a group of enzymes, hydrolysing cyclic
amides, amidines and other C-N bonds (Bush et al. 1995). The first
β-lactamase was identified by Abraham and Chain in 1940 before penicillins
became clinically used as antibiotics (Abraham and Chain 1940; Mascaretti
2003; Turner 2005). They termed it penicillinase. Since these enzymes can
inactivate other β-lactams such as cephalosporins, carbapenems, and
monobactams, they are now called β-lactamases. β-lactamases are plasmid
or chromosomally encoded enzymes which hydrolyse the β-lactam C-N bond
of β-lactam antibiotics. They are secreted into the periplasmic space of
Gram negative bacteria or are attached to the cell envelope in Gram positive
bacteria (Lai et al. 1981; Mascaretti 2003; Nielsen et al. 1981; Sarvas and
Palva 1983). Many of the Gram negative bacteria produce a natural
chromosomal mediated β-lactamase, which may help the bacteria in finding a
niche when faced with competition from other bacteria that naturally produce
β-lactams (Turner 2005). The known number, diversity, and substrate
specifity of β-lactamases has increased considerably over 60 years, and
resistance to β-lactam antibiotics has continued to be problematic.
1.4 Nomenclature and Classification of β-lactamses
β-lactamase nomenclature has neither been rational nor has followed a
consistent rule. Some have three and the others have four-letter
abbreviations. Table 1 shows the reasons of nomenclature of some different
β-lactamases (Helfand and Bonomo 2003; Jacoby 2006; Mascaretti 2003).

6
Table 1. Nomenclature of some of the β-lactamases
β-lactamase Reason of nomenclature CARB Substrate they hydrolyse (carbenicillin) OXA Substrate they hydrolyse (oxacillin) IMP Substrate they hydrolyse (imipenem) CTX-M Substrate they hydrolyse (cefotaxime), first isolated at Munich IMI An imipenemase from Enterobacter cloacae TEM First three letters of the patient’s surname (Temoniera) SHV Biochemical properties (sulphydryl variable) NMC-A Abbr. of nonmetallo carbapenemase of Class A IBC Abbr. of integron-borne cephalosporinase OKP Abbr. of other Klebsiella pneumoniae β-Lactamase ACT AmpC type KPC Klebsiella pneumoniae carbapenemase PSE Refers to Pseudomonas-specific enzymes Sme Refers to Serratia marcescens enzyme SFO Refers to Serratia fonticola enzyme MIR Refers to a name of a hospital (Miriam Hospital) OHIO Refers to a particular state in US (discovered in Cleveland, Ohio) VEB Abbr. of Vietnam extended spectrum β-lactamase BES Abbr. of Brazilian extended spectrum β-lactamase GES Abbr. of (French)Guiana extended spectrum β-lactamase VIM Verona integron-encoded metallo-β-lactamase (most common in Taiwan) FPM Refers to a pharmaceutical company (Fujisawa’s Proteus mirabilis) HMS Refers to researchers who discovered them (Harris, Matthew, Sykes) TLA A β-lactamase found in Escherichia coli named after Tlahuicas Indians LEN A β-lactamase found in Klebsiella pneumoniae strain LEN-1 GC1 A β-lactamase found in Enterobacter cloacae strain GC1 PC1 A β-lactamase found in Staphylococcus aureus strain PC1
Adapted from Jacoby GA. (2006)

7
Now more than 700 β-lactamases have been characterised. To organise the
nomenclature of β-lactamases, Bush and Jacoby have maintained an
Internet database initially for extended-spectrum and inhibitor-resistant
β-lactamases (http://www.lahey.org/studies/webt.html) (Bush and Jacoby
1997b, 1997a; Jacoby and Bush 2005). Since 1968, several classification
methods have been used as follow:
Sawai et al. 1968; Jack and Richmond, 1970; Richmond and Sykes, 1973;
Sykes and Matthew, 1976; Ambler 1980; Bush 1989 and Bush–Jacoby-
Medeiros functional classification (Bush et al. 1995).
β-lactamases have been classified according to the following aspects:
1. Function, especially substrate profile and sensitivity to inhibitors
2. Physical properties such as isoelectric point and molecular weight
3. Genetic location: plasmid or chromosome
β-lactamases have been commonly classified according to two general
schemes: the Ambler molecular classification scheme and the more recent,
Bush–Jacoby-Medeiros functional classification system (Ambler 1980; Bush
et al. 1995). Molecular structure classification of β-lactamases was first
proposed by Ambler in 1980 on the basis of their primary structure and amino
acid sequence identity. He divided β-lactamases into four classes: A, B, C,
and D (Table 2). Class A, C, and D β-lactamases have serine in their active
sites, while class B enzymes are metalloproteins containing Zn2+ ions in their
active subunits. According to Bush–Jacoby-Medeiros functional classification
β-lactamases are classified into four groups based on their functional
characteristics and substrate/inhibitor profiles (Table 2). Group 2 is the
largest category and contains six subgroups based on preferential hydrolysis
of penicillins, cephalosporins, oxyimino β-lactams, cloxacillin, carbenicillins,
or carbapenems. Over half of the β-lactamases are plasmid encoded.

8
Table 2. β-lactamases classification (Bush et al. 1995)
Bush-Jacoby-Medeiros group
Molecular class
Preferred substrates
Inhibited by: Representative enzymes Clavulanic acid EDTA
1 C Cephalosporines - - AmpC β-lactamases from gram negative
bacteria; MIR-1 2a A Penicillins + - Penicillinases from gram-positive bacteria 2b A Penicillins, cephalosporins + - TEM-1, TEM-2, SHV-1 2be A Penicillins, narrow-spectrum + - TEM-3 to TEM-26, SHV-2 to SHV-6, and extended- spectrum K. oxytoca K1 cephalosporins and monobactams 2br A Penicillins ± - TEM-30 to TEM-36, TCR-1 2c A Penicillins, carbenicillin + - PSE-1, PSE-3, PSE-4 2d D Penicillin, cloxacillin ± - OXA-1 to OXA-11, PSE-2 (OXA-10) 2e A Cephalosporins + - Inducible cephalosporinases from
Proteus vulgaris 2f A Penicillins, cephalosporins,
carbapenems + - NMC-A from E. cloacae, Sme-1 from
S. marcescens3 B β-lactams including
carbapenems - + L1 from S. maltophila, CcrA from B. fragilis
4 ND Penicillin - ? Penicillinase from P. cepacia ND, not determined Printed with permission from the publisher and the author

9
Regardless of the huge amino acid variability of β-lactamases, their globular
structure is similar and consists of alpha-helices and beta-plated sheets
(Knox 1995). X-ray crystallography of class A β-lactamases reveals an α/β
domain (a five-stranded antiparallel β-sheet surrounded by α-helices on both
sides) and an all-α domain with an active site in the groove between domains
(Figure 3) (Kuzin et al. 1999; Matagne et al. 1998).

10
Figure 3. Tertiary structure of a class A TEM β-lactamase from Matagne et al. (1998)
[Printed with the publisher permission]
11
1.5 ESBLs Extended Spectrum β-lactamases or ESBLs are enzymes which hydrolyse
extended-spectrum β-lactam antibiotics such as oxyimino cephalosporins
(e.g. cefotaxime, ceftazidime, ceftriaxone, cefepime, and cefpirome), as well
as oxyimino monobactam (aztreonam), therefore providing resistance to
these antibiotics. ESBLs are located in 2be subgroup (Ambler’s class A) and
subgroup 2d (Ambler’s class D) of Bush-Jacoby-Medeiros functional
classification (Bush et al. 1995). Cephamycins and carbapenems are stable
to ESBLs. They are inhibited by β-lactamases inhibitors such as clavulanic
acid (Mascaretti 2003; Paterson and Bonomo 2005). ESBL refers to enzyme
activity which can be found in several β-lactamase classes. In some classes
(e.g. TEM and SHV) it arises from point mutation in their β-lactamase genes
(bla), while others, in particular CTX-M, have inherent ESBL activity. ESBLs
and AmpC-type β-lactamases have a similar activity but AmpCs are not
inhibited by clavulanic acid (Paterson and Bonomo 2005). The first ESBL
was reported in 1983 in Frankfurt, Germany (Knothe et al. 1983). ESBL
production is also often accompanied by resistance to other antibiotic classes
such as aminoglycosides, trimethoprim/sulfamethoxazole and
floroquinolones (Colodner 2005).
Some β-lactamases such as TEM-1, TEM-2, SHV-1, SHV-11, OXA-2 and
OXA-10 are not ESBLs and have evolved from chromosomal penicillinases.
They do not have the mutations required for ESBL-production but show a
broader spectrum activity than other low spectrum β-lactams (Haeggman et
al. 1997). The majority of ESBLs are derivatives of these broad spectrum
β-lactamases (Gniadkowski 2001). The difference between ESBLs and their
progenitors arise from one or more amino acid substitution. Point mutation is
the most common cause of these substitutions; however insertions and
deletions have been reported either (Arpin et al. 2001; Perilli et al. 1997).
Mutation of the amino acid residue 164 [according to Ambler’s numbering
scheme] in TEMs, 179 in SHVs and 238 in both, which are the most common
point mutations, lead to enlarging the binding site of the β-lactam antibiotics

12
to accommodate the bulky side chain of third generation cephalosporins, and
expanding the spectrum of action of the β-lactamases.
In ESBLs, due to the substitution of Gly238→Ser because of the existence of
two large side chains in positions Met69 and Ser238 the lower part of the β3
β-strand is pushed away from the active site. Consequently active sites of
these β-lactamases become larger and they become capable to hydrolyse
β-lactams with bulky oxyimino side chains (Huletsky et al. 1993).
Furthermore amino acid substitutions of 104 in TEMs and 240 in TEMs and
SHVs increase the interaction of β-lactamases with oxyimino side chains
(Gniadkowski 2001). In another words, strong electrostatic bond between the
lysine as a substituent at position 240 with the carboxylate residue of these
side chains improves the level of resistance of the bacterium against
oxyimino cephalosporins (Tzouvelekis and Bonomo 1999).
In 2002, Hujer showed that mutation at 238 residue leads to a lower
expression level of the gene in comparison to the wild type (SHV-1) because
of a decrease in translation. For compensation, bacteria began to improve
their resistance status by hyperproduction of the enzyme in different ways
such as mutation in the promoter sequences or insertion sequences
integrated upstream of the gene, resulting in more potent promoters
(Heritage et al. 1999).
1.6 SHV β-lactamases The SHV β-lactamases comprises one of the most clinically significant
classes of the β-lactamase families. Because of their importance, our
research team focused on this class. Therefore, the other β-lactamases have
not been explained in this literature review. This group of β-lactamases was
first detected by Pitton in 1972 and was named Pitton’s type-2 β-lactamases
(PIT-2) (Barthelemy et al. 1986; Pitton 1972). In 1979, Matthew et al. found a
unique biochemical property in this group in comparison to the other
β-lactamases. They designated this group, SHV-1 (means sufhydryl
variable). SHV β-lactamases hydrolysed cephaloridine but not
benzylpenicillin in the presence of the inhibitory sufhydryl binding chemical,

13
p-chloromercuribenzoate [PCMB]. This suggested that cephaloridine and
benzylpenicillin bind to different parts of the active site in SHV and the active
site for cephaloridine but not benzylpenicillin contains a sulfhydryl group,
essential for substrate binding (Matthew et al. 1979; Tzouvelekis and
Bonomo 1999). This property, which was the basis of SHV β-lactamase
nomenclature, was never confirmed later. Other research groups tried to
obtain the same results by using purified enzyme, but this was never
achieved later (Paterson and Bonomo 2005).
SHV β-lactamases include SHV-1 and nearly 100 variants
(http://www.lahey.org/studies/webt.html). They belong to group 2be
β-lactamases (Ambler’s class A). SHV-1 is both encoded chromosomally on
plasmids. LEN-1 (a chomosomally encoded β-lactamase and K.pneumoniae
species-specific penicillinase) and OHIO-1 (a plasmid encoded β-lactamase)
have 84-88.9% and 91.8% amino acid sequence similarity with SHV-1,
respectively, whereas SHV-1 has only 63.7-67% identity with TEM-1
(Heritage et al. 1999; Tzouvelekis and Bonomo 1999). The kinetics of these
enzymes and their biochemical properties are quite similar.
PCR and hybridisation studies revealed that the SHV β-lactamase gene or
blaSHV that encode these enzymes are native to the Klebsiella pneumoniae
chromosome (Ford and Avison 2004; Haeggman et al. 1997). It has also
been found on plasmids of K. pneumoniae, and a smaller but still significant
proportion of other species in the Enterobacteriaceae family such as
Escherechia coli, Klebsiella oxytoca, Pseudomonas aeruginosa, Proteus
mirabilis and nontyphoid Salmonella spp. (Hirakata et al. 2005; Poirel et al.
2004; Politi et al. 2005; Sabate et al. 2002; Vercauteren et al. 1997).
In the early 1980’s, to overcome the resistance of bacteria against β-lactams
antibiotics, long side chains were added to cephalosporins, not to let them fit
in the active site of β-lactamases. Third generation cephalosporins or
oxyimino cephalosporins such as cefotaxime, ceftazidime and ceftriaxone are
the product of these modifications. Unfortunately, overuse of these antibiotics
led to the rapid emergence of the resistance to these antibiotics (Heritage et

14
al. 1999). SHV-2 was the first ESBL which was reported by Konthe et al.
(Kliebe et al. 1985; Knothe et al. 1983).

15
Table 3. A sample of SHV β-lactamases (Bush and Jacoby 1997a)
β-lactamase pI Amino acid residue ESBL comment 8 35 43 130 140 141 179 205 238* 240* Pos Neg SHV-1 7.6 Ile Leu Arg Ser Ala/Thr Thr/Ala Asp Arg Gly Glu X SHV-2 7.6 Thr/Ala Ala/Thr Ser X
SHV-2a 7.6 Gln Ser X SHV-3 7.0 Leu Ser X SHV-4 7.8 Leu Ser Lys X SHV-5 8.2 Ser Lys X SHV-6 7.6 Ala X Only hydrolyse
ceftazidime
SHV-7 7.6 Phe Ser Ser Lys X Substitution 8 is cleared in mature enzyme
SHV-8 7.6 Asn X SHV-9 8.2 Arg Ser Lys X Loss of aa 54
SHV-10 8.2 Gly Arg Ser Lys X Inhibitor resistant
SHV-11 7.6 Gln X SHV-12 8.2 Gln Ser Lys X
* Important point mutations for ESBL activity

16
Substitutions G238S and E240K are the most important ones for ESBL
activity in SHVs, which confer the highest levels of resistance, while
microorganisms containing D179N substitution express the weakest SHV
ESBLs, such as SHV-6 [Table 3] (Randegger et al. 2000). Replacement of
glycine by serine at residue 238 (i.e. substitution of a G for an A nucleotide)
changes the spectrum of activity of SHV-1 or SHV-11, and leads to the
production of SHV ESBLs. In addition, replacement of glutamic acid by lysine
at residue 240 (i.e. substitution of a G for an A nucleotide) increases the
activity of the enzyme against ceftazidime.
1.7 ESBL Detection Methods ESBL expressing status of an organism is determined by phenotypic and
genotypic tests.
1.7.1 Phenotypic Tests or Clinical Microbiology Techniques
Phenotypic tests are divided into two categories; screening tests and
confirmatory tests. It is very important to know that in both types of tests, the
size of inoculum can affect MICs, as a lower inoculums size leads to a false
negative result, while a higher inoculum size may lead to a higher MIC value.
The Clinical and Laboratory Standards Institute (CLSI, formerly NCCLS)
recommends 5×10⁵ CFU/mL as a standard inoculum (Queenan et al. 2004).
Screening Tests
Broth Microdilution Method (BMD) This method is recommended by CLSI for screening for ESBL producers
including K. pneumoniae, K. oxytoca and E.coli. CLSI recommended
screening criteria are as follows (AB-BIODISK 2007):
MIC ≥8 μg/ml to cefpodoxime
MIC ≥2 μg/ml to ceftazidime, cefotaxime, ceftriaxone and aztreonam
17
Disk Diffusion Methods
These methods are recommended by CLSI for screening for ESBL producers
including K. pneumoniae, K. oxytoca, E.coli and Proteus mirabilis.
Recommended screening criteria by CLSI for Klebsiellae and E.coli are as
follows (AB-BIODISK 2007). The numbers show the size of the inhibition
zones in millimitre:
Cefpodoxime ≤17 mm
Ceftazidime ≤22 mm
Cefotaxime ≤27 mm
Ceftriaxone ≤25 mm
Aztreonam ≤27 mm
But the criterion for P. mirabilis for cefpodoxime is ≤22 mm (MIC ≥2 μg/ml).
Phenotypic Confirmatory Tests
These tests should be used for the confirmation of ESBL production for
screening-positive or suspicious results. All of these methods are based on
the augmentation of inhibition zones of third generation cephalosporins and
monobactams such as cefotaxime, ceftazidime, ceftriaxone, cefpodoxime
and aztreonam in the presence of clavulanate. There are several different
phenotypic confirmatory tests as follow (Carter et al. 2000; Ho et al. 1998;
M'Zali et al. 2000; Paterson and Bonomo 2005; Schooneveldt et al. 1998;
Thomson and Sanders 1992; Vercauteren et al. 1997; Woodford et al. 1990;
Jarlier et al. 1988; Kader et al. 2006).
1. Cehalosporin/clavulanate combination disk
2. Etest®
3. MAST double disc (MDD) test
4. Double-disk diffusion (DDD) Test
5. Agar supplemented with clavulanate
6. Disk replacement method
7. Three-dimensional tests
18
A positive confirmatory test isolate should be reported to the clinician as
being resistant to all penicillins, cephalosporins and aztreonam but not to
cephamycins. Susceptibility to cephamycins (cefoxitin and cefotetan) should
be reported based on their results (Paterson and Bonomo 2005; Queenan et
al. 2004). Since Etest® has been chosen as the confirmatory test in this
project, it is described below.
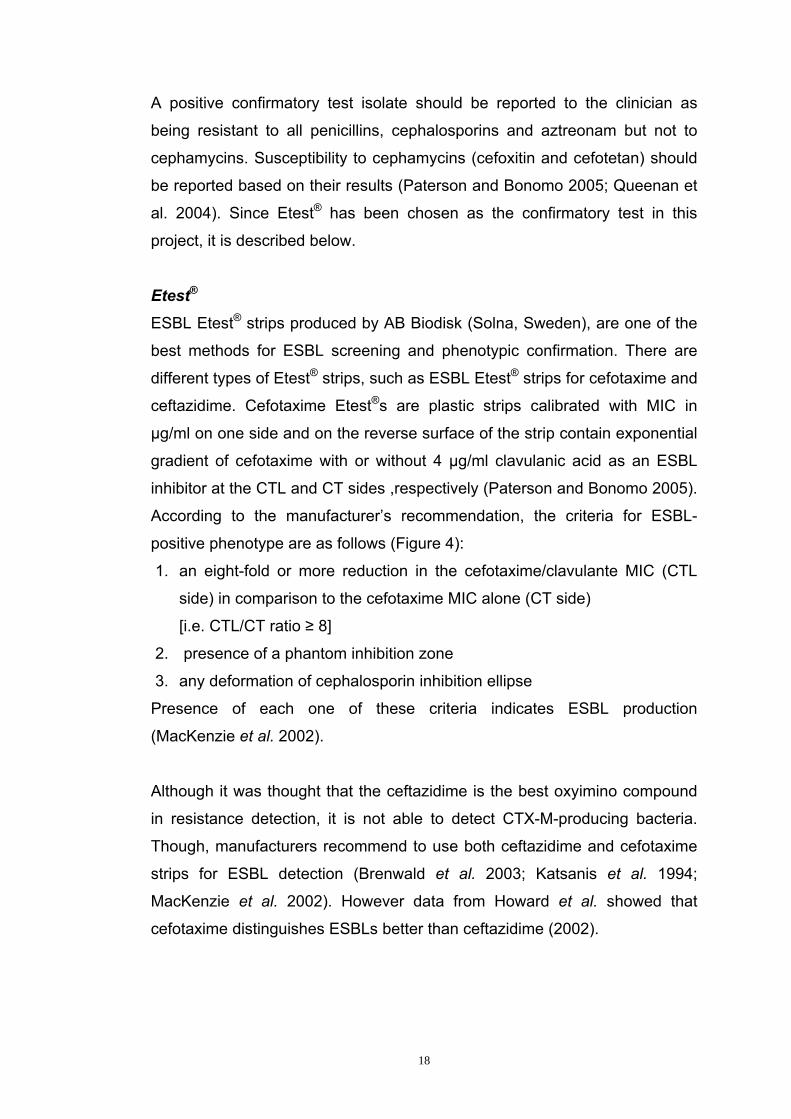
Etest®
ESBL Etest® strips produced by AB Biodisk (Solna, Sweden), are one of the
best methods for ESBL screening and phenotypic confirmation. There are
different types of Etest® strips, such as ESBL Etest® strips for cefotaxime and
ceftazidime. Cefotaxime Etest®s are plastic strips calibrated with MIC in
μg/ml on one side and on the reverse surface of the strip contain exponential
gradient of cefotaxime with or without 4 μg/ml clavulanic acid as an ESBL
inhibitor at the CTL and CT sides ,respectively (Paterson and Bonomo 2005).
According to the manufacturer’s recommendation, the criteria for ESBL-
positive phenotype are as follows (Figure 4):
1. an eight-fold or more reduction in the cefotaxime/clavulante MIC (CTL
side) in comparison to the cefotaxime MIC alone (CT side)
[i.e. CTL/CT ratio ≥ 8]
2. presence of a phantom inhibition zone
3. any deformation of cephalosporin inhibition ellipse
Presence of each one of these criteria indicates ESBL production
(MacKenzie et al. 2002).
Although it was thought that the ceftazidime is the best oxyimino compound
in resistance detection, it is not able to detect CTX-M-producing bacteria.
Though, manufacturers recommend to use both ceftazidime and cefotaxime
strips for ESBL detection (Brenwald et al. 2003; Katsanis et al. 1994;
MacKenzie et al. 2002). However data from Howard et al. showed that
cefotaxime distinguishes ESBLs better than ceftazidime (2002).
19
Figure 4. ESBL Etest® results

20
Other Methods
There are also some other methods for ESBL detection, based on the
augmentation of inhibition in the presence of clavulanate, which are not
explained in this thesis.
1. VITEK ESBL cards
2. Microscan panels
3. BD Phoenix automated microbiology system

21
1.7.2 Genotypic Tests or Molecular Detection Methods
The fact that some ESBL expressing isolates may be missed by phenotypic
diagnostic methods suggests that the using of phenotypic methods alone is
not sufficient in ESBL identification and DNA-based methods are required, as
well. Although genotypic methods are not as rapid as phenotypic methods,
attempts are done to find new rapid genotypic techniques as a substitution
for conventional methods. On the other hand, genotypic techniques only
reveal the genetic potential of resistance expression in microorganisms, not
an actual response to an antibiotic (Hammond 2004). These methods are
also useful in epidemiological investigations.
Direct PCR Sequencing
Direct sequencing of the PCR-amplified bla genes were used traditionally for
ESBL detection but the presence of multiple bla genes can confound this
approach (Kim and Lee 2000; Perilli et al. 2002).
PCR-Single Strand Conformational Polymorphism (PCR-SSCP) and
PCR-Restriction Fragment Length Polymorphism (PCR-RFLP)
PCR-SSCP was first described by Orita et al. (1989), which is useful for
strain typing and detection of SNPs. The PCR-SSCP relies on the basis that
SNPs can confer different migration patterns of small single stranded DNA
molecules from their paternal DNA in non denaturing gels. M’Zali et al. used
this method for identification of SHV genes by comparison of the patterns
with the known SHV variants patterns as standard genes (M'Zali et al. 1996;
M'Zali et al. 1998). PCR-SSCP can be used as a rapid screening test and
also for detection of novel SHV-β-lactamases by finding an undescribed
pattern. By using PCR-SSCP, more than one β-lactamase could be found in
a single isolate. Kim et al. have reported that by using this technique, SHV-2a
and SHV-12 were not characterised from SHV-2 and SHV-5, respectively
(2000). By adding PCR-RFLP techniques to PCR-SSCP, the reliability of
SHV β-lactamase identification was improved and resulted in an increase in
the sensitivity of the test (Chanawong et al. 2000). However, PCR-RFLP has

22
also some limitations due to the absence of the restriction enzymes for some
SNPs within blaSHV (Chanawong et al. 2001).
Ligase Chain Reaction (LCR)
LCR was first used by Kim et al. (2000) for characterisation of SNPs in blaSHV
genes of ESBL positive organisms. This method is based on the using of a
thermostable ligase for ligation of consensus primers containing a phosphate
at their 5' end. After doing a SHV-specific PCR, four different sets of
consensus and biotinylated mutant-specific primers are added to 870bp
amplimers. Consensus primers are amplified exponentially, while mutant
ones will not be amplified due to the absence of phosphate at their 5' end.
One of the mutant-specific primers, containing a biotin instead of the
phosphate, is captured on a streptavidin-coated microwell, and the other
primer, containing an additional 21-base sequence, is complemented by an
alkaline-phophatase-conjugated oligonucleotide which in turn is used in a
color change reaction (Kim and Lee 2000). This method is easier and more
rapid than the direct PCR sequencing method.
Restriction Site Insertion-PCR (RSI-PCR)
In this technique, mismatch primers with one or two modified nucleotides
near their 3' end, which are specially designed for different blaSHV SNPs,
create or remove restriction sites on amplimers of the blaSHV gene.
Afterwards, the relevant restriction enzymes are used for PCR product
digestion and the result is compared to a DNA size marker (Chanawong et al.
2001; Haliassos et al. 1989). By combination of this method and PCR-RFLP
analysis, Chanawong et al. differentiated 27 SHV variants (2001).
First Nucleotide Change (FNC) Method FNC is based on the interrogation of a specific nucleotide in the gene. Four
different flourescein-labaled ddNTPs are added in separate microwells,
containing the amplicon of the target gene, which has been previously
hybridised with biotinylated primers (exactly 1 base upstream of the SNPs).
Afterwards, antiflourescein-alkaline phasphatase conjugate is added followed
by p-nitrophenyl phosphate as the reaction substrate. An ELISA plate reader

23
is applied for reading the results (Howard et al. 2002). By using this
technique, Howard et al. designed a quantitative minisequencing-plate-based
method for blaSHV discrimination without involvement of electrophoresis. They
analysed 21 K. pneumoniae isolates from Princess Alexandra Hospital
outbreak (1991-1995) in Brisbane, Australia. They also reported a correlation
between the MIC data and the relative copy number of blaSHV gene.
Real-time PCR or Kinetic PCR Method
Real-time PCR was first described by Higuchi et al. (1992), which was
recognised later as the best technique for nucleic acid analysis quantification.
One of the limitations of the original end-point PCR method is the difficulty of
quantification of the primary DNA template, but Real-time PCR technique is
based on the continuous monitoring of PCR product by determination of the
fluorescence of introduced dyes or probes. Detection and quantification of
SNPs are among the most common usages of this method (Kubista et al.
2006). There are several real-time PCR methods for SNP detection. The
SHV melting curve mutation detection method was described by Randegger
et al. (2001) and fluorescence resonance transfer (FRET) real-time PCR
method was applied by Szabó et al. (2005). Hammond et al. (2004)
developed an allele specific PCR (AS-PCR) for blaSHV SNP detection, which
was a variant of a technique used by Germer et al. (2000). AS-PCR
technique is based on the less efficiency extension of DNA polymerases from
3´ mismatches than matches. The real-time PCR SNP assay is a useful
technique in situations where there is more than one β-lactamase in a
bacterial strain. In this project, genetic determination of ESBL production and
blaSHV gene copy number quantification were based on Hammond’s allele
specific PCR technique.

24
1.8 Epidemiology and Dissemination of β-lactamase
1.8.1 Global Epidemiology The history of antibiotics shows a great challenge between the usage of new
developed antibiotics and the emergence of the bacterial resistance which
would make the need for new agents. In the early 1980’s, to overcome the
resistance of bacteria against β-lactams antibiotics, third generation
cephalosporins such as cefotaxime, ceftazidime and ceftriaxone were used in
hospitals and subsequently the first wave resistance to these new drugs
emerged later by producing ESBLs such as SHV and TEM type ESBLs
(Heritage et al. 1999). More recently CTX-M ESBLs are a particular problem
in East Asia, but cause problems just about everywhere.
The first ESBL was detected in 1983 in Germany, Europe (Knothe et al.
1983). During the first decade, ESBLs proliferated dramatically in France.
However, recently the incidence of ESBL-producing K. pneumoniae das been
decreased in France. In contrast, there is a significant increase in Western
Europe (Paterson and Bonomo 2005).
TEM-4 was the first reported ESBL in the United States in 1988 (Jacoby et al.
1988). Although SHV-type ESBLs have also been reported but TEM-
producing organisms have been the main cause of the most outbreaks in the
US. However, recently CTX-M-type ESBLs have been reported in the US and
Canada (Paterson and Bonomo 2005).
There are some reports about SHV-2 and SHV-5 ESBL producing organisms
in Chile and Argentina during 1988 and 1989. In 1989, an outbreak of
Salmonella enterica serovar Typhimurium infection, harboring CTX-M-2
ESBL, was reported in Argentinean provinces. Other CTX-M-type ESBLs
have been also reported from Brazil. There are rare reports of TEM-type
ESBLs from South America (Paterson and Bonomo 2005).

25
Several outbreaks of ESBL-producing organisms have been also reported
from Israel, Saudi Arabia, South Africa and different North African countries.
ESBL production rate has been described much lower in Japan in
comparison to other parts of Asia. Appearance of CTX-M-type ESBLs has
been recently reported in different countries in Asia (Paterson and Bonomo
2005).
Although ESBL producing organisms were detected in every state of
Australia and in the Northern Territory but only two outbreaks have been
reported in Australian hospitals. The first case occurred from a gentamicin-
resistant Klebsiella spp. in Perth, Western Australia between 1986 and 1988
(Mulgrave and Attwood 1993). Later, Howard et al. found that the type of
ESBL was SHV-12 (2002). The second case occurred at Princess Alexandra
Hospital (PAH) in Brisbane, Australia between 1991 and 1995 (Schooneveldt
et al. 1998). The types of ESBLs were SHV-2a and SHV-12 and the majority
of the non-ESBL ones were SHV-11. It was suggested that ESBLs may have
been arisen from an SHV-11 ancestor in Australia (Howard et al. 2002).
The SENTRY Antimicrobial Surveillance Program started in 1997 to monitor
main pathogens and manage antibiotic resistance in Asia-Pacific region and
South Africa by using valid and reference methods in a central laboratory
from the first of 1998 till the end of 1999 (Bell and Turnidge 2003). Bell et al.
performed a survey about the frequency of occurrence of the ESBL-
producing isolates through this program (2002). They also described the
preferred substrates for ESBL detection and the co-resistance patterns of the
microorganisms, as well. The frequency for E.coli strains varied from 0-1%for
medical centers in Australia to 13-35% for mainland Chinese centers. The
prevalence of ESBL positive K. pneumoniae in Australia showed lower rates
than the other countries (<20%). They also reported that ceftriaxone and
aztreonam were the best substrates for ESBL detection and co-resistance to
other antibiotics were common in most centers.
26
1.8.2 Molecular Epidemiology of Nosocomial Infections K. pneumoniae have been reported as the cause of more than 75% of ESBL-
producing infections. All of K. pneumoniae isolates are almost naturally
resistant to ampicillin and amoxicillin due to their chromosomally mediated
SHV-1 β-lactamase. This leads to the colonisation of the bacteria on the skin
and mucosa of hospitalised patients. Although these patients may be
asymptomatic, but they may transfer it to compromised patients such as
neonates or the microorganisms can be transferred on staff hands. Intensive
care units have been recognised as the epicenter of ESBL-producing
organism in hospital outbreaks (French et al. 1996; Paterson and Bonomo
2005).
Among Enterobacteriacea, Klebsiella has the longest survival on the hospital
environment. Clonal persistence of more than three years has been reported.
Intercontinental transfer has been reported as well (Paterson and Bonomo
2005). There are also some reports of more complex epidemiologic pattern
such as simultaneously clonal dissemination of five different ESBL-positive
Klebsiella strains in the same hospital unit, occurrence of different ESBL
genes in a single epidemic, production of the same ESBL by different strains
(plasmid transfer inter different species), and finally dissemination of the
same ESBL by different types of plasmid (Bradford et al. 1994; Fiett et al.
2000).
Although, most of the reports are about hospital-acquired infections or related
to nursing homes, in recent years, true community-acquired colonisation or
infections have been described (Paterson and Bonomo 2005). CTX-M-type
β-lactamases, which have naturally the potential hydrolytic activity against
cefotaxime, are identified as the cause of these community-acquired
infections and are rapidly spreading all over the world. In several areas, CTX-
M-type ESBLs are more prevalent than TEM or SHV ESBLs (Rossolini et al.
2008).

27
1.9 Bacterial Resistance to β-lactam Antibiotics
As discussed before, mutation at residue 238 leads to a lower expression
level of the gene in comparison to the wild type but there are other
mechanisms which increase ESBL-related resistance (Gniadkowski 2008).
1. A reduction in accumulation of β-lactam in cell due to lowering the outer
membrane permeability, known as porin deficiency
2. Higher expression of ESBLs by promoter mutation or replacements,
mediated by insertion sequences such as IS26 or gene copy
amplification
3. Increasing ESBL activity by further evolution such as further mutation at
residue 240
1.10 blaSHV Gene Evolution The story of the evolution of SHV gene begins with translocation of the
chromosomal blaSHV gene on to the plasmids. Evidences have shown that
plasmid-borne blaSHV genes are transferred by transposons; and Insertion
sequences such as IS26 has played an important role in this translocation.
The SHV β-lactamase gene, blaSHV, is a normal part of the K. pneumoniae
chromosome and has been found on the plasmids in K. pneumoniae strains,
as well as other members of the Enterobacteriaceae family. The plasmid-
borne blaSHV carries IS26 insertions (an 820bp IS) either upstream of the
promoter or in the promoter, which in turn reinforces promoter strength. Two
single, separate mobilisation events of blaSHV from the K. pneumoniae
chromosomes, containing blaSHV-1 and blaSHV-11, onto the plasmids appear
to have been mediated by insertion sequence IS26 (Ford and Avison 2004).
The case of blaSHV-1, the mobilisation led to an IS26 insertion approximately
two kbp upstream of the blaSHV coding sequence and the mobilisation of
blaSHV-11 resulted in an IS26 insertion in the blaSHV promoter (termed
pr::IS26-blaSHV). Other blaSHV types have been emerged from these two
types of plasmid-borne blaSHV genes later.

28
An intriguing aspect of the biology of the SHV β-lactamases in K.
pneumoniae is that plasmid-borne ESBL encoding blaSHV genes are found
commonly, while reports of ESBLs encoded by the K. pneumoniae
chromosome located blaSHV remain vanishingly rare. Three likely (and non-
mutually exclusive) explanations for this are:
1. Plasmid- borne blaSHV genes are expressed more highly because they
possess more powerful promoters than the chromosomal blaSHV, so the
ESBL-activity conferring mutations are more likely to be fixed by evolution if
they occur in a plasmid-borne gene (Hammond et al. 2005; Podbielski et al.
1991; Rice et al. 2000).
2. Plasmid-borne blaSHV genes are expressed more highly because they are
present in the higher copy number than the chromosomal gene. Evidence
suggests that the conversion to an ESBL-positive phenotype occurs following
an increase in the number of mutation targets (i.e. blaSHV gene copy number)
either by plasmid or IS26-mediated amplification (Hammond et al. 2005).
3. Mutations conferring ESBL activity are exceedingly rare, while
dissemination of plasmid-borne ESBL-expressing mutant forms of blaSHV is
exceedingly efficient. . Recent studies have shed light on this issue. It has
been shown that the strains which only harbour the chromosomal blaSHV
gene - IS26 negative isolates - cannot express an ESBL phenotype, even
under selective pressure which maybe due to the affect of the gene
regulatory mechanisms, but strains containing plasmid-borne blaSHV are
capable of acquisition of an ESBL-positive phenotype (Ford and Avison
2004; Hammond et al. 2008). Therefore, the presence of a plasmid-borne
non-ESBL-encoding blaSHV is essential for ESBL expression.
Further studies on strains with IS26 upstream of the promoter of blaSHV gene
showed that there is a single nucleotide polymorphism or SNP (C→A) in the
second position of the -10 region of the blaSHV of ESBL positive
K. pneumoniae isolates (Rice et al. 2000). Recent research conducted at
QUT revealed that in these cases, the A allele only exists on the plasmid-

29
borne blaSHV, and not on the chromosomal-borne blaSHV (Turner, unpublished
data). On the other hand, Hammond et al. (2005) suggested that IS26
insertion in the blaSHV promoter maybe associated with the selection for an
ESBL-positive phenotype. These findings explain that why the promoter of a
plasmid-borne blaSHV is more efficient than a chromosomal-borne blaSHV. Hammond et al. (2008) also found a correlation between the copy number of
the blaSHV gene and the resistance level. This suggests that the evolution of
widespread clinically significant SHV-ESBL has required gene mobilisation
on to plasmids plus the appearance of variant promoters that are stronger
than the chromosomal promoter plus the presence of IS26 copies that flank
blaSHV and facilitate its multimerisation.
Theses findings have also an important clinical usage, as specific IS26
insertions can be used as a marker for the presence of plasmid-borne blaSHV.
In the absence of IS26, blaSHV only exists on the chromosome and never
expresses ESBL activity, but in the presence of IS26 and no ESBL activity,
ESBL expression can occur in response to a selective pressure. Therefore, in
the latter, usage of third generation cephalosporins in the treatment of the
patients is not effective.
1.11 Origin of Mutations
Over 60 years ago, Luria and Delbrück (1943) proposed a fluctuation
analysis to determine the origin of mutation in bacteria. They tried to find out
whether mutations occur spontaneously and randomly prior to exposure to
selective agents, or occur in response to exogenous environment (induced or
directed mutations). It was hypothesised that circumstances has no effect on
mutation rate. To determine this, Luria and Delbrück inoculated E. coli into a
culture media and dispensed a known cell volume into parallel identical tubes
containing broth culture media without any selective pressure and incubated
them. After reaching a suitable concentration, they transferred an equal
amount of broth cultures onto the agar plates containing 1010 lethal
bacteriophage T1. In the case of induced mutation theory, it was expected to

30
have equal probabilities of resistant development and therefore equal
number of resistant colonies from parallel broth cultures. But there was a
wide variation between the results of parallel cultures. This was in
accordance with the spontaneous mutation theory and indicated the
presence of different number of mutants before bacteriophage exposure.
According to this theory, mutation had occurred non-selectively and
independently sometimes during the growth of the bacteria in broth cultures
from the first cell divisions to the last ones. If it happens in the early stages,
the number of mutants will be higher than when it occurs in the last stages
(Angerer 2001; Dewanji et al. 2005; Jones et al. 1994; Ma et al. 1992). Luria
and Delbrück concluded that mutation rates are not influenced by selective
pressures (Cairns and Foster 1991).
In 1988, Cairns et al. proposed induced mutation theory again. This time,
they used a non-lethal selective agent, lactose, and E. coli Lac- mutants. This
experimental system also gives the opportunity of directed mutation for other
non-mutant cells. In this system, Lac- mutants with a revertible Lac mutation
are plated on the media containing lactose as the only carbon source of
energy. Looking at the genotype of the strains in these experiments
conducted by Cairns et al (1988) they used E. coli FC40 mutants harboring a
LacI-LacZ fusion that lacks the Lac regulatory region and containing a
frameshift mutation that encodes a translational fusion between LacI and
LacZ (Muller-Hill and Kania 1974). The frameshift (+1) is located in the LacI
portion. Although, transcription is initiated constitutively from the Lac
promoter (LacP) but the construct is Lac- because of a polar +1 frameshift
changing CCC to CCCC at the 320th codon of LacI (Calos and Miller 1981).
In other words, a frameshift in the upstream LacI part of the fused genes
prevents expression of the downstream lower LacZ part and transforms the
strain to Lac-. Compensating (-1) frameshift mutations lead to the expression
of LacZ and revert the strain to Lac+. Revertant colonies can grow on lactose
medium by either compensating (-1) frameshift mutation or increasing mutant
gene copy number (Roth et al. 2006).
31
After a few days, some Lac+ revertants formed visible colonies during the
exponential growth (spontaneous mutation) and Lac+ revertants continued to
appear in a stationary phase with a higher mutation rate due to Lac+ mutation
stimulation (induced or adaptive mutation) (Cairns and Foster 1991; Cairns et
al. 1988). Therefore, Cairns et al (1988) reopened the debate of the origin of
the genetic variation and the controversy was still remaining. They showed
that the majority of mutants/revertants emerge after exposure to lactose.
Their results also revealed that without other requirements for growth such as
RecA and LexA, adaptive mutants cannot emerge in the presence of lactose
and this has not any effect on the spontaneous mutation rate (Cairns and
Foster 1991).
Several models have been proposed to describe the mechanism of stress-
induced mutation of non-growing cells. In functional direction model, cells
change sites in their genome to overcome the situation and survive under
selection pressure (Foster and Cairns 1992). In another model called
hypermutable state (HMS) model, stress induces a general or genome-wide
hypermutable state in a subpopulation of non-growing cells. Only cells that
acquire proper mutation relive the stress (Hall 1990). Positional direction
model is a combination of the previous two models and states that stress
induces dinB, which is located 16 kb from Lac gene in plasmids, encodes
DNA Pol IV and associates mutagenesis. Stress only mutagenises regions
with recombinational replication. According to this model, mutagenesis is
directed to plasmids because of their intense recombinational events.
It seems that to obtain a revertant phenotype, the cells have to undergo two
processes: mutational process and amplification process, which in the first
process true revertants are formed and in the latter, slowly growing colonies
are produced.
The amplification model proposes that mutations emerge in a growing subset
of cells. It is known that there are some cells with a Lac duplication in the
whole population (about 1%). Formation of these duplications is RecA-
independent. These cells start slowly growing clones under selective

32
pressure. In these developing clones, the Lac region is amplified by a heavily
RecA-dependent recombination process. These copies are unstable. After
the occurrence of Lac+ mutation, these mutants proliferate and the extra Lac-
copies are eliminated by RecA. During this process the Lac+ copy, which is a
useful genes, is retained and leads to a pure Lac+ colony. Recombination
provides Lac+ higher copy numbers that might increase the mutation rate
(Foster 2004; Roth et al. 2006).
1.12 Gene Amplification
It has been known for many years that antibiotic-mediated selective pressure
can result in an increase in the copy number of the corresponding resistance
gene. It has also been established that this process is dependent upon the
homologous recombination pathway, and sequence repeats flanking the
resistance gene. Recent findings have lead to a renewed interest in the
contribution of gene copy number effects to adaptive processes in bacteria.
Kugelberg et al. (2006) and Slechta et al. (2003) have demonstrated that
amplification of the LacZ gene is the mechanistic basis for apparent, but now
disproved, events adaptive mutation in enteric bacteria, and Bergthorsson et
al. (2007) have posited that gene amplification facilitates the evolution of new
functions of pre-existing genes. Of more relevance to antibiotic resistance, it
has recently been found that duplication of a 13.5 kbp chromosomal
fragment in Streptococcus agalactiae leads to resistance to sulphonamide
and trimethoprim, by increasing expression of genes involved in folate
biosynthesis (Brochet et al. 2008). A broadly similar mechanism contributes
to linezolid resistance in Staphylococcus aureus (Tsakris et al. 2007).
A remaining enigma is the role of copy number plasticity of plasmid-borne
blaSHV. There is some evidence that, even allowing for the effect of the strong
promoters driving plasmid-borne blaSHV, copy number plasticity of plasmid-
borne blaSHV is central to the evolution of SHV ESBL–dependent resistance
to third generation cephalosporins. There are increasing reports of copy
number amplification of bla genes, and causative associations with increased

33
expression. One of the earliest was by Xiang et al. (1997) who described
amplification of plasmid-borne blaSHV-5. Three possible mechanisms of SHV-5
β-lactamase hyperproduction were investigated: a more powerful promoter,
an increase in plasmid copy number or blaSHV-5 gene copy number
amplification on a plasmid. They found that the selection of high resistance
levels to CTX in a blaSHV-5- expressing K. pneumoniae is associated with
blaSHV copy number amplification. Similar results were obtained by Hammond
et al. (2005). They reported an association between cefotaxime resistance
level and blaSHV copy number amplification in the PAH ESBL-positive
isolates. The examination of closely related K. pneumoniae clinical isolates
that carried blaSHV, but differed in their ESBL expression status revealed that
the ESBL-expressing strains had higher blaSHV copy numbers than the ESBL
non expressers. Finally, blaSHV copy number amplification via the formation of
tandem arrays has been directly detected in a fully characterised plasmid
from a K. pneumoniae clinical isolate by Zienkiewicz et al. (2007). They
sequenced the blaSHV-5- carrying plasmid p1658/97 and found tandem
repeats of the blaSHV-5 containing region bounded by copies of IS26. They
termed this region an amplimer. Copy number amplification is not confined to
SHV family genes, with Bertini et al. (2007) reporting an association between
duplication of blaoxa-58 and high level carbapenem resistance in Acinetobacter
baumannii. Remarkably, this duplication is also of an IS26 delineated
cassette.
1.13 Heteroresistance
The term “heteroresistance” is difficult to define precisely but has been used
to describe microbial populations that generate higher MIC derivatives at
such a high frequency that essentially any significant population will contain
such derivatives. Classically, the term has been applied to vancomycin
resistance in Gram-positive bacteria, in particular S. aureus (Falagas et al.
2008). The concept has now been extended to colistin resistance in
Acinetobacter baumannii-calcoaceticus complex (Hawley et al. 2008), and to
penicillin resistance in Streptococcus pneumoniae (Morand and Muhlemann

34
2007). It seems that heteroresistance provides bacteria with an opportunity to
explore growth in the presence of antibiotics before organism is completely
evolved to a resistant strain.
According to Clinical Laboratory Standard Institute (CLSI) criteria, Gram
negative microorganisms with an MIC value ≥ 16 µg/mL for third generation
cephalosporins such as cefotaxime and ceftazidime are considered resistant.
However, there are too many treatment failure reports due to infections
caused by ESBL producers with MIC values between 2 and 8 µg/mL (Perez
et al. 2007). It was hypothesised that the heteroresistance in these bacteria
may provide the opportunity for the organism to amplify the blaSHV gene in a
selective environment, which in turn leads to the emergence of resistant
phenotypes. This might explain the reason of the reported treatment failures.
1.14 Treatment of Infections with ESBL-Producing Organisms
According to the results of the SENTRY Antimicrobial Surveillance Program,
the best treatment results were obtained with imipenem as the first choice,
amikacin as the second choice followed by piperacillin/tazobactam as the
third choice with 0%, 6% and 10% resistance, respectively (Bell et al. 2002).
ESBLs are frequently plasmid encoded which may carry other genes
encoding resistance to other drugs (e.g. aminoglycosides). Therefore
antibiotic options in the treatment are extremely limited. Carbapenems are
also suggested as the drug of choice for the treatment of the infections
caused by ESBL-producing organisms (Chambers 2007). Clinicians should
avoid cephalosporins if drug penetration to infection site is poor (e.g.
meningitis, endocarditis and osteomyelitis) or at the presence of high-
inoculum infections such as intra-abdominal abscess (Paterson and Bonomo
2005). There are also some reports that show ESBL-producing strains of
K. pneumoniae can become resistant to cephamycins due to the loss of outer
membrane porin proteins, OmpK35 and OmpK36 (Domenech-Sanchez et al.
2003; Hernandez-Alles et al. 1999; Martinez-Martinez et al. 1996).

35
1.15 Mutation Rate Determination
1.15.1 Mutation Rate versus Mutation Frequency
“Mutation rate” and “mutant frequency” are terms that are sometimes
confused, but they mean very different things. Mutant frequency is the
proportion of mutants to the total number of cells. Because the number of
specific mutants in a culture depends on when the mutation occurred during
growth of the culture, simply counting the mutants in a single culture may not
be very useful (Figure 5) (Pope et al. 2008; Rosche and Foster 2000). In
contrast, the mutation rate is the probability of a mutation occurring during a
single growth and division cycle of a single cell.
This is regarded as the more useful descriptor because it is not a function of
the number of generations of growth and so is inherently more absolute.
Two methods for the mutation rate determination are mutation accumulation
method and fluctuation analysis method. Although, mutation accumulation
method is more accurate than the other method, it is difficult and time-
consuming. Therefore, fluctuation analysis was preferred. In antibiotic
research, fluctuation analysis methods are more common than mutation
accumulation methods. In fluctuation methods, mutation rate is calculated by
analysing the distribution of mutants in parallel cultures. This method was
first introduced by Luria and Delbrück in 1943 (Rosche and Foster 2000).

36
Figure 5. Comparison between mutation frequency and mutation rate; Mutation frequency is 7 in 16 cells but mutation rate is 3 in 15 cell divisions (mutants are in gray color)
Figure 5. Comparison between mutation frequency and mutation rate; Mutation frequency is 7 in 16 cells but mutation rate is 3 in 15 cell divisions (mutants are in gray color)

37
1.15.2 Poisson Distribution
The Poisson distribution is the probability distribution of random events in
time or random distribution of small particles in space (Armitage 1952). It is
useful for determination of the probability of random mutations of a particular
gene in a cell. Poisson equation for the probability of the random mutations in
a cell is as follow:
Px = mx e-m / x!
Where:
Px = probability that a culture will have exactly x mutations
m = average number of mutations per culture (i.e. per cell divisions)
“Estimator” is a traditional word meaning a method of calculation of m. This
parameter is used in mutation rate calculations. There are 8 different
estimators to determine Px.
1. Po method
2. Luria-Delbrück method of the mean
3. Lea-Coulson method of the mean
4. Drake formula using the median
5. Jones median estimator
6. Koch’s quartiles method
7. Lea-Coulson maximal likelihood method
8. Ma-Sandri-Sarkar maximum-likelihood method (MSS-MLL)
The simplest one is Po method which was applied by Luria and Delbrück.
However, the frequency of zero mutations has to be calculated:

38
Po = m0 e-m/0!
Po = 1 × e-m / 1
Po = e-m
m = -ln Po
Where:
Po = proportion of cultures without mutants (number of cultures with 0
mutants / total number of cultures)
After determining m value, it could be used for determination of Px. Then, this
calculated result, which is a prediction of randomness, can be compared to
the observed values. The Po method estimator is only valid when Po is
between 0.1 and 0.7 (0.3 ≤ m ≤ 2.3) (Rosche and Foster 2000).
1.15.3 The MSS Maximum-Likelihood (MSS-MLL) Method
MSS maximum-likelihood method is the gold standard estimator for m
estimation for all ranges of m (Rosche and Foster 2000). In 1992, Ma et al.
described a new recursion relation for computing of the Luria-Delbrück
distribution using the Lea-Coulson generating function
The MSS-MLL algorithm is as follows (Hammond 2004; Rosche and Foster
2000):
1. Estimation of a preliminary m using Lea-Coulson method of the
median equation ( r~ is the median number of mutants in a culture):
024.1)ln(/~ =−− mmr

39
2. Obtaining a maximum –likelihood estimation of m, calculation of Po and
Pr for the calculation of the total probability (Pr) for a given m:
∑ −
=−
+−==
1
00 )1(; r
ii
rm
irp
rmpep
Where:
Po = proportion of cultures with no mutants
Pr = proportion of cultures with observed r mutants in a culture
Calculation of the Pr’s for r = 0 to 150 for a given m.
3. Calculation of a likelihood value from the following equation:
∏=
=C
ii mrfmrf
1
)()(
Where:
rpmrf =)( and C = The number of parallel cultures in the experiment
Recalculation of the Pr’s, using adjacent m’s, until obtaining of an m that
maximises the likelihood.
4. Plotting the value of the likelihood function against m and determine the m
for the maximum value
5. Using m for the mutation rate calculation
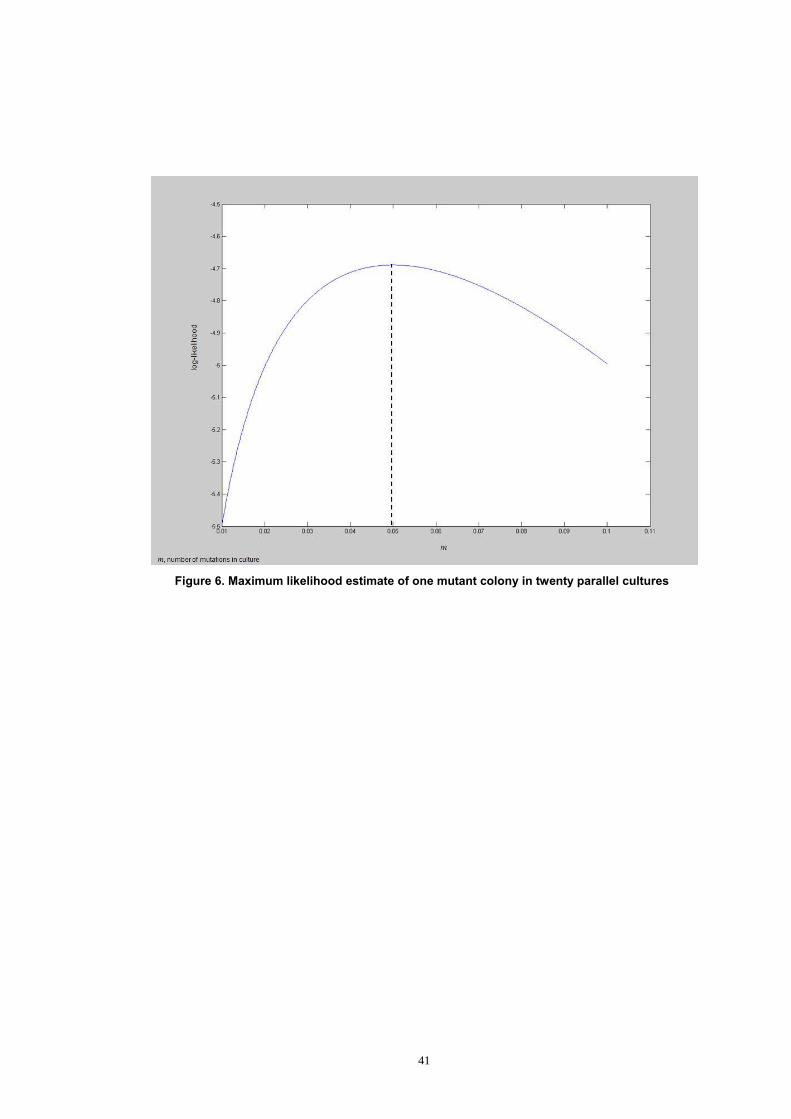
As a summary, maximum likelihood is in essence a “trial and error” method in
which the likelihood of obtaining the results is calculated for different values
of m, the number of mutations in culture. Maximum likelihood differs from
probability. A probability refers events that occur in future, while likelihood
refers to the events in the past which have known outcomes (Weisstein
2003). In another words, likelihood is a conditional probability. Figure 6
shows the maximum-likelihood of one mutant colony in 20 parallel cultures.

40
The maximum likelihood estimate is obtained by finding the value of m that
maximises the log-likelihood. In this example, it is 0.05.
1.15.4 Calculation of Mutation Rate
Mutation rate (µ) is the probability of mutation of a cell during one cell cycle.
The amount of growth has a great influence on the parameter m. Therefore,
mutation rate is obtained by dividing m by the some measure of the number
of cells at the risk of mutation (Rosche and Foster 2000). According to
Armitage, mutation can occur at two points of the cell division, at the
beginning and the end of cell division (1952). At the beginning of the cell
division, the number of the total cells at risk is the total number of cells that
ever existed in the culture, i.e. 2Nt. Nt is the final number of viable cells in
culture. So, the sum of Nt cells with their Nt/2 parents and Nt/4 grandparents,
etc., is 2Nt. Therefore the mutation rate per cell per generation is calculated
as follows:
µ = m/2Nt
Since at the end of the cell division, the number of the cells at risk is the
same as the number of divisions that occurred, therefore, the calculation of
the mutation rate per cell per division is:
µ = m/Nt
Determination of Nt should be done with a high level of accuracy.
Confidence limits for m are calculated as (Rosche and Foster 2000):
315.096.1
95 )(96.1)ln( −+=+σσ emCL
315.096.195 )(96.1)ln( ++=−
σσ emCL Where:
.225.1 315.0 Cm−≈σ
41
Figure 6. Maximum likelihood estimate of one mutant colony in twenty parallel cultures

42
1.16 Summary
Bacterial resistance to antibiotics and worldwide dissemination of these
resistant strains is one of the major problems encountered in clinics. The
history of antibiotics shows a great challenge between the usage of new
developed antibiotics and the emergence of the bacterial resistance which
would make the need for new agents. In the early 1980’s, to overcome the
resistance of bacteria against β-lactams antibiotics, third generation
cephalosporins such as cefotaxime, ceftazidime and ceftriaxone were used in
hospitals and subsequently the resistance to these new drugs emerged later
by producing ESBLs (Heritage et al. 1999). There are different types of
ESBLs. The SHV ESBLs comprise one of the most clinically significant types
of the β-lactamases. The SHV β-lactamase gene, blaSHV, is a normal part of
the K. pneumoniae chromosome and has been found on the plasmids in
K. pneumoniae strains, as well as other members of the Enterobacteriaceae
family. K. pneumoniae have been reported as the cause of more than 75% of
ESBL-producing infections. Because of its importance, our research team
only focused their work on this group. ESBL production is conferred by point
mutation but this mutation leads to a lower expression level of the gene in
comparison to the wild type (Hujer et al. 2002). To overcome this problem, it
seems that the bacterial cells improve their resistance status by an increase
in blaSHV gene copy number.
The hypothesis of this project is that when there is a blaSHV on a plasmid,
mutation rate to ESBL positive phenotype will be consistent with the
requirement for two genetic events, the mutation and the copy number
expansion of blaSHV. In other words, mutation is only effective when there
happens to have been prior blaSHV copy number expansion and the mutation
is essential but not sufficient for acquisition of ESBL activity. A remaining
enigma is the role of copy number plasticity of plasmid-borne blaSHV.
Evidence suggests that the conversion to an ESBL-positive phenotype
occurs following an increase in the number of mutation targets (i.e. blaSHV
gene copy number) either by plasmid or IS26-mediated amplification
(Hammond et al. 2005). There is some evidence that, even allowing for the
43
effect of the strong promoters driving plasmid-borne blaSHV, copy number
plasticity of plasmid-borne blaSHV is central to the evolution of SHV ESBL–
dependent resistance to third generation cephalosporins. If this model is
correct, then the mutation rate from a non-ESBL to ESBL-positive phenotype
would be very low, even with a plasmid-borne blaSHV gene. On the other
hand, the mutation rate from a low MIC ESBL-positive ( ≤ 8 µg/mL for CTX)
to high MIC ESBL-positive ( ≥16 µg/mL for CTX) was predicted to be very
high. This is because only blaSHV gene copy number increase is needed,
which is probably mediated by homologous recombination that typically takes
place at a much higher frequency than point mutation.
According to Clinical Laboratory Standard Institute (CLSI) criteria, Gram
negative microorganisms with an MIC value ≥ 16 µg/mL for third generation
cephalosporins such as cefotaxime and ceftazidime are considered resistant.
However, there are too many treatment failure reports due to infections
caused by ESBL producers with MIC values between 2 and 8 µg/mL (Perez
et al. 2007). It was hypothesised that the heteroresistance in these bacteria
may provide the opportunity for the organism to amplify the blaSHV gene in a
selective environment, which in turn leads to the emergence of resistant
phenotypes. This might explain the reason for the reported treatment failures.
In this study, the aim was to shed light on the role of blaSHV copy number
plasticity on the evolution of SHV ESBL activity.

44
1.17 Aims
According to these hypotheses, three aims were designed for this study.
1. Determination of blaSHV mutation rate in K. pneumoniae isolates from a
non-ESBL status to an ESBL positive status and comparison to the
mutation rate of rpoB gene, which is responsible for rifampicin resistance,
as a control. Also, determination of blaSHV mutation rate in
K. pneumoniae isolates from a low MIC ESBL status to a high MIC ESBL
status.
2. Detection of heterogenous phenotype with regards to cephalosporin
resistance in K. pneumoniae strains
3. Determination of the mechanism of blaSHV copy number amplification.

45
Chapter 2
2 Mutation Rate Determination
It has previously been reported that the selection of SHV ESBL expressing
derivatives of non-ESBL expressing K. pneumoniae is associated with blaSHV
copy number expansion (Hammond et al. 2005). This experiment was carried
out in liquid medium, so determination of the mutation frequency was not
possible. However, it suggests that selection of an SHV-dependent ESBL-
expressing derivative of a non-ESBL expressing K. pneumoniae requires the
simultaneous selection of a point mutant and copy number variant. It may
therefore be predicted that the observed mutation frequency will be very low,
as it would be the product of the frequencies of appropriate blaSHV point
mutants and copy number variants. This was tested using six K. pneumoniae
clinical isolates.
2.1 Materials and Methods
2.1.1 Bacterial Isolates
The isolates 18, 33, 54, 110, 113, 114 and 119 were from the SENTRY
Antimicrobial Surveillance Program collection and were collected from the
Asia-Pacific region and South Africa between January 1998 and December
1999, and isolates A1, B1, D1, E1, F1 and K2 were from the Princess
Alexander Hospital (PAH), Brisbane (Table 4) (Howard et al. 2002;
Schooneveldt et al. 1998).

46
Table 4. K. pneumoniae PAH and SENTRY isolates genotype and phenotype
Isolate Origin blaSHV Pr::IS26-blaSHV U/S IS26 ESBL A1 Australia Pos Pos Neg Pos B1 Australia Pos Pos Neg Pos D1 Australia Pos Pos Neg Pos E1 Australia Pos Pos Neg Pos F1 Australia Pos Pos Neg Pos K2 Australia Pos Pos Neg Neg 33 Philippines Pos Pos Neg Neg*
119 Hong Kong Pos Pos Neg Neg 18 South Africa Pos Neg Pos Neg*
54 Philippines Pos Neg Pos Neg 110 Taiwan Pos Neg Pos Neg 113 Taiwan Pos Neg Neg Neg 114 Philippines Pos Neg Neg Neg
pr::IS26-blaSHV, IS26 in the blaSHV promoter U/S IS26, IS26 approximately 2kbp upper blaSHV promoter * These isolates found to be ESBL-positive or contaminated with ESBL-positive samples.
47
2.1.2 Determination of Mutation Rates
A single colony of each isolate, streaked on MHII agar plates was used to
make a 0.5-McFarland unit suspension for the following procedure (Figure 7).
5 microliter of a 1 in 150 dilution of the suspension in sterile physiological
saline, which approximately contains 10,000 cells, was used for inoculating
each of 20 parallel MHII broth cultures (to rule out jackpot mutations). After
20 hours incubation at 37 °C with agitation, 225 RPM (I 26 incubator shaker
series, New Brunswick Scientific), 50 microliter from each tube was plated
out onto MHII-cefotaxime (1µg/mL) and MHII-rifampicin (150 µg/mL) agar
plates. This low concentration of cefotaxime only prevents the growth of non-
ESBL strains and has not any selection pressure on the growth of the
bacteria. Following 18-24 hours incubation at 37 °C the number of CTXr
(cefotaxime resistant) and Rif r (rifampicin resistant) mutant colonies were
counted. The total number of viable cells (Nt) was determined by plating 50
microliter of a diluted suspension from 5 parallel broth cultures of an isolate
onto free antibiotic MHII agar plates. For this purpose 10-6 dilution was used
and the results were multiplied by 106 (Hammond 2004). The mean of the
five numbers of viable cells is considered as the number of viable cells (Nt).
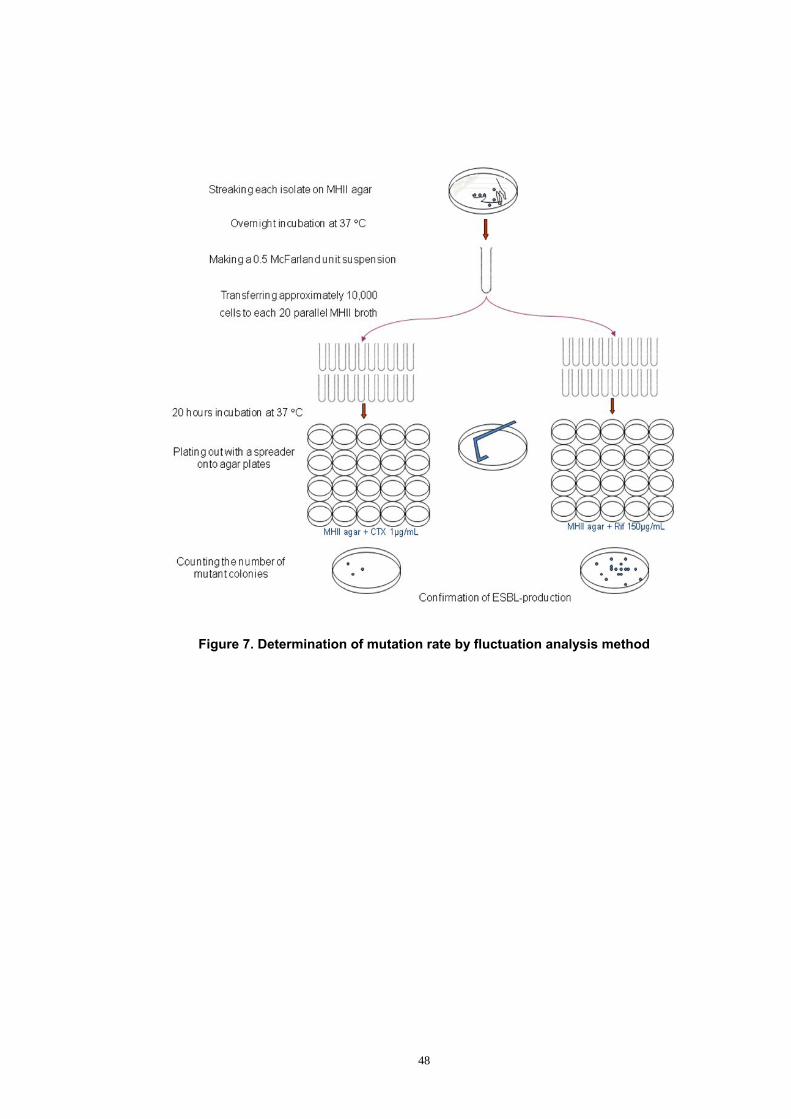
48
Figure 7. Determination of mutation rate by fluctuation analysis method

49
Mutation rates were calculated by using the MSS-maximum likelihood
method according to Rosche et al. (2000) A computer-based program was
designed for the convenience (appendices A and B). This algorithm is
discussed in section 15.3 of the the first chapter.
2.1.3 ESBL Phenotypic Detection
The Etest® ESBL screening strips were used for the detection of ESBL-
expression and determination of CTX MICs, according to the manufacturer’s
instructions (AB Biodisk, Solna, Sweden).
2.1.4 DNA Extraction for Real-Time PCR Analysis
The DNA extraction was done by using a DNeasy tissue kit (Qiagen, Hilden,
Germany) in accordance with manufacturer’s instructions and DNA
concentration was checked by agarose gel electrophoresis.
2.1.5 Real-Time PCR and Relative Quantitation of blaSHV
Allele specific real-time PCR, which is sometimes known as kinetic PCR, was
used to interrogate the codon 238 SNP associated with acquisition and of
SHV ESBL activity. This was carried out essentially as previously described
(Hammond et al. 2005). The assays were performed in duplicate in a Corbett
6000 Rotorgene, and Platinum ® SYBR® Green qPCR SuperMix (Invitrogen)
was used as the Mastermix. The primer sequences are shown in Table 5.
The reactions contained 5 pmol of each primer, 1µL of bacterial cell lysate,
and master mix according to the manufacturer’s instructions. The final
reaction volumes were 10 µL. The thermocycling protocol was an initial
denaturation at 95°C for 60 s, followed by 40 cycles of 94°C for 15 s, 60°C
for 20 s, and 72°C for 30 s. Fluorescence readings were acquired during the
72°C step.
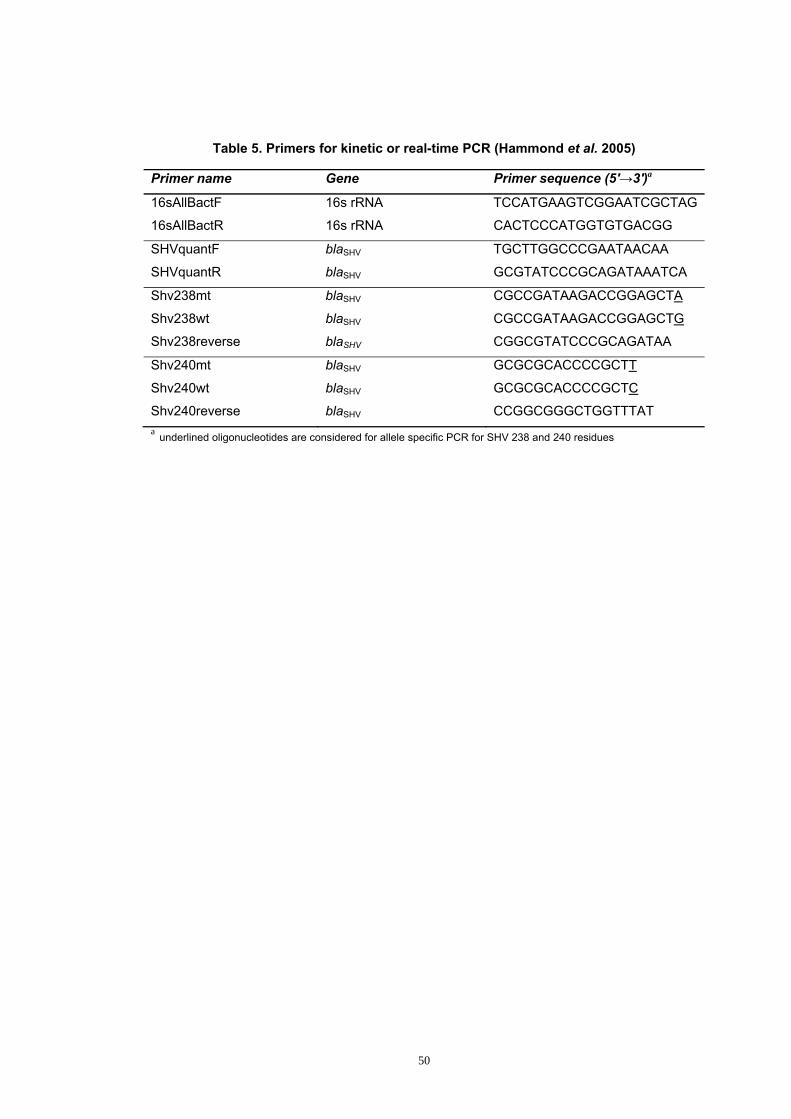
50
Table 5. Primers for kinetic or real-time PCR (Hammond et al. 2005)
Primer name Gene Primer sequence (5'→3')a
16sAllBactF 16s rRNA TCCATGAAGTCGGAATCGCTAG
16sAllBactR 16s rRNA CACTCCCATGGTGTGACGG
SHVquantF blaSHV TGCTTGGCCCGAATAACAA
SHVquantR blaSHV GCGTATCCCGCAGATAAATCA
Shv238mt blaSHV CGCCGATAAGACCGGAGCTA
Shv238wt blaSHV CGCCGATAAGACCGGAGCTG
Shv238reverse blaSHV CGGCGTATCCCGCAGATAA
Shv240mt blaSHV GCGCGCACCCCGCTT
Shv240wt blaSHV GCGCGCACCCCGCTC
Shv240reverse blaSHV CCGGCGGGCTGGTTTAT a underlined oligonucleotides are considered for allele specific PCR for SHV 238 and 240 residues

51
Real-time PCR was also used for total blaSHV relative copy number
determination by the comparative CT method with the 16s rRNA-encoding
gene as the endogenous control, as previously described (Hammond et al.
2005).
2.2 Results
The mutation rates to resistance to 1 µg/mL CTX were determined, and
compared with rates of mutation to 150 µg/mL rifampicin, which is conferred
by a small number of point mutations in the chromosomally located rpoB
gene (Tables 6 and 7).
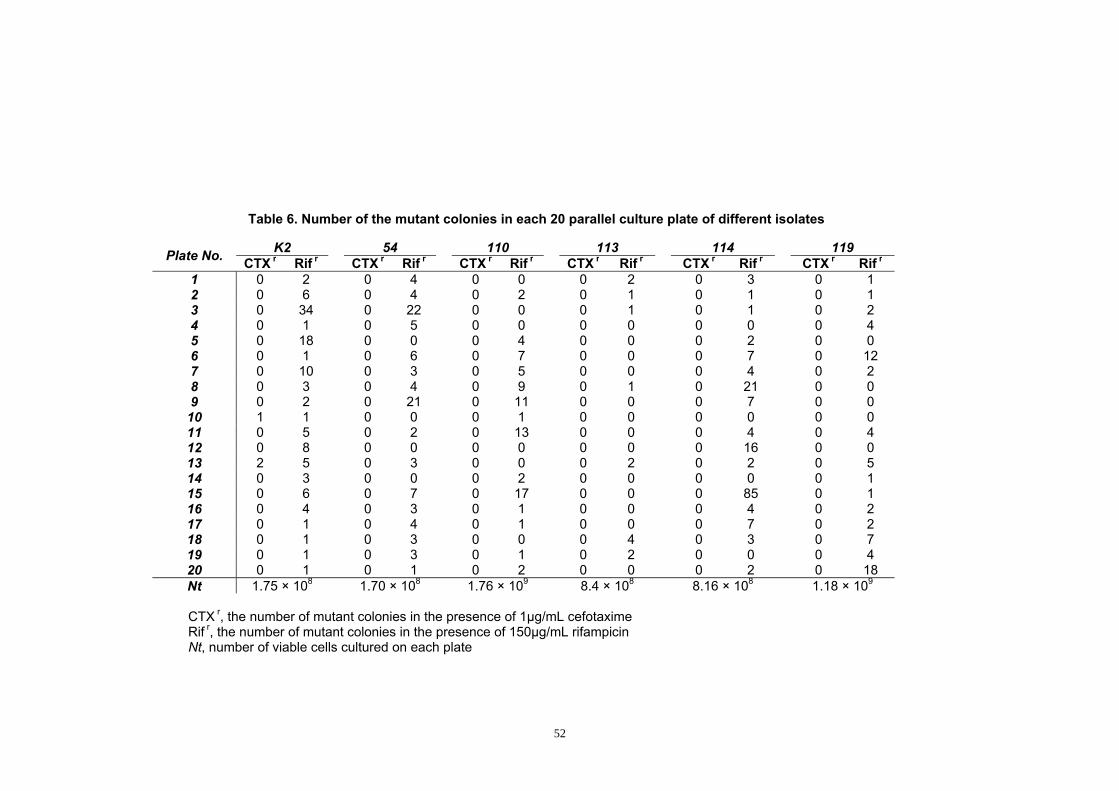
52
Table 6. Number of the mutant colonies in each 20 parallel culture plate of different isolates
Plate No. K2 54 110 113 114 119 CTX r Rif r CTX r Rif r CTX r Rif r CTX r Rif r CTX r Rif r CTX r Rif r
1 0 2 0 4 0 0 0 2 0 3 0 1 2 0 6 0 4 0 2 0 1 0 1 0 1 3 0 34 0 22 0 0 0 1 0 1 0 2 4 0 1 0 5 0 0 0 0 0 0 0 4 5 0 18 0 0 0 4 0 0 0 2 0 0 6 0 1 0 6 0 7 0 0 0 7 0 12 7 0 10 0 3 0 5 0 0 0 4 0 2 8 0 3 0 4 0 9 0 1 0 21 0 0 9 0 2 0 21 0 11 0 0 0 7 0 0 10 1 1 0 0 0 1 0 0 0 0 0 0 11 0 5 0 2 0 13 0 0 0 4 0 4 12 0 8 0 0 0 0 0 0 0 16 0 0 13 2 5 0 3 0 0 0 2 0 2 0 5 14 0 3 0 0 0 2 0 0 0 0 0 1 15 0 6 0 7 0 17 0 0 0 85 0 1 16 0 4 0 3 0 1 0 0 0 4 0 2 17 0 1 0 4 0 1 0 0 0 7 0 2 18 0 1 0 3 0 0 0 4 0 3 0 7 19 0 1 0 3 0 1 0 2 0 0 0 4 20 0 1 0 1 0 2 0 0 0 2 0 18 Nt 1.75 × 10⁸ 1.70 × 10⁸ 1.76 × 10⁹ 8.4 × 10⁸ 8.16 × 10⁸ 1.18 × 10⁹
CTX r, the number of mutant colonies in the presence of 1µg/mL cefotaxime Rif r, the number of mutant colonies in the presence of 150µg/mL rifampicin Nt, number of viable cells cultured on each plate
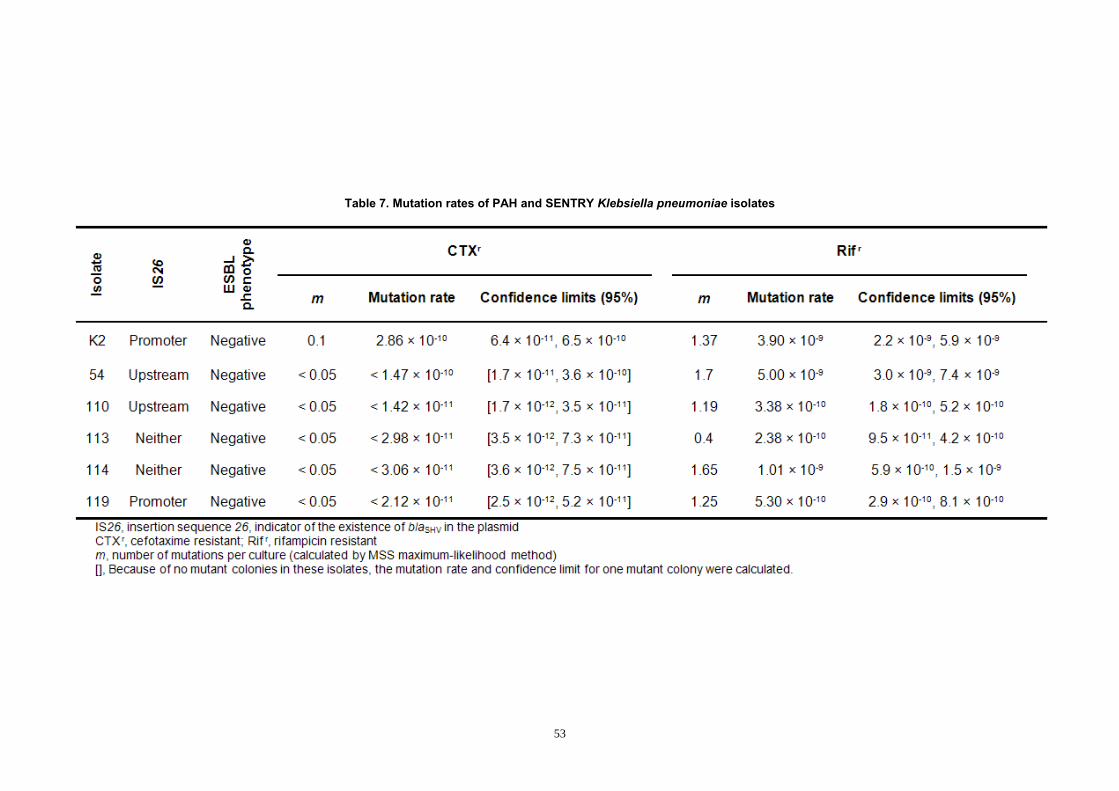
53
Table 7. Mutation rates of PAH and SENTRY Klebsiella pneumoniae isolates

54
In this experimental system, colonies grew on between eight and 20 of the 20
rifampicin plates used for each isolate, with the highest number of colonies
on any one plate being 85, and the calculated mutation rates to rifampicin
resistance are between 10-10 and 10-9. Although the mutation rate to
rifampicin resistance was easily determined, the mutation to CTX resistance
was almost undetectable in this system. Preliminary experiments showed
that isolates 18 and 33 are ESBL-positive or had been contaminated with
ESBL-positive samples. Therefore, they were not incorporated in mutation
rate determinations. Isolates 113 and 114 do not possess a plasmid-borne
blaSHV and only have the chromosomal blaSHV. It has previously been shown
in step-wise selection experiments that plasmid-borne blaSHV is required for
the selection of ESBL expressing mutants (Hammond et al. 2008). As
expected, these strains yielded no mutants. However, the same result was
obtained from three of the four isolates that possess plasmid-borne blaSHV,
and only three ESBL-expressing colonies were obtained in 20 parallel
cultures from just one strain (K2). All three mutant derivatives of K2 were
shown to be ESBL positive according to the cefotaxime E-test (Figure 8), and
to be mutated at codon 238 as determined by kinetic PCR (Table 8).
Maximum likelihood calculations indicated that the rifampicin resistance
mutation rate is at least 10-100 times higher than the cefotaxime resistance
mutation rate, and the mutation rates or µ values (probabilities of mutation
per cell per generation) for mutation to cefotaxime resistance are less than
10-11 and probably much lower (less than the frequency of a single specific
point mutation) (Table 7). The generally accepted mutation rate for a specific
base change in non-mutator enteric bacteria is approximately 10-9. While the
rifampicin resistance mutation rate indicates that this figure may be slightly
lower in K. pneumoniae, the data indicate that the mutation rate to
cefotaxime resistance is less than the frequency of a single specific point
mutation. blaSHV relative copy number analysis of three mutant colonies also
revealed a consistent small increase in the amount of blaSHV gene copy
number (Table 9).

55
Figure 8. ESBL Etest® experiments of K2 three mutant colonies
CT/CTL = 6 / 0.125 = 48 CT/CTL = 6 / 0.125 = 48 CT/CTL = 2 / 0.125 = 16
Criterion for ESBL production: CT/CTL ≥ 8 → ESBL-positive
Table 8. Quantification of blaSHV 238 mutant alleles of K2 mutant colonies
Colony Mean wild type shv238
allele CT Mean mutant shv 238
allele CT ΔCT TCΔ2N1 15.42 18.46 -3.04 0.1 C1 14.7 13.4 1.35 2.5 C2 14.54 14.09 0.45 1.4 C3 14.0 12.77 1.24 2.4
CT, The comparative threshold cycle ΔCT = CT wild type – CT mutant
TCΔ2 , quantity of blaSHV 238 mutant alleles
Table 9. Total blaSHV relative copy number of K2 mutant colonies
Colony 16S SHV TCΔ
TCΔΔ TCΔΔ−2 * N1 10.12 15.64 4.53 C1 10.77 14.07 3.31 -1.22 2.33 C2 10.91 13.96 3.05 -1.48 2.79 C3 10.80 14.18 3.39 -1.14 2.20
CT, The comparative threshold cycle ΔCT = blaSHV CT – 16S rRNA encoding gene CT ΔΔCT was calculated by subtracting the starting culture ΔCT from the calculated ΔCT *, Total blaSHV relative copy number

56
2.3 Mutation Rate from a Low MIC ESBL-Positive Phenotype to a High
MIC ESBL-Positive Phenotype
The selections were carried out using two PAH low MIC ESBL-expressing
K. pneumoniae clinical isolates, B1 and F1, which had previously been
determined to have CTX MIC values of 1 μg/ml. This is towards the low end
of the range of what is found in ESBL-expressing isolates.
The current model for the mechanism of acquisition of high CTX MIC values
is copy number amplification mediated by the generation of tandem repeats
that is in turn mediated by homologous recombination involving the IS26
elements that flank plasmid-borne blaSHV. This would be predicted to take
place at a very high frequency in comparison to point mutation, so the
frequency with which derivatives with increased CTX MIC values can be
selected would be predicted to be very high.
Preliminary experiments indicated that this is indeed the case. Plating of
approximately 109 cells on to CTX concentrations from 2-32 μg/ml yielded a
confluent growth (data not shown). It was decided that this reflected such an
extreme and obvious difference from the frequency of mutation from non-
ESBL expressing to ESBL-expressing that frequency determination using
parallel cultures and maximum likelihood analysis was unnecessary to prove
that the mutation rate was high than the mutation rate from ESBL non-
expressing to ESBL positive. Also, the presence of very large numbers of
mutation events in the cultures essentially eliminates the Luria fluctuation and
makes parallel cultures and statistical analyses unnecessary. Rather, it was
reasoned that more insight would be obtained by plating relatively low
numbers of cells from ESBL-expressing isolates onto a range of CTX
concentrations above the nominal CTX MICs of the isolates, and observing
the numbers of colonies that grow.
Isolates F1 and B1 were grown overnight form single colonies in MHII broth
containing 1µg/mL CTX. Approximately 106 cells of each of these isolates
was plated out onto a 2 fold increasing series of cefotaxime concentrations

57
(Figure 9), and colonies that grew were analysed for CTX MIC as determined
by the E-test and blaSHV copy number amplification as compared with the
original isolate.
In comparison to the previous experiment results, the number of mutant
colonies in the plates was much more and instead of having a number of
mutant colonies, we had a confluent growth of the mutant colonies in the first
plates. Therefore, the MSS maximum likelihood method was not used for the
mutation rate determination, because it was obvious that the mutation rate
from a low MIC ESBL status to a high MIC ESBL status was very high. The
rate for the appearance of higher MIC cells (i.e analogous to the mutation
rate) was approximately 10 million-fold higher than the mutation frequency of
an ESBL-negative strain.

58
Figure 9. F1 mutant colonies in different cefotaxime concentration
A 10-2 dilution is cultured on each plate.

59
Chapter 3
3 Detection of Heteroresistance to Cefotaxime in
K. pneumoniae Isolates by Population Analysis Profile (PAP) Method
3.1 PAP Experiments for Cefotaxime-Resistant K. pneumoniae Strains According to Wootton et al. (2001) the population analysis profiles were
performed for large and distinct colonies as follows. Stock isolates were
cultured on MHII agar plates containing CTX in accordance with their
predetermined MICs. A single separate colony was cultured overnight in
MHII-cefotaxime broths, containing the same CTX concentration. The broth
was diluted 10-2 in saline and 100 µL of the diluted sample plated out by a
spreader onto MHII agar plates containing 1, 2, 4, 8, 16, 32, 64 and 128
µg/mL cefotaxime and incubated at 37 °C for 24 hours. In later experiments
more diluted samples (10-4 and 10-6) were also used to obtain countable
colonies. ESBL-production of the mutant colonies was determined
phenotypically and genotypically as described before. Total blaSHV gene copy
number was determined, as well. The experiment repeated for F1 isolate in a
second run.
Our current model is that plasmid-borne blaSHV exhibits considerable copy
number heterogeneity within K. pneumoniae cells, and that this confers
heterogeneity in resistance phenotype. It was therefore predicted that any
population of K. pneumoniae cells with a plasmid-borne blaSHV would contain
a significant proportion of cells that have an elevated β-lactam MIC as
compared to the population as a whole. This conjecture was tested using two
isolates F1 and B1. These were chosen because they are ESBL expressers
according to the E-test, and this phenotype is conferred by a mutated blaSHV
(Hammond et al. 2005). However, they both have CTX MIC values at the low
end of the range commonly observed for ESBL expressing K. pneumoniae,

60
and this was seen as desirable for this experiment because it provides a wide
range of higher, biologically plausible MICs that can be selected for.
3.2 Results The first quantitative experiments were carried out using inocula of 106
CFU/mL per plate. There were several significant observations. It was found
that isolates B1 and F1 behaved very differently on the selective media.
Firstly, it was observed that two different colony types appeared on the plates
containing different CTX concentrations (Figure 10); large colonies: that
appeared as normal K. pneumoniae colonies, albeit somewhat variable in
size, and were scattered evenly over the plates, and small colonies: that
were tiny and “unhealthy” looking, growing in clumps. They appeared to be
dependent for growth on other nearby colonies, and would have been termed
satellite colonies except that they frequently grew on plates devoid of
colonies of normal morphology i.e. they were not satellites of anything except
each other. In general, F1 yielded primarily the colonies of usual normal
morphology, while isolate B1 yielded the very small “clumpy” colonies. It was
hypothesised that the large colonies represented genuine variants with
higher CTX MIC values, whereas small colonies were growing by virtue of
secreted and carried over β-lactamase activity and grew only in regions of
the plate where sufficient cells had been inoculated to reduce the localised
CTX concentration below a threshold value. The predictions of this
hypothesis would be that large colonies would exhibit an elevated CTX MIC
on the basis of the E-test and also blaSHV copy number amplification with
respect to the original isolate, whereas small colonies would exhibit neither of
these. This was tested with duplicate colonies of both normal and small
morphologies from each plate containing different CTX concentration and
found to be the case (Figure 11 and Table 10). Remarkably, isolate B1
yielded only small colonies when subject to the same selection procedure. It
was concluded that this isolate does not encompass or generate blaSHV copy
number variants in a similar manner to isolate F1. The mechanistic basis for

61
the difference between F1 and B1 is unknown and is worthy of further
investigation.
In addition, the number of colonies that appeared on the selective plates from
isolate F1 indicated that the rate of copy number expansion (i.e. analogous to
the mutation rate) is of the order of 1-10 million times higher than the
frequency of point mutation.
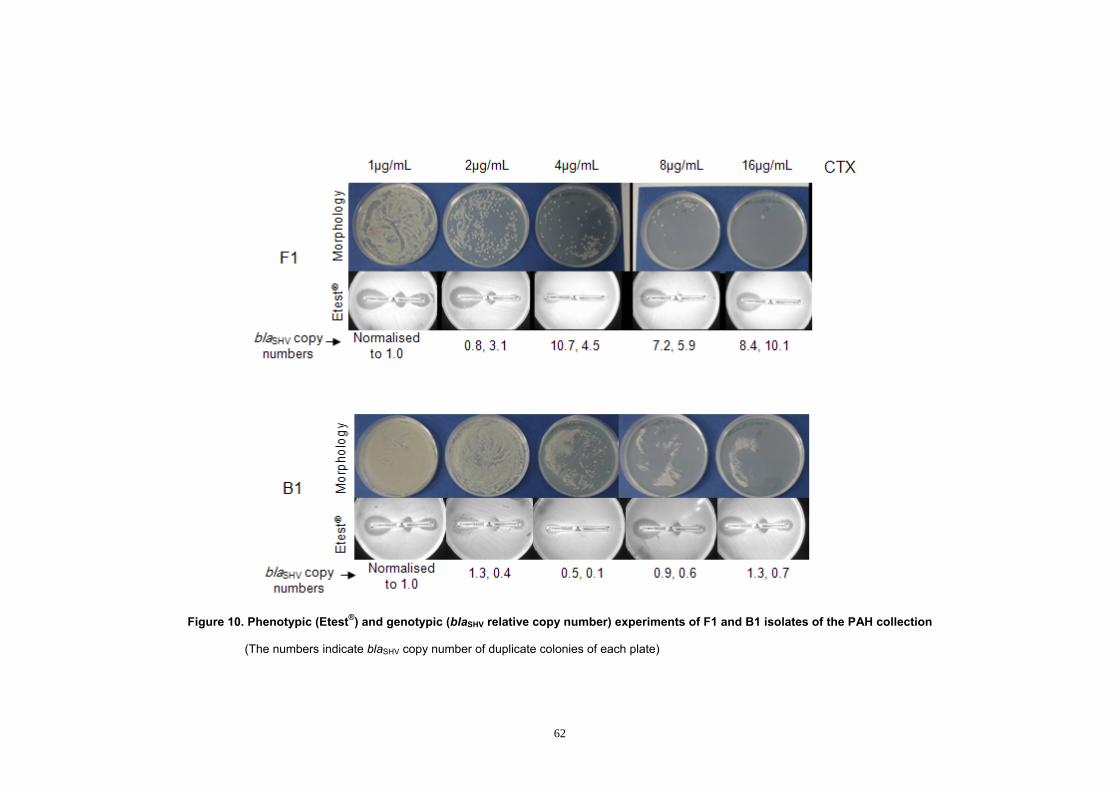
62
Figure 10. Phenotypic (Etest®) and genotypic (blaSHV relative copy number) experiments of F1 and B1 isolates of the PAH collection
(The numbers indicate blaSHV copy number of duplicate colonies of each plate)

63
Table 10. Total blaSHV relative copy number of B1 and F1 isolates
Isolate (in μg/mL CTX) blaSHV TC a 16S rRNA TC TCΔ
b TCΔΔ c TCΔΔ−2 d
First experiment F1 colonies (first colony):
F1(1) 13.15 10.41 2.74 F1(2) 11.12 10.00 1.12 -1.62 3.07 F1(4) 10.22 9.63 0.59 -2.16 4.45 F1(8) 10.65 10.46 0.19 -2.55 5.86
F1(16) 10.36 10.95 -0.59 -3.34 10.09
F1 colonies (second colony): F1(1) 14.27 9.21 5.07 F1(2) 15.94 10.60 5.35 0.28 0.82 F1(4) 10.56 8.92 1.64 -3.43 10.74 F1(8) 11.71 9.50 2.21 -2.86 7.24
F1(16) 11.93 9.94 1.99 -3.08 8.43
B1 colonies (first colony): B1(1) 17.64 10.85 6.79 B1(2) 19.06 10.76 8.30 1.51 0.35 B1(4) 21.22 11.12 10.11 3.32 0.10 B1(8) 18.06 10.62 7.44 0.65 0.64 B1(16) 18.88 11.59 7.30 0.51 0.70
B1 colonies (second colony):
B1(1) 17.80 13.70 4.10 B1(2) 18.11 14.34 3.77 -0.33 1.26 B1(4) 20.00 14.81 5.19 1.09 0.47 B1(8) 18.51 14.32 4.20 0.09 0.94 B1(16) 18.90 15.19 3.72 -0.39 1.31
Second experiment F1 colonies (first colony):
F1(1) 14.15 11.98 2.18 F1(2) 14.58 10.83 3.75 1.58 0.34 F1(4) 13.16 11.69 1.47 -0.70 1.63 F1(8) 11.01 11.28 -0.27 -2.45 5.45
F1(16) 10.98 11.71 -0.73 -2.91 7.52
F1 colonies (second colony):
F1(1) 14.23 11.46 2.78 F1(2) 13.96 11.55 2.41 -0.37 1.29 F1(4) 11.25 10.59 0.65 -2.12 4.35 F1(8) 10.50 10.87 -0.38 -3.15 8.88
F1(16) 8.96 11.51 -2.56 -5.33 40.22
a, The comparative threshold cycle b, ΔCT = blaSHV CT – 16S rRNA encoding gene CT c, ΔΔCT was calculated by subtracting the starting culture ΔCT from the calculated ΔCT d, Total blaSHV relative copy number

64
Figure 11. Total blaSHV relative copy number of B1 and F1 isolates
R1, first set of experiments; R2, second set of experiments

65
Turning to the details of data in figure 11, Etest® results of isolate F1 in
higher cefotaxime concentrations showed more resistant colonies with
increased blaSHV copy numbers, while in B1 isolate, Etest® results of the
colonies of higher cefotaxime concentrations did not show more resistant
variants and it also did not generate blaSHV copy number variants in a similar
manner to isolate F1. This suggests that F1 colonies are genuine variants,
while B1 colonies are not and grow by virtue of secreted and carried over β-
lactamase activity.
Population analysis profile analysis revealed copy number heterogeneity. In
order to expand and refine these findings, the experiments were repeated
with more isolates, and different numbers of inoculated cells per plate, so as
to yield PAPs over as wide a range of CTX concentrations as practically
possible. The number of viable colonies was counted after 24 hours
incubation at 37°C and the logarithm of the colony numbers plotted against
cefotaxime concentration using SAS 9.1 software. It can be seen that all
isolates tested contained substantial populations of cells that grew at CTX
concentrations 16 times higher than the published MIC values (Figures 12-
14). These figures also show the growth of clumpy colonies growing by virtue
of secreted and carried over β-lactamase activity and grew only in regions of
the plate where sufficient cells had been inoculated. Of course, these
colonies are not genuine and were not counted in our results. In some
instances, growth of undiluted samples on higher concentration CTX yielded
to a non-ESBL background growth, whereas a 10-2 dilution resulted in no
growth of the bacteria.
It was concluded that it is possible to select at a very high frequency
derivatives of ESBL expressing K. pneumoniae with stable increases in CTX
MIC, although this may be strain dependent.
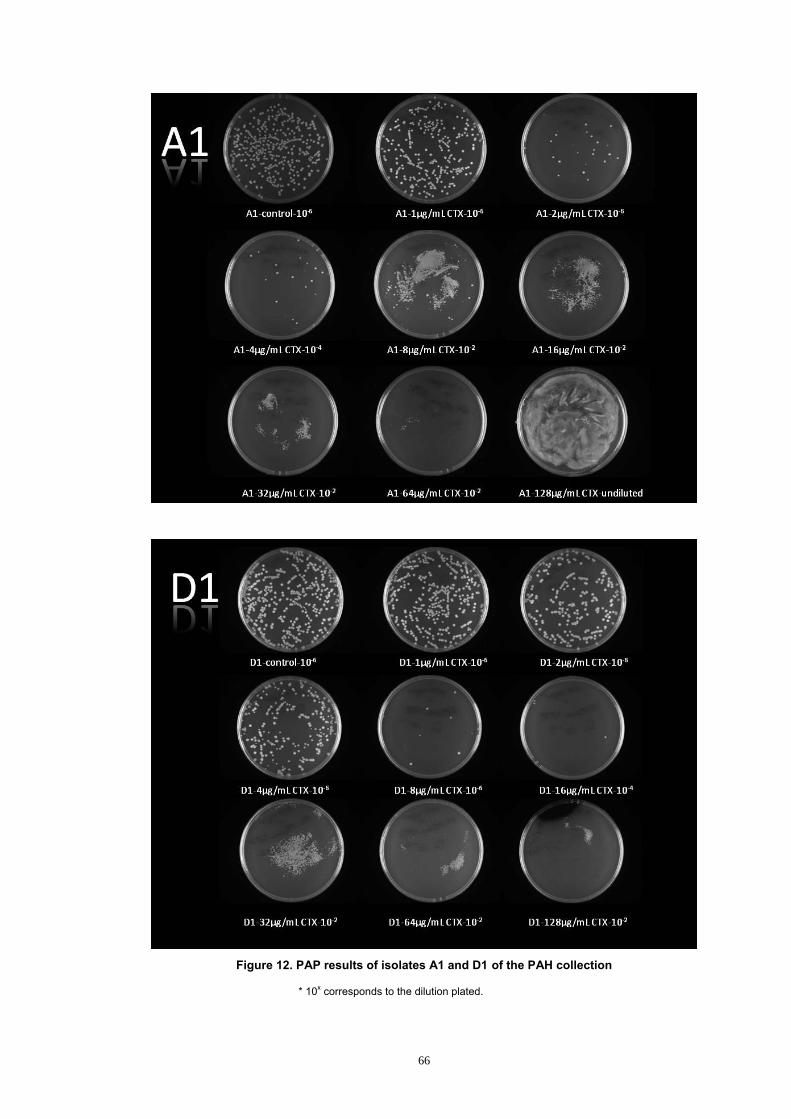
66
Figure 12. PAP results of isolates A1 and D1 of the PAH collection
* 10x corresponds to the dilution plated.

67
Figure 13. PAP results of isolates E1 and F1 of the PAH collection
* 10x corresponds to the dilution plated.

68
Figure 14. Population analysis profile for cefotaxime-resistant Klebsiella pneumoniae strains
from PAH isolates
[D1 isolate had a previously determined CTX MIC of 4µg/mL, while the other isolates had CTX MICs of 1µg/mL.]

69
Chapter 4
4 Evaluation of the Effect of Novobiocin on the blaSHV Copy Number Expansion
During the project, it was hypothesised that homologous recombination is the
mechanism of multimrisation of blaSHV gene in plasmids. The amplification of
blaSHV gene results in emergence of resistant strains and over expression of
β-lactamases.
It has recently been demonstrated that variation in resistance to linezolid in
Gram-positive bacteria is due to variations in copy number of the rRNA
encoding operon (Tsakris et al. 2007). These workers reasoned that DNA
gyrase inhibitors such as novobiocin would inhibit the homologous
recombination reactions that are thought to generate copy number
amplification, and so prevent the appearance of variants with higher MIC
values. Novobiocin inhibits bacterial DNA gyrase activity by attaching to the
GyrB subunit of the enzyme. This conjecture was supported by their data.
We hypothesised that novobiocin would have a similar effect for a similar
reason in our experimental system. Since, a sub-inhibitory concentration of
novobiocin is a homologous recombination inhibitor, it can be used as a
substance to delay or prevent the emergence of resistant strains. According
to Tsakris et al. (2007), a selection method was developed. A low MIC ESBL-
positive strain (F1) from PAH isolates was cultured in 1mL MHII broth,
containing 1µg/mL cefotaxime, and incubated overnight at 37 °C with
agitation, 225 RPM (I 26 incubator shaker series, New Brunswick Scientific).
106 cells of each isolate (0.1mL of a 10-2 dilution in sterile physiological
saline) were plated out on a series of MHII agar plates, containing 1, 2, 4, 8,
16, 32, 64 and 128µg/mL cefotaxime, with and without 15µg/mL novobiocin.
A sub-inhibitory concentration of 15 µg/mL novobiocin was arrived at
empirically. After 24 hours incubation at 37 °C, the mutant colonies were
examined phenotypically and genotypically for ESBL production. The total
blaSHV copy number was quantitated by real-time PCR.

70
Results The results were as expected. It was shown that subinhibitory concentration
of novobiocin has no effect on colony phenotype in the absence of CTX
(Figure 15). This supports that novobiocin is only effective on the gene
amplification phase conducted by homologous recombination. The
novobiocin prevented the selection of the well separated colonies with stably
increased CTX MICs and expanded blaSHV copy numbers. The colonies that
grew were all of the unhealthy clumpy “satellite” colony morphology, and no
evidence for blaSHV copy number expansion could be found (Figure 16). One
unexpected result was that the satellite colonies were more numerous on the
novobiocin containing plates than on those without novobiocin. This is not
fully understood, but may indicate a higher rate of cell lysis or leakage.
It was concluded that a known inhibitor of homologous recombination
prevents the selection of F1 variants with higher CTX MIC, and that this
suggests that recombination is required for blaSHV copy number expansion.

71
Figure 15. Effect of novobiocin on the colony size and distribution of F1 strain
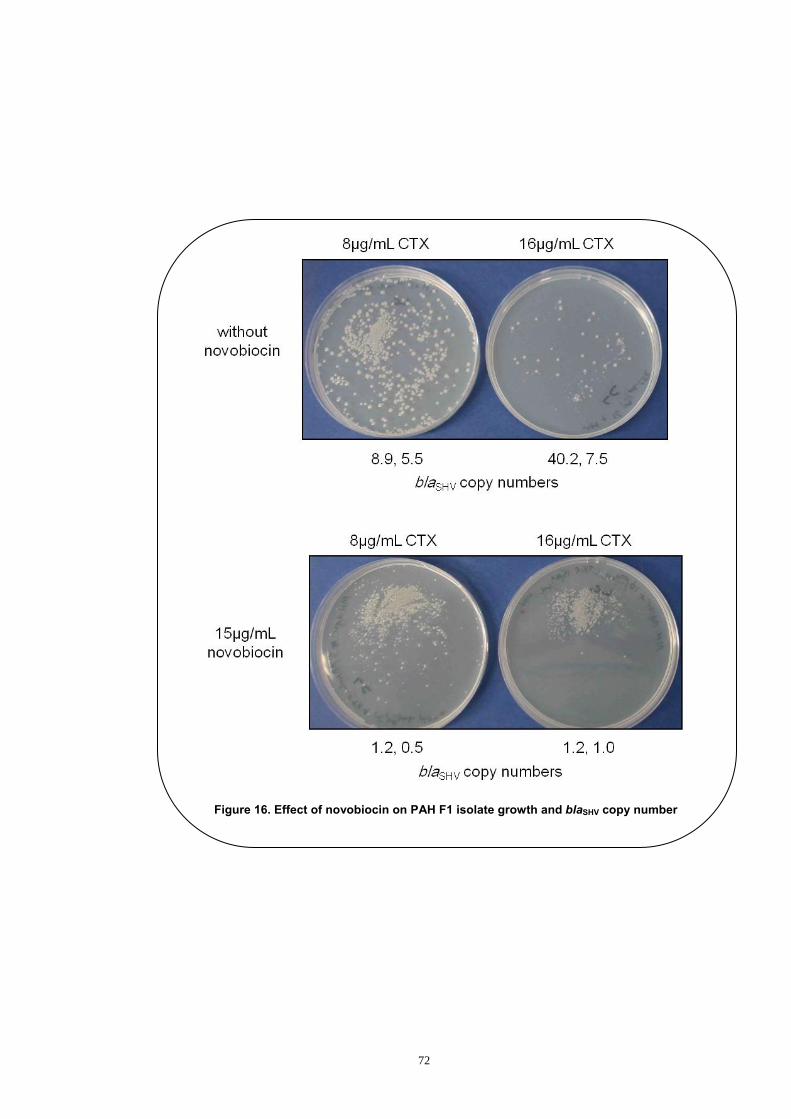
72
Figure 16. Effect of novobiocin on PAH F1 isolate growth and blaSHV copy number
73
Chapter 5
5 Discussion
The concept of increase in the copy number of related genes as a result of
selective pressure has been reported as a mechanism of the resistance of
different bacteria against antibiotics. This process occurs as a result of the
homologous recombination phenomenon following sequence repeats that
flank the resistance gene. This has led to the reintroduction of adaptive
mutation theory. Recently, Kugelberg et al. (2006) and Slechta et al. (2003)
showed that the mechanistic basis of adaptive mutation in gram negative
bacteria is multimerisation of the LacZ gene. However, this concept has been
disproved by Bergthorsson et al. (2007) who demonstrated that
multimerisation expedites the evolution of pre-existing genes. Recent findings
have also attached greater importance to gene amplification in antibiotic
resistance. Brochet et al. (2008) reported a 13.5 kbp chromosomal fragment
duplication in Streptococcus agalactiae, which through higher expression of
genes involved in folate biosynthesis, results in resistant strains to
sulphonamide and trimethoprim. Research conducted by Tsakris et al. (2007)
revealed a similar mechanism for linezolid resistance in Staphylococcus
aureus. The mechanistic basis for linezolid resistance is a point mutation in
the 23S rRNA encoding gene and multimerisation of the same gene results in
more resistant levels. They showed that the selection for high levels of
resistance can be prevented by using a subinhibitory concentration of
novobiocin, as a homologous recombination inhibitor. They proposed that the
mutation is detrimental and multimerisation of the gene compensates for this.
There are increasing reports of copy number amplification of bla genes, and
causative associations with increased expression. One of the earliest was by
Xiang et al. (1997) who described amplification of plasmid-borne blaSHV-5.
Three possible mechanisms of SHV-5 β-lactamase hyperproduction were
investigated: the effect of a powerful promoter, an increase in plasmid copy
number or blaSHV-5 gene copy number amplification on a plasmid. They found
74
that the selection of high resistance levels to CTX in a blaSHV-5- expressing
K. pneumoniae is associated with blaSHV copy number amplification. Similar
results were obtained by Hammond et al. (2005). They reported an
association between cefotaxime resistance level and blaSHV copy number
amplification in the PAH ESBL-positive isolates. The examination of
epidemiologically closely related K. pneumoniae clinical isolates that carried
blaSHV, but differed in their ESBL expression status revealed that the ESBL-
expressing strains had higher blaSHV copy numbers than the ESBL non
expressers. Finally, blaSHV copy number amplification due to the formation of
tandem arrays has been directly detected in a fully characterised plasmid
from a K. pneumoniae clinical isolate by Zienkiewicz et al. (2007). They
sequenced the blaSHV-5-carrying plasmid p1658/97 and found tandem repeats
of the blaSHV-5 containing region bounded by copies of IS26. They termed this
region an amplimer. Copy number amplification is not confined to SHV family
genes, and Bertini et al. (2007) reported an association between duplication
of blaoxa-58 and high level carbapenem resistance in Acinetobacter baumannii.
Interestingly, this duplication is also of an IS26 delineated cassette.
The results of this study help to clarify the selection model for SHV-ESBL
dependent resistance to CTX and other similar antibiotics. As discussed in
the literature review, plasmid-borne blaSHV is derived from the chromosome
of K. pneumoniae, and mobilised by IS26 through transposition-like events
involving enzyme IS26 transposase. Research showed that the different
types of blaSHV promoters on plasmids are more powerful than the
chromosomal one (Ford and Avison 2004; Podbielski et al. 1991). Therefore,
it is obvious that blaSHV gene copy number is not the only parameter that
expedites the selection of ESBL expression in K. pneumoniae. According to
our data, mutation rate for the selection of ESBL expressers is very low. This
result in conjunction with other findings which revealed a correlation between
the higher blaSHV gene copy numbers and higher MIC values for ESBL
expressers strongly indicates that copy number plasticity is still of central
importance. The story of the evolution of blaSHV gene suggests the
requirement of more powerful promoters than chromosomal one plus blaSHV
mobilisation on to plasmids by IS26 copies that flank blaSHV gene and

75
facilitate multimerisation of the gene. IS26 is an intriguing element which is
820 bp and plays an important role with plasmids or gene cassettes
containing resistance genes. Hammond et al. (2005) showed the association
of IS26 with amplification of blaSHV gene copy number in K.pneumoniae
isolates. The mechanistic basis for this homologous repeats is gene
amplification involving two IS26 copies (Zienkiewicz et al. 2007). Our
experiments confirmed that the mechanistic basis for blaSHV gene
amplification is homologous recombination. Our results showed that as a
gyrase inhibitor, novobiocin could prevent the appearance of blaSHV copy
number amplified derivatives with increased MIC values. Although,
novobiocin is no longer used clinically, these results suggest that other
recombination inhibitors could have the potential to inhibit the evolution of
high CTX MICs SHV-ESBL expressers and may be useful adjuncts in the
treatment of infections with ESBL expressing bacteria. As homologous
recombination is a RecA protein dependent process, recently, a research
group at University of North Carolina (UNC) is working to find molecules
which are inhibitors of RecA (Lee et al. 2007; Wigle and Singleton 2007).
The term “heteroresistance” is difficult to define precisely but it is explained
as the presence of microbial subpopulations with higher MIC values at a
frequency of 10-7 to 10-3 in the whole population (Morand and Muhlemann
2007). This is very important from the evolutionary point of view because it
may give the opportunity of bacterial growth on higher concentrations of
antimicrobials to survive without acquisition of resistant genes for subsequent
emergence of resistant strains. This phenomenon was detected twenty years
ago and the term was firstly used for methicillin and vancomycin resistance in
Staphylococcus aureus strains (Falagas et al. 2008). This phenomenon has
now been extended to other microorganisms, including collistin resistance in
Acinetobacter baumanni-calcoaceticus complex (Hawley et al. 2008) and
penicillin resistance in Streptococcus pneumoniae (Morand and Muhlemann
2007). The CTX K. pneumoniae PAP profiles obtained in the current study
are very similar to the PAP profiles of S. pneumoniae obtained by Morand
and Mühlemann. In general, our results show the existence of the resistance
over a wider range of antibiotic concentrations. They indicate that there is
76
sufficient justification regarding K. pneumoniae strains carrying plasmid-
borne blaSHV as heteroresistant with respect to the substrates for the
encoded enzymes. Relative copy number analyses revealed that blaSHV copy
number plasticity is the cause of this heteroresistance. This has not
previously been identified as a mechanism of heteroresistance, even though
its role in heteroresistance is not surprising. This may provide further insight
in understanding the mechanism of the resistance which in turn would have a
great impact on diagnostic and treatment strategies, not just for SHV ESBLs,
but also for other β-lactamases.
This project has also thrown light on the concept of “inoculum effect, which
refers to an increase in MIC associated with a higher inoculum which may
contain higher number of cells used for MIC determinations, particularly in
MIC determination against β-lactam antibiotics. Previously, this phenomenon
was explained as the transfer of excess β-lactamase into the media along
with the inoculum and depletion of more β-lactam being used as the selective
agent. Apart from this reason, our results suggest an alternative mechanism
for inoculum effect which is the high level of heteroresistance. In other words,
larger inoculums have a higher probability of having cells that have higher
blaSHV gene copy number and consequently higher MIC values. These cells
over-express the β-lactamase which in turn may interfere in MIC
determination. The morphology of the cells that grow for the first reason is
small and clumpy on the selective solid media, while cells with the second
reason are stable and can produce normal morphology colonies. Analyses of
the results obtained from B1 and F1 isolates revealed that their behaviour is
completely different on the selective media. B1 isolate could only produce
small clumpy colonies without the ability to increase blaSHV gene copy
number, while F1 isolate mainly produced separate normal morphology
colonies and showed blaSHV gene copy number increase in higher CTX
concentration (Figure 10). It can be seen in figure 10 that B1 yielded more
colonies. It could be the result of a very high carryover of β-lactamase or it is
also possible that B1 is not heteroresistant in the same way as F1. The
results also show that determination of MIC alone is not sufficient for ESBL

77
detection and resistant strains are likely to emerge. This explains treatment
failures in Klebsiella infections with low CTX MIC values.
In summary, the findings presented in this thesis provide a valuable insight in
understanding the evolutionary mechanism of the resistance of non-ESBL
K. pneumoniae strains. Additional studies could be performed to build on the
outcomes of this thesis. It has been shown that RecA protein has a key role
in recombination stage during adaptive mutation and as a result in gene copy
number (Lee et al. 2007). The novobiocin experiment results also indicate
that the mechanism of blaSHV copy number increase is homologous
recombination. However, novobiocin is not used clinically anymore. Showing
a clinically used RecA inhibitor with the same effect on blaSHV copy number
increase, as shown by novobiocin, may lead to a new treatment strategy for
infections, caused by microorganisms producing ESBLs.

78

79
Appendices1
A. MSS-MLE Program in MATLAB R2007a Software
Since the likelihood is a univariate function of m, the maximum likelihood
estimate can be obtained simply by a grid search. More specifically, we first
build a grid for various values of m. For each of these values, we compute
the corresponding log-likelihood value. In this way we construct a graph of
log-likelihood against m. The maximum likelihood estimate is obtained by
finding the value of m that maximizes the log-likelihood. The following
program gives an answer that is accurate up to 4 significant figures.
load CTX.csv; Y = CTX; ngrid = 200; m = linspace(.01, 2, ngrid)'; C = sum( Y(:,2)); llike = zeros(ngrid,1); for i=1:ngrid llike(i,1) = llike_m(m(i),Y); end plot(m,llike); [valid] = max(llike); options = optimset('Display','off'); [m_MLE fval flag output grad Hess] = fminunc(@nllike_m, m(id) ,options, Y); sig = 1.225 * m(id) ^ (-.315) / sqrt(C); ulim = log(m(id)) + 1.96 * sig * exp(1.96 * sig) ^ (-.315); llim = log(m(id)) - 1.96 * sig * exp(1.96 * sig) ^ (.315); disp( ['MLE using the Newtons method is ' num2str(m_MLE)]) disp( ['The confidence interval is (' num2str(exp(llim)) ',' num2str(exp(ulim)) ').' ]) %disp( ['MLE using the grid-search method is ' num2str(m(id))]) %disp( ['The confidence interval is (' num2str(exp(llim)) ',' num2str(exp(ulim)) ').'])
1 The computer programs were designed by Joshua C. C. Chan whose work was in turn supported by the Australian Research Council (Discovery Grant DP0558957).
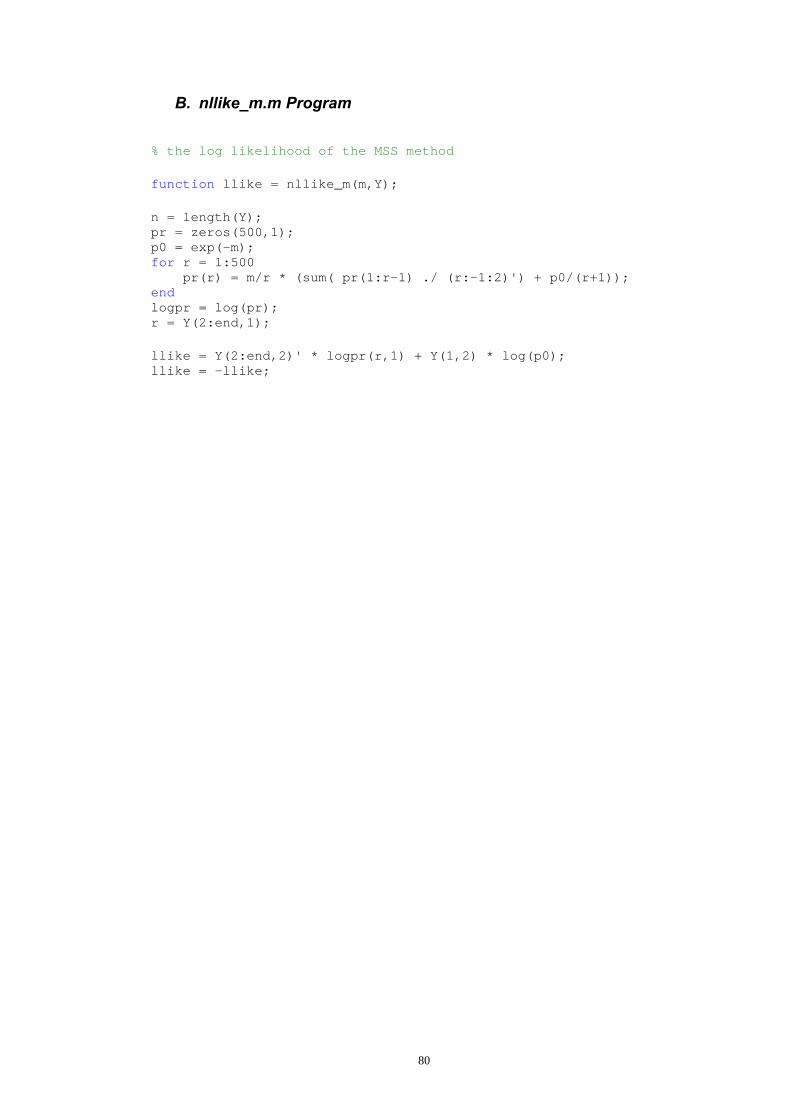
80
B. nllike_m.m Program % the log likelihood of the MSS method function llike = nllike_m(m,Y); n = length(Y); pr = zeros(500,1); p0 = exp(-m); for r = 1:500 pr(r) = m/r * (sum( pr(1:r-1) ./ (r:-1:2)') + p0/(r+1)); end logpr = log(pr); r = Y(2:end,1); llike = Y(2:end,2)' * logpr(r,1) + Y(1,2) * log(p0); llike = -llike;

81
References
AB-BIODISK. 2007. Etest for detection of ESBL [Etest technical manual].
Solna, Sweden: AB BIODISK.
Abraham, E. and E. Chain.(1940) An enzyme from bacteria able to destroy
penicillin [letter]. . Nature 146:837.
Ambler, R.(1980) The structure of β-lactamases. Philosophical Transactions
of the Royal Society of London. Series B, Biological Sciences 289
(1036):321-331.
Angerer, W.(2001) An explicit representation of the Luria-Delbruck
distribution. Journal of Mathematical Biology 42 (2):145-174.
Armitage, P.(1952) The Statistical Theory of Bacterial Populations Subject to
Mutation. Journal of the Royal Statistical Society. Series B
(Methodological) 14 (1):1-40.
Arpin, C., R. Labia, C. Andre, C. Frigo, Z. El Harrif and C. Quentin.(2001)
SHV-16, a β-lactamase with a pentapeptide duplication in the omega
loop. Antimicrobial Agents and Chemotherapy 45 (9):2480-2485.
Barthelemy, M., J. Peduzzi, C. Verchere-Beaur, H. Ben Yaghlane and R.
Labia.(1986) Purification and biochemical properties of Pitton's type 2
β-lactamase (SHV-1). Annales de l Institut Pasteur. Microbiologie
137B (1):19-27.
Bell, J. and J. Turnidge.(2003) SENTRY Antimicrobial Surveillance Program
Asia-Pacific region and South Africa. Communicable Diseases
Intelligence 27 Suppl:S61-S66.
82
Bell, J., J. Turnidge, A. Gales, M. Pfaller and R. Jones.(2002) Prevalence of
extended spectrum β-lactamase (ESBL)-producing clinical isolates in
the Asia-Pacific region and South Africa: regional results from
SENTRY Antimicrobial Surveillance Program (1998-99). Diagnostic
Microbiology and Infectious Disease 42 (3):193-198.
Bergthorsson, U., D. I. Andersson and J. R. Roth.(2007) Ohno's dilemma:
evolution of new genes under continuous selection. Proceedings of
the National Academy of Sciences of the United States of America
104 (43):17004-17009.
Bertini, A., L. Poirel, S. Bernabeu, D. Fortini, L. Villa, P. Nordmann and A.
Carattoli.(2007) Multicopy blaOXA-58 gene as a source of high-level
resistance to carbapenems in Acinetobacter baumannii. Antimicrobial
Agents and Chemotherapy 51 (7):2324-2328.
Bradford, P., C. Cherubin, V. Idemyor, B. Rasmussen and K. Bush.(1994)
Multiply resistant Klebsiella pneumoniae strains from two Chicago
hospitals: identification of the extended-spectrum TEM-12 and TEM-
10 ceftazidime-hydrolyzing β-lactamases in a single isolate.
Antimicrobial Agents and Chemotherapy 38 (4):761-766.
Brenwald, N., G. Jevons, J. Andrews, J. Xiong, P. Hawkey and R.
Wise.(2003) An outbreak of a CTX-M-type β-lactamase-producing
Klebsiella pneumoniae: the importance of using cefpodoxime to detect
extended-spectrum β-lactamases. Journal of Antimicrobial
Chemotherapy 51 (1):195-196.
Brochet, M., E. Couve, M. Zouine, C. Poyart and P. Glaser.(2008) A naturally
occurring gene amplification leading to sulfonamide and trimethoprim
resistance in Streptococcus agalactiae. Journal of Bacteriology 190
(2):672-680.

83
Bush, K. and G. Jacoby.(1997a) Amino Acid Sequences for TEM, SHV and
OXA Extended-Spectrum and Inhibitor Resistant β-Lactamases.
Lahey Clinic. http://www.lahey.org/Studies/ (accessed August 15th,
2008).
Bush, K. and G. Jacoby.(1997b) Nomenclature of TEM β-lactamases.
Journal of Antimicrobial Chemotherapy 39 (1):1-3.
Bush, K., G. Jacoby and A. Medeiros.(1995) A functional classification
scheme for β-lactamases and its correlation with molecular structure.
Antimicrobial Agents and Chemotherapy 39 (6):1211-1233.
Cairns, J. and P. Foster.(1991) Adaptive reversion of a frameshift mutation in
Escherichia coli. Genetics 128 (4):695-701.
Cairns, J., J. Overbaugh and S. Miller.(1988) The origin of mutants. Nature
335 (6186):142-145.
Calos, M. P. and J. H. Miller.(1981) Genetic and sequence analysis of
frameshift mutations induced by ICR-191. Journal of Molecular Biology
153 (1):39-64.
Carter, M., K. Oakton, M. Warner and D. Livermore.(2000) Detection of
extended-spectrum β-lactamases in klebsiellae with the Oxoid
combination disk method. Journal of Clinical Microbiology 38
(11):4228-4232.
Chain, E., H. Florey, M. Adelaide, A. Gardner, N. Heatley, M. Jennings, J.
Orr-Ewing and A. Sanders.(1940) Penicillin as a chemotherapeutic
agent. Lancet (ii):226–228.
Chambers, H.(2007) β-Lactam & Other Cell Wall & Membrane-Active
Antibiotics. In Basic and Clinical Pharmacology,Vol., ed. B. G.
Katzung, 726-744: McGraw-Hill.

84
Chanawong, A., F. M'Zali, J. Heritage, A. Lulitanond and P. Hawkey.(2000)
Characterisation of extended-spectrum β-lactamases of the SHV
family using a combination of PCR-single strand conformational
polymorphism (PCR-SSCP) and PCR-restriction fragment length
polymorphism (PCR-RFLP). FEMS Microbiology Letters 184 (1):85-
89.
Chanawong, A., F. M'Zali, J. Heritage, A. Lulitanond and P. Hawkey.(2001)
Discrimination of SHV β-lactamase genes by restriction site insertion-
PCR. Antimicrobial Agents and Chemotherapy 45 (7):2110-2114.
Colodner, R.(2005) Extended-spectrum beta-lactamases: a challenge for
clinical microbiologists and infection control specialists. American
Journal of Infection Control 33 (2):104-107.
Demarco, P. and R. Nagarajan.(1972) Physical-chemical properties of
cephalosporins and penicillins. In Cephalosporins and Penicillins,Vol.,
ed. E. H. Flynn, 312-369. New York and London: Academic Press.
Dewanji, A., E. Luebeck and S. Moolgavkar.(2005) A generalized Luria-
Delbruck model. Mathematical Biosciences 197 (2):140-152.
Domenech-Sanchez, A., L. Martinez-Martinez, S. Hernandez-Alles, M. del
Carmen Conejo, A. Pascual, J. Tomas, S. Alberti and V.
Benedi.(2003) Role of Klebsiella pneumoniae OmpK35 porin in
antimicrobial resistance. Antimicrobial Agents and Chemotherapy 47
(10):3332-3335.
Falagas, M. E., G. C. Makris, G. Dimopoulos and D. K. Matthaiou.(2008)
Heteroresistance: a concern of increasing clinical significance? Clin
Microbiol Infect 14 (2):101-104.

85
Fiett, J., A. Palucha, B. Miaczynska, M. Stankiewicz, H. Przondo-Mordarska,
W. Hryniewicz and M. Gniadkowski.(2000) A novel complex mutant
β-lactamase, TEM-68, identified in a Klebsiella pneumoniae isolate
from an outbreak of extended-spectrum β-lactamase-producing
Klebsiellae. Antimicrobial Agents and Chemotherapy 44 (6):1499-
1505.
Fleming, A.(1929) On the antibacterial action of cultures of a penicillium, with
special reference to their use in the isolation of B. influenzae. . British
Journal of Experimental Pathology 10:226–236.
Florey, H. and E. Abraham.(1951) The work on penicillin at Oxford. Journal of
the History of Medicine and Allied Sciences 6 (3):302-317.
Ford, P. and M. Avison.(2004) Evolutionary mapping of the SHV β-lactamase
and evidence for two separate IS26-dependent blaSHV mobilization
events from the Klebsiella pneumoniae chromosome. Journal of
Antimicrobial Chemotherapy 54 (1):69-75.
Foster, P. L.(2004) Adaptive mutation in Escherichia coli. Journal of
Bacteriology 186 (15):4846-4852.
Foster, P. L. and J. Cairns.(1992) Mechanisms of directed mutation. Genetics
131 (4):783-789.
French, G., K. Shannon and N. Simmons.(1996) Hospital outbreak of
Klebsiella pneumoniae resistant to broad-spectrum cephalosporins
and β-lactam-β-lactamase inhibitor combinations by hyperproduction
of SHV-5 β-lactamase. Journal of Clinical Microbiology 34 (2):358-
363.
Germer, S., M. J. Holland and R. Higuchi.(2000) High-throughput SNP allele-
frequency determination in pooled DNA samples by kinetic PCR.
Genome Research 10 (2):258-266.
86
Gniadkowski, M.(2001) Evolution and epidemiology of extended-spectrum
β-lactamases (ESBLs) and ESBL-producing microorganisms. Clinical
Microbiology & Infection 7 (11):597-608.
Gniadkowski, M.(2008) Evolution of extended-spectrum β-
lactamases by mutation. Clinical Microbiology and Infection 14
(s1):11-32.
Haeggman, S., S. Lofdahl and L. Burman.(1997) An allelic variant of the
chromosomal gene for class A β-lactamase K2, specific for Klebsiella
pneumoniae, is the ancestor of SHV-1. Antimicrobial Agents and
Chemotherapy 41 (12):2705-2709.
Haliassos, A., J. Chomel, L. Tesson, M. Baudis, J. Kruh, J. Kaplan and A.
Kitzis.(1989) Modification of enzymatically amplified DNA for the
detection of point mutations. Nucleic Acids Research 17 (9):3606.
Hall, B. G.(1990) Spontaneous point mutations that occur more often when
advantageous than when neutral. Genetics 126 (1):5-16.
Hammond, D.(2004) SHV β-lactamases: DNA Diagnostics and Evolution .
Queensland University of Technology, Brisbane (Thesis).
Hammond, D., J. Schooneveldt, G. Nimmo, F. Huygens and P. Giffard.(2005)
blaSHV Genes in Klebsiella pneumoniae: different allele distributions
are associated with different promoters within individual isolates.
Antimicrobial Agents and Chemotherapy 49 (1):256-263.
Hammond, D. S., T. Harris, J. Bell, J. Turnidge and P. M. Giffard.(2008)
Selection of SHV extended-spectrum-beta-lactamase-dependent
cefotaxime and ceftazidime resistance in Klebsiella pneumoniae
requires a plasmid-borne blaSHV gene. Antimicrobial Agents and
Chemotherapy 52 (2):441-445.

87
Hawley, J. S., C. K. Murray and J. H. Jorgensen.(2008) Colistin
heteroresistance in acinetobacter and its association with previous
colistin therapy. Antimicrobial Agents and Chemotherapy 52 (1):351-
352.
Helfand, M. and R. Bonomo.(2003) β-lactamases: a survey of protein
diversity. Current Drug Targets. Infectious Disorders 3 (1):9-23.
Heritage, J., F. M'Zali, D. Gascoyne-Binzi and P. Hawkey.(1999) Evolution
and spread of SHV extended-spectrum β-lactamases in gram-
negative bacteria. Journal of Antimicrobial Chemotherapy 44 (3):309-
318.
Hernandez-Alles, S., V. Benedi, L. Martinez-Martinez, A. Pascual, A. Aguilar,
J. Tomas and S. Alberti.(1999) Development of resistance during
antimicrobial therapy caused by insertion sequence interruption of
porin genes. Antimicrobial Agents and Chemotherapy 43 (4):937-939.
Higuchi, R., G. Dollinger, P. Walsh and R. Griffith.(1992) Simultaneous
amplification and detection of specific DNA sequences.
Bio/Technology 10 (4):413-417.
Hirakata, Y., J. Matsuda, Y. Miyazaki, S. Kamihira, S. Kawakami, Y.
Miyazawa, Y. Ono, N. Nakazaki, Y. Hirata, M. Inoue, et al.(2005)
Regional variation in the prevalence of extended-spectrum
β-lactamase-producing clinical isolates in the Asia-Pacific region
(SENTRY 1998-2002). Diagnostic Microbiology and Infectious
Disease 52 (4):323-329.
Ho, P., K. Chow, K. Yuen, W. Ng and P. Chau.(1998) Comparison of a novel,
inhibitor-potentiated disc-diffusion test with other methods for the
detection of extended-spectrum β-lactamases in Escherichia coli and

88
Klebsiella pneumoniae. Journal of Antimicrobial Chemotherapy 42
(1):49-54.
Howard, C., A. van Daal, G. Kelly, J. Schooneveldt, G. Nimmo and P.
Giffard.(2002) Identification and minisequencing-based discrimination
of SHV β-lactamases in nosocomial infection-associated Klebsiella
pneumoniae in Brisbane, Australia. Antimicrobial Agents and
Chemotherapy 46 (3):659-664.
Hujer, A., K. Hujer, M. Helfand, V. Anderson and R. Bonomo.(2002) Amino
acid substitutions at Ambler position Gly238 in the SHV-1
β-lactamase: exploring sequence requirements for resistance to
penicillins and cephalosporins. Antimicrobial Agents and
Chemotherapy 46 (12):3971-3977.
Huletsky, A., J. Knox and R. Levesque.(1993) Role of Ser-238 and Lys-240
in the hydrolysis of third-generation cephalosporins by SHV-type
β-lactamases probed by site-directed mutagenesis and three-
dimensional modeling. Journal of Biological Chemistry 268 (5):3690-
3697.
Jacoby, G.(2006) β-lactamase nomenclature. Antimicrobial Agents and
Chemotherapy 50 (4):1123-1129.
Jacoby, G. and K. Bush.(2005) β-lactamase nomenclature. Journal of Clinical
Microbiology 43 (12):6220.
Jacoby, G., A. Medeiros, T. O'Brien, M. Pinto and H. Jiang.(1988) Broad-
spectrum, transmissible β-lactamases. New England Journal of
Medicine 319 (11):723-724.
Jarlier, V., M. Nicolas, G. Fournier and A. Philippon.(1988) Extended broad-
spectrum β-lactamases conferring transferable resistance to newer
β-lactam agents in Enterobacteriaceae: hospital prevalence and
susceptibility patterns. Reviews of Infectious Diseases 10 (4):867-878.
89
Jones, M., S. Thomas and A. Rogers.(1994) Luria-Delbruck fluctuation
experiments: design and analysis. Genetics 136 (3):1209-1216.
Kader, A., A. Kumar, A. Krishna and M. Zaman.(2006) An accelerated
method for the detection of extended-spectrum β-lactamases in
urinary isolates of Escherichia coli and Klebsiella pneumoniae. Saudi
Journal of Kidney Diseases and Transplantation 17 (4):535-539.
Katsanis, G., J. Spargo, M. Ferraro, L. Sutton and G. Jacoby.(1994)
Detection of Klebsiella pneumoniae and Escherichia coli strains
producing extended-spectrum β-lactamases. Journal of Clinical
Microbiology 32 (3):691-696.
Kim, J. and H. Lee.(2000) Rapid discriminatory detection of genes coding for
SHV β-lactamases by ligase chain reaction. Antimicrobial Agents and
Chemotherapy 44 (7):1860-1864.
Kliebe, C., B. Nies, J. Meyer, R. Tolxdorff-Neutzling and B.
Wiedemann.(1985) Evolution of plasmid-coded resistance to broad-
spectrum cephalosporins. Antimicrobial Agents and Chemotherapy 28
(2):302-307.
Knothe, H., P. Shah, V. Krcmery, M. Antal and S. Mitsuhashi.(1983)
Transferable resistance to cefotaxime, cefoxitin, cefamandole and
cefuroxime in clinical isolates of Klebsiella pneumoniae and Serratia
marcescens. Infection 11 (6):315-317.
Knox, J.(1995) Extended-spectrum and inhibitor-resistant TEM-type
β-lactamases: mutations, specificity, and three-dimensional structure.
Antimicrobial Agents and Chemotherapy 39 (12):2593-2601.
90
Kubista, M., J. Andrade, M. Bengtsson, A. Forootan, J. Jonak, K. Lind, R.
Sindelka, R. Sjoback, B. Sjogreen, L. Strombom, et al.(2006) The real-
time polymerase chain reaction. Molecular Aspects of Medicine 27
(2-3):95-125.
Kugelberg, E., E. Kofoid, A. Reams, D. Andersson and J. Roth.(2006)
Multiple pathways of selected gene amplification during adaptive
mutation. Proceedings of the National Academy of Sciences of the
United States of America 103 (46):17319-17324.
Kuzin, A., M. Nukaga, Y. Nukaga, A. Hujer, R. Bonomo and J. Knox.(1999)
Structure of the SHV-1 β-lactamase. Biochemistry 38 (18):5720-5727.
Lai, J., M. Sarvas, W. Brammar, K. Neugebauer and H. Wu.(1981) Bacillus
licheniformis penicillinase synthesized in Escherichia coli contains
covalently linked fatty acid and glyceride. Proceedings of the National
Academy of Sciences of the United States of America 78 (6):3506-
3510.
Lee, A. M., T. J. Wigle and S. F. Singleton.(2007) A complementary pair of
rapid molecular screening assays for RecA activities. Analytical
Biochemistry 367 (2):247-258.
Luria, S. and M. Delbruck.(1943) Mutations of Bacteria from Virus Sensitivity
to Virus Resistance. Genetics 28 (6):491-511.
M'Zali, F., A. Chanawong, K. Kerr, D. Birkenhead and P. Hawkey.(2000)
Detection of extended-spectrum β-lactamases in members of the
family Enterobacteriaceae: comparison of the MAST DD test, the
double disc and the Etest ESBL. Journal of Antimicrobial
Chemotherapy 45 (6):881-885.

91
M'Zali, F., D. Gascoyne-Binzi, J. Heritage and P. Hawkey.(1996) Detection of
mutations conferring extended-spectrum activity on SHV β-lactamases
using polymerase chain reaction single strand conformational
polymorphism (PCR-SSCP). Journal of Antimicrobial Chemotherapy
37 (4):797-802.
M'Zali, F., J. Heritage, D. Gascoyne-Binzi, A. Snelling and P. Hawkey.(1998)
PCR single strand conformational polymorphism can be used to detect
the gene encoding SHV-7 extended-spectrum β-lactamase and to
identify different SHV genes within the same strain. Journal of
Antimicrobial Chemotherapy 41 (1):123-125.
Ma, W., G. Sandri and S. Sarkar.(1992) Analysis of the Luria-Delbruck
Distribution Using Discrete Convolution Powers. Jounal of Applied
Probability 29 (2):255-267.
MacKenzie, F., C. Miller and I. Gould.(2002) Comparison of screening
methods for TEM- and SHV-derived extended-spectrum β-lactamase
detection. Clinical Microbiology and Infection 8 (11):715-724.
Martinez-Martinez, L., S. Hernandez-Alles, S. Alberti, J. Tomas, V. Benedi
and G. Jacoby.(1996) In vivo selection of porin-deficient mutants of
Klebsiella pneumoniae with increased resistance to cefoxitin and
expanded-spectrum-cephalosporins. Antimicrobial Agents and
Chemotherapy 40 (2):342-348.
Mascaretti, O.(2003) Bacteria Versus Antibacterial Agents. 1 vols.107-198.
Washington, D.C.: ASM Press.
Matagne, A., J. Lamotte-Brasseur and J. Frere.(1998) Catalytic properties of
class A β-lactamases: efficiency and diversity. Biochemical Journal
330 ( Pt 2):581-598.

92
Matthew, M., R. Hedges and J. Smith.(1979) Types of β-lactamase
determined by plasmids in Gram-negative bacteria. Journal of
Bacteriology 138 (3):657-662.
Morand, B. and K. Muhlemann.(2007) Heteroresistance to penicillin in
Streptococcus pneumoniae. Proceedings of the National Academy of
Sciences of the United States of America 104 (35):14098-14103.
Mulgrave, L. and P. Attwood.(1993) Characterization of an SHV-5 related
extended broad-spectrum β-lactamase in Enterobacteriaceae from
Western Australia. Pathology 25 (1):71-75.
Muller-Hill, B. and J. Kania.(1974) Lac repressor can be fused to beta-
galactosidase. Nature 249 (457):561-563.
Nielsen, J., M. Caulfield and J. Lampen.(1981) Lipoprotein nature of Bacillus
licheniformis membrane penicillinase. Proceedings of the National
Academy of Sciences of the United States of America 78 (6):3511-
3515.
Orita, M., H. Iwahana, H. Kanazawa, K. Hayashi and T. Sekiya.(1989)
Detection of polymorphisms of human DNA by gel electrophoresis as
single-strand conformation polymorphisms. Proceedings of the
National Academy of Sciences of the United States of America 86
(8):2766-2770.
Paterson, D. and R. Bonomo.(2005) Extended-spectrum β-lactamases: a
clinical update. Clinical Microbiology Reviews 18 (4):657-686.
Perez, F., A. Endimiani, K. M. Hujer and R. A. Bonomo.(2007) The continuing
challenge of ESBLs. Current Opinion in Pharmacology 7 (5):459-469.

93
Perilli, M., E. Dell'Amico, B. Segatore, M. de Massis, C. Bianchi, F. Luzzaro,
G. Rossolini, A. Toniolo, G. Nicoletti and G. Amicosante.(2002)
Molecular characterization of extended-spectrum β-lactamases
produced by nosocomial isolates of Enterobacteriaceae from an Italian
nationwide survey. Journal of Clinical Microbiology 40 (2):611-614.
Perilli, M., A. Felici, N. Franceschini, A. De Santis, L. Pagani, F. Luzzaro, A.
Oratore, G. Rossolini, J. Knox and G. Amicosante.(1997)
Characterization of a new TEM-derived β-lactamase produced in a
Serratia marcescens strain. Antimicrobial Agents and Chemotherapy
41 (11):2374-2382.
Pitton, J.(1972) Mechanisms of bacterial resistance to antibiotics. Ergebnisse
der Physiologie, Biologischen Chemie und Experimentellen
Pharmakologie 65:15-93.
Podbielski, A., J. Schonling, B. Melzer, K. Warnatz and H. G. Leusch.(1991)
Molecular characterization of a new plasmid-encoded SHV-type beta-
lactamase (SHV-2 variant) conferring high-level cefotaxime resistance
upon Klebsiella pneumoniae. Journal of General Microbiology 137
(3):569-578.
Poirel, L., E. Lebessi, M. Castro, C. Fevre, M. Foustoukou and P.
Nordmann.(2004) Nosocomial outbreak of extended-spectrum beta-
lactamase SHV-5-producing isolates of Pseudomonas aeruginosa in
Athens, Greece. Antimicrobial Agents and Chemotherapy 48 (6):2277-
2279.
Politi, L., P. T. Tassios, M. Lambiri, A. Kansouzidou, M. Pasiotou, A. C.
Vatopoulos, K. Mellou, N. J. Legakis and L. S. Tzouvelekis.(2005)
Repeated occurrence of diverse extended-spectrum beta-lactamases
in minor serotypes of food-borne Salmonella enterica subsp. enterica.
Journal of Clinical Microbiology 43 (7):3453-3456.

94
Pope, C. F., D. M. O'Sullivan, T. D. McHugh and S. H. Gillespie.(2008)
A practical guide to measuring mutation rates in antibiotic resistance.
Antimicrobial Agents and Chemotherapy 52 (4):1209-1214.
Queenan, A., B. Foleno, C. Gownley, E. Wira and K. Bush.(2004) Effects of
inoculum and β-lactamase activity in AmpC- and extended-spectrum
β-lactamase (ESBL)-producing Escherichia coli and Klebsiella
pneumoniae clinical isolates tested by using NCCLS ESBL
methodology. Journal of Clinical Microbiology 42 (1):269-275.
Randegger, C. and H. Hachler.(2001) Real-time PCR and melting curve
analysis for reliable and rapid detection of SHV extended-spectrum
β-lactamases. Antimicrobial Agents and Chemotherapy 45 (6):1730-
1736.
Randegger, C., A. Keller, M. Irla, A. Wada and H. Hachler.(2000)
Contribution of natural amino acid substitutions in SHV extended-
spectrum β-lactamases to resistance against various β-lactams.
Antimicrobial Agents and Chemotherapy 44 (10):2759-2763.
Rice, L., L. Carias, A. Hujer, M. Bonafede, R. Hutton, C. Hoyen and R.
Bonomo.(2000) High-level expression of chromosomally encoded
SHV-1 β-lactamase and an outer membrane protein change confer
resistance to ceftazidime and piperacillin-tazobactam in a clinical
isolate of Klebsiella pneumoniae. Antimicrobial Agents and
Chemotherapy 44 (2):362-367.
Rosche, W. and P. Foster.(2000) Determining mutation rates in bacterial
populations. Methods 20 (1):4-17.
Rossolini, G. M., M. M. D’Andrea and C. Mugnaioli.(2008) The spread of
CTX-M-type extended-spectrum β-lactamases. Clinical
Microbiology and Infection 14 (s1):33-41.

95
Roth, J. R., E. Kugelberg, A. B. Reams, E. Kofoid and D. I. Andersson.(2006)
Origin of mutations under selection: the adaptive mutation
controversy. Annual Review of Microbiology 60:477-501.
Sabate, M., E. Miro, F. Navarro, C. Verges, R. Aliaga, B. Mirelis and G.
Prats.(2002) β-lactamases involved in resistance to broad-spectrum
cephalosporins in Escherichia coli and Klebsiella spp. clinical isolates
collected between 1994 and 1996, in Barcelona (Spain). Journal of
Antimicrobial Chemotherapy 49 (6):989-997.
Sarvas, M. and I. Palva.(1983) The penicillinase of Bacillus licheniformis is
an outer membrane protein in Escherichia coli. Journal of Bacteriology
155 (2):657-663.
Schooneveldt, J., G. Nimmo and P. Giffard.(1998) Detection and
characterisation of extended spectrum β-lactamases in Klebsiella
pneumoniae causing nosocomial infection. Pathology 30 (2):164-168.
Slechta, E. S., K. L. Bunny, E. Kugelberg, E. Kofoid, D. I. Andersson and J.
R. Roth.(2003) Adaptive mutation: general mutagenesis is not a
programmed response to stress but results from rare coamplification
of dinB with lac. Proceedings of the National Academy of Sciences of
the United States of America 100 (22):12847-12852.
Szabo, D., M. Melan, A. Hujer, R. Bonomo, K. Hujer, C. Bethel, K. Kristof and
D. Paterson.(2005) Molecular analysis of the simultaneous production
of two SHV-type extended-spectrum β-lactamases in a clinical isolate
of Enterobacter cloacae by using single-nucleotide polymorphism
genotyping. Antimicrobial Agents and Chemotherapy 49 (11):4716-
4720.

96
Thomson, K. and C. Sanders.(1992) Detection of extended-spectrum
β-lactamases in members of the family Enterobacteriaceae:
comparison of the double-disk and three-dimensional tests.
Antimicrobial Agents and Chemotherapy 36 (9):1877-1882.
Tsakris, A., S. K. Pillai, H. S. Gold, C. Thauvin-Eliopoulos, L. Venkataraman,
C. Wennersten, R. C. Moellering, Jr. and G. M. Eliopoulos.(2007)
Persistence of rRNA operon mutated copies and rapid re-emergence
of linezolid resistance in Staphylococcus aureus. Journal of
Antimicrobial Chemotherapy 60 (3):649-651.
Turner, P.(2005) Extended-spectrum β-lactamases. Clinical Infectious
Diseases 41 Suppl 4:S273-S275.
Tzouvelekis, L. and R. Bonomo.(1999) SHV-type β-lactamases. Current
Pharmaceutical Design 5 (11):847-864.
Vercauteren, E., P. Descheemaeker, M. Ieven, C. Sanders and H.
Goossens.(1997) Comparison of screening methods for detection of
extended-spectrum β-lactamases and their prevalence among blood
isolates of Escherichia coli and Klebsiella spp. in a Belgian teaching
hospital. Journal of Clinical Microbiology 35 (9):2191-2197.
Weisstein, E.(2003) CRC Concise Encyclopedia of Mathematics. 2nd
ed.1762: CRC Press.
Wigle, T. J. and S. F. Singleton.(2007) Directed molecular screening for
RecA ATPase inhibitors. Bioorganic and Medicinal Chemistry Letters
17 (12):3249-3253.
Woodford, N., D. Payne, A. Johnson, M. Weinbren, R. Perinpanayagam, R.
George, B. Cookson and S. Amyes.(1990) Transferable cephalosporin
resistance not inhibited by clavulanate in Escherichia coli. Lancet 336
(8709):253.

97
Wootton, M., R. A. Howe, R. Hillman, T. R. Walsh, P. M. Bennett and A. P.
MacGowan.(2001) A modified population analysis profile (PAP)
method to detect hetero-resistance to vancomycin in Staphylococcus
aureus in a UK hospital. Journal of Antimicrobial Chemotherapy 47
(4):399-403.
Xiang, X., K. Shannon and G. French.(1997) Mechanism and stability of
hyperproduction of the extended-spectrum β-lactamase SHV-5 in
Klebsiella pneumoniae. Journal of Antimicrobial Chemotherapy 40
(4):525-532.
Zienkiewicz, M., I. Kern-Zdanowicz, M. Golebiewski, J. Zylinska, P.
Mieczkowski, M. Gniadkowski, J. Bardowski and P. Ceglowski.(2007)
Mosaic structure of p1658/97, a 125-kilobase plasmid harboring an
active amplicon with the extended-spectrum β-lactamase gene
blaSHV-5. Antimicrobial Agents and Chemotherapy 51 (4):1164-1171.