Embed Size (px)
Citation preview
Mutant huntingtin interacts with b-tubulin anddisrupts vesicular transport and insulin secretion
Ruben Smith1,{, Karl Bacos2,{, Valentina Fedele1, Denis Soulet1, Helena A. Walz4,
Stefanie Obermuller3, Anders Lindqvist3, Maria Bjorkqvist1, Pontus Klein1,
Patrik Onnerfjord5, Patrik Brundin1, Hindrik Mulder2 and Jia-Yi Li1,�
1Neuronal Survival Unit, BMC A10, Department of Experimental Medical Science, Lund University 221 84 Lund,
Sweden, 2Unit of Molecular Metabolism, Department of Clinical Sciences and 3Unit of Islet Cell Physiology, CRC
91:11, 205 02 Malmo, Sweden, 4Insulin Signal Transduction Group and 5Connective Tissue Biology, BMC C12,
221 84 Lund, Sweden
Received June 1, 2009; Revised and Accepted July 20, 2009
Huntington’s disease is a severe progressive neurodegenerative disorder caused by a CAG expansion in theIT15 gene, which encodes huntingtin. The disease primarily affects the neostriatum and cerebral cortex andalso associates with increased incidence of diabetes. Here, we show that mutant huntingtin disrupts intra-cellular transport and insulin secretion by direct interference with microtubular b-tubulin. We demonstratethat mutant huntingtin impairs glucose-stimulated insulin secretion in insulin-producing b-cells, withoutaltering stored levels of insulin. Using VSVG-YFP, we show that mutant huntingtin retards post-Golgi trans-port. Moreover, we demonstrate that the speed of insulin vesicle trafficking is reduced. Using immunopreci-pitation of mutant and wild-type huntingtin in combination with mass spectrometry, we reveal an enhancedand aberrant interaction between mutant huntingtin and b-tubulin, implying the underlying mechanism ofimpaired intracellular transport. Thus, our findings have revealed a novel pathogenetic process by whichmutant huntingtin may disrupt hormone exocytosis from b-cells and possibly impair vesicular transport inany cell that expresses the pathogenic protein.
INTRODUCTION
Huntington’s disease (HD) is caused by a CAG triplet expan-sion in the first exon of the IT15 gene, coding for the proteinhuntingtin. The disease primarily affects the neostriatum andcerebral cortex. However, HD is also associated with anincreased incidence of diabetes (1,2). The function of hunting-tin is not yet fully understood, but a role in regulating intra-cellular trafficking has been suggested. Recently, huntingtinwas shown to affect kinesin activity via alterations in thestate of phosphorylation of huntingtin (3,4). Moreover, hun-tingtin has been shown to interact with dynein (5), HAP-1/p150Glued (6,7) and kinesin light chain (8), all of which arepart of the transport machinery. The protein has also beenreported to be associated with microtubules (9,10). A normaland highly regulated interplay between microtubules and mol-ecular motors is crucial for an effective transport. Mutant
huntingtin has been shown to exert negative effects onaxonal transport in neurons (11–15), again emphasizing theimportance of huntingtin in intracellular trafficking events.
In a transgenic mouse model (R6/2) of HD in which themice express exon 1 of huntingtin with 155 CAG repeats(16), insulin secretion is deficient in late disease stages (17).b-Cell mass, insulin content of the islets and secretion ofinsulin are all reduced. Here, we have, in order to further elu-cidate the defects seen in the mouse model, studied the effectsof expressing mutant huntingtin in an acute fashion in a clonalinsulin-producing cell line. We found that mutant huntingtinrapidly reduces the efficiency of intracellular transport anddecreases stimulated insulin secretion despite normal contentof insulin and a normal number of insulin vesicles beingpresent in the cells. We also report that exon 1 mutant hunting-tin interacts more strongly with b-tubulin than its wild-type(wt) counterpart. We suggest that this interaction blocks
†The authors wish it to be known that, in their opinion, the first two authors should be regarded as joint First Authors.
�To whom correspondence should be addressed. Tel: þ46 462220525; Fax: þ46 462220531; Email: [email protected]
# The Author 2009. Published by Oxford University Press. All rights reserved.For Permissions, please email: [email protected]
Human Molecular Genetics, 2009, Vol. 18, No. 20 3942–3954doi:10.1093/hmg/ddp336Advance Access published on July 23, 2009
Dow
nloaded from https://academ
ic.oup.com/hm
g/article/18/20/3942/647591 by guest on 02 January 2022
intracellular transport, rendering it progressively more ineffi-cient as huntingtin accumulates. This could potentially be anovel pathogenetic mechanism in HD, occurring in the pan-creatic b-cells, and perhaps also in other cell types in whichvesicular transport is crucial, e.g. neurons.
RESULTS
Altered insulin levels, localization and secretion
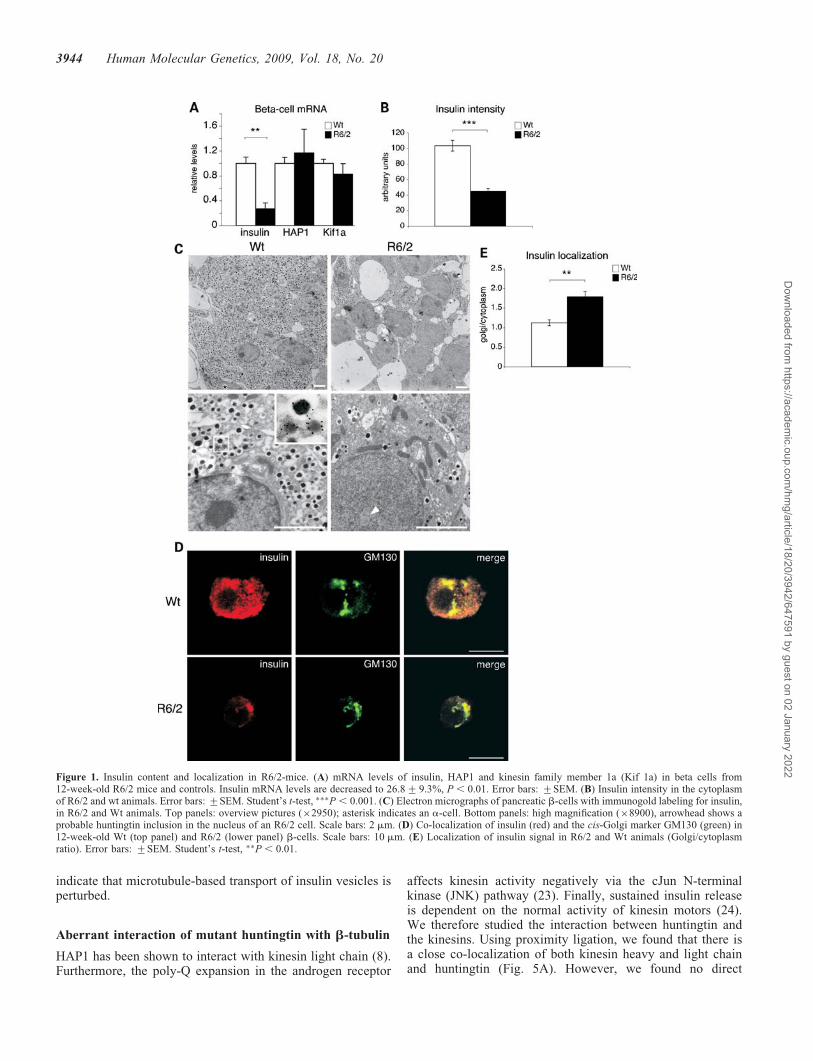
We first used semi-quantitative real-time PCR to study insulinmRNA expression in 12-week-old R6/2 and wt mice. Asexpected, we found dramatically reduced insulin mRNAlevels in R6/2 mice, whereas mRNAs of kinesin 1a andhuntingtin-associated protein 1 (HAP1) were unchanged(Fig. 1A). Moreover, the insulin content in R6/2 b-cells wasdrastically reduced as judged by immunocytochemistry(Fig. 1B). In immuno-electron microscopy micrographs, wefound that the number of insulin vesicles was reduced inR6/2 b-cells as previously reported (Fig. 1C) (17). Interest-ingly, the remaining insulin/proinsulin in the R6/2 b-cellswas mainly localized to the Golgi apparatus (Fig. 1D andE). These data indicate that insulin production, vesicular bio-genesis and/or vesicle trafficking are impaired in the R6/2mouse. The decreased insulin mRNA in the R6/2 mousemodel is likely due to a transcriptional effect, possibly dueto decreased PDXI or p300 as previously demonstrated inthis model (18).
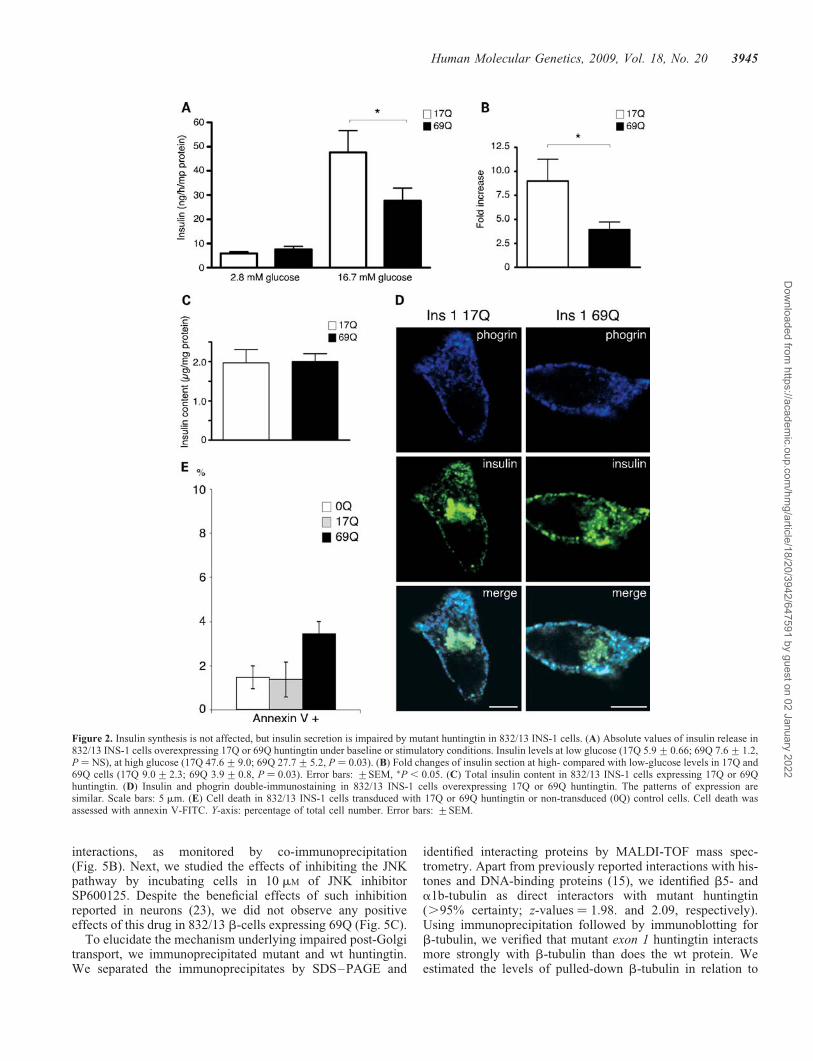
To further investigate this phenomenon, we used 832/13b-cells (INS-1 cells) with adenovirally mediated expressionof exon 1 huntingtin containing either 17 (wt) or 69(mutant) glutamine residues. First, we analyzed insulinsecretion in response to glucose. Cells expressing 69Q hun-tingtin exhibited normal basal release of insulin, while theresponse to glucose was impaired (Fig. 2A). The fold-changeafter stimulation was significantly higher in 17Q cells than incells expressing pathogenic 69Q huntingtin (Fig. 2B). Totalinsulin/proinsulin levels were comparable as determined byradioimmunoassay (Fig. 2C), indicating that the molecularmanipulations did not affect insulin content. Next, usingimmunofluorescence labeling of insulin/proinsulin andphogrin, an insulin vesicle marker, we assessed the subcellularlocalization of the hormone. 17Q- and 69Q-expressing cellsdisplayed similar patterns of insulin/proinsulin and phogrinimmunoreactivity, a punctuate staining in the periphery anda stronger proinsulin signal from the Golgi apparatus(Fig. 2D). Although we found a slight increase in early apop-tosis in cells expressing 69Q huntingtin when compared with17Q cells (Fig. 2E), the defect in insulin secretion could notbe attributed to cell death. When we triple-stained cells withendoplasmatic reticulum (ER), cis-Golgi and trans-Golginetwork markers, we found no alterations in ER or Golgi mor-phology upon huntingtin expression (data not shown).
Impaired intracellular transport
Huntingtin has previously been reported to affect intracellulartrafficking in neurons (11,12,14). Therefore, we used vesicularstomatitis viral glycoprotein coupled to a yellow fluorescentprotein (VSVG-YFP) to study the transport of protein from
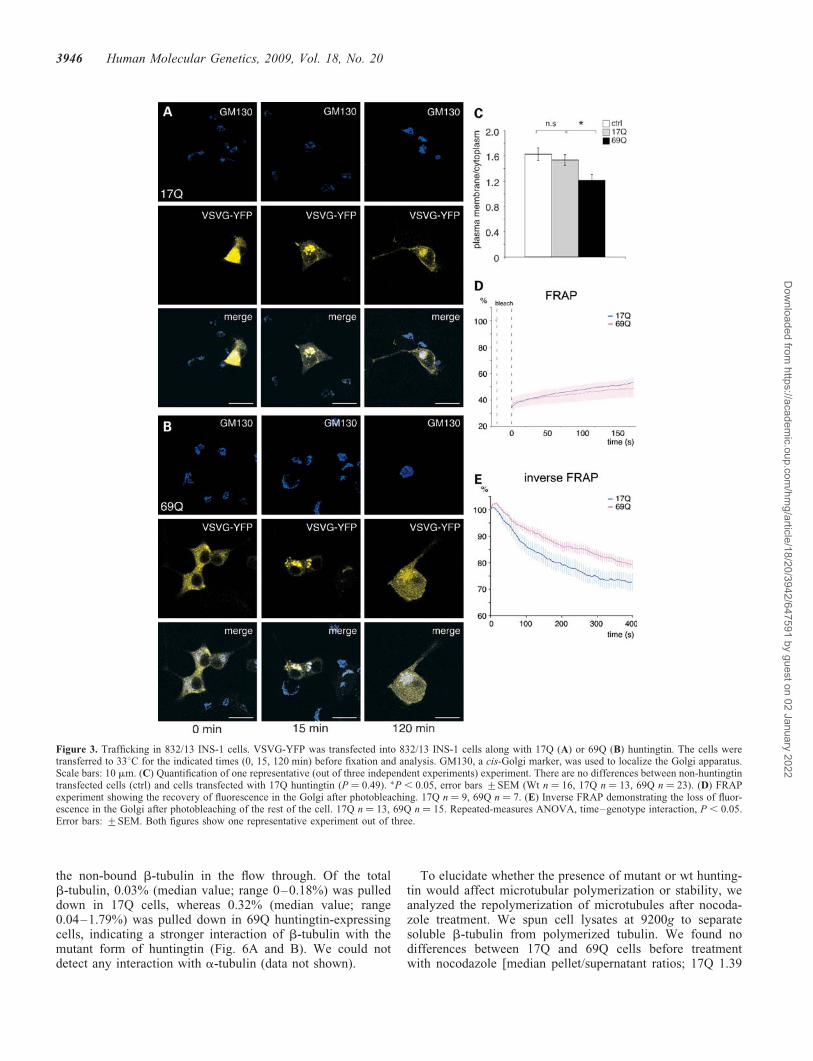
the ER to the plasma membrane. The VSVG protein reversiblymisfolds at 398C and therefore remains in the ER. When thetemperature is lowered to 338C, the protein refolds correctlyand translocates to the plasma membrane via the Golgi appar-atus (19). In both 17Q- and 69Q-expressing cells, the VSVGreached the Golgi apparatus after 15 min at 338C. In contrast,the transport from the Golgi to the plasma membrane was sig-nificantly slower in the cells expressing 69Q huntingtin(Fig. 3A–C).
To verify the transport defects, we studied insulin vesicletransport to and from the trans-Golgi network in two fluor-escence recovery after photobleaching (FRAP) experiments.We visualized insulin vesicles by transduction with an isletamyloid polypeptide (IAPP)-EGFP virus. First, the Golgiapparatus was photobleached. The recovery of fluorescencewas assessed, monitoring the refilling of the Golgi from theER. We did not observe any changes in the rate of recoveryin 69Q compared with 17Q cells (Fig. 3D), indicatingnormal protein trafficking between ER and Golgi apparatus.In the second experiment, we performed an inverse FRAP todetermine transport from the Golgi apparatus by monitoringfading of the network. We found that the rate of fluorescencefading was significantly slower in the cells expressing 69Qhuntingtin (Fig. 3E, P , 0.05), indicating impaired post-Golgitransport.
Insulin vesicle transport and release
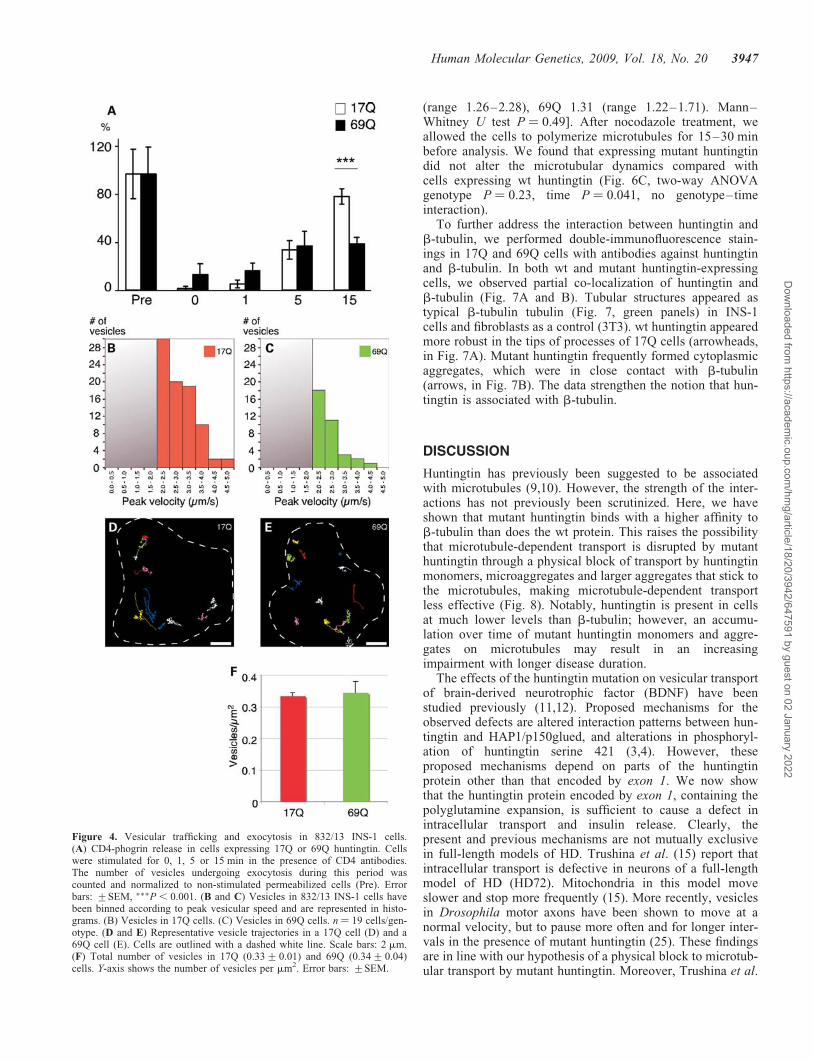
The initial phase of insulin secretion is contributed by exocy-tosis of a ‘release competent’ pool of insulin-containing ves-icles situated close to the plasma membrane (20). Sustainedinsulin release depends on the recruitment of vesicles from avesicular pool in the interior of the cell, a process dependenton microtubule-associated transport. In order to furtherdissect the time-dependency of insulin release, we transfectedcells with a CD4-phogrin chimeric protein (21). The proteinlocalizes to the insulin vesicles with the CD4 epitopeexposed on the luminal surface of the granule. Vesicles, endo-cytosed after fusing with the plasma membrane, can thus bedetected with CD4 antibodies present in the stimulationbuffer. We found the number of fused insulin vesicles to benormal in 69Q cells at the early time points, correspondingto the first-phase insulin secretion. However, the expectedincrease in insulin secretion at the later time points, corre-sponding to the second or sustained phase of insulin, wasblunted in cells expressing mutant huntingtin (Fig. 4A).
To estimate the number and speed of vesicles moving alongmicrotubules, we acquired high-velocity scans of cells trans-duced with IAPP-EGFP and the different types of huntingtin.We tracked the vesicles in 17Q- and 69Q-expressing cells andanalyzed the peak velocities, which reflect directed transportin contrast to the slower random vesicle movements. Thefast, directional type of movement is dependent on a normalintegrity of the microtubules (22). Indeed, we observed a dra-matic reduction in the number of vesicles moving in a direc-tional fashion in the 69Q-expressing cells (Fig. 4B and C;representative vesicle trajectories in a 17Q- and a69Q-expressing cell are depicted in Fig. 4D and E, respect-ively). However, the total number of vesicles was not alteredby expression of mutant huntingtin (Fig. 4F). These data
Human Molecular Genetics, 2009, Vol. 18, No. 20 3943
Dow
nloaded from https://academ
ic.oup.com/hm
g/article/18/20/3942/647591 by guest on 02 January 2022
indicate that microtubule-based transport of insulin vesicles isperturbed.
Aberrant interaction of mutant huntingtin with b-tubulin
HAP1 has been shown to interact with kinesin light chain (8).Furthermore, the poly-Q expansion in the androgen receptor
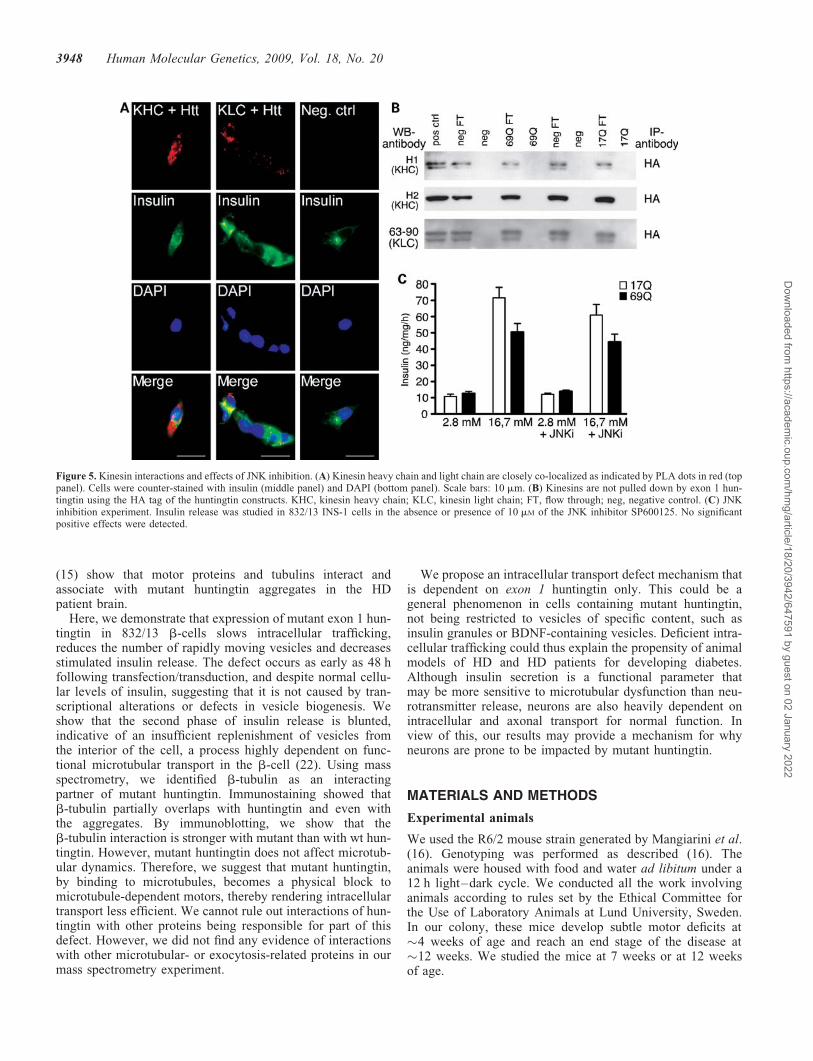
affects kinesin activity negatively via the cJun N-terminalkinase (JNK) pathway (23). Finally, sustained insulin releaseis dependent on the normal activity of kinesin motors (24).We therefore studied the interaction between huntingtin andthe kinesins. Using proximity ligation, we found that there isa close co-localization of both kinesin heavy and light chainand huntingtin (Fig. 5A). However, we found no direct
Figure 1. Insulin content and localization in R6/2-mice. (A) mRNA levels of insulin, HAP1 and kinesin family member 1a (Kif 1a) in beta cells from12-week-old R6/2 mice and controls. Insulin mRNA levels are decreased to 26.8+9.3%, P , 0.01. Error bars: +SEM. (B) Insulin intensity in the cytoplasmof R6/2 and wt animals. Error bars: +SEM. Student’s t-test, ���P , 0.001. (C) Electron micrographs of pancreatic b-cells with immunogold labeling for insulin,in R6/2 and Wt animals. Top panels: overview pictures (�2950); asterisk indicates an a-cell. Bottom panels: high magnification (�8900), arrowhead shows aprobable huntingtin inclusion in the nucleus of an R6/2 cell. Scale bars: 2 mm. (D) Co-localization of insulin (red) and the cis-Golgi marker GM130 (green) in12-week-old Wt (top panel) and R6/2 (lower panel) b-cells. Scale bars: 10 mm. (E) Localization of insulin signal in R6/2 and Wt animals (Golgi/cytoplasmratio). Error bars: +SEM. Student’s t-test, ��P , 0.01.
3944 Human Molecular Genetics, 2009, Vol. 18, No. 20
Dow
nloaded from https://academ
ic.oup.com/hm
g/article/18/20/3942/647591 by guest on 02 January 2022
interactions, as monitored by co-immunoprecipitation(Fig. 5B). Next, we studied the effects of inhibiting the JNKpathway by incubating cells in 10 mM of JNK inhibitorSP600125. Despite the beneficial effects of such inhibitionreported in neurons (23), we did not observe any positiveeffects of this drug in 832/13 b-cells expressing 69Q (Fig. 5C).
To elucidate the mechanism underlying impaired post-Golgitransport, we immunoprecipitated mutant and wt huntingtin.We separated the immunoprecipitates by SDS–PAGE and
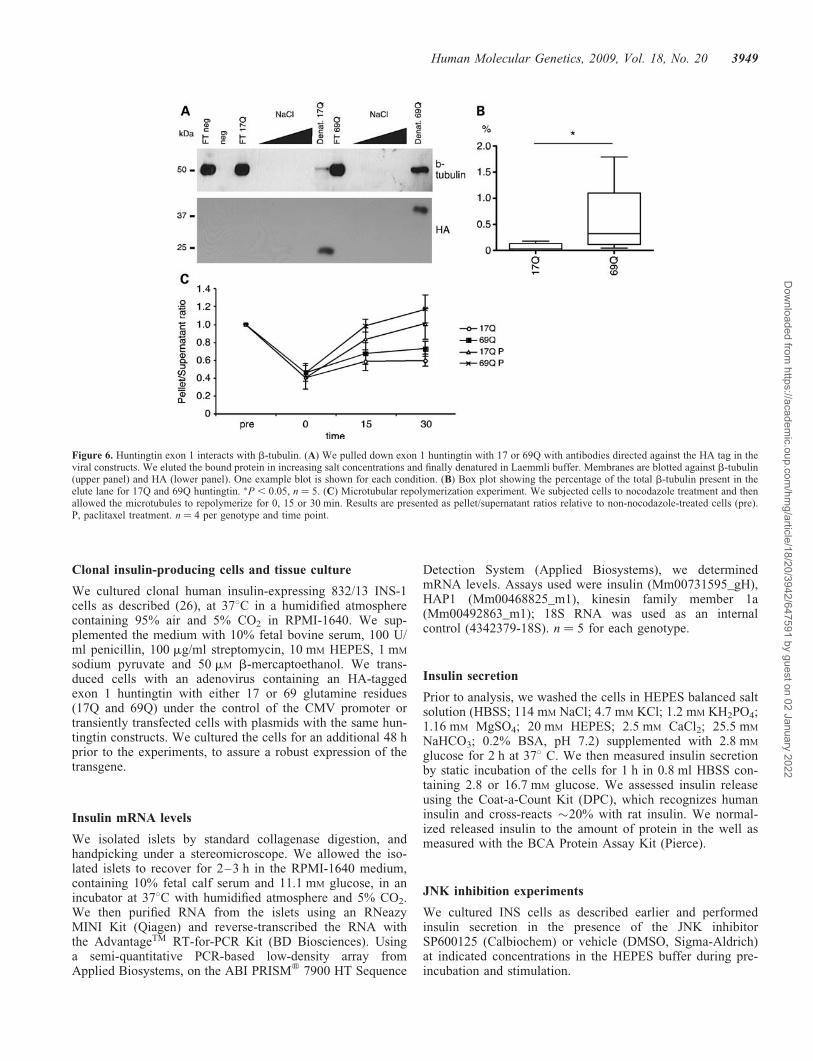
identified interacting proteins by MALDI-TOF mass spec-trometry. Apart from previously reported interactions with his-tones and DNA-binding proteins (15), we identified b5- anda1b-tubulin as direct interactors with mutant huntingtin(.95% certainty; z-values ¼ 1.98. and 2.09, respectively).Using immunoprecipitation followed by immunoblotting forb-tubulin, we verified that mutant exon 1 huntingtin interactsmore strongly with b-tubulin than does the wt protein. Weestimated the levels of pulled-down b-tubulin in relation to
Figure 2. Insulin synthesis is not affected, but insulin secretion is impaired by mutant huntingtin in 832/13 INS-1 cells. (A) Absolute values of insulin release in832/13 INS-1 cells overexpressing 17Q or 69Q huntingtin under baseline or stimulatory conditions. Insulin levels at low glucose (17Q 5.9+0.66; 69Q 7.6+1.2,P ¼ NS), at high glucose (17Q 47.6+9.0; 69Q 27.7+5.2, P ¼ 0.03). (B) Fold changes of insulin section at high- compared with low-glucose levels in 17Q and69Q cells (17Q 9.0+2.3; 69Q 3.9+0.8, P ¼ 0.03). Error bars: +SEM, �P , 0.05. (C) Total insulin content in 832/13 INS-1 cells expressing 17Q or 69Qhuntingtin. (D) Insulin and phogrin double-immunostaining in 832/13 INS-1 cells overexpressing 17Q or 69Q huntingtin. The patterns of expression aresimilar. Scale bars: 5 mm. (E) Cell death in 832/13 INS-1 cells transduced with 17Q or 69Q huntingtin or non-transduced (0Q) control cells. Cell death wasassessed with annexin V-FITC. Y-axis: percentage of total cell number. Error bars: +SEM.
Human Molecular Genetics, 2009, Vol. 18, No. 20 3945
Dow
nloaded from https://academ
ic.oup.com/hm
g/article/18/20/3942/647591 by guest on 02 January 2022
the non-bound b-tubulin in the flow through. Of the totalb-tubulin, 0.03% (median value; range 0–0.18%) was pulleddown in 17Q cells, whereas 0.32% (median value; range0.04–1.79%) was pulled down in 69Q huntingtin-expressingcells, indicating a stronger interaction of b-tubulin with themutant form of huntingtin (Fig. 6A and B). We could notdetect any interaction with a-tubulin (data not shown).
To elucidate whether the presence of mutant or wt hunting-tin would affect microtubular polymerization or stability, weanalyzed the repolymerization of microtubules after nocoda-zole treatment. We spun cell lysates at 9200g to separatesoluble b-tubulin from polymerized tubulin. We found nodifferences between 17Q and 69Q cells before treatmentwith nocodazole [median pellet/supernatant ratios; 17Q 1.39
Figure 3. Trafficking in 832/13 INS-1 cells. VSVG-YFP was transfected into 832/13 INS-1 cells along with 17Q (A) or 69Q (B) huntingtin. The cells weretransferred to 338C for the indicated times (0, 15, 120 min) before fixation and analysis. GM130, a cis-Golgi marker, was used to localize the Golgi apparatus.Scale bars: 10 mm. (C) Quantification of one representative (out of three independent experiments) experiment. There are no differences between non-huntingtintransfected cells (ctrl) and cells transfected with 17Q huntingtin (P ¼ 0.49). �P , 0.05, error bars +SEM (Wt n ¼ 16, 17Q n ¼ 13, 69Q n ¼ 23). (D) FRAPexperiment showing the recovery of fluorescence in the Golgi after photobleaching. 17Q n ¼ 9, 69Q n ¼ 7. (E) Inverse FRAP demonstrating the loss of fluor-escence in the Golgi after photobleaching of the rest of the cell. 17Q n ¼ 13, 69Q n ¼ 15. Repeated-measures ANOVA, time–genotype interaction, P , 0.05.Error bars: +SEM. Both figures show one representative experiment out of three.
3946 Human Molecular Genetics, 2009, Vol. 18, No. 20
Dow
nloaded from https://academ
ic.oup.com/hm
g/article/18/20/3942/647591 by guest on 02 January 2022
(range 1.26–2.28), 69Q 1.31 (range 1.22–1.71). Mann–Whitney U test P ¼ 0.49]. After nocodazole treatment, weallowed the cells to polymerize microtubules for 15–30 minbefore analysis. We found that expressing mutant huntingtindid not alter the microtubular dynamics compared withcells expressing wt huntingtin (Fig. 6C, two-way ANOVAgenotype P ¼ 0.23, time P ¼ 0.041, no genotype–timeinteraction).
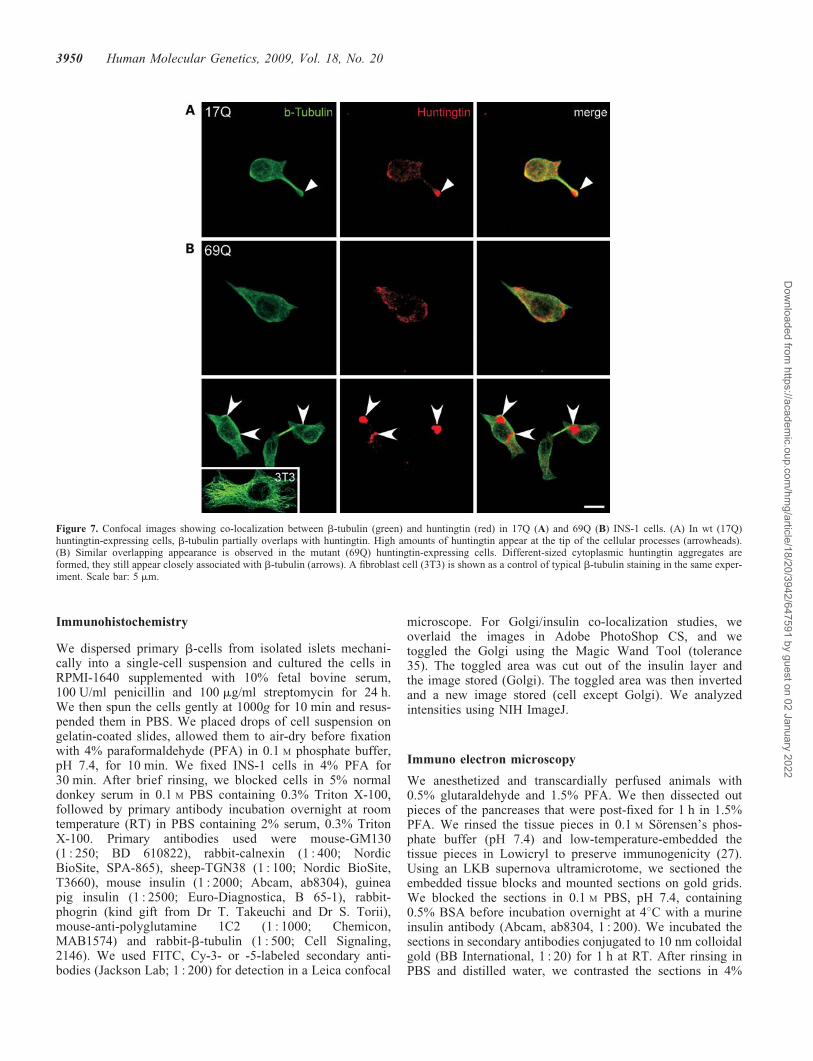
To further address the interaction between huntingtin andb-tubulin, we performed double-immunofluorescence stain-ings in 17Q and 69Q cells with antibodies against huntingtinand b-tubulin. In both wt and mutant huntingtin-expressingcells, we observed partial co-localization of huntingtin andb-tubulin (Fig. 7A and B). Tubular structures appeared astypical b-tubulin tubulin (Fig. 7, green panels) in INS-1cells and fibroblasts as a control (3T3). wt huntingtin appearedmore robust in the tips of processes of 17Q cells (arrowheads,in Fig. 7A). Mutant huntingtin frequently formed cytoplasmicaggregates, which were in close contact with b-tubulin(arrows, in Fig. 7B). The data strengthen the notion that hun-tingtin is associated with b-tubulin.
DISCUSSION
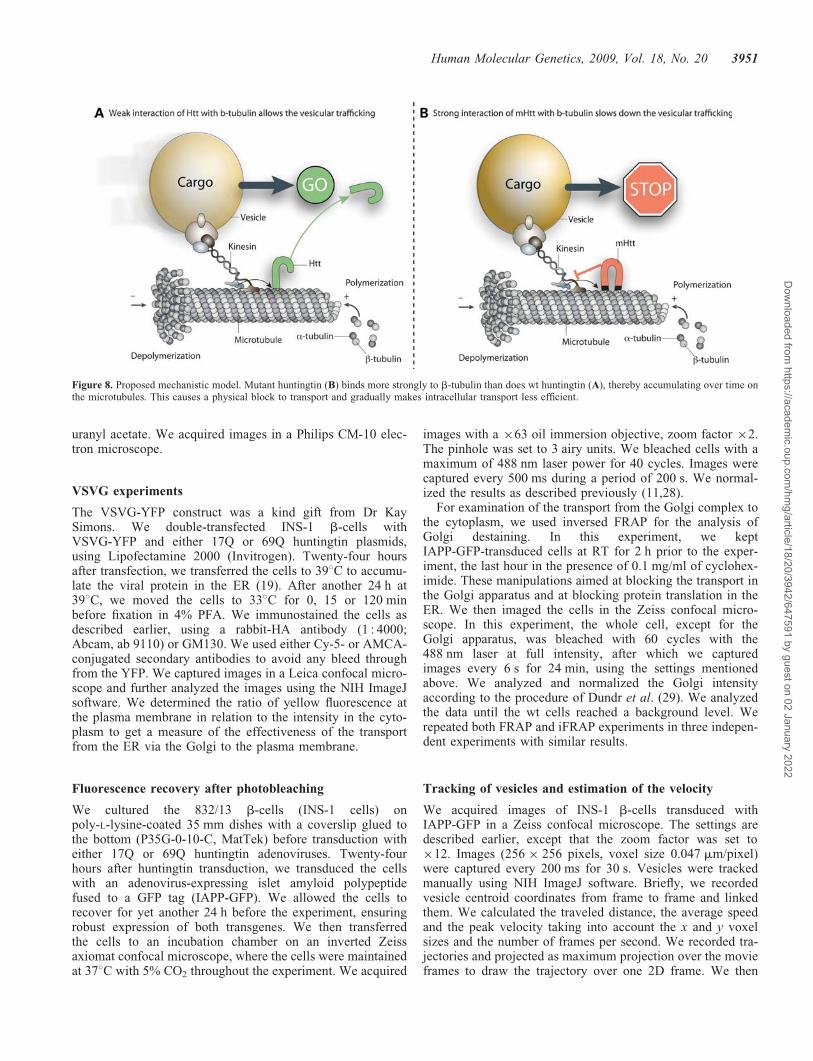
Huntingtin has previously been suggested to be associatedwith microtubules (9,10). However, the strength of the inter-actions has not previously been scrutinized. Here, we haveshown that mutant huntingtin binds with a higher affinity tob-tubulin than does the wt protein. This raises the possibilitythat microtubule-dependent transport is disrupted by mutanthuntingtin through a physical block of transport by huntingtinmonomers, microaggregates and larger aggregates that stick tothe microtubules, making microtubule-dependent transportless effective (Fig. 8). Notably, huntingtin is present in cellsat much lower levels than b-tubulin; however, an accumu-lation over time of mutant huntingtin monomers and aggre-gates on microtubules may result in an increasingimpairment with longer disease duration.
The effects of the huntingtin mutation on vesicular transportof brain-derived neurotrophic factor (BDNF) have beenstudied previously (11,12). Proposed mechanisms for theobserved defects are altered interaction patterns between hun-tingtin and HAP1/p150glued, and alterations in phosphoryl-ation of huntingtin serine 421 (3,4). However, theseproposed mechanisms depend on parts of the huntingtinprotein other than that encoded by exon 1. We now showthat the huntingtin protein encoded by exon 1, containing thepolyglutamine expansion, is sufficient to cause a defect inintracellular transport and insulin release. Clearly, thepresent and previous mechanisms are not mutually exclusivein full-length models of HD. Trushina et al. (15) report thatintracellular transport is defective in neurons of a full-lengthmodel of HD (HD72). Mitochondria in this model moveslower and stop more frequently (15). More recently, vesiclesin Drosophila motor axons have been shown to move at anormal velocity, but to pause more often and for longer inter-vals in the presence of mutant huntingtin (25). These findingsare in line with our hypothesis of a physical block to microtub-ular transport by mutant huntingtin. Moreover, Trushina et al.
Figure 4. Vesicular trafficking and exocytosis in 832/13 INS-1 cells.(A) CD4-phogrin release in cells expressing 17Q or 69Q huntingtin. Cellswere stimulated for 0, 1, 5 or 15 min in the presence of CD4 antibodies.The number of vesicles undergoing exocytosis during this period wascounted and normalized to non-stimulated permeabilized cells (Pre). Errorbars: +SEM, ���P , 0.001. (B and C) Vesicles in 832/13 INS-1 cells havebeen binned according to peak vesicular speed and are represented in histo-grams. (B) Vesicles in 17Q cells. (C) Vesicles in 69Q cells. n ¼ 19 cells/gen-otype. (D and E) Representative vesicle trajectories in a 17Q cell (D) and a69Q cell (E). Cells are outlined with a dashed white line. Scale bars: 2 mm.(F) Total number of vesicles in 17Q (0.33+0.01) and 69Q (0.34+0.04)cells. Y-axis shows the number of vesicles per mm2. Error bars: +SEM.
Human Molecular Genetics, 2009, Vol. 18, No. 20 3947
Dow
nloaded from https://academ
ic.oup.com/hm
g/article/18/20/3942/647591 by guest on 02 January 2022
(15) show that motor proteins and tubulins interact andassociate with mutant huntingtin aggregates in the HDpatient brain.
Here, we demonstrate that expression of mutant exon 1 hun-tingtin in 832/13 b-cells slows intracellular trafficking,reduces the number of rapidly moving vesicles and decreasesstimulated insulin release. The defect occurs as early as 48 hfollowing transfection/transduction, and despite normal cellu-lar levels of insulin, suggesting that it is not caused by tran-scriptional alterations or defects in vesicle biogenesis. Weshow that the second phase of insulin release is blunted,indicative of an insufficient replenishment of vesicles fromthe interior of the cell, a process highly dependent on func-tional microtubular transport in the b-cell (22). Using massspectrometry, we identified b-tubulin as an interactingpartner of mutant huntingtin. Immunostaining showed thatb-tubulin partially overlaps with huntingtin and even withthe aggregates. By immunoblotting, we show that theb-tubulin interaction is stronger with mutant than with wt hun-tingtin. However, mutant huntingtin does not affect microtub-ular dynamics. Therefore, we suggest that mutant huntingtin,by binding to microtubules, becomes a physical block tomicrotubule-dependent motors, thereby rendering intracellulartransport less efficient. We cannot rule out interactions of hun-tingtin with other proteins being responsible for part of thisdefect. However, we did not find any evidence of interactionswith other microtubular- or exocytosis-related proteins in ourmass spectrometry experiment.
We propose an intracellular transport defect mechanism thatis dependent on exon 1 huntingtin only. This could be ageneral phenomenon in cells containing mutant huntingtin,not being restricted to vesicles of specific content, such asinsulin granules or BDNF-containing vesicles. Deficient intra-cellular trafficking could thus explain the propensity of animalmodels of HD and HD patients for developing diabetes.Although insulin secretion is a functional parameter thatmay be more sensitive to microtubular dysfunction than neu-rotransmitter release, neurons are also heavily dependent onintracellular and axonal transport for normal function. Inview of this, our results may provide a mechanism for whyneurons are prone to be impacted by mutant huntingtin.
MATERIALS AND METHODS
Experimental animals
We used the R6/2 mouse strain generated by Mangiarini et al.(16). Genotyping was performed as described (16). Theanimals were housed with food and water ad libitum under a12 h light–dark cycle. We conducted all the work involvinganimals according to rules set by the Ethical Committee forthe Use of Laboratory Animals at Lund University, Sweden.In our colony, these mice develop subtle motor deficits at�4 weeks of age and reach an end stage of the disease at�12 weeks. We studied the mice at 7 weeks or at 12 weeksof age.
Figure 5. Kinesin interactions and effects of JNK inhibition. (A) Kinesin heavy chain and light chain are closely co-localized as indicated by PLA dots in red (toppanel). Cells were counter-stained with insulin (middle panel) and DAPI (bottom panel). Scale bars: 10 mm. (B) Kinesins are not pulled down by exon 1 hun-tingtin using the HA tag of the huntingtin constructs. KHC, kinesin heavy chain; KLC, kinesin light chain; FT, flow through; neg, negative control. (C) JNKinhibition experiment. Insulin release was studied in 832/13 INS-1 cells in the absence or presence of 10 mM of the JNK inhibitor SP600125. No significantpositive effects were detected.
3948 Human Molecular Genetics, 2009, Vol. 18, No. 20
Dow
nloaded from https://academ
ic.oup.com/hm
g/article/18/20/3942/647591 by guest on 02 January 2022
Clonal insulin-producing cells and tissue culture
We cultured clonal human insulin-expressing 832/13 INS-1cells as described (26), at 378C in a humidified atmospherecontaining 95% air and 5% CO2 in RPMI-1640. We sup-plemented the medium with 10% fetal bovine serum, 100 U/ml penicillin, 100 mg/ml streptomycin, 10 mM HEPES, 1 mM
sodium pyruvate and 50 mM b-mercaptoethanol. We trans-duced cells with an adenovirus containing an HA-taggedexon 1 huntingtin with either 17 or 69 glutamine residues(17Q and 69Q) under the control of the CMV promoter ortransiently transfected cells with plasmids with the same hun-tingtin constructs. We cultured the cells for an additional 48 hprior to the experiments, to assure a robust expression of thetransgene.
Insulin mRNA levels
We isolated islets by standard collagenase digestion, andhandpicking under a stereomicroscope. We allowed the iso-lated islets to recover for 2–3 h in the RPMI-1640 medium,containing 10% fetal calf serum and 11.1 mM glucose, in anincubator at 378C with humidified atmosphere and 5% CO2.We then purified RNA from the islets using an RNeazyMINI Kit (Qiagen) and reverse-transcribed the RNA withthe AdvantageTM RT-for-PCR Kit (BD Biosciences). Usinga semi-quantitative PCR-based low-density array fromApplied Biosystems, on the ABI PRISMw 7900 HT Sequence
Detection System (Applied Biosystems), we determinedmRNA levels. Assays used were insulin (Mm00731595_gH),HAP1 (Mm00468825_m1), kinesin family member 1a(Mm00492863_m1); 18S RNA was used as an internalcontrol (4342379-18S). n ¼ 5 for each genotype.
Insulin secretion
Prior to analysis, we washed the cells in HEPES balanced saltsolution (HBSS; 114 mM NaCl; 4.7 mM KCl; 1.2 mM KH2PO4;1.16 mM MgSO4; 20 mM HEPES; 2.5 mM CaCl2; 25.5 mM
NaHCO3; 0.2% BSA, pH 7.2) supplemented with 2.8 mM
glucose for 2 h at 378 C. We then measured insulin secretionby static incubation of the cells for 1 h in 0.8 ml HBSS con-taining 2.8 or 16.7 mM glucose. We assessed insulin releaseusing the Coat-a-Count Kit (DPC), which recognizes humaninsulin and cross-reacts �20% with rat insulin. We normal-ized released insulin to the amount of protein in the well asmeasured with the BCA Protein Assay Kit (Pierce).
JNK inhibition experiments
We cultured INS cells as described earlier and performedinsulin secretion in the presence of the JNK inhibitorSP600125 (Calbiochem) or vehicle (DMSO, Sigma-Aldrich)at indicated concentrations in the HEPES buffer during pre-incubation and stimulation.
Figure 6. Huntingtin exon 1 interacts with b-tubulin. (A) We pulled down exon 1 huntingtin with 17 or 69Q with antibodies directed against the HA tag in theviral constructs. We eluted the bound protein in increasing salt concentrations and finally denatured in Laemmli buffer. Membranes are blotted against b-tubulin(upper panel) and HA (lower panel). One example blot is shown for each condition. (B) Box plot showing the percentage of the total b-tubulin present in theelute lane for 17Q and 69Q huntingtin. �P , 0.05, n ¼ 5. (C) Microtubular repolymerization experiment. We subjected cells to nocodazole treatment and thenallowed the microtubules to repolymerize for 0, 15 or 30 min. Results are presented as pellet/supernatant ratios relative to non-nocodazole-treated cells (pre).P, paclitaxel treatment. n ¼ 4 per genotype and time point.
Human Molecular Genetics, 2009, Vol. 18, No. 20 3949
Dow
nloaded from https://academ
ic.oup.com/hm
g/article/18/20/3942/647591 by guest on 02 January 2022
Immunohistochemistry
We dispersed primary b-cells from isolated islets mechani-cally into a single-cell suspension and cultured the cells inRPMI-1640 supplemented with 10% fetal bovine serum,100 U/ml penicillin and 100 mg/ml streptomycin for 24 h.We then spun the cells gently at 1000g for 10 min and resus-pended them in PBS. We placed drops of cell suspension ongelatin-coated slides, allowed them to air-dry before fixationwith 4% paraformaldehyde (PFA) in 0.1 M phosphate buffer,pH 7.4, for 10 min. We fixed INS-1 cells in 4% PFA for30 min. After brief rinsing, we blocked cells in 5% normaldonkey serum in 0.1 M PBS containing 0.3% Triton X-100,followed by primary antibody incubation overnight at roomtemperature (RT) in PBS containing 2% serum, 0.3% TritonX-100. Primary antibodies used were mouse-GM130(1 : 250; BD 610822), rabbit-calnexin (1 : 400; NordicBioSite, SPA-865), sheep-TGN38 (1 : 100; Nordic BioSite,T3660), mouse insulin (1 : 2000; Abcam, ab8304), guineapig insulin (1 : 2500; Euro-Diagnostica, B 65-1), rabbit-phogrin (kind gift from Dr T. Takeuchi and Dr S. Torii),mouse-anti-polyglutamine 1C2 (1 : 1000; Chemicon,MAB1574) and rabbit-b-tubulin (1 : 500; Cell Signaling,2146). We used FITC, Cy-3- or -5-labeled secondary anti-bodies (Jackson Lab; 1 : 200) for detection in a Leica confocal
microscope. For Golgi/insulin co-localization studies, weoverlaid the images in Adobe PhotoShop CS, and wetoggled the Golgi using the Magic Wand Tool (tolerance35). The toggled area was cut out of the insulin layer andthe image stored (Golgi). The toggled area was then invertedand a new image stored (cell except Golgi). We analyzedintensities using NIH ImageJ.
Immuno electron microscopy
We anesthetized and transcardially perfused animals with0.5% glutaraldehyde and 1.5% PFA. We then dissected outpieces of the pancreases that were post-fixed for 1 h in 1.5%PFA. We rinsed the tissue pieces in 0.1 M Sorensen’s phos-phate buffer (pH 7.4) and low-temperature-embedded thetissue pieces in Lowicryl to preserve immunogenicity (27).Using an LKB supernova ultramicrotome, we sectioned theembedded tissue blocks and mounted sections on gold grids.We blocked the sections in 0.1 M PBS, pH 7.4, containing0.5% BSA before incubation overnight at 48C with a murineinsulin antibody (Abcam, ab8304, 1 : 200). We incubated thesections in secondary antibodies conjugated to 10 nm colloidalgold (BB International, 1 : 20) for 1 h at RT. After rinsing inPBS and distilled water, we contrasted the sections in 4%
Figure 7. Confocal images showing co-localization between b-tubulin (green) and huntingtin (red) in 17Q (A) and 69Q (B) INS-1 cells. (A) In wt (17Q)huntingtin-expressing cells, b-tubulin partially overlaps with huntingtin. High amounts of huntingtin appear at the tip of the cellular processes (arrowheads).(B) Similar overlapping appearance is observed in the mutant (69Q) huntingtin-expressing cells. Different-sized cytoplasmic huntingtin aggregates areformed, they still appear closely associated with b-tubulin (arrows). A fibroblast cell (3T3) is shown as a control of typical b-tubulin staining in the same exper-iment. Scale bar: 5 mm.
3950 Human Molecular Genetics, 2009, Vol. 18, No. 20
Dow
nloaded from https://academ
ic.oup.com/hm
g/article/18/20/3942/647591 by guest on 02 January 2022
uranyl acetate. We acquired images in a Philips CM-10 elec-tron microscope.
VSVG experiments
The VSVG-YFP construct was a kind gift from Dr KaySimons. We double-transfected INS-1 b-cells withVSVG-YFP and either 17Q or 69Q huntingtin plasmids,using Lipofectamine 2000 (Invitrogen). Twenty-four hoursafter transfection, we transferred the cells to 398C to accumu-late the viral protein in the ER (19). After another 24 h at398C, we moved the cells to 338C for 0, 15 or 120 minbefore fixation in 4% PFA. We immunostained the cells asdescribed earlier, using a rabbit-HA antibody (1 : 4000;Abcam, ab 9110) or GM130. We used either Cy-5- or AMCA-conjugated secondary antibodies to avoid any bleed throughfrom the YFP. We captured images in a Leica confocal micro-scope and further analyzed the images using the NIH ImageJsoftware. We determined the ratio of yellow fluorescence atthe plasma membrane in relation to the intensity in the cyto-plasm to get a measure of the effectiveness of the transportfrom the ER via the Golgi to the plasma membrane.
Fluorescence recovery after photobleaching
We cultured the 832/13 b-cells (INS-1 cells) onpoly-L-lysine-coated 35 mm dishes with a coverslip glued tothe bottom (P35G-0-10-C, MatTek) before transduction witheither 17Q or 69Q huntingtin adenoviruses. Twenty-fourhours after huntingtin transduction, we transduced the cellswith an adenovirus-expressing islet amyloid polypeptidefused to a GFP tag (IAPP-GFP). We allowed the cells torecover for yet another 24 h before the experiment, ensuringrobust expression of both transgenes. We then transferredthe cells to an incubation chamber on an inverted Zeissaxiomat confocal microscope, where the cells were maintainedat 378C with 5% CO2 throughout the experiment. We acquired
images with a �63 oil immersion objective, zoom factor �2.The pinhole was set to 3 airy units. We bleached cells with amaximum of 488 nm laser power for 40 cycles. Images werecaptured every 500 ms during a period of 200 s. We normal-ized the results as described previously (11,28).
For examination of the transport from the Golgi complex tothe cytoplasm, we used inversed FRAP for the analysis ofGolgi destaining. In this experiment, we keptIAPP-GFP-transduced cells at RT for 2 h prior to the exper-iment, the last hour in the presence of 0.1 mg/ml of cyclohex-imide. These manipulations aimed at blocking the transport inthe Golgi apparatus and at blocking protein translation in theER. We then imaged the cells in the Zeiss confocal micro-scope. In this experiment, the whole cell, except for theGolgi apparatus, was bleached with 60 cycles with the488 nm laser at full intensity, after which we capturedimages every 6 s for 24 min, using the settings mentionedabove. We analyzed and normalized the Golgi intensityaccording to the procedure of Dundr et al. (29). We analyzedthe data until the wt cells reached a background level. Werepeated both FRAP and iFRAP experiments in three indepen-dent experiments with similar results.
Tracking of vesicles and estimation of the velocity
We acquired images of INS-1 b-cells transduced withIAPP-GFP in a Zeiss confocal microscope. The settings aredescribed earlier, except that the zoom factor was set to�12. Images (256 � 256 pixels, voxel size 0.047 mm/pixel)were captured every 200 ms for 30 s. Vesicles were trackedmanually using NIH ImageJ software. Briefly, we recordedvesicle centroid coordinates from frame to frame and linkedthem. We calculated the traveled distance, the average speedand the peak velocity taking into account the x and y voxelsizes and the number of frames per second. We recorded tra-jectories and projected as maximum projection over the movieframes to draw the trajectory over one 2D frame. We then
Figure 8. Proposed mechanistic model. Mutant huntingtin (B) binds more strongly to b-tubulin than does wt huntingtin (A), thereby accumulating over time onthe microtubules. This causes a physical block to transport and gradually makes intracellular transport less efficient.
Human Molecular Genetics, 2009, Vol. 18, No. 20 3951
Dow
nloaded from https://academ
ic.oup.com/hm
g/article/18/20/3942/647591 by guest on 02 January 2022
added the outline of the cell as an overlay in Adobe Illustrator.We split vesicle trajectories into spinning vesicles and vesiclesmoving in a linear trajectory. We analyzed all the vesiclesmoving linearly in a comprehensive way. We thereafter trans-formed velocity data by visual banding using SSPS software,ranking peak velocities and binning into speed intervals thatwere plotted in a histogram (n ¼ 9/genotype).
CD4-phogrin experiment
We cultured INS-1 cells for 24 h in 24-well plates before ade-noviral transduction with either 17 or 69Q huntingtin. Twenty-four hours later, we transfected the cells with CD4-phogrinusing Lipofectamine 2000 (Invitrogen). Forty-eight hours fol-lowing transfection, we stimulated with 16.7 mM glucose and35 mM KCl in HBSS for 0, 1, 5 or 15 min with 0.5 mg/mlmouse anti-human CD4 antibody (Chemicon, CBL127) inthe medium. After stimulation, we rinsed the cells in PBS,prior to fixation in 4% PFA. We then permeabilized cellswith 0.3% Triton X-100, followed by a Cy-2-conjugateddonkey-anti-mouse secondary antibody for the detection ofinternalized CD4/phogrin. One well of unstimulated cells percondition was kept as a transfection control. These wellswere permeabilized and incubated with CD4 antibody tolabel all CD4-positive vesicles.
We acquired z-stacks (0.5 mm optical increment) through-out the whole cell thickness in a Leica confocal microscope.A person blinded to the cell genotype and time of stimulationcounted the number of vesicles in each cell. We normalizedvesicle numbers to the non-stimulated transfection controlcells. We assessed statistical significance using Student’st-tests. The experiment was repeated three times with similarresults.
Cell death assay
To assess cell death induced by expression of our huntingtinconstructs, we stained cell cultures with propidium iodide(PI) and annexin V-FITC (Invitrogen). In brief, werinsed cells once in PBS before a 30 min incubation in PI(1 mg/ml) at 378C. After the PI, we rinsed cells once inPBS, once in annexin V-binding buffer (Invitrogen) prior toa 15 min incubation in annexin V-FITC (Invitrogen) at RT.We then rinsed cells again in annexin V-binding bufferbefore fixation in 4% PFA for 20 min at RT. After fixation,we rinsed cells twice and stained with DAPI (Sigma) for15 min at RT. We photographed random areas of cells, anda person blinded to the genotypes counted the annexin Vand PI positive or double-positive cells in the images. Weused DAPI to assess the total cell number. We performedfive independent experiments with similar results.
Immunoprecipitation
For mass spectrometry. We cultured INS-1 cells as described,rinsed in PBS and harvested in homogenization buffer [4 mM
HEPES, pH 7.4, 2 mM EDTA, 1% protease inhibitor cocktail(Sigma P8340)]. We sonicated the cells on ice and spunthem at 1000g for 10 min. We determined the protein concen-tration using a Pierce BCA protein assay and used the
supernatant for IP. For mass spectrometry, we rinsed 500 mlprotein A bead slurry (Millipore 16–125) in PBS and incu-bated it rotating with 50 ml rabbit HA antibody for 1 h atRT. We then bound the antibodies covalently to the beadsby incubation in 20 mM dimethyl-pimelimidate (Sigma) in200 mM triethanolamine, pH 8.5, for 30 min at RT. Afterrinses in 200 mM monoethanolamine, pH 8.5, we rinsed thebeads in IP buffer (1% Triton X-100, 0.1 M PBS, pH 7.4,10 mM beta-glycerol phosphate, 10 mM sodium fluoride,7 mM sodium pyrophosphate, 10 mM EDTA, 400 mM sodiumorthovanadate, 20 nM okadaic acid) and transferred them toPoly-Prep chromatography columns (BioRad, 731–1550).We incubated the beads, rotating with 10 mg of INS-1 cellprotein overnight at 48C. We then rinsed the beads in IPbuffer before the elution of the bound protein in PBS withincreasing NaCl concentrations (0.5–2.5 M) and finally100 mM glycine, pH 2.7. We precipitated the eluted proteinin ethanol before dissolving it in �2 Laemmli buffer (0.33 M
Tris–HCl, pH 6.8, 20% sucrose, 6% SDS, 0.1% bromphenolblue and 3% beta-mecaptoethanol). We separated the proteineluates on 12.5% acrylamide gels, after which we stainedthe gels using the blue silver Coomassie method (30).
For immunoblotting. We prepared INS-1 cell samples asdescribed and incubated 500 mg of cell lysate with primaryantibody against HA (ab 9110), kinesin heavy chain (H1 orH2) or kinesin light chain (63–90) overnight at 48C. Afterwe had captured the antibodies using protein A beads (Milli-pore), we carefully rinsed the beads/antibodies in IP-buffer,followed by increasing concentrations of saline as describedearlier. When precipitating the kinesins, we omitted the saltwashes. We used beads without primary antibody as negativecontrol. We separated the eluted proteins by SDS–PAGE, fol-lowed by blotting onto Hybond-P PVDF membranes (GEHealthcare). We incubated membranes in rabbit-HA (abcam9110, 1 : 4000), rabbit b-tubulin (abcam 6046, 1 : 1000),mouse a-tubulin (abcam 7291, 1 : 1000), mouse-kinesinheavy chain (H1, 1 : 1000; kind gift from Dr S. Brady), mouse-kinesin heavy chain (H2, 1 : 1000; Dr S. Brady) or mouse-kinesin light chain (63–90, 1 : 1000; Dr S. Brady). We usedHRP-conjugated secondary antibodies against mouse orrabbit heavy chains (NA931 or NA934, GE Healthcare,1 : 20 000), or in the case of b-tubulin detection, rabbit lightchain-specific secondary (211-032-171, Jackson; 1 : 10 000).We detected the signal using ECL Plus and Hyperfilm ECL-films (RPN2132 and RPN2103K, GE Healthcare).
Sample preparation for MALDI-TOF MS
We excised Coomassie-stained bands on SDS–PAGE gels andwashed extensively using 40% acetonitrile in 25 mM
NH4HCO3, pH 7.8. After washing, we dried the gel piecesin a SpeedVac before digestion overnight at 378C using 50–100 ng of sequencing grade trypsin (Promega) in 25 mM
NH4HCO3, pH 7.8. We terminated the digestion by theaddition of 2 ml 2% TFA, which also extracted the peptidesout of the gel. After 1 h extraction at RT, we purified peptidesfrom buffer using miniaturized reversed-phase tips (31). Weeluted purified peptides directly onto the sample target.The matrix 2,5-dihydroxybenzoic acid was used on
3952 Human Molecular Genetics, 2009, Vol. 18, No. 20
Dow
nloaded from https://academ
ic.oup.com/hm
g/article/18/20/3942/647591 by guest on 02 January 2022
AnchorchipTM targets (Bruker Daltonik), increasing the sensi-tivity (32).
Mass spectrometry
We identified samples with mass spectrometric studies using aReflex III MALDI-TOF mass spectrometer (Bruker). Theinstrument was used in the positive ion mode with delayedextraction and an acceleration voltage of 26 kV. We analyzedpeptide samples using accumulation of 50–150 single-shotspectra for improved signal-to-noise ratio. Trypsin autolysispeaks were used for internal calibration. We used theprogram ProFound (huntingtinp://prowl.rockefeller.edu/prowl-cgi/profound.exe) for identifying proteins in the NCBIdatabase.
In situ proximity ligation assay
For methodological background, see Soderberg et al. (33). Inbrief, we immunostained cells as described earlier, usingmouse-kinesin heavy chain (H1, 1 : 1000; Dr S. Brady) ormouse-kinesin light chain (63-90, 1 : 1000; Dr S. Brady)with rabbit-HA (ab9110, 1 : 4000; Abcam) and guinea pig-proinsulin (ab 9003, 1 : 2500; Eurodiagnostica). Instead of flu-orescent secondary antibodies, to verify a close co-localizationof proteins, we used an anti-rabbit, anti-mouse duolink in situproximity ligation assay (PLA) kit (Olink Biosciences)according to the manufacturer’s protocol. After the detectionof interacting proteins, we counterstained the cells with Cy-2anti-guinea pig secondary antibody (Jackson Immuno-Research, Inc.) and DAPI (Chemicon). We captured theimages of cells at �100 magnification in an Olympus epifluor-escence microscope.
Microtubule polymerization assay
Forty-eight hours after viral transduction in multi-well plates,we cultured cells in media containing nocodazole (5 mg/ml,Sigma-Aldrich) for 1 h to depolymerize microtubules. Wethen washed cells with 378C PBS and cultured the cells innormal medium or medium containing 100 nM paclitaxel(Sigma-Aldrich) for 15 or 30 min. After washing in warmPBS, we lysed the cells in 20 mM Tris–HCl (pH 8.6), 1 mM
MgCl2, 2 mM EGTA, 1� PIC, 1 mM orthovanadate and0.5% Nonidet P-40. We centrifuged lysates at 9168g topellet polymerized microtubules. We then measured theamount of soluble and polymerized b-tubulin by separatingsupernatants and pellets, respectively, by SDS–PAGE fol-lowed by western blotting. Samples from untreated cells(pre) or cells just treated with nocodazole (0) were used ascontrols.
Statistics
We used Mann–Whitney U tests, where group sizes werelimited (n , 8) or results not normally distributed; t-tests(two-tailed) were used for larger normally distributedgroups. Wilcoxon’s signed rank test was used for assessingsignificance in the insulin secretion assay. Repeated-measuresANOVA was used to address statistical significance in
samples where repeated measures were used. We consideredstatistical significance reached when P , 0.05.
ACKNOWLEDGEMENTS
We are very grateful for technical assistance from Britt Lind-berg, Birgit Haraldsson, Lina Gefors, Ann-Kristin Holmen-Palbrink and Dr Eric Carlemalm. We would like to thank DrKay Simons for supplying us with the VSVG-YFP construct,Dr Frederic Saudou for making the huntingtin constructs avail-able to us, Dr Seiji Torii and Dr Toshiyuki Takeuchi for pro-viding us with the phogrin antibody and CD4-phogrinconstruct, Dr Scott Brady and Dr Gerardo Morfini for provid-ing kinesin antibodies and important intellectual inputs. Weare thankful for rewarding discussions within and supportfrom NeuroFortis, NeuroNE and the Nordic Center of Excel-lence on Molecular Mechanisms of Neurodegeneration.
Conflict of Interest statement. None declared.
FUNDING
This work was financed by the Swedish Research Council, theSwedish Society for Medicine, the Crafoord Foundation, theHedlund Foundation, the Greta and Johan Kock Foundationand the Segerfalk Foundation.
REFERENCES
1. Podolsky, S., Leopold, N.A. and Sax, D.S. (1972) Increased frequency ofdiabetes mellitus in patients with Huntington’s chorea. Lancet, 1, 1356–1358.
2. Farrer, L.A. (1985) Diabetes mellitus in Huntington disease. Clin. Genet.,27, 62–67.
3. Colin, E., Zala, D., Liot, G., Rangone, H., Borrell-Pages, M., Li, X.J.,Saudou, F. and Humbert, S. (2008) Huntingtin phosphorylation acts as amolecular switch for anterograde/retrograde transport in neurons. EMBOJ., 27, 2124–2134.
4. Zala, D., Colin, E., Rangone, H., Liot, G., Humbert, S. and Saudou, F.(2008) Phosphorylation of mutant huntingtin at S421 restores anterogradeand retrograde transport in neurons. Hum. Mol. Genet., 17, 3837–3846.
5. Caviston, J.P., Ross, J.L., Antony, S.M., Tokito, M. and Holzbaur, E.L.(2007) Huntingtin facilitates dynein/dynactin-mediated vesicle transport.Proc. Natl Acad. Sci. USA, 104, 10045–10050.
6. Engelender, S., Sharp, A.H., Colomer, V., Tokito, M.K., Lanahan, A.,Worley, P., Holzbaur, E.L. and Ross, C.A. (1997) Huntingtin-associatedprotein 1 (HAP1) interacts with the p150Glued subunit of dynactin. Hum.Mol. Genet., 6, 2205–2212.
7. Li, S.H., Gutekunst, C.A., Hersch, S.M. and Li, X.J. (1998) Interaction ofhuntingtin-associated protein with dynactin P150Glued. J. Neurosci., 18,1261–1269.
8. McGuire, J.R., Rong, J., Li, S.H. and Li, X.J. (2006) Interaction ofHuntingtin-associated protein-1 with kinesin light chain: implications inintracellular trafficking in neurons. J. Biol. Chem., 281, 3552–3559.
9. Gutekunst, C.A., Levey, A.I., Heilman, C.J., Whaley, W.L., Yi, H., Nash,N.R., Rees, H.D., Madden, J.J. and Hersch, S.M. (1995) Identification andlocalization of huntingtin in brain and human lymphoblastoid cell lineswith anti-fusion protein antibodies. Proc. Natl Acad. Sci. USA, 92, 8710–8714.
10. Hoffner, G., Kahlem, P. and Djian, P. (2002) Perinuclear localization ofhuntingtin as a consequence of its binding to microtubules through aninteraction with beta-tubulin: relevance to Huntington’s disease. J. Cell.Sci., 115, 941–948.
11. del Toro, D., Canals, J.M., Gines, S., Kojima, M., Egea, G. and Alberch, J.(2006) Mutant huntingtin impairs the post-Golgi trafficking of
Human Molecular Genetics, 2009, Vol. 18, No. 20 3953
Dow
nloaded from https://academ
ic.oup.com/hm
g/article/18/20/3942/647591 by guest on 02 January 2022
brain-derived neurotrophic factor but not its Val66Met polymorphism.J. Neurosci., 26, 12748–12757.
12. Gauthier, L.R., Charrin, B.C., Borrell-Pages, M., Dompierre, J.P.,Rangone, H., Cordelieres, F.P., De Mey, J., MacDonald, M.E., Lessmann,V., Humbert, S. et al. (2004) Huntingtin controls neurotrophic support andsurvival of neurons by enhancing BDNF vesicular transport alongmicrotubules. Cell, 118, 127–138.
13. Gunawardena, S., Her, L.S., Brusch, R.G., Laymon, R.A., Niesman, I.R.,Gordesky-Gold, B., Sintasath, L., Bonini, N.M. and Goldstein, L.S. (2003)Disruption of axonal transport by loss of huntingtin or expression ofpathogenic polyQ proteins in Drosophila. Neuron, 40, 25–40.
14. Szebenyi, G., Morfini, G.A., Babcock, A., Gould, M., Selkoe, K.,Stenoien, D.L., Young, M., Faber, P.W., MacDonald, M.E., McPhaul,M.J. et al. (2003) Neuropathogenic forms of huntingtin and androgenreceptor inhibit fast axonal transport. Neuron, 40, 41–52.
15. Trushina, E., Dyer, R.B., Badger, J.D. II, Ure, D., Eide, L., Tran, D.D.,Vrieze, B.T., Legendre-Guillemin, V., McPherson, P.S., Mandavilli, B.S.et al. (2004) Mutant huntingtin impairs axonal trafficking in mammalianneurons in vivo and in vitro. Mol. Cell. Biol., 24, 8195–8209.
16. Mangiarini, L., Sathasivam, K., Seller, M., Cozens, B., Harper, A.,Hetherington, C., Lawton, M., Trottier, Y., Lehrach, H., Davies, S.W.et al. (1996) Exon 1 of the HD gene with an expanded CAG repeat issufficient to cause a progressive neurological phenotype in transgenicmice. Cell, 87, 493–506.
17. Bjorkqvist, M., Fex, M., Renstrom, E., Wierup, N., Petersen, A., Gil, J.,Bacos, K., Popovic, N., Li, J.Y., Sundler, F. et al. (2005) The R6/2transgenic mouse model of Huntington’s disease develops diabetes dueto deficient beta-cell mass and exocytosis. Hum. Mol. Genet., 14,565–574.
18. Andreassen, O.A., Dedeoglu, A., Stanojevic, V., Hughes, D.B., Browne,S.E., Leech, C.A., Ferrante, R.J., Habener, J.F., Beal, M.F. and Thomas,M.K. (2002) Huntington’s disease of the endocrine pancreas: insulindeficiency and diabetes mellitus due to impaired insulin gene expression.Neurobiol. Dis., 11, 410–424.
19. Toomre, D., Keller, P., White, J., Olivo, J.C. and Simons, K. (1999)Dual-color visualization of trans-Golgi network to plasma membranetraffic along microtubules in living cells. J. Cell. Sci., 112, 21–33.
20. Rorsman, P., Eliasson, L., Renstrom, E., Gromada, J., Barg, S. and Gopel,S. (2000) The cell physiology of biphasic insulin secretion. News Physiol.
Sci., 15, 72–77.
21. Torii, S., Saito, N., Kawano, A., Zhao, S., Izumi, T. and Takeuchi, T.(2005) Cytoplasmic transport signal is involved in phogrin targeting andlocalization to secretory granules. Traffic, 6, 1213–1224.
22. Ivarsson, R., Obermuller, S., Rutter, G.A., Galvanovskis, J. and Renstrom,E. (2004) Temperature-sensitive random insulin granule diffusion is aprerequisite for recruiting granules for release. Traffic, 5, 750–762.
23. Morfini, G., Pigino, G., Szebenyi, G., You, Y., Pollema, S. and Brady,S.T. (2006) JNK mediates pathogenic effects of polyglutamine-expandedandrogen receptor on fast axonal transport. Nat. Neurosci., 9, 907–916.
24. Donelan, M.J., Morfini, G., Julyan, R., Sommers, S., Hays, L., Kajio, H.,Briaud, I., Easom, R.A., Molkentin, J.D., Brady, S.T. et al. (2002)Ca2þ-dependent dephosphorylation of kinesin heavy chain onbeta-granules in pancreatic beta-cells. Implications for regulatedbeta-granule transport and insulin exocytosis. J. Biol. Chem., 277, 24232–24242.
25. Sinadinos, C., Burbidge-King, T., Soh, D., Thompson, L.M., Marsh, J.L.,Wyttenbach, A. and Mudher, A.K. (2009) Live axonal transport disruptionby mutant huntingtin fragments in Drosophila motor neuron axons.Neurobiol. Dis., 34, 389–395.
26. Hohmeier, H.E., Mulder, H., Chen, G., Henkel-Rieger, R., Prentki, M. andNewgard, C.B. (2000) Isolation of INS-1-derived cell lines with robustATP-sensitive Kþ channel-dependent and -independentglucose-stimulated insulin secretion. Diabetes, 49, 424–430.
27. Armbruster, B.L., Carlemalm, E., Chiovetti, R., Garavito, R.M., Hobot,J.A., Kellenberger, E. and Villiger, W. (1982) Specimen preparation forelectron microscopy using low temperature embedding resins. J. Microsc.,126, 77–85.
28. Phair, R.D., Gorski, S.A. and Misteli, T. (2004) Measurement of dynamicprotein binding to chromatin in vivo, using photobleaching microscopy.Methods Enzymol., 375, 393–414.
29. Dundr, M., Hoffmann-Rohrer, U., Hu, Q., Grummt, I., Rothblum, L.I.,Phair, R.D. and Misteli, T. (2002) A kinetic framework for a mammalianRNA polymerase in vivo. Science, 298, 1623–1626.
30. Candiano, G., Bruschi, M., Musante, L., Santucci, L., Ghiggeri, G.M.,Carnemolla, B., Orecchia, P., Zardi, L. and Righetti, P.G. (2004) Bluesilver: a very sensitive colloidal Coomassie G-250 staining for proteomeanalysis. Electrophoresis, 25, 1327–1333.
31. Ishihama, Y., Rappsilber, J. and Mann, M. (2006) Modular stop and goextraction tips with stacked disks for parallel and multidimensionalpeptide fractionation in proteomics. J. Proteome Res., 5, 988–994.
32. Schuerenberg, M., Luebbert, C., Eickhoff, H., Kalkum, M., Lehrach, H.and Nordhoff, E. (2000) Prestructured MALDI-MS sample supports. Anal.Chem., 72, 3436–3442.
33. Soderberg, O., Gullberg, M., Jarvius, M., Ridderstrale, K., Leuchowius,K.J., Jarvius, J., Wester, K., Hydbring, P., Bahram, F., Larsson, L.G. et al.(2006) Direct observation of individual endogenous protein complexes insitu by proximity ligation. Nat. Methods, 3, 995–1000.
3954 Human Molecular Genetics, 2009, Vol. 18, No. 20
Dow
nloaded from https://academ
ic.oup.com/hm
g/article/18/20/3942/647591 by guest on 02 January 2022