Embed Size (px)
Citation preview
Musical Instrument Classification and DuetAnalysis Employing Music InformationRetrieval Techniques
BOZENA KOSTEK, MEMBER, IEEE
Invited Paper
The aim of this paper is to present solutions related to iden-tifying musical data. These are discussed mainly on the basis ofexperiments carried out at the Multimedia Systems Department,Gdansk University of Technology, Gdansk, Poland. The topicspresented in this paper include automatic recognition of musicalinstruments and separation of duet sounds. The classificationprocess is shown as a three-layer process consisting of pitchextraction, parametrization, and pattern recognition. These threestages are discussed on the basis of experimental examples.Artificial neural networks (ANNs) are employed as a decisionsystem and they are trained with a set of feature vectors (FVs)extracted from musical sounds recorded at the Multimedia SystemsDepartment. The frequency envelope distribution (FED) algorithmis presented, which was introduced to musical duet separation. Forthe purpose of checking the efficiency of the FED algorithm, ANNsare also used. They are tested on FVs derived from musical soundsafter the separation process is performed. The experimental resultsare shown and discussed.
Keywords—Duet separation, MPEG-7, music informationretrieval (MIR), musical content processing, musical data manage-ment.
I. INTRODUCTION
There are many problems related to the managementof musical data that have not yet been solved. These arenow being extensively considered in the field of musicinformation retrieval (MIR) [1], [2]. Topics that should beincluded within the scope of this discussion include theproblem of automatically classifying musical instrument
Manuscript received February 4, 2003; revised November 10, 2003. Thiswork is supported in part by the Committee for Scientific Research, Warsaw,Poland, under Grant 4 T11D 014 22 and in part by the Foundation for PolishScience.
The author is with the Department of Multimedia Systems,Faculty of Electronics Telecommunications and Informatics,Gdansk University of Technology, Gdansk 80-952, Poland (e-mail:[email protected]).
Digital Object Identifier 10.1109/JPROC.2004.825903
sounds and musical phrases/styles, music representation andindexing, estimating similarity of music using both percep-tual and musicology criteria, problems of recognizing musicusing audio or semantic description, building up musicaldatabases, evaluation of MIR systems, intellectual propertyright issues, user interfaces, issues related to musical stylesand genres, language modeling for music, user needs andexpectations, auditory scene analysis, gesture control overmusical works, and others. Some of topics contained withinthe notion of MIR are covered by the MPEG-7 standard[3]–[5], which defines description of the multimedia contentin order to support better interpretation of information. Itshould be stressed that solving these problems needs humanassistance and management. These issues will be explainedfurther on.
One of the aims of this paper is to show examples ofMIR domain applications, namely, automatic recognitionof musical instruments and separation of musical duets.Together they resulted from the experiments conductedfor several years in the Multimedia Systems Department,Gdansk University of Technology, Gdansk, Poland. Thefirst mentioned process consists of several stages, such aspreprocessing, feature extraction, and classification. Thepreprocessing stage is needed to estimate musical soundpitch. The feature extraction changes redundant informationcontained in the signal into descriptors. The main stage isthe classification process, which can be executed based onvarious techniques, both statistical and soft computing.
For the purpose of the study conducted, a database ofmusical instrument sounds engineered earlier at the Multi-media Systems Department was adopted. This database is amultimedia application containing information on musicalinstruments, along with sound analyses. It encompassessound samples of the whole musical scale of individual in-struments and exemplary musical phrases played by a giveninstrument, time- and frequency-domain representation ofsounds, tables containing sound parameter values, program
0018-9219/04$20.00 © 2004 IEEE
712 PROCEEDINGS OF THE IEEE, VOL. 92, NO. 4, APRIL 2004
help, the possibility of creating various kinds of chartsand printed reports for all parameters, Structured QueryLanguage (SQL)-based query, descriptive informationconcerning the SQL-based help, and selected HTML linkpages.
The separation of musical duets requires a more complexapproach in comparison to the recognition of musical in-strument classes based on monophonic sound samples [6],[7]. The proposed technique for the decomposition of duetsounds is based on the modified frequency envelope distri-bution (FED) analysis. The recently introduced FED algo-rithm decomposes signal into linear expansion of waveforms,called envelope modulated oscillations (EMOs), providing acombination of complex exponential signals modulated bycomplex amplitude envelopes. These waveforms are chosento best match the harmonic parts of the signal; however, non-harmonic structures can also be represented by EMOs. Thefirst step of the engineered algorithm is the estimation ofthe fundamental frequency of the lower pitched instrument.Pitch estimation is carried out in block processing. The inputsignal is divided into short overlapping blocks, and pitchis estimated for each block separately, to deliver the pitchcontour signal (PCS). Then harmonics of the second soundare searched for in the residual signal. Therefore, in this ap-proach based on the FED algorithm, the multipitch detec-tion is not needed. Results of the performed experiments areshown in the following sections.
The experiments described in the paper show only someof the applications related to management of musical data.It would be very valuable if the reader of this paper wouldrefer to the rich literature related to these topics, examplesof which are given in [8]–[29]. More detailed description ofsome of the topics mentioned is available through the citedauthor and her team’s papers.
II. EXPERT KNOWLEDGE IN MIR SYSTEMS
In the theory of information introduced by Shannon, in-formation is discussed in terms of quantity. It is assumed thatinformation reduces uncertainty on the basis of knowledge ofa priori probabilities. This theory serves well when dealingwith well-specified problems of data transmission and com-munication; however, it can be observed that information isnot a notion of content and furthermore of knowledge [30].In the knowledge discovery and data management, human as-sistance is needed. Decision systems may produce numerousrules generated in the mining process. This makes it neces-sary to provide for postprocessing the generated rules. An-other problem which needs attention is processing unknownor missing attribute values when acquiring knowledge fromdatabases. Real data usually contain a certain percentage ofmissing values. Even the choice of attributes is not an arbi-trary process. When preparing a format description, eithera numerical or a categorical one, it is done on the basis ofunderstanding of the problem domain. Information retrievalsystems are presupposed to do exact matches of documentsinvolving the same cues to the user query. However, opera-tions which are behind the query do not always provide goodresponses to the user’s interest. To improve information re-trieval quality, various strategies were proposed and used,
such as probabilistic, vector space, clustering, and intelligentretrieval. The latter technique often uses concept analysis re-quiring semantic calculations.
The MPEG-7 standard refers to metadata informationcontained in the Internet archives. This notion is veryoften applied to the value-added information created todescribe and track objects, and to allow access to thoseinformation objects [31]. In this context, descriptors thatare well defined allow for better computing, and improveduser interfacing and data management. In the context of theMPEG-7 standard, higher level information is defined astextual information on audio such as titles of songs, signers’names, composers’ names, duration of music excerpt,etc. One should keep in mind the fact that music can bedescribed in a number of ways, and the musical soundsinclude polyphonic sounds and human voice sounds (speechand singing). A musical signal, music, scores (graphicalform), MIDI code, or verbal description each comes asa different representation. Provided within the MPEG-7standard are also low-level descriptors for musical data,organized in groups of parameters such as timbral temporal,basic spectral, basic, timbral spectral, spectral basis, andsignal parameters [3]. The so-called audio framework thatcontains all these parameter groups includes 17 vector andscalar quantities. They represent log(attack time), temporalcentroid, audio spectrum envelope, audio spectrum centroid,audio spectrum spread, audio spectrum flatness, audiowaveform and power, harmonic spectral centroid, harmonicspectral deviation, harmonic spectral spread, harmonicspectral variation, spectral centroid, audio spectrum basis,audio spectrum projection, audio harmonicity, and audiofundamental frequency [3], [4]. These low-level descriptorsprovide information for higher-level application, namely,sound recognition, musical instrument timbre similarity,melody and melodic contour recognition, robust audiomatching, and spoken content recognition. It can easily beobserved that these low-level descriptors are more data ori-ented than human oriented. This is because the idea behindthis standard is to have data defined and linked in such a wayas to be able to use it for more effective automatic discovery,integration, and reuse in various applications. The mostambitious task is, however, to provide seamless meaning tolow- and high-level descriptors. In such a way data can beprocessed and shared by both systems and people.
It seems there exists a way to change primitives intohigher abstraction level, namely, semantics. Assessingtimbre or quality of musical instrument sounds, humans usecriteria that are rarely quantitative but most often qualitative.Therefore, there is a need to find methods that make itpossible to find a relationship between objectively extractedinformation from sound and subjective notions of timbre.Especially interesting seems a “computing with words”concept introduced by Zadeh [32], [33], which refers to thefact that humans employ words in computing and reasoning,arriving at conclusions expressed as words from premisesexpressed in a natural language. Computing with wordscan be a necessity when the available information is tooimprecise to justify the use of numbers and can be justifiedwhen it is in a better rapport with reality. It seems that this
KOSTEK: MUSICAL INSTRUMENT CLASSIFICATION AND DUET ANALYSIS EMPLOYING MUSIC INFORMATION RETRIEVAL TECHNIQUES 713
new paradigm of computing can be used with success inMIR by offering better processing of subjective descriptorsof musical instrument sounds and enabling the analysis ofdata that would result in a new way of describing musicalinstrument sounds. An example of such processing wasrecently introduced by the author [34]. It was proposed thatcategorical notions would be quantities partitioned usingfuzzy logic.
One can name such parameters both subjective andobjective ones such as pitch (frequency in hertz or barks),brightness (spectral centroid), tone/noise-like quality(spectral flatness measure), attack asymmetry (skewness),overshoot or inharmonicity (log ratio of the first harmonicto second harmonic or, more generally, higher frequencyharmonics to the fundamental frequency ratio), vibrato(periodic fluctuation of pitch), tremolo (periodic changeof sound level), nasality (formants’ position if they exist),synchronicity (delay of higher harmonics with relation tothe fundamental during the attack), etc., that have doubleinterpretation. The relationship between the objectivelymeasured parameters of musical instrument sounds and theirsubjective quality can be assessed by listeners in subjectivelistening tests. The subject’s task is to assign ranges to suchparameters and to associate presented stimuli with a set ofsemantic scales. In further analysis, in order to secure bettergeneralization properties, it was thought that processingshould be based on learning algorithms.
It may be observed that musical object classification usinglearning algorithms mimics the way of human reasoning.These algorithms are especially valuable in domains in whichthere is a problem of imprecision and a need of knowledgemining; thus, they are a way to handle uncertainties in mu-sical data. Such algorithms often need human supervisorycontrol. This remark refers both to rule-based systems andneural networks (NNs) in which an expert controls the algo-rithm settings and the choice of feature vectors (FVs). Theapproach mentioned is still at the experimental stage [34];thus, here this idea was only roughly presented.
III. AUTOMATIC CLASSIFICATION OF MUSICAL
INSTRUMENTS
Automatic classification of musical instruments cangenerally be viewed as a three-layer process. The first layerconsists in preprocessing, which may be identified as pitchextraction. The subsequent stage of preprocessing providesinformation on frequency components. This informationwill then be used in the parametrization, which presentsthe second layer in the automatic classification process.Parametrization provides data on musical sounds in the formof FVs. Fundamental frequency and its harmonics allowfor calculation of numerous parameters. The FVs are thenused in the pattern recognition, which is the last layer in theautomatic classification flow.
A. Preprocessing
Since the starting point of the classification process ispitch detection of a musical sound, some methods knownfrom the literature were first reviewed and then imple-mented. Pitch detection is one of the most difficult tasks in
speech and musical signals processing and has been studiedin many publications for many years. It is due to the factthat acoustic signals are nonstationary, i.e., their pitch andamplitudes of harmonics are varying in time. In many casessignificant noise disturbances are contaminating analyzedsignals, making pitch estimation even more difficult. Dueto these facts, a universal solution for the problem doesnot seem to exist, and pitch detection algorithms (PDAs)vary often in accordance to different requirements andapplications. An even more difficult problem is the case ofpitch tracking in polyphonic music. It is worth noticing thatgenerally such procedures are called PDAs, even if they aimat extracting a signal-related physical variable such as thefundamental frequency and not the perceptual notion suchas pitch. Also, the error estimation is often calculated usinga semitone precision.
For the purpose of pitch extraction, it is possible to usespectral estimation procedures such as parametric and/ornonparametric ones. Other numerous methods operate ontime, frequency, cepstral, and time-frequency domains.Among others, the autocorrelation, Schroeder’s histogram,cepstral, zero crossing (ZXABE), threshold crossing(TABE), two-threshold crossing (TTABE), or averagemagnitude difference function (AMDF) methods can becited [18], [35]–[47]. Pitch can also be estimated using suchtime-frequency methods as subband processing based on theMeddis–Hewitt model [37], [41] and the McAulay–Quatierimethod [41].
There are two major problems, namely, octave errors andpitch estimation accuracy [38], [40], that most PDAs are sus-ceptible to. Octave error problems seem to be present in allknown pitch tracking algorithms; however, these errors arecaused by different input signal properties in the estimationprocess. In time domain-based algorithms [44]–[46] octaveerrors may result from the low energy content of odd har-monics. In the frequency domain, errors are mostly causedby the low energy content of the lower order harmonics.In cepstral [40], as well as in autocorrelation of log spec-trum (ACOLS) [48] analyses, such problems may appear dueto the high energy content in higher frequency parts of thesignal. On the other hand, the estimation accuracy problemfor all mentioned domains is caused by a limited number ofsamples representing analyzed peaks related to the funda-mental frequency.
In the study conducted here, both the AMDF method and amodified Schroeder’s histogram were implemented and fur-ther analyzed. The AMDF method was chosen because ofits relatively low computational cost. On the other hand, theSchroeder’s method may be used in cases where some har-monics are missing or are not properly extracted, becauseon the basis of the statistical properties of the histogram, itis still possible to determine the most probable fundamentalfrequency. That is why both these algorithms may be usedfor large musical database analyses.
The AMDF method consists of searching the zeros of thefollowing function:
(1)
714 PROCEEDINGS OF THE IEEE, VOL. 92, NO. 4, APRIL 2004
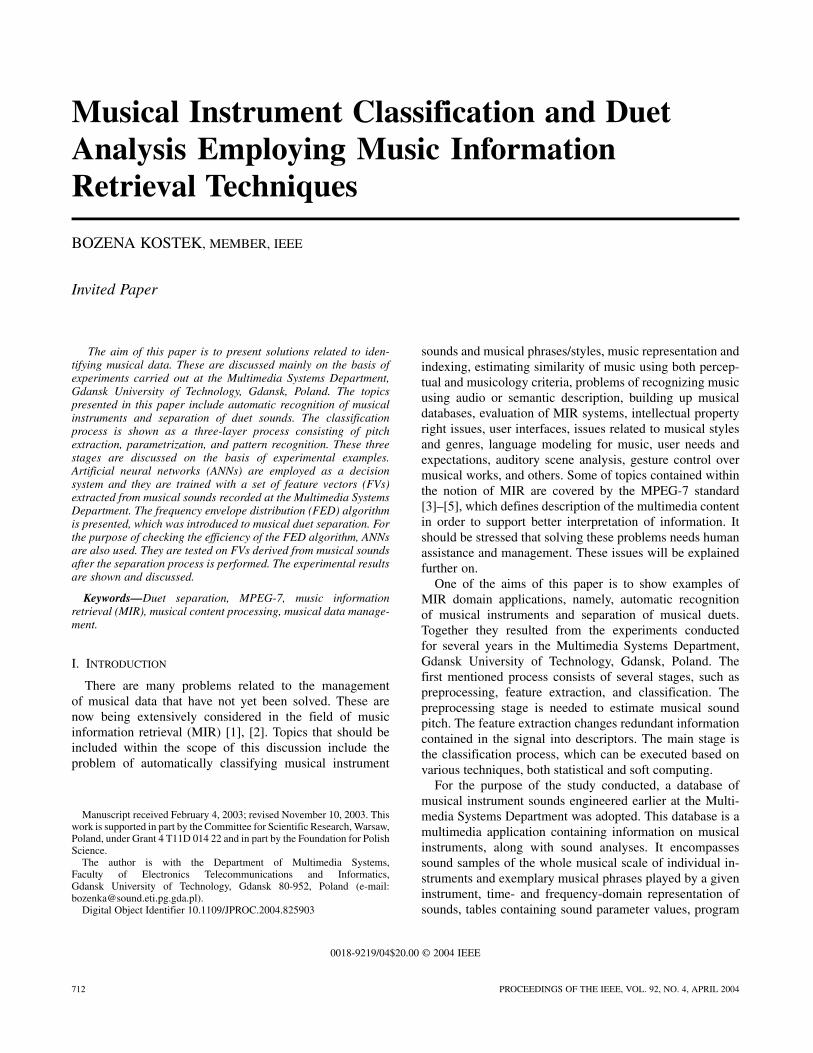
Fig. 1. Pitch detection performed for oboe sounds by: (a) the AMDF algorithm and (b) Schroeder’shistogram.
where is length of the analysis window, and repre-sents the analyzed sound.
In the case of quasi-periodic sound, this method does notsecure a proper calculation of zeros. However, the estimationprocess can be carried out with sufficient quality providedthat the search will be for the local minima of this function.
The AMDF method detects the fundamental frequencyquite efficiently, whereas the second method is susceptibleto octave errors. Generally, Schroeder’s algorithm consistsin building a histogram over the signal spectrum. For eachpeak, all its potential fundamentals are noted and theirlocations accumulated within the histogram. The largestpeak within the histogram is assigned to the fundamentalfrequency. The engineered algorithm consists of threemain steps. The first step is the fast Fourier transform(FFT) analysis, the second one aims at identifying soundharmonics, and the last step is the estimation of the fun-damental frequency. Apart from the standard FFT and logprocedures, the first step employs a low-pass filter (FIR) ofthe fifth order and the cutoff frequency equal to 80. Thesecond step assigns a threshold value corresponding to acertain level, above which spectrum partials are treated assignal harmonics and others are discarded. As a result ofthis operation, a spectrum consisting of partials is created.The third stage of the modified Schroeder’s PDA consistsin observation of the spectral distribution of partials. Theassignment of the threshold value was done experimentallyafter performing dozens of sound analyses.
The above-presented pitch estimation methods wereimplemented and their performance tested using numerousmusical sounds. The following instruments were used,namely, bassoon, clarinet, English horn, saxophone, French
horn, trombone, trumpet, violin, viola, and cello. In ad-dition, several representations of these instruments, i.e.,sounds played forte, mezzoforte, piano, staccato, portato,and nonlegato were employed. All files were monophonic,sampled using a 44.1-kHz sample rate and 16-b resolution.Pitch estimator performance was evaluated using the meanabsolute error
(2)
where is the estimated and is real fundamental fre-quency.
However, from the practical point of view, in the recogni-tion process, it is sufficient to estimate the pitch with semi-tone precision; therefore, the following formula was used:
(3)
where
for
for(4)
returning the percentage of correctly estimated fundamentalfrequencies with semitone precision.
In Fig. 1, an example of pitch detection process results ob-tained for oboe sounds employing AMDF and Schroeder al-gorithms can be observed. Using the AMDF algorithm, alloboe sounds of this particular articulation were properly es-timated; on the other hand, Schroeder’s histogram showedone octave error and one sound not being estimated at all. In
KOSTEK: MUSICAL INSTRUMENT CLASSIFICATION AND DUET ANALYSIS EMPLOYING MUSIC INFORMATION RETRIEVAL TECHNIQUES 715
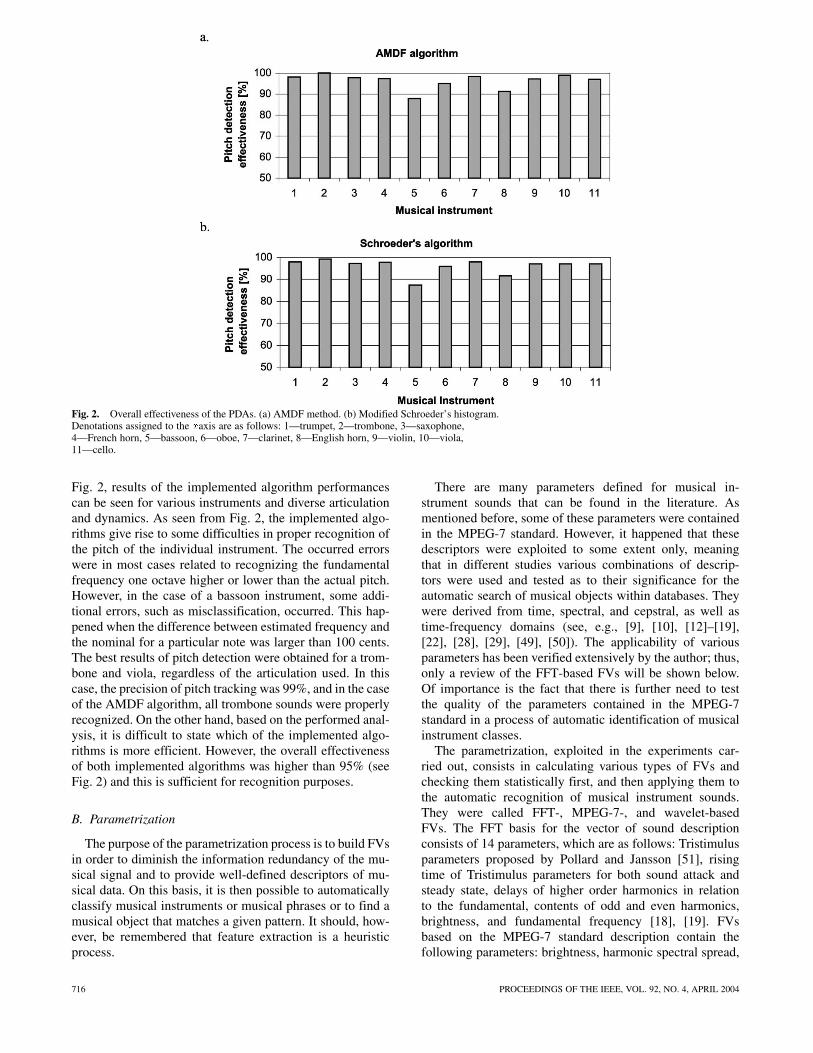
Fig. 2. Overall effectiveness of the PDAs. (a) AMDF method. (b) Modified Schroeder’s histogram.Denotations assigned to the xaxis are as follows: 1—trumpet, 2—trombone, 3—saxophone,4—French horn, 5—bassoon, 6—oboe, 7—clarinet, 8—English horn, 9—violin, 10—viola,11—cello.
Fig. 2, results of the implemented algorithm performancescan be seen for various instruments and diverse articulationand dynamics. As seen from Fig. 2, the implemented algo-rithms give rise to some difficulties in proper recognition ofthe pitch of the individual instrument. The occurred errorswere in most cases related to recognizing the fundamentalfrequency one octave higher or lower than the actual pitch.However, in the case of a bassoon instrument, some addi-tional errors, such as misclassification, occurred. This hap-pened when the difference between estimated frequency andthe nominal for a particular note was larger than 100 cents.The best results of pitch detection were obtained for a trom-bone and viola, regardless of the articulation used. In thiscase, the precision of pitch tracking was 99%, and in the caseof the AMDF algorithm, all trombone sounds were properlyrecognized. On the other hand, based on the performed anal-ysis, it is difficult to state which of the implemented algo-rithms is more efficient. However, the overall effectivenessof both implemented algorithms was higher than 95% (seeFig. 2) and this is sufficient for recognition purposes.
B. Parametrization
The purpose of the parametrization process is to build FVsin order to diminish the information redundancy of the mu-sical signal and to provide well-defined descriptors of mu-sical data. On this basis, it is then possible to automaticallyclassify musical instruments or musical phrases or to find amusical object that matches a given pattern. It should, how-ever, be remembered that feature extraction is a heuristicprocess.
There are many parameters defined for musical in-strument sounds that can be found in the literature. Asmentioned before, some of these parameters were containedin the MPEG-7 standard. However, it happened that thesedescriptors were exploited to some extent only, meaningthat in different studies various combinations of descrip-tors were used and tested as to their significance for theautomatic search of musical objects within databases. Theywere derived from time, spectral, and cepstral, as well astime-frequency domains (see, e.g., [9], [10], [12]–[19],[22], [28], [29], [49], [50]). The applicability of variousparameters has been verified extensively by the author; thus,only a review of the FFT-based FVs will be shown below.Of importance is the fact that there is further need to testthe quality of the parameters contained in the MPEG-7standard in a process of automatic identification of musicalinstrument classes.
The parametrization, exploited in the experiments car-ried out, consists in calculating various types of FVs andchecking them statistically first, and then applying them tothe automatic recognition of musical instrument sounds.They were called FFT-, MPEG-7-, and wavelet-basedFVs. The FFT basis for the vector of sound descriptionconsists of 14 parameters, which are as follows: Tristimulusparameters proposed by Pollard and Jansson [51], risingtime of Tristimulus parameters for both sound attack andsteady state, delays of higher order harmonics in relationto the fundamental, contents of odd and even harmonics,brightness, and fundamental frequency [18], [19]. FVsbased on the MPEG-7 standard description contain thefollowing parameters: brightness, harmonic spectral spread,
716 PROCEEDINGS OF THE IEEE, VOL. 92, NO. 4, APRIL 2004
harmonic spectral centroid, audio spectral flatness, attacktime, temporal centroid, fundamental frequency, and, inaddition, content of odd harmonics.
Since descriptors contained in the MPEG-7 standard andthose derived on the FFT analysis were exploited very ex-tensively and their definitions could be easily found in theliterature [4], [12], [13], [19] or in some cases, such as con-tents of odd or even harmonics, are self-explanatory; thus,only the wavelet-based FVs analysis will be discussed morethoroughly.
Wavelet Analysis: One of the main advantages ofwavelets is that they offer a simultaneous localization intime and frequency domain. This is also simply an alter-native way of describing a signal in the frequency domain.Such a description in the frequency domain provides a moreparsimonious representation than the usual one on a grid inthe time domain. In order to define features that may be de-rived from the wavelet analysis, some extensive experimentswere performed by the author and her team [18], [50], [52].Frames consisting of 2048 samples taken from the transientof a sound were analyzed. Several filters such those asproposed by Daubechies, Coifman, Haar, Meyer, Shannon,etc., were used in analyses and their order was varied fromtwo up to eight. It was found that Daubechies filters (secondorder) have the computational load considerably lower thanwhile employing other types of filters; therefore, they wereused in the analysis.
For the purpose of the study, several parameters were cal-culated. They were derived by observing both energy andtime relations within the wavelet subbands. Below, energy-related parameters are shown. They are as follows [18]:
(5)
(6)
where denotes partial energy parameters,refers to energy computed for the wavelet
spectrum subbands normalized with regard to the overallenergy of the parameterized frame corresponding tothe starting transient, where:
energy in the frequency band21.53–43.066 Hz;
energy in the frequency band43.066–86.13 Hz;
;energy in the frequency band
11 025–22 050 Hz, and are consecutive waveletcoefficients.
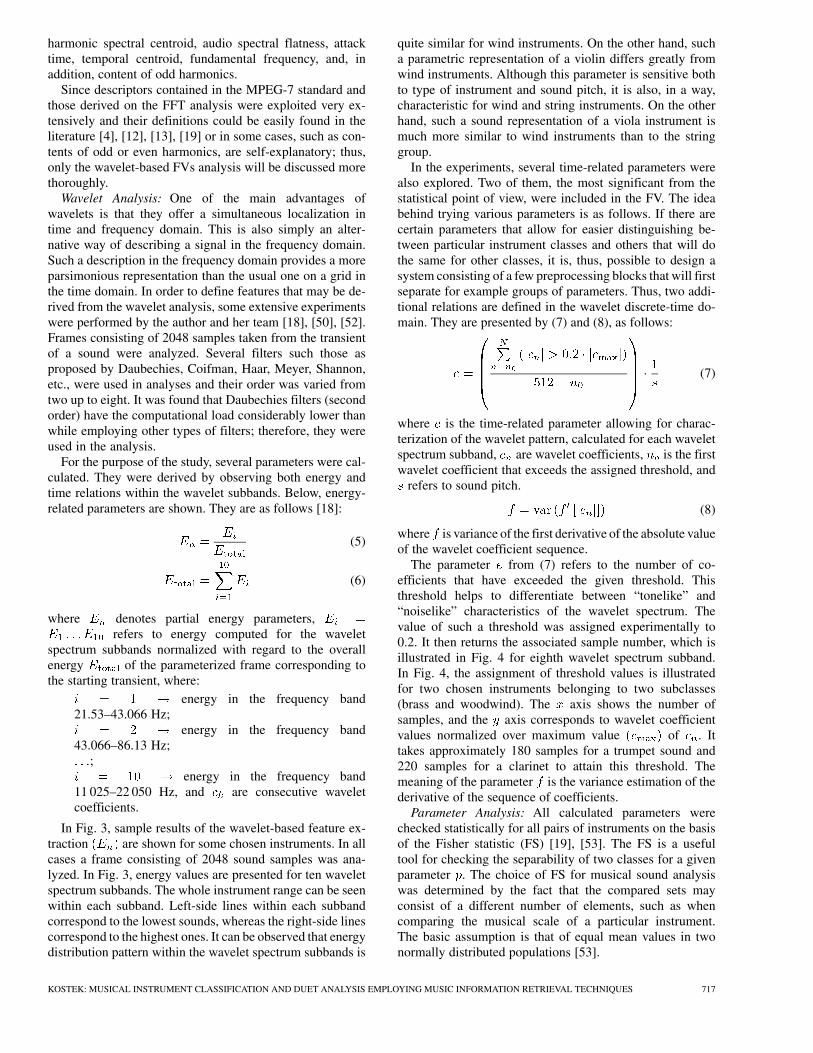
In Fig. 3, sample results of the wavelet-based feature ex-traction are shown for some chosen instruments. In allcases a frame consisting of 2048 sound samples was ana-lyzed. In Fig. 3, energy values are presented for ten waveletspectrum subbands. The whole instrument range can be seenwithin each subband. Left-side lines within each subbandcorrespond to the lowest sounds, whereas the right-side linescorrespond to the highest ones. It can be observed that energydistribution pattern within the wavelet spectrum subbands is
quite similar for wind instruments. On the other hand, sucha parametric representation of a violin differs greatly fromwind instruments. Although this parameter is sensitive bothto type of instrument and sound pitch, it is also, in a way,characteristic for wind and string instruments. On the otherhand, such a sound representation of a viola instrument ismuch more similar to wind instruments than to the stringgroup.
In the experiments, several time-related parameters werealso explored. Two of them, the most significant from thestatistical point of view, were included in the FV. The ideabehind trying various parameters is as follows. If there arecertain parameters that allow for easier distinguishing be-tween particular instrument classes and others that will dothe same for other classes, it is, thus, possible to design asystem consisting of a few preprocessing blocks that will firstseparate for example groups of parameters. Thus, two addi-tional relations are defined in the wavelet discrete-time do-main. They are presented by (7) and (8), as follows:
(7)
where is the time-related parameter allowing for charac-terization of the wavelet pattern, calculated for each waveletspectrum subband, are wavelet coefficients, is the firstwavelet coefficient that exceeds the assigned threshold, and
refers to sound pitch.
(8)
where is variance of the first derivative of the absolute valueof the wavelet coefficient sequence.
The parameter from (7) refers to the number of co-efficients that have exceeded the given threshold. Thisthreshold helps to differentiate between “tonelike” and“noiselike” characteristics of the wavelet spectrum. Thevalue of such a threshold was assigned experimentally to0.2. It then returns the associated sample number, which isillustrated in Fig. 4 for eighth wavelet spectrum subband.In Fig. 4, the assignment of threshold values is illustratedfor two chosen instruments belonging to two subclasses(brass and woodwind). The axis shows the number ofsamples, and the axis corresponds to wavelet coefficientvalues normalized over maximum value of . Ittakes approximately 180 samples for a trumpet sound and220 samples for a clarinet to attain this threshold. Themeaning of the parameter is the variance estimation of thederivative of the sequence of coefficients.
Parameter Analysis: All calculated parameters werechecked statistically for all pairs of instruments on the basisof the Fisher statistic (FS) [19], [53]. The FS is a usefultool for checking the separability of two classes for a givenparameter . The choice of FS for musical sound analysiswas determined by the fact that the compared sets mayconsist of a different number of elements, such as whencomparing the musical scale of a particular instrument.The basic assumption is that of equal mean values in twonormally distributed populations [53].
KOSTEK: MUSICAL INSTRUMENT CLASSIFICATION AND DUET ANALYSIS EMPLOYING MUSIC INFORMATION RETRIEVAL TECHNIQUES 717
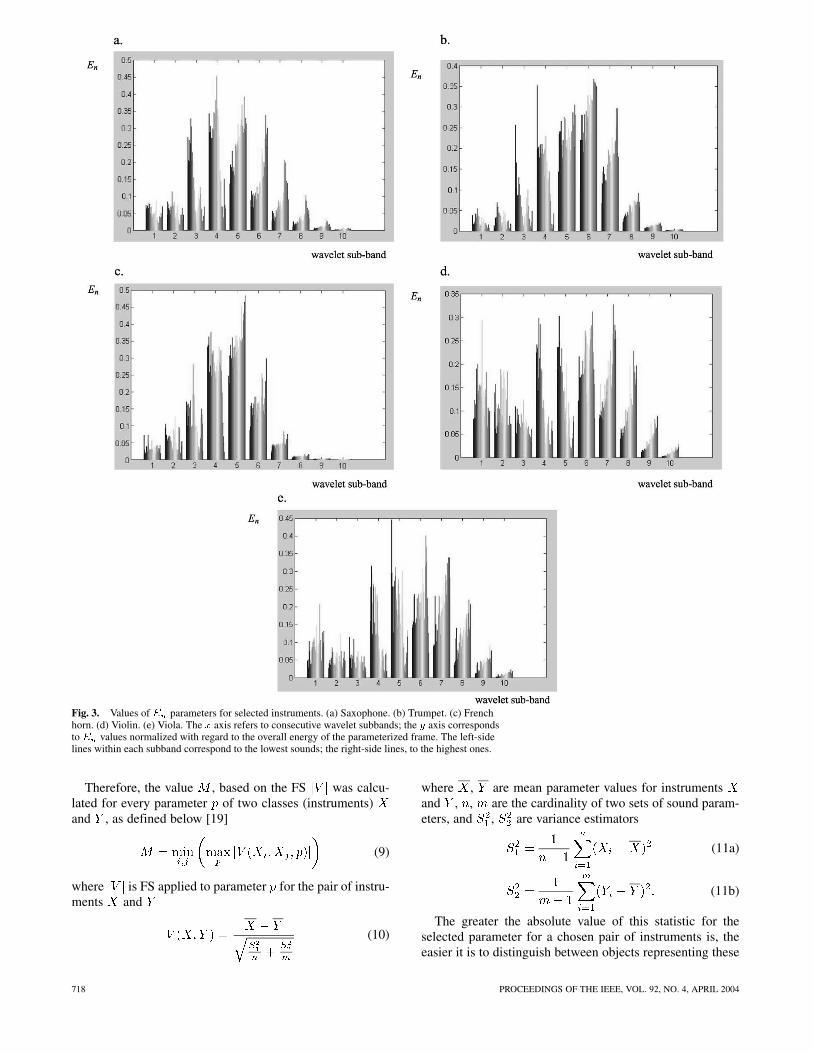
Fig. 3. Values of E parameters for selected instruments. (a) Saxophone. (b) Trumpet. (c) Frenchhorn. (d) Violin. (e) Viola. The x axis refers to consecutive wavelet subbands; the y axis correspondsto E values normalized with regard to the overall energy of the parameterized frame. The left-sidelines within each subband correspond to the lowest sounds; the right-side lines, to the highest ones.
Therefore, the value , based on the FS was calcu-lated for every parameter of two classes (instruments)and , as defined below [19]
(9)
where is FS applied to parameter for the pair of instru-ments and
(10)
where , are mean parameter values for instrumentsand , , are the cardinality of two sets of sound param-eters, and , are variance estimators
(11a)
(11b)
The greater the absolute value of this statistic for theselected parameter for a chosen pair of instruments is, theeasier it is to distinguish between objects representing these
718 PROCEEDINGS OF THE IEEE, VOL. 92, NO. 4, APRIL 2004
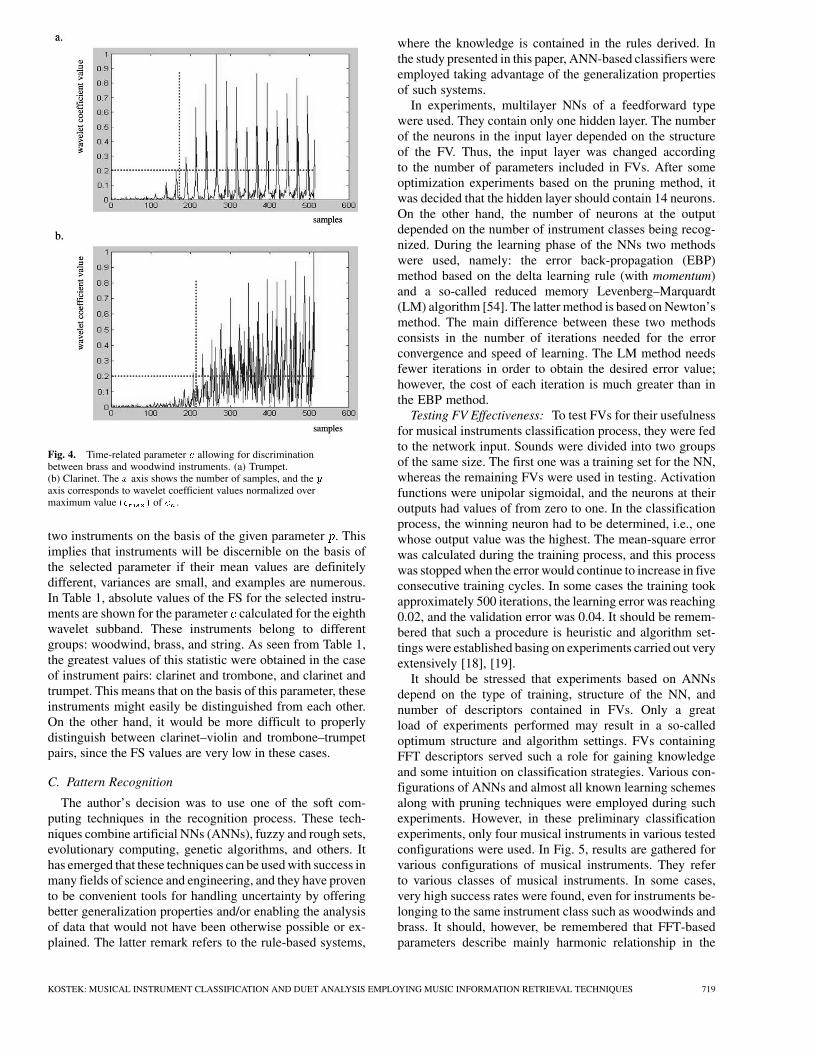
Fig. 4. Time-related parameter e allowing for discriminationbetween brass and woodwind instruments. (a) Trumpet.(b) Clarinet. The x axis shows the number of samples, and the y
axis corresponds to wavelet coefficient values normalized overmaximum value (c ) of c .
two instruments on the basis of the given parameter . Thisimplies that instruments will be discernible on the basis ofthe selected parameter if their mean values are definitelydifferent, variances are small, and examples are numerous.In Table 1, absolute values of the FS for the selected instru-ments are shown for the parameter calculated for the eighthwavelet subband. These instruments belong to differentgroups: woodwind, brass, and string. As seen from Table 1,the greatest values of this statistic were obtained in the caseof instrument pairs: clarinet and trombone, and clarinet andtrumpet. This means that on the basis of this parameter, theseinstruments might easily be distinguished from each other.On the other hand, it would be more difficult to properlydistinguish between clarinet–violin and trombone–trumpetpairs, since the FS values are very low in these cases.
C. Pattern Recognition
The author’s decision was to use one of the soft com-puting techniques in the recognition process. These tech-niques combine artificial NNs (ANNs), fuzzy and rough sets,evolutionary computing, genetic algorithms, and others. Ithas emerged that these techniques can be used with success inmany fields of science and engineering, and they have provento be convenient tools for handling uncertainty by offeringbetter generalization properties and/or enabling the analysisof data that would not have been otherwise possible or ex-plained. The latter remark refers to the rule-based systems,
where the knowledge is contained in the rules derived. Inthe study presented in this paper, ANN-based classifiers wereemployed taking advantage of the generalization propertiesof such systems.
In experiments, multilayer NNs of a feedforward typewere used. They contain only one hidden layer. The numberof the neurons in the input layer depended on the structureof the FV. Thus, the input layer was changed accordingto the number of parameters included in FVs. After someoptimization experiments based on the pruning method, itwas decided that the hidden layer should contain 14 neurons.On the other hand, the number of neurons at the outputdepended on the number of instrument classes being recog-nized. During the learning phase of the NNs two methodswere used, namely: the error back-propagation (EBP)method based on the delta learning rule (with momentum)and a so-called reduced memory Levenberg–Marquardt(LM) algorithm [54]. The latter method is based on Newton’smethod. The main difference between these two methodsconsists in the number of iterations needed for the errorconvergence and speed of learning. The LM method needsfewer iterations in order to obtain the desired error value;however, the cost of each iteration is much greater than inthe EBP method.
Testing FV Effectiveness: To test FVs for their usefulnessfor musical instruments classification process, they were fedto the network input. Sounds were divided into two groupsof the same size. The first one was a training set for the NN,whereas the remaining FVs were used in testing. Activationfunctions were unipolar sigmoidal, and the neurons at theiroutputs had values of from zero to one. In the classificationprocess, the winning neuron had to be determined, i.e., onewhose output value was the highest. The mean-square errorwas calculated during the training process, and this processwas stopped when the error would continue to increase in fiveconsecutive training cycles. In some cases the training tookapproximately 500 iterations, the learning error was reaching0.02, and the validation error was 0.04. It should be remem-bered that such a procedure is heuristic and algorithm set-tings were established basing on experiments carried out veryextensively [18], [19].
It should be stressed that experiments based on ANNsdepend on the type of training, structure of the NN, andnumber of descriptors contained in FVs. Only a greatload of experiments performed may result in a so-calledoptimum structure and algorithm settings. FVs containingFFT descriptors served such a role for gaining knowledgeand some intuition on classification strategies. Various con-figurations of ANNs and almost all known learning schemesalong with pruning techniques were employed during suchexperiments. However, in these preliminary classificationexperiments, only four musical instruments in various testedconfigurations were used. In Fig. 5, results are gathered forvarious configurations of musical instruments. They referto various classes of musical instruments. In some cases,very high success rates were found, even for instruments be-longing to the same instrument class such as woodwinds andbrass. It should, however, be remembered that FFT-basedparameters describe mainly harmonic relationship in the
KOSTEK: MUSICAL INSTRUMENT CLASSIFICATION AND DUET ANALYSIS EMPLOYING MUSIC INFORMATION RETRIEVAL TECHNIQUES 719
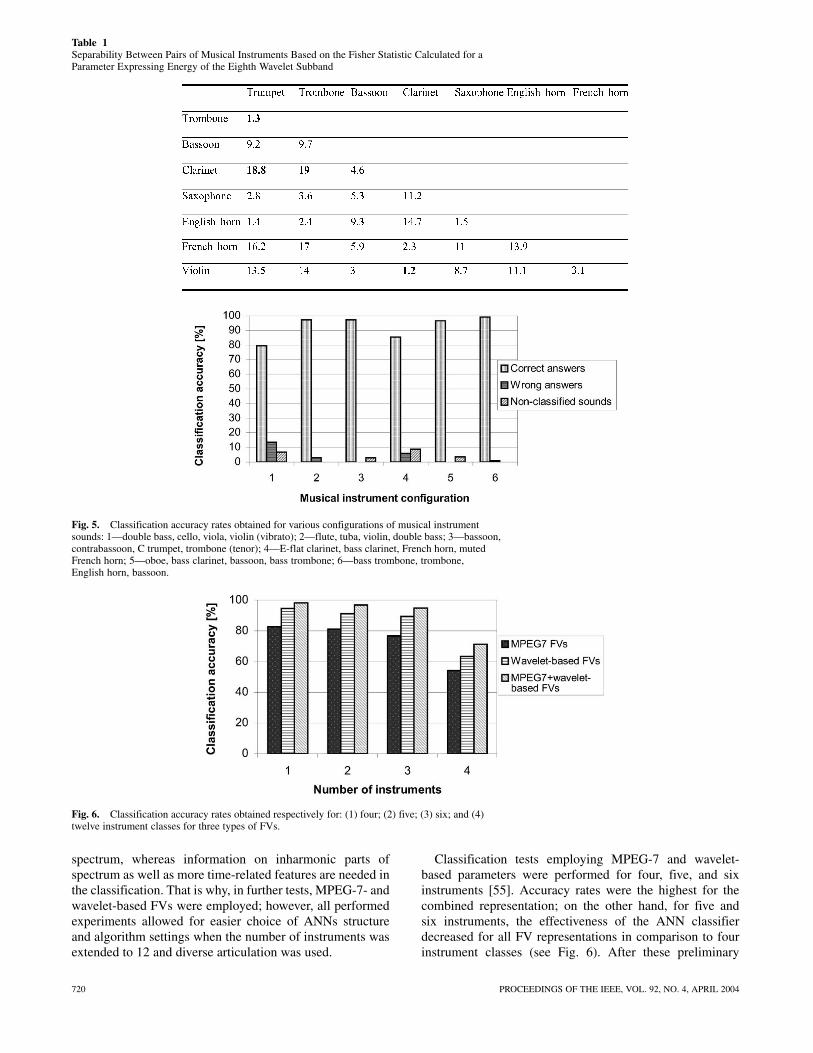
Table 1Separability Between Pairs of Musical Instruments Based on the Fisher Statistic Calculated for aParameter Expressing Energy of the Eighth Wavelet Subband
Fig. 5. Classification accuracy rates obtained for various configurations of musical instrumentsounds: 1—double bass, cello, viola, violin (vibrato); 2—flute, tuba, violin, double bass; 3—bassoon,contrabassoon, C trumpet, trombone (tenor); 4—E-flat clarinet, bass clarinet, French horn, mutedFrench horn; 5—oboe, bass clarinet, bassoon, bass trombone; 6—bass trombone, trombone,English horn, bassoon.
Fig. 6. Classification accuracy rates obtained respectively for: (1) four; (2) five; (3) six; and (4)twelve instrument classes for three types of FVs.
spectrum, whereas information on inharmonic parts ofspectrum as well as more time-related features are needed inthe classification. That is why, in further tests, MPEG-7- andwavelet-based FVs were employed; however, all performedexperiments allowed for easier choice of ANNs structureand algorithm settings when the number of instruments wasextended to 12 and diverse articulation was used.
Classification tests employing MPEG-7 and wavelet-based parameters were performed for four, five, and sixinstruments [55]. Accuracy rates were the highest for thecombined representation; on the other hand, for five andsix instruments, the effectiveness of the ANN classifierdecreased for all FV representations in comparison to fourinstrument classes (see Fig. 6). After these preliminary
720 PROCEEDINGS OF THE IEEE, VOL. 92, NO. 4, APRIL 2004
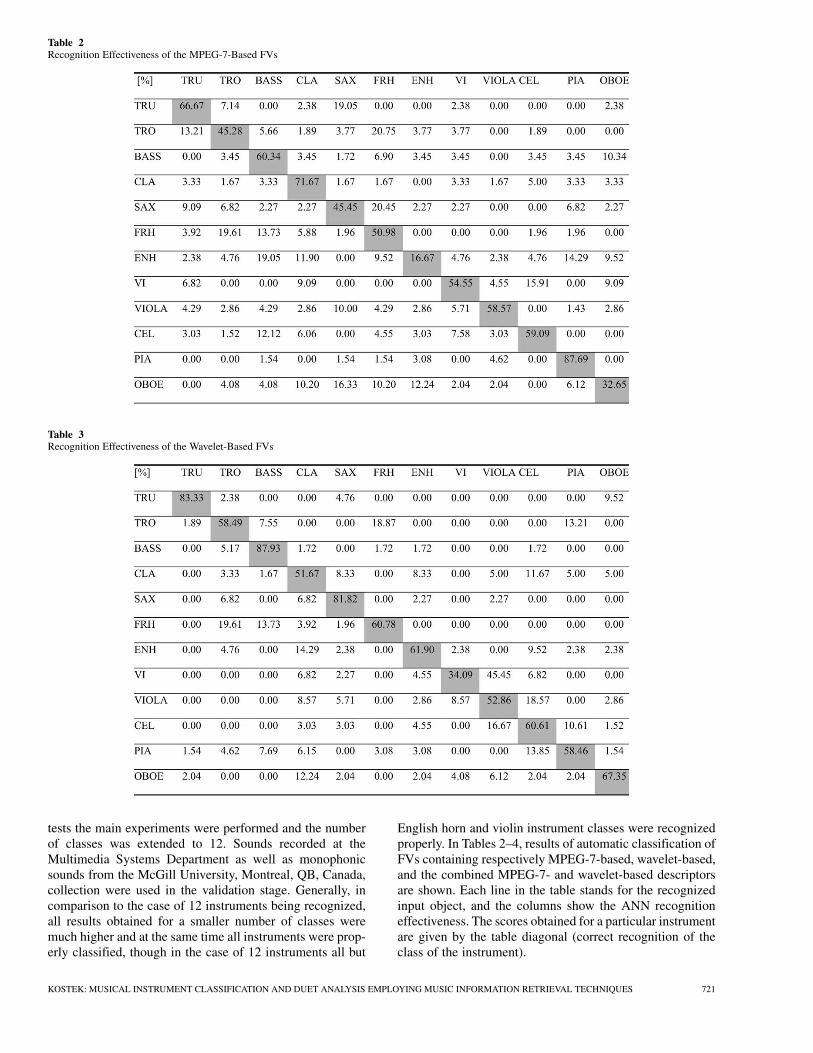
Table 2Recognition Effectiveness of the MPEG-7-Based FVs
Table 3Recognition Effectiveness of the Wavelet-Based FVs
tests the main experiments were performed and the numberof classes was extended to 12. Sounds recorded at theMultimedia Systems Department as well as monophonicsounds from the McGill University, Montreal, QB, Canada,collection were used in the validation stage. Generally, incomparison to the case of 12 instruments being recognized,all results obtained for a smaller number of classes weremuch higher and at the same time all instruments were prop-erly classified, though in the case of 12 instruments all but
English horn and violin instrument classes were recognizedproperly. In Tables 2–4, results of automatic classification ofFVs containing respectively MPEG-7-based, wavelet-based,and the combined MPEG-7- and wavelet-based descriptorsare shown. Each line in the table stands for the recognizedinput object, and the columns show the ANN recognitioneffectiveness. The scores obtained for a particular instrumentare given by the table diagonal (correct recognition of theclass of the instrument).
KOSTEK: MUSICAL INSTRUMENT CLASSIFICATION AND DUET ANALYSIS EMPLOYING MUSIC INFORMATION RETRIEVAL TECHNIQUES 721
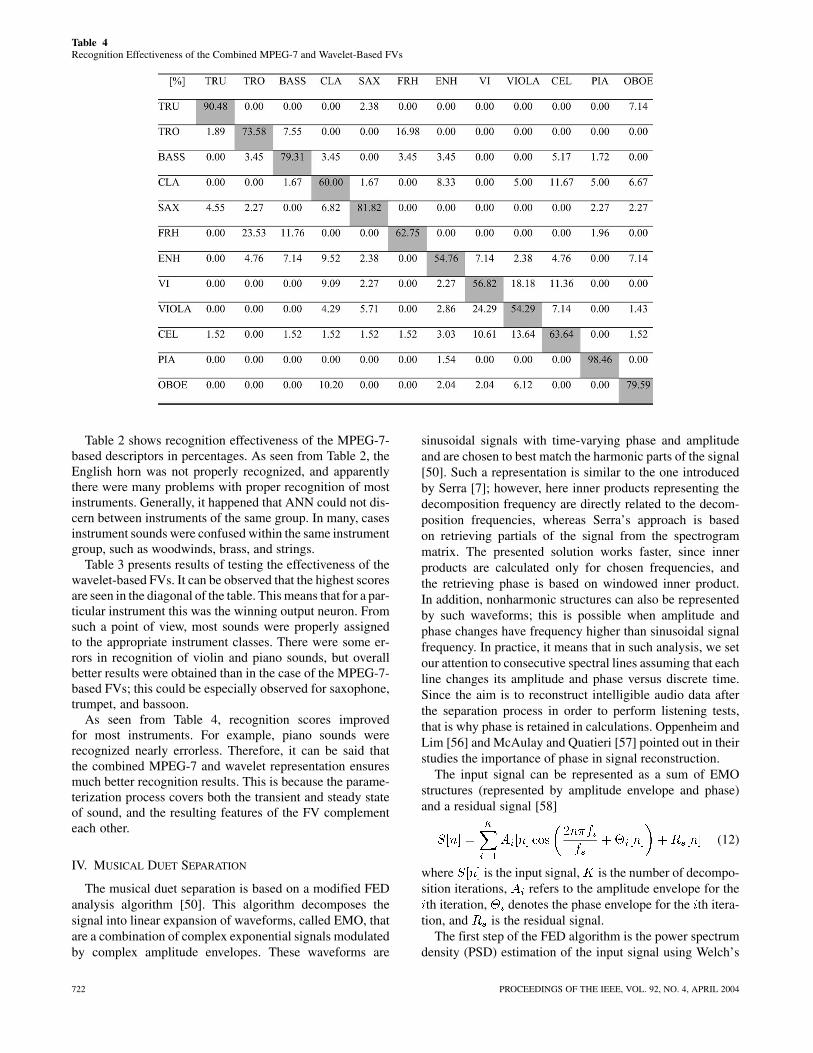
Table 4Recognition Effectiveness of the Combined MPEG-7 and Wavelet-Based FVs
Table 2 shows recognition effectiveness of the MPEG-7-based descriptors in percentages. As seen from Table 2, theEnglish horn was not properly recognized, and apparentlythere were many problems with proper recognition of mostinstruments. Generally, it happened that ANN could not dis-cern between instruments of the same group. In many, casesinstrument sounds were confused within the same instrumentgroup, such as woodwinds, brass, and strings.
Table 3 presents results of testing the effectiveness of thewavelet-based FVs. It can be observed that the highest scoresare seen in the diagonal of the table. This means that for a par-ticular instrument this was the winning output neuron. Fromsuch a point of view, most sounds were properly assignedto the appropriate instrument classes. There were some er-rors in recognition of violin and piano sounds, but overallbetter results were obtained than in the case of the MPEG-7-based FVs; this could be especially observed for saxophone,trumpet, and bassoon.
As seen from Table 4, recognition scores improvedfor most instruments. For example, piano sounds wererecognized nearly errorless. Therefore, it can be said thatthe combined MPEG-7 and wavelet representation ensuresmuch better recognition results. This is because the parame-terization process covers both the transient and steady stateof sound, and the resulting features of the FV complementeach other.
IV. MUSICAL DUET SEPARATION
The musical duet separation is based on a modified FEDanalysis algorithm [50]. This algorithm decomposes thesignal into linear expansion of waveforms, called EMO, thatare a combination of complex exponential signals modulatedby complex amplitude envelopes. These waveforms are
sinusoidal signals with time-varying phase and amplitudeand are chosen to best match the harmonic parts of the signal[50]. Such a representation is similar to the one introducedby Serra [7]; however, here inner products representing thedecomposition frequency are directly related to the decom-position frequencies, whereas Serra’s approach is basedon retrieving partials of the signal from the spectrogrammatrix. The presented solution works faster, since innerproducts are calculated only for chosen frequencies, andthe retrieving phase is based on windowed inner product.In addition, nonharmonic structures can also be representedby such waveforms; this is possible when amplitude andphase changes have frequency higher than sinusoidal signalfrequency. In practice, it means that in such analysis, we setour attention to consecutive spectral lines assuming that eachline changes its amplitude and phase versus discrete time.Since the aim is to reconstruct intelligible audio data afterthe separation process in order to perform listening tests,that is why phase is retained in calculations. Oppenheim andLim [56] and McAulay and Quatieri [57] pointed out in theirstudies the importance of phase in signal reconstruction.
The input signal can be represented as a sum of EMOstructures (represented by amplitude envelope and phase)and a residual signal [58]
(12)
where is the input signal, is the number of decompo-sition iterations, refers to the amplitude envelope for theth iteration, denotes the phase envelope for the th itera-
tion, and is the residual signal.The first step of the FED algorithm is the power spectrum
density (PSD) estimation of the input signal using Welch’s
722 PROCEEDINGS OF THE IEEE, VOL. 92, NO. 4, APRIL 2004
averaged, modified periodogram method [41]. The frequencyof the maximum value of the PSD is treated as thefrequency of the most energy carrying EMO structure. Nextis the calculation of nodes that represent the amplitude en-velope of the real and imaginary part of related to thecomplex exponential. Such an operation can be viewed ascalculating inner products of the signal and the complex ex-ponential divided into frames, where the inner product ofeach frame represents amplitude value. First, signals are mul-tiplied sample by sample
(13)
where is the input signal and refers to signal mul-tiplied sample by sample by complex exponential of the fre-quency .
Signal is divided into frames of the same length as thatof the complex exponential period, and for each block framethe value is calculated
(14)
where is the amplitude value for the th block,refers to frame length related to , and is the th frameof the signal.
The node value for the th frame is an inner product of theinput signal in the th frame and the complex exponential inthe th frame. To obtain amplitude signals of the same size asthe input signal one, appropriate interpolation has to be per-formed. Cubic spline approximation provides interpolatingcurves that do not exhibit large oscillations associated withhigh-degree interpolating polynomials [42] and thanks to itslow computational complexity, seems to be the perfect toolfor the task of amplitude envelope interpolation. In the nextalgorithmic step, cubic spline interpolation is performed. It isalso used to overcome the problem with phase unwrapping.
The first decomposition step is then performed
(15)
where is the residual signal and refers to frequencyfor the first iteration.
Each iteration is computed identically assuming that aresidual signal of the previous iteration becomes the inputsignal for the next iteration. However, if the sameis detected, a significantly shorter amplitude calculationframe has to be applied and the iteration is then repeated,assuming that most of the energy carrying frequencies phaseis disturbed and does not preserve harmonic properties. Inthis case, the EMO structure represents the nonharmonicpart of the signal. Decomposition frequencies are chosena priori for the FED. The first decomposition frequency isthe fundamental frequency of the lower pitched instrument.Therefore, it is necessary to first employ a pitch estimationalgorithm.
Since multipitch detection is not needed at this stage andone is interested in the lower instrument pitch only, an al-gorithm based on the correlation analysis seems to be well
suited to carry out this task [42], [50]. However several mod-ifications were applied to improve the accuracy of the al-gorithm according to the research done by Masuda–Katsuse[59].
The average pitch of a chosen segment results in the firstdecomposition frequency. It is assumed that this frequencyis the fundamental frequency of the lower pitched instru-ment. Frequencies of the first ten harmonics are then calcu-lated and FED iterations are performed for those frequencies.Since FED iterations can represent harmonic or inharmonicparts of the signal, a necessary modification of the FED wasnecessary in order to decompose only harmonic parts. Suchmodification is achieved by allowing only relatively largewindows for calculating envelopes for each EMO.
The first harmonics of the lower pitched instrument,within each segment can be represented as a sum of EMOstructures and can be written in a simplified way as
EMO
EMO (16)
where is the th segment of the input signal, is theextracted signal containing harmonic components of thelower pitched instrument, is the number of iterationsor the number of harmonics to be decomposed, is thefrequency corresponding to the th harmonic, EMOrefers to the th EMO corresponding to the th harmonicfrequency, and is the residual signal containinginharmonic components of both instruments and harmonicsof the higher pitched instrument.
The pitch detection procedure is repeated for re-sulting in PCS. Further segmentation of is carried out ifnecessary. FED decomposition is repeated for each segmentof . The first harmonics of the higher pitched instru-ment can be represented as a sum of EMO structures
EMO
EMO (17)
where is the th segment of , is the extractedsignal containing harmonic components of the higherpitched instrument, refers to the number of iterationsor the number of harmonics to be decomposed, is thefrequency corresponding to the th harmonic, EMOdenotes the th EMO corresponding to the th harmonicfrequency, and is the residual signal containinginharmonic components of both instruments and harmonicsof the lower pitched instrument.
A. Signal Decomposition
The segmentation of a sound based on PCS allows forsmall fluctuations of pitch. Pitch for each segment is actuallyan average pitch within such a segment. This generalizationdoes not produce large errors in algorithm, since each EMOstructure, thanks to the envelope frequency modulation prop-erties, adapts itself to such small fluctuations.
KOSTEK: MUSICAL INSTRUMENT CLASSIFICATION AND DUET ANALYSIS EMPLOYING MUSIC INFORMATION RETRIEVAL TECHNIQUES 723
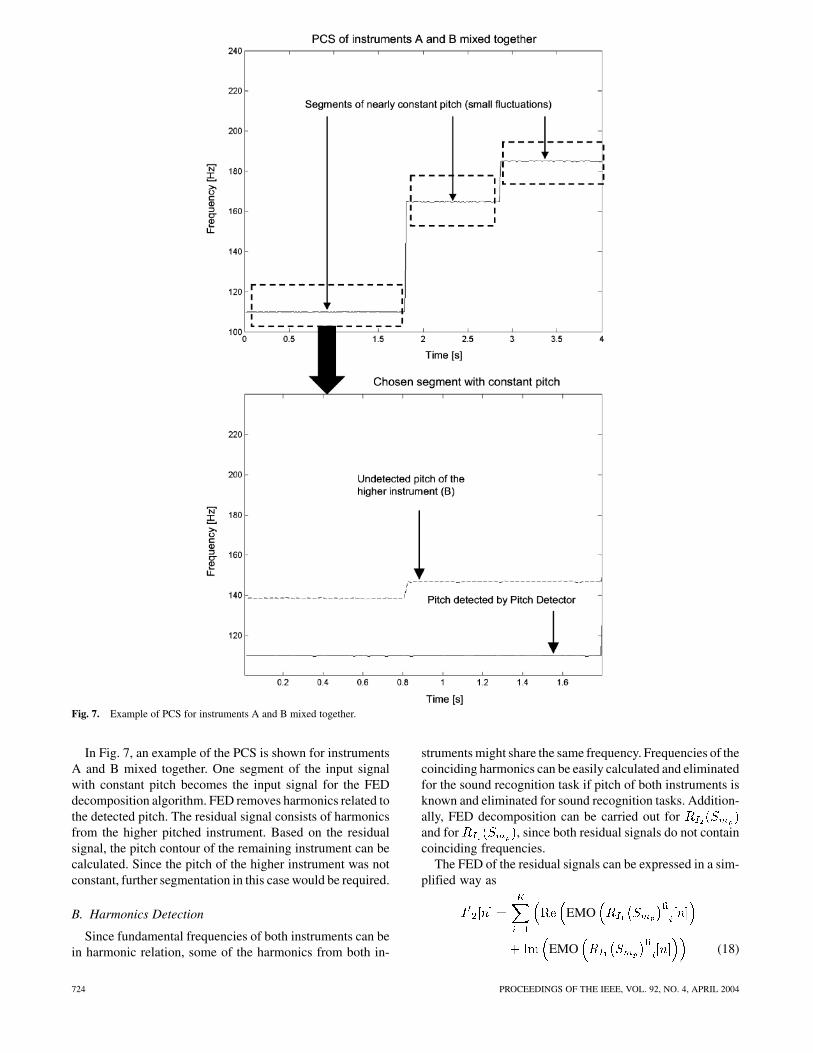
Fig. 7. Example of PCS for instruments A and B mixed together.
In Fig. 7, an example of the PCS is shown for instrumentsA and B mixed together. One segment of the input signalwith constant pitch becomes the input signal for the FEDdecomposition algorithm. FED removes harmonics related tothe detected pitch. The residual signal consists of harmonicsfrom the higher pitched instrument. Based on the residualsignal, the pitch contour of the remaining instrument can becalculated. Since the pitch of the higher instrument was notconstant, further segmentation in this case would be required.
B. Harmonics Detection
Since fundamental frequencies of both instruments can bein harmonic relation, some of the harmonics from both in-
struments might share the same frequency. Frequencies of thecoinciding harmonics can be easily calculated and eliminatedfor the sound recognition task if pitch of both instruments isknown and eliminated for sound recognition tasks. Addition-ally, FED decomposition can be carried out forand for , since both residual signals do not containcoinciding frequencies.
The FED of the residual signals can be expressed in a sim-plified way as
EMO
EMO (18)
724 PROCEEDINGS OF THE IEEE, VOL. 92, NO. 4, APRIL 2004
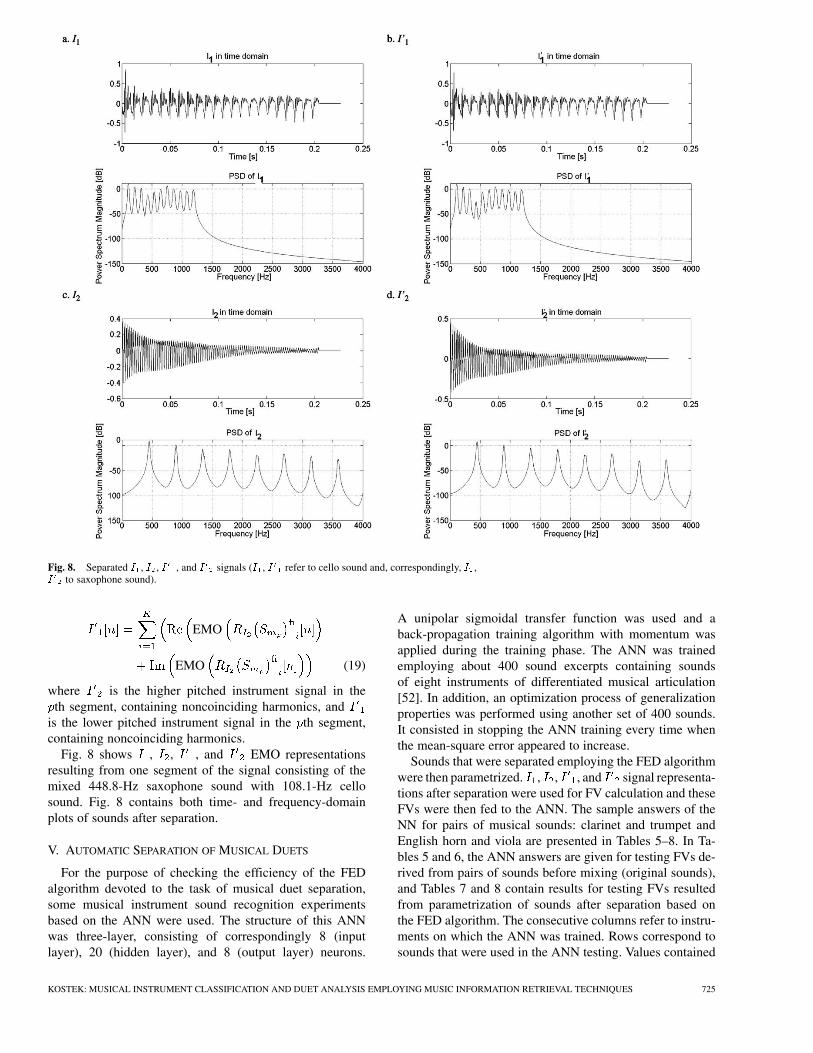
Fig. 8. Separated I , I , I , and I signals (I , I refer to cello sound and, correspondingly, I ,I to saxophone sound).
EMO
EMO (19)
where is the higher pitched instrument signal in theth segment, containing noncoinciding harmonics, and
is the lower pitched instrument signal in the th segment,containing noncoinciding harmonics.
Fig. 8 shows , , , and EMO representationsresulting from one segment of the signal consisting of themixed 448.8-Hz saxophone sound with 108.1-Hz cellosound. Fig. 8 contains both time- and frequency-domainplots of sounds after separation.
V. AUTOMATIC SEPARATION OF MUSICAL DUETS
For the purpose of checking the efficiency of the FEDalgorithm devoted to the task of musical duet separation,some musical instrument sound recognition experimentsbased on the ANN were used. The structure of this ANNwas three-layer, consisting of correspondingly 8 (inputlayer), 20 (hidden layer), and 8 (output layer) neurons.
A unipolar sigmoidal transfer function was used and aback-propagation training algorithm with momentum wasapplied during the training phase. The ANN was trainedemploying about 400 sound excerpts containing soundsof eight instruments of differentiated musical articulation[52]. In addition, an optimization process of generalizationproperties was performed using another set of 400 sounds.It consisted in stopping the ANN training every time whenthe mean-square error appeared to increase.
Sounds that were separated employing the FED algorithmwere then parametrized. , , , and signal representa-tions after separation were used for FV calculation and theseFVs were then fed to the ANN. The sample answers of theNN for pairs of musical sounds: clarinet and trumpet andEnglish horn and viola are presented in Tables 5–8. In Ta-bles 5 and 6, the ANN answers are given for testing FVs de-rived from pairs of sounds before mixing (original sounds),and Tables 7 and 8 contain results for testing FVs resultedfrom parametrization of sounds after separation based onthe FED algorithm. The consecutive columns refer to instru-ments on which the ANN was trained. Rows correspond tosounds that were used in the ANN testing. Values contained
KOSTEK: MUSICAL INSTRUMENT CLASSIFICATION AND DUET ANALYSIS EMPLOYING MUSIC INFORMATION RETRIEVAL TECHNIQUES 725
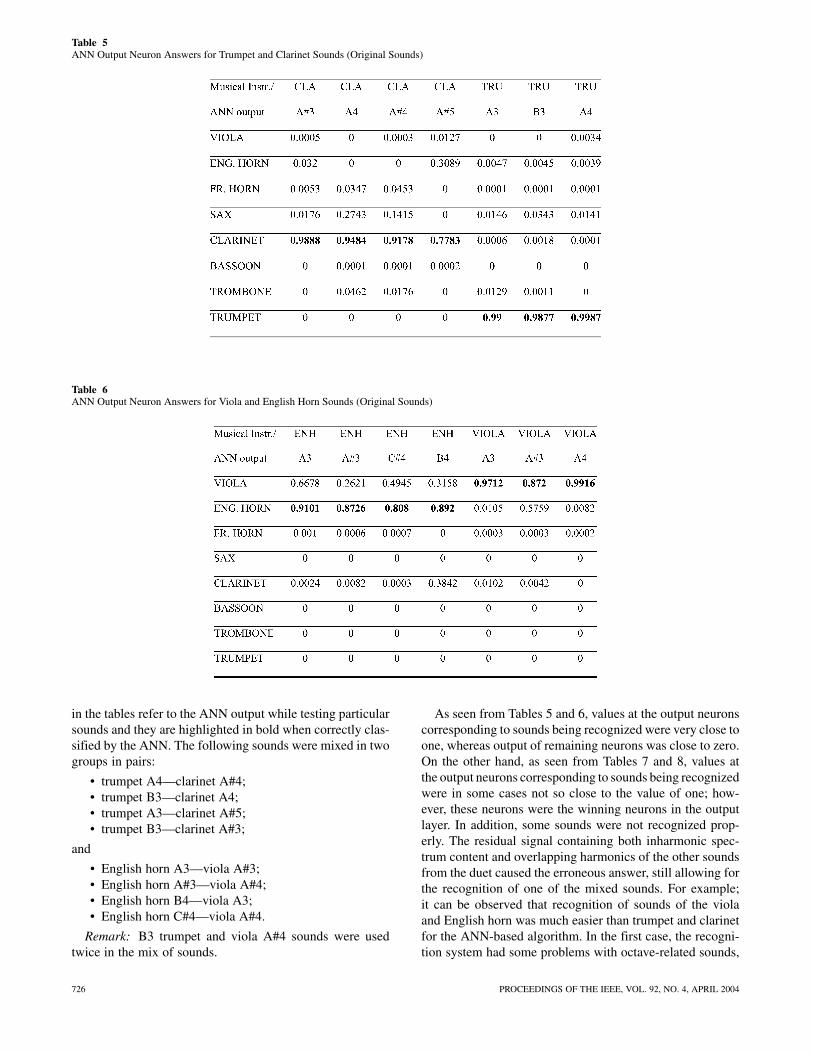
Table 5ANN Output Neuron Answers for Trumpet and Clarinet Sounds (Original Sounds)
Table 6ANN Output Neuron Answers for Viola and English Horn Sounds (Original Sounds)
in the tables refer to the ANN output while testing particularsounds and they are highlighted in bold when correctly clas-sified by the ANN. The following sounds were mixed in twogroups in pairs:
• trumpet A4—clarinet A#4;• trumpet B3—clarinet A4;• trumpet A3—clarinet A#5;• trumpet B3—clarinet A#3;
and
• English horn A3—viola A#3;• English horn A#3—viola A#4;• English horn B4—viola A3;• English horn C#4—viola A#4.
Remark: B3 trumpet and viola A#4 sounds were usedtwice in the mix of sounds.
As seen from Tables 5 and 6, values at the output neuronscorresponding to sounds being recognized were very close toone, whereas output of remaining neurons was close to zero.On the other hand, as seen from Tables 7 and 8, values atthe output neurons corresponding to sounds being recognizedwere in some cases not so close to the value of one; how-ever, these neurons were the winning neurons in the outputlayer. In addition, some sounds were not recognized prop-erly. The residual signal containing both inharmonic spec-trum content and overlapping harmonics of the other soundsfrom the duet caused the erroneous answer, still allowing forthe recognition of one of the mixed sounds. For example;it can be observed that recognition of sounds of the violaand English horn was much easier than trumpet and clarinetfor the ANN-based algorithm. In the first case, the recogni-tion system had some problems with octave-related sounds,
726 PROCEEDINGS OF THE IEEE, VOL. 92, NO. 4, APRIL 2004
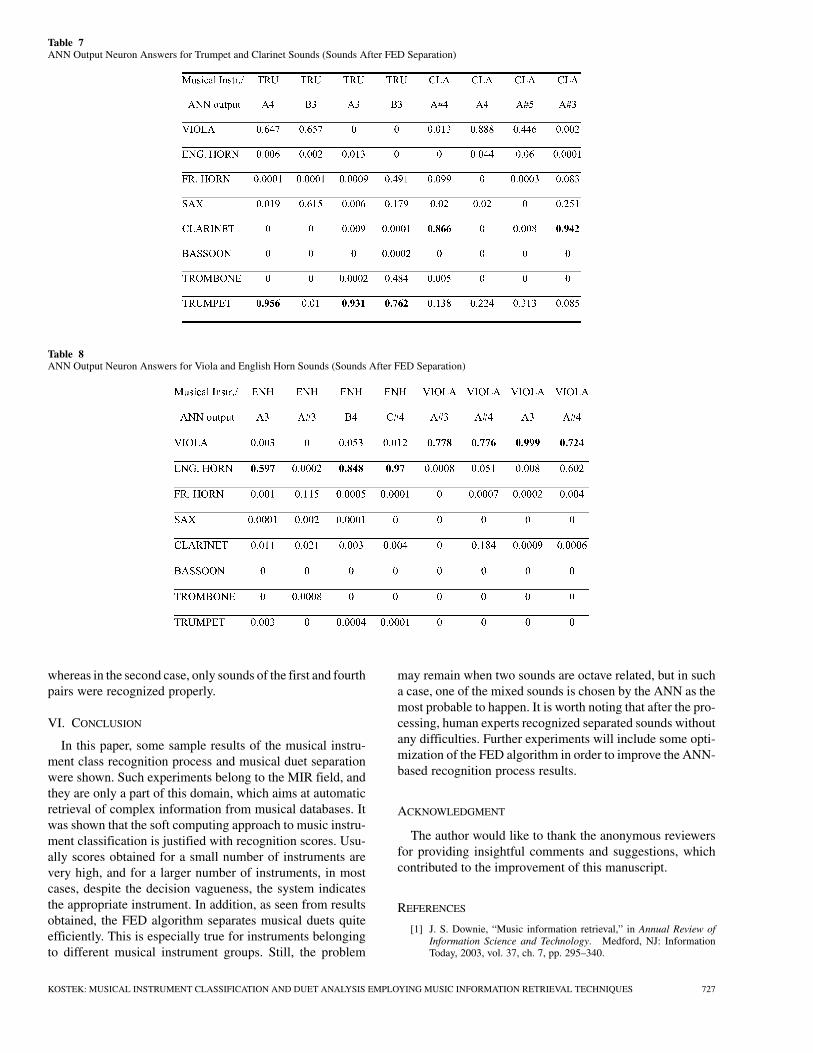
Table 7ANN Output Neuron Answers for Trumpet and Clarinet Sounds (Sounds After FED Separation)
Table 8ANN Output Neuron Answers for Viola and English Horn Sounds (Sounds After FED Separation)
whereas in the second case, only sounds of the first and fourthpairs were recognized properly.
VI. CONCLUSION
In this paper, some sample results of the musical instru-ment class recognition process and musical duet separationwere shown. Such experiments belong to the MIR field, andthey are only a part of this domain, which aims at automaticretrieval of complex information from musical databases. Itwas shown that the soft computing approach to music instru-ment classification is justified with recognition scores. Usu-ally scores obtained for a small number of instruments arevery high, and for a larger number of instruments, in mostcases, despite the decision vagueness, the system indicatesthe appropriate instrument. In addition, as seen from resultsobtained, the FED algorithm separates musical duets quiteefficiently. This is especially true for instruments belongingto different musical instrument groups. Still, the problem
may remain when two sounds are octave related, but in sucha case, one of the mixed sounds is chosen by the ANN as themost probable to happen. It is worth noting that after the pro-cessing, human experts recognized separated sounds withoutany difficulties. Further experiments will include some opti-mization of the FED algorithm in order to improve the ANN-based recognition process results.
ACKNOWLEDGMENT
The author would like to thank the anonymous reviewersfor providing insightful comments and suggestions, whichcontributed to the improvement of this manuscript.
REFERENCES
[1] J. S. Downie, “Music information retrieval,” in Annual Review ofInformation Science and Technology. Medford, NJ: InformationToday, 2003, vol. 37, ch. 7, pp. 295–340.
KOSTEK: MUSICAL INSTRUMENT CLASSIFICATION AND DUET ANALYSIS EMPLOYING MUSIC INFORMATION RETRIEVAL TECHNIQUES 727
[2] ISMIR: The international conferences on music infor-mation retrieval and related activities [Online]. Available:http://www.ismir.net/
[3] Meta-labs.com [Online]. Available: http://www.meta-labs.com/mpeg-7-aud
[4] International Organisation for Standardisation, Coding ofMoving Pictures and Audio: MPEG-7 overview, ISO/IEC JTC1/SC29/WG11. [Online]. Available: http://www.chiariglione.org/mpeg/standards/mpeg-7/mpeg-7 .htm.
[5] A. T. Lindsay and J. Herre, “MPEG-7 and MPEG-7 audio—anoverview,” J. Audio Eng. Soc., vol. 49, no. 7/8, pp. 589–594, 2001.
[6] N. Laurenti and G. de Poli, “A method for spectrum separation andenvelope estimation of the residual in spectrum modeling of musicalsound,” presented at the COST G6 Conf. on Digital Audio Effects(DAFX-00), vol. 2000, Verona, Italy.
[7] X. Serra, Musical Sound Modeling With Sinusoids PlusNoise. Lisse, The Netherlands: Swets & Zeitlinger Publishers,1997.
[8] S. McAdams, “Concurrent sound segregation I: Effects of frequencymodulation coherence,” J. Acoust. Soc. Amer., vol. 86, no. 6, pp.2148–2159, 1989.
[9] J. C. Brown, “Computer indentification of musical instruments usingpattern recognition with cepstral coefficients as features,” J. Acoust.Soc. Amer., vol. 105, pp. 1933–1941, 1999.
[10] J. C. Brown, O. Houix, and S. McAdams, “Feature dependence inthe automatic identification of musical woodwind instruments,” J.Acoust. Soc. Amer., vol. 109, no. 3, pp. 1064–1072, 2001.
[11] P. Cosi, G. de Poli, and G. Lauzzana, “Auditory modeling and self-organizing neural networks for timbre classification,” J. New MusicRes., vol. 23, no. 1, pp. 71–98, 1994.
[12] A. Eronen and A. Klapuri, “Musical instrument recognition usingcepstral coefficients and temporal features,” in Proc. IEEE Int. Conf.Acoustics, Speech, and Signal Processing 2000, pp. 753–756.
[13] P. Herrera, X. Amatriain, E. Battle, and X. Serra. Toward instrumentsegmentation for music content description: a critical reviewof instrument classification techniques. presented at Int. Symp.Music Information Retrieval (ISMIR 2000). [Online]. Available:http://ismir2000.indiana.edu/
[14] P. Herrera, X. Serra, and G. Peeters, “A proposal for the descriptionof audio in the context of MPEG-7,” in Proc. Eur. Workshop Content-Based Multimedia Indexing (CBMI’99), pp. 81–88.
[15] I. Kaminskyj, “Multi-feature musical instrument sound classifierv/user determined generalization performance,” in Proc. ACMC2002, 2002, pp. 53–62.
[16] , “Multi-feature musical instrument sound classifier,” in Proc.ACMC, 2000, pp. 46–54.
[17] K. Kashino and H. Tanaka, “A sound source separation system withthe ability of automatic tone modeling,” in Proc. ICMC, 1993, pp.248–255.
[18] B. Kostek and A. Czyzewski, “Representing musical instrumentsounds for their automatic classification,” J. Audio Eng. Soc., vol.49, no. 9, pp. 768–785, 2001.
[19] B. Kostek, “Soft computing in acoustics, applications of neural net-works, fuzzy logic and rough sets to musical acoustics,” in Studiesin Fuzziness and Soft Computing. Heidelberg, Germany: PhysicaVerlag, 1999.
[20] , “Computer based recognition of musical phrases using therough set approach,” J. Inf. Sci., vol. 104, pp. 15–30, 1998.
[21] C. Papaodysseus, G. Roussopoulos, D. Fragoulis, T. Panagopoulos,and C. Alexiou, “A new approach to the automatic recognition ofmusical recordings,” J. Audio Eng. Soc., no. 1/2, pp. 23–35, 2001.
[22] G. de Poli and P. Prandoni, “Sonological models for timbre charac-terization,” J. New Music Res., vol. 26, no. 2, pp. 170–197, 1997.
[23] European IST project ‘RAA’ (2000). [Online]. Available:http://www.joanneum.ac.at
[24] P. Y. Rolland, “Discovering patterns in musical sequences,” J. NewMusic Res., vol. 28, no. 4, pp. 334–350, 1999.
[25] , “Adaptive user modeling in a content-based music retrievalsystem,” in Proc. 2nd Int. Symp. Music Information RetrievalISMIR’01, Bloomington, IN, 2001.
[26] G. Tzanetakis and P. Cook, “Audio information retrieval (AIR)tools,” presented at the Int. Symp. Music Information Retrieval(ISMIR’00), Plymouth, MA.
[27] M. Ueda and S. Hashimoto, “Blind decomposition of concurrentsounds,” in Proc. ICMC, 1994, pp. 311–318.
[28] A. Wieczorkowska and A. Czyzewski, “Rough set based approachto automatic classification of musical instrument sounds,” Electron.Notes Theor. Comput. Sci., vol. 82, no. 4, pp. 1–12 , 2003.
[29] A. Wieczorkowska, J. Wroblewski, D. Slezak, and P. Synak, “Appli-cation of temporal descriptors to musical instrument sound recogni-tion,” J. Intell. Inf. Syst., vol. 21, no. 1, pp. 71–93, 2003.
[30] 20th WCP: Philosophy and cognitive science [Online]. Available:http://www.bu.edu/wcp/MainCogn.htm
[31] [Online]. Available: http://www.w3.org/Metdadata[32] L. Zadeh, “Fuzzy logic=computing with words,” IEEE Trans. Fuzzy
Syst., vol. 2, pp. 103–111, May 1996.[33] , “From computing with numbers to computing with
words—from manipulation of measurements to manipulation ofperceptions,” IEEE Trans. Circuits Syst., vol. 45, pp. 105–119, Jan.1999.
[34] B. Kostek, “‘Computing with words’ concept applied to musical in-formation retrieval,” presented at the Int. Workshop RSKD, Warsaw,Poland, 2003.
[35] J. W. Beauchamp, “Detection of musical pitch from recorded soloperformances,” presented at the 94th. Audio Engineering Soc. Con-vention, Berlin, Germany, 1993.
[36] J. C. Brown, “Musical fundamental frequency tracking using a pat-tern recognition method,” J. Acoust. Soc. Amer., vol. 92, no. 3, pp.1394–1402, 1992.
[37] A. Czyzewski, A. M. Szczerba, and B. Kostek, “Pitch estimationassisted by the neural network-based prediction algorithm,” in Proc.ISMA 2002, pp. 246–255.
[38] W. Hess, Pitch Determination of Speech Signals, Algorithms andDevices. Berlin, Germany: Springer-Verlag, 1983.
[39] A. Klapuri, “Wide-band pitch estimation for natural sound sourceswith inharmonicities,” presented at the 106th Audio EngineeringSoc. Convention, Munich, Germany, 1999.
[40] A. M. Noll, “Cepstrum pitch determination,” J. Acoust. Soc. Amer.,vol. 14, pp. 293–309, 1967.
[41] J. G. Proakis and D. G. Manolakis, Digital Signal Processing. Prin-ciples, Algorithms and Applications, 3rd ed. Englewood Cliffs, NJ:Prentice-Hall, 1999.
[42] L. Rabiner, M. J. Cheng, A. E. Rosenberg, and C. Gonegal, “A com-parative performance study of several pitch detection algorithms,”IEEE Trans. Acoust., Speech, Signal Processing, vol. ASSP-24, pp.399–418, Oct. 1976.
[43] M. R. Schroeder, “Period histogram and product spectrum: newmethods for fundamental frequency measurement,” J. Acoust. Soc.Amer., vol. 43, pp. 829–834, 1968.
[44] X. Quian and R. Kimaresan, “A variable frame pitch estimator andtest results,” in IEEE Int. Conf. Acoustics, Speech and Signal Pro-cessing, vol. 1, 1996, pp. 228–231.
[45] D. Talkin, A Robust Algorithm for Pitch Tracking (RAPT). SpeechCoding and Synthesis. New York: Elsevier, 1995, pp. 495–518.
[46] A probabilistic approach to AMDF pitch detection, G. S. Ying, L.H. Jamieson, and C. D. Michell. [Online]. Available: http://pur-cell.ecn.purdue.edu/~speechg
[47] J. D. Wize, J. R. Caprio, and T. W. Parks, “Maximum-likelihoodpitch estimation,” IEEE Trans. Acoust., Speech, Signal Processing,vol. ASSP-24, pp. 418–423, Oct. 1976.
[48] N. Kunieda, T. Shimamura, and J. Suzuki, “Robust method of mea-surement of fundamental frequency by ACOLS-autocorrelation oflog spectrum,” in IEEE Int. Conf. Acoustics, Speech and Signal Pro-cessing, vol. 1, 1996, pp. 232–235.
[49] B. Kostek and P. Zwan, “Wavelet-based automatic recognition ofmusical instruments,” in Proc. 142nd Meeting Acoustical Soc. Amer.,vol. 110, 2001, p. 2754.
[50] B. Kostek, P. Zwan, and M. Dziubinski, “Statistical analysis of mu-sical sound features derived from wavelet representation,” presentedat the 112th Audio Engineering Soc. Convention, Munich, Germany,2002.
[51] H. F. Pollard and E. V. Jansson, “A tristimulus method for the spec-ification of musical timbre,” Acustica, vol. 51, pp. 162–171, 1982.
[52] B. Kostek, M. Dziubinski, and P. Zwan, “Further developments ofmethods for searching optimum musical and rhythmic feature vec-tors,” presented at the 21st Audio Engineering Soc. Conf., St. Pe-tersburg, Russia, 2002.
[53] W. H. Press, S. A. Teukolsky, W. T. Vetterling, and B. P. Flannery,Numerical Recipes. Cambridge, U.K.: Cambridge Univ. Press,1992.
[54] J. Zurada, Introduction to Artificial Neural Systems. St. Paul, MN:West, 1992.
[55] B. Kostek, P. Zwan, and M. Dziubinski, “Musical sound parame-ters revisited,” presented at the Stockholm Music Acoustics Conf.(SMAC’03), Stockholm, Sweden.
728 PROCEEDINGS OF THE IEEE, VOL. 92, NO. 4, APRIL 2004
[56] A. V. Oppenheim and J. S. Lin, “The importance of phase in signals,”Proc. IEEE, vol. 69, pp. 529–541, May 1981.
[57] R. J. McAualay and T. F. Quatieri, “Pitch estimation and voicingdetection based on sinusoidal speech model,” in Proc. ICASSP, vol.1, 1990, pp. 249–252.
[58] M. Dziubinski, “Evaluation of musical instrument sound separationmethod effectiveness in polyphonic recordings by means of softcomputing methods,” Ph.D. dissertation, Multimedia Syst. Dept.,Gdansk Univ. Technol., Gdansk, Poland, to be published.
[59] I. Masuda-Katsuse, “A new method for speech recognition in thepresence of non stationary, unpredictable and high level noise,” inProc. Eurospeech 2001, pp. 1119–1122.
Bozena Kostek (Member, IEEE) received theM.Sc. degree in sound engineering and the M.Sc.degree in organization and management fromthe Gdansk University of Technology (GUT),Gdansk, Poland, in 1983 and 1986, respectively,the Diplome d’Acoustique degree from the PaulSabatier University of Toulouse, France, in 1988,the Ph.D. degree from GUT in 1992, and theD.Sc. degree at the Warsaw Institute of ResearchSystems, Polish Academy of Sciences, Warsaw,Poland, in 2000.
She is an Associate Professor with the Department of Multimedia Sys-tems, GUT. She has also led a number of research projects sponsored by thePolish State Committee for Scientific Research. She has presented more than200 scientific papers in journals and international conferences. Her main sci-entific interests are musical acoustics, music information retrieval, the psy-chophysiology of hearing, and applications of soft computing methods tothe mentioned domains.
Prof. Kostek is a Member of the Audio Engineering Society, AcousticalSociety of America, and others. In 2000, she received an award for scientificachievements from the Prime Minister of Poland. In 2003, she was electedthe AES Vice-President for central Europe.
KOSTEK: MUSICAL INSTRUMENT CLASSIFICATION AND DUET ANALYSIS EMPLOYING MUSIC INFORMATION RETRIEVAL TECHNIQUES 729