Embed Size (px)
Citation preview
Music2Go-Intro Players Manual (revision F)
© Smartsims International Ltd
Music2Go-Intro Players Manual 2
Getting Started ............................................................................................. 2 Single-Player vs Multi-Player ........................................................................... 2 Your Goal – Maximize Marketing Contribution .................................................... 3 Summary of the Music2Go Scenario ................................................................. 4 Key Reports Menu.......................................................................................... 7
Chapter 2: The Music2Go Scenario 8
Market Segment Overview .............................................................................. 8 Standard Segment ................................................................................. 8 Youth Segment ...................................................................................... 9 Sports Segment (Multi-Player only) .......................................................... 9 The Perceptual Map and Segment Movement over Time ............................. 10 Forecast Segment Demand .................................................................... 11
Advertising Media Selection ........................................................................... 12 Advertising Reach and Media Viewing Preferences ..................................... 13
Distribution and Sales Promotion .................................................................... 14 Distribution and Retail Margin................................................................. 14 The Product Life Cycle ........................................................................... 15 Sales Promotion and the Product Life Cycle .............................................. 16 How do I choose a Sales Promotion Mix for my products? .......................... 19
Chapter 3 - The Decision Screens 20
Price ........................................................................................................... 20 Product Pricing Screen ........................................................................... 20 How do I set the price and margin for each product? ................................. 22
Advertising .................................................................................................. 23 Advertising Screen ................................................................................ 23
Sales Promotion ........................................................................................... 24 Sales Promotion Strategy Screen ............................................................ 24
Product Development .................................................................................... 25 Product Development Screen (Existing Product) ....................................... 25 Launch New Product Screen ................................................................... 27
Chapter 4 - Market Research Reports 28
Market Research Report Screen .............................................................. 28 Market Research Reports Available .......................................................... 28 Free Market Research - Some Product Details Report ................................ 29 Free Market Research - Market Information Report ................................... 29
Chapter 5 - Key Reports 30
Key Reports Menu......................................................................................... 30 Forecast Marketing Expenditure Budget ................................................... 30 Industry Benchmark Report ................................................................... 31 Product Contribution Report ................................................................... 34

Forecast Results ........................................................................................... 36
Chapter 6 - FAQs 37
Music2Go is a Principles of Marketing simulation where you will plan and
implement a Sales and Marketing campaign for the MP3 Player division of a large Consumer Electronics Corporation.
Getting Started
1 Read this Players Manual in full. It contains hints and tips to get you started as well as a detailed overview of the Music2Go market segments, consumer preferences, and advertising reach and viewing habits. You will need this
information.
2 Go to www.smartsims.com and log in using the login and password provided by your Instructor
3 Watch the Single-Player Overview video for Music2Go
4 Open your Single-Player and start practicing. This will allow you to get used to the simulation before your Multi-Player competition begins.
Single-Player vs Multi-Player
The Music2Go Single-Player allows you to practice against a single computer controlled competitor. You are able to roll forward into the next decision period / year, or roll back as you wish in order to test and change your decisions. Your goal is to generate more Marketing Contribution than your opponent.
All you have to do is to log into our website, go to the Music2Go menu, and click the blue Launch button to open your firm. Note – we may have to create this for
you, so just let us know if you can’t find your Single-Player.
In the Multi-Player you will compete against other students in your class to create the highest Total Marketing Contribution (see ‘goals’ section below). Moving from one year (decision period) to the next is done by automatic rollover on preset dates chosen by your Instructor. Before each of these scheduled times you need to have all decisions for the upcoming year entered into the Multi-Player.
Note: In Multi-Player, your Instructor decides when the simulation will move from
one decision period to the next (ie. rollovers). You can NOT roll the Multi-Player forward and backward yourself.
Music2Go-Intro Players Manual
Music2Go-Intro Players Manual 3
Your Goal – Maximize
Marketing Contribution
You are the Vice President of Marketing for the MP3 Player division of a Consumer Electronics Corporation. You will be competing against either a single computer controlled competitor (Single-Player), or your classmates (Multi-Player) who are
marketing similar music players.
Your goal in Music2Go is to beat your competitors by maximizing the Total Marketing Contribution of your firm. Or, to put it in simple terms - you want to make as much money as possible!
To do this you will need to carefully plan your Marketing Strategy, decide which
markets to enter, how to price each product, analyze market research, optimize
your advertising mix for each product, promote your products at different stages of the product life-cycle, and respond to your competitors' actions.
Note: The Industry Benchmark Report under Key Reports shows how you are performing relative to your competitor(s) in terms of Marketing Contribution.
WHAT IS MARKETING CONTRIBUTION?
Marketing Contribution is a measure of how profitable a firm is as a result of its strategic marketing plan. It is the amount of profit remaining after manufacturing
(cost of goods sold) and marketing expenditures have been deducted. The only costs still to be deducted are other functional overhead costs for the firm, e.g. finance, administration etc. Positive Marketing Contribution occurs when Net Sales Revenue is greater than Marketing Expenditure.
Marketing Contribution Example
Imagine that you spent $25m on Marketing Expenses. Then if you sold 2 million
units at $50 each you would have $100m in sales. If each unit sold cost $30, then the cost of those goods would be $60m. This would give you Marketing Contribution of $15m as in the table below:
Sales $100m
Less Cost of Goods Sold $60m
Gross Margin $40m
Less Marketing Expenses $25m
Marketing Contribution $15m
Note: The Industry Benchmark Report under Key Reports shows how you are performing relative to your competitor(s) in terms of Marketing Contribution.
Music2Go-Intro Players Manual 4
Summary of the Music2Go
Scenario
You assume the role of the Vice President of Marketing for the MP3 Player division of a Consumer Electronics Corporation.
The most successful students will be those who can combine research from multiple
sources to create an effective marketing campaign, and who continually review in order to refine their campaign.
YEAR AHEAD AND KEY REPORTS
After every rollover the Year Ahead report outlines new developments in the scenario and gives general hints and tips for the coming year. We strongly recommend you read the Year Ahead report after each rollover so you are aware of
new developments in the Scenario.
The Key Reports menu contains important reports that you will need every year.
You will gradually be given more control of your firm as the simulation progresses:
Year One One existing product selling to the Standard market segment. You make price, margin, sales forecast, and advertising mix decisions (TV, Digital Media, Newspapers, Magazines)
Year Two (after 1st rollover) Same as above, plus Sales Promotion decisions.
Year Three (after 2nd rollover) Same as above, plus Product Development. You can launch a second product into either the Youth or Sports segments, improve your existing product, and reduce the cost of your existing product
Year Four (after 3rd rollover) Same as above, plus you can launch a 3rd product if you wish
Year Five (after 4th rollover) Same as above, plus you can launch a 4th product if you wish
MARKETING BUDGET
You are given a fixed budget every year with which to plan and implement your Sales and Marketing campaign. The amount of your budget will vary depending on
how successful you are and it is the larger of $25m or 50% of your gross margin up to a maximum of $50m. In addition, whenever a new product is launched your budget will increase by $10m for a single period to allow you to build initial awareness for your new product. (This can temporarily take you over the $50m budget limit.)
For example, if your Sales last year were $150m, and your Cost of Goods Sold was
$90m, then your Gross Margin was $60m. So your marketing budget for this year will be 0.5 * $60m = $30m. However if you also choose to launch a new product this period, then your Marketing Budget will temporarily increase by $10m to a total of $40m to help you establish awareness for the new product.
Music2Go-Intro Players Manual 5
The Forecast Results->Budget Spending Report allows you to see what your current budget is, and how much you have used. It will also show the adjusted budget limit if you choose to launch a new product. You should always check this report after making your decisions to ensure you are within budget.
MARKET RESEARCH
There are a variety of Market Research reports available for purchase every year, and effective use of Market Research is critical to succeeding in Music2Go. We strongly recommend you familiarize yourself with the available Market Research reports in the Single-Player before your Multi-Player competition starts so you can purchase wisely.
One of the key lessons in Music2Go is that information has a value. By spending on Market Research, you can make better decisions. You can save money by not purchasing Market Research, but you may find your competitors who invest in
Market Research out-perform you.
MEDIA CHANNELS
There are four Media Channels in Music2Go that you can use to reach your customers – TV, Digital Media, Newspapers, and Magazines. Each market segment
has different media viewing habits, so be sure to check the Advertising Reach curves and Segment Media Viewing preferences section in Chapter 2 of this manual.
MARKET SEGMENTS
There are three market segments in Music2Go – Standard, Youth, and Sports. (The Sports segment only appears in the Multi-Player, not the Single-Player).
These segments have different sizes, projected growth, and sensitivity to price,
advertising, distribution, and product specs. Chapter 2 of this manual has important information on advertising reach and demographics.
THE PERCEPTUAL MAP AND SEGMENT MOVEMENT OVER TIME
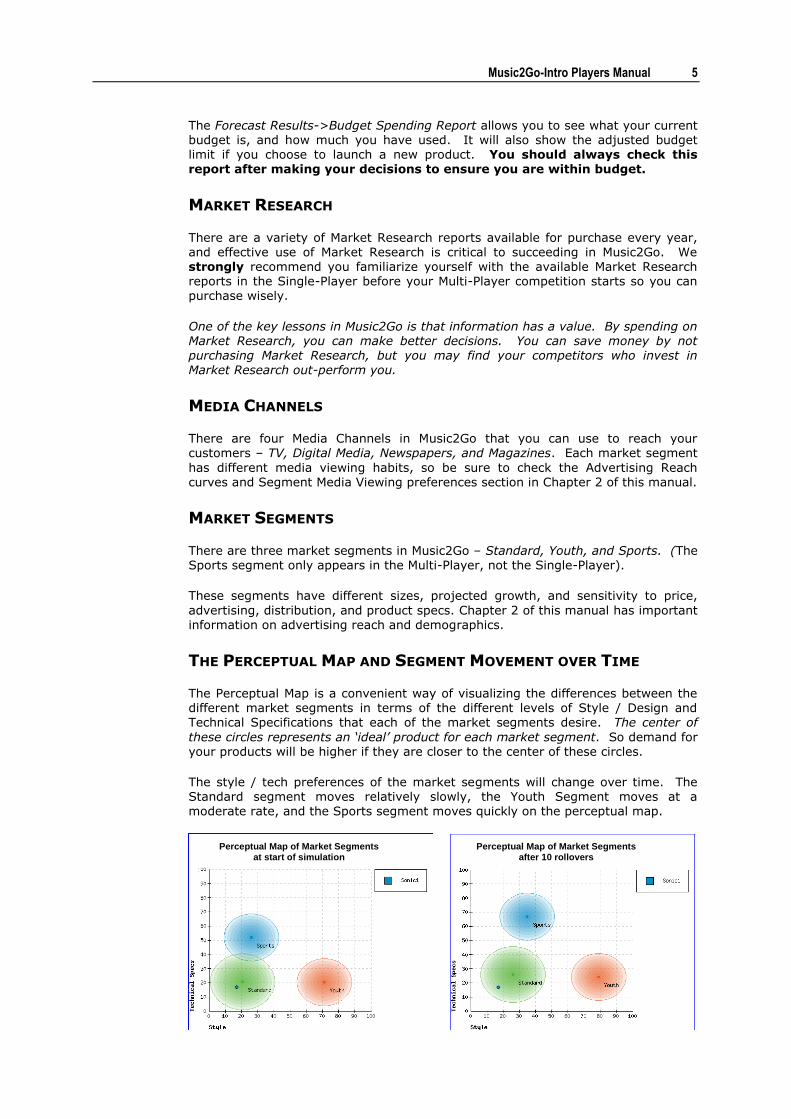
The Perceptual Map is a convenient way of visualizing the differences between the different market segments in terms of the different levels of Style / Design and Technical Specifications that each of the market segments desire. The center of
these circles represents an ‘ideal’ product for each market segment. So demand for your products will be higher if they are closer to the center of these circles.
The style / tech preferences of the market segments will change over time. The Standard segment moves relatively slowly, the Youth Segment moves at a moderate rate, and the Sports segment moves quickly on the perceptual map.
Perceptual Map of Market Segments at start of simulation
Perceptual Map of Market Segments after 10 rollovers
Music2Go-Intro Players Manual 6
PRODUCT DEVELOPMENT – SPEC IMPROVEMENT / COST REDUCTION
You start with a single MP3 Player product in the Standard market segment. But over time you and your competitors may improve your existing product, launch additional products into new market segments, and perform cost reduction projects
to reduce the manufacturing cost of every unit sold. (Product Development is available after the 2nd rollover).
Note that the style / tech preferences of the markets change over time, so you may need to make some improvements to your existing products just to keep them attractive to your customers. How often you need to do this will depend on how sensitive each segment is to product specifications and how quickly each segment
moves on the Perceptual Map.
Look at the Perceptual Map report under Key Reports to see approximately where your products sit within each segment, or purchase the All Product Details Market
Research to see how your Product Specification Index compares to your competitors.
SALES FORECASTING AND INVENTORY MANAGEMENT
Accurate forecasting of demand and Inventory Management is important. If you
purchase too little stock you miss out on easy sales. Too much, and you will incur inventory holding costs. Too much stock on hand also means that product modification can be expensive because you will have to dump any finished goods you have below cost before modifying your product.
All students have the Product Contribution Report under the Key Reports menu. This shows Starting Inventory, Planned vs Actual Units Ordered, Closing Inventory,
and Estimated Lost Sales (excess demand) for each product. Students should use this report to aid them in forecasting demand for next period. Also see Key Reports -> Some Product Details report.
SALES PROMOTION AND THE PRODUCT LIFE CYCLE
Your Sales Promotion strategy will need to vary with the Life Cycle of your product. For instance, Trade Shows and Sales Force training will be important at a new product launch, but progressively less so as the product ages. Your existing
product will be in the Mature phase of its life cycle for your first Sales Promotion decision. (Sales Promotion decisions are available after 1st rollover). See Chapter 2 for more information.
DISTRIBUTION
Some market segments value distribution more than others. You can influence distribution by modifying your retailer margin and by investing in Sales Promotion.
Music2Go-Intro Players Manual 7
Chapter 2 of this Players Manual gives a detailed overview of:
Market segments
Product life-cycle and sales promotion activities
Advertising media channels
Sales promotion activities
You WILL need the information in Chapter 2 to succeed in Music2Go.
Chapter 3 gives an overview of the decision screens
Chapter 4 gives an overview of how to evaluate your performance via the available reports and Market Research. This will assist you in assessing your progress and in
making decisions for the next rollover.
Chapter 5 gives an overview of some other key reports
Chapter 6 has some FAQs (Frequently Asked Questions) that you may find useful
Key Reports Menu
The Key Reports menu contains important reports that you will need every year.
Industry Benchmark. This compares the Sales, Costs, and Marketing Contribution of every firm in the Industry.
Market Information. This summarizes all of the useful facts and figures from
Chapter 2 of the Players Manual. This includes information on segment size and price ranges, what factors the segments are sensitive to, media viewing habits and advertising sensitivity for each segment, and the ideal sales promotion mix for each stage of the product life cycle. You should consider printing out this report to refer to when you make your decisions.
Some Product Details. A comparison of all products in the Music2Go market including price and sales volume as well as more detailed information for your own products including Estimated Lost Sales.
Product Contribution. Compare the performance of each of your products.
Budgeted Expenditure Report. Shows your budget for this year and how much you have remaining to spend.
Current Decisions. Shows the decisions you have entered for the upcoming
rollover. You should review this report each period to ensure that you have entered all of your decisions correctly.
Market Segment Overview
There are three market segments in Music2Go – Standard, Youth, and Sports (Multi-Player only). These segments have different sizes, projected growth, and sensitivity to price, advertising, distribution, and product specs.
You start with a single MP3 Player product in the Standard market segment. But starting in Year 3 (after 2nd rollover) you may improve your existing product and / or launch additional products into new market segments (up to a maximum of 4 products by Year 6). Part of the challenge of Music2Go is in being able to balance
the needs of your products within your limited marketing budget.
Standard Segment
Consumers in this segment tend to be less active than those in the sports segment and thus do not require the high level of technological specifications inherent in sports designs. Thus while young adults in this segment share the purchasing ability of their sports counterparts they are more price conscious, which is reflected in the relative pricing between these two segments.
Medium priced ($85 - $100) with high price sensitivity
Price range is $40 to $120, but the recommended range is $85 to $100.
Medium sensitivity to advertising
High sensitivity to distribution coverage
Low sensitivity to product specifications
Consumer style / tech spec preferences change slowly, so segment moves slowly on perceptual map.
Because consumers in this segment are highly price sensitive, you can expect some price competition. Plan for this with cost reduction projects to maintain acceptable
unit margins. But be careful of engaging in a price war. No-one wins a war.
This is the slowest moving segment and has low sensitivity to product specs. So you may only require a single product spec improvement project midway through the simulation to remain competitive. It is the largest of the three segments but has minimal underlying growth.
You will be selling a single standard segment music player in the first 2 years of the
simulation. After the 2nd rollover you may launch additional products into the Youth and Sports segments (Multi-Player only).
Chapter 2: The Music2Go Scenario
Chapter 2: The Music2Go Scenario 9
Youth Segment
The Youth segment is representative of the high style emphasis, fashion conscious youth purchaser (less than 18 years of age) of MP3 Players in the Music2Go market. Most purchases will be made by older age groups on behalf of children / youths.
Competitively priced ($55 - $65) with medium price sensitivity
Price range is $20 to $80, but the recommended range is $55 to $65.
High sensitivity to advertising
Medium sensitivity to distribution coverage
Medium sensitivity to product specifications
Purchase decision is heavily influenced by Television and Digital Media.
Consumer style / tech spec preferences are fashion driven and change
moderately quickly, so segment moves at a moderate rate on perceptual map.
Although the Youth Market has medium price sensitivity, it has a smaller price
range ($20 to $80), so margins are tight and there is still likely to be some price competition. Make sure you maintain a sufficient unit margin by investing in cost reduction projects.
This segment has medium sensitivity to product specs and moves at a moderate rate, so successful firms will undertake product spec improvement projects every second year or so. The Youth segment starts off smaller than the standard segment, but has high underlying growth as the market develops.
Sports Segment (Multi-Player only)
The Sports segment is comprised of young, physically active individuals. They require a high degree of technological sophistication in their music players in order to cope with the physical demands they place on their MP3 Player when in use with sports/recreation activities. As such, these players can command a premium price in the market, and are thus popular with young adults (18-34) who have begun work but are not yet subject to the family commitments of older age groupings.
High priced ($120-$135) with low price sensitivity
Price range is $60 to $150, but the recommended range is $120 to $135.
Low sensitivity to advertising
Medium sensitivity to distribution coverage
High sensitivity to product specifications
Consumer style / tech spec preferences are technology driven and change
quickly, so segment moves quickly on perceptual map.
As the Sports Market has low price sensitivity and a high price range ($60 to $150)
it is possible to maintain high prices and unit margins.
This is the fastest moving segment, and the most sensitive to product specs, so successful students will undertake product spec improvement projects most periods. It is the smallest of the three segments and has moderate underlying growth.
Chapter 2: The Music2Go Scenario 10
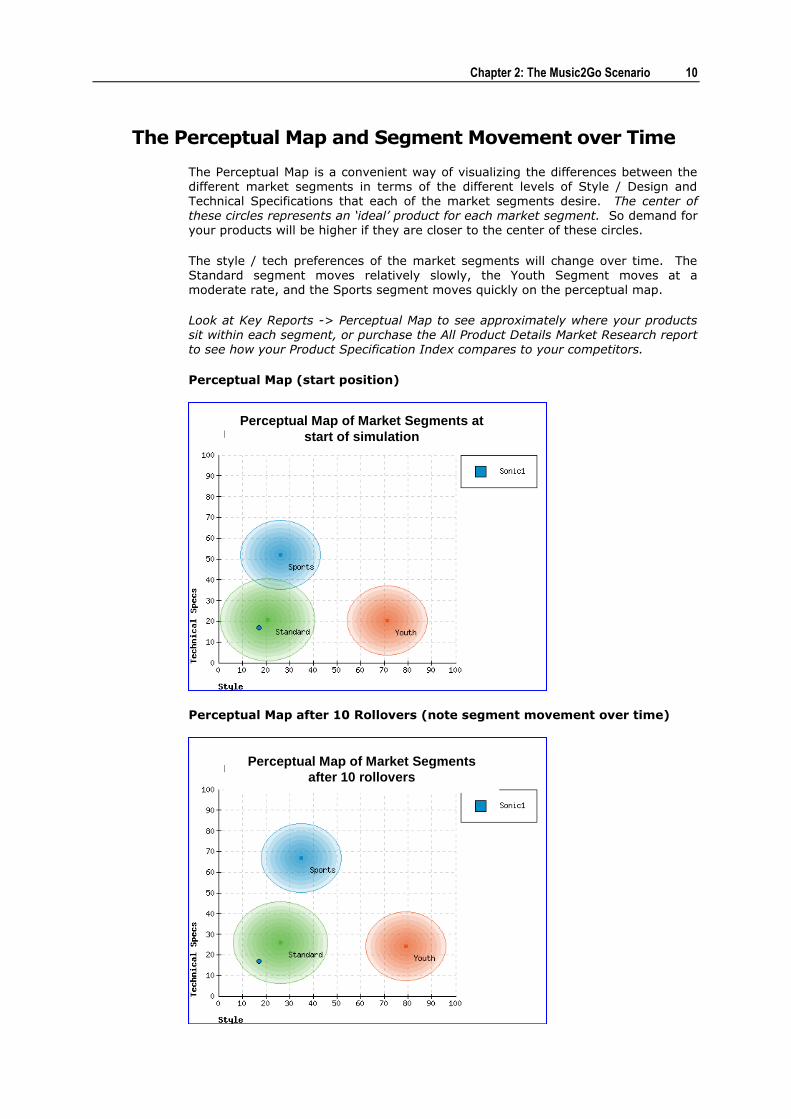
The Perceptual Map and Segment Movement over Time
The Perceptual Map is a convenient way of visualizing the differences between the different market segments in terms of the different levels of Style / Design and Technical Specifications that each of the market segments desire. The center of these circles represents an ‘ideal’ product for each market segment. So demand for your products will be higher if they are closer to the center of these circles.
The style / tech preferences of the market segments will change over time. The Standard segment moves relatively slowly, the Youth Segment moves at a moderate rate, and the Sports segment moves quickly on the perceptual map.
Look at Key Reports -> Perceptual Map to see approximately where your products sit within each segment, or purchase the All Product Details Market Research report to see how your Product Specification Index compares to your competitors.
Perceptual Map (start position)
Perceptual Map after 10 Rollovers (note segment movement over time)
Perceptual Map of Market Segments at
start of simulation
Perceptual Map of Market Segments
after 10 rollovers
Chapter 2: The Music2Go Scenario 11
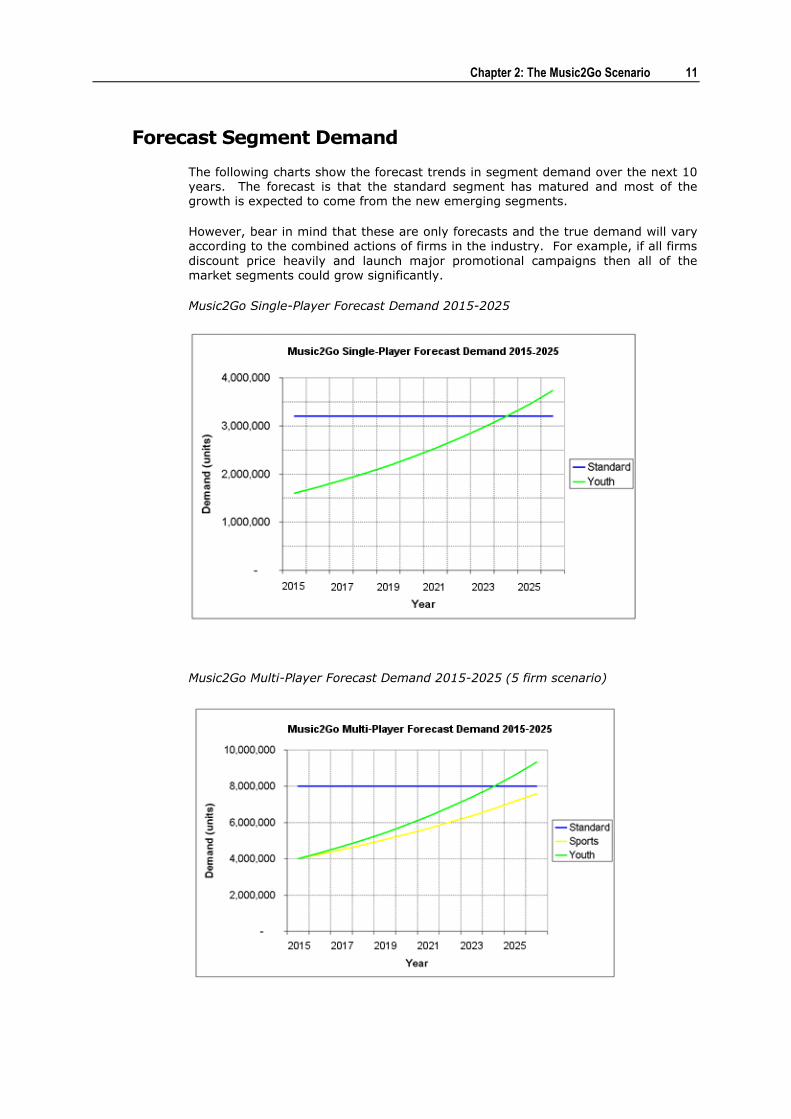
Forecast Segment Demand
The following charts show the forecast trends in segment demand over the next 10 years. The forecast is that the standard segment has matured and most of the growth is expected to come from the new emerging segments.
However, bear in mind that these are only forecasts and the true demand will vary according to the combined actions of firms in the industry. For example, if all firms
discount price heavily and launch major promotional campaigns then all of the market segments could grow significantly.
Music2Go Single-Player Forecast Demand 2015-2025
Music2Go Multi-Player Forecast Demand 2015-2025 (5 firm scenario)
Chapter 2: The Music2Go Scenario 12
Advertising Media Selection
In Music2Go, there are four media choices available to you to advertise your products:
Digital Media
Magazines
Newspapers
Television (TV)
Each media choice offers different performance in terms of reach, ability to target
and cost.
Digital Marketing via Digital Media allows you to engage and reach potential customers through the devices they use for work and leisure (such as computers, smartphones, tables, and games consoles). This medium has a similar reach to television, but you can create content and start reaching customers with a lower up-front investment. Digital Media also allows you to effectively target qualified customers via Internet and Mobile search based advertising.
Magazines can reach a national market at relatively low cost per reader. Special-interest magazines and regional editions of general interest magazines makes it possible for advertisers to reach a selected audience with a minimum of wasted circulation.
Newspapers reach a relatively large mass audience throughout a geographic region with a single exposure, at a relatively low cost per thousand. It is important to note that the readership of newspapers is heavily influenced by age, so there is little
readership in the Youth market segment.
Television is the most effective method of reaching a large audience. Virtually every household has a television and that over 85% of all age groupings watch television at least once a day. The television medium also has the advantage of combining motion, sound and special visual effects into an advertisement. As such it offers wide geographic coverage and flexibility in how a message can be presented.
However TV ads are expensive relative to other forms of media as you require a significant initial investment to develop a successful TV campaign.
Chapter 2: The Music2Go Scenario 13
Advertising Reach and Media Viewing Preferences
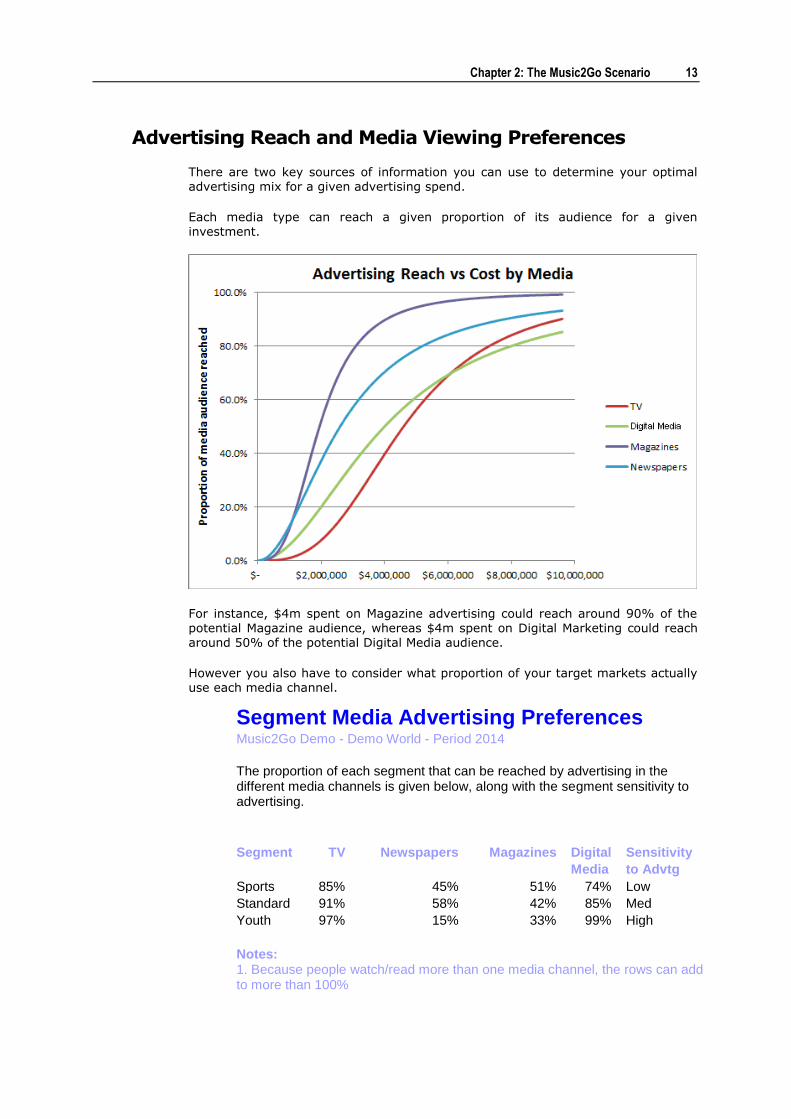
There are two key sources of information you can use to determine your optimal advertising mix for a given advertising spend.
Each media type can reach a given proportion of its audience for a given investment.
For instance, $4m spent on Magazine advertising could reach around 90% of the potential Magazine audience, whereas $4m spent on Digital Marketing could reach around 50% of the potential Digital Media audience.
However you also have to consider what proportion of your target markets actually use each media channel.
Segment Media Advertising Preferences Music2Go Demo - Demo World - Period 2014
The proportion of each segment that can be reached by advertising in the different media channels is given below, along with the segment sensitivity to advertising.
Segment TV Newspapers Magazines Digital Sensitivity
Media to Advtg
Sports 85% 45% 51% 74% Low
Standard 91% 58% 42% 85% Med
Youth 97% 15% 33% 99% High
Notes: 1. Because people watch/read more than one media channel, the rows can add to more than 100%
Chapter 2: The Music2Go Scenario 14
So lets look at the above example again and assume we have a $4m advertising budget to spend targeting the Standard market segment.
Only 42% of the Standard segment read magazines. So our $4m spend would reach approximately 90% * 42% = 37.8% of the Standard segment.
But 85% of the Standard segment use Digital Media. So our $4m spend would reach approximately 50% * 85% = 42.5% of the Standard segment.
But maybe we can do better than that still. What happens if we spend $2m on Newspapers, and $2m on Magazines?
If we spent $2m on Newspapers we could reach approximately 40% of Newspaper viewers. And 58% of the Standard segment reads Newspapers. So we could reach approximately 40% * 58% = 23.2% of the Standard segment.
If we spend $2m on Magazines we could reach approximately 50% of Magazine viewers. And 42% of the Standard segment reads Magazines. So we could reach approximately 50% * 42% = 21% of the Standard segment.
So together, our $4m spent half on Newspapers and half on Magazines would reach approximately 44.2% of the Standard segment. This is obviously a better use of our advertising budget than the first two options.
Distribution and Sales
Promotion
Distribution and Retail Margin
The distribution related decisions are very simple in Music2Go.
The 3 market segments have different sensitivity to distribution (Standard is high, Youth and Sports medium). Aside from Sales Promotion decisions, your challenge is to decide how to set the price and retail margin for each product in order to influence its distribution coverage in a way that increases its Marketing
Contribution.
Each product has a price and retail margin. Your distributors look at how much total retail margin they make from stocking each product and based on this they decide how many stores will stock each product. This then translates into a Distribution
Index which ranges from 0 to 1 (higher is better). In general as your distributors make more money from a given product, then more stores will stock it and the product’s Distribution Index will increase.
For instance, if you sold 1 million units of Product A at $100 with a 40% retail margin, then your distributors would make 1 million * 40% * $100 = $40m
But perhaps by dropping your price to $95, and your retail margin to 30% you can now sell 1.3 million units. Your distributors would then make 1.3 million * 30% * $95 = $37m
Chapter 2: The Music2Go Scenario 15
In this case, your Distribution Index for Product A would fall as your distributors made less retail margin in total. This may not be an issue in the Sports / Youth markets, but it may disadvantage you in the Standard market. And of course, it also depends on your competitor actions. If your competitors have much higher
distribution indexes than you, then you will lose more market share.
As you can see, sales volume is also an important component of distribution. So it may be beneficial for students to keep retail margins slightly higher whilst building initial market share for new products. And it may be possible to gradually reduce margins for established products with high sales volumes without adversely affecting their Distribution Index.
These are the types of distribution related trade-offs that students have to consider
in Music2Go when setting price and retail margin.
View Key Reports -> Some Product Details to see the Distribution Index for each of
your products.
Buy the Distribution Coverage and Sales Promotion Market Research report to see the Distribution Index and Sales Promotion Rating for all products on the market.
The Product Life Cycle
The Product Life Cycle is a useful way of thinking about the different promotional requirements as a product ages.
In Music2Go, new Products start in the Growth phase then over the next six
rollovers they gradually transition from Growth, to Mature, to the Decline phase.
Your existing product will be in the Mature phase of its life cycle for your first Sales Promotion decision. (Sales Promotion decisions are available after 1st rollover).
Life-Cycle Stage Age
GROWTH (new product / 0 years old)
GROWTH - STARTING TO MATURE (1 year old)
MOSTLY MATURE (2 years old)
MATURE (3 years old)
MATURE - STARTING DECLINE (4 years old)
MOSTLY DECLINE (5 years old)
DECLINE (6 years and older)
In Music2Go, the Product Life Cycle only affects the Sales Promotion decision (see below).
Buy the Distribution Coverage and Sales Promotion Market Research report to see the age and stage of product life cycle for all products on the market.
Chapter 2: The Music2Go Scenario 16
Sales Promotion and the Product Life Cycle
Sales Promotion decisions are available after the 1st rollover.
Sales Promotion in Music2Go works by boosting your distribution coverage and distribution index. You should buy the Distribution Coverage and Sales Promotion Market Research report for detailed information on the Sales Promotion Rating and stage of Product Life Cycle for all firms in the Industry.
There are 6 types of sales promotion activities available to you to promote your products and support your distributors:
Trade Shows
Salesforce Training
Premiums (Gifts)
Website / Social Media
Point of Purchase displays
Rebates
Each promotional activity has particular relevance to certain stages of the Product Life Cycle as outlined below. Note that the Distribution Coverage and Sales Promotion Market Research report will show the age and stage of product life cycle for every product on the market, as well as the Sales Promotion Rating and the Promotion Mix effectiveness. Use the following information and this report to optimize your Sales Promotion mix for your products every year.
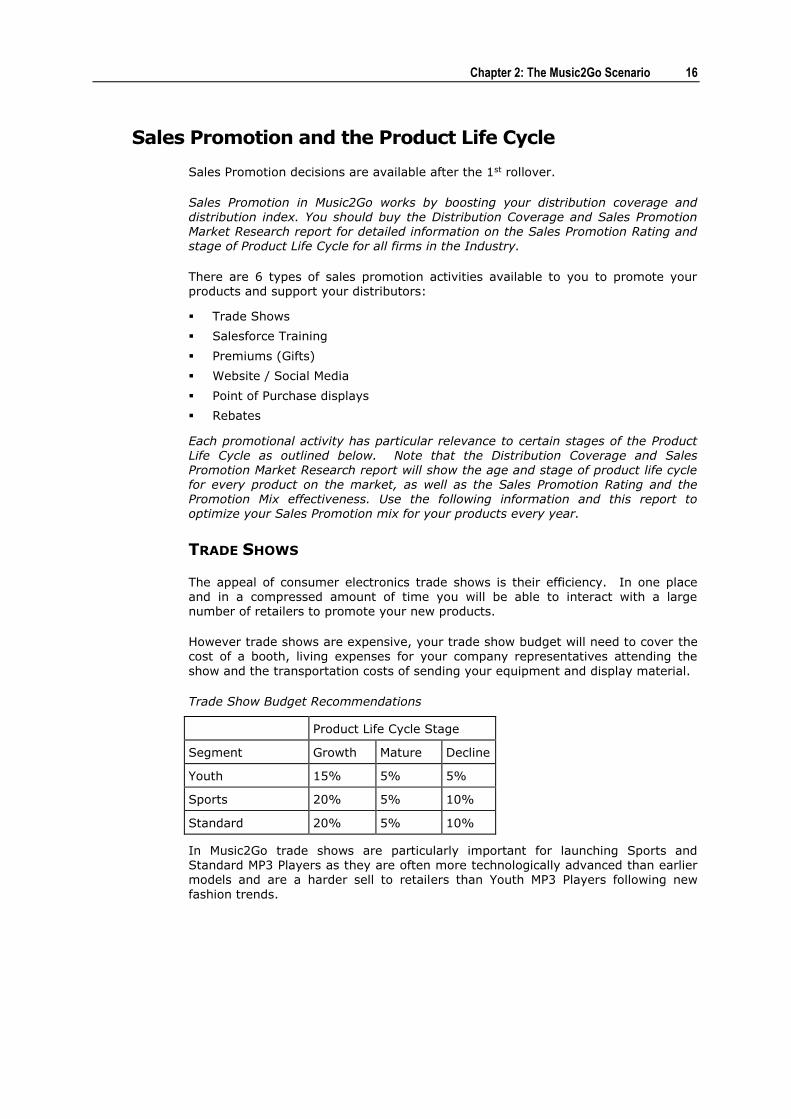
TRADE SHOWS
The appeal of consumer electronics trade shows is their efficiency. In one place and in a compressed amount of time you will be able to interact with a large
number of retailers to promote your new products.
However trade shows are expensive, your trade show budget will need to cover the cost of a booth, living expenses for your company representatives attending the
show and the transportation costs of sending your equipment and display material.
Trade Show Budget Recommendations
Product Life Cycle Stage
Segment Growth Mature Decline
Youth 15% 5% 5%
Sports 20% 5% 10%
Standard 20% 5% 10%
In Music2Go trade shows are particularly important for launching Sports and Standard MP3 Players as they are often more technologically advanced than earlier models and are a harder sell to retailers than Youth MP3 Players following new
fashion trends.
Chapter 2: The Music2Go Scenario 17
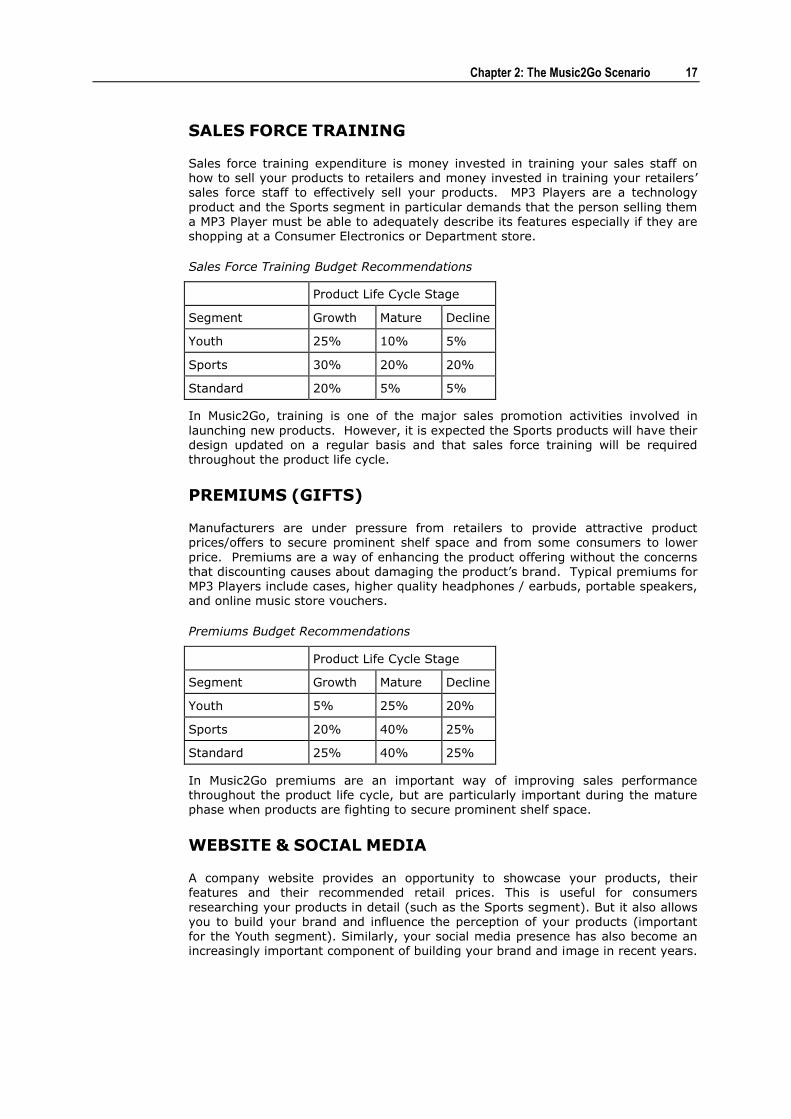
SALES FORCE TRAINING
Sales force training expenditure is money invested in training your sales staff on how to sell your products to retailers and money invested in training your retailers’ sales force staff to effectively sell your products. MP3 Players are a technology
product and the Sports segment in particular demands that the person selling them a MP3 Player must be able to adequately describe its features especially if they are shopping at a Consumer Electronics or Department store.
Sales Force Training Budget Recommendations
Product Life Cycle Stage
Segment Growth Mature Decline
Youth 25% 10% 5%
Sports 30% 20% 20%
Standard 20% 5% 5%
In Music2Go, training is one of the major sales promotion activities involved in
launching new products. However, it is expected the Sports products will have their design updated on a regular basis and that sales force training will be required throughout the product life cycle.
PREMIUMS (GIFTS)
Manufacturers are under pressure from retailers to provide attractive product prices/offers to secure prominent shelf space and from some consumers to lower
price. Premiums are a way of enhancing the product offering without the concerns that discounting causes about damaging the product’s brand. Typical premiums for MP3 Players include cases, higher quality headphones / earbuds, portable speakers, and online music store vouchers.
Premiums Budget Recommendations
Product Life Cycle Stage
Segment Growth Mature Decline
Youth 5% 25% 20%
Sports 20% 40% 25%
Standard 25% 40% 25%
In Music2Go premiums are an important way of improving sales performance throughout the product life cycle, but are particularly important during the mature phase when products are fighting to secure prominent shelf space.
WEBSITE & SOCIAL MEDIA
A company website provides an opportunity to showcase your products, their features and their recommended retail prices. This is useful for consumers
researching your products in detail (such as the Sports segment). But it also allows you to build your brand and influence the perception of your products (important for the Youth segment). Similarly, your social media presence has also become an increasingly important component of building your brand and image in recent years.
Chapter 2: The Music2Go Scenario 18
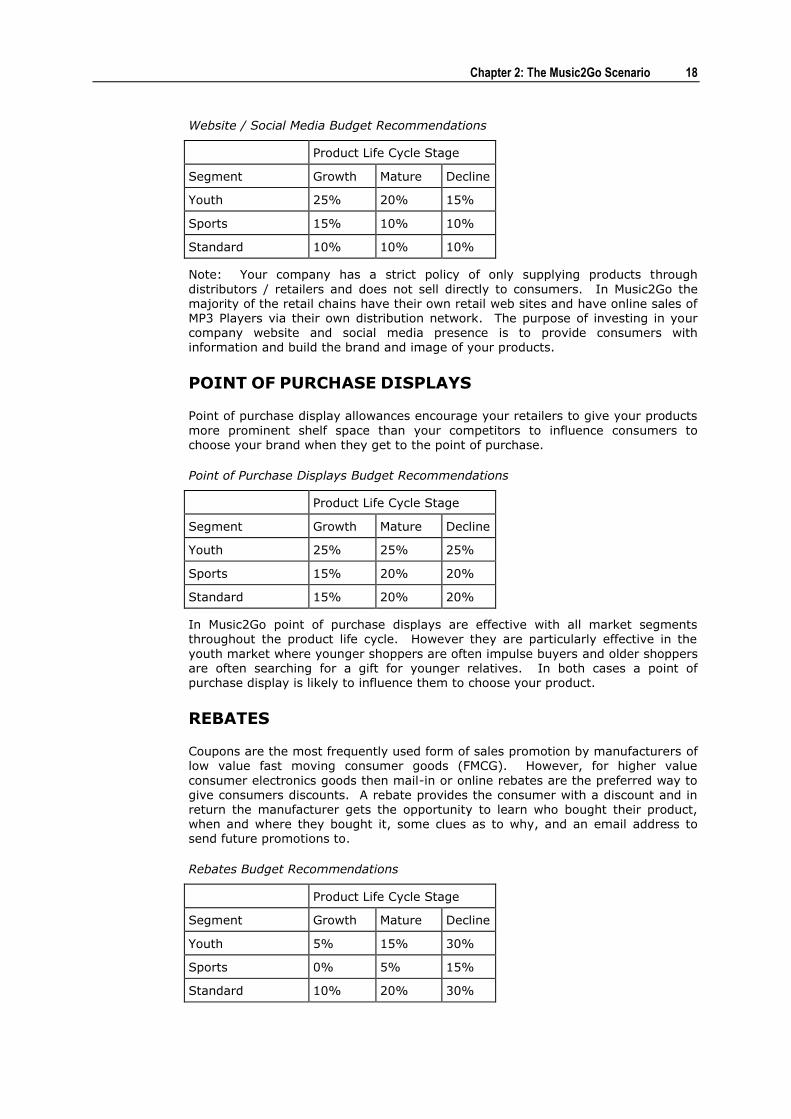
Website / Social Media Budget Recommendations
Product Life Cycle Stage
Segment Growth Mature Decline
Youth 25% 20% 15%
Sports 15% 10% 10%
Standard 10% 10% 10%
Note: Your company has a strict policy of only supplying products through
distributors / retailers and does not sell directly to consumers. In Music2Go the majority of the retail chains have their own retail web sites and have online sales of MP3 Players via their own distribution network. The purpose of investing in your company website and social media presence is to provide consumers with information and build the brand and image of your products.
POINT OF PURCHASE DISPLAYS
Point of purchase display allowances encourage your retailers to give your products
more prominent shelf space than your competitors to influence consumers to choose your brand when they get to the point of purchase.
Point of Purchase Displays Budget Recommendations
Product Life Cycle Stage
Segment Growth Mature Decline
Youth 25% 25% 25%
Sports 15% 20% 20%
Standard 15% 20% 20%
In Music2Go point of purchase displays are effective with all market segments throughout the product life cycle. However they are particularly effective in the
youth market where younger shoppers are often impulse buyers and older shoppers are often searching for a gift for younger relatives. In both cases a point of purchase display is likely to influence them to choose your product.
REBATES
Coupons are the most frequently used form of sales promotion by manufacturers of low value fast moving consumer goods (FMCG). However, for higher value
consumer electronics goods then mail-in or online rebates are the preferred way to give consumers discounts. A rebate provides the consumer with a discount and in return the manufacturer gets the opportunity to learn who bought their product, when and where they bought it, some clues as to why, and an email address to send future promotions to.
Rebates Budget Recommendations
Product Life Cycle Stage
Segment Growth Mature Decline
Youth 5% 15% 30%
Sports 0% 5% 15%
Standard 10% 20% 30%
Chapter 2: The Music2Go Scenario 19
In Music2Go, the Youth and Standard segments respond well to rebates and it is an especially effective means of promotion during the mature and decline stages of their product life cycle. However, the Sports segment views discounted items as being of poor quality and given their preference for products at the leading edge of
technology only a small rebate budget is required mainly for purchases made through discount stores.
How do I choose a Sales Promotion Mix for my products?
Remember that each of your products will progress through the Product Life Cycle starting in the Growth phase for new products, and then gradually progressing through to the Decline stage over the next six rollovers.
So say we launch a new Sports product this period. This new product will start in the Growth phase of the Product Life Cycle. Then from looking at the tables above
we can see that our ideal Sales Promotion Mix for a new Sports product is:
Trade Shows 20%
Sales Force Training 30%
Premiums (Gifts) 20%
Website and Social Media 15%
Point of Purchase Displays 15%
Rebates 0%
Total 100%
That was a simple example. But what happens in the second year that we sell this Sports product? The product will have moved from the ‘Growth’ phase to ‘Growth – Starting to Mature’. So the optimal Sales Promotion mix will be 1/3 of the way between the ideal Growth and Mature figures in the tables above. That would give us an optimal Sales Promotion mix something like:
Trade Shows 15% (Ideal Growth = 20%, Ideal Mature = 5%)
Sales Force Training 27% (Ideal Growth = 30%, Ideal Mature = 20%)
Premiums (Gifts) 26% (Ideal Growth = 20%, Ideal Mature = 40%)
Website and Social Media 13% (Ideal Growth = 15%, Ideal Mature = 10%)
Point of Purchase Displays 17% (Ideal Growth = 15%, Ideal Mature = 20%)
Rebates 2% (Ideal Growth = 0%, Ideal Mature = 5%)
Total 100%
You should buy the Distribution Coverage and Sales Promotion Market Research report for detailed information on the Sales Promotion Rating and stage of Product Life Cycle for all firms in the Industry.

Once you have read Chapter 2 and have a basic understanding of the Music2Go
market segments, then you are ready to make some actual decisions for your Firm.
Price
Product Pricing Screen
The Product Price screen is used to enter retail pricing, retailer margin, and a sales forecast for each of your firm's products for the coming year. You start Music2Go with a single existing product, but will eventually be able to launch a maximum of 4 products.
RETAIL PRICE (RRP)
The Retail Price is the retail price that you recommend to your retailers that they
sell your product for.
Note that you only receive the Wholesale Price which is Retail Price less Retailer Margin.
Chapter 3 - The Decision Screens
Chapter 3 - The Decision Screens 21
RETAILER MARGIN
The Retailer Margin indicates the percentage of a product's retail selling price that the retailer receives as commission for selling that product. The number of retailers that choose to stock your product is partly due to the absolute amount of money
that they gain from selling your product.
The amount of money that retailers receive is equal to the sales volume that they sell times the commission they get per unit. So increasing your retailer margin will increase the number of retailers willing to stock your product provided that your sales do not decrease from last year.
So if you set a RRP of $100 and a Retailer Margin of 35%, then for each unit sold
you will receive the wholesale price of $100 * (1 - 0.35) = $65
This is shown in the Unit Margin field on the pricing screen. Your unit margin is the
amount of Gross Margin you make on each unit sold.
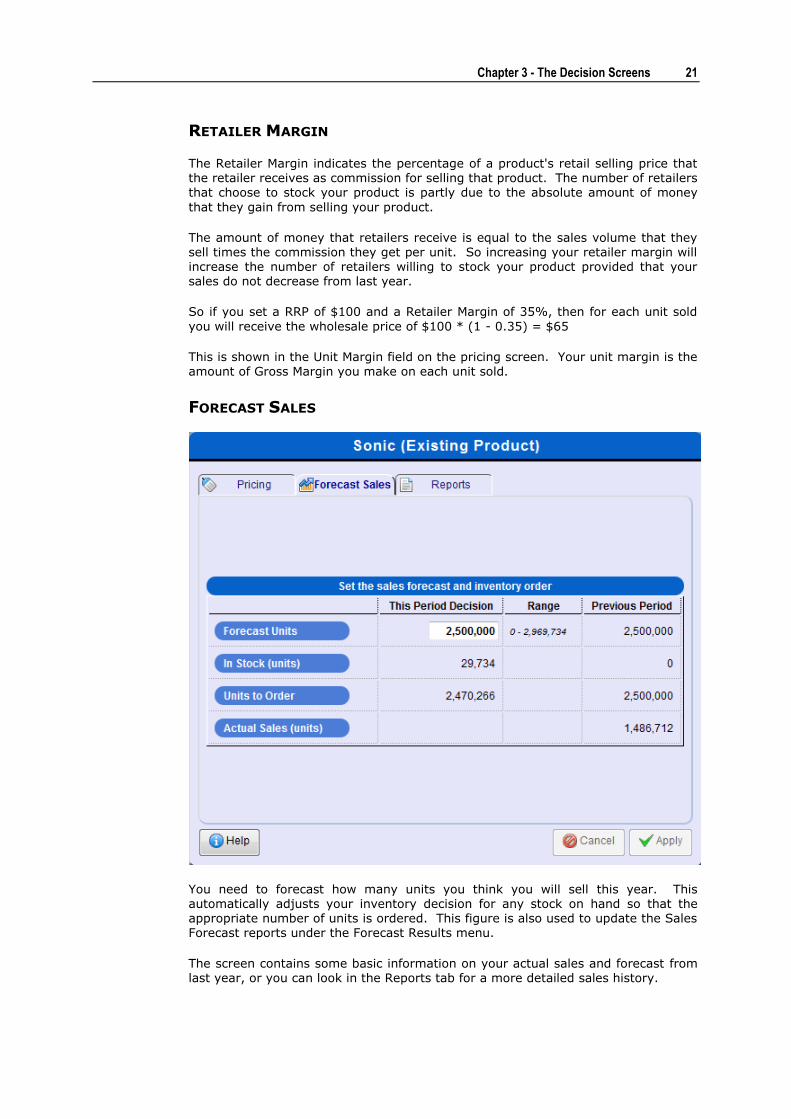
FORECAST SALES
You need to forecast how many units you think you will sell this year. This automatically adjusts your inventory decision for any stock on hand so that the appropriate number of units is ordered. This figure is also used to update the Sales Forecast reports under the Forecast Results menu.
The screen contains some basic information on your actual sales and forecast from last year, or you can look in the Reports tab for a more detailed sales history.
Chapter 3 - The Decision Screens 22
DEMAND RESPONSIVENESS
In Music2Go you make decisions for an entire year. But your factory has a limited ability to adjust the number of units produced to try to meet actual demand during the year. This is called Demand Responsiveness. Most worlds have 20% Demand
Responsiveness enabled, although your instructor may request this to be modified or disabled for your multi-player.
Demand Responsiveness allows the actual number of units ordered to increase or decrease by up to 20% to meet the actual demand for your product. ie. if you ordered 1 million units of a product, then the actual number of units delivered could vary between 800,000 units and 1.2 million units depending on actual demand. This
happens automatically during rollover and does not require any additional action by you or your team members.
How do I set the price and margin for each product?
When setting the Retail Price, you should consider things like:
How much competition is there in this market segment?
How are my competitors pricing their products in this market segment?
How sensitive is this market segment to price? What are the minimum and
maximum price levels for this market? Note - we recommend staying away from the top 5-10% of the price range for every market segment, even for price insensitive segments. The maximum price is the level beyond which NO consumers will buy your products. So even for price insensitive segments, a product that is priced at the maximum looks
like poor value compared to a more reasonably priced product.
Similarly do not price too close to the minimum price level for a given market. The extra market share is unlikely to make up for your smaller margins. Start off somewhere in the upper-middle of the price range and work your way up or down from there.
What is my overall strategy? Am I a high volume / low cost manufacturer? Should I aim for lower volume / higher margin?
What are my projected sales for a given pricing level and advertising mix?
Once you have set your price, consider your retailer margin, unit cost, unit margin, and sales projections. Look carefully at the your Forecast Results reports and your
Forecast Marketing Contribution report. If your sales projections are accurate, will you make sufficient gross margin to give you a positive Marketing Contribution? Is it worth giving your Distributors more Retail Margin early in the simulation to encourage them to stock your products and gain market share? Or do you already have sufficient market share and distribution that you can afford to cut your Retail
Margins?
Chapter 3 - The Decision Screens 23
Advertising
Advertising Screen
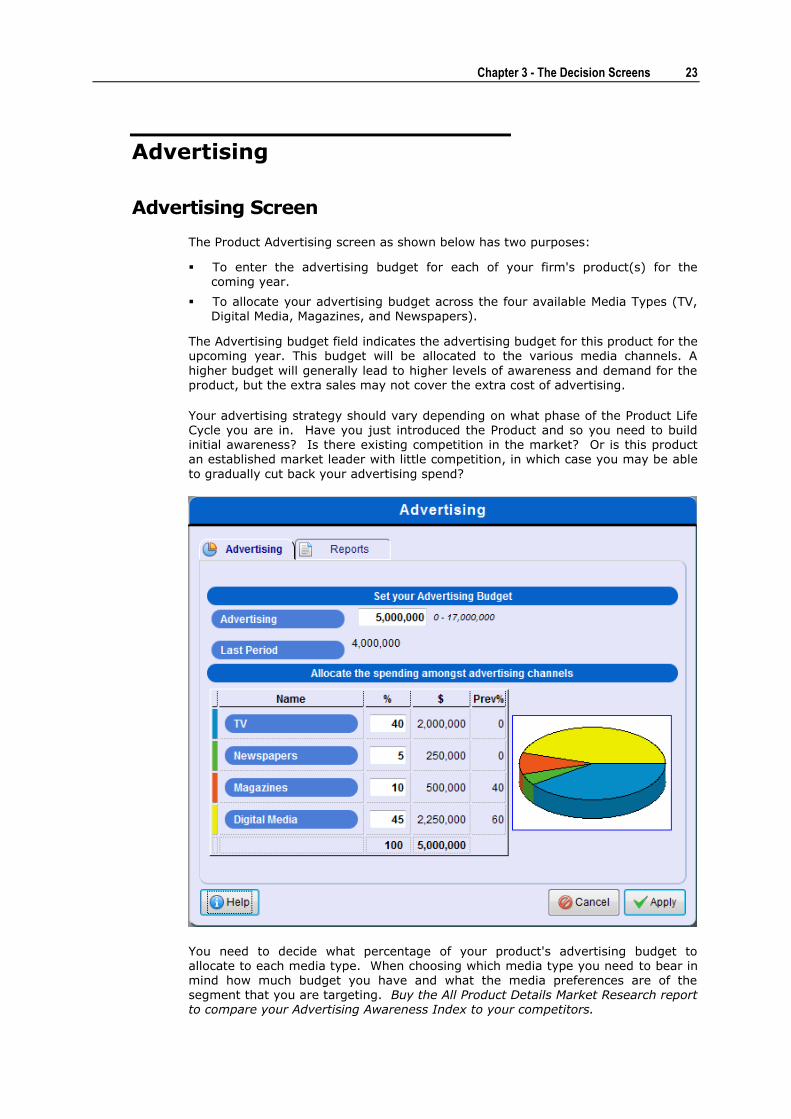
The Product Advertising screen as shown below has two purposes:
To enter the advertising budget for each of your firm's product(s) for the coming year.
To allocate your advertising budget across the four available Media Types (TV, Digital Media, Magazines, and Newspapers).
The Advertising budget field indicates the advertising budget for this product for the upcoming year. This budget will be allocated to the various media channels. A
higher budget will generally lead to higher levels of awareness and demand for the product, but the extra sales may not cover the extra cost of advertising.
Your advertising strategy should vary depending on what phase of the Product Life Cycle you are in. Have you just introduced the Product and so you need to build initial awareness? Is there existing competition in the market? Or is this product an established market leader with little competition, in which case you may be able
to gradually cut back your advertising spend?
You need to decide what percentage of your product's advertising budget to allocate to each media type. When choosing which media type you need to bear in mind how much budget you have and what the media preferences are of the segment that you are targeting. Buy the All Product Details Market Research report to compare your Advertising Awareness Index to your competitors.
Chapter 3 - The Decision Screens 24
Sales Promotion
Sales Promotion Strategy Screen
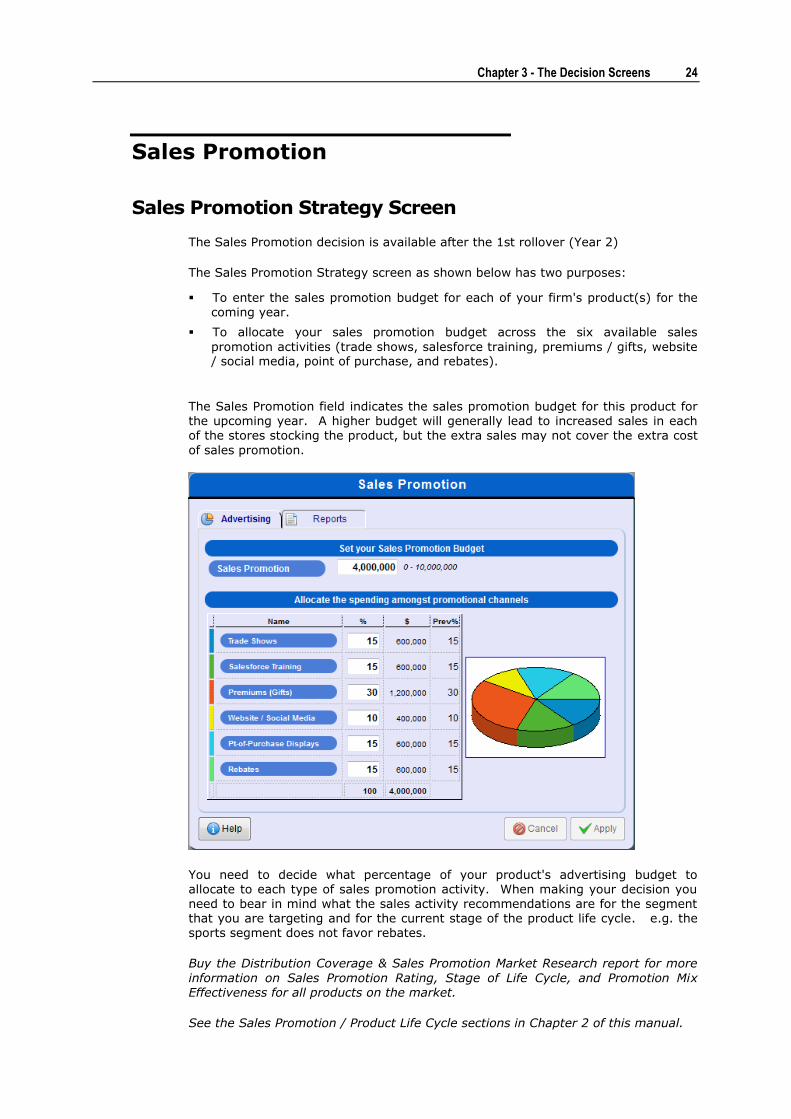
The Sales Promotion decision is available after the 1st rollover (Year 2)
The Sales Promotion Strategy screen as shown below has two purposes:
To enter the sales promotion budget for each of your firm's product(s) for the coming year.
To allocate your sales promotion budget across the six available sales
promotion activities (trade shows, salesforce training, premiums / gifts, website / social media, point of purchase, and rebates).
The Sales Promotion field indicates the sales promotion budget for this product for the upcoming year. A higher budget will generally lead to increased sales in each of the stores stocking the product, but the extra sales may not cover the extra cost
of sales promotion.
You need to decide what percentage of your product's advertising budget to allocate to each type of sales promotion activity. When making your decision you need to bear in mind what the sales activity recommendations are for the segment that you are targeting and for the current stage of the product life cycle. e.g. the sports segment does not favor rebates.
Buy the Distribution Coverage & Sales Promotion Market Research report for more
information on Sales Promotion Rating, Stage of Life Cycle, and Promotion Mix Effectiveness for all products on the market.
See the Sales Promotion / Product Life Cycle sections in Chapter 2 of this manual.
Chapter 3 - The Decision Screens 25
Product Development
Product Development allows you to launch new products, reduce the unit cost of existing products, and improve Style and Technical specs (product attributes) of existing products.
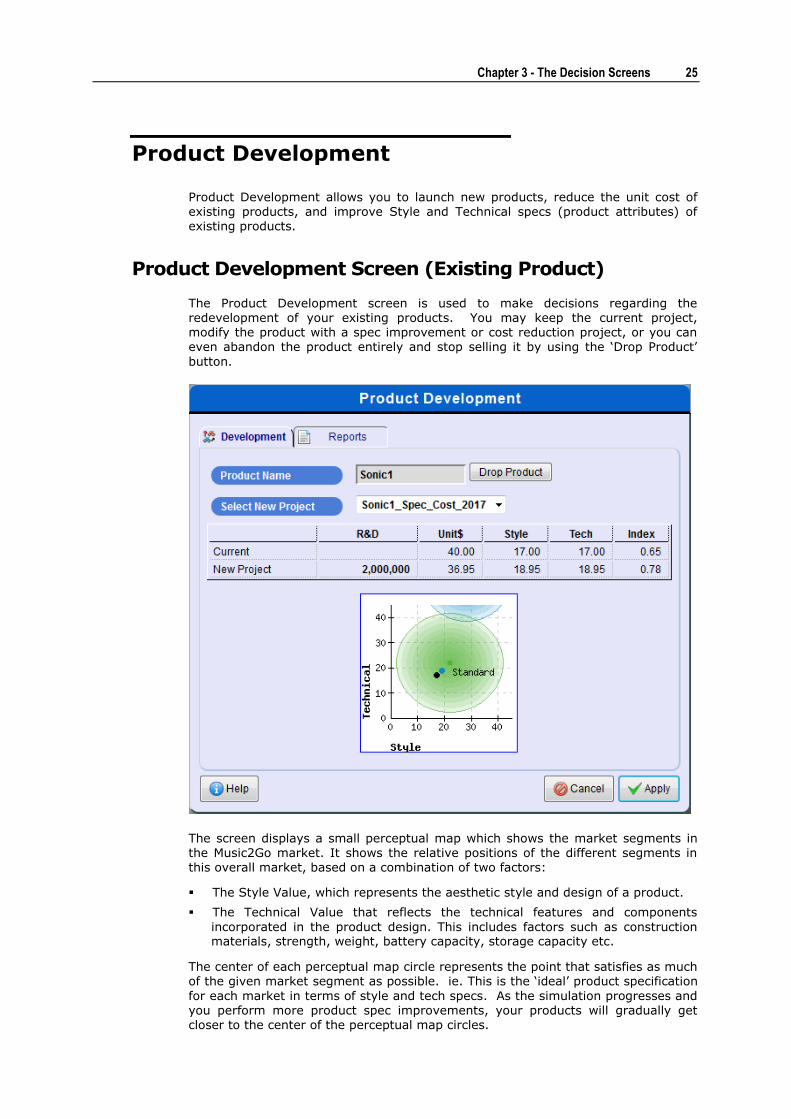
Product Development Screen (Existing Product)
The Product Development screen is used to make decisions regarding the redevelopment of your existing products. You may keep the current project, modify the product with a spec improvement or cost reduction project, or you can even abandon the product entirely and stop selling it by using the ‘Drop Product’
button.
The screen displays a small perceptual map which shows the market segments in
the Music2Go market. It shows the relative positions of the different segments in this overall market, based on a combination of two factors:
The Style Value, which represents the aesthetic style and design of a product.
The Technical Value that reflects the technical features and components
incorporated in the product design. This includes factors such as construction materials, strength, weight, battery capacity, storage capacity etc.
The center of each perceptual map circle represents the point that satisfies as much of the given market segment as possible. ie. This is the ‘ideal’ product specification
for each market in terms of style and tech specs. As the simulation progresses and you perform more product spec improvements, your products will gradually get closer to the center of the perceptual map circles.
Chapter 3 - The Decision Screens 26
Note: You should also review the Perceptual Map and Segment Movement over time section in Chapter 2. The preferences of your customers tend to increase over time, which means that without performing spec improvement projects your products will gradually drift towards the outer regions of the perceptual map circles.
This may not be a problem in the Standard segment, but the Youth segment has medium sensitivity to product specifications and the Sports segment is highly sensitive to product specifications.
The Product Development screen also has a Reports tab which shows useful information about past product development and a bigger perceptual map showing your firm's products and the market segments.
MODIFYING A PRODUCT / SELECTING AN AVAILABLE PROJECT
The drop-down ‘Select New Project’ combo box lists all the projects / designs that you can redevelop your existing product with.
Keeping the current project means you will continue to sell last year's model for another year.
Each project / design has a:
Cost to develop
Unit Cost
Style Value
Technical Value
Generally you will be offered three options each year:
Productname_spec_year (improve the product's technical and style values)
Productname_cost_year (reduce the product's unit cost)
Productname_spec_cost_year (do both)
E.g. if next year is 2017 and your product's name is Sonic, then option 1 above would be Sonic_spec_2017.
Generally, a specification improvement project costs the same as a unit cost reduction project ($1 million), and the combined project costs double ($2 million). A specification project will make your product more attractive to the market, while a cost project will not improve your product's attractiveness but will reduce your unit costs allowing you to make more profit per unit sold.
Note that the cost of product development projects is not deducted from your
marketing budget. However it does affect your Marketing Contribution.
Choosing which project to implement should be clear from your marketing objectives in your annual marketing plan and the needs of your target markets. But sometimes it is obvious when a project is beneficial. For instance if you are selling 1 million units of a product, and a cost reduction project that costs $1m can
drop your unit cost price from $40 to $38, then that cost reduction project would improve your Gross Margin (and therefore your Marketing Contribution) by $2m
every year for a one-time cost of $1m.
Note: If you either update or abandon a product then any existing inventory will be dumped at 93.5% of the cost price. For example if you have $1 million worth of inventory, then you will only receive $935,000 and make a $65,000 inventory disposal loss this year.
Chapter 3 - The Decision Screens 27
However you may find a portion of this inventory disposal loss is offset because your inventory holding cost will be lower for the year. This happens because the old stock is dumped immediately at the start of the year, so the overall effect on your Marketing Contribution will be reduced.
ABANDONING AN EXISTING PRODUCT
You may find that your marketing budget is not sufficient to adequately promote all of your products, especially if you have three or more products. If you wish to abandon and withdraw a poorly performing product from the market you can click the ‘Drop Product’ button on the Product Development screen. The product will no longer be sold, and any existing stocks will be dumped at 93.5% of the cost price.
You will then be able to devote more of your marketing budget to your other products.
Launch New Product Screen
This screen allows you to launch a new product if you want to. The screen is very similar to the Product Development screen for existing products.
You need to make three decisions.
PRODUCT NAME
The Product Name field is where you need to type the name of your new product. Your product name can be any name up to a maximum of 10 characters. The
product name you choose has no effect on product demand in Music2Go, but as marketing professionals you should choose a name that reflects your positioning strategy for this product.
SELECT MARKET SEGMENT
Choose whether you want to launch a Standard, Youth, or Sports product (Multi-Player only). This is the most important aspect of launching a new product. You
should have a clear idea of which market segment you want to target, and why.
SELECT NEW PROJECT
The drop-down ‘Select New Project’ combo box lists all the designs that you can use to launch your new product with, although there is usually only one design you can choose for each market segment. Select the design you wish to launch and push the apply button.
Once you click the Apply button, the Launch New Product screen is replaced by a New Product screen where you should make price, sales forecast, advertising, and sales promotion decisions for your new product.
Always remember to check Forecast Results -> Budget Spending Report to make sure that your decisions remain within budget. This becomes more important with multiple products because it is easy to exceed your budget.
Remember also that you will get a temporary boost of $10m to your marketing budget in the period that you launch a new product. This allows you to build initial awareness for your new product, but you will need to watch your budget carefully after the initial launch period to ensure that you can adequately promote all of your products.
There are a variety of Market Research reports available for purchase every year,
and effective use of Market Research is critical to succeeding in Music2Go. We strongly recommend you familiarize yourself with the available Market Research reports in the Single-Player before your Multi-Player competition starts so you can purchase wisely.
One of the key lessons in Music2Go is that information has a value. By spending on Market Research, you can make better decisions. You can save money by not purchasing Market Research, but you may find your competitors who invest in
Market Research out-perform you.
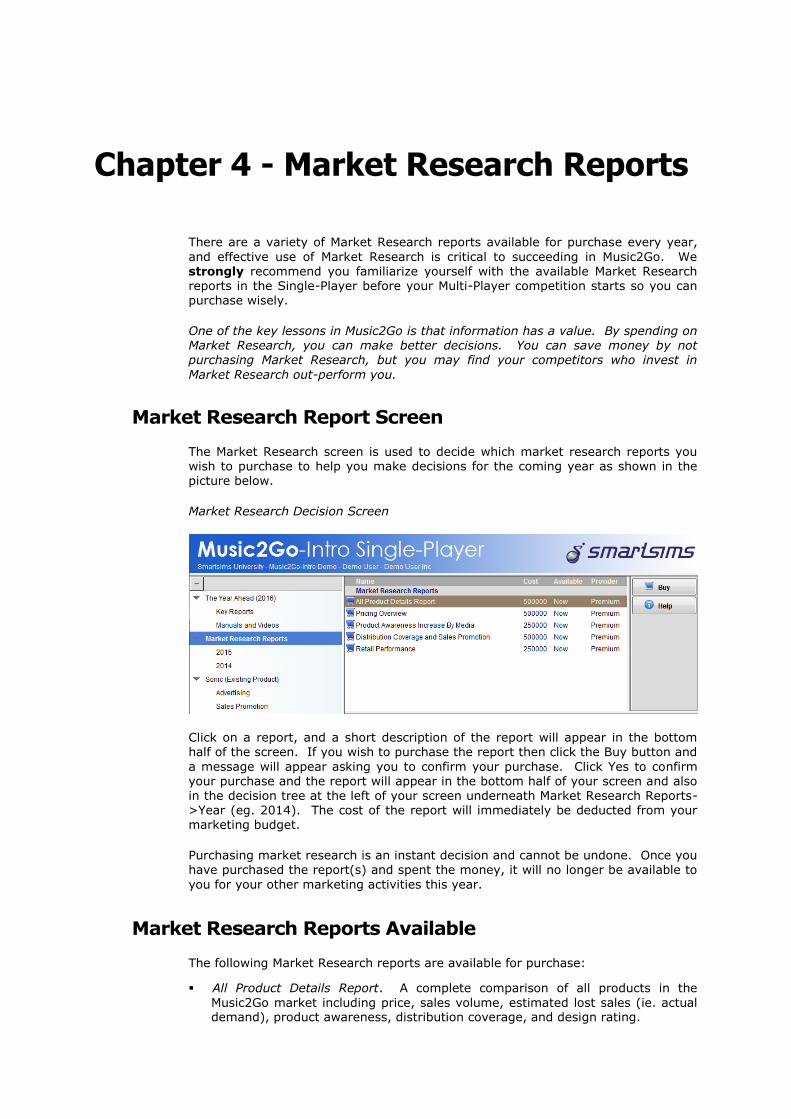
Market Research Report Screen
The Market Research screen is used to decide which market research reports you wish to purchase to help you make decisions for the coming year as shown in the picture below.
Market Research Decision Screen
Click on a report, and a short description of the report will appear in the bottom half of the screen. If you wish to purchase the report then click the Buy button and
a message will appear asking you to confirm your purchase. Click Yes to confirm your purchase and the report will appear in the bottom half of your screen and also in the decision tree at the left of your screen underneath Market Research Reports->Year (eg. 2014). The cost of the report will immediately be deducted from your marketing budget.
Purchasing market research is an instant decision and cannot be undone. Once you have purchased the report(s) and spent the money, it will no longer be available to
you for your other marketing activities this year.
Market Research Reports Available
The following Market Research reports are available for purchase:
All Product Details Report. A complete comparison of all products in the
Music2Go market including price, sales volume, estimated lost sales (ie. actual demand), product awareness, distribution coverage, and design rating.
Chapter 4 - Market Research Reports
Chapter 4 - Market Research Reports 29
Pricing Overview. Shows the sales volume, price index, retail price, wholesale
price, production cost, and gross margin for all firms and products. This is useful for analyzing your competitors' cost structure.
Product Awareness Increase Due to Media Advertising. The increase in product
awareness of each of your products due to each media type that it was advertised in last period. This allows you to see which parts of your advertising mix were most effective in increasing product awareness last period.
Distribution Coverage and Sales Promotion. Shows distribution coverage, sales
promotion budget, sales promotion rating, stage of product life cycle, and sales promotion mix effectiveness for all firms and products.
Retail Performance and Stores Stocking. Shows retailer margin, distribution
coverage, and the number of stores stocking each product in the Music2Go market.
Free Market Research - Some Product Details Report
See Key Reports->Some Product Details Report.
A comparison of all products in the Music2Go market including price, sales volume, and estimated lost sales for your products. Estimated lost sales is very useful
because it tells you how many more products you could have sold if you had ordered more stock.
Free Market Research - Market Information Report
See Key Reports -> Market Information Report
The information in Chapter 2 of the Players Manual is summarized in the Market
Information report under Key Reports. This gives you a useful quick reference for most things you need to know to play Music2Go.
You should consider printing out this report to refer to when you make
your decisions.
In particular this report shows:
Segment Size and Price Range. An estimate of the current potential size of
each market segment, its sensitivity to price, and its recommended retail price range. Note that the potential market size estimates are updated every period based on underlying growth and the performance of all products on the market.
Segment Media Advertising Preferences. Media viewing habits for each
segment including advertising sensitivity. You will need this information to help plan your advertising mix.
Advertising Reach Curves
Consumer sensitivity to Advertising, Distribution, Price, and Product Specs
Key Reports Menu
The Key Reports menu contains important reports that you will need every year. This section of the Players Manual gives an example of some of these reports and how to interpret them.
Forecast Marketing Expenditure Budget
See Key Reports -> Budgeted Expenditure Report
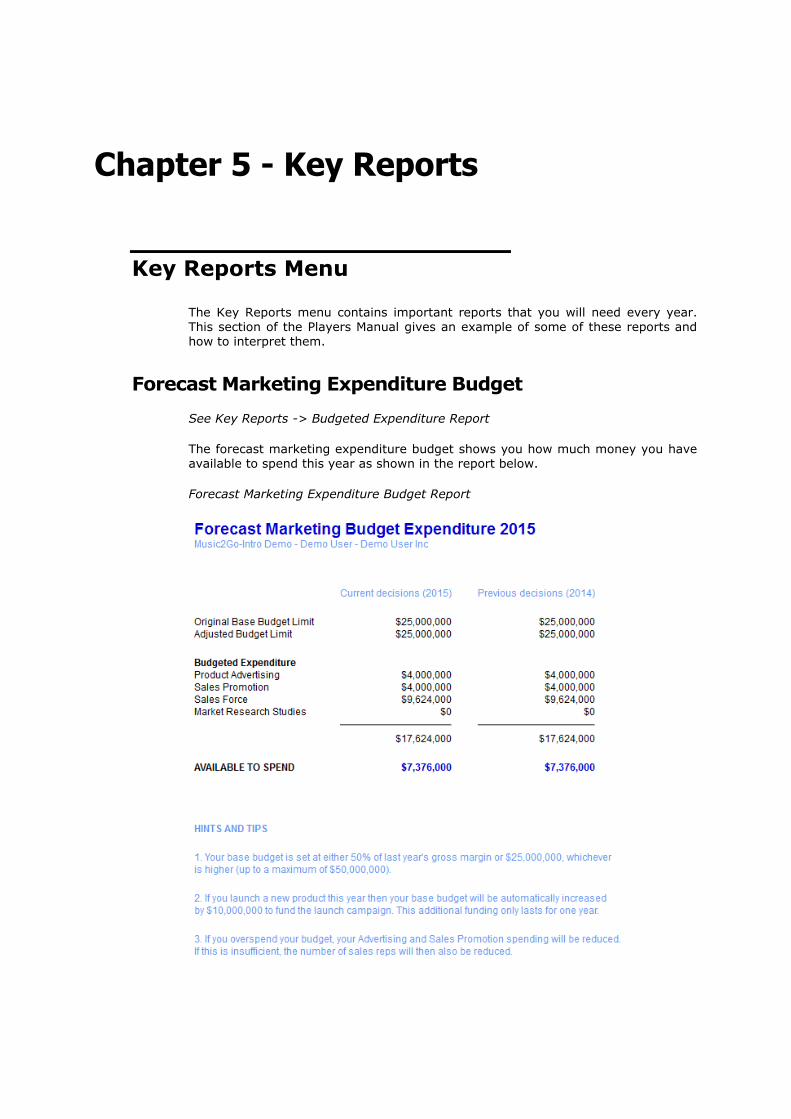
The forecast marketing expenditure budget shows you how much money you have available to spend this year as shown in the report below.
Forecast Marketing Expenditure Budget Report
Chapter 5 - Key Reports
Chapter 5 - Key Reports 31
There are three key parts of this report that you must understand.
BUDGET LIMIT
Your original base budget limit is set at either 50% of last year's gross margin or $25 million; whichever is higher. However your base budget limit can not be any
higher than $50 million. See the Industry Benchmark report section below for a more detailed discussion of gross margin.
Your adjusted budget limit is the actual budget that you have available for this period. This is your original base budget plus any adjustments. There are only two possible types of adjustments:
If you launch a new product then you are given a one year $10 million budget increase to fund the launch costs.
In Music2Go Multi-Player your course instructor is able to increase or decrease
your budget.
For example, if your Sales last year were $150m, and your Cost of Goods Sold was
$90m, then your Gross Margin was $60m. So your marketing budget for this year will be 0.5 * $60m = $30m.
BUDGETED EXPENDITURE
The first column in this section shows how much money you currently have allocated to product advertising, sales promotion, and market research. Changing any of your decisions in these areas will automatically update this report.
The second column shows you how much you spent last year.
AVAILABLE TO SPEND
This is how much unallocated budget you have left, i.e. how much money you still have available to spend if you want to. Any money you spend will be deducted from your marketing contribution, so you should only spend money on activities where you think the return will more than cover the cost.
If this number is negative that means that you have exceeded your budget and you need to choose which marketing activities to cut back. If you do not do so yourself, then the Music2Go will automatically reduce your Advertising and Sales Promotions budgets during the rollover to bring you back within budget.
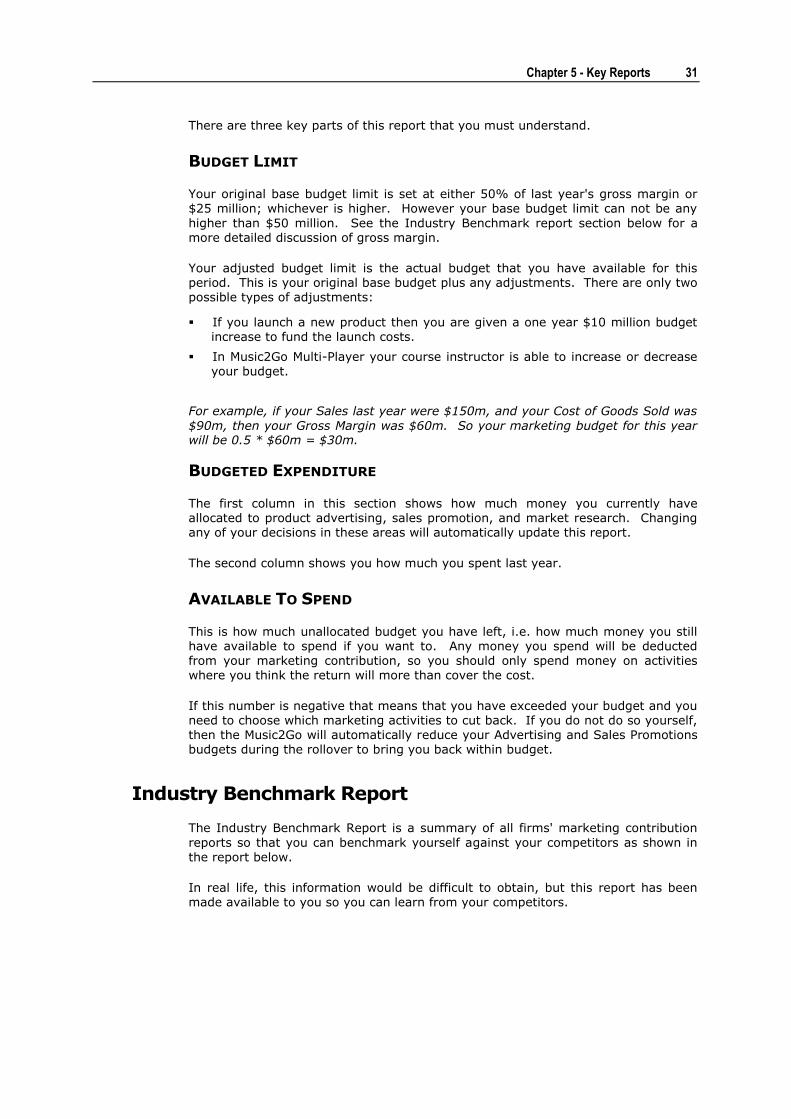
Industry Benchmark Report
The Industry Benchmark Report is a summary of all firms' marketing contribution
reports so that you can benchmark yourself against your competitors as shown in
the report below.
In real life, this information would be difficult to obtain, but this report has been made available to you so you can learn from your competitors.
Chapter 5 - Key Reports 32
There are several key parts of this report that you need to understand.
SALES AND GROSS MARGIN
The Sales Revenue listed for each is the total wholesales sales revenue of all of the
firm's products. The Cost of Goods sold is the number of units of a particular product sold multiplied by its manufacturing cost. So for instance, if you sold 1 million units at a cost of $40 per unit, then the Cost of Goods Sold would be $40m. See the product pricing decision screen for each of your products to see their unit manufacturing cost.
Chapter 5 - Key Reports 33
Gross Margin is the amount of profit that each firm made after the manufacturing costs were deducted. To increase your firm's gross margin you need to consider:
Increasing sales revenue, i.e. increase sales volume (units) and/or increase price
Decrease Cost of Goods sold per unit, i.e. invest in product development projects that reduce unit cost.
INVENTORY COSTS
There are two types of inventory costs:
Inventory Holding Cost. Each year all firms are charged 3.5% of the value of
their average closing inventory for inventory holding costs to cover the cost of warehousing etc. For instance, if you have 1 million units of unsold stock at the end of the year at
a cost of $40 per unit, then you have $40m of inventory which will cost 3.5% * $40m = $1.4m in holding costs.
Inventory Disposal Loss. If a firm updates a product with a new design or
abandons it altogether then all existing inventory is dumped at 93.5% of what the firm paid for it. e.g. $1m of inventory would be dumped for $935K giving a loss of $65K.
You can gather some valuable market research from looking at the figures for your competitors. Firms that have no inventory holding costs have stocked out, because they are under forecasting demand for their products. Firms with large inventories
are over-forecasting demand. If you see any inventory disposal costs, then you know that your competitor has either updated an existing product's design or abandoned one.
PRODUCT MARKETING
This section shows the combined Product Advertising and Sales Promotion budgets for all products that each firm is marketing. This allows you see how much money your competitors are spending on promotion but not how they are allocating it to
individual products.
FIRM MARKETING
The Sales Force management budget is fixed and you can NOT control this. This value is the same for all your competitors.
The Market Research budgets lets you know whether your competitors are buying a little or a lot of Market Research.
The Product Development budget lets you know whether your competitors have improved any of their products in the last year and/or launched new ones.
MARKETING CONTRIBUTION
Marketing contribution is the amount of profit remaining after manufacturing (cost of goods sold) and marketing expenditures have been deducted. The only costs still to be deducted are other functional overhead costs for your firm, e.g. finance,
administration etc.
Marketing contribution is a measure of how profitable your firm is as a result of your strategic marketing plan.
Chapter 5 - Key Reports 34
Your goal in Music2Go is to beat your competitors by maximizing the Total Marketing Contribution of your firm. To do this you will need to carefully plan your Marketing Strategy, decide which markets to enter, how to price each product, conduct and analyze market research and consumer demographic information,
optimize your advertising mix for each product, manage your distribution chain, and respond to your competitors' actions.
Product Contribution Report
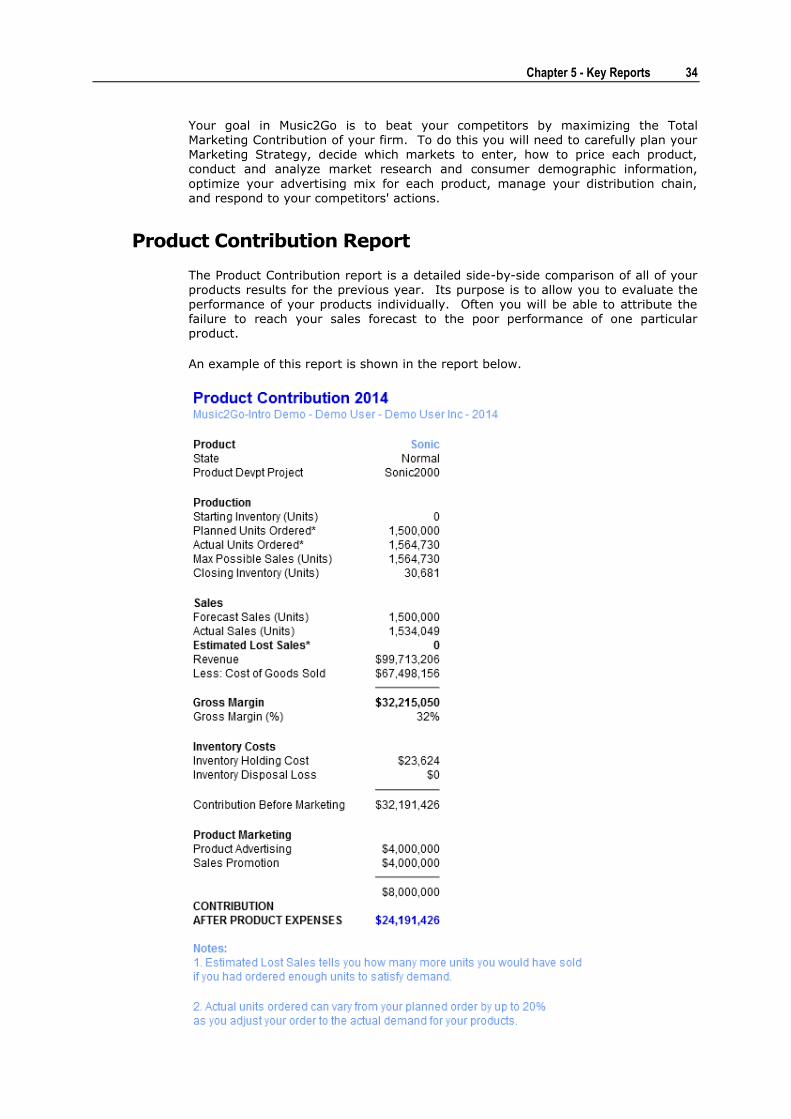
The Product Contribution report is a detailed side-by-side comparison of all of your products results for the previous year. Its purpose is to allow you to evaluate the performance of your products individually. Often you will be able to attribute the failure to reach your sales forecast to the poor performance of one particular product.
An example of this report is shown in the report below.
Chapter 5 - Key Reports 35
Each part of this report will now be described in more detail.
PRODUCT
The product name tells you what the name of your product is. The state tells you whether it was upgraded last year, and the product development project tells you
what design this product is based on.
PRODUCTION
Starting inventory is based on how many unsold products you had in stock at the end of last year.
Note: if you used the Product Development screen to modify the product last year then Starting Inventory will always be zero as any existing inventory would have
been dumped at the start of the year.
The Planned Units Ordered were calculated from your Starting Inventory and your Forecast Sales for last year. eg. If you started with 200,000 units, and your Forecast Sales was 1 million units, then Planned Units Ordered would have been 800,000 units.
SALES
Forecast sales came from your product sales forecast last year. Actual sales are obviously your actual sales for last year.
Estimated lost sales lets you know if you lost any sales due to stock-outs (running out of inventory). ie. Estimated Lost Sales shows how many more units you could have sold if you had ordered enough units. So Actual Sales Units + Estimated Lost Sales = Actual Demand.
The "revenue", "cost of goods sold" and "gross margin" are for this particular
product. These terms are discussed in more detail above.
INVENTORY COSTS AND PRODUCT MARKETING
These costs are the ones that relate directly to this product. For a more detailed discussion of these terms and concepts read the Industry Overview section above.
CONTRIBUTION AFTER PRODUCT EXPENSES
This is the contribution that this product made to your firm - i.e. how profitable this
product is.
Summing the total contribution for your products and then deducting the sales
force management, product development and market research expenditures calculates marketing contribution for your firm.
Chapter 5 - Key Reports 36
Forecast Results
When you select the Forecast Results menu you are given access to a series of pro-forma firm level financial performance reports for next year based on your current decisions and assuming that your sales forecasts are completely accurate:
Forecast Results Overview. A memo summarizing the reports available.
Forecast Marketing Expenditure Budget. This report is repeated from the Year Ahead above and highlights what your remaining budget is for this year.
Forecast Marketing Contribution. Compares your forecast results for next year
versus your actual results for this year so that you can review how much your current decisions are predicted to improve your marketing contribution.
Forecast Product Contribution. A detailed side-by-side comparison of all of your
individual products forecast results for the next year.
Current Decisions. Details of all of the decisions that you have entered for next year.
The content of all of these reports has been explained in earlier sections so you should be able to interpret them effectively unaided.
Help! My Decisions aren’t being saved!
Make sure you always click the Apply button after changing a decision
Always check the Current Decisions report under Forecast Results after entering your decisions to make sure you haven’t missed anything.
Always check the Forecast Budget Expenditure report under Forecast
Results to make sure you are within budget.
I checked my decisions last period and I tried to spend $Xm on Advertising or Sales Promotion, but after the rollover it appears I actually spent less than that. What
happened?
Remember that you have a fixed marketing budget each year. If you exceed that budget, then your Advertising and Sales Promotion spending decisions will automatically be reduced during the rollover to keep you within budget. Always check the Budget Spending Report under Forecast Results to make sure you are within budget before each rollover.
Someone keeps changing my decisions! (Multi-Player)
Remember that you probably have 2-5 people assigned to your Multi-Player firm, and any one of them can log in and update the decisions. You should discuss with your team members who is responsible for actually updating your team’s decisions
to avoid confusion.
Why did I receive a different number of units from what I ordered?
In Music2Go you make decisions for an entire year. But your factory has a limited
ability to adjust the number of units produced to try to meet actual demand during the year. This is called Demand Responsiveness. Most worlds have 20% Demand Responsiveness enabled, although your instructor may request this to be modified or disabled for your multi-player. Demand Responsiveness allows the actual number of units ordered to increase or decrease by up to 20% to meet the actual demand for your product.
For instance, if you ordered 1 million units of a product, then the actual number of
units delivered could vary between 800,000 units and 1.2 million units depending on actual demand.
Why can't I order more than 2 million units for a new product?
You can only order a maximum of 2 million units of a new product in its launch year. This is a safeguard that your Board of Directors put in place to stop you ordering vast amounts of a product before it has a proven market.
Chapter 6 - FAQs
Chapter 6 - FAQs 38
I want to order more units but the simulation won't let me
Your Board of Directors put another safeguard in place to prevent you ordering far too much stock for existing products. Your Board of Directors assumes that it is not possible to sell more than twice the number of units that you sold last year.
So if you sold 1 million units last year, then you can not order more than 2 million units this year.
Or if you sold 1 million units last year, and you have 200,000 units of finished goods in stock, then you can not order more than 1,800,000 units this year.
Does product development come out of my marketing budget?
The cost of product development projects is not deducted from your marketing budget. However it does affect your Marketing Contribution.
If you experience any other difficulties, feel free to contact the Smartsims Support Team:
Email: [email protected]
Website: www.smartsims.com