Embed Size (px)
Citation preview

1
IQP FB FB01
Music Composition Using a Real-Time MRI Biofeedback System
Interactive Qualifying Project Report completed in partial fulfillment
of the Bachelor of Science degree at
Worcester Polytechnic Institute, Worcester, MA
Submitted by:
Sinan Asaad
Date: July 6th 2011
Submitted to:
Professor Frederick Bianchi (Advisor)

2
Acknowledgement
The author of this paper would like to thank the following individuals:
Frederick Bianchi of Worcester Polytechnic Institute for his assistance,
guidance and advising in this project.
Karl Helmer of Medical School in Harvard University for providing help and
guidance in this study.

3
Abstract
The goal of this project was to describe a real time music composition through an fMRI
based-biofeedback system that monitors the activity in the medial prefrontal cortex
(MPFC) of the brain. Based on creativity and neuroscience research, it is suggested that
increased MPFC activity is closely associated with creativity in jazz improvisation.[51]
.

4
Table of Contents
ACKNOWLEDGMENT .................................................................................................................. 2
ABSTRACT ..................................................................................................................................... 3
CONTENTS ..................................................................................................................................... 4
LIST OF TABLES AND FIGURES ................................................................................................ 5
I. INTRODUCTION ........................................................................................................................ 6
II. LITERATURE BACKGROUND ................................................................................................ 7
II.I. MUSIC AND THE BRAIN ............................................................................................. 8
II.II. BIOFEEDBACK, BRAIN WAVES & EEG ............................................................... 11
II.III. HISTORY OF MUSIC COMPOSITION: BRAIN ACTIVITY BASED ................... 17
II.IV. MRI AND THE MUSIC ............................................................................................. 20
II.V. MEDITATION ............................................................................................................ 26
III. HYPOTHESIS .......................................................................................................................... 29
IV. METHODOLOGY ................................................................................................................... 33
V. SUGGESTIONS ........................................................................................................................ 35
V. I. NOISE REDUCTION .................................................................................................. 35
V. II. ENGAGING MUSIC LISTENING TO EMOTIONS ................................................ 36
V. III. QUALITY ABD SPEED OF IMAGING .................................................................. 37
V. IV. STRENGTHENING THE MPFC ACTIVITY BY REWARDING .......................... 37
V. V. IMAGES INTERPOLATION .................................................................................... 38
V. VI. EEG-FMRI COLLABORATION ............................................................................. 39
REFERENCES ............................................................................................................................... 40

5
List of Tables and Figures:
TABLE1: COMPARISON TABLE (BRAIN WAVES). ...................................................................... 12
FIGURE (1) .............................................................................................................................. 7
FIGURE (2) .............................................................................................................................. 8
FIGURE (3) ............................................................................................................................ 15
FIGURE (4) ............................................................................................................................ 20
FIGURE (5) ............................................................................................................................ 25
FIGURE (6) ............................................................................................................................ 30
FIGURE (7) ............................................................................................................................ 34
FIGURE (8) ............................................................................................................................ 34
FIGURE (9) ............................................................................................................................ 36

6
I. Introduction
here have been studies in the area of music processing based upon
neurological and electrical activity of the brain using functional Magnetic
Resonance Imaging, Electroencephalograph, Positron Emission
Tomography, and Magnetoencyphalograph. Different methodologies with different
detecting devices have been used to explore the relationship between musical actions
and specific locations in the brain.
The goal of this project is to achieve real time music composition through an fMRI
based-biofeedback system that monitors the activity in the medial prefrontal cortex
(MPFC) of the brain. Based on creativity and neuroscience research, it is suggested that
increased MPFC activity is closely associated with creativity in jazz improvisation.[51]
Prior to developing the biofeedback music composition system, a study is needed to test
the hypothesis that an enjoyable passive listening experience may also result in
increased activity in the MPFC. If a subject exhibits increased MPFC activity while
passively listening to music it may suggest a heightened state of involvement similar to
the active state of creative involvement. If an enjoyable listening experience results in
similar brain activity as creative involvement, then it may be plausible to construct a
biofeedback composition system that aims to monitor and optimize activity in the MPFC
through the real time manipulation of aural input.
T

7
II. Literature Background
There are different ways for looking at the activity in the brain. This includes MRI
images for the interior component of the brain or by EEG that detects electrical signals
(brain waves) that exists during different states of thinking and activity. These electrical
waves originate from specific areas in the brain and are detected from different
locations at the cerebral cortex (outermost tissue to the cerebrum of the mammalian
brain).
FIGURE (1): The cerebrum of the brain. (Source: http://healthnhealthy.com)

8
II.I. Music and the Brain
What is the secret of music's strange power?
Music surrounds us and it couldn’t be any other way. An exhilarating orchestral
crescendo can bring tears to the eyes and send shivers down the spine. Background
swells add emotive punch to movies and TV shows. Organists at ballgames can bring a
cheering crowd to their feet, and parents croon soothingly to infants [15].
Music and the brain is the science that studies the neural mechanisms that underlie
musical behaviors in humans and animals. These behaviors include music listening,
performing, composing, reading, writing, and ancillary activities. It also is increasingly
concerned with the brain’s basis for musical aesthetics and musical emotion. Scientists
working in this field may have training in cognitive neuroscience, neurology,
neuroanatomy, psychology, music theory, computer science, and other allied fields [16].
The brain reacts in various ways to sound and music. For example, when unpleasant
melodies are played the posterior cingulate cortex activates which indicates a sense of
conflict or emotional pain [17].
FIGURE (2): Posterior Cingulate Cortex (Source: neuro.questionsthatmatter.info)
9
Furthermore, the right hemisphere has also been found to be correlated with emotion,
which can activate areas in the cingluate in times of emotional pain, specifically social
rejection (Eisenberger). This evidence, along with observations, has led many musical
theorists, philosophers and neuroscientists to link emotion with musical organization.
This seems almost obvious because the tones in music seem like a characterization of
the tones in human speech, which have emotional content. The vowels in the phonemes
of a song are elongated for a dramatic effect, and it seems as though musical tones are
simply exaggerations of the normal verbal tonality [16].
Cognitive musicology is a branch of Cognitive Science concerned with computationally
modeling musical knowledge with the goal of understanding both music and cognition.
[18] More broadly, it can be considered the set of all phenomena surrounding
computational modeling of musical thought and action. [19]
Cognitive musicology can be differentiated from the better known field of Music
Cognition by a difference in methodological emphasis. Cognitive musicology uses
computer modeling to study music-related knowledge representation and has roots in
Artificial Intelligence and Cognitive Science. The use of computer models provides an
exacting, interactive medium in which to formulate and test theories [20]
This interdisciplinary field investigates topics such as the parallels between language and
music in the brain. Biologically inspired models of computation are often included in
research, such as neural networks and evolutionary programs. [21] This field seeks to

10
model how musical knowledge is represented, stored, perceived, performed, and
generated. By using a well-structured computer environment, the systematic structures
of these cognitive phenomena can be investigated. [22]

11
II.II. Biofeedback, Brain Waves and EEG
Biofeedback is the process of becoming aware of various physiological functions using
instruments that provide information on the activity of those same systems, with a goal
of being able to manipulate them at will.[23][24] Processes that can be controlled
include brainwaves, muscle tone, skin conductance, heart rate and pain perception.[25]
There are many kinds of biofeedback sensors (instruments) with different operating
concepts: Electromyograph, Thermometer, Electrodermograph, Electroencephalograph,
Photoplethysmograph, Electrocardiograph, fMRI and etc. But the ones that are most
directly related to the current study of brain activity, creativity and music enjoyment are
the EEG and fMRI.
Many experiments have been done through the 20th century to build a musical
composition from a person’s electrical head signals (EEG).
Electroencephalography (EEG) is the recording of electrical activity along the scalp. EEG
measures voltage fluctuations resulting from ionic current flows within the neurons of
the brain.[26]
The EEG is typically described in terms of (1) rhythmic activity and (2) transients. The
rhythmic activity is divided into bands by frequency.

12
Table1: Comparison table (Brain Waves).[27]
Comparison of EEG bands
Type Frequency
(Hz) Location Normally Pathologically
Delta up to 4
frontally in adults,
posteriorly in
children; high
amplitude waves
adults slow wave sleep
in babies
Has been found during some
continuous attention tasks
(Kirmizi-Alsan et al. 2006)
subcortical lesions
diffuse lesions
metabolic encephalopathy
hydrocephalus
deep midline lesions
Theta 4 – <8
Found in locations
not related to task at
hand
young children
drowsiness or arousal in older
children and adults
idling
Associated with inhibition of
elicited responses (has been
found to spike in situations
where a person is actively
trying to repress a response or
action) (Kirmizi-Alsan et al.
2006).
focal subcortical lesions
metabolic encephalopathy
deep midline disorders
some instances of
hydrocephalus
Alpha 8 – 13
posterior regions of
head, both sides,
higher in amplitude
on dominant side.
Central sites (c3-c4)
at rest .
relaxed/reflecting
closing the eyes
Also associated with inhibition
control, seemingly with the
purpose of timing inhibitory
activity in different locations
across the brain (Klimesch,
Sauseng, & Hanslmayr 2007;
Coan & Allen 2008).
coma
Beta >13 – 30
both sides,
symmetrical
distribution, most
evident frontally; low
amplitude waves
alert/working
active, busy or anxious
benzodiazepines

13
thinking, active concentration
Gamma 30 – 100+ Somatosensory
cortex
Displays during cross-modal
sensory processing (perception
that combines two different
senses, such as sound and sight)
(Kisley & Cornwell 2006;
Kanayama, Sato, & Ohira 2007;
Nieuwenhuis, Yeung, & Cohen
2004)
Also is shown during short term
memory matching of
recognized objects, sounds, or
tactile sensations (Herrmann,
Frund, & Lenz 2009)
A decrease in gamma band
activity may be associated with
cognitive decline, especially
when related the theta band;
however, this has not been
proven for use as a clinical
diagnostic measurement yet
(Moretti et al. 2009).
Mu 8 – 13 Sensorimotor cortex Shows rest state motor neurons
(Gastaut, 1952).
Mu suppression could be
indicative for motor mirror
neuronsworking, and deficits
in Mu suppression, and thus in
mirror neurons, might play a
role in autism. (Oberman et al.,
2005)
The two most important waves are the Alpha and the Beta wave. Alpha waves are one
type of brain wave detected either by electroencephalography (EEG) or
Magnetoencephalography (MEG) and predominantly originate from the occipital lobe
during wakeful relaxation with closed eyes [2]. Beta states are the states associated with
normal waking consciousness. Low amplitude beta waves with multiple and varying
frequencies, 12 and 30 Hz, are often associated with active, busy, or anxious thinking
and active concentration. [7]

14
In the mid-1960s, Alvin Lucier composed Music for Solo Performer. He placed electrodes
on his own scalp, amplified the signals, and relayed them through loudspeakers that
were “directly coupled to percussion instruments, including large gongs, cymbals,
tympani, metal ashcans, cardboard boxes, bass and snare drums.”*55+
In the early 1970s David Rosenboom, of California Institute of the Arts, began systematic
research into the potential of using EEG to generate music [56]. Rosenboom thought
that it might be possible to understand specific aspects of human’s musical experience
by capturing EEG signals, digging for potentially useful information to make music.
Thirteen years later, Eduardo Miranda, of Plymouth University in UK, developed new
techniques to enhance the EEG signal and to train the computer to identify EEG patterns
associated with different cognitive musical tasks.[57]
In addition, fMRI has a great potential as a biofeedback (neuro-activity) system for
music composition. Its applications have a wide range of advantages and usages,
including the reading of brain states, brain–computer interfaces, communicating with
locked-in patients, lie detection, and learning control over brain activation to modulate
cognition or even treat disease.[52] Moreover, MRI has great advantages in detecting
the neurological activity while listening to music and improvising. While EEG detects the
electrical waves only on the surface of the cerebrum, fMRI gives high-resolutions images
(1 mm cubical voxels) from any part of the brain. That is why fMRI is more realistic and
more accurate.

15
A study done at MIT designed a Magnetoencephalography experiment, to compare the
motor activation in pianists and non-pianists while listening to piano pieces. The study
found a statistically significant increase of activity above the region of the contralateral
motor cortex (CLMC). That means when the pianists were listening to well-trained piano
performance, they exhibit involuntary motor activity involving the primary CLMC [8].
They tested the participant’s brain activity with MEG to find the difference in motor
activation between the pianists and the non-pianists. The study suggested that the mere
perception of well-trained piano music can involuntarily evoke motor cortex activity in
pianists without actual movement. It is shown from the difference plot clearly that a
focus of activity above the left central sulcus between the two groups, whereas other
areas exhibit little differential activation [8].
FIGURE(3): The plots (a–b) show the relative differences of the MEG derivatives
between pianists and non-pianists group averages [8].
The results showed that listening to well-trained piano performance can involuntarily
evoke motor cortex activity in pianists without actual movement. They did not detect
any activity arising from other constituents of the motor system that are known for their
contribution to motor programming (like SMA or PMC). However, some sort of motor

16
programming must have taken place because M1 activity was detected before the onset
of the notes, and the finger dissociation indicated that the subjects knew with which
finger the next note would normally be played. They speculated that due to the high
level of skill of the subjects, the motor programming processes were highly automated
and required little recruitment in the motor neurons.
Emotions, induced by music, might activate similar frontal brain regions compared to
emotions elicited by other stimuli. Schmidt and Trainor (2001) discovered that valence
(i.e. positive vs. negative) of musical segments was distinguished by patterns of frontal
EEG activity [28]. Joyful and happy musical segments were associated with increases in
left frontal EEG activity whereas fearful and sad musical segments were associated with
increases in right frontal EEG activity. Additionally, the intensity of emotions was
differentiated by the pattern of overall frontal EEG activity [28].

17
II.III. HISTORY OF MUSIC COMPOSITION: BRAIN ACTIVITY BASED
Scientists used the technology of EEG biofeedback to produce music through different
interfaces. This includes connecting the output of EEG directly to acoustic musical
instruments, analyzing the power spectrum of the EEG waves for various applications,
connecting to an analog or digital synthesizer, or manipulating the signal through
software.[55],[56][57].
The use of electrical signals emanating from living organisms (bioelectric signals) to
create music is not new. While a complete history of bioelectric music experiments is
beyond the scope of this paper, some background is appropriate. The history of
bioelectric music experiments can be traced back to 1934 with the translation of the
human electroencephalogram (EEG) into audio signals (Adrian and Matthews 1934);
these experiments went largely unnoticed until the late 1960s. In the decades that
followed, the efforts of many composers and artists (Lucier 1976; Arcadiou 1986;
Rosenboom 1976, 1989; Knapp and Lusted 1990) established work in this arena as
meritorious. These systems may produce some interesting musical results, but they will
tend to be stylistically limited, and due to their reliance on ill-structured methods of
acquisition and analysis they tell us very little about the underlying processes of musical
cognition [9]. Lucier, who started his work on “Music for Solo Performer” in 1956, uses
EEG electrodes attached to the performer's scalp to detect bursts of alpha waves
generated when the performer achieves a meditative, non-visual brain state. These

18
alpha waves are amplified and the resulting electrical signal is used to vibrate percussion
instruments distributed around the performance space [58].
An interesting patented (music from neurological activity) study, by Knispel, relates to a
method and apparatus for translating an ongoing EEG signal into a musical feedback
signal and applying the musical feedback signal to the human brain, or any other brain,
to induce controllable physiological and psychological responses. A signal processor
converts an ongoing EEG signal from a selected position on the scalp into electrical
signals that music synthesizers convert into music. The brain receives the musical
feedback after it is delayed by a period of time that is calculated so that the music
reinforces specific or desired EEG activity at a particular area of the brain determined by
the site of the recording electrode. In addition, the music is engineered to have psycho-
acoustical and musical properties (resonant frequencies and emotionally acceptable for
extended listening) that induce the brain to preferentially produce a particular type of
EEG activity. The physiological response of the brain to the feedback music actively
drives the ongoing EEG activity into resonance with the music to form a real time
physiological feedback loop. The musical qualities and encoded physiological
information of the feedback signal selectively reinforce biologically produced brain wave
activity. The type of brain wave activity that is reinforced, together with the musical
program in which it is encoded, can be used to promote emotional states without
additional stimuli such as the presence of a therapist. For example, alpha activity can be

19
enhanced so as to induce relaxation solely by musically reinforcing the alpha activity
that is sensed by an electrode located on the scalp at the positions on the scalp known
as CZ or P3 in the nomenclature of clinical neurology. [12]

20
II.IV. MRI AND THE MUSIC
A new approach of fMRI was introduced recently for studying the internal organs,
tissues and blood flow. A relatively new technology, Magnetic resonance imaging was
first developed at the University of Aberdeen, UK. The first MR image was published in
1973[29][30] and the first cross-sectional image of a living mouse was published in
January 1974 [31]. The concept of studying brain activity as it relates to music listening,
improvising and rehearsing ... etc by the fMRI is relatively new.
Functional MRI (fMRI) measures signal changes in the brain that are due to changing
neural activity. The brain is scanned at low resolution but at a rapid rate (typically once
every 2–3 seconds). Increases in neural activity cause changes in the MR signal via T*2
changes;[32] this mechanism is referred to as the BOLD (blood-oxygen-level dependent)
effect.
FIGURE (4): Images from fMRI (Source: csulb.edu).

21
Increased neural activity causes an increased demand for oxygen, and the vascular
system actually overcompensates for this, increasing the amount of oxygenated
hemoglobin relative to deoxygenated hemoglobin. Because deoxygenated hemoglobin
attenuates the MR signal, the vascular response leads to a signal increase that is related
to the neural activity. The precise nature of the relationship between neural activity and
the BOLD signal is a subject of current research. While BOLD signal is the most common
method employed for neuroscience studies in human subjects, the flexible nature of MR
imaging provides means to sensitize the signal to other aspects of the blood supply.
Alternative techniques employ arterial spin labeling (ASL) or weight the MRI signal by
cerebral blood flow (CBF) and cerebral blood volume (CBV). The CBV method requires
injection of a class of MRI contrast agents that are now in human clinical trials. Because
this method has been shown to be far more sensitive than the BOLD technique in
preclinical studies, it may potentially expand the role of fMRI in clinical applications. The
CBF method provides more quantitative information than the BOLD signal, albeit at a
significant loss of detection sensitivity [33].
Like any technique, fMRI has advantages and disadvantages, and in order to be useful,
the experiments that employ it must be carefully designed and conducted to maximize
its strengths and minimize its weaknesses.
Some of the advantages of fMRI:[33]
It can noninvasively record brain signals without risks of radiation inherent in
other scanning methods, such as CT or PET scans.

22
It has high spatial resolution. 2–3 mm is typical but resolution can be as good as
1mm.
It can record signal from all regions of the brain, unlike EEG/MEG which are
biased towards the cortical surface.
fMRI is widely used and standard data-analysis approaches have been developed
which allow researchers to compare results across labs.
fMRI produces compelling images of brain "activation."
Here is also some of its (fMRI) disadvantages:[33]
The images produced must be interpreted carefully, since correlation does not
imply causality, and brain processes are complex and often non-localized.
Statistical methods must be used carefully because they can produce false
positives. One team of researchers studying reactions to pictures of human
emotional expressions reported a few activated voxels in the brain of a dead
salmon when no correction for multiple comparisons was applied, illustrating the
need for rigorous statistical analyses [34].
The BOLD signal is only an indirect measure of neural activity, and is therefore
susceptible to influence by non-neural changes in the body. This also means that
it is difficult to interpret positive and negative BOLD responses [35].

23
BOLD signals are most strongly associated with the input to a given area rather
than with the output. It is therefore possible (although unlikely) that a BOLD
signal could be present in a given area even if there is no single unit activity [36].
fMRI has poor temporal resolution. The BOLD response peaks approximately 5
seconds after neuronal firing begins in an area. This means that it is hard to
distinguish BOLD responses to different events which occur within a short time
window. Careful experimental design can reduce this problem. Also, some
research groups are attempting to combine fMRI signals that have relatively high
spatial resolution with signals recorded with other techniques,
electroencephalography (EEG) or magnetoencephalography (MEG), which have
higher temporal resolution but worse spatial resolution.
fMRI has often been used to show activation localized to specific regions, thus
minimizing the distributed nature of processing in neural networks. Several
recent multivariate statistical techniques work around this issue by
characterizing interactions between "active" regions found via
traditional univariate techniques.
The BOLD response can be affected by a variety of factors, including:
drugs/substances;[37] age, brain pathology;[38] local differences in
neurovascular coupling;[39] attention;[40] amount of carbon dioxide in the
blood;[41] etc.

24
Nowadays the brain activity detection – Neurological signals- can be done by a
continuous (real time) fMRI. The main advantages to fMRI as a technique to image brain
activity related to a specific task or sensory process include 1) the signal does not
require injections of radioactive isotopes, 2) the total scan time required can be very
short, i.e., on the order of 1.5 to 2.0 min per run (depending on the paradigm), and 3)
the in-plane resolution of the functional image is generally about 1.5 x 1.5 mm although
resolutions less than 1 mm are possible. Due to the ability to image the entire 3-
dimensional volume of brain, fMRI is capable of isolating many simultaneous and
coordinated brain events. This "multi-level" view of brain activity can include
"executive" functions and high level cognitive tasks simultaneously with the primary and
secondary input such as vision and audition as well as cerebellar contributions [60].
For these reasons, Functional imaging provides insights into neural processing that are
complementary to insights of other studies in neurophysiology.
Researchers from Johns Hopkins University’s Peabody Institute used MRI to study
spontaneity and creativity on jazz musicians. They found that a region of the brain
known as the dorsolateral prefrontal cortex, a broad portion of the front of the brain
that extends to the sides, showed a slowdown in activity during improvisation. This area
has been linked to planned actions and self-censoring, such as carefully deciding what
words you might say at a job interview. Shutting down this area, dorsolateral prefrontal
cortex, could lead to lowered inhibitions and self-generated behaviors (such as
improvisation) occur here in the absence of the context typically provided by the lateral

25
prefrontal regions according to researcher Limb [51]. Deactivation of this DLPFC may be
associated with defocused, free-floating attention that permits spontaneous unplanned
associations, and sudden insights or realizations [59].
The researchers also saw increased activity in the medial prefrontal cortex, which sits in
the center of the brain’s frontal lobe. This area has been linked with self-expression and
activities that convey individuality, such as telling a story about yourself [51].
Source: [51]

26
II.V. Meditation
WHAT is mediation and HOW is meditation related to the current study?
Meditation refers to any of a family of practices in which the practitioner trains his or
her mind or self-induces a mode of consciousness in order to realize some benefit
[42][43][44]. A review of scientific studies identified relaxation, concentration, an
altered state of awareness, a suspension of logical thought and the maintenance of a
self-observing attitude as the behavioral components of meditation;[46] it is
accompanied by a host of biochemical and physical changes in the body that alter
metabolism, heart rate, respiration, blood pressure and brain activation.[47][48]
Meditation has been used in clinical settings as a method of stress and pain reduction.
Meditation has also been studied specifically for its effects on stress.[49][50]
Meditation is the key for opening the doors of mysteries to your mind. In that state man
abstracts himself: in that state man withdraws himself from all outside objects; in that
subjective mood he is immersed in the ocean of spiritual life and can unfold the secrets
of things-in-themselves.[45]
Meditation is related to our study in several perspectives:
During meditation, practitioners try to control their minds and go in a
state where they have an internal concentration (tracking) within their
bodies. On the other hand, in our experiment the musicians have to
concentrate on a piece of music when they are listening (tracking).

27
An important series of neural changes have been noticed in the mPFC
region of meditators, as will be shown later in the section. Interestingly,
similar activation in the same region occurs while jazz musicians
improvise.
One of the aspects of the project is to determine whether that region,
mPFC, is responsible for creativity. Furthermore, Alpha waves may
appear to correspond to creativity. The more Alpha waves emitted, the
more creative activity is occurring. It has been shown in some studies
that mediation practitioner’s EEG shows more Alpha waves compared to
the control group.
In this context, it is shown that long-term meditation practitioners showed more
activation in the prefrontal cortex during meditation than did novice mediators [3].
It was shown that the dipoles for the diffuse high-amplitude Alpha waves (in order
to have a creative inspiration, your brain needs to be able to generate a big burst of
Alpha brain waves [10]) are localized to both the mPFC (which is the part of the
brain our study focuses on) and ACC.[11]
Previous studies have reported that meditators demonstrate better attentional
functioning and lower levels of stress than do non-meditators [4,5].
In a comparison study between meditators and non-meditators, meditators showed
stronger activations in the rostral anterior cingulate cortex and the dorsal medial

28
prefrontal cortex bilaterally, compared to controls. Greater rostral anterior cingulate
cortex activation in meditators may reflect stronger processing of distracting events.
The increased activation in the medial prefrontal cortex may reflect that meditators
are engaged in emotional processing. [6]

29
III. Hypothesis
People perceive and respond to music in different ways. The level of musicianship of the
performer and the listener as well as the manner in which a piece is performed affects
the "experience" of music. An experienced and accomplished musician might hear and
feel a piece of music in a totally different way than a non-musician or beginner. This is
why two accounts of the same piece of music can contradict themselves. [1].
Researchers from Johns Hopkins University’s Peabody Institute used MRI to study
spontaneity and creativity on jazz musicians found that the dorsolateral prefrontal
cortex showed a deactivation during improvisation. This area has been linked to planned
actions and self-censoring, such as carefully choosing words at a job interview. Shutting
down this area could lead to lowered inhibitions, Limb suggests. Those researchers also
saw increased activity in the medial prefrontal cortex, which sits in the center of the
brain’s frontal lobe. This area has been linked with self-expression and activities that
convey individuality, such as telling a story about yourself [51]. This can give us an
indication that the jazz musician may be shutting off the parts of the brain that are
responsible on self-monitoring. This may lead to an increased capability for creating new
music and allow the musicians to focus within themselves and be in state of isolation
from the surroundings. This state of mind is similar to what was proved by Britta Holzel
that long-term meditation practitioners showed more activation in parts of the medial
prefrontal cortex during meditation than did novice mediators, and they are more
emotionally engaged 6]. While another experiment studied the cortical regions involved
30
in the generation of musical structures during improvisation was done on non-jazz
pianists who were asked to improvise. Results showed that the activated brain regions
included the right dorsolateral prefrontal cortex, the presupplementary motor area, the
rostral portion of the dorsal premotor cortex, and the left posterior part of the superior
temporal gyrus. It is suggested that because the non-jazz pianists were not trained to
improvise, as opposed to the jazz musicians, they were having scattered neurological
activities in different sides of the brain. This may be due to thinking, remembering and
other logical and self-censoring processes that increase the complexity load in the
DLPFC. However, the increase in the DLPFC activity may be attributed to the non-jazz
pianists inability to improvise.
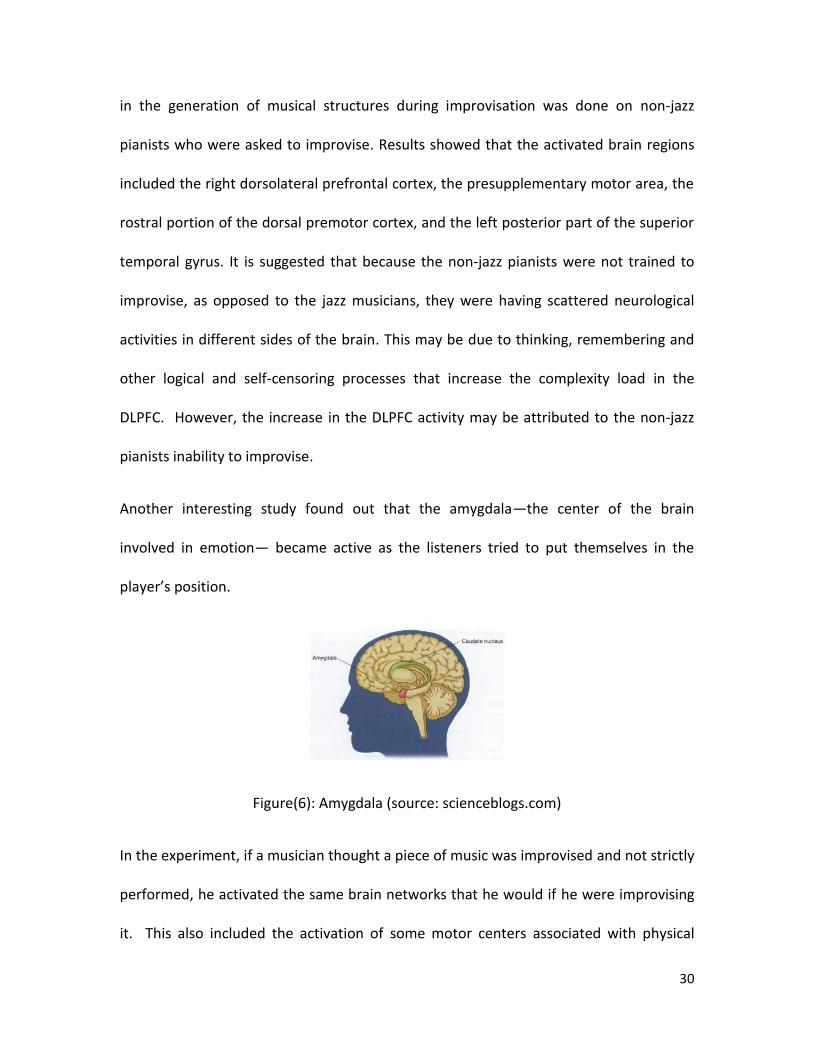
Another interesting study found out that the amygdala—the center of the brain
involved in emotion— became active as the listeners tried to put themselves in the
player’s position.
Figure(6): Amygdala (source: scienceblogs.com)
In the experiment, if a musician thought a piece of music was improvised and not strictly
performed, he activated the same brain networks that he would if he were improvising
it. This also included the activation of some motor centers associated with physical

31
performance. Furthermore, the musicians who rated themselves in a questionnaire as
more “empathetic” were better at picking out the improvisations as opposed to the
strictly performed listening examples [13]. Limb suggests that jazz musicians must
exhibit a sort of dissociation in the frontal lobe by which the large part of the brain
controlling self-monitoring is not inhibiting self-expression of new, free-flowing ideas.
This suggests that empathetic musicians try to create emotional involvement between
their minds and the music, in order to predict what will be coming next. There might be
a good chance that the more emotional engagement the musicians get in, the more
accurate prediction occurs, as the study indicated. It is suggested that such emotional
engagement might lead to betterment in the improvisational ability.
In the hypothesis, the intent is to optimize activity in the MPFC through the real time
manipulation of aural input while simultaneously monitoring the MPFC. It is very
plausible that in order to reach this heightened activity of mPFC, the subject must enjoy
the aural input when listening, indicating a greater emotional involvement. Although the
hypothesis concentrates at the whole entity of mPFC, a study found that Left medial
prefrontal cortex activity was positively correlated with pleasure, and favorite music
[14]. it is plausible that as more active listening and more emotional engagement occurs
(in other words the more preferable and favorable music), there should be a heightened
activity in the mPFC. This will be monitored by a continuous real time fMRI.

32
In this way, while listening to piece of music the activity in the brain, particularly in
mPFC, will be an indication of whether emotional involvement is happening or not and
so the aural input will alter depending on this biofeedback from the brain to keep a
heightened activity state on that region, mPFC.

33
IV. Methodology
There have been several approaches to develop brain–machine interfaces. Real Time
fMRI provides a novel interface with the nervous system that offers the possibility of
directly reading aspects of a person’s brain activation state. It has potential applications
in many contexts, particularly when a patient cannot communicate verbally. [52]
The suggested experiment will use the functional MRI and the software (E-Prime) to
detect, record and analyze the activity of the brain in the medial prefrontal cortex that is
timely synchronized with the decision making through a two buttons keyboard that the
musician can choose either like or dislike when he/she is listening to some part of music.
Both of the output data from the MRI and the keyboard will go to the analyst computer,
where E-Prime will collect the data from both sources to determine how the like/dislike
decision is related to the mPFC activity. In other words, whether the activity is getting
lower or higher with the like/dislike recorded data or there is no relationship.
The experiment diagram is shown in the figure below:

34
FIGURE(7): Experiment Diagram: Two outputs could be collected when subject is
listening to music.
The activation information from the mPFC can be depicted both as a scrolling line graph
or as a changing image of a virtual fire, as well as the acquired data will be recorded by
the E-Prime software. According to that, it is very plausible to see increased activity
(more neurons firing), when listening to a favorable music, as shown in Figure 2.

35
V. Suggestions
This section gives suggestions and recommendations to solve problems that might be
facing the execution of this experiment.
V.I. Noise Reduction:
For every decision making process including moving limbs or voluntarily actions, there
will be a correspondent activity in the brain. This may result in some mixing between
the movement of the finger, the thinking process, and the mPFC activity that goes on
when the musician decides whether they like or dislike the music. In order to get rid of
some part of that noise, the following simple filtering method could be used:
First, capturing an image when the musician is doing nothing; to be called rest stage (1).
Then an image when the musician is pressing on one of the buttons should be taken;
that is called stage (2). After that, during doing the experiment where it is expected to
see brain activity, which is due to two reasons: finger movement plus listening to the
music; let us call it stage (3). In order to get rid of the noise “finger movement”, simple
adding and subtraction can be made as following: add stages 1 and 3 and subtract 2; to
get what we called stage (4), which is the image that we need to study. This can be
illustrated by the following figure; figure3:

36
FIGURE (9): A Filter Concept to get rid of the noise resulting from pressing the
like/dislike buttons. Where 1: Rest-state. 2: Pressing one buttons- state. 3: The Listening
and like/dislike decision- state. 4: The resultant image from (3+1-2).
V.II. Engaging Music Listening to Emotions
Amygdala is involved with the emotions. This might be also true for the mPFC. The
experiment could be divided into two groups: Group (A) showing the subjects pictures
along with music listening that come in the same context for example: sad music comes
with a picture of a break moment or a picture symbolizes loneliness, the opposite is
applicable too so a picture of wedding for example with happy music and so on. Group
(B) will be the control group for those not seeing pictures, but listening to the same
music. After the data is being collected and comparisons are made, there might be a
chance to see different activity levels, possibly higher in group (A), due to more
emotional engagement.

37
V.III. Quality and Speed of Imaging
The most common technique for continuous brain activity detection is the BOLD effect,
explained previously in the MRI section. Besides that, there are a lot of adjustable
parameters when using the fMRI that need to be figured out, such as the magnetic field
strength in Tesla, echo time (TE) in milliseconds, field of view (FOV) - spatial encoding
area of the image-, flip angle (FA) -which means how much the net magnetization is
rotated, due the second RF excitation, relative to the main magnetic field direction-,
repetition time (TR), and the resolution measured by the voxel, three dimensional pixel,
size... etc. Those parameters could be adjusted to get different sampling rate (Number
of images / amount of time) with different resolution. It is recommended that a fast
sampling rate of 1 to 2 images per second would work properly. Bearing in mind that a
good quality for the images is important, the small changes in the blood flow in the
brain - due to neuro-activation- need to be noticed.
V.IV. Strengthening the mPFC activity by Rewarding
Because we are dealing with an indirect detecting system that depends basically on the
blood flow and not the neuro-activation itself as explained before, it is a must to think
about how we could reduce the noise (e.g. increase in the blood flow due to another
reason other than the brain activity), and also increase the strength of the activation in
the region interest-ROI- (mPFC) in order to get a clearer image. Some information from
a previous study(2001) done by Blood and Zatorre[53], could be used to strengthen the
activation magnitude, where they found that some part of the medial prefrontal area

38
and other regions in the brain are linked to rewards and motivation. That could be
useful for increasing the intensity of activation by using some sort of rewarding. For
example, telling the participants in advance to the experiment that the best music -that
will be composed depending on the activation changes- chosen by a judge, the
participant will get a certain amount of money!
V.V. Images Interpolation
As we have introduced in the intro and the methodology, it is very possible that the
liking/disliking decision and the imaging may occur at different times (meaning the
decision could be taken place so it lags or leads the closest image). In this case, it is
suggested to interpolate the images (average them), similar to what is used in
mathematics. Interpolation could be done between 2 preceding images and 2
succeeding images. All of that will be done after the data from the experiment are
already collected. MATLAB could be very useful in converting the image into matrices
(values for pixels) and then to use its interpolation functions.

39
V.VI EEG-fMRI collaboration
The last suggestion, which might be added to experiment, is using EEG-fMRI procedure.
This new technology was first implemented in the late nineties, to reflect the brain’s
electrical activity, and in particular post-synaptic potentials in the cerebral cortex,
whereas fMRI is capable of detecting haemodynamic changes throughout the brain
through the BOLD effect. EEG-fMRI therefore allows measuring both neuronal and
haemodynamic activity which comprise two important components of the
neurovascular coupling mechanism [54]. It is very important to remember the
correlation between the alpha wave (from EEG and corresponds to creativity) and the
mPFC, which is suggested as a center for musical creativity. If our hypothesis is correct,
the alpha wave emission should increase with the increase of the mPFC activity.

40
Reference
[1] Laurence O'Donnell, “Music and the Brain” (1999).
Retrieved May 2011, from:
http://www.cerebromente.org.br/n15/mente/musica.html
[2] Alpha Wave. (n.d.). In Wikipedia. Retrieved June, 2011,
from http://en.wikipedia.org/wiki/Alpha_wave.
[3] J.A.Brefczynski-Lewis, A.Lutz, H.S.Schaefer, D.B.Levinson,
R.J.Davidson, Neural Correlates of attention expertise in
long-term meditation practitioners ,Proc. Natl.
Acad.Sci.U.S.A.104(2007)11483–11488.
[4] Y.H.Jung, D.H.Kang, J.H.Jang, H.Y.Park, M.S.Byun,
S.J.Kwon, G.E.Jang, U.S. Lee, S.C.An, J.S.Kwon, The effects of
mind-body training on stress reduction, positive effect, and
plasma catecholamine’s, Neurosci.Lett.479(2010)138–142.
[5] Y.Y.Tang, Y.Ma,J.Wang, Y.Fan, S.Feng, Q.Lu, Q.Yu, D.Sui,
M.K. Rothbart, M.Fan, M.I.Posner, Short-term meditation
training improves attention and self-regulation,
roc.Natl.Acad.Sci.U.S.A.104(2007) 17152–17156.
[6] Britta K. Holzel , Ulrich Ott, Hannes Hempel, Andrea
Hackl, Katharina Wolf, Rudolf Stark, Dieter Vaitl “Differential
engagement of anterior cingulate and adjacent medial
frontal cortex in adept meditators and non-meditators”
Bender Institute of Neuroimaging, Justus-Liebig-University,
Giessen, Germany.
[7] Beta Wave. (n.d.). In Wikipedia. Retrieved June, 2011,
from http://en.wikipedia.org/wiki/Beta_wave
[8] Involuntary Motor Activity in Pianists Evoked by Music
Perception by: Jens Haueisen Friedrich-Schiller-
University, Jena, Germany Thomas R. Knösche Max-Planck
Institute of Cognitive Neuroscience, Leipzig, Germany.
[9] Erik Gottesman, “The Psycho-adaptive Listening
Machine: An Application of Perceptual Control Theory to
Computer Music” (1998), MI, USA.
[10] Dr. Hans Berger, “Alpha Brain Waves”. Retrieved May
2011, from
http://www.biocybernaut.com/about/brainwaves/alpha.ht
m.
[11] S. Yamamoto, Y. Kitamura, N. Yamanda, Y. Nakashima,
and S. Kuroda: “Medial Prefrontal Cortex and Anterior
Cingulated Cortex in Generation of Alpha Activity Induced by
Transcendental Meditation: a Magnetoencephalographic
Study.”, 2006. ISSN: 0386300X
[12] Joel Knispel, Timonium, Geoffrey Wright, Baltimore,
both of Md.: “Method and Apparatus for Translating the EEG
into Music to Induce and Control Various Psychological and
Physiological States and to Control a Musical Instrument.”
1989.
[13] Sara Reardon, Brains on Jazz Feel The Music. Retrieved
June 2011, from http://news.sciencemag.org
[14] Osuch, Elizabeth A.a b; Bluhm, Robyn L.a e; Williamson,
Peter C.a b; Théberge, Jeana b d; Densmore, Mariaa;
Neufeld, Richard W.J.a c: “Brain activation to favorite music
in healthy controls and depressed patients”, (2009) doi:
10.1097/WNR.0b013e32832f4da3.
[15] Norman M. Weinberger, October 25, 2004: “Music and
the Brain.” Retrieved June 2011 from:
http://www.centerformusicmedicine.org/pdfs-music-and-
brain/Music_and_the_Brain_By_Norman_M._Weinberger.p
df.
[16] Music and the brain. (n.d.) In Wikipedia. Retrieved May
2011, from:
http://en.wikipedia.org/wiki/Music_and_the_brain.
[17] Tramo MJ. (2001). "Biology and music. Music of the
hemispheres". Science 291 (5501): 54–6. PMID 11192009.
[18] Laske, Otto (1999). “Navigating New Musical Horizons
(Contributions to the Study of Music and Dance”. Westport:
Greenwood Press. ISBN 9780313306327.
[19] Newell, A. & Simon, H. (1976). Computer Science as
empirical inquiry: Symbols and search. Communications of
the ACM, 19, 113-126.
[20] Laske, O. (1999). Ai and music: A cornerstone of
cognitive musicology. In M. Balaban, K. Ebcioglu, & O. Laske
(Eds.), Understanding music with ai: Perspectives on music
cognition. Cambridge: The MIT Press.
[21] Graci, C. (2009-2010) “A brief tour of the learning
sciences featuring a cognitive tool for investigating melodic
phenomena”. Journal of Educational Technology Systems,
38(2), 181-211.
[22] Hamman, M., 1999. "Structure as Performance:
Cognitive Musicology and the Objectification of Procedure,"
in Otto Laske: Navigating New Musical Horizons, ed. J. Tabor.
New York: Greenwood Press.
[23] Durand, Vincent Mark; Barlow, David (2009). Abnormal
psychology: an integrative approach. Belmont, CA:
Wadsworth Cengage Learning. pp. 331. ISBN 0-495-09556-7.
[24] "What is biofeedback?". Association for Applied
Psychophysiology and Biofeedback. 2008-05-18. Retrieved
2011 June.

41
[25] deCharms RC, Maeda F, Glover GH, et al. (December
2005). "Control over brain activation and pain learned by
using real-time functional MRI". Proc. Natl. Acad. Sci. U.S.A.
102 (51): 18626–31. doi:10.1073/pnas.0505210102. PMC
1311906. PMID 16352728.
[26] Niedermeyer E. and da Silva F.L. (2004).
Electroencephalography: Basic Principles, Clinical
Applications, and Related Fields. Lippincot Williams &
Wilkins. ISBN 0781751268.
[27]Electroencyphalograph. (n.d.) In Wikipedia. Retrieved
June 2011 from:
http://en.wikipedia.org/wiki/Electroencephalography#Comp
arison_table.
[28] Schmidt, L.A.; Trainor, L.J. (2001). "Frontal brain
electrical activity (EEG) distinguishes valence and intensity of
musical emotions". Cognition and Emotion 15 (4): 487–500.
[29] Lauterbur PC (1973). "Image Formation by Induced
Local Interactions: Examples of Employing Nuclear Magnetic
Resonance". Nature 242 (5394): 190–191. Bibcode
1973Natur.242..190L. doi:10.1038/242190a0.
[30] Filler AG (2010). "The history, development, and impact
of computed imaging in neurological diagnosis and
neurosurgery: CT, MRI, DTI". Internet Journal of
Neurosurgery 7 (1).
[31] Lauterbur PC (1974). "Magnetic resonance
zeugmatography". Pure and Applied Chemistry 40: 149–157.
doi:10.1351/pac197440010149.
[32] Thulborn KR, Waterton JC, Matthews PM, Radda GK
(February 1982). "Oxygenation dependence of the
transverse relaxation time of water protons in whole blood
at high field". Biochim. Biophys. Acta 714 (2): 265–70.
doi:10.1016/0304-4165(82)90333-6. PMID 6275909.
[33] Magnetic resonance imaging (Jan 2011). (n.d.) In
Wikipedia. Retrieved June 2011, from
http://en.wikipedia.org/wiki/MRI.
[34] Corbetta, M., Miezin, F., Dobmeyer, S., Shulman, G.,
Petersen, S. (1990). Attentional modulation of neural
processing of shape, color, and velocity in humans. Science.
4962, 1556-1559.
[35] Shmuel et al. Negative fMRI response correlates with
decreases in neuronal activity in monkey visual area V1.
Nature Neurosci. 9(4):569-577 (2006).
[36] Logothetis, N.K.; Pauls, J; Augath, M; Trinath, T;
Oeltermann, A (2001). "Neurophysiological investigation of
the basis of the fMRI signal.". Nature 412 (6843): 150.
doi:10.1038/35084005. PMID 11449264.
[37] Magalhaes, A. (2005). Functional magnetic resonance
and spectroscopy in drug and substance abuse. Top
Magnetic Resonance Imaging. 3, 247-251.
[38] Chen, C., Hou, B., Holodny, A. (2008). Effect of age and
tumor grade on BOLD functional MR imaging in pre-
operative assessment of patients with glioma. Radiology. 3,
971-978.
[39] Aguirre, G., Zarahn, E., and D’esposito, M. (1998). The
variability of human BOLD hemodynamic responses.
Neuroimage. 8 (4), 360-369.
[40] Corbetta, M., Miezin, F., Dobmeyer, S., Shulman, G.,
Petersen, S. (1990). Attentional modulation of neural
processing of shape, color, and velocity in humans. Science.
4962, 1556-1559.
[41] Haller, S., Bartsch, A. (2009). Pitfalls in fMRI. European
Radiology. 19, 2689-2706.
[42] Lutz et. al. : "Attention regulation and monitoring in
meditation", (2008) doi:10.1016/j.tics.2008.01.005.
[43] "MacMillan Reference Encyclopedia of Buddhism", the
article entitled, "Meditation" Retrieved June 2011. From: http://en.wikipedia.org/wiki/Meditation
[44] Goleman's (1988) Meditative Mind, ISBN 0-87477-833-6
and Shear's & (2006) Experience of Meditation, ISBN
9781557788573.
[45] `Abdu'l-Bahá (1995), “Paris Talks”. Bahá'í Distribution
Service. pp. 175. ISBN 1870989570.
[46] Perez-De-Albeniz, Alberto; Jeremy Holmes (March
2000). "Meditation: concepts, effects and uses in therapy".
International Journal of Psychotherapy 5 (1): 49–59.
doi:10.1080/13569080050020263. Retrieved 2007-08-23.
[47] A. B. Newberg & J. Iversen (2003). "The neural basis of
the complex mental task of meditation: Neurotransmitter
and neurochemical considerations". Medical Hypotheses
(Elsevier) 61 (2): 282–291. doi:10.1016/S0306-
9877(03)00175-0. ISSN 0306-9877. PMID 12888320.
[48] B. Rael Cahn & John Polich (2006). "Meditation states
and traits: EEG, ERP, and neuroimaging studies".
Psychological Bulletin (American Psychological Association)
132 (2): 180–211. doi:10.1037/0033-2909.132.2.180.
[49] Kabat-Zinn, Jon; Lipworth L, Burney R. (1985). "The
clinical use of mindfulness meditation for the self-regulation
of chronic pain". Journal of Behavioral Medicine 8 (2): 163–
190. doi:10.1007/BF00845519. PMID 3897551.

42
[50] Davidson, Richard J.; Kabat-Zinn, Jon; Schumacher,
Jessica; Rosenkrantz, Melissa; Muller, Daniel; Santorelli, Saki
F.; Urbanowski, Ferris; Harrington, Anne; Bonus, Katherine;
Sheridan, John F. (2003 July–August). "Alterations in brain
and immune function produced by mindfulness meditation".
Psychosomatic Medicine 65 (4): 564–570.
doi:10.1097/01.PSY.0000077505.67574.E3. PMID 12883106.
[51] Limb CJ, Braun AR (2008) Neural Substrates of
Spontaneous Musical Performance: An fMRI Study of Jazz
Improvisation. PLoS ONE 3(2): e1679.
doi:10.1371/journal.pone.0001679
[52] R. Christopher deCharms:” Applications of real-time
fMRI”. (2007) from: www.nature.com/reviews/neuro
[53] Blood, A. J.; Zatorre, R. J. (2001). "Intensely pleasurable
responses to music correlate with activity in brain regions
implicated in reward and emotion". National Academy of
Sciences of the United States of America.
[54] EEG-fMRI (Jan 2010), (n.d.) In Wikipedia. Retrieved June
2011, from: http://en.wikipedia.org/wiki/EEG-fMRI.
[55] Lucier, A. (1976). “Statement on: music for solo
performer”, In D. Rosenboom (Ed.), Biofeedback and the
Arts, Results of Early Experiments. Vancouver:Aesthetic
Research Center of Canada Publications.
[56] Rosenboom, D. (1990) “The performing brain”,
Computer Music Journal
[57] Miranda, E.R, Sharman, K, Kilborn, K, and Duncan, A.
(2003) “ On Harnessing the EEG for the Musical Braincap”.,
Computer Music Journal., 27 (2)-80-102.
[58] Alvin Lucier. (2011, April 21). In Wikipedia, The Free
Encyclopedia. Retrieved 03:37, July 3, 2011, from
http://en.wikipedia.org/w/index.php?title=Alvin_Lucier&old
id=425161650
[59] Bransford J, Stein BS (1993) “The ideal problem solver: a
guide for improving thinking, learning, and creativity.” New
York: W.H. Freeman. pp xiii, 262.
[60] Columbia University Medical Center, “The Future Role
of functional MRI in Medical Applications”. Retrieved July
2011 from: http://www.fmri.org/fmri.htm.