Embed Size (px)
Citation preview

Astronomy & Astrophysics manuscript no. cen-a_arcs_muse_final_arXiv c©ESO 2018February 8, 2018
Letter to the Editor
MUSE discovers perpendicular arcs in the inner filament of Cen AS. Hamer1, P. Salomé1, F. Combes1 and Q. Salomé1
LERMA, Observatoire de Paris, UMR 8112 61, Av. de l’Observatoire, F-75014 Parise-mail: [email protected]
Received July XX, 2014; accepted xxxxx XX, 2014
ABSTRACT
Context. Evidence of active galactic nuclei (AGN) interaction with the intergalactic medium is observed in some galaxies and manycool core clusters. Radio jets are suspected to dig large cavities into the surrounding gas. In most cases, very large optical filaments(several kpc) are also seen all around the central galaxy. The origin of these filaments is still not understood. Star-forming regions aresometimes observed inside the filaments and are interpreted as evidence of positive feedback (AGN-triggered star formation).Aims. Centaurus A is a very nearby galaxy with huge optical filaments aligned with the AGN radio-jet direction. Here, we searchedfor line ratio variations along the filaments, kinematic evidence of shock-broadend line widths, and large-scale dynamical structures.Methods. We observed a 1′×1′ region around the so-called inner filament of Cen A with the Multi Unit Spectroscopic Explorer(MUSE) on the Very Large Telescope (VLT) during the Science Verification period.Results. (i) The brightest lines detected are the Hαλ6562.8, [NII]λ6583, [OIII]λ4959+5007 and [SII]λ6716+6731. MUSE shows that the filamentsare made of clumpy structures inside a more diffuse medium aligned with the radio-jet axis. We find evidence of shocked shellssurrounding the star-forming clumps from the line profiles, suggesting that the star formation is induced by shocks. The clump lineratios are best explained by a composite of shocks and star formation illuminated by a radiation cone from the AGN. (ii) We also reporta previously undetected large arc-like structure: three streams running perpendicular to the main filament; they are kinematically,morphologically, and excitationally distinct. The clear difference in the excitation of the arcs and clumps suggests that the arcs arevery likely located outside of the radiation cone and match the position of the filament only in projection. The three arcs are thusmost consistent with neutral material swept along by a backflow of the jet plasma from the AGN outburst that is ionised through adifuse radiation field with a low-ionisation parameter that continues to excite gas away from the radiation cone.
Key words. Galaxies: individual: Cen-A, Galaxies: ISM, Galaxies: jets, Galaxies: structure, Galaxies: star formation
1. Introduction
In recent decades, observations and modelling have shown theneed for a mechanism able to regulate star formation in galax-ies (Bower et al. 2006; Croton et al. 2006). The interaction ofjets from radio galaxies with the surrounding medium is believedto provide this mechanism, although understanding the detailedprocesses of the interaction of radio jets with the inter-stellarmedium (ISM) or the intra-cluster medium (ICM) is a key miss-ing piece in the scenario of AGN-regulated galaxy growth. Whilefeedback from AGN jets is believed to quench star formationglobally, the interaction of the jet with the gas may indeed locallyenhance star formation (Rees 1989; Croft et al. 2006; Bogdánet al. 2011), as observed in Minkowski’s object (van Breugelet al. 1985; Brodie et al. 1985) or along filaments surroundingNGC 5128 (Cen A). As a nearby source, Cen A is thus a perfecttarget for detailed studies of the star formation processes at theinterface of the jet-and-gas interaction.
NGC 5128 is a very extensively studied giant early-typegalaxy located at 3.8 Mpc (Rejkuba 2004). It lies at the heart of amoderately rich group of galaxies and hosts a relatively massivedisc of dust, gas, and young stars in its central regions (Israel1998) that is interpreted as evidence of a recent merger event.NGC 5128 has a central supermassive black hole (with a massof ∼2×10⁸ M�, Khorunzhev et al. 2012) and a very large double-lobed radio source. The AGN at the centre of the galaxy is thelargest extragalactic radio source projected on the sky (Israel1998), composed of radio jets (∼1.35 kpc) and giant radio lobes
(∼250 kpc). More recently, Kraft et al. (2009) mapped huge X-ray filaments around the galaxy. These hot gas filaments couldhave been expelled by previous AGN outbursts or could be partof the shells resulting from the recent merger. Along the radio-jet, optically bright filaments have been observed (Crockett et al.2012, and references therein) in far-ultraviolett (FUV) and near-ultraviolett (NUV) GALEX data (Auld et al. 2012).
Deep optical observations reported by Rejkuba et al. (2001)contained no stars younger than ∼40 Myr in the halo, whereasthe authors observed luminous blue main sequence stars (∼10Myr old) aligned with the radio axis of Cen A. The intersec-tion of the north-eastern radio jet with a HI filament along theradio jet edge was also observed by Mould et al. (2000), whofound blue stars with -0.6 < V − I < -0.5, suggesting that theradio jet has led to a star formation episode. More recently,very young stars (∼1−4 Myr old) were observed in the north-ern filaments (Crockett et al. 2012), and GALEX observationsconfirmed star formation rates of the order of 2.5×10⁻³ M�/yraround the shell region. The jet has probably hit the existingHI filament and shocked the gas, which has resulted in regionsof cool gas (T≤ 104 K) surrounded by a much hotter (T≥ 106
K) medium (Rees 1989). This could have produced an over-pressured environment where molecular clouds can collapse andform stars via Jeans instability, resulting in a burst of star forma-tion.
Article number, page 1 of 14
arX
iv:1
409.
7700
v2 [
astr
o-ph
.GA
] 2
8 Ja
n 20
15

A&A proofs: manuscript no. cen-a_arcs_muse_final_arXiv
Fig. 1. Hα channel map contours with panels centred at wavelengths from 6575 to 6563 Å at an interval of 1.5 Å (∼ 60 km/s) from left to right,top to bottom, overlaid on GALEX FUV images. Panel 6 is a wider view of the NUV image together with 21cm VLA radio-continuum contoursin red. The red rectangle indicates the FOV of MUSE.
2. Observations
The observations were carried out using MUSE on the VLT(Henault et al. 2003) during the Sience Verification period (Pro-gram 60.A-9341(A) on 25 June 2014, PIs: S. Hamer for the in-ner filament and F. Santoro for the outer filament). The observa-tions consisted of three pointings of 540s each, with a 3 arcsecdither and 90o rotation between each. The data were reducedwith version 0.18.1 of the MUSE data reduction pipeline. Theindividual recipes of the pipeline were executed from the Euro-pean Southern Observatory Recipe Execution Tool (ESOREX v.3.10.2) command-line interface. We fixed a pipeline error dur-ing the wavelength calibration by changing the tracetable for ifu6, kindly provided by Johan Richard. The final data cube wasthen sky subtracted using a 20x20 arcsec region of the FOVfree from line emission and stars to produce the sky model.Individual cubes were extracted for each of our principal lines(Hαλ6562.8, [NII]λ6583, Hβλ4861.3, [OIII]λ4959+5007 [OI]λ6366 andboth [SII]λ6716+6731 lines), each covering a velocity range of ±330 km s−1 from the mean redshift of the filament (z = 0.00108)at a consistent velocity sampling of ∼ 30 km s−1.
3. Results
We produced channel maps for each of our principal lines fromtheir individual cubes to examine their respective structure (seeAppendix C). The channel maps recover all of the clumpy emis-sion from the filament seen by Crockett et al. (2012). In addition,we discovered a new component of low surface brightness thatwe call ”arcs” to describe the extended emission in the highervelocity channels that in projection run perpendicular to the di-rection of the main filament, see Fig. 1. The arcs show a non-uniform structure that resembles several filaments that appear toconverge on the central bright region of the main filament (Fig.2). The position of the arcs also changes as the velocity channelincreases, such that the gas closer to the central galaxy appears tobe more highly redshifted. We compared the arcs with the X-raymap of Karovska et al. (2002); the MUSE field of view was su-perposed on part of the large ring, but in a diffuse region, withouta clear associated X-ray structure.
Moment maps of the Hα emission from the filament areshown in Fig. 2 (moment maps for the other principle lines canbe found in Appendix B). The Hα flux map has been scaled toshow the structure in the arcs and the clumps of the main fila-ment are seen as a dark region that runs SW to NE in the image.
The velocity map shows that no coherent velocity structure ispresent within the filament as a whole. However, we note thatsome velocity variations of about ∼200 km s−1are present withinthe individual clumps. In contrast, the arcs show a much morecoherent velocity structure, with a velocity shift of ∼200 km s−1
running parallel to the main filament. However, we note that themean velocity of the arcs is offset from that of the main filamentby ∼200–300 km s−1 at any given projected distance from thegalaxy. There is a sharp transition between the velocities at theedge of the clumps in the filament, suggesting that the arcs arecomponents that are kinematically separated from the filament.The map of the FWHM shows that in the central parts of theclumps the emission lines are very narrow, barely resolved at thenative resolution of the observations. In contrast, however, thegas surrounding the clumps shows broad lines, with a FWHMof about 400–600 km s−1. This is consistent with the value of∼450 km s−1 estimated by Sutherland et al. (1993) to be the in-duced velocity at the jet–cloud boundary, which suggests that thegas in these regions has been shocked. We note, however, thatthe flux from the clumps is similar to that from the arcs here,such that the two kinematic components may be blended, thusartificially broadening the line. To test this, we attempted to fitthe broad regions again, this time using a two-component model.A second component is present when increasing the binning to1×1 arcsec2 , but we note that this is similar to the thickness ofthe broad-line region. We find no significant second componentat the spatial sampling used by the fitting routine that producedthe moment maps. The narrow component within the clumps isorders of magnitude brighter than the broad lines that surroundthem, but we detect broad wings in some of the fainter regionsof the clumps (see Appendix D) that have a FWHM consistentwith that seen at the projected edge of the clumps.
4. Discussion
Arcs - The arcs seen in these observations differ substantiallyfrom the main filament. From consulting the channel maps, wenote that they do not show the seemingly clumpy structure ofthe main filament and present a much more uniform distributionat a given velocity. The moment maps also indicate that theirline ratios (in particular [OIII]/Hβ) differ from those seen in theclumps. Their line widths are narrow, but are typically resolvedwith an average line width of ∼ 150 km s−1 unlike the interiorsof the clumps, which are unresolved in most cases. This all sug-gests that the arcs are a phenomenon separate from the filaments.
Article number, page 2 of 14

S. Hamer , P. Salomé , F. Combes and Q. Salomé : MUSE discovers perpendicular arcs in the inner filament of Cen A
Fig. 2. Left - Integrated Hα flux map scaled to emphasize the clumpy structure of the inner filament. Centre left - Hα flux map after the clumps ofthe inner filament have been subtracted to show the structure of the arcs. Centre right - Velocity structure of the Hα – [NII] complex. Right - FWHMof the Hα emission showing regions of increased line width surounding the clumps. The FWHM map shows that the linewidth is broadened at theedges of the clumps up to 400-600 km s−1 , suggesting that the gas here may be shocked.
Given the offset in velocity and the sharp transition, it is possiblethat they are separated in space and superimposed onto the sameregion of the sky by projection effects.
If the arcs are phenomena separate from the filament, thenthe nature of the arcs must be addressed, and we propose thefollowing three possibilities: 1) - The arcs are separate filamentsfeeding gas onto the main filament. While the channel maps lookas though the arcs form filaments that lead to the central clumpof the main filament, we note that the velocity in the arcs at thisintersection differs from that of the filament by 200–300 km s−1.We thus find it unlikely that the arcs are feeding gas onto themain filament; if this were the case, we would expect to see asmoother velocity transition. 2) - The arcs are associated with thestellar shell surrounding the galaxy. There exists a well-knownset of stellar shells as a result of a past encounter and mergerof a small galaxy companion, as well as associated HI shellswith molecular gas (e.g. Schiminovich et al. 1994; Charmandariset al. 2000) near the arcs, which suggests that the two might berelated. Direct comparison shows that the arcs share a structurewith a faint FUV emission seen in GALEX images that is notclearly in the NUV (see Fig. 1). We also note that the sense ofcurvature of these structures is opposite to that seen in the stellarshell surrounding the central galaxy. 3) - The arcs are a backflowof gas from the AGN outburst. Backflows are predicted to formas fast-moving material in the jet collides with the slower mov-ing material at the front (Norman et al. 1982; Perucho & Martí2007; Rossi et al. 2008; Mizuta et al. 2010). These simulationsconsidered the plasma of the jet, while we observed the recom-bination lines from the ionised front of the neutral medium asso-ciated with this plasma by the interaction between the backflowand the ISM. Such a backflow would account for the concavity ofthe arcs and explain the velocity structure they show. Addition-ally, Cen-A is a good candidate to form backflows because it isan FRI source (consistent with models of backflows by Laing &Bridle 2012) with a jet–cocoon morphology over the inner 5–10kpc of the radio jet.
Of the three proposed cases, a backflow from an AGNoutburst best fits the observed data. Cielo et al. (2014) havesimulated backflows and found a time-scale of 1 Myr to formthe backflow; after this time, the backflow might disappear,which suggests that the inner jet in Cen-A might be quite youngand that the most recent episode of outburst began relativelyrecently. In this case the radio lobes seen on large scales musthave come from previous outbursts of the AGN.
Clumpy filament - Given the clumpy appearence of the mainfilament, we applied the clumpfind procedure developed byWilliams et al. (1994) to search for clumps within the Hα datacube. We eliminated clumps with a spatial extent smaller thanthe mean seeing and those that reached the edge of the cube
along one or more of the axes. Finally, we combined clumpsthat shared a sharp edge along one of the spatial (x or y) axesand had matching extents in the other and the v axis. We identi-fied ten significant clumps within the main filament and list theirpositions and sizes in Table B.1. The clumps are large, ∼3–6times the spatial resolution (∼ 60–120 pc), suggesting that thereare no smaller clumps. Most notably, however, they are all a partof the main filament, clearly indicating a difference in structurebetween the filament and the arc.
We used the positions and sizes of the clumps as identifiedfrom the Hα to extract the fluxes for each of the principlelines from their individual cubes. These are given in Table B.1.We note that the [OIII] is surprisingly bright in the clumps,outshining all other lines with the exception of Hα in clump 1,which was identified as a star-forming knot in Crockett et al.(2012). Its position in the moment maps indicates that it showsvery little velocity and has much lower [NII]/Hα and [OIII]/Hβratios than the other clumps, confirming that the dominance of[OIII] is real and not a result of a misalignment between thecubes of individual lines.
Excitation - In Fig. 3 we show three key diagnostic line ratioplots to compare the clumps with the arcs. The positions of thetwo structures in these diagrams suggest that star formation isnot the dominant form of ionisation within them, with one excep-tion. The star-forming knot identified by Crockett et al. (2012)is clearly separate from the other clumps (shown in blue) andfalls below the star-forming upper limit in all three diagnosticplots. We include shock models from Allen et al. 2008 in theseplots. The range of line ratios in the arcs cannot be explained bythe shock models, but the ratios are consistent with AGN exci-tation (Rodriguez Zaurin et al. 2014) by a radiation field with alow ionisation parameter. In the clumps the shock models agreewell with the [NII]/Hα, [OIII]/Hβ and [SII]/Hα ratio. However,the [OI] appears weak in relation to the other lines. This appar-ent weakness of [OI] in the clumps can be explained in severalways. Using models with a stronger magnetic field ( B = 0.1 mGfor n=100 and 1 mG for n=1000) improves the model fits withthe [OI]/Hα, but causes the models to shift away from the posi-tions of the clumps in the other two diagrams. It is also possi-ble that the gas is of low metallicity such that coolants are rare.In this case, the gas remains hot and excited, which boosts the[OIII] (Bresolin 2007) emission and leaves little neutral oxygento produce the [OI] line (McGaugh 1991). To test this, we com-pared the low-metallicity models from Allen et al. 2008 with ourdata. It is important to note that the low-metallicity models havea lower density (n=1) than the expected electron density in theclumps (n=100-200 from the [SII] ratio). These models fit the[OI]/Hα and [OIII]/Hβ ratios very well. However, the modelsunderestimate the [NII]/Hα and [SII]/Hα ratio. Finally, we note
Article number, page 3 of 14

A&A proofs: manuscript no. cen-a_arcs_muse_final_arXiv
Fig. 3. Key diagnostics of the reddening–insensitive line ratios for the clumps (circles) and arcs (points). The dotted line represents the empiricalseparation of star formation and AGN-ionised regions, the dashed lines show the extreme upper limit possible for star formation (Kewley et al.2006). Shock models from Allen et al. 2008 are shown for 2 densities n=100 (purple) and 1000 (blue) cm−3 at 3 standard magnetic field strengths(B=0.1, 1, 5 and 10, 32, 100 µG, respectively, from left to right in the first and second panel and right to left in the third panel) and one highmagnetic field strength (B=0.1 and 1 mG). The clumps and arcs are clearly seperated in this plot, indicating that they are energetically distinctobjects. The excitation of the clumps cannot be fully explained by shocks because they are too low in [OI] relative to the [OIII] flux.
the possibility that the clumps are excited by photo-ionisationfrom the AGN (Rodriguez Zaurin et al. 2014) with the additionof a bright radiation cone (Baskin & Laor 2005) that does notaffect the arcs.
Any model to explain the line ratios seen in the clumps mustallow for the different ratios seen in the arcs. For magnetic fieldsto play a role, the strong fields would have to be confined tothe small scales of the individual clumps. A large variation inmetallicity between the clumps and the arcs could also explaindifference in line ratios between the two. The apparent offset invelocity space between the clumps and the arcs does allow for abright radiation cone to illuminate the clumps while not affectingthe more distant arcs. The simplicity of this solution, coupledwith the fact that radiation cones are common within the narrow-line regions of AGN (Mulchaey et al. 1996a,b) makes this ourfavoured solution. Composite models (including star formation,AGN photo-ionisation, and shocks) are probably needed to fullyaccount for the ionisation within the clumps. McDonald et al.(2012) were able to account for a low [OI]/Hα ratio in filamentswithin cluster cores by using a composite of star formation andshock models, but this cannot explain the strength of the [OIII]line in the inner filament of Cen-A.
5. Conclusions
Our observations have detected a new structure close (in projec-tion) to the inner filament in Cen-A. These arcs are offset fromthe filament by 200–300 km s−1 and show distinct differencesin their morphology, velocity structure, and line ratios, whichsuggests that they are a component distinct from the filaments.We conclude that the arcs are most likely formed as a result ofa backflow from the AGN jets, suggesting that the inner jet isyoung (∼ 1 Myr). The detection of the backflow and the abilityof MUSE to measure the excitation and accurately map its kine-matics allow us to directly observe the impact of the jet on theambient gas in Cen-A and demonstrate that jets can continue toaffect gas far from the main axis of the jet through backflows.
The line profiles also show evidence of a thin region ofbroad-line emission surrounding the clumps. The width of theselines is consistent with that predicted from shocks, which sug-gests that the clumps are surrounded by a shell of gas that hasbeen shocked by an interaction with the jet. The clumps showevidence of being shocked by the jet, are bright in UV, and onehas line ratios consistent with star formation, which together in-dicates that the gas in that clump is forming stars as a directresult of the interaction with the jet through positive feedback.
However, the other clumps are much brighter in [OIII] than theother lines, but are weak in [OI] for a shock-ionised region. Wepropose that the clumps are also illuminated by a radiation conefrom the AGN that is boosting the [OIII] and dominates the ion-isation in the rest of the filament. Composite models of shockionisation and star formation would then account for the line ra-tios seen in the star-forming clump.Acknowledgements. The authors would like to thank Thierry Contini and JohanRichard for their help during the MUSE data reduction and calibration process.SLH acknowledges the support the European Research Council for AdvancedGrant Program number 267399-Momentum. Based on observations made withESO Telescopes at the Paranal Observatory under programme ID 60.A-9341
ReferencesAuld, R., Smith, M. W. L., Bendo, G., et al. 2012, MNRAS, 420, 1882Baskin, A. & Laor, A. 2005, MNRAS, 358, 1043Bogdán, Á., Kraft, R. P., Forman, W. R., et al. 2011, ApJ, 743, 59Bower, R. G., Benson, A. J., Malbon, R., et al. 2006, MNRAS, 370, 645Bresolin, F. 2007, ApJ, 656, 186Brodie, J. P., Bowyer, S., & McCarthy, P. 1985, ApJ, 293, L59Charmandaris, V., Combes, F., & van der Hulst, J. M. 2000, A&A, 356, L1Cielo, S., Antonuccio-Delogu, V., Macciò, A. V., Romeo, A. D., & Silk, J. 2014,
MNRAS, 439, 2903Crockett, R. M., Shabala, S. S., Kaviraj, S., et al. 2012, MNRAS, 421, 1603Croft, S., van Breugel, W., de Vries, W., et al. 2006, ApJ, 647, 1040Croton, D. J., Springel, V., White, S. D. M., et al. 2006, MNRAS, 365, 11Henault, F., Bacon, R., Bonneville, C., et al. 2003, in Society of Photo-Optical
Instrumentation Engineers (SPIE) Conference Series, Vol. 4841, InstrumentDesign and Performance for Optical/Infrared Ground-based Telescopes, ed.M. Iye & A. F. M. Moorwood, 1096–1107
Israel, F. P. 1998, A&A Rev., 8, 237Karovska, M., Fabbiano, G., Nicastro, F., et al. 2002, ApJ, 577, 114Khorunzhev, G. A., Sazonov, S. Y., Burenin, R. A., & Tkachenko, A. Y. 2012,
Astronomy Letters, 38, 475Kraft, R. P., Forman, W. R., Hardcastle, M. J., et al. 2009, ApJ, 698, 2036Laing, R. A. & Bridle, A. H. 2012, MNRAS, 424, 1149McDonald, M., Veilleux, S., & Rupke, D. S. N. 2012, ApJ, 746, 153McGaugh, S. S. 1991, ApJ, 380, 140Mizuta, A., Kino, M., & Nagakura, H. 2010, ApJ, 709, L83Mould, J. R., Ridgewell, A., Gallagher, III, J. S., et al. 2000, ApJ, 536, 266Mulchaey, J. S., Wilson, A. S., & Tsvetanov, Z. 1996a, ApJS, 102, 309Mulchaey, J. S., Wilson, A. S., & Tsvetanov, Z. 1996b, ApJ, 467, 197Norman, M. L., Winkler, K.-H. A., Smarr, L., & Smith, M. D. 1982, A&A, 113,
285Perucho, M. & Martí, J. M. 2007, MNRAS, 382, 526Rees, M. J. 1989, MNRAS, 239, 1PRejkuba, M. 2004, A&A, 413, 903Rejkuba, M., Minniti, D., Silva, D. R., & Bedding, T. R. 2001, A&A, 379, 781Rodriguez Zaurin, J., Tadhunter, C. N., Rupke, D. S. N., et al. 2014, ArXiv e-
printsRossi, P., Mignone, A., Bodo, G., Massaglia, S., & Ferrari, A. 2008, A&A, 488,
795Schiminovich, D., van Gorkom, J. H., van der Hulst, J. M., & Kasow, S. 1994,
ApJ, 423, L101van Breugel, W., Filippenko, A. V., Heckman, T., & Miley, G. 1985, ApJ, 293,
83Williams, J. P., de Geus, E. J., & Blitz, L. 1994, ApJ, 428, 693
Article number, page 4 of 14

A&A–cen-a_arcs_muse_final_arXiv, Online Material p 5
Appendix A: Composite image
A&A–cen-a_arcs_muse_final_arXiv, Online Material p 6
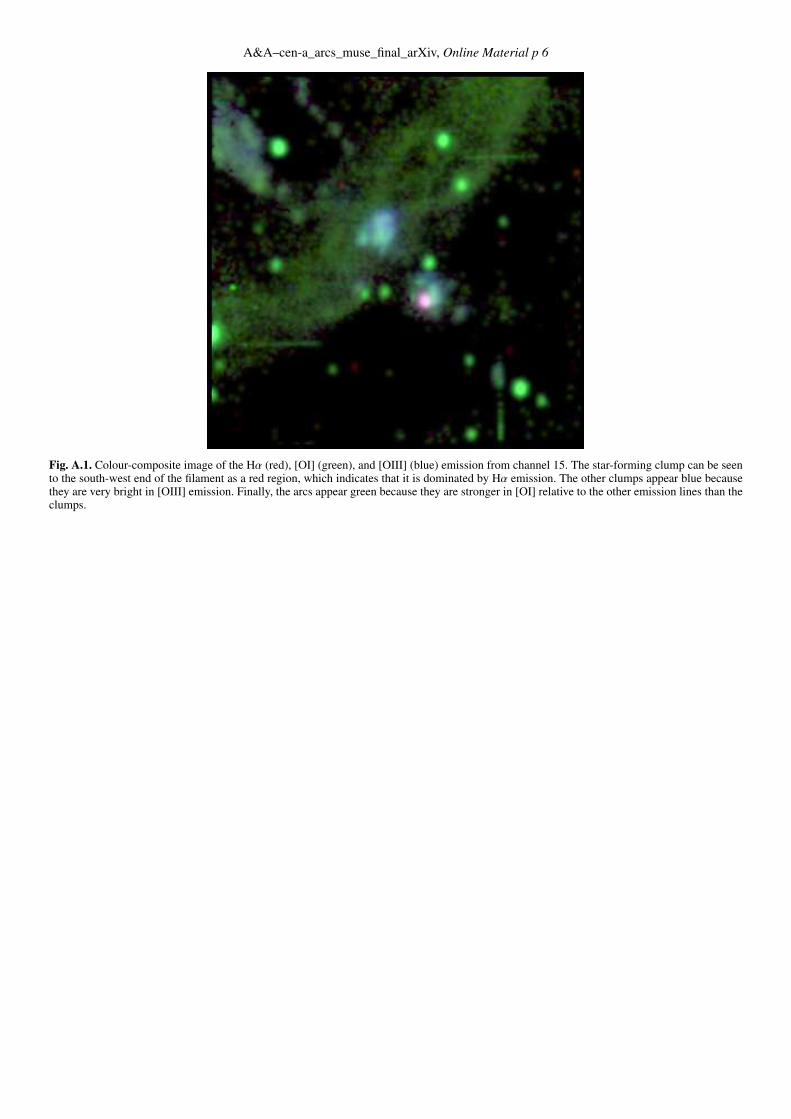
Fig. A.1. Colour-composite image of the Hα (red), [OI] (green), and [OIII] (blue) emission from channel 15. The star-forming clump can be seento the south-west end of the filament as a red region, which indicates that it is dominated by Hα emission. The other clumps appear blue becausethey are very bright in [OIII] emission. Finally, the arcs appear green because they are stronger in [OI] relative to the other emission lines than theclumps.

A&A–cen-a_arcs_muse_final_arXiv, Online Material p 7
Appendix B: Moment maps and clump properties

A&A–cen-a_arcs_muse_final_arXiv, Online Material p 8
Fig. B.1. Fitted flux in each of our primary diagnostic lines. The key line ratios, average velocity, and the full width at half maximum for all of thelines are shown.
Table B.1. Positions and sizes of the filament clumps
Clump RA Dec RA FWZI Dec FWZI Velocity FWHM Hα Hβ [OIII] [NII] [SII] [OI](pc) (km s−1) (10−16 erg cm−2 s−1)
1 13:26:03.41 -42:57:17.2 120.3 ± 0.072 112.7 ± 0.068 -194 ± 8.7 102 ± 4.3 266 ± 0.31 80 ± 0.21 224 ± 0.49 64 ± 0.13 41 ± 0.22 8 ± 0.252 13:26:04.67 -42:56:58.2 91.63 ± 1.1 156.6 ± 1.8 -314 ± 9.6 92 ± 4.7 78 ± 0.28 24 ± 0.19 259 ± 0.45 45 ± 0.12 37 ± 0.20 13 ± 0.233 13:26:04.05 -42:57:03.0 114.3 ± 1.7 173.5 ± 2.5 -194 ± 8.7 102 ± 4.3 102 ± 0.35 33 ± 0.23 361 ± 0.55 39 ± 0.14 33 ± 0.25 12 ± 0.284 13:26:04.39 -42:57:05.8 153.7 ± 2.9 126.7 ± 2.4 -254 ± 7.8 114 ± 3.9 65 ± 0.30 20 ± 0.20 175 ± 0.48 36 ± 0.13 31 ± 0.22 13 ± 0.245 13:26:03.45 -42:57:13.8 70.55 ± 1.7 115.6 ± 2.7 -254 ± 6.4 138 ± 3.2 28 ± 0.21 9 ± 0.14 69 ± 0.33 16 ± 0.087 15 ± 0.15 4 ± 0.176 13:26:05.03 -42:56:57.4 64.75 ± 1.6 64.46 ± 1.6 -284 ± 10. 87 ± 5.0 19 ± 0.16 5 ± 0.11 32 ± 0.25 10 ± 0.066 8 ± 0.12 5 ± 0.137 13:26:03.35 -42:57:13.6 59.70 ± 1.5 94.37 ± 2.4 -254 ± 7.5 119 ± 3.7 24 ± 0.19 8 ± 0.13 71 ± 0.30 12 ± 0.079 11 ± 0.14 3 ± 0.158 13:26:05.01 -42:56:51.8 114.1 ± 4.3 58.85 ± 2.2 -314 ± 12 75 ± 5.7 17 ± 0.17 5 ± 0.11 49 ± 0.27 8 ± 0.071 7 ± 0.12 3 ± 0.149 13:26:05.10 -42:56:59.2 96.12 ± 4.8 73.27 ± 3.6 -314 ± 11 81 ± 5.3 7 ± 0.12 2 ± 0.078 15 ± 0.18 4 ± 0.048 3 ± 0.084 2 ± 0.09310 13:26:04.83 -42:56:57.0 60.03 ± 3.0 111.5 ± 5.5 -344 ± 11 80 ± 5.4 19 ± 0.18 6 ± 0.12 58 ± 0.28 9 ± 0.074 7 ± 0.13 4 ± 0.14

A&A–cen-a_arcs_muse_final_arXiv, Online Material p 9
Appendix C: Channel Maps

A&A–cen-a_arcs_muse_final_arXiv, Online Material p 10
Fig. C.1. Hα channel maps. The channels cover the velocity range of -330 km s−1 to 300 km s−1 relative to the mean redshift of the filament(z = 0.00108, shifted by ∼ -220 km s−1 relative to the central galaxy) with channels of 30 km s−1. Flux units are 10−20 erg s−1 cm−2 Å−1.
Fig. C.2. [NII] channel maps. The channels cover the velocity range of -330 km s−1 to 300 km s−1 relative to the mean redshift of the filament(z = 0.00108, shifted by ∼ -220 km s−1 relative to the central galaxy) with channels of 30 km s−1. Flux units are 10−20 erg s−1 cm−2 Å−1.

A&A–cen-a_arcs_muse_final_arXiv, Online Material p 11
Fig. C.3. Hβ channel maps. The channels cover the velocity range of -330 km s−1 to 300 km s−1 relative to the mean redshift of the filament(z = 0.00108, shifted by ∼ -220 km s−1 relative to the central galaxy) with channels of 30 km s−1. Flux units are 10−20 erg s−1 cm−2 Å−1.
Fig. C.4. [OIII] channel maps. The channels cover the velocity range of -330 km s−1 to 300 km s−1 relative to the mean redshift of the filament(z = 0.00108, shifted by ∼ -220 km s−1 relative to the central galaxy) with channels of 30 km s−1. Flux units are 10−20 erg s−1 cm−2 Å−1.

A&A–cen-a_arcs_muse_final_arXiv, Online Material p 12
Fig. C.5. [SII] channel maps. The channels cover the velocity range of -330 km s−1 to 300 km s−1 relative to the mean redshift of the filament(z = 0.00108, shifted by ∼ -220 km s−1 relative to the central galaxy) with channels of 30 km s−1. Flux units are 10−20 erg s−1 cm−2 Å−1.
Fig. C.6. [OI] channel maps. The channels cover the velocity range of -330 km s−1 to 300 km s−1 relative to the mean redshift of the filament(z = 0.00108, shifted by ∼ -220 km s−1 relative to the central galaxy) with channels of 30 km s−1. Flux units are 10−20 erg s−1 cm−2 Å−1. The first7 channels are covered by a skyline and as such are extremely noisy, therefore no emission is visible. We have retained their panels, but set theirvalue to zero so that the channels are consistent in velocity with the other channel maps.

A&A–cen-a_arcs_muse_final_arXiv, Online Material p 13
Appendix D: Broad wings within the clumps
A&A–cen-a_arcs_muse_final_arXiv, Online Material p 14
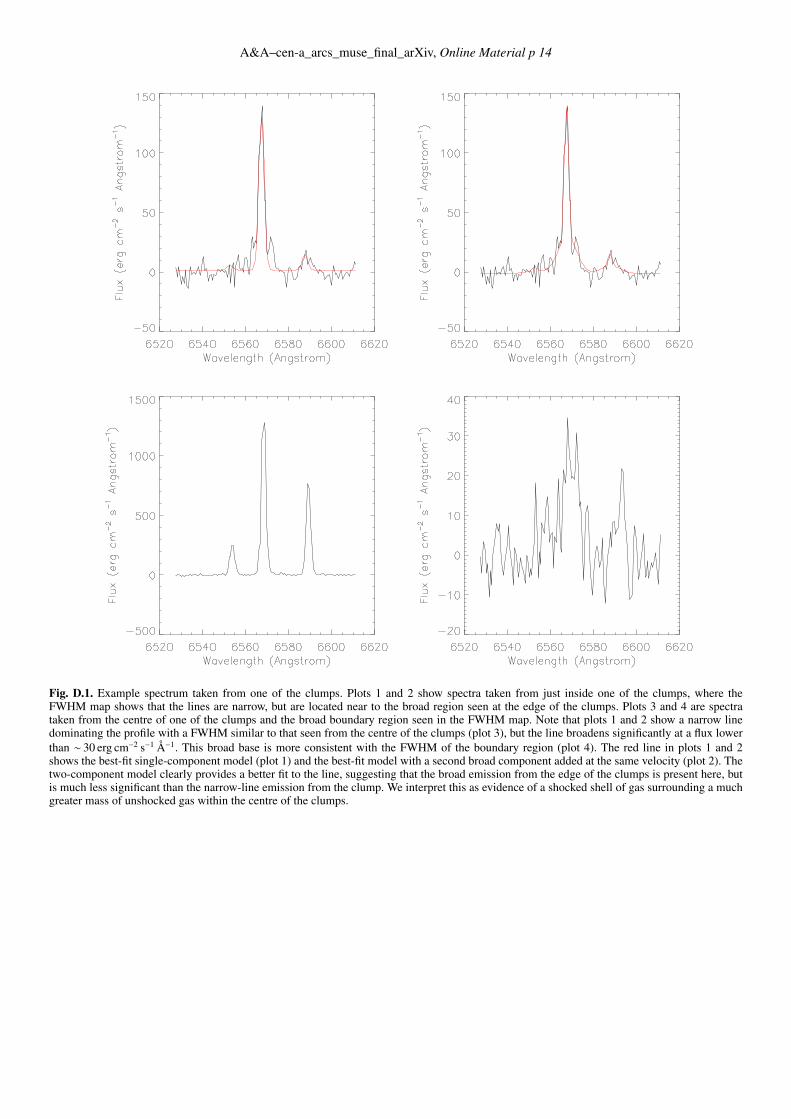
Fig. D.1. Example spectrum taken from one of the clumps. Plots 1 and 2 show spectra taken from just inside one of the clumps, where theFWHM map shows that the lines are narrow, but are located near to the broad region seen at the edge of the clumps. Plots 3 and 4 are spectrataken from the centre of one of the clumps and the broad boundary region seen in the FWHM map. Note that plots 1 and 2 show a narrow linedominating the profile with a FWHM similar to that seen from the centre of the clumps (plot 3), but the line broadens significantly at a flux lowerthan ∼ 30 erg cm−2 s−1 Å−1. This broad base is more consistent with the FWHM of the boundary region (plot 4). The red line in plots 1 and 2shows the best-fit single-component model (plot 1) and the best-fit model with a second broad component added at the same velocity (plot 2). Thetwo-component model clearly provides a better fit to the line, suggesting that the broad emission from the edge of the clumps is present here, butis much less significant than the narrow-line emission from the clump. We interpret this as evidence of a shocked shell of gas surrounding a muchgreater mass of unshocked gas within the centre of the clumps.