Embed Size (px)
Citation preview
MUSCl 1 CALCIUM MODULATION USING VITAMIN D
TO IMPROVE B i l l TENDERNESS
by
JAVDEN LLOYD MONTGOMERY, B.S., M S
A DISSER1 ATION
IN
ANIMAL SCIENCE
Submitted to the Graduate Faculty
of Texas Tech University in Partial Fulfillment of the Requirements for
the Degree of
DOCTOR OF PHILOSOPHY
Approved
May, 2001
ACKNOWLIiDGEMRNTS
1 would like to express my sinccrest gratitude and thanks to Dr. Mark Miller. Dr.
Miller has been a guiding light in my life for a number of years. His leadership,
devotion, and work ethic ha\e taught me a lot about how to be a good leader. 1 consider
Dr. Miller not only the chairman of my dissertation committee, but also my friend. I
cannot begin to measure the time that Dr. Miller has spent trying to mold both my
professional and personal life. Again, 1 express my heartfelt thanks to Dr. Miller and his
family for their dedication and commitment to "excellence." Without your help and
support, I w ould have ne\ er had the degree of success I have had in my life.
My thanks go out to Dr. K. John Morrow. I carmot begin to measure the amount
of time that you also have spent shaping my professional life. Your suggestions have
always been well received. I would like to thank Dr. Morrow and Dr. John Blanton for
their time and expertise in the areas of cell culture, cellular protein synthesis and
degradation, molecular and cellular biology, ELISA, and Western blotting.
I would also like to thank Dr. Mike Galyean for his vital and helpful suggestions
and time in setting up the nutritional side of my experiments. Without your help, I would
have never started or completed a project. Also your additional time in editing my
journal articles over the years has proven a major asset to my writing abilities. I also
would like to thank Dr. David Wester for your generous time and expertise in
experimental design and statistical analyses. Dr. Wester has spent a great amount of his
time helping me analyze data from my dissertation and additional projects. Again,
thanks.
1 also would like to thank Dr. Ronald Horst from the National Animal Disease
Center in Ames, lA. While your daily input was limited because of geography, your
input into m> doctoral education truly was immeasurable. You opened your lab and
resources to me for a number of months, which greatly helped in my doctoral research. I
cannot fully express thanks for your time, help, and suggestions. Again, thanks.
Special tlianks go to the graduate students in the Meat Science program at Texas
Tech Uni\ ersit> and especiall> to Dr. Mandy Carr, and Dr. Chris Kerth, and to Eddie and
Laura Behrends, Brian King, Jessica Gentry, Amber and Brett Barham, Will Harper, and
Gretchen Hilton. Without your support, friendship and help with research projects, this
program and my doctoral research would have been unthinkable.
I would also like to thank Derrel Hoy and Dwajoie Zimmerman for their expertise
and help with my vitamin D and metabolite determination. I would like to thank Dr.
Elisabeth and Dr. Stephen Lonergan for their help and training with my Western-blot
determinations. I would like to thank Kirk Robinson for his help in managing and
feeding of my cattle. I would also like to send out a sincere thank you to Mrs. Mary
Catherine Hastert for help expertise and time with the electron microscopy components
of my projects. Your help and time with the localizations part of my experiments have
proven extremely valuable. I would also like to thank my friend and roommate. Lane
Stanfield, for his support and help in maintaining my household and life while I was
spending time in Iowa.
I would also like to thank Dr. Vivien Allen and Phil Brown for their training and
help in running of the muscle digests and mineral analyses. I also very much appreciate
111

the laboratory help of Kirk Braden and Crystal Sullemeier. 1 also want to acknowledge
oiu- funding sources for their contributions: National Cattlemen's Beef Association,
Texas Beef Council. Roche Vitamins. Inc., and the Center for Feed Industry Research
and Education at lexas lech University. Personally, I would like to thank Texas Tech
for funding my personal research through the 1999 Texas Tech University Summer
Dissertation Research .Award.
Most of all. 1 would like to thank my loving parents. Bill and Jackie. Your love
and support is a valuable part of my life, and makes each day worth living. Finally, an
extra-special thanks to my fiancee Lisa for all of her love and patience in completing this
dissertation.
I feel \ er> fortunate to have worked and met so many wonderful people in my
life during m> time at Texas Tech University. I hope to continue to make all of you
proud. Again, thanks.
IV

I ABl P.OI ("()Nfl':NIS
\cKN'()\\i.i-;nGMi;Nis ii
\USIR.\t 1 viii
LIS! 0\- lABl lS . . X
LISIOI FKURIS xii
CHAPTER
I. INTRODl fl ' lON 1
II. RIAIEW OF LITERATURE 3
HI. EFFECT OF VITAMIN D3 DOSE CONCENTRATION \ND BIOLOGICAL TYPE OF CATTLE ON THE FEED EFFICIENCY, TISSUE RESIDUES, AND TENDERNESS OF BEEF STEERS 54
I\' EFFECT OF VITAMIN D;, SUPPLEMENTATION OF STEERS ON THE MINERAL STATUS AND DISTRIBUTION OF CALCIUM WITHIN LONGISSIMUS Ml SCLE 95
V EFFECT OF VITAMIN D3 SUPPLEMENTATION ON PROTEIN TURNOVER AND PROTEIN REGULATION USING A CELL CULTURE MODEL 113
VI SUMMARY OF EXPERIMENTS 143
LITERATURE CITED 145
APPENDIX
A. SOLUTION AND REAGENT FORMULATIONS 174
B. DETERMINATION OF PLASMA CALCIUM 181
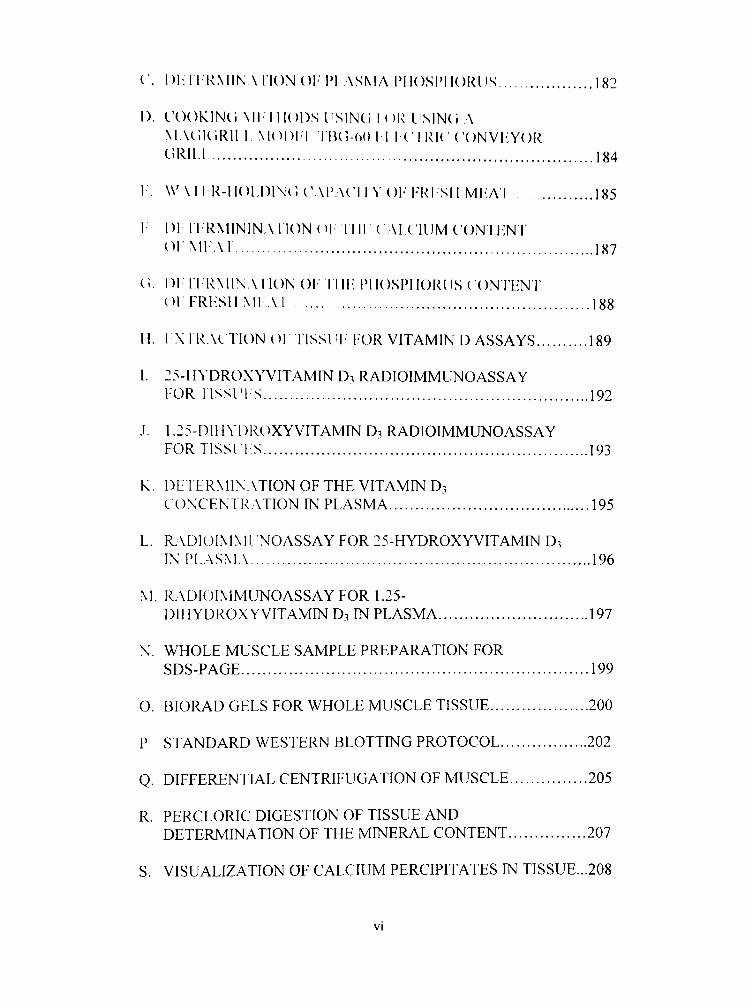
C. I)1-;IIRM1N AllON OF PI ASMA PliOSPIIORUS |82
1). COOKING Ml I HODS USING K )R USING A M AGIGRIl I MODI 1 liUl-OO II IC IRK C'ONVI'YOR < il lll 184
I'. W \ l l R-H01,|)|NG CA1'ACI^^• OFFRI SI! MflAI 185
I nilTRMlNINAriONOI IIIICAI.CIUM CONTENT OF Ml-A 1 187
G. 1)1 riRMIN AllON OF I I If: IM lOSPHORUS ( ONTEN T Ol FRHSll Ml Al 188
H. IX TRACTION Ol TISSUI FOR VITAMIN D ASSAYS 189
1. :5-HYDROXYVlTAMIN D3 RADIOIMMUNOASSAY FOR TISSUTS 192
.1. 1.25-Dlini)ROXYVITAMIN D3 RADIOIMMUNOASSAY FORTlSSn-S 193
K. DETERMINATION OF THE VITAMIN D3 CONCENTRATION IN PLASMA 195
L. R.\D10I.MNUN0ASSAY FOR 25-HYDROXYVITAMIN D3 IN PLASMA 196
M. RADIOIMMUNOASSAY FOR 1,25-DIHYDROXYVITAMIN D3 IN PLASMA 197
N. WHOLE MUSCLE SAMPLE PREPARATION FOR SDS-PAGE 199
O. BIORAD GELS FOR WHOLE MUSCLE TISSUE 200
P STANDARD WESTERN BLOTTING PROTOCOL 202
Q. DIFFERENTIAL CENTRIFUGATION OF MUSCLE 205
R. PERCLORIC DIGESTION OF TISSUE AND DETERMINATION OF THE MINERAL CONTENT 207
S. VISUALIZATION OF CALCIUM PERCIPITATES IN TISSUE...208

I Dl TTRMIN ATION Ol HIT PROTI'IN ( ON TI'NT OT IIAR\ I S T 1 D C T : I IS 210
U. DiniRMINATlON OF CI 1 I ULAR PROTl-lN SYN'THi;SIS OFC:(M2CLI,I.S 212
\ DT: TT'RMINA TION OFCTI lUI AR DTXiRADATION OFC2C12 MYOBI AS IS 214
W I \ / ^ M 1 1 INklD IMMUNOABSORBANCI ASSAY 216
VII

ABSTRACT
The effect of supplemental vitamin D3 (VITD) doses during the last 8 d of feeding
and biological t\'pe of cattle on feedlot performance, VITD residues, meat tenderness,
and muscle calcium homeostasis was studied. Supplementing cattle with 5 million
lU/steer daily of VITD negatively affect average daily gain and feed intake, but feeding 1
or .5 million lU/steer daih did not negatively impact feedlot performance data. All the
treatments studied improxed meat tenderness. Sensory panel scores and Warner-Bratzler
shear force indicated that the longissimus and semimembranosus muscles were the most
responsi\e to VITD improving tenderness by as much as 21%. Tissue VITD residues in
the li\ er, kidne>. and muscle were increased by supplementing steers with VITD.
Cooking samples seemed to reduce treatment effects on residues. Supplementing steers
with VITD also increased the calcium content of meat and activated ^-calpain, thereby
increasing myofibrillar proteolysis and degradation of troponin T. Therefore, vitamin D
supplementation of beef cattle can improve meat tenderness and presumably improves
the marketability of beef by decreasing the variation in beef tenderness and accelerating
postmortem tenderization.
The effect of VITD supplementation on muscle mineral metabolism also was
investigated. The VITD treatments seemed to increase the binding of calcium near the Z-
line and to myofibril proteins. Moreover, VITD supplementation and postmortem aging
increased the concentration of Ca^^and P in the cytosol of longissimus muscle.
Vlll

Se\eri\l cell culture experiments were devised to try and explain the role of
\itamin D in muscle cell protein synthesis and degradation. Treatment of myotubes with
l,25-dih>droxy\itamin Dy decreased cellular protein synthesis and increased cellular
protein degradation. The expression of calpastatin, m-calpain, calbindin, and the
calcium-sensing receptor also were decreased by treatment in myotubes. Therefore, the
affects of VITD treatment on cellular degradation might be attributable to regulation of
calpastatin, fi-calpain. and m-calpain expression.
Therefore \ itamin D3 is an important regulator of calcium homeostasis and
proteolysis in muscle. Feeding vitamin D3 at .5 million lU daily for 8 d to steers can
improve beef tenderness and possibly the marketability of beef
IX

LIST OF TABLES
1. Composition of the formulated diet for the vitamin D3 experiment 79
2. Composition of the supplement used in the diet for the vitamin D3 experiment 80
3. .Actual diet nutrient summaiy for the vitamin D3 experiment 81
4. The effect of feeding Vitamin D3 to feedlot steers for eight consecutive da\ s before slaughter on feed:gain, average daily gain, average daih drymatter intake measured during the last 25 days of the feeding trial 81
5. The effect of feeding vitamin D3 to feedlot steers for eight consecutive days before slaughter on carcass traits 82
6. The effect of feeding vitamin D3 to feedlot steers for eight consecutix e days before slaughter on muscle pH, temperature, drip loss, purge and moisture content, calpain activity, and calcium and phosphorus concentration 83
7. The effect of feeding vitamin D3 to feedlot steers for eight consecutive days before slaughter on Warner-Bratzler shear force (kg) 84
8. The effect of feeding vitamin D3 to feedlot steers for eight consecutive days before slaughter on cooking loss (%) 85
9. The effect of feeding Vitamin D3 to feedlot steers for eight consecutive days before slaughter on sensory traits of longissimus and semimembranosus steaks aged to seven days postmortem 86
10. The effect of feeding Vitamin D3 to feedlot steers for eight consecutive days before slaughter on sensory traits of gluteus medius and supraspinatus steaks aged to seven days postmortem 87
11. The effect of feeding Vitamin D3 to feedlot steers for eight consecutive days before slaughter on vitamin D3, 25-hydroxy-vitamin D3, and 1,25-dihydroxy-vitamin D3 concentrations in liver, kidney, strip loin and plasma samples 88
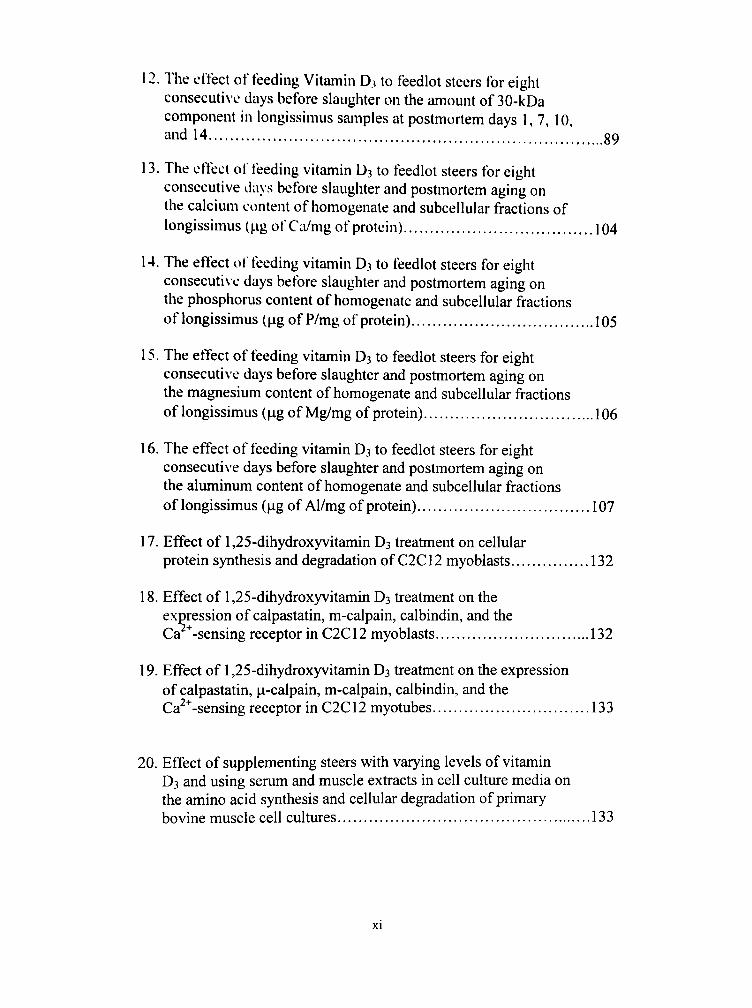
12. The effect of feeding Vitamin D3 to feedlot steers for eight consecutive days before slaughter on the amount of 30-kDa component in longissimus samples at postmortem days 1,7, 10, and 14 89
13. The etfect of feeding vitamin D3 to feedlot steers for eight consecutive da\ s before slaughter and postmortem aging on the calcium content of homogenale and subcellular fractions of longissimus (|.ig of Cii/mg of protein) 104
14. The effect oi' feeding vitamin D3 to feedlot steers for eight consecuti\ e days before slaughter and postmortem aging on the phosphorus content of homogenate and subcellular fractions of longissimus (|.ig of P/mg of protein) 105
15. The effect of feeding vitamin D3 to feedlot steers for eight consecuti\e days before slaughter and postmortem aging on the magnesium content of homogenate and subcellular fractions of longissimus (jag of Mg/mg of protein) 106
16. The effect of feeding vitamin D3 to feedlot steers for eight consecuti\'e days before slaughter and postmortem aging on the aluminum content of homogenate and subcellular fractions of longissimus (|ag of Al/mg of protein) 107
17. Effect of 1,25-dihydroxyvitamin D3 treatment on cellular protein synthesis and degradation of C2C12 myoblasts 132
18. Effect of 1,25-dihydroxyvitamin D3 treatment on the expression of calpastatin, m-calpain, calbindin, and the Ca^^-sensing receptor in C2CI2 myoblasts 132
19. Effect of 1,25-dihydroxyvitamin D3 treatment on the expression of calpastatin, |a-calpain, m-calpain, calbindin, and the Ca ' -sensing receptor in C2C12 myotubes 133
20. Effect of supplementing steers with varying levels of vitamin D3 and using serum and muscle extracts in cell culture media on the amino acid synthesis and cellular degradation of primary bovine muscle cell cultures 133
XI
I.ISTOFT'lCiURIS
1. The structure of muscle (from Bloom and Taccd, 1969, p. 273) 4
2. The slrucluiv of a saaonieiv (irom Huxley. l')()Xp. IX) 6
3. Location of the myoHhrillar and intermediate filament proteins within the myofibril 17
4. The stiuctuiv oi'\itamin Di 45
5 The effect ol lecding \ itaniin D; to feedlot slccrs for eight consecuti\ c days before slaughter on a\ ciage Teed intake 90
(1. The effect o\' feeding vitamin D3 to feedlot slccrs for eight conscculi\e da\s before slaughter on plasma Ca concentrations 91
7. The effect of feeding \itamin D3 to feedlot steers for eight consecutive da>s before slaughter on plasma P concentrations 92
8. The effect of biological type and feeding vitamin D3 to feedlot steers for eight consecutive days before slaughter on plasma 25-hydroxy-\ itamin D3 concentrations 93
9. The effect of feeding vitamin D3 to feedlot steers for eight consecuti\ c days before slaughter on Troponin T degradation 94
10. Dark precipitates of bound Ca disappeared after the fixation solution was treated with EGTA [ethylenebis (oxyethylenenitrilotetraaceticacid)] 108
11. Effect of supplementing steers 0 million lU/steer daily of vitamin D3 (control) for 8 d on the bound Ca distribution 109
12. Effect of supplementing steers 0.5 million lU/steer daily for 8 d on the bound Ca distribution 110
13. Effect of supplementing steers 1.0 million lU/steer daily for 8 d on the bound Ca distribution I l l
14. Effect of supplementing steers 5.0 million lU/steer daily for 8 d on the bound Ca distribution 112
Xll

15. Effect of 1,25-dihydroxyvitamin D3 and treatment time on cellular protein synthesis of C2C12 myotubes 134
16. Effect of 1,25-dihydroxyvitamin D3 and treatment time on cellular protein degradation of C2C12 myotubes 135
17. Effect of 1,25-dihydroxyvitamin D3 on the cellular content of calpastatin in C2C12 myogenic cells in the presence or absence of 1.25-dihydroxyvitamin D3 (100 nM) for 24 hours in octet 136
18. Effect of 1.25-dihydroxyvitamin D3 on the cellular content of (.i-calpain in C2C12 myogenic cells in the presence or absence of 1.25-dihydroxy\itamin D3 (100 nM) for 24 hours in octet 136
19. Effect of 1,25-dihydroxyvitamin D3 on the cellular content of m-calpain in C2C12 myogenic cells in the presence or absence of 1,2 5 -dihydroxyvitamin D3 (100 nM) for 24 hours in octet 137
20. Effect of 1,25-dihydroxyvitamin D3 on the cellular content of the vitamin D-dependent 28 kDa protein calbindin in C2C12 myogenic cells in the presence or absence of 1,25-dihydroxyvitamin D3 (100 nM) for 24 hours in octet 137
21. Effect of 1,25-dihydroxyvitamin D3 on the cellular content of the calciimi-sensing receptor in C2C12 myogenic cells in the presence or absence of 1,25-dihydroxyvitamin D3 (100 nM) for 24 hours in octet 138
22. Effect of 1.25-dihydroxyvitamin D3 and treatment time on the expression of )i-calpain of C2C12 myoblasts 139
23. Effect of 1,25-dihydroxyvitamin D3 and treatment time on the expression of the calcium-sensing receptor of C2C12 myoblasts 140
24. Effect of 1,25-dihydroxyvitamin D3 and treatment time on the expression of calpastatin in C2C12 myotubes 141
25. Effect of supplementing steers vitamin D3 and breed type class on the cellular degradation of primary bovine muscle cultures treated with muscle extracts from the supplemented steers 142
XllI
CHAPTER 1
INTRODUCTION
Tenderness is the most variable and single most important factor affecting
consumer satisfaction and acceptance of meat. Beef tenderness varies greatly among and
between muscles :md it is affected by a number of factors including connective tissue,
muscle fiber t>pe. sarcomere length, degree of doneness, and degree of myofibril
degradafion/ft-agmentation. Lack of beef tenderness has been estimated to cost the U. S.
beef industry $200 to $300 million annually (Morgan, 1995; Smith et al., 1995; Miller et
al.. 1998). Currently, m>ofibrillar proteolysis or degradation seems to be the single most
influential factor affecting postmortem tenderization of meat. Myofibrillar proteolysis
resulting from the intracellular calcium-dependent proteases, |i-calpain and m-calpain,
has been shown to enhance meat tenderness (Koohmaraie, 1992b; Huff-Lonergan et al.,
1996a). Thus, increasing muscle calcium antemortem might potentially activate the
calpains and improve beef tenderness.
Vitamin D3 plays a vital role in maintaining blood concentrations of calcium (Ca)
and phosphorus (P; Horst, 1986; Hurwitz, 1996). Early studies with VITD indicated that
supplementation as low as 1 x 10 lU/d increased blood Ca and P and decreased the
incidence of milk fever in dairy cows (Hibbs et al., 1946, 1951; Hibbs and Pounden,
1955).
Considerable attention has recently been paid to supplementing vitamin D3
antemortem to accelerate postmortem aging of meat. Swanek et al. (1999) and
Montgomery et al. (2000) reported VITD supplementation to steers at 5 x 10 and 7.5 x
10 lU/d improved beef longissimus tenderness. Thus. VLTD supplementation could act
as do other calcium-induced tenderization systems such as calcium chloride injection and
infusion (Koohmarie et al., 1988; Kerth et al.. 1995). Before vitamin D supplementation
ciui be implemented b\ the beef industry to improve tenderness, several issues, including
potential tissue residues and negative feedlot performance, require further investigation.
The objecti\es of the present studies were to determine the effects of the dose of vitamin
D3 and breed type of cattle on beef tenderness of a variety of muscles, on tissue residues,
and on feedlot performance b> beef steers. In addition, the effect of vitamin D
supplementation on the biochemical and biophysical regulation of calcium homeostasis
within muscle was determined.
CHAPTER II
REVIEW OF LITERATURE
Structure of Muscle
The details of muscle structure and function in the animal play a pivotal role in
determining the overall quality and palatability of meat. Knowledge of the structure of
muscle is essential to understand how differences in meat quality (e.g., tenderness) occur.
Muscle can be classified b\ control mechanisms (voluntary vs involuntary) or into three
type categories (striated, cardiac, and smooth). Both smooth and cardiac muscle are
involuntary muscle because their function is normally unconsciously controlled by the
animal. Both striated and cardiac muscle contain a banding pattern that is transverse with
the long axis of the muscle fiber when viewed under a microscope. Skeletal muscle is the
primary tissue that comprises consumed meat. Skeletal muscle is classified as a
voluntary striated muscle because skeletal muscle can generally be controlled by the free
will of the animal (Judge et al., 1989). Therefore, the remainder of this discussion will
focus on skeletal muscle.
Skeletal muscle organization is related in many ways to different types of
connective tissue. A muscle is surrounded by a thin layer of connective tissue known as
the epimysium. Within the muscle are a number of muscle bundles, each surrounded by
a layer of connective tissue, the perimysium. Each muscle bundle is made of many
muscle fibers. These muscle fibers are long, cylindrical in appearance, and
muhinucleated. The diameter of an individual muscle fiber can range from 10 to more

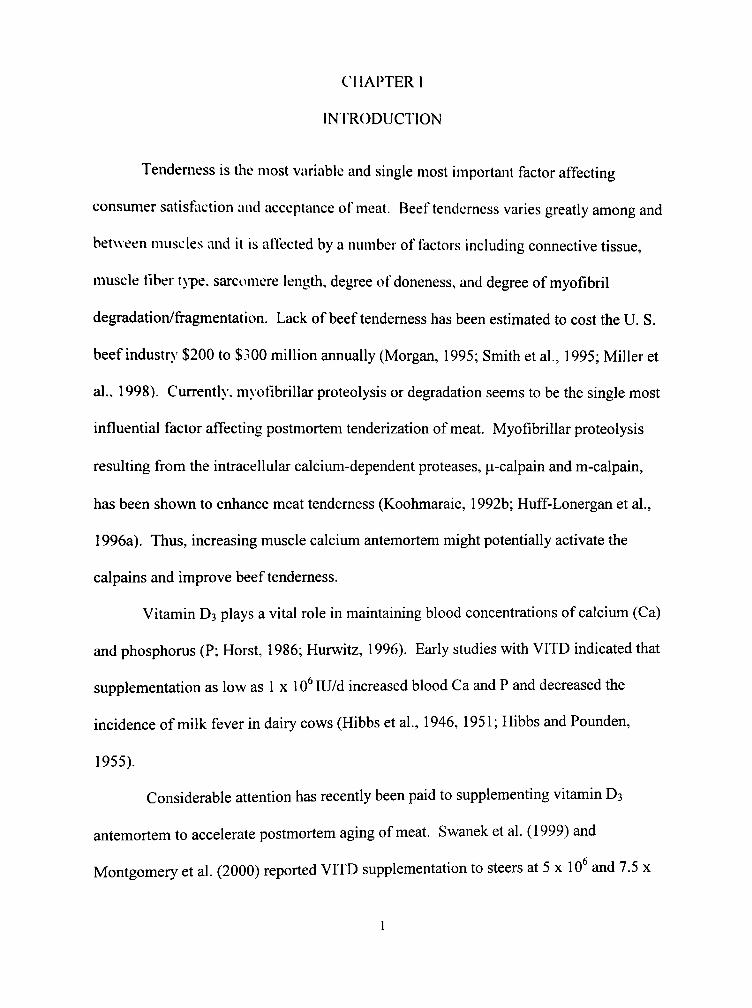
than 100 im (Judge et al.. 1989; see Figure 1). The outer cell membrane of the muscle
fiber is known as the sarcolemma, surrounded by the third layer of connective tissue, the
endomysium. All three forms of connective tissue found within muscle provide a
ft-amework for the organization for the entire structure of muscle (Cassens, 1987).
Muscle
M l s C I . F lU 'XDl . i ;
Ixi'i i 1 : I ; M • • ; ; ;
( ( : 1
MlJ.SCl.l'. FIHFH
I.))
H / A I - -..^
^ s.ircomire I MV()FIBR[L
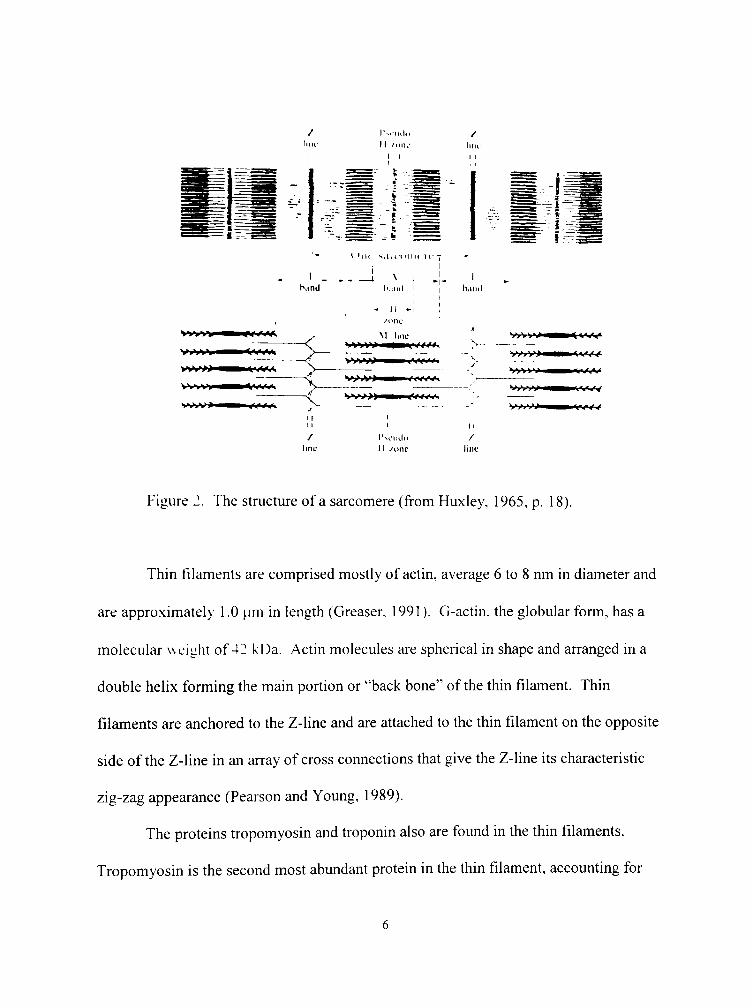
Figure 1. The structure of muscle (from Bloom and Facett, 1969, p. 273).
The functional unit of a muscle fiber is the myofibril. The myofibril is long,
cylindrical, I to 2 jam in diameter, and runs the entire length of the muscle fiber (Greaser,
1991). Within the muscle fiber is an array of thick and thin filaments aligned parallel and

o\ erlapping in specific areas, giving the muscle fiber its typical striated appearance
(Huxley, 1958; see Figure ID). The striation appears as light and dark bands under
polarized light. The light bands are termed I-bands for isotropic, and are comprised
mostl}' of thin filaments. The dark bands, known as the A-bands are anisotropic and are
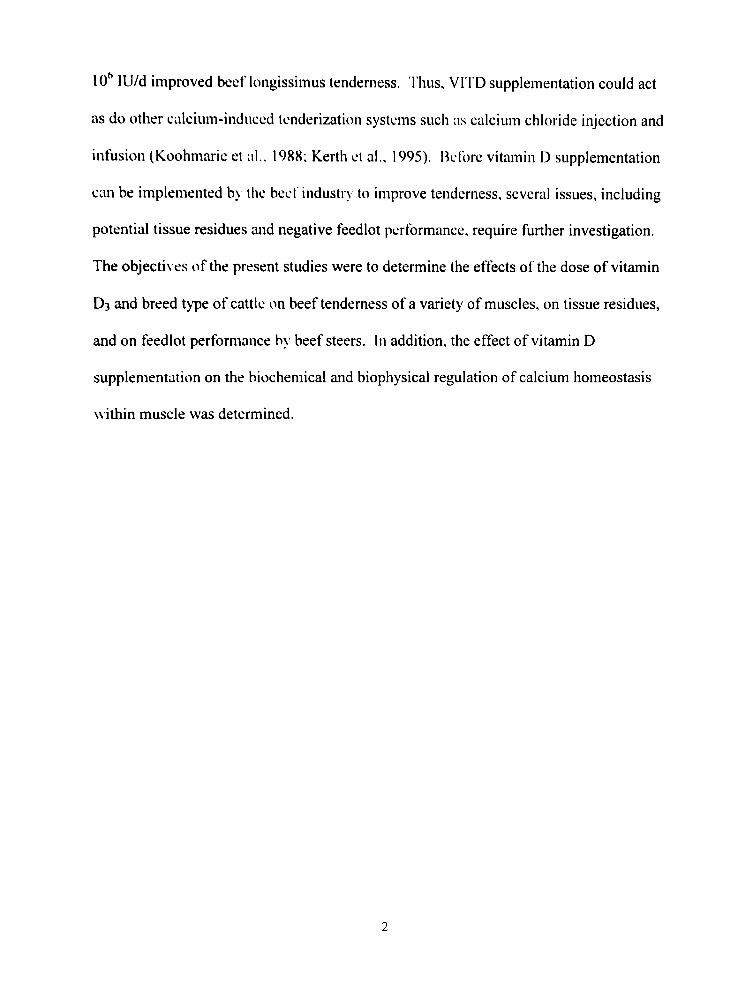
comprised mosth of thick filaments (McComas, 1996). Bisecting the 1-bands is a dark
band known as the Z-line. The region between two Z-lines of the transverse area of the
myofibril is referred to as a sarcomere. Thus, one sarcomere contains one A-band
between two half I-bands. In the center of the A-band is a lighter region known as the H-
zone (Huxley. 1965). The A-band is bisected by a narrow band known as the M-line. In
resting muscle the typical length of a sarcomere is between 2 and 3 im (Judge et al.,
1989; McComas, 1996; see Figure 2).
The two major filaments in muscle are commonly referred to as the thick and thin
filaments. Normal thick filaments of skeletal muscle are 14 to 16 nm in diameter and 1.5
|a.m in length (Greaser. 1991). Thick filaments are composed of approximately 300
myosin molecules. Myosin molecules are rod shaped (tail region) with a globular two-
headed region on one end. In the thick filament, myosin molecules are arranged in
bundles with the tail regions making up the main shaft of the thick filament. The myosin
filaments are arranged so that the heads are oriented toward the two distinct ends of the
thick filaments, leaving a bare zone in the middle of the thick filament. Other proteins
comprising the thick filament include C-protein, myomesin, creatine kinase, an 86
kilodahon (kDa) protein, X-protein, H-protein, and others in association with the thick
filament (Pearson and Young, 1989).
/ hiu-
VV».V»-
V > > y » ' ^
V»>»»^>«
V>.>.Vl»-
V i > » V » '
i^< '« ' .v;
M^*l'<««S
i^'aM.*.
•V'««<'«'«
I ' s . l l . l , .
II / n l U '
I I t
i
/ lirir
I . h.ind
11
/ l ine
M i l t S.l l i-( M l U ' l (•
--J ^ : . h.iii.l
- I I - I
M lino ||'i'i^'i> — I — m ' l ' i ' f f
I ' l ' l l , !^ ^ W t ' l l l ' i ' l -
' i ' j ' i V > — | m i I'lU'l'r'i
I ' s o i i i l o
11 /one
h.iiul
/ line
„—i -I
I
VV/V^"
Figure 2. The structure of a sarcomere (from Huxley, 1965, p. 18).
Thin filaments are comprised mostly of actin, average 6 to 8 nm in diameter and
are approximately 1.0 |.uii in length (Greaser. 1991). G-actin. the globular form, has a
molecular weight of 42 kDa. Actin molecules are spherical in shape and arranged in a
double helix forming the main portion or "back bone" of the thin filament. Thin
filaments are anchored to the Z-line and are attached to the thin filament on the opposite
side of the Z-line in an array of cross connections that give the Z-line its characteristic
zig-zag appearance (Pearson and Young, 1989).
The proteins tropomyosin and troponin also are found in the thin filaments.
Tropomyosin is the second most abundant protein in the thin filament, accounting for
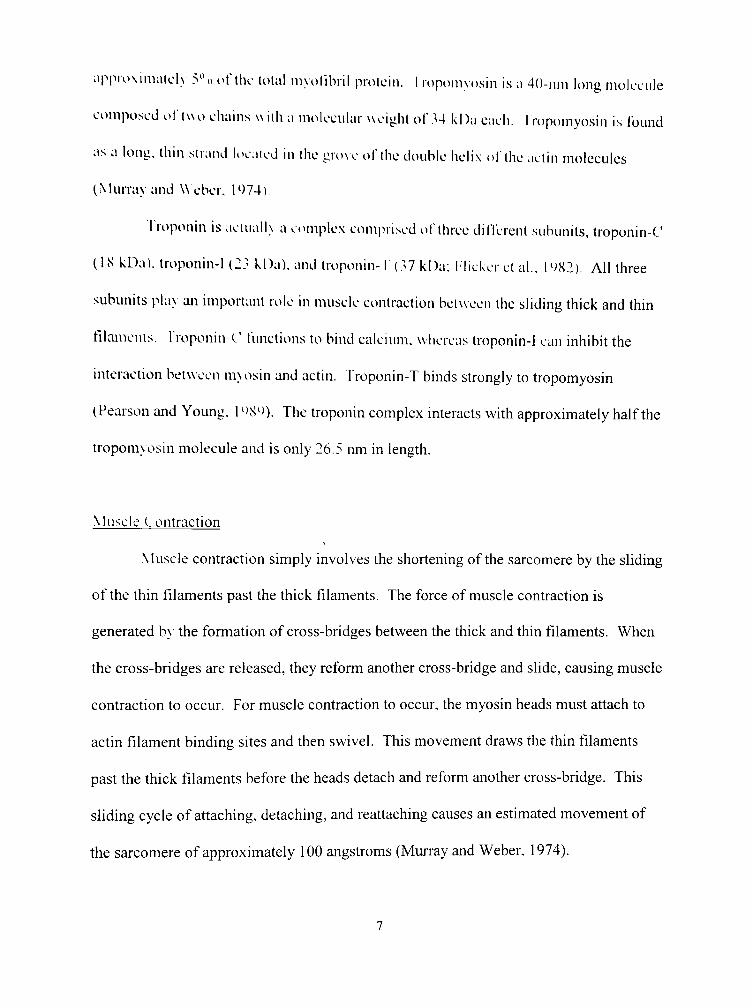
appro\imatel> 5",. of the total niyofibril protein. I roponiyosin is a 4()-nm long molecule
composed of two chains wilh a molecular \seight of 34 kDa each. Tropomyosin is found
as a long, thin strand locaied in ihe gro\e of the double helix olTlie actin molecules
(Murray and Weber. 1974).
Troponin is aciualK a complex comiirised of three dilTerenl subunits, troponin-C
(IS kDa). troponin-1 (23 kDa). and troponin- T (, 7 kDa; T'licker el al., 19X2). All three
subunits pla\ an important role in muscle contraction belween the sliding thick and thin
filaiiicnis. Troponin-C functions to bind calcium, whereas troponin-I can inhibit the
interaction between m>osin and actin. Troponin-T binds strongly to tropomyosin
(Peaison and Young, L)S' )). The troponin complex interacts with approximately half the
troponiNosin molecule and is only 26.5 nm in length.
•Muscle C ontraction
.Muscle contraction simply involves the shortening of the sarcomere by the sliding
of the thin filaments past the thick filaments. The force of muscle contraction is
generated b> the formation of cross-bridges between the thick and thin filaments. When
the cross-bridges are released, they reform another cross-bridge and slide, causing muscle
contraction to occur. For muscle contraction to occur, the myosin heads must attach to
actin filament binding sites and then swivel. This movement draws the thin filaments
past the thick filaments before the heads detach and reform another cross-bridge. This
sliding cycle of attaching, detaching, and reattaching causes an estimated movement of
the sarcomere of approximately 100 angstroms (Murray and Weber, 1974).
Regulation of muscle contraction is accomplished by the aclin-lroponin-
troponiNosm s\slem. the concentration of adenosinctriphosphate (ATP) and free calcium
(Ca -') and Mg in the mNofibril (McComas. 1996). In the relaxed state ofmu.scle. the
troponin complex binds the tropomviisin and holds it on the outer part of the actin helix.
This action prohibits the interaction of niNosin and act in. When the concentration of Ca "
is sufficiently high, the troponin complex binds [o the ( a" and releases the tropomyosin.
This activates the thick and thin filaments allowing for the Tormalion of cross-bridges and
muscle contraction.
Muscle contraction cannot occur without an energy source, provided by the
hydrohsis of .\TP into two lower energ> compounds, adenosinediphosphate (ADP) and
inorganic phosphate. This hydrolysis reaction takes place on the myosin head
(McComas, 1996). When .ATP binds to the myosin head h forms a myosin-ATP complex
that can bind to actin (.Murray and Weber, 1974). When the myosin-ATP complex binds
to actin, a power stroke and ATP hydrolysis occur simultaneously. The myosin head will
then bind Mg releasing .ADP. The newly formed myosin-actin complex (referred to as
the rigor complex) is maintained until ATP is again bound to the myosin head thereby
releasing it from actin (McComas, 1996).
Rigor Mortis and the Conversion of Muscle to Meat
At death, a complex series of physical and chemical events occurs in muscle,
which leads to the muscle entering a stiffened or rigid state. This rigid state is termed
"rigor mortis" (Latin: the stiffness of death). At death, the supply of blood to muscle is
terminated, resulting in mtmy inherent metabolic regulatory mechanisms to become
compromised. These metabolic changes result in a substantially different micro-
environment within the muscle cell. Within a few hours of death, muscle temperature
and pH drop, the abilit> of muscle cellular systems to maintain and control redox
conditions is terminated, energ> supply accumulations are diminished, and the relative
ionic strength is increased dramaticalh.
The stiffness and inextensible state of rigor mortis is a state that muscle fibers
enter after death as a result of a large drop in available ATP (Bate-Smith and Bendall,
1947. 1949; Bendall, 1951; Weber and Murray, 1973). This conversion fi-om a relaxed
state in which the thick and thin filaments slide past each other, into the rigor state in
w hich the two are rigidly interconnected by strong non-covalent interaction between actin
molecules of the thin filament and the heads of the myosin subunits of the thick filament
results from the drop in ATP that resolves the actomyosin bond (Weber and Murray,
1973). The depletion of ATP also leads to a change in the micro-environment. ATP
powers Ca"^ translocation by the Ca^^-ATPase pump of the sarcoplasmic reticulum and
drives Ca"", sodium, and potassium effluxes across the plasma membrane. Thus, once
muscle enters the state of rigor mortis the thick and thin filaments become permanently
bound, and the relative cytosolic strength of the muscle cell rises.
At death, ATP and creatine phosphate are present in muscle, and the pH ranges
from 6.7 to 7.2 (Judge et al., 1989). During normal metabolic processes in live muscle,
the supply of ATP is continually replenished by oxidative phosphorylation. When the
blood supply is terminated along with its supply of oxygen, muscle goes into an

anaerobic state, and the supply of ATP can be maintained for only a few hours. Eariy
postmortem, creatine phosphate supplies are used up to convert ADP to ATP. Thus, once
creatine phosphate reserves aie depleted, the muscle ATP levels also are exhausted.
Anaerobic gheoKsis in muscle results in the production of lactate from glycogen
reserNcs resulting in a drop of muscle pH. A few hours after death, muscle pH can drop
from 7.2 to 5.5 (Penny. 1980). Without a constant supply of ATP to assist in breaking
Uie actomjosin bond at the end of the crossbridge cycle, the two filaments become
irreversibly bound (Judge et al.. 1989).
There are a number of physical and chemical changes that result in the conversion
of muscle to meat. The events occurring during rigor development and resolution can
play an important role in the determination of meat tenderness. There is a slow loss of
extensibility or elasticit>' of muscle that has been termed the "delay phase of rigor mortis"
(Bate-Smith and Bendall, 1949). Stores of glycogen, ATP, and creatine phosphate are all
depleted, leading to the loss of muscle extensibility in the "rigor onset phase" that lasts
until the completion of rigor mortis. The completion of rigor mortis occurs when creatine
phosphate is used up. If muscle that has entered and completed rigor mortis is then
"aged" or held under refrigerated cooler aging conditions, the meat can attain increased
palatability and tenderness.
When muscle is held at one end, and the other end is attached to a sensing device,
isometric tension can be measured. The degree of tension or shortening can then be
measured when muscle enters rigor using a physiograph. Busch et al. (1967, 1968)
termed the period of increasing isometric tension as the onset of rigor mortis, whereas the
10
decrease in isometric tension was identified as the resolution of rigor. Busch et al. (1972)
showed that the de\elopment of postmortem isometric tension was strongly related to the
changes in muscle length that occur in postmortem muscle during rigor mortis
development.
Myofibrillar Proteins Possibly Involved in Tenderness
As previoush discussed, the two major working complexes of muscle are the
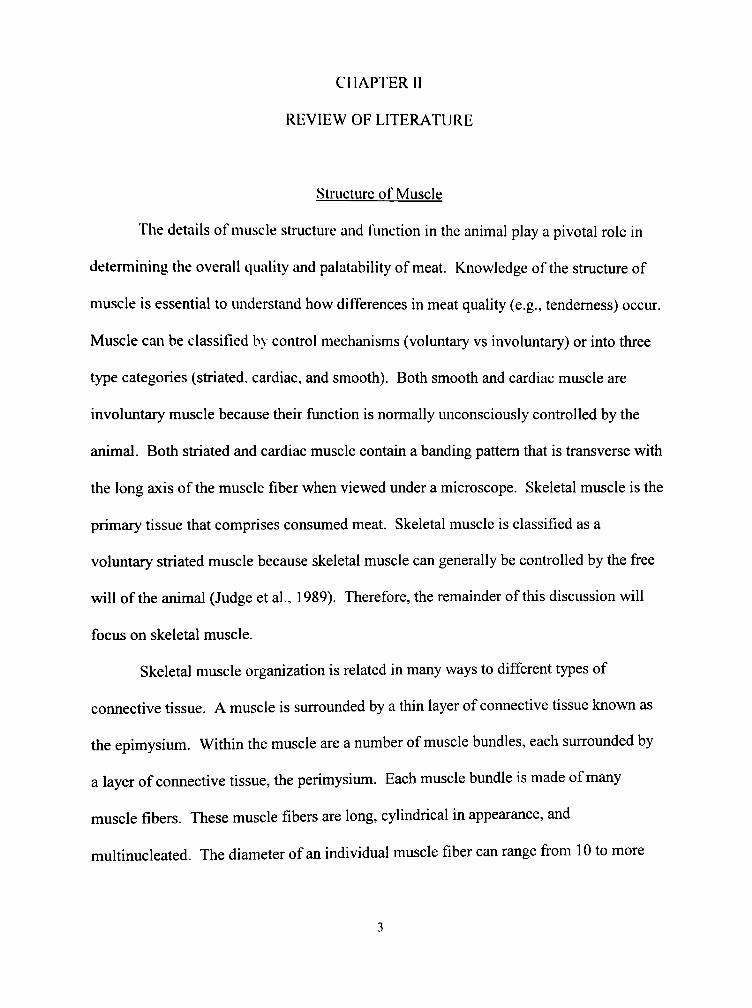
tliick and thin tilaments. .A third filament system, the intermediate filaments, serves the
purpose of anchoring, aligning, binding, and guiding proteins in the thick and thin
filaments to each other (see Figure 3). The intermediate filaments are all localized in part
at the Z-disks (Z-line) forming costameres, thus each transverse array of intermediate
filaments constitutes a costamere. The major myofibrillar and structural proteins in
muscle are myosin and actin. Myosin makes up approximately 45% of the cytoskeleton
and acun makes up approximately 20% (Robson et al., 1997). In normal and
conventionally postmortem aged meat, actin, myosin, and the coupled proteins
(actomyosin), that are not proteolytically degraded. Because actin and myosin are
typically not degraded, proteins should be of the intermediate filament class to be
implicated in actively playing a role in determining meat tenderness. Thus, disruption of
structural and cytoskeletal elements that maintain sarcomeric alignment and integrity
would then seem to aid in the disruption of the myofibril, and enhance meat tenderness.
Titin
Not only is titin the largest protein found in the myofibril, but titin is the largest
protein found in nature, with a molecular weight estimated to be 3,700 kDa (Robson,
1995). Titin was first discovered and purified by Wang et al. (1979). The term titin
literalK comes from the Greek word meaning anything of great size. Titin is the third
most abundant protein found in the myofibril (Trinick et al., 1984), making up 8 to 10%
of the total myofibrillar protein. Titin helps to form the third filament system within
myofibrils, keeps thick filaments in register, and regulates the length of the thick
filaments (Bennett and Gautel. 1996). Titin comprises part of the longitudinal structtires
in the myofibril and acts like a blueprint for the sarcomere, affecting the width and
structure of the Z-line (Gautel et al., 1996). Titin is unique in that it is the only protein
that is present throughout the entire length of the sarcomere. Titin extends from the M-
line to the Z-line (Furst et al., 1988, 1989); therefore, two fitin molecules extend the
entire length of the sarcomere. Although titin's length is over 1 im, and it has a diameter
of 4 to 5 nm (Furst et al., 1988).
Titin was previously noted as gap filaments by Locker and Leet (1975), S-
filaments by Huxley and Hanson (1954), connecting (connectin) filaments by Pringle
(1977), and super thin filaments by McNeill and Hoyle (1967). Native intact titin is
commonly referred to as Tl, and the major degradation product of titin is a 2,600 kDa
component that is referred to as T2 (Wang et al., 1991). Titin is thought to play a role in
the springiness of the sarcomere and aid in the ability to stretch. Itoh et al. (1988)
reported a small 1,200 kDa degradation product of titin, in the I-band actually that
12

originated from the Z-line and was very elastic in nature, whereas the T2 portion was not
elastic (Robson et al., 1991). In beef titin has proven to be very susceptible to
postmortem degradation during storage (Huff-Lonergan el al., 1995, 1996a,b). Because
of the importance, location, and roles of titin in muscle structure, it might very likely be
invohed in the dexelopment of tenderness.
Nebulin
Nebulin is anotlier extremely large protein found in skeletal muscle. It has a
molecular weight of 600 to 900 kDa (Jin and Wang, 1991), which varies based on muscle
and muscle type (Wang and Wright, 1988). Nebulin makes up 3 to 4% of the total
m>'ofibrillar protein (Wang. 1982). Nebulin was so named because it is located within
the N2 lines of a sarcomere, which are rather "nebulous" in their appearance (Wang,
1981). Specifically, the N2 lines are seen as dark lines that parallel the Z-lines and run
through the I-band (Locker and Leet, 1975), but are not seen in all electron micrographs
of muscle. Nebulin co-localizes with the thin filament of the skeletal muscle myofibril,
with the c-terminus at the Z-line end of the thin filament (Kruger et al., 1991; Wright et
al., 1993). Thus, nebulin acts to anchor the thin filament to the Z-line to its c-terminus
component. This linkage of the thin filament to the Z-line by nebulin is believed to be a
result of interactions between nebulin and a-actinin (Robson et al., 1991). Nebulin runs
along each of the two long F-actin groves of the thin filament providing increased
structural integrity of the thin filament just as fifin functions (Jin and Wang, 1991; Labeit
et al., 1991; Wang et al., 1996). Because nebulin has a role in anchoring the thin filament
13
to the /-line and possibi) acts to stabilize the thin tilament structure, nebulin might be
invohed in the development of tenderness in postmortem muscle.
Filamin
Filamin is a 5(iO kDa protein found in low concentrations in the myofibril (less
thiui 1%) that is localized at the periphei> of the Z-line and associates with the
intermediate fikuiient (Robson et al.. 1997; Price et al.. I')M4). Filamin functions to
cross-link F-actin filaments (Price et al.. \'M4) and aid in lateral register of the
s;u-comeie. Postmortem degradation o\' filamin could alter key linkages that hold
m\ofibrils in lateral register.
Desmin
Desmin is 53 kDa protein that is a member of the 10-nm diameter intermediate
filament group proteins (Robson et al., 1997). It is located in the periphery of the Z-line
( 'ag^Tl et al., 1990). Desmin encircles the Z-line, ensnaring and connecting adjacent
myofibrils b>- t\ing them together at the level of the Z-line (Robson et al., 1991;
Lazarides, 1982). By encircling myofibrils at the Z-line, desmin is believed to play a role
in maintaining the alignment of adjacent myofibrils. In both living muscle and in
postmortem muscle, the degradation of a structural element such as desmin that connects
major components of a cell and adjacent cells, might be important in determining the
overall organizafion of the muscle cell and possibly the tenderness of the meat.
14

Troponin T
Troponin T is a 37 kDa protein that is part of the muscular contraction regulatory
complex, troponin. Troponin T speciticall\ liinctions in the regulation of Ca''-induced
contraction of striated muscle in conjunction with troponin C and troponin I. Troponin T
was one ol the first myofibrillar proteins shown to he susceptible to postmortem
degradation (Olson et al.. 197(i). The major degradation products that have been
observed where, range in molecular weight from -3(),()(H) to 15,000 Daltons (Olson et al.,
l ): " ; Olson and Piu-rish. 1977; Ho et al., 1994; Negishi et al., 1996). Whether the
degradation of troponin T is a marker of postmortem proteolysis and (or) specifically
contributes to the postmortem improvement of tenderness remains unclear (Ho et al.,
19 )4; Huff-Lonergan et al., 1995. 1996a).
g-Actinin
a.-.Actinin is a 200 kDa protein that is composed of two similar subunits weighing
o
100 kDa each (Robson et al., 1981). Because of its dimensions of 4 b\' 50 A, it has been
suetiested a-actinin is a Z-line filament that cross-links actin filaments across the Z-lines
in the myofibrils of striated muscle (Suzuki et al., 1976: Fyrberg et al., 1990). Robson et
al. (1981) suggested that a-actinin might play a three-fold role in skeletal muscle by first
anchoring the thin filaments to the Z-line, then modifying the structure of actin in the thin
filaments. a-Actinin may also help to determine the directionality and regulate the
growth of the thin filaments.
15
Synemin
Synemin is a 230 kDa sarcomeric protein that is co-localized with desmin at the
periphery of the Z-line and functions to link myofibrils together with desmin (Granger
and Lazarides, 1979, 1980; Robson et al., 1991). Synemin has been shown to be
proteolytically labile (Bellin et al., 1996), and it has a role in cross-linking the
intermediate filaments to other components of the cytoskeleton and linking the Z-lines of
adjacent m>ofibrils (Bellin et al., 1999). As with desmin and other proteins, because
s>Tiemin is located near the Z-line and is degradable, it might play a possible role in
postmortem tenderization.
Vinculin
Viniculin is a myofibrillar protein that plays a dynamic role in the assembly of the
actin cytoskeleton (Bakolitsa et al., 1999). Viniculin is a 130 kDa protein that has been
suggested to indirectly link peripheral myofibrils to the costameres that are found at the
sarcolemma (Johnson and Craig, 1995). Viniculin may also play a role in linking actin to
the cell membrane (Geiger, 1979). Thus, any degradation of vinculin might affect muscle
cell integrity by disrupting linkages of the peripheral myofibrils to the cell membrane.
16

A muscle sarcomere
Z-fine Thick ff/oment Thin ni^ment \ >W-/OTe
t roponin.. Z-line
B Plasmaleinma
Z-lines
Z-disc
Cytoskeletal filaments (.AJpha Actinin, Vinculin)
Myofibrils
Intermediate filaments
(Desmin, Paranemin, Synemin,
Filamin, Zeugmatin)
Figure 3. Location of the myofibrillar and intermediate filament proteins within the myofibril. (A) Arrangement of the thick, thin, and intermediate filaments within a sarcomere. (B) Scheme for the tethering of the Z-discs by the intermediate filaments (adapted fi-om Lazarides and Capetanaki, 1986, p. 756).
17
/eumnatin
Zeugmatin is a 600 kDa protein that currently is thought to be at the outer edge of
the /-line. Turnacioglu el al. (1997) showed that /eugmatin is part oT/-line region
where titin connects inlt> the /-disks, /eugmatin might play a role in postmortem
tenderi/alion because of its potential location, and it seems \ciy susceptible to proteolysis
(Pearson and Young. 19S9).
Paranemin
Paranemin is a 17S kDa protein found with desmin in the developing muscle cell,
and along with the desmin intermediate filaments at the Z-line periphery of mature
striated muscle myofibrils (Hemken et al., 1996, 1997). Paranemin may contribute to the
o\erall muscle cell integrit\ and organization by linking desmin intermediate filaments to
other structures such as the m\ ofibrillar Z-lines and costameres, along the cell membrane
skeleton (Bellin et al., 1997; Robson et al., 1997; Hemken et al., 1997).
Postmortem Aging
Postmortem aging is a process where meat, primarily beef is held for periods of
time after slaughter and fabrication to improve tenderness. There are a number of ways
to "age" meat. Historically beef was first "dry aged," a process where the entire carcass
was held for a very extended time and then fabricated. Today, beef is postmortem aged
or aged using a wet aging process. Carcasses are fabricated into wholesale cuts and
distributed through a number of meat marketing avenues. Typically when beef is
fabricated within the U. S., the wholesale cuts are vacuum packaged in polymer
anaerobic packaging. Thus, beef is allowed to postmortem age within its packaging
during the time it is being distributed. Retailers then can continue to "age" meat by
storing it within its package for extended periods of time at refrigerated temperatures.
One of the largest effects of postmortem aging is a fairly consistent improvement in
tenderness. Because of the improved beef tenderness, a number of researchers have
raised quesfions as to how to optimize postmortem aging. Times of 9 d (Paul et al., 1944)
up to 20 d (Jennings et al., 1978) have been suggested to opfimize the effect of
postmortem aging on beef tenderness. In reality, it is difficuU to optimize the effect of
aging because there are a number of variables that affect postmortem aging. One of the
important factors affecting aging is storage temperature. Davey and Graafhuis (1976)
noted that as storage temperature increased to 60°C postmortem aging and tenderness
development were accelerated.
Structural Changes
A number of structural changes occur within the myofibril and muscle when meat
is postmortem aged. Paul et al. (1944) first noted structural changes in muscle when
structures called "fiber striations" became more fi-agile as postmortem aging increased.
The striations also gradually became lost over large areas when postmortem aging was
extended. These structural changes in the muscle also coincided with improvements in
tenderness as measured both mechanically and by sensory methods (Paul et al., 1944).
19
Phase contrast and electron microscopy studies have shown that myofibrils aged
for 7 d contained a niunber of myofibrils that were out of register and not as defined in
structure as unaged myofibrils (Schmidt and Parrish, 1971). Myofibrils also lost some of
their integrity and shrank. Further electron microscopy studies of aged meat indicated
there were no changes in the M-lines or in the thick and thin filaments of aged meat
(Schmidt and PaiTish, 1971). Postmortem aging also increased fragmentation at or near
the Z-lines and was related to improved tenderness (Parrish et al., 1973).
Several studies have indicated a number of Z-line structural changes occur
because of postmortem aging. In a high-temperature aging study, lengthening of the A-
band and shortening of tlie I-bands and disappearance of the Z-line was noted by Davey
and Gilbert (1967). Other studies have shown the disappearance of the Z-lines and (or)
weakening of the interaction between the Z-lines and the thin filaments, as well as
weakening of lateral attachments that hold the myofibrils in place within muscle (Stromer
et al., 1967; Davey and Gilbert, 1969; Davey and Dickson, 1970). Fractures also can
occur in the A-I junction (Davey and Dickson, 1970; Locker and Wild, 1984; Ouali,
1990) and in the N2 lines (Ouali, 1990) as a result of postmortem aging. In samples
without Z-lines, the myofibrils still retained some of their inherent integrity, indicating
that some structural entities still remained in their original structure (Davey and Gilbert,
1969). Other studies have shown that fragmentation at the interface between the I-band
and the Z-line occurs more often in tender than in tough meat (Gann and Merkel, 1978).
20
Myofibril Fragmentation
Because of tlie breakage that occurs in the myofibril of aged meat, a greater
number of myofibrillar fragments have been routinely reported in aged than in unaged
meat. A method for determining the amount of fragmentation that has occurred in the
m>'ofibril at or near the Z-line, involves measuring the change in turbidity at 540 nm.
This procedure is known as the myofibril fragmentafion index (MFI). As the length of
postmortem aging is increased, so does the turbidity of samples because of the increased
presence of myofibril fragments (Olson et al., 1976; Culler et al., 1978). MacBride and
Parrish (1977) suggested that the term "myofibril fragmentation tenderness" be used to
describe postmortem aging improvements in tenderness caused by increased
fragmentation. Their suggestion is further substantiated because as the degree of
fragmentation increases, so does the tenderness of cooked meat (correlation coefficient
between MFI and sensory panel evaluated-tendemess = 0.75, and between MFI and
Warner-Bratzler shear = -0.72; Culler et al., 1978). Therefore, MFI is a procedure that is
a accurate predictor of the Z-line fragmentation of raw meat and the tenderness of cooked
meat.
Heat-Induced Changes
Heat is noted for changing the flavor, intensity, and texture of meat. One of the
largest effects of heating or cooking meat is protein coagulation. At 70°C, Schmidt and
Parrish (1971) reported severe disrupfion of the thin filaments and coagulation of the
thick filaments. SDS-Page techniques have shown that cooking of meat is associated
21
with the degradation of titin (King et al., 1981, 1984; Locker and Wild, 1984). Fritz et al.
(1992) utilized Western blotting techniques and showed that titin was degraded in cooked
meat. As cooking time was increased, the titin degradation also increased. These studies
illustrate that the sU-uctural changes that occur in postmortem muscle are highly specific.
In order to gain an understanding of the processes that take place during postmortem
aging, one first must have an understanding of what structural elements or proteins are
altered to allow the gross changes in the characteristics of meat to occur.
Postmortem Degradation of Specific Myofibrillar Proteins
Titin
The degradation of titin within postmortem muscle has been shown by several
researchers (Lusby et al., 1983; Anderson and Parrish, 1989; Taylor et al., 1995a; Huff-
Lonergan et al., 1995, 1996a,b). The first major degradation product of titin that was
described was termed T2. T2 migrates with the intact form of titin (Ti) causing the
appearance of a doublet on SDS-Page gels. T2 is thought to originate from the C-terminal
end of the titin molecule and extend from the m-line to past the A-I junction. T2 was
estimated to be 0.9 [im in length (Nave et al., 1989; Suzuki et al., 1994). The second and
large degradation product of titin has been shown to exist at a molecular weight of
1,200,000 Da and is therefore referred to as the 1,200 kDa polypeptide (Matsuura et al.,
1991). This degradation product was found to exist in the I-band and originated from the
Z-line end (n-terminus) of the titin molecule (Itoh et al., 1988; Tanabe et al., 1994). The
fragment has been estimated to be 0.34 to 0.36 im in length (Tanabe et al., 1994; Suzuki
22

et al., 1994). Together, the 1': and l,2()()-kl)a pol>peptide have been thought to make up
almost the enliret\ of the titin molecule (Tanabe el al., I')'M).
Titin degradation has been shown to lenect dillcrcnces in meat tenderness.
Patterson and Parrish (l')S(i) slu>\\ed T) and T- bands arc Tound in tough rhombiodeus
muscle, whereas onl> T: is found in tender inliaspinatiis muscle. Man\ factors can alTect
the postmortem degradation of titin. Orcutt and DuTson (l')S.S) showed that as pTl was
lowered the amount of gap filament (titin) degradation also was decreased. Titin is one
of the most proteohticalh susceptible niN ofibrillar proteins, and undergoes a high degree
of degradation during postmortem aging (Lusby et al.. 1983; Taylor et al., 1995a; Robson
et al.. 1997). Because the rate of degradation of intact titin is strongly related to
tenderness, tender beef samples will have a significant amount of titin degradation at 1 d
postmortem, and nearh complete degradation by 3 d postmortem (Huff-Lonergan et al.,
1996a). In tougher beef samples, the rate of T2 production is slower, but there is still
significant degradation of titin by 3 d postmortem (Huff-Lonergan et al.. 1996a).
Nebulin
Several researchers have shown that nebulin is rapidly degraded in postmortem
aged meat (Patterson and Parrish, 1987; Anderson and Parrish, 1989; Huff-Lonergan et
al., 1995, 1996a,b; Taylor et al., 1995a). Degradation of nebulin could be important in
the development of postmortem tenderization because of the location of nebulin within
the myofibril and its interaction with titin. Degradation of nebulin could weaken thin
filament linkages at the Z-line. Nebulin also has been shown to be capable of linking
23

actin and nnosin (Root and Wang, 1994). Therefore, nebulin degradation could disrupt
alignment of the thick and thin filament and help explain in part, the resolution of rigor
and tenderness development.
Filamin
Filamin might possibh exert an influence on tenderness development through its
association w itli the intermediate filament system. Again, postmortem aging degradation
could disrupt ke> linkages connecting peripheral myofibrils to the sarcolemma.
Degradation of filamin could change interactions between peripheral Z-disks and the
sarcolemma \ia the intermediate filament system. Calcium chloride injection of meat has
been shown to increase the degradation of filamin (Uytterhaegen et al., 1994). Filamin
has been shown to degrade much more slowly than titin or nebulin in postmortem aged
beef samples (Huff-Lonergan et al., 1996a), but filamin degradation still correlates
moderateh to beef tenderness when tender and tough samples are compared.
Desmin
Desmin is another intermediate filament protein that has been shown to be
degraded in postmortem aged meat (Young et al., 1980; Robson et al., 1981, 1984;
Koohmaraie et al., 1984a,b; Whipple and Koohmaraie, 1991). As with filamin, the rate
of postmortem degradation of desmin is much slower than that of titin or nebulin (Huff-
Lonergan et al., 1996a; Ho et al., 1996). Because the proposed location of desmin is
around the periphery of the Z-line, it may play a possible role in connecting adjacent
24

myofibrils and could help maintain the lateral register and connect myofibrils to other
cellular sti-uctiu-es, including the sarcolemma (Yagyu et al., 1990; Robson et al., 1991).
Thus, degradation of a structural element that connects major components of a cell
together, as well as to the cell membrane, could affect the development of tenderness.
Troponin-T and Uie 30.000 Dalton Component
The existence of a polypeptide in muscle extracts from postmortem aged muscle
that appeared in SDS-pohacrylamide (SDS PAGE) gels at 30 kDa has been known for a
number of years. Dabrowska et al. (1973) was the first to observe that the appearance of
a 30 kDa component coincided with a decrease of troponin-T. The same degradation
product could be manufactured in digests of troponin-T or myofibrils with trypsin. The
existence of the 30 kDa component in chicken myofibrils was first noted by Hay et al.
(1973). This degradation product was observed to increase in intensity as postmortem
aging time increased (Samejima and Wolfe, 1976). The 30 kDa component has been
shown to exist as early as 24 h postmortem (Penny, 1974) in beef, and to exist in purified
beef troponin-T incubated with a newly discovered protease (at the time) calcium
activated factor (CAF; m-calpain; Olson et al., 1977).
Since the mid-1970's a number of reports have demonstrated that the appearance
of the 30 kDa component corresponds with a decrease in the intensity of troponin-T as
postmortem aging time increases (Olson et. al., 1977; Koohmaraie et al., 1984a,b; Ho et
al., 1994; Negishi et al., 1996). However, it has not been proven whether the 30 kDa
component is a band composed entirely or partially of polypeptides of troponin-T
25
degradation. Olson and Parrish (1977) found that the intensity of the 30 kDa component
and degradation of tioponin- T coi related to W'arner-Biat/ler shear force values (an
objectixe estimate of meat tenderness) as well as senson tenderness .scores. MacBride
and Parrish (1977) similarl>' found that bo\ine longissimus samples that were
significimtly more tender alter 1 d i>f .storage at 2"(' exhibited the presence of the 30 kDa
band, whereas steaks designated as tough did not ha\e the 30 kDa component at I d
postmortem.
Subsequently, it has been shown that the loss of troponin-T is very highly related
to beef tenderness; howe\er. the exact contribution of the 30 kDa component to
tenderness is not fully understood. The 30 kDa band appearance might be a simple
indication of o\eraIl proteohsis. It is further possible that troponin-T degradation could
pla> a role in maintaining the integrity of the thin filament. Thus, the loss of the integrity
of troponin-T could also accelerate the overall disruption of the myofibril in the I-band.
g-Actinin. S\'nemin. \'inculin. Zeugmatin. and Paranemin
When myofibrils are digested with purified calpains (calcium-activated enzyme
proteases), a-actinin is released in an undegraded form (Goll et al., 1991). Because a-
actinin plays a role in anchoring the thin filaments to the Z-line, the release of a-actinin
in postmortem muscle may improve tenderness. Synemin, vinculin, and paranemin all
have been shown to be proteolytically degraded by the calpains (Hemken et al., 1997;
Robson et al., 1997; Bellin et al., 1999). Pearson and Young (1989) also showed that
zeugmatin is susceptible to proteolysis. Taylor et al. (1995a) showed degradation of
26
costameres and their connections greatly improved tenderness. Because viniculin links
the myofibril to the costameres, viniculin degradation could potentially help explain the
differences in tenderness noted by Taylor et al. (1995a). Although the exact nature of
degradation of the aforementioned proteins might not be fully understood, they all may
have some importance leading in postmortem tenderization of meat because of their
specific location and function w ithin the myofibril.
Enzyme Systems in Muscle and Meat
Protein turnover is a characteristic of the living muscle cell, and the balance
between protein syntiiesis and degradation rates, determines the overall level of protein
within tiie cell. Proteins are continuously degraded to delete damaged proteins that are
no longer biologically active. New proteins are then synthesized to replace damaged
proteins. Cells also synthesize new proteins through gene activation to enable cells to
respond to changing environmental conditions. Thus, degradation mechanisms fimction
to remove denatured or unactive/active proteins and to facilitate adaptive responses by
destroying native proteins that are no longer needed by the cell (Mykles, 1998).
Enzymes in the form of proteases are now recognized to play a vital role in
confrolling intracellular proteins through selective degradation as well as through bulk
degradation. Both types of proteolysis are highly regulated and typically controlled by
extracellular signals. In living and growing muscle there are three major protease
families, including lysosomal enzymes, the proteasome, and calcium-dependent proteases
(CDPs). The lysosomal enzymes are a family of proteins contained within the lysosome
27

imd are composed mainly of different cathepsin enzymes. The proteasome and ubiquitin-
conjugated system and the CDPs are the two cytosolic proteolytic systems responsible for
myofibrillar protein degradation.
Cathepsins
The catiiepsins are a wide family of lysosomal proteinases, in which the most
commonly studied catheptic enzymes in muscle tissue include cathepsins B, C, D, and L.
Most of the cathepsins ha\ e an acidic pH optimum, indicating a potential role in
posmiortem tenderization. Catiiepsins B and C have been shown to degrade both actin
and myosin (Bandman. 1987). Cathepsin L has been shown to degrade actin, myosin, a-
actinin, troponin, and tropomyosin (Okitani et al., 1980).
Cathepsin D is a lysosomal protease that is present in muscle, and organs such as
liver and spleen (Robbins et al., 1979; Okitani et al., 1981). Robbins et al. (1979)
reported that the incubation of myofibrils with a cathepsin D extract resulted in the
disruption of the Z-line to the point of almost total degradation by 1 h of incubation.
Okitani et al. (1981) and Zeece et al. (1986) both suggested that cathepsin D, with its
peak activity at a pH range of 3.0 to 4.5, probably does not play an important role in
postmortem proteolysis.
Cathepsin B is characterized as an enzyme that is inhibited by the presence of
heavy metals (Penny, 1980). Again, the pH optimum of both cathepsins B and D seems
to be outside of the normal pH range of postmortem muscle, although cathepsin B
28
activity is typically higher than cathepsin D activity in postmortem muscle (Schwartz and
Bird, 1977).
Matsukura et al. (1981) reported that cathepsin L degraded actin, myosin, a-
actinin, troponin-T. and troponin-I. They also found the most intense degradation
occurred around the pH of 4.8. From their data, they suggested that cathepsin L might
play a role in actin and m\osin degradation in living muscle tissue. They further
suggested that cathepsin L may contiibute to the tenderizing process that occurs during
postmortem degradation of troponin-T. Matsukura et al. (1984) examined electron
transmission micrographs of myofibrils incubated with cathepsin L: They found that
degradation of the Z-line, with complete disappearance of the Z-line after only 4 h of
incubation with cathepsin L. From their results, they suggested that at a pH of 5.5,
cathepsin L might be the most important lysosomal enzyme in postmortem tenderization.
In order for any of the cathepsins to play a role in postmortem tenderization, they
must first be released from the lysosome. An increase in temperature and (or) lowering
of pH will accelerate the reactions by most catheptic enzymes (Permy, 1980). Also,
catheptic enzymes typically have a pH optimum below the normal pH range of
postmortem muscle. Furthermore, lysosomal degradation in vitro exceeds postmortem
changes of muscle (Whipple and Koohmaraie, 1991).
Cystatins
Cystatins are a family of protease inhibitors that specifically inhibh cysteine
proteases such as cathepsins B, D, and L, as well as the calpains and papain (Barrett,
29
1987). There are three families of cystatins. Cystatin A and B are the only cystatins
located intracellularly and comprise family 1. The major component of family 2 is
cystatin 2, which is predominantly found extracellularly. The third family is also located
extracellularly and its main members are the glycoproteins, kininogens (Zeece et al.,
1992). In a study by Shackleford et al. (1991), an equation that combined calpastatin
activity, |.i-calpain acti\ it\. and 24-h cystatin activity accounted for 63% of the variation
in 14-d postmortem Warner-Bratzler shear force. This result and others that are similar,
have lead some researchers to speculate that cystatins may play a role in postmortem
tenderization (Zeece et al.. 1992).
Ubiquitin-Proteasome Pathway
It has been recently suggested that the bulk of all intracellular protein is degraded
through the ubiquitin-proteasome pathway (Rock et al., 1994). Proteins degraded by this
pathway are first tagged for degradation by the covalent attachment of ubiquitin
molecules. Ubiquitin is a 76 amino acid heat-stable polypeptide that is an essential
cofactor in the ATP-dependent degradation of actin and myosin (Lecker et al., 1999;
Ciechanover et al., 1978). Proteolysis is then carried out by the 26S proteasome complex
(also known as the multicatalytic proteasome; Goll, 1991) by degrading proteins into
small peptides (Kisselev et al., 1998). The 26S proteasome complex has three distinct
activities at three different pH ranges (Goll, 1991). The 26S proteasome also can degrade
myofibrillar proteins that both are, and are not associated with ubiquitin. This system is
30
imoKed with the degradation of both abnormal and normal proteins and is an ATP-
dependent pathwa>.
There are four overall major steps to the ubiquitin-proteasome pathway. The rir.st
step is an A TP-iequiring icaction in which ubiquitin is coniugaled, via a thioestcr bond,
to HI. a ubiquitin-acti\ating protein. In the second step the ubiquitin is then transferred
to a specific sulth>dryl group on one of numerous proteins named 1:2, a group of
ubiquitin-carrier proteins. In the third step, the activated ubiquitin is transferred to the
protein substrate by H3, the ubiquitin-protein ligase. In the final step, proteins marked for
degradation b>' ubiquitin are digested into small peptides within the 26S proteasome
particle. The rapid degradation of myotlbrillar proteins by the 26S proteasome particle
requires that a tagged substrate have at least five linked ubiquiting molecules before
catabalism (Pickart, 1997). The 26S proteasome also contains enzymes that release
ubiquitin molecules from the degrading substrates for reuse (Hadari et al., 1992; Kam et
al., 1997; Lecker et al.. 1999). This system is responsible for the turnover of both short
lived and long-lived proteins, that comprise the bulk of the living muscle cell (Rock et al.,
1994; Mitch and Goldberg. 1996).
The general belief that the ubiquitin-proteasome pathway plays a vital role in
muscle protein turnover, has changed from disagreement and hypothesis to a greater
understanding of this pathway in the last 20 years (Goll et al.. 1989; Goll, 1991; Lecker et
al.. 1999). Although the ubiquitin-proteasome pathway apparently has a critical role in
proteolysis of live muscle, it has little to no activity in degrading proteins in postmortem
muscle. Research with postmortem skeletal muscle has shown that the 26S proteasome
31
had little to no effect on degrading myofibrillar proteins, presumable because of the lack
of available ATP and the function of ubiquitin in postmortem muscle (Koohmaraie,
1992a).
Calpains and Calpastatin
The understanding of the link between Ca and myofibrillar proteolysis has
spanned tlie last tiiree decades. Busch et al. (1972) and Penny (1974) showed that
incubating muscle strips w iUi a Ca' ^-containg solution caused complete Z-line removal,
but no otiier ultrastiuctural changes were noted. This eventually led to the discovery of
the calpain family. The calpain family is a multi-component system composed of several
isoforms of the enzyme, calpain, and an endogenous inhibitor of the enzyme, named
calpastatin. Historically. CAF, a Ca^^-dependent proteolytic enzyme, was initially
purified in 1976 (Dayton et al., 1976a). Characterization and further purification of CAF
led to the identification of the inhibitor, calpastatin, of the Ca^"^-dependent proteolytic
activity (Dayton et al., 1976b). Several years later, a second Ca^"^-dependent protease
was identified and purified (Mellgren, 1980; Dayton et al., 1981). The two Ca " -
dependent proteolytic active proteases have been named m-calpain (originally CAF) and
H-calpain.
The calpains and calpastatin are ubiquitously distributed, being found in every
vertebrate cell type tested to date. The calpains are cysteine proteases that have an
absolute requirement for calcium to initiate full activity. The two most characterized
forms of the enzyme are |j.-calpain and m-calpain. Ahhough calpastatin and |j,-calpain
32

and m-calpain are ubiquitously distributed, they are exclusively intracellular. The Ca
requirement for |.i-calpain is between 5 and 65 iM of Ca'^ for half-maximal activity,
while the Ca requirement for m-calpain is between 300 and 1,000 [iM of Ca ^ for half-
maximal acti\'ity (Cong et al., 1989; Edmunds et al., 1991; Barrett et al., 1991). The Ca
requirement varies based on Uie substrate used. In general, the Ca requirements are
substantialh greater for m>ofibrillar proteins than for casein, an inexpensive and
commonh' used substrate.
Ultrastructuralh. incubation of myofibrils with the calpains results in a
degradation or loss of the N^-lines and the Z-disks. Typically, the calpains cleave
relatively few peptide bonds in each protein and leave large polypeptide fragments rather
than reducing the protein into small peptides and amino acids. This is an important
consequence when considering effects of calpains on protein turnover in the muscle cell.
Moreover, full degradation of myofibrillar proteins would involve the calpain system in
addition to the ubiquitin-proteasome system or lysosomal enzymes. The roles of the
calpains in vertebrate cells include: (1) activation of other enzymes, or at least alteration
of the regulation of these enzymes; (2) disassembly and (or) remodeling of the
cytoskeleton; and (3) cleavage of hormone receptors. In striated muscle, calpains have
been shown to rapidly cleave many of the myofibrillar proteins, including troponin-T,
desmin, vinculin, talin, spectrin, nebulin, and titin; whereas troponin I, filamin, C-protein,
dystrophin, tropomyosin, a-actinin, and m-protein are slowly degraded by calpains
(Zeece et al., 1986; Kimura et al., 1992). The calpains have little to no effect on
degrading actin or myosin (Goll et al., 1992).
33

Both |.i- and m-calpain exist as heterodimers composed of an 80 kDa and a 28
kDa subunit. The 28 k[)a subunit of both of the calpains is identical and contains four Ca
binding sites. The 80 kDa subunit is composed of four domains, referred to as Domains
1,11, 111, and IV. The acti\e site of the enzyme is thought to be located in Domain 11
(Suzuki, 1990). The C-terminal domain. Domain IV, has been called "calmodulin-like"
because it contains four consecutive helix-loop-helix structures (E-F-hand) that predict
Ca binding sites. As can be deduced from the above description, the calpains can be
predicted to ha\ e eight binding sites for Ca'*; however, based on the available evidence
the calpains do not seem to bind this amount of Ca^* Most studies to date seem to
indicate that )i-calpain binds two Ca atoms on the 80 kDa subunit, and two on the 28 kDa
subunit for a total of four Ca atoms per molecule (Minami et al., 1987; Zimmerman and
Schlaepfer, 1988). Although it has the same number of binding sites as |j,-calpain, m-
calpain binds as many as six Ca atoms.
In 1989 a third protease specific to skeletal muscle, calpain 3, sm-calpain or p94,
was discovered (Sorimachi et al., 1989). The overall activity and properties of calpain 3
in skeletal muscle are not currently known, but lack of the gene for calpain 3 is
responsible for limb-girdle muscular dystrophy type 2A (Sorimachi and Suzuki, 1992;
Sorimachi et al., 1997). The remainder of this discussion will include calpastatin, |a-
calpain, and m-calpain.
Both i^-calpain and m-calpain seem to be localized with the plasma membrane
and with subcellular organelles (Goll et al., 1992). Within muscle cells, the calpains are
localized with myofibrils, mitochondria, and nuclei. In skeletal muscle myofibrils, the
34

calpains are most denselv- located at the Z-line, and some calpain molecules can be
detected at the 1-baiid and the A-band, but the concentrations appear to be highest in the
Z-line region (Taylor et al.. 1995b). The endogenous inhibitor of the calpains,
calpastatin, seems to be co-localized with both |a-calpain, and m-calpain (Goll et al.,
1992).
In the earh 1980"s, it was noted that brief incubation of chicken skeletal muscle
m-calpain with Ca at 0°C decreased the amount of Ca required for half-maximal activity
of the enzNTiie. The lowering of die Ca requirement was dramatic, from 400 | M Ca^*
required for half maximal activity before incubation with 0.5 mM Ca^* to only 30 )j,M
Ca"* required for half maximal activity (Suzuki et al., 1981). This phenomenon was
accompanied by a reduction in mass of both subunits of the enzyme (Suzuki et al., 1981).
Later studies with both \x- and m-calpain have shown that limited autolysis decreased the
amount of Ca required for half-maximal activity of m-calpain from 200 to 1,000 iM to
50 to 150 \iM concentrations. The Ca requirement for half-maximal activity of |i-calpain
is decreased from 3 to 50 |iM before autolysis to 0.6 to 0.8 j M after autolysis. The
specific activities of both enzymes are largely left unchanged (Edmunds et al., 1991).
The mass of the 80 kDa subunit of m-calpain is reduced to 78 kDa and the 28 kDa
subunit is decreased to 18 kDa. The mass of the 80 kDa subunit of |ii-calpain is reduced
to 76 kDa and the mass of the 28 kDa subunit mass is reduced to 18 kDa as in m-calpain
(Cong et al., 1989; Suzuki, 1990; Edmunds et al., 1991).
The physiological significance of this autolysis is not clear. In most cases, the
amount of Ca "" required to initiate autolysis is higher than the concentration of Ca -2+
35

required for proteolytic activity. For example, |.i-calpain for bovine skeletal muscle has
been shown to require 40 to 50 ).iM Ca'' for half maximal activity for proteolysis,
whereas 190 to 210 }.iM Ca"" is required to initiate autolysis. The differences in Ca
requirements for proteol> tic activity and autolysis for m-calpain are considerably less.
The protease m-calpain from bovine skeletal muscle requires 700 to 740 [iM Ca^* for a
half maximal rate of hydrolysis of casein and requires 740 to 780 j M Ca " for autolysis
(Cong et al.. 1989). As stated earlier, the physiological significance of autolysis is as of
> et unclear.
The calpains seem to ha\e a pH optimum that is near pH 7.5 with, a decrease in
activity below pH 6.5 and above pH 8.0 (Dayton et al., 1976a,b). The temperature
optimum for the calpains appears to be between 25°C and 30°C in the presence of excess
Ca (Dayton et al.. 1976a,b), and the activity declines rapidly at temperatures higher than
30°C. Few studies have been published describing the effects of ionic strength on the
activity of calpain. At pH 7.5 m-calpain activity is decreased by an increase in ionic
strength (Tan et al., 1988; Wang and Jiang, 1991). When at a pH 7.0, m-calpain activity
increases with an increase with an increase in ionic strength (Kendall et al., 1993). Thus,
the overall affect of ionic strength on calpain activity is not fully understood.
Calpastatin
The endogenous inhibitor of the calpain enzymes is knovm as calpastatin.
Calpastatin is a multi-headed protein inhibitor that inhibits only the calpains. Calpastatin
is expressed in several different isoforms that have one, three, or four inhibitory domains
36
luid different N-terminal sequences (Goll et al.. 1998). Calpastatin competitively inhibits
the calpains (Maki et al., 1988). Although calpastatin it.self has not been shown to bind
Ca, Ca is required to allow calpastatin to bind to the calpains (Kapprell and Goll, 1989;
Maki et al., 1990). The amount of Ca'* required to allow half-maximal binding of
calpastatin to calpains is generally lower than that required for half-maximal activity of
the unautoh zed and autolyzed forms of m-calpain and for half-maximal activity of
autolyzed |.i-calpain. Thus, the physiological effect of calpastatin and the interactions of
the calpains and calpastatin are not fully understood. It has been hypothesized that
unautolyzed |i-calpain might not be affected by the presence of calpastatin and could
possibly be acti\e.
The Calpain Filmilv in Postmortem Muscle
The enzymes \i- and m-calpain have been shown to retain at least partial activity
in postmortem muscle (Olson et al., 1977; Koohmaraie et al., 1986, 1987; Zeece et al.,
1986). The enzyme ^-calpain has been shown to be capable of partially removing the Z-
disks in postmortem aged muscle (Koohmaraie et al., 1986). Studies that have focused
on the fate of the major components of the calpain system (|i- and m-calpain and
calpastatin) in postmortem tissue have shown that although the activity of m-calpain
tends to remain constant over a 14-d postmortem aging period, the activities of ^-calpain
and the inhibitor decreases rapidly within the first 24 h postmortem (Koohmaraie et al.,
1987;Boehmetal., 1998).
37
The rate and decrease in calpastatin activity is variable and has been shown to be
related to the tenderness of beef as it is aged (Whipple et al., 1990). Yet it has been
shown tiiat cells contain enough calpastatin to completely inhibit all the calpain present
(Murachi, 1984). An additional complication arises when one considers the fact that, in
most cases, the calpains require less calcium for Uie binding of calpastatin than for
activity. Clearly, die relationship between the calpains and calpastatin in muscle cells
and postmortem tissue must be furUier investigated in order to elucidate the regulatory
mechanism of calpastatin in muscle and results in meat tenderness.
Calcium Metabolism in the Muscle Cell
Calcium functions to control a variety of cellular processes, including muscle
contraction, secretion, cell growth, cell differentiation, neural excitability, and it
functions as a second messenger regulating a variety of cellular metabolism functions.
The maintenance of a low free Ca^* concentration is vital to the correct functioning and
survival of the muscle cell. Calcium concentrations within the myofibril at rest are
approximately 10"' M, and 10" to 10" M during contraction (Greaser, 1977; Konishi,
1998). The extracellular concentration of Ca^* is approximately 10" M, allowing for a
sfrong tendency for Ca ions to enter the fibers through simple diffusion. The muscle cells
have a number of regulatory units to maintain such a low intracellular concentration of
Ca^*. At the plasma membrane (sarcolemma), the level of intracellular Ca' * is affected
by Ca^* charmels, Ca^*-ATPases or Ca pumps, the NaVCa^* exchangers, and the Ca^*
sensing receptor.
38
The intracellular Ca'* concentration is further ariected by Tiber type. Slow twitch
oxidative fibers ( Type 1) are iinolved in sustained, contractile exenls and maintain
intracellular Ca"* concentrations at relati\el> high levels (100 to 300 nM). In contrast,
fast twitch ghcoNtic fibers ( T\pe lib) are used for sudden bursts ol contraction and are
chai-acterized b\ bricL high-amplitude Ca"' transient and lower ambient Ca^*
concentrations (< 50 nM; Olson and W illiams, 2()()()). These properties olskeletal
muscle fibers depend on the pattern ol inotor nerve stimulation, such that tonic motor
neuron acti\ il> promotes the slow fiber phenot> pe, whereas infrequent motor neuron
acti\ity results in fast fibers.
Calcium pumps in the plasma membrane compensate the influx of Ca^* along a
steep electrochemical gradient, therebv allowing the cells to maintain a steady state with
respect to Ca"* content (Raeymaekers and Wuytack, 1996). In muscle cells, two
transporters operate in parallel: the Ca"*-transport ATPase (Ca pump) and the Na*/Ca^*
exchanger. These tw o transporters also participate in returning the cell to the resting state
Ca " concentration (100 nM) at the end of muscle contraction. Thus, both function to
lower c>tosolic concentrations of Ca"* These pumps transport Ca"* from the cell
cvtoplasm into the sarcoplasmic reticulum or into the extracellular space. Although the
Ca pumps of the plasma membrane and sarcoplasmic reticulum both belong to a group of
P-type transport ATPases, they do sufficiently differ to categorize them into two distinct
gene families (Raeymaekers and Wuytack, 1996). The Ca pump functions by the binding
of calmodulin, a cytosolic calcium binding protein, and the hydrolysis of ATP (Carafoli
and Guerini, 1997). The calcium pump functions to transport only one Ca^* per ATP
39
hydrolyzed. The Na*/Ca-* exchanger also is located in the plasma membrane and on the
sarcoplasmic reticulum. The Na*/Ca"' exchanger is a reversible transporter that couples
the tianslocation of three Na' against 1 Ca"* (Gabellini et al., 2000). Thus, for every ATP
that is hydrolyzed, one Ca atom is removed from the cytosol and three sodium atoms are
translocated into the cvtosol b) the Na'/Ca"* exchanger.
The plasma and sarcoplasmic reticulum both contain an L-type Ca receptor (Ca
channel) that is electiostatically controlled. The Ca receptor transports Ca^* into the
cvotosol through conformational changes that result from Ca^* binding. Neural electrical
stimulation for muscle contraction results in a stimulation of intracellular Ca^*
concentrations b\' two orders of magnitude, as a partial result of Ca^*influx through this
high voltage-dependent Ca channel. The Ca channel contains three peptide subunits with
a molecular weight of 165, 55, and 32 kDa (Hofmann et al., 1988). The 165 kDa subunit
contains the Ca"* binding properties in skeletal muscle and has been observed to produce
a slow but long-lasting inward Ca^* current in most excitable cell types (Hofmann et al.,
1988; Franzini-Armstrong et al., 1998). Thus, the Ca receptor does not require ATP
hydrolysis and functions to increase cytosolic Ca^* concentrations. Opposing, the Ca *-
pump and Na*/Ca^* exchangers function to decrease cytosolic Ca^* concentrations.
9-1-
Recent research has shown that a number of cells contain a cell surface, Ca -sensing
receptor (Riccardi, 1999; Yarden et al., 2000). This Ca^*-sensing receptor fimctions to
sense increases in extracellular Ca^* concentrations and transports Ca^* into the cell. The
Ca^*-sensing receptor has been localized in the kidney, parathyroid, brain, stomach, and
pancreas, the physiological role and possible relevance of the receptor on Ca homeostasis
40
remains unclear (Riccardi, 1999). Whether or not the Ca^*-sensing receptor exists in
muscle is not presently known.
Muscle contraction is triggered by a cytosolic increase in Ca^* that is 100 to 1,000
times die resting concentrations (Perry, 1996). The storehouse for Ca in muscle is the
sarcoplasmic reticulum and connecting transverse tubule system (T-system). The
sarcoplasmic reticulum is a convoluted structure lying on the surface of the myofibrils
and bounded by a membrane. The sarcoplasmic reticulum functions to store and
transport Ca, and to release Ca into the sarcoplasm (Perry, 1996). The control
mechanism for die release of Ca from the stores of the T-system into the cytosol is the
ryanodine receptor. Three dimensional immunological labeling studies indicate the T-
system surrounds the myofibril, and the ryanodine receptor is located near the Z-line in
approximately 2 )im intervals (Airey et al., 1990; Shacklock et al., 1995). The location of
the rv'anodine receptor at the Z-line also is co-localized with the L-type Ca^* channels
(Shacklock et al.. 1995). Thus, the ryanodine receptor and Ca^* channel fiinction to
release Ca^* from the sarcoplasmic reticulum into the cytosol for muscle contraction,
while the Ca pump and Na*/Ca^* exchanger function to fill the sarcoplasmic reticulum
back with the excess cytosolic calcium.
A number of proteins in the myofibril function to bind Ca. Troponin C contains
four Ca binding sites and functions to mediate muscle contraction through a
conformational change that occurs with the binding of Ca (Herzberg et al., 1986).
Calmodulin is a ubiquitous Ca binding protein that functions to shuttle Ca^* to the Ca
pump for translocation to the extracellular space or into the T-system. The Ca-
41

calmodulin system functions to bind four atoms of Ca"' per calmodulin unit, and is
closely linked to the cAMP second messenger system in muscle (Michiel and Wang,
1984). Calbindin is a \ itamin D-dependent Ca binding protein that binds four atoms of
Ca and is found in muscle and other tissues. Paravalbumin is a Ca binding protein found
predominantly in Uie sarcoplasmic reticulum that functions to bind two atoms of Ca
(Gerday, 1988).
Because intracelluUu- Ca"* concentrations are tightly regulated to control muscle
contraction, Ca is described as existing in two general compartments, the exchangeable
and the nonexchangeable fractions. The exchangeable fraction is believed to be
equivalent to the releasable Ca"* contained in the sarcoplasmic reticulum. The
nonexchangeable fraction is believed to consist largely of Ca, either bound to proteins or
stored in other cellular components (Sjodin, 1982). Mitochondria have a variety of roles
in cellular metabolism, including storing Ca. Thus, to maintain steady state Ca
concentrations within the myofibril, excess Ca must be either stored in the sarcoplasmic
reticulum or mitochondria, pumped outside of the cell by the Na*/Ca * exchanger or Ca
pump, or bound to protein. Besides the aforementioned Ca binding proteins, there are a
number of myofibril structural proteins that can bind Ca^*, including actin, myosin, titin,
and nebulin (Sjodin, 1982; Tatsumi et al., 1997). Wroblewski and Edstrom (1994) found
that Ca concentrations are highest in the Z-line and A-band, the location of actin, myosin,
titin, and nebulin molecules. Therefore, binding Ca to structural myofibrillar proteins is
another mechanism that helps maintain steady state cytosolic concentiations of Ca^*.
42
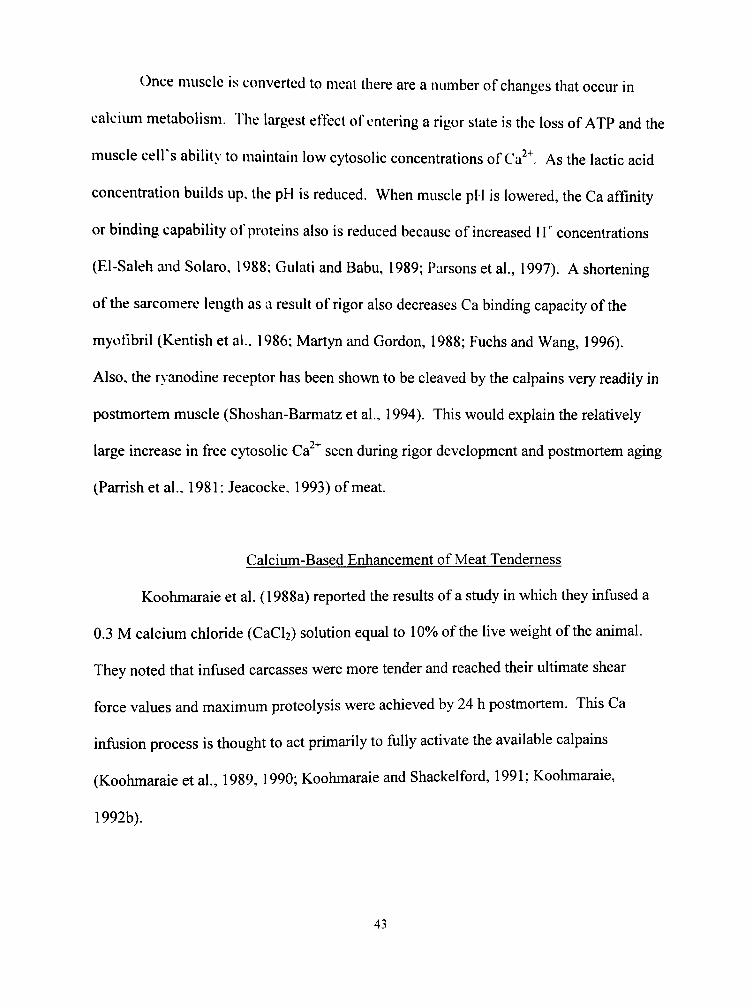
Once muscle is converted to meat there are a number of changes that occur in
ealciimi metabolism. The largest effect of entering a rigor state is the loss of ATP and the
muscle cell's ability to maintain low cytosolic concentrations of Ca^* As the lactic acid
concentiation builds up. the pH is reduced. When muscle pH is lowered, the Ca affinity
or binding capability of proteins also is reduced because of increased FL concentrations
(El-Saleh and Solaro. 1988; Gulati and Babu, 1989; Parsons et al., 1997). A shortening
of Uie sarcomere length as a result of rigor also decreases Ca binding capacity of the
myofibril (Kentish et al., 1986; Martyn and Gordon, 1988; Fuchs and Wang, 1996).
Also, the rvanodine receptor has been shown to be cleaved by the calpains very readily in
postmortem muscle (Shoshan-Barmatz et al., 1994). This would explain the relatively
large increase in free cytosolic Ca * seen during rigor development and postmortem aging
(Parrish et al., 1981; Jeacocke. 1993) of meat.
Calcium-Based Enhancement of Meat Tenderness
Koohmaraie et al. (1988a) reported the results of a study in which they infused a
0.3 M calcium chloride (CaCh) solution equal to 10% of the live weight of the animal.
They noted that infused carcasses were more tender and reached their uhimate shear
force values and maximum proteolysis were achieved by 24 h postmortem. This Ca
infusion process is thought to act primarily to fully activate the available calpains
(Koohmaraie et al., 1989, 1990; Koohmaraie and Shackelford, 1991; Koohmaraie,
1992b).
43
The initial CaCL infusion studies led to a number of studies being conducted to
demonsti-ate Uiat the effectiveness of CaCli injection of meat in activating the calpains
and improving tenderness (Wheeler et al.. 1993; Whipple and Koohmaraie, 1993; Kerth
et al.. 1995: Lansdell et al.. 1995; Wheeler et al., 1997). Injection or infusion of CaChat
earh times postmortem is appealing for a number of reasons. In most cases, the
tenderization of a carcass is complete within 24 h postmortem, and the meat is never
over-tenderized by Uie process. AlUiough CaCb enhancement of tenderness seems to be
ver> plausible. Uiis technology has yet to be implemented by the meat industry. Some
important drawbacks to CaCL injection and (or) infusion are the potential for off-flavor
development (St. Angelo et al.. 1991) and the possibility of increased lean discoloration
during retail conditions (Kerth et al., 1995) when injection levels above 200 mM are used
(Miller et al., 1995). Thus, if a technology can be devised to activate the calpains and
improve meat tenderness without increasing lean discoloration or off-flavors, then the
meat industry might adopt a Ca-based system to enhance tenderness.
Biochemistry and Metabolism of Vitamin D
Vitamin D, a fat soluble vitamin (also referred to as calciferol) is a generic term
that indicates a molecule of the general structure containing four six-carbon rings with
differing side chain structures. The four-ring structure the
cyclopentanoperhydrophenanthrene ring structure from which cholesterol and all steroids
are derived. Technically, vitamin D is classified as a secosteroid, a compound in which
one of the four rings has been broken; in vitamin D the 9,10 carbon-carbon bond of the B
44

ring is broken, \ i tamin D is initially derived from cholesleiol, as are all steroids.
Pnn itamin D (also known as 7-dehydrocholesterol) is a simple derivative of cholesterol,
which is formed when a iiydrogen is removed from the number seven carbon, which
forms a double bond with the number eight carbon in the second, or B ring of cholesterol.
Provitamin D is converted to v itamin Di (cholecalciferol) by the action of ultraviolet light
on the skin. In this reaction, the B ring of the sterol is opened (see Figure 4). Vitamin D^
(\ ITD) is then transported by a vitamin D binding protein to the liver. Here an enzyme,
referred to as a "mitochondrial hvdroxvlase,"" introduces a hydroxyl (OH) group at
position 25. This reaction requires energv in the form of NADPH and the presence of
molecular o \ \ gen. This new intermediate, known as 25-hydroxy-vitamin D3 (25-OH
DO, is not the active form of the vitamin, but is typically stored in the liver until required
(DeLuca, 1979; Reichel et al., 1989).
CH3
CH (CH2)3 CH3
CH2
CH3
CH
CH3
"rY '
H HO
Figure 4. The structure of vitamin D3.
45
When the active form of vitamin D (steroid) is needed, 25-OH D3 is transported to
the kidney where a new hydrolayse enzyme is synthesized, 25-OH Drla-hydroxylase.
This hydroxylase enzyme is controlled by parathyroid hormone (PTH) and by the Ca and
phosphate concentrations in the blood, as well as by feedback regulation from the active
form of Uie vitamin (Norman and Henry. 1993; Feldman et al., 1998). The 25-OH D3-
la-hydroxylase enzyme introduces another hydroxyl group at position 1, and the
biologically acti\e form 1.25-dihydroxy-vitaniin D3 (calcitriol) is produced. An
additional ke> component of the vitamin D endocrine system is the plasma vitamin D
binding protein that carries VITD and all its metabolites to their various target organs.
Functions of Vitamin D
Binding of dihydroxylated metabolites, particularly 1,25-dihydroxy-vitamin D3
[1.25-(OH)2 D3]. to a nuclear receptor at the target organs allows for the subsequent
generation of specific biological responses. Thus, VITD is a prohormone without
intrinsic biological activity (Reichel et al., 1989; DeLuca and Zierold, 1998). Only after
VITD is metabolized, first into 25-OH D3 in the liver, and than into l,25-(OH)2 D3 by the
kidney, are biologically active molecules produced. Some 37 different vitamin D
metabolites have been isolated and characterized, although 25-OH D3 and l,25-(OH)2 D3
are the prunary fiinctional metabolites in mammals (Norman and Henry, 1993; DeLuca
and Zierold, 1998; Feldman et al., 1998).
The major ftinction of the vitamin D endocrine system in the body is to increase
plasma concentrations of Ca^*. The three major target tissues of the steroid l,25-(OH)2
46
D3 are the intestine, kidney, and bone. The mechanism by which 1,25-(OH)2 D3
functions is similar to that of other steroid hormones. 1,25-(OH)2 D3 interacts
stereospecifically (does not bind covalently) with an intracellular receptor protein. The
steroid-receptor complex is then associated with DNA in the nucleus of target cells, either
to initiate the sviithesis of specific RNA-encoded proteins that mediate a spectrum of
biological responses (mainly Ca binding) or to mediate a selective repression of gene
transcription (Reichel et al., 1989).
The l,25-(OH): Ds-receptor, vitamin D receptor (VDR), is an intracellular
receptor that helps to increase Ca transport, and to mediate cell differentiation, and cell
proliferation (Pike, 1985). The cellular distribution of VDR in both avian and
mammalian tissues is ubiquitous, including intestine, bone, kidney, pancreas, skin,
muscle, mammarv- gland, testis, and many other organs and tissues (Pike, 1985; Haussler,
1986; Costa et al., 1986; Boland and Nemere, 1992). Intracellular Ca concentrations
and VDR expression are related. Krishnan and Feldman (1991) showed that activation of
the protein kinase-C pathway and elevation of intracellular Ca^* both lead to a significant
down regulation of VDR.
The traditional view holds that all steroid hormones, including l,25-(OH)2 D3,
have only one class of receptors, namely those cytosolic/nuclear proteins that bind with
exquisite specificity to their ligands and then interact in the nucleus with the promoters of
genes that are either up- or down-regulated (Norman, 1998). Rapid actions of l,25-(OH)2
D3 have been observed at both the cellular (e.g., Ca transport across a tissue) and
subcellular level (membrane Ca transport, and changes in intracellular second
47

messengers). Nemere et al. (1998) found a 1,25-(OH). D3-receptor bound to the plasma
membrane of intestinal cells that mediates a rapid transport of Ca^* across the membrane.
Thus, 1.25-(OH): D3 functions to both rapidly and slowly (through genetic responses)
increase the infracellulai- concentration of Ca"'
AnoUier explanation of the rapid, non-genomic effects of l,25-(OH)2 D3 on Ca
transport involves activation of the Ca channel. Increased Ca channel activity has been
shown to be mediated by the cAMP pathway and l,25-(OH)2 D3 (Selles and Boland,
1991). An interaction with an inhibitory G-protein coupled to adenylate cyclase might be
part of Uie mechanism b> which l,25-(OH)2 D3 increases Ca^* uptake through the Ca
channels (Boland et al.. 1991; Bygrave and Roberst, 1995). Thus, the rapid action of
1.25-(OH)2 D3 on Ca uptake seems to be because of a plasma membrane bound receptor
and modulation/activation of the Ca charmel.
Vitamin D Effects on Muscle
There is increasing evidence to indicate that skeletal muscle is a target organ for
vitamin D. First, the VDR is located in muscle and gene activation increases the RNA
synthesis of Ca-binding proteins (Boland and Boland, 1985; Costa et al., 1986). 1,25-
(0H)2 D3 also rapidly (1 to 3 min after treatment) increases muscle cell intracellular ' ^*
concentrations (Boland, 1986). The rapid actions of l,25-(OH)2 D3 on skeletal muscle Ca
uptake have been shown to be due to modulation of the Ca channel through the cAMP
pathway (Boland and Boland, 1987; Vazquez et al., 1995). The vitamin D steroid also
increases the calmodulin distribution near the plasma membrane and increases Ca
48
binding capacity of calmodulin (Boland and Nemere, 1992; Boland and Boland, 1994).
1.25-(OH)2 D3 also decrea.ses Ca"' concentrations in muscle mitochondria thereby
increasing intracellular Ca"' concentrations within the muscle cell (Selles and Boland,
1990). AlUiough Uie newlv' discovered plasma membrane-bound vitamin D receptor has
only been located on intestinal cells, it might be present on muscle cells, which would
furUier explain some of the biologically rapid effects of l,25-(OH)2 D3 on muscle.
Effects of Feeding Vitamin D3 to Cattle
Vitamin D3 plav s a \'ital role in maintaining blood concentrations of Ca and P
(Schwartz, 1975; Horst, 1986; Hurwitz, 1996). The major effect of supplementing high
levels of \ itamin D is to increase Ca absorption in the gut and release of Ca from bone
stores (Conrad and Hansard, 1957; Littledike and Goff, 1987). Early attention was
focused on studies using VITD supplementation to decrease the incidence of milk fever.
These studies with VITD in cattle indicated that supplementation as low as 1 x lO^IU/d
increased blood Ca and P and decreased the incidence of milk fever (parturient paresis) in
dairy cows (Hibbs et al.. 1946 and 1951; Hibbs and Pounden, 1955). Feeding as low as
2.5 x 10' lU/d of VITD for extended periods of time increased plasma concentrations of
Ca in dairy cows (McDermott et al., 1985). Injections of the vitamin D metabolites 25-
(OH) D3 and l,25-(OH)2 D3 also have been shown to increase serum Ca concentrations
(HolUs et al., 1977; Hove et al., 1983; Hodnett et al., 1992).
Depending on the dose and length of feeding, feeding high doses of VITD can
cause VITD toxicity in cattle, prolonged hypercalcemia, weight loss, loss of appetite.
49
decreased feed intiike. and death (Littledike and Horst, 1982; Mortensen et al., 1993).
Puis (1994) suggested that doses 1 to 2 million lU of VTTD/animal daily could cause
toxicity. In an experiment using the rat as a model, Beckman et al. (1995) found
excessive levels of VITD increased expression of the vitamin D receptor, and impaired
the responsiveness of the mitochondrial hydroxylase, 25-OH D3 1 a-hydroxylase,
resulting in increased concentrations of plasma Ca"' and decreased concentrations of
1.25-(OH):D3.
Feeding Vitamin Dj to Improve Meat Tenderness
Supplementing \itamin D3 shortly before slaughter to improve meat tenderness
has receixed much attention recently. Vitamin D3 feeding appears to increase plasma and
muscle concentrations of Ca, and activates the calpain system in a maimer similar to
CaCL infusion and injection. Feeding high levels of VITD (0.5 x 10 to 7.5 x 10 )
lU/animal/daily for 4 to 10 d before slaughter has been shown to improve beef
longissimus tenderness (Swanek et al., 1999; Montgomery et al., 2000, 2001a). In these
experiments, decreased Warner-Bratzler shear force were seen at 7 and 14 d postmortem,
but not at 21 d postmortem. Montgomery et al., (2001a) noted that VITD
supplementation had its greatest effect on semimembranosus steaks compared with
longissimus steaks and suggested that feeding VITD will effectively improve tenderness
when cattle tend to produce tough beef but will have no impact on cattle that tend to
produce tender beef Karges et al. (1999) reported VITD supplementation decreased the
WBS force of longissimus and gluteus medius steaks at 14 and 21 d postmortem, but hot
50
carcass weights were decreased when the cattle were fed 6x10^ lU/animal/daily for 4 or
6 d before slaughter. This decrease in hot carcass weight was probably a result of
decreased feed intake and growth (Karges et al., 1998; Montgomery et al., 2001a).
Vargas et al. (1999) fed steers different combinations of VITD and vitamin E and
reported Uiat steaks from the steers fed VITD required less aging time than control steaks
to reach a WBS Uireshold value of < 3.86 kg, which was considered "very tender" in their
laboratorv. Enright et al. (1998) fed pigs high levels of VITD and reported that meat
palatability traits were not affected, although visual color, muscle firmness, and drip loss
were all improved by VITD supplementation. In another study, Enright et al. (2000)
showed VITD supplementation of pigs also decreased average daily gain, gain-to-feed
ratio, li\e weight, and carcass weight. While these findings indicate feeding high levels
of VITD has the potential to negatively impact growth and feed intake, Montgomery et
al. (2001a) reported feeding less than 2.5 x 10 lU/animal/daily for 9 d before slaughter
did not negatix ely impact feed intake by steers. Thus, there currently seems to be a dose
level identified that does not decrease important economic growth performance traits of
beef cattle.
High levels of VITD in the diet can be toxic to both cattle and humans. The
recommended dietary allowance of VITD for an adult human is 200 lU/d or 400 lU/d for
young aduhs, which is 5 or 10 (xg/d, respectively (NRC, 1989). At this rate, an adult
would need to eat 67 g of steak or 9 g of liver from steers treated with 5 x 10^ lU of
VITD to meet their daily needs for this nutrient according to the study by Montgomery et
al. (2001). Consumption of as little as 45 |j,g of VITD per day has been associated with
51
signs of vitamin D3 toxicity in young children (AAP, 1963). Extrapolating, it would take
as little as 88 g of cooked liver from treated cattle to deliver a potential toxic dose of
VITD (Montgomery et al., 2001). A more recent study found that the minimum dose
required to cause toxicity was 1,250 \ig of VITD, which would require 16 kg of beef or
2.2 kg of liver to achieve a toxic dose (Miller and Hayes, 1982; Montgomery et al.,
2001). Olson et al. (1972) first studied the effects of administering high amounts of 25-
(OH): D3 to cattle and found a 140% increase in VITD concentrations in beef
Montgomery et al. (2000, 2001a) indicated that feeding VITD in excess of 0.5 x 10
lU/animal daily significanth raised VITD concentration in beef and liver. While cooking
samples also decreased the concentrations of residues, the increase in residues in liver
samples poses a serious toxicological hazard, requiring livers to be removed from the
food chain, whereas the increase in beef muscle VITD concentrations does not seem to
pose a toxicological hazard. Assessment of toxicological hazards in tissues from VITD-
treated cattle is further complicated by results suggesting that the dietary allowances are
grossly underestimated and should be increased to at least 250 |ag/d for adults (Vieth,
1999). Because of the complications associated with calculating toxicological hazards
associated with VITD, determining the overall hazard from supplementing cattle with
high levels of VITD to improve beef tenderness is somewhat hindered.
In summary, vitamin D3 supplementation has been shown to effectively increase
muscle Ca concentration and improve beef tenderness of a variety of muscles within a
carcass. Several researchers have found VITD supplementation had minimal effects on
tenderness or did not improve tenderness (Hill et al., 1999; Scanga et al., 1999; Rider et
52
al., 2000), which suggests the need for further research and the possibility that VITD
supplementation is onh effectiv e on animals and (or) that produce tough meat. It seems
that VITD increases c> (osolic Ca"* and activates the calpains in meat to accelerate
postmortem tenderization (Swanek et al., 1999). The calpains also have been shown to
be activated by vitamin D in carcinoma cell culture cells (Ravid et al., 1994; Berry and
Meckling-Gill. 1999). There is still needed research to determine biological type and sex
interactions w ith \ itamin D? as well as the potential for toxicological hazards in the food
chain.
53
CHAPTI'R 111
EFFECT OF VITAMIN D3 DOSE CONCENTRATION AND
BIOLOGICAL TYPE OF CATTLE ON THE FEED EFFICIENCY,
TISSUE Ri;siDlJi:s. A N D T E N D E R N I ' S S O F B E E F STEERS
Abstract
Postmortem tenderization increases with aging time as evidenced by Warner-
Bratzler sheai- (WBS) force. This improvement in tenderness is associated with the
degradation of myofibrillar/cytoskeletal proteins as a consequence of Ca-activated
protease |i-calpain. Because of the Ca dependency of the calpains, it has been
hypothesized Uiat oral supplementation of VITD can increase the Ca content of muscle to
activate the calpains and improve tenderness. Feedlot steers (n = 142) were arranged in a
4 X 3 factorial arrangement consisting of four levels of vitamin D3 (0, .5, 1, and 5 million
lU/steer/daily) for eight consecutive days antemortem utilizing three biological types
(Bos indicus. Bos /awrw^-Continental, and Bos /awrw^-English). Feedlot performance and
carcass data were collected and WBS was measured at 3, 7, 10, 14 and 21 d postmortem
on longissimus lumborum, semimembranosus, gluteus medius, and supraspinatus steaks
cooked to 71°C. Plasma samples for P and Ca determinations were collected during
supplementation and at exsanguination. Longissimus lumborum samples were collected
at 20 min postmortem to determine calpain activity. High performance liquid
chromatography (HPLC) and radioimmuno assays (RIA) were conducted to determine
the concentration of vitamin D3 and the vitamin D3 metabolites (25-hydroxy-vitamin D3,
1,25-dihydroxy-vitamin D3 in longissimus, liver, kidney, and plasma. Vitamin D3 at 5
54

million lU/steer/d decreased ADG over the last 25 d of feeding and feed intake for the
last 2 d of feeding (P < .05) compared with non-treated control steers. Plasma
concentrations of P and Ca were increased (P < .05) by VITD concentrations of 1 and 5
million lU/steer/daily. Vitamin D3 treatments did not affect (P > .05) carcass
measiu-ements, including USDA yield and quality grade; thus, any improvements in meat
tenderness as a result of VITD supplementation can be made without adversely affecting
economically important feedlot performance or carcass factors.
Biological t\pe of cattle did not affect vitamin D treatment for any carcass,
feedlot performance, or tenderness traits measured, suggesting that feeding VITD for 8 d
before slaughter will affect all biological types of cattle in a similar fashion.
Supplementing steers with .5, 1, or 5 million lU/daily decreased (P < .05) longissimus
lumborum WBS at 7, 10, 14 and 21 d postmortem compared with controls. Vitamin D3
freatments of .5, 1, and 5 million lU/daily decreased semimembranosus WBS at 3, 7, and
14 d postmortem (P < .05). Supraspinatus WBS was decreased at 3 d postmortem when
steers were fed .5 million lU/daily (P < .05). Gluteus medius WBS was decreased at 3 d
postmortem when steers were fed .5 million lU/daily, and 14 d postmortem WBS was
reduced when steers were fed 5 million lU/daily (P < .05). In general, VITD
improvements in WBS were most consistent and intense in longissimus lumborum steaks
and vitamin D3 treatment did not interact with breed type for WBS. Sensory panel
tenderness was improved by all VITD treatments in longissimus samples. Sensory panel
traits of juiciness, flavor, connective tissue, mouth-feel, and off-flavor were not (P > .05)
affected by VITD treatments. The improvement in tenderness of multiple muscles
55
through the feeding of \ itamin D3 8 d prior to slaughter gives the beef industry a tool to
improve the quality and consistency of beef at both retail and for food service with no
detrimental affect on feedlot peifomiance traits. Additionally, the fact that the
improvement in WBS was noted in the longissimus, semimembranosus, and gluteus
medius by 3 d postmortem enhances the value and usefiilness of VITD in improving the
consistencv of beef tenderness without the necessity of a costly and lengthy aging
process. All vitamin D3 treatments decreased |a-calpain activity and increased muscle Ca
concentrations. Vitamin D3 concentiations were increased (P < .05) by vitamin D3
supplementation in tissues tested (kidney, longissimus, and plasma). Liver vitamin D3
concentrations were increased (P < .05) by vitamin D3 treatments as much as 75 times
when steers were tieated with 1 and 5 million lU/daily. Cooking the longissimus samples
to 71 °C negated (P > .05) any treatment increases in vitamin D3 concentration. The
vitamin D metabolite 1.25-dihydroxy-vitamin D3 was only increased (P < .05) in plasma
samples as a result of the VITD treatments. These results indicate that oral
supplementation with vitamin D3 of .5 million lU/steer/d for eight consecutive days
before slaughter improves tenderness in beef steaks from different subprimal cuts by
affecting cellular Ca levels and |i-calpain activities and muscle proteolysis, while having
only a minor effect on tissue vitamin D concentrations and no adverse effects on feedlot
performance.
56
Introduction
Juiciness, flavor, and tenderness are three major sensory factors that affect
perception and satisfaction of meat by consumers. Of these quality factors, tenderness
has been shown to be most variable and the single most important factor affecting
consumer satisfaction (Savell et al., 1987, 1989; Miller et al., 1995). Surveys of meat
retailers and restaurateurs indicated Uiat beef tenderness varies greatly (Hamby, 1992;
Morgan et al., 1991) and the 1995 National Beef Quality Audh listed tenderness as a
major beef qualitv problem and Uie second largest concern of the meat retail industry
(Smith et al., 1995). Therefore, tenderness seems to be problematic to beef consumers,
inadequate beef tenderness has been estimated to cost the U. S. beef industry $200 to
$300 million annually (Morgan, 1995; Smith et al., 1995; Miller et al., 2001).
One of the most effective ways of improving meat tenderness is postmortem
aging. Myofibrillar proteolysis as a result of the intracellular Ca^*-dependent proteases,
^-calpain and m-calpain. has been shown to enhance and increase meat tenderization.
Injection of carcasses and meat cuts with CaCb has been shown to improve beef
tenderness and enhance consumer perception of beef steak tenderness (Wheeler et al.,
1997; Kerth et al., 1995; Miller et al., 1995) by accelerating postmortem tenderization.
Infusion of CaCb solutions shortly after death also has been shown to activate the calpain
system and accelerate postmortem tenderization of meat (Koohmaraie et al., 1988a, 1989,
1990). Swanek et al. (1999) first reported supplementation of VITD before slaughter
improved beef longissimus tenderness; however, no other muscles were studied.
Therefore, supplementation of VITD could act in similar fashion as other Ca induced
57

tenderness improvement systems and possibly increase the economic capacity of beef
Before VITD supplementation can be implemented by the beef industry, the hurdles of
potential tissue residues and negative feedlot performance must be overcome. To achieve
this, the proper dose of VITD must be further defined. This study was conducted to
investigate Uie effect of VITD feeding before slaughter on the tenderness of muscles from
different biological types of cattle.
Materials and Methods
Cattle
One hundred fifty (150) medium- to large-framed beef steers were purchased for
use in this experiment. The steers were of three biological types consisting of Bos
taurus-EngWsh (n = 50). ^o^-muA-w^-Continental (n = 50), and Bos-indicus (n = 50). The
Bos toMrM5-English steer were from a single south Texas ranch and were 7/8 to 100% Bos
taurus-Eng\\sh type cattle. The Bos taurus-ContixiQnXdl steers were 5/8 to 100% Bos
rawrM^-Continental cattle and originated from three different Texas ranches. The Bos
indicus steers were 3/4 to 100% Bos indicus type steers and originated from a number of
south Texas ranches. After arrival at the Texas Tech University Bumett Center, each
steer was weighed, given an individually numbered ear tag, vaccinated with Bovishield
4-i-Lepto (Pfizer Animal Health, Groton, CT) and Fortress 7 (Pfizer), treated for internal
and external parasites down the back line with Dectomax Pour-On (Pfizer), and an
individual body weight was measured. Following processing, steers were housed in dirt
floor pens at the Bumett center and offered a 60% concentrate starter diet.
58
The lightest and heaviest steers of each biological type were designated as extra
steers and were not used in Uie experiment. The remaining 144 steers were split into the
three respective breed t> pes. and within each biological type, steers were stratified by
initial bod)' weight (BW) and assigned randomly within BW strata to one of the four
dietary vitamin D3 treatments. During the next 14 d the diet was gradually stepped up to
a 90% concentrate diet. Within 14 d of initial processing, each steer was again
individual!}, weighed, implanted with Ralgro (Schering-Plough Animal Health,
Kenilworth, NJ). imd sorted to their assigned pens. Six steers of the same biological type
were sorted to a partially slotted concrete floor pens. Each steer was again individually
weighed after 56, 99, and 123 d on feed the morning before feeding.
Diet
After the second processing and sorting of the cattle, the steers were all fed the
same 90% concentrate diet. Ingredient composition of the diet is shown in Table 1 and
the composition of the supplement within the diet is shown in Table 2. The diet was
mixed in a 45-cubic foot capacity Marion paddle mixer. The Burnett Center feed milling
system is operated by a computer-controlled WEM batching system. Once the total diet
was mixed, the amount of feed allotted to each pen was delivered using a computer-
controlled belt-feeding system to each of the individual pens. Each feed bunk was
evaluated visually at approximately 0700 to 0730 daily. The quantity of feed remaining
in each bunk was estimated, and the daily allotment of feed for each pen was recorded.
This bunk-reading process was designed to allow for little or no accumulation of
59
imconsimied feed (0 to .5 kg per pen). Feed bunks were cleaned, and unconsumed feed
was weighed on d 56, 99, and 123 of the experiment. Dry matter (DM) content of bunk
weighback samples were determined in a forced-air oven by drying overnight at 100°C.
Bunk weighbacks and DM determinations of weekly feed bunk samples were used to
calculate DM intake b> each pen.
Because of the potential variability in the moisture content of the silage used in
the diet, samples of mixed feed delivered to feed bunks were taken weekly throughout the
experiment. Samples of feed taken from the bunk were composited for the entire first
115 d of the experiment. Samples were further composited during the last 8 d of feeding
when the experimental VITD treatments were applied to each pen. Feed samples were
ground to pass a 2-mm screen in a Wiley mill, and overall composites were analyzed for
DM, ash, CP, acid detergent, Ca, and P (AOAC,1990; Table 3).
Experimental Vitamin D3 Diets
After 99 d on feed, steers in all pens were weighed and split into pens of three
steers per pen (n = 48). Before the dietary treatment period two steers were removed
from the experiment because of leg injuries (142 steers remained). The dietary
freatments consisted of 0.0. 0.5, 1.0, or 5.0 XIO^ lU/steer daily of vitamin D3 (Roche
Vitamins Inc., Nutley, NJ) during the last 8 d of feeding. Four pens per biological type
received one of the four vitamin D3 treatments for the last 8 d of feeding. The vitamin D3
was individually weighed for each day per pen and diluted in 100 g of ground com meal.
Each of these pen treatments was top dressed on the delivered feed and then hand mixed.
60
immediately after delivery to the individual bunk. Before feeding during the last 8 d of
feeding each bunk was cleaned and any left over feed from the previous day was
collected and weighed as described previously. After 123 d on feed each steer was again
individually weighed and then transported to the Excel Corp. slaughter facility in
Plainview. TX.
Plasma Calcium and Phosphorus Determinations
Blood samples were collected from each steer during sorting after 99 d on fed.
The blood samples were collected via jugular puncture method into 13 x 100 mm sodium
heparin (143 US? units) 10 mL vacutainer (Becton Dikinson, Franklin Lakes, NJ) tubes.
Blood samples also were collected from one half of the animals after 4 d and from the
other half of the animals after 6 d of vitamin D3 freatment and were collected on each
steer at the time of exsanguination. Blood samples were stored on ice and transported to
the laboratory where the tubes were centrifiiged for 15 min at 500 x g. Plasma was
collected from the centrifuged tubes and stored in 4-mL cryotubes at -20°C. Ionized
Ca^* concentrations were determined in duplicate by atomic absorption spectrometry
(Perkin-Elmer Corp., 1965) using standards of 0, 5, 10, and 15 mg of Ca^*/100 mL on a
Perkin Elmer model 2380 atomic absorption spectrometer (Perkin Elmer Inc., Wellesley,
MA; see Appendix B). Plasma phosphorus (P) concentrations were determined
according to the methods of Parekh and Jung, (1970; see Appendix C) using a
Thermomax microplate reader (Molecular Devices, Sunnyvale, CA).
61

Slaughter and Carcass Evaluation
After the 8 d of \ itaniin D3 supplementation, the steers were transported the
following morning to a USDA-inspected facility (Excel Corp., Plainview, TX) and
harvested using approv ed humane techniques. Blood was collected during
exsanguination for each steer. Liver samples also were collected from the right hepatic
lobe (lobus hepatis dexter), and the remaining liver was discarded if the steer had been
supplemented with \ itamin D3. A 30-g longissimus muscle sample was removed from
each carcass at 20 min postmortem for calpain determination according to the procedures
of Koohmaraie (1990). Carcass pH was measured using a Model 230A Orion
temperature-compensated pH meter (Orion Research, Boston, MA) between the 11 " and
\2^ rib at 3 and 24 h postmortem. Carcass temperature also was measured at 3 and 24 h
postmortem using a Hantover Model TM99A-H digital thermometer (Hantover,
Middlefield, CT).
Carcasses were spray-chilled for 48 h (-1°C). After chilling, carcasses were
ribbed, and USDA quality and yield grade traits were recorded. Commission
Intemationale de I'Eclairage (CIE) L* (muscle lightness), a* (muscle redness), b*
(muscle yellowness), saturation index, and hue angle values were collected from the
longissimus dorsi muscle of each carcass with a Hunter Miniscan XE Plus spectrometer
(Reston, VA) using illuminant D65 and a 3.5-cm aperture. After collection of USDA
traits and color data, the carcasses were fabricated. During fabrication mock tenders
(supraspinatiis, IMPS #116b), strip loins (longissimus, IMPS #180), top butts (gluteus
medius, IMPS #184), and inside rounds (semimembranosus, IMPS #168) were collected
62

and vacuum packaged. The meal was then transported to the Texas Tech University
Meat Laboratoiv for further analv.ses.
W arner-Bral/ler Shear Force and Tenderness Determination
Fach mock tender, strip loin, top butt, and inside round were fabricated into
individual mu.scles of supraspinatus. longi.ssimus, gluteus medius, and semimembranosus,
respectivelv on d 3 postmortem. Each muscle was then cut into 2.54-cm thick steaks,
placed in Cr\o\ac BlOO beef bags and wet-aged (aging in anerabic conditions) at 2''C.
Steaks for each muscle were aged to d 3, 7, 10, 14, or 21 postmortem for Warner-Bratzler
shear (W BS) force determinations, and to 7 d postmortem for sensory evaluations, as
well as for chemical and water anahses. At each of the individual aging treatments,
steaks were frozen at -2n"C until further analyses.
Sensor> panel ev aluations and WBS determinations were made according to
AMS.A (1995) guidelines. Steaks for sensory and WBS determinations were thawed
slowh in a 2°C cooler for 18 to 24 h and cooked on a MagiGrill beh grill (Model TBG-
60 Electric Con\ e\or Grill, MagiKitch'n. Quakertown, PA) to an internal temperature of
71°C. Individual cooking cvcles are reported in Appendix D. Individual steaks were
weighed before cooking and after cooking to determine cooking loss on WBS steaks.
Once cooked, steaks for WBS evaluation were placed on plastic trays, covered with
polyvinyl chloride film, and chilled for 18 h at 2°C. Five to six round cores (1.27-cm
diameter) were removed from each supraspinatus steak, six cores were removed from
each longissimus steak, and eight cores were removed from each gluteus medius and
63
semimembranosus steak parallel to the muscle fiber orientation and sheared once with a
WBS machine (G-R Elec. Mfg. Co., Manhattan, KS). The multiple shear force
determinations for each steak were then averaged.
Sensory steaks were cut into 1-cm- cubes immediately after cooking and stored in
warming pans (approximatelv' 5 min) until they were served warm (approximately 50°C)
to Uie trained sensory panel (AMSA, 1995). Samples were evaluated by a six to eight
member panel trained according to Cross et al. (1978). Steaks were evaluated for initial
juiciness, sustained juiciness, initial tenderness, sustained tenderness, flavor intensity,
beef flavor, overall niouUi feel, and connective tissue (8 = extremely juicy, tender,
intense, characteristic beef flavor, beef-like mouth feel, none to 1 = extremely dry, tough,
bland, uncharacteristic beef flavor, non-beef-like mouth feel, abundjmt) and off-flavor (5
= extremeh' off-flavor to 1 = none).
Water-Holding Capacity and Chemical Analysis of Fresh Beef
Amount of purge was measured on individual strip loins, top butts, and inside
rounds by weighing individual cuts before removal from packaging and reweighing 10
min after removal. Drip loss was measured on longissimus (strip loin) and supraspinatus
(mock tender) samples at 3-d postmortem by removing a 1.2-cm core from each muscle
and weighing the core sample before and after storage at 2°C for 24 h. Percent moisture,
and percent free, bound, and immobilized water were determined on longissimus samples
using the procedures of Wierbicki and Deatherage (1958; Appendix E).
64
Muscle Ca and P concentrations were determined on longissimus samples
according to AO.AC (1990) techniques. A 5-g muscle sample was placed in a crucible
and dried in a \acuuiii diving oven at 1()0°C for 24 h. Samples were then ashed in a
muffle fiu-nace at 625°C for 18 h. Samples were then cooled to room temperature and
dissolved in 50 niL of 3 N HCI and boiled to 25 mL of solution. Samples were then
filtered into a 100-niL flask and diluted (see Appendix F). Next, 4 mL of the diluted
sample was placed in a test tube wiUi 5.5 mL of distilled water and 0.5 mL of 5%
(vol/\ol) solution of lanthanum chloride. Calcium concentrations were determined in
duplicate using atomic absorption as described previously. Muscle P concentrations also
were determined colormetrically on the diluted samples in duplicate according to AOAC
(1990) procedures using a Beckman DU-50 Spectrophotometer (Beckman Coulter,
Chaska, MN; Appendix G).
Vitamin D3. 25-Hydroxyvitamin D3, and 1,25-Dihvdroxyvitamin D3 in Plasma. Beef, Liver, and Kidney
Vitamin D3, 25-hydroxyvitamin D3, and 1,25-dihydroxyvitamin D3 concentrations
were quantified by a modification of the methods of Montgomery et al. (2000). For
kidney, liver, muscle, and cooked steaks (samples were cooked to 71°C then stored at
4°C overnight) samples, 2 g of tissues were homogenized in 8 mL of phosphate buffered
saline (PBS) with a tissue homogenizer for 60 s. A 2 mL aliquot of the homogenate was
transferred to a 29 by 147 mm capped glass tube. Approximately 50 ng of vitamin D2
and 1000 counts per minute (CPM) of ^H-25-hydroxyvitamin D3 and H-1,25-
65
dihydroxyvitamin D3 were added to the 2-niL aliquot for recovery estimates. Samples
were then extracted and the concentration of vitamin D3 was determined using HPLC
(Appendix H). Tissue concentrations of 25-hydroxyvitaniin D3 and 1,25-
dihydroxyvitaniin D3 were determined after HPLC separation and concentrations were
determined using radioimmunoassays (Appendix 1 and J. respectively). Plasma vitamin
D3, 25-hydroxv"\itamin D3. and 1.25-dihydroxyvitamin Di concentrations also were
determined using HPLC and radioimmunoassays (Appendix K, L, and M, respectively).
Troponin T Degradation
Longissimus samples were collected at 24 h postmortem and on d 7, 10, and 14
postmortem, and whole muscle preparations were used to determine troponin T
degradation. A total of six animals were subsampled per four vitamin D3 (n = 28 steers)
treatments for each of the agmg treatments for ease of collection and determination.
Samples were prepared as described by Huff-Lonergan et al. (1996b; Appendix N). A 7-
d aged sample from the control group was loaded on each gel to serve as an internal
standard (Appendix O). Western blots were performed according to the method of Huff-
Lonergan et al. (1996a) to detect the 30-kDa component, a proteolytic degradation
product of troponin T using Sigma antibody JLT-12 (Appendix P). The 30-kDa band
was detected using a chemiluminescent signal with an Amersham detection kit (ECL
#RPN 2106). The 30-kDa band was then quantified using a Kodak molecular Analysis
software package.
66
Statistical Analyses
Feedlot performiuice data, carcass traits, Ca and P concentration, and tissue
residues were analyzed using a 4 (vitamin D treatment) by 3 (biological type) factorial
arrangement of freatments where a pen of three steers was the experimental unit. Feed
intake was analyzed as a repeated measure where the main plot consisted of the vitamin
D and breed type main effects and the \ itaniin D by biological type interaction. The error
term for the main plot was vitamin D X biological type nested within pen. For the
subplot, Uie repeated measure was day (the 8 d of vitamin D supplementation), and all
interactions were represented. The error term for the subplot was vitamin D and breed
tjpe nested within pen and day. For amounts purge, drip loss, and sensory traits a split-
plot arrangement was also used. The main plot was as described previously, and the
subplot consisted of muscle type and all interactions; the error term for the subplot was
vitamin D and biological type nested within pen and muscle. For WBS and cooking
shrink a split-split-plot design was used. As before, the whole plot consisted of the
factorial arrangement, the first sub-plot consisted of muscle effects and interactions, and
the final sub-plot consisted of postmortem aging effects and aging interactions; the error
term for the final subplot consisted of vitamin D, biological type, and muscle nested
within pen and aging treatment. For all the analyses, the experimental unit was a pen of
steers, and an a level of 5% was used. Data for the 4 X 3 factorial were analyzed
according to Steel and Torrie (1980) and means were separated with the pdiff option in
SAS using the GLM procedure of SAS (1994, SAS Inst. Inc., Gary, NC). When data
were analyzed as a split-plot or split-split-plot design, the pooled standard errors were
67

calculated according to Steel and Torrie (1980), and means were separated by the least
significant difference (LSD) method. Critical differences were calculated for the LSD by
calculating the Saiterthwaite degrees of freedom for the t values (Saiterthwaite, 1946).
For troponin T degradation analysis, the experimental unit consisted of a single
animal. Data were analyzed as a repeated measures design. The main plot consisted of
Uie four vitamin D3 treatments, and Uie error term was vitamin D treatment nested with
animal. The subplot consisted of postiuorteni aging time and the vitamin D by aging
treatment interaction. The error temi for Uie subplot was vitamin D nested within animal
and aging treatments. The standard errors of the means and mean separation were
performed as explained previously for the split-plot designs.
Results
Feedlot performance data were collected throughout the entire feeding time and
over the last 25 d on feed and are presented in Table 4. Average daily drymatter intake
and final BW were not affected by vitamin D3 treatments (P > 0.05). Average daily gain
during the last 25 d of feeding was decreased (P < 0.05) when steers were fed 5 million
lU of VITD daily although average drymatter intake was not significantly decreased by
any of the treatments averaged over all the last 25 d on feed. Feeding 5 million lU of
VITD/steer daily decreased (P < 0.01) drymatter intake on d 5, 7, and 8 of the VITD
feeding period (Figure 5). Because of the time required to convert vitamin D3 to the
biologically active form (1,25-dihydroxy-vitamin D3), it should be expected VITD
supplementation would not negatively impact feed intake until d 3 to 5 of
68
supplementation. Therefore, supplementing cattle with 5 million lU/head over 6
consecutiv e d decreased drymatter intake, but all other VITD treatments did not affect
dry matter intake and feedlot performtuice.
Supplementing steers wiUi .5 million lU/steer daily increased (P < 0.05) plasma
concentiations of Ca'* on d 4 and 6 of treatment (Figure 6). Calcium concentrations also
were increased on d 6 and at slaughter by supplementing steers with 1 or 5 million
lU/steer daily of VITD. VITD at 1 and 5 million lU/steer daily increased (P < 0.05)
plasma P concentrations at d 6 of supplementation and at slaughter (Figure 7). Figures 6
and 7 indicate that supplemental VITD at 5 million lU/steer daily had the greatest effect
on increasing Ca"* and P
After slaughter, carcasses were chilled for 48 h, after which they were quality and
>ield graded. Although biological type had a number of effects on carcass traits, effects
of VITD (Table 5) were minimal. USDA quality and yield factors were not affected by
VITD supplementation, suggesting that improvements in beef tenderness as a result of
VITD supplementation can be made without adversely affecting economically important
carcass traits. Three-hour carcass temperature and 24-h longissimus pH were increased
(P < 0.05) by all VITD treatments (Table 5). Because Ca is a powerful primary and
second messenger, it is possible that the effects of VITD supplementation on carcass
temperature and pH are a result of increased cellular metabolism and glycogen
modulation. Vitamin D effects on carcass temperature and pH might also be a result of
affected metabolism differences leading to increased muscle degradation and improved
tendemess. Overall, the steers used in this experiment graded 69% Choice or higher and
69
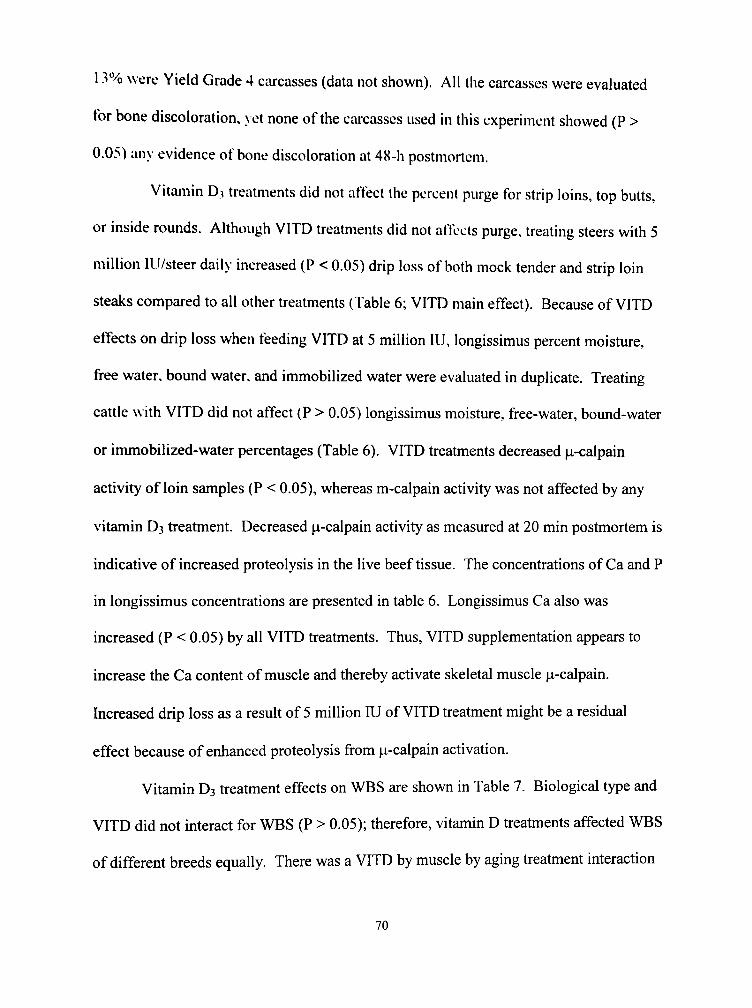
13% were Yield Grade 4 carcasses (data not shown). All the carcasses were evaluated
tor bone discoloration, \et none of the cai-casses used in this experiment showed (P >
0.05) any evidence of bone discoloration at 48-h postmortem.
Vitamin D3 treatments did not affect the percent purge for strip loins, top butts,
or inside rounds. Although VITD treatments did not affects purge, treating steers with 5
million lU/steer daily increased (P < 0.05) drip loss of both mock tender and strip loin
steaks compared to all other treatments (Table 6; VITD main effect). Because of VITD
effects on drip loss when feeding VITD at 5 million lU, longissimus percent moisture,
free water, bound water, and immobilized water were evaluated in duplicate. Treating
cattle with VITD did not affect (P > 0.05) longissimus moisture, free-water, bound-water
or immobilized-water percentages (Table 6). VITD treatments decreased ^-calpain
activity of loin samples (P < 0.05), whereas m-calpain activity was not affected by any
vitamin D3 treatment. Decreased i^-calpain activity as measured at 20 min postmortem is
indicative of increased proteolysis in the live beef tissue. The concentrations of Ca and P
in longissimus concentrations are presented in table 6. Longissimus Ca also was
increased (P < 0.05) by all VITD treatments. Thus, VITD supplementation appears to
increase the Ca content of muscle and thereby activate skeletal muscle |j,-calpain.
Increased drip loss as a result of 5 million lU of VITD treatment might be a residual
effect because of enhanced proteolysis from |a-calpain activation.
Vitamin D3 treatment effects on WBS are shown in Table 7. Biological type and
VITD did not interact for WBS (P > 0.05); therefore, vitamin D treatments affected WBS
of different breeds equally. There was a VITD by muscle by aging treatment interaction
70

(P = 0.04) for WBS. Supplementing steers with .5, 1, or 5 million lU/steer/daily
decreased (P < .05) longissimus lumborum WBS at 7. 10, 14 and 21 d postmortem
compared with controls. Longissimus lumborum WBS at 3 d postmortem also was
decreased by 1 and 5 million lU VITD treatments (P < .05). Vitamin D3 at .5, 1, and 5
million lU/steer daily decreased seminienibranosus WBS at 3, 7, and 14 d postmortem (P
< .05). and Uie .5 and 1 million lU levels decreased (P < .05) semimembranosus WBS at
21 d postinortem. The 5 million lU/steer daily of VITD decreased (P < .05)
semimembranosus WBS at 10 d postmortem compared with controls
Gluteus medius WBS was decreased at 3 d postmortem when steers were fed .5
million lU/steer daily, and 14-d postmortem WBS was decreased when steers were fed 5
million lU/steer daily (P < .05). By d 21 postmortem, there was no significant decrease
in WBS as a result of VITD treatment in gluteus medius steaks. Supraspinatus WBS was
not decreased (P > .05) by any VITD treatment on d 7, 10, 14, and 21 postmortem
compared with controls, however, WBS was less (P < 0.05) at 3 d postmortem when
steers were fed .5 million lU/steer daily. In general, improvements in WBS as a result of
VITD were largest in longissimus lumbomm steaks. Vitamin D3 treatments decreased
WBS approximately 1 kg in longissimus lumborum steaks and .5 to 1 kg in
semimembranosus steaks. Treatment effects in supraspinatus steaks were generally
inconsistent. Of the VITD treatments tested, the .5 million lU/steer daily of VITD was
the only treatment that improved WBS in all four muscles tested. Vitamin D3 could be
very useful to the beef industry because it will impact the entire carcass and muscles from
all major primal cuts.
71
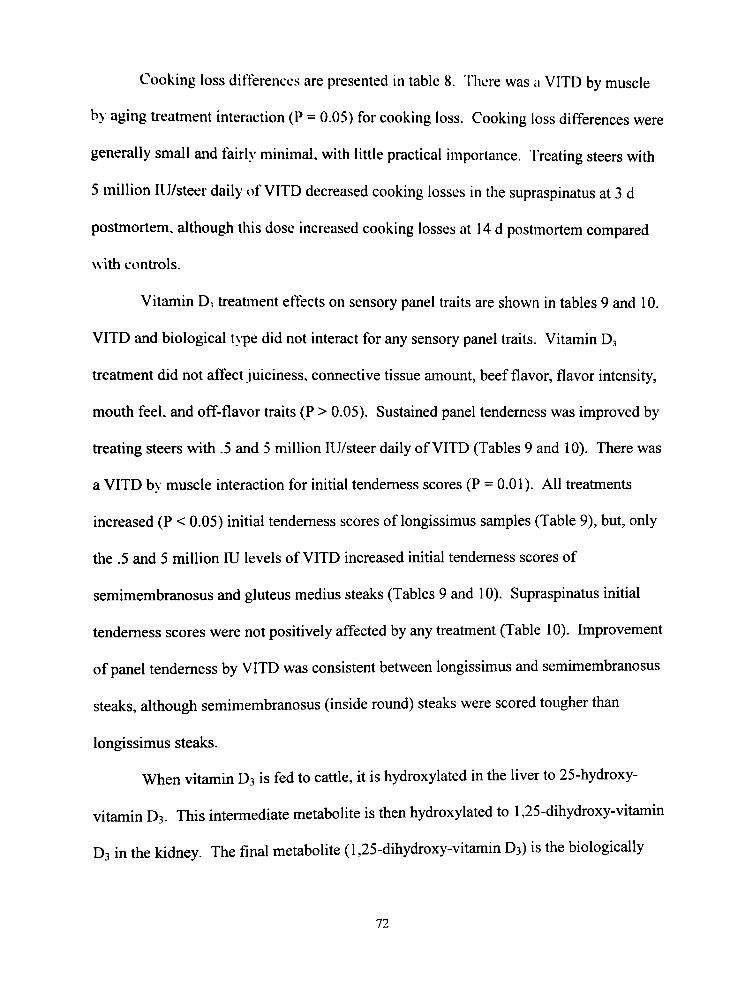
Cooking loss differences are presented in table 8. There was a VITD by muscle
by aging treatment interaction (P = 0.05) for cooking loss. Cooking loss differences were
generally small and fairh' minimal, with little practical importance. Treating steers with
5 million lU/steer daily of VITD decreased cooking losses in the supraspinatus at 3 d
postmortem, although this dose increased cooking losses at 14 d postmortem compared
with controls.
Vitamin D, treatment effects on sensory panel traits are shown in tables 9 and 10.
VITD and biological tvpe did not interact for any sensory panel traits. Vitamin D,
treatment did not affect juiciness, connective tissue amoimt, beef flavor, flavor intensity,
mouth feel, and off-flavor traits (P > 0.05). Sustained panel tenderness was improved by
treating steers with .5 and 5 million lU/steer daily of VITD (Tables 9 and 10). There was
a VITD b> muscle interaction for initial tendemess scores (P = 0.01). All treatments
increased (P < 0.05) initial tendemess scores of longissimus samples (Table 9), but, only
the .5 and 5 million lU levels of VITD increased initial tendemess scores of
semimembranosus and gluteus medius steaks (Tables 9 and 10). Supraspinatus initial
tendemess scores were not positively affected by any treatment (Table 10). Improvement
of panel tendemess by VITD was consistent between longissimus and semimembranosus
steaks, although semimembranosus (inside round) steaks were scored tougher than
longissimus steaks.
When vitamin D3 is fed to cattle, it is hydroxylated in the liver to 25-hydroxy-
vitamin D3. This intermediate metabolite is then hydroxylated to 1,25-dihydroxy-vitamin
D3 in the kidney. The final metabolite (1,25-dihydroxy-vitamin D3) is the biologically
72
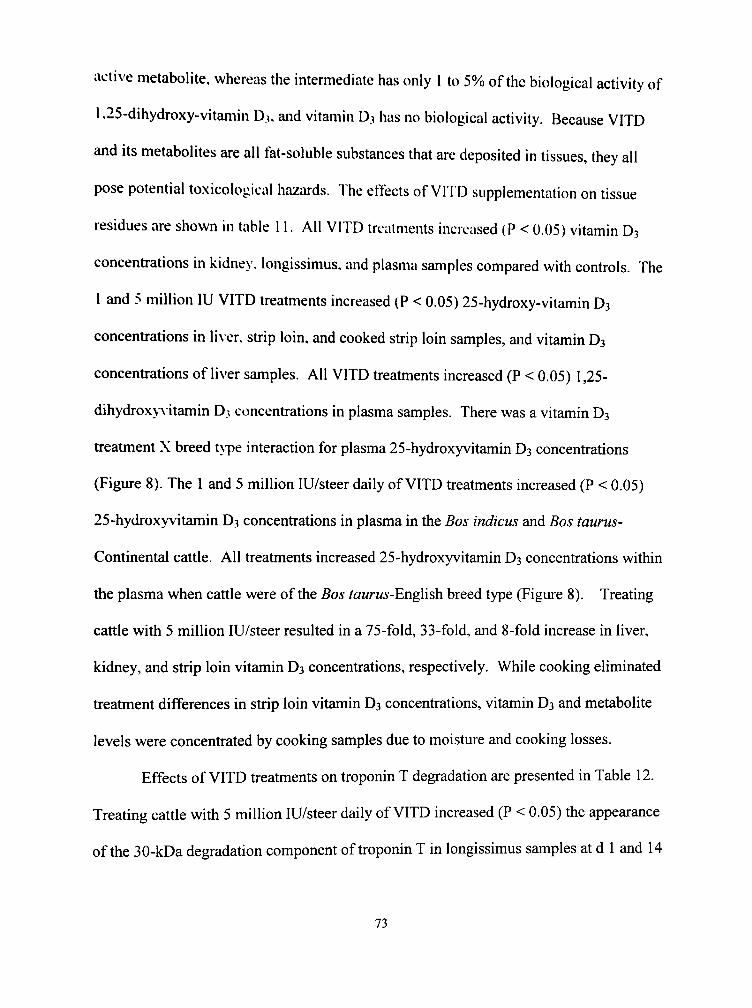
active metabolite, whereas the intermediate has only 1 to 5% of the biological activity of
1,25-dihydroxy-vitamin D3, and vitamin D3 has no biological activity. Because VITD
and its metabolites are all fat-soluble substances that are deposited in tissues, they all
pose potential toxicological hazards. The effects of VITD supplementation on tissue
residues are shown in table 11. All VITD treatments increased (P < 0.05) vitamin D3
concentrations in kidney, longissimus, and plasma samples compared with controls. The
1 and 5 million lU VITD treatments increased (P < 0.05) 25-hydroxy-vitamin D3
concentrations in liver, stt-ip loin, and cooked stiip loin samples, and vitamin D3
concentrations of liver samples. All VITD tt-eatinents increased (P < 0.05) 1,25-
dihydroxv-vitamin D3 concentrations in plasma samples. There was a vitamin D3
treatment X breed tvpe interaction for plasma 25-hydroxyvitamin D3 concentrations
(Figure 8). The 1 and 5 million lU/steer daily of VITD treatments increased (P < 0.05)
25-hydroxyvitamin D3 concentiations in plasma in the Bos indicus and Bos taurus-
Continental cattle. All treatments increased 25-hydroxyvitamin D3 concentrations within
the plasma when cattle were of the Bos toMrM.s-English breed type (Figure 8). Treating
cattle with 5 million lU/steer resulted in a 75-fold, 33-fold, and 8-fold increase in liver,
kidney, and strip loin vitamin D3 concentrations, respectively. While cooking eliminated
freatment differences in strip loin vitamin D3 concentrations, vitamin D3 and metabolite
levels were concenfrated by cooking samples due to moisture and cooking losses.
Effects of VITD treatments on troponin T degradation are presented in Table 12.
Treating cattle with 5 million lU/steer daily of VITD increased (P < 0.05) the appearance
of the 30-kDa degradation component of troponin T in longissimus samples at d 1 and 14
73
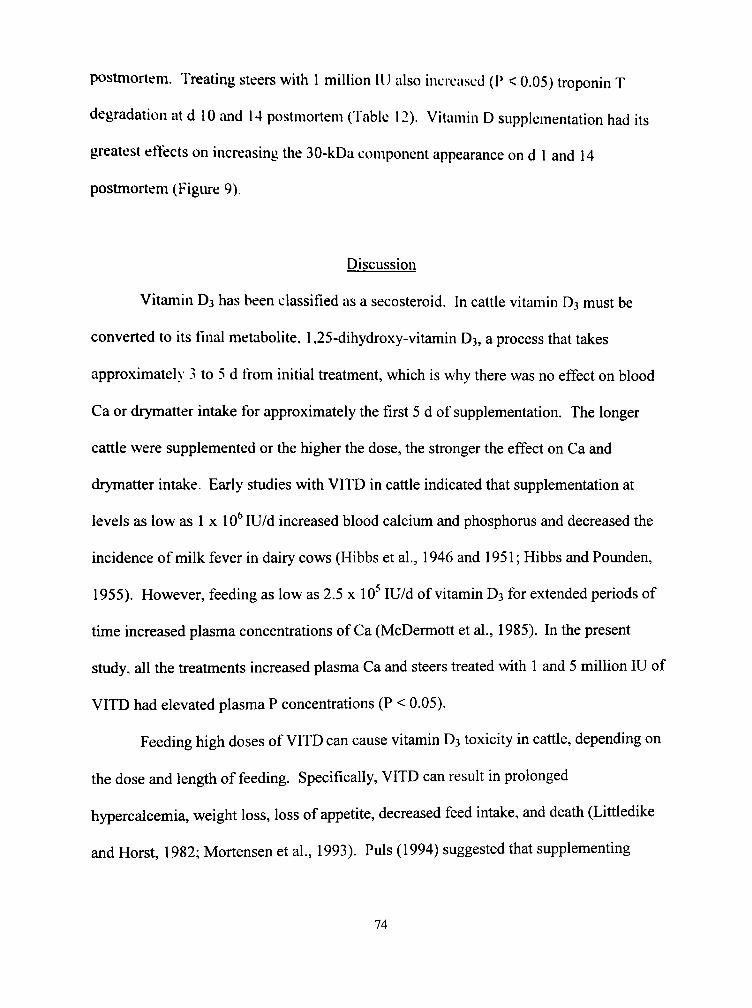
postmortem. Treating steers with 1 million lU also increased (P < 0.05) troponin T
degradation at d 10 and 14 postmortem (Table 12). Vitamin D supplementation had its
greatest effects on increasing the 30-kDa component appearance on d 1 and 14
postmortem (Figure 9).
Discussion
Vitamin D3 has been classified as a secosteroid. In cattle vitamin D3 must be
converted to its final metabolite. 1,25-dihydroxy-vitamin D3, a process that takes
approximatelv' 3 to 5 d from initial freatment, which is why there was no effect on blood
Ca or drymatter intake for approximately the first 5 d of supplementation. The longer
cattle were supplemented or the higher the dose, the stronger the effect on Ca and
drymatter intake. Early studies with VITD in cattle indicated that supplementation at
levels as low as 1 x 10^ lU/d increased blood calcium and phosphoms and decreased the
incidence of milk fever in dairy cows (Hibbs et al., 1946 and 1951; Hibbs and Pounden,
1955). However, feeding as low as 2.5 x 10 lU/d of vitamin D3 for extended periods of
time increased plasma concentrations of Ca (McDermott et al., 1985). In the present
study, all the treatments increased plasma Ca and steers treated with 1 and 5 million lU of
VITD had elevated plasma P concentrations (P < 0.05).
Feeding high doses of VITD can cause vitamin D3 toxicity in cattle, depending on
the dose and length of feeding. Specifically, VITD can resuh in prolonged
hypercalcemia, weight loss, loss of appetite, decreased feed intake, and death (Littledike
and Horst, 1982; Mortensen et al., 1993). Puis (1994) suggested that supplementing
74

cattle with 1 to 2 million lU of VITD/animal daily could result in toxicity. In an
experiment using the rat as a model, Beckman et al. (1995) found supplementing
excessive levels of VITD increased expression of the vitamin D receptor, and increased
concentiations of plasma Ca^* and decreased levels of 1,25-(01I)2 D3.
In the present study, we found that feeding 5 million lU/steer daily of VITD
decreased drvmatter intake on d 7 and 8 of supplementation. Feeding a higher dose or
increasing the time of feeding would likely have increased the intensity of this response.
Vitamin D3 supplementation did not affect any quality or grade factor, but it improved
beef tendemess. This means producers can feed certain levels of VITD to improve beef
tendemess without negativ eh impacting economically important traits such as USDA
quality and Yield Grades and feedlot performance when cattle are fed .5 million lU daily
of VITD. It is important to note because of the possible impacts on feed intsike, and
average daily gain during VITD supplementation, that if cattle are supplemented 5
million lU/steer or higher doses of VITD, or supplemented VITD for longer than 8 days
before slaughter, hot carcass weights could be negatively affected, and dry matter intake
and ADG could be adversely affected by VITD treatment. Karges et al. (1999) found
that VITD supplementation decreased hot carcass weights when the cattle were fed 6 x
10^ lU/animal daily for 4 or 6 d. This decrease in hot carcass weight was probably a
resuh of decreased feed intake and growth that has been previously noted (Karges et al.,
1998; Montgomery et al., 2001a). hi the present study supplementing 5 million lU of
VITD decreased ADG .39 kg/d and supplementing steers 1 million lU of VITD decreased
ADG .20 kg/d compared to controls. Therefore, the results from the present research
75
show that cattle can be supplemented with .5 million Ill/steer daily of VTTD to enhance
the tenderness of muscles in all major wholesale cuts without atlveiselv affecting live
weight, carcass traits, or feedlot perTormanec.
\ Itamin D, supplementation increased carcass lempeiature, pll, and muscle Ca,
while decreasing p-calpain aelivitv. The calpains are eviosolie enzymes that degrade
myofibrillar proteins at or near the Z-line of the nuisele sarcomere. This effect leads to
postmortem tenderization of beef It seems that vitamin D, supplementation increases
muscle Ca and activates |.i-calpain in the live muscle, which results in increased muscle
degradation of troponin T noted in the present study and previously (Montgomery et al.,
2000). This increased protein degradation apparently led to improved shear force and
sensor) panel tenderness. Increased proteolysis as a result of VITD treatment could
potentially explain increases carcass temperature and pH and drip loss noted with added
VITD. \'itamin D, supplementation had its greatest effects on improving the tendemess
of longissimus steaks. The longissimus muscle is known as one of the most
proteolytically active muscles in a carcass (Koohmaraie et al., 1988b; Ouali and Talmant,
1990; Kim et al., 1993). The lack of treatment effects on the tenderness of supraspinatus
steaks can be most likelv explained by the high amount of connective tissue found within
this muscle.
Vitamin D, supplementation significantly increased vitamin D3 concentrations in
muscle, kidney, and plasma samples, although cooking eliminated differences in muscle.
In particular, the 1 million and 5 million lU/steer daily treatments significantly increased
liver vitamin D3 residues. Because of the elevated residues as a result of supplementing
76

cattle at a divsc of 1 million lU steer or higher for S d. producers should be discouraged
from using this rate of supplementation hecau.se of possible toxicological hazards.
Monlgoniery et al. (2000 and 2()01a) also noted WVVD supplementation dramatically
increased tissue residues oTthat \TTD and its metabolites when a high level of 5 million
11) or higher was fed. feeding .5 million lU/steer prevented increased vitamin D,
concentrations in the liver, which is oTprimarv concern Tor the U.S. Food and Drug
.Administration. The current studv is the first to indicate that kidneys should be
eliminated from the food chain for all \'l TD-treated cattle because of potential
toxicological hazards, fhese data indicate that livers pose no toxicological hazard when
cattle were fed .5 million lU. although feeding 1 million lU/steer and higher increased the
potential toxicological hazard in raw samples. Meat samples were all in safe levels of
recommended daily allowances regardless of vitamin D treatment (NRC, 1989).
High levels of \ 'ITD in the diet can be toxic to both cattle and humans. The
recommended dietarv allowance of VITD for a normal aduh human is 200 lU/d, which is
5 ).ig (NRC, 1989). At this rate, an adult would need to eat 111 g of steak, 12 g of kidney,
or 5 g of liver from steers treated with 5 million lU of VITD per day to meet their daily
needs for this nutrient. Consumption of as little as 45 |ag of VITD per day has been
associated with signs of VITD toxicity in young children (AAP. 1963). At this rate, it
would take as little as 45 g of liver or an entire kilogram of striploin from treated cattie (5
million lU treated) to deliver a potential toxic dose of VITD. A more recent study found
that the minimum dose required to cause toxicity was 1,250 ig of VITD (Miller and
Hayes, 1982). At this level, none of the meat or liver samples would pose a serious
77
toxicological hazard. It also is important to note that the above toxicological hazards are
expressed on a wet tissue basis. Because cooking apparently disrupts the concentrations
of VITD and its metabolites, the potential tissue residue hazards may be further reduced
by cooking. Assessment of toxicological hazards in tissues from VTTD-treated cattle is
further complicated by results suggesting that the dietary allowances are grossly
underestimated and should be increased to at least 250 |Lig/d for adults (Vieth, 1999).
Because of the complications associated with calculating toxicological hazards associated
with VITD, determining the overall hazard of supplementing cattle with VITD is
problematical.
The metabolite 1,25-dihydroxy-vitamin Dj fimctions as other steroids (e.g.,
auigrogens and esfrogens) and elicits its response in muscle through a receptor
mechanism. Treating steers with .5 million lU daily increased plasma concentrations of
Ca, calpain activity, and Ca within muscle. Beef tenderness also was improved by this
freatment to some degree in every muscle sampled. Therefore, it seems supplementing
steers with .5 million lU/steer of VITD can modulate calpain activity and Ca metabolism
in muscle. These results indicate that oral supplementation with VITD of .5 million
lU/steer daily for eight consecutive days before slaughter improved WBS in longissimus
and semimembranosus steaks by affecting Ca metabolism and i^-calpain activity, but only
had a minor effect on tissue residues and no adverse effects on feedlot performance.
78
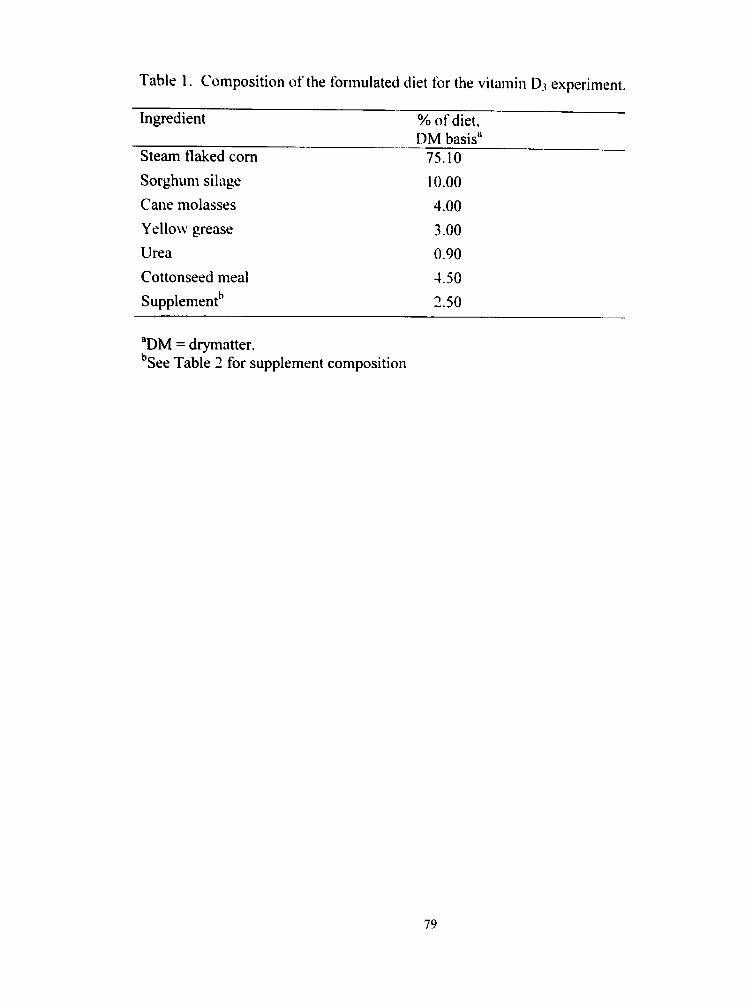
Table 1. Composition of the formulated diet for the vitamin D3 experiment.
Ingredient % of diet, DM basis"
Steam flaked corn 75.10
Sorghimi silage 10.00
Cane molasses 4.00
Yellow grease 3.00
Urea 0.90
Cottonseed meal 4.50
Supplement*' 2.50
^DM = drymatter. ''See Table 2 for supplement composition
79
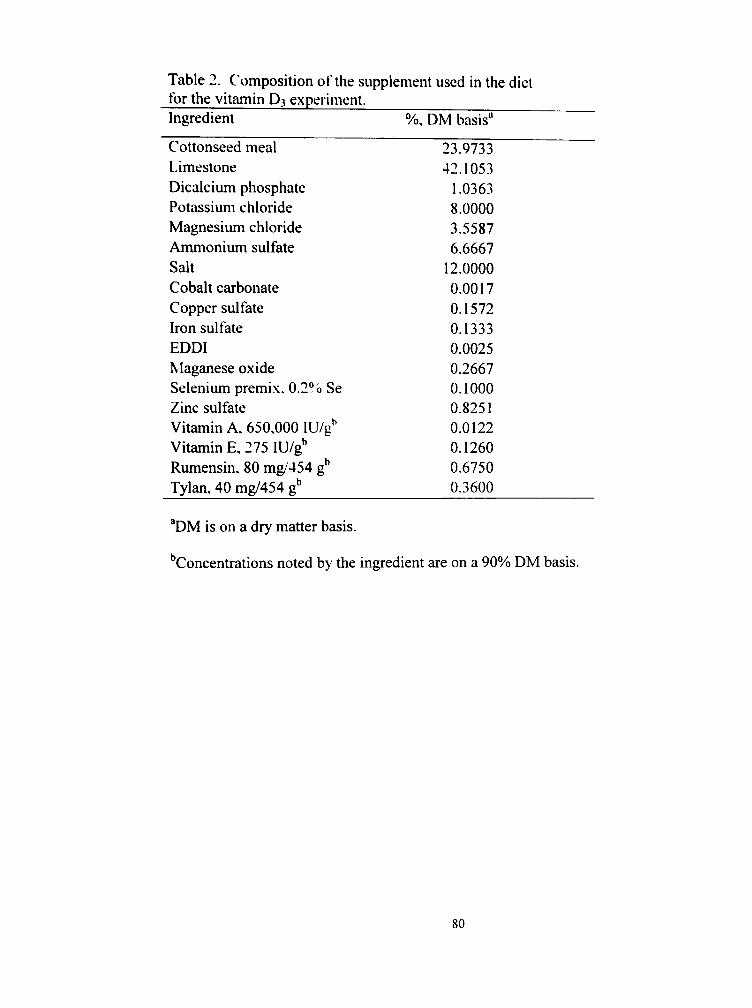
Table 2. Composition of the supplement used in the diet for the vitamin D3 experiment. Ingredient %, DM basis"
Cottonseed meal Limestone Dicalcium phosphate Potassium chloride Magnesium chloride Ammonium sulfate Salt Cobalt carbonate Copper sulfate Iron sulfate EDDI Maganese oxide Selenium premix. 0.2°o Se Zinc sulfate Vitamin A, 650,000 lU/g" Vitamin E, 275 lU/g*" Rumensin. 80 mg/454 g'' Tylan, 40 mg/454 g''
23.9733 42.1053
1.0363 8.0000 3.5587 6.6667
12.0000 0.0017 0.1572 0.1333 0.0025 0.2667 0.1000 0.8251 0.0122 0.1260 0.6750 0.3600
^DM is on a dry matter basis.
''Concentrations noted by the ingredient are on a 90% DM basis.
80

Table 3. Actual diet nutrient summary for the vitamin D3 experiment.
Item DM, % CP, %" Ash, %' Ca, %" P, %" Acid detergent fiber, °0'
Values before Treatments
65.1 11.55 4.11 0.47 0.24 6.30
Vitamin D3 Treatments (10" lU/Steer
Control
64.4 12.64 5.29 0.57 0.27 5.96
Daily) 0.5
66.4 12.22 4.56 0.58 0.27 5.67
I.O
64.7 13.17 5.44 0.67 0.31 9.13
5.0
64.7 12.65 4.56 0.56 0.28 6.44
Table 4. The effect of feeding Vitamin D3 to feedlot steers for eight consecutive days before slaughter on feed:gain, average daily gain, average daily drymatter intake
measured during the last 25 days of the feeding trial.
Initial Average Daily Gain, kg Final Average Daily Gain, kg Feed:Gain, (DMB, kg) "*
Average Daily Feed Intake, kg hiitial BW. kg
Final BW, kg
Confrol 1.39"
1.49"
2.24*'
7.10
534.7
570.3
Vitamin D3 0.5
1.44"
1.41"
2.67""
7.41
544.7
578.8
Treatment 1
1.59"
1.29""
3.34"
7.21
552.9
583.8
(10* lU/Steer 5
1.52""
1.10''
2.46""
6.99
547.4
573.7
Daily) SEM' 0.05
0.09
0.31
0.14
7.5
7.8
~^^Means in the same row with different superscripts differ (P < 0.05). ' SEM = standard error of the mean. ^ Means in the same row with different superscripts differ (P < 0.10). *DMB = Dry matter basis
81
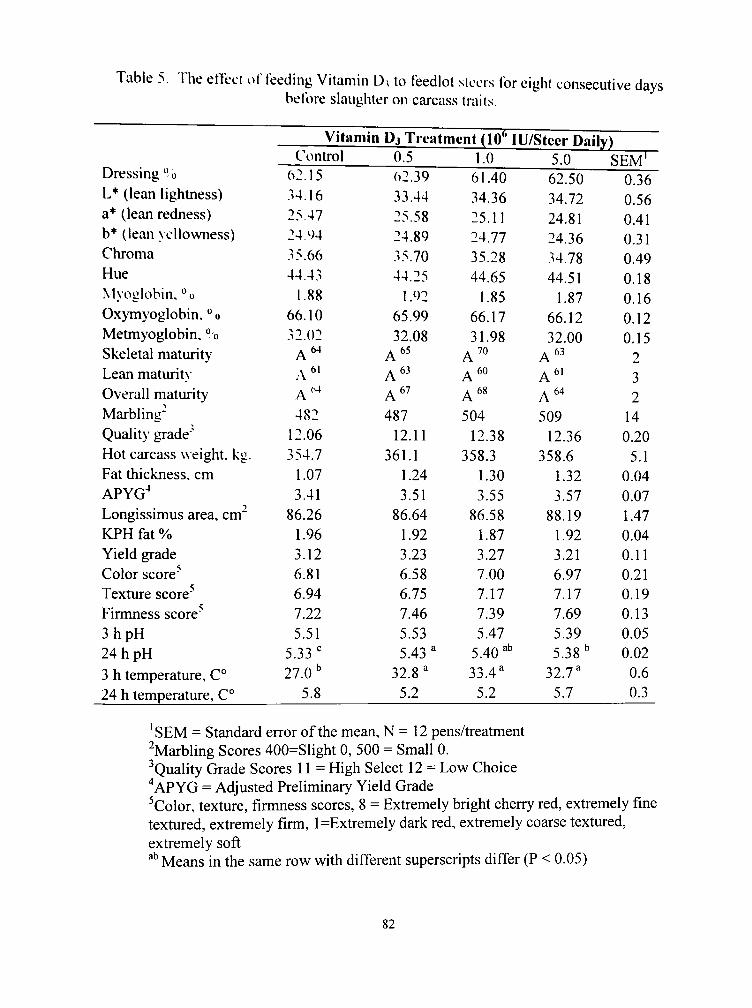
Table 5. The effect of feeding Vitamin Di to feedlot steers for eight consecutive days before slaughter on carcass traits.
Dressing "o L* (lean lightness) a* (lean redness) b* (lean vellowness) Chroma Hue Myoglobin, "o Oxymyoglobin." o Metmyoglobin." o Skeletal maturity Lean maturity Overall maturity Marbling" Quality grade' Hot carcass weight, kg. Fat thickness, cm APYG^ Longissimus area, cm^ KPH fat % Yield grade Color score^ Texture score" Firmness score" 3hpH 24hpH 3 h temperature, C° 24 h temperature, C°
'SEM = Standard
Vitamin Dj Treatment dO'' lU/Steer Daily) Control
62.15 34.16 25.47 24.94 35.66 44.43
1.88 66.10 32.02
^ 6 4
A^' A"^ 482
12.06 354.7
1.07 3.41
86.26 1.96 3.12 6.81 6.94 7.22 5.51
5.33' 27.0"
5.8
0.5 62.39 33.44 25.58 24.89 35.70 44.25
1.92 65.99 32.08
A^^ A " A " 487
12.11 361.1
1.24 3.51
86.64 1.92 3.23 6.58 6.75 7.46 5.53 5.43"
32.8" 5.2
1.0 61.40 34.36 25.11 24.77 35.28 44.65
1.85 66.17 31.98
A ° ^ 6 0
^ 6 8
504 12.38
358.3 1.30 3.55
86.58 1.87 3.27 7.00 7.17 7.39 5.47
5.40 "" 33.4"
5.2
error of the mean, N = 12 pens/treatment ^Marbling Scores 400=Slight 0, ^Quality Grade Sc
500 = Small 0. ores 11 = High Select 12 = Low Choice
5.0 ! 62.50 34.72 24.81 24.36 34.78 44.51
1.87 66.12 32.00
A " A^' ^ 6 4
509 12.36
358.6 1.32 3.57
88.19 1.92 3.21 6.97 7.17 7.69 5.39 5.38"
32.7" 5.7
5EM' 0.36 0.56 0.41 0.31 0.49 0.18 0.16 0.12 0.15
2 3 2
14 0.20
5.1 0.04 0.07 1.47 0.04 0.11 0.21 0.19 0.13 0.05 0.02 0.6 0.3
' APYG = Adjusted Preliminary Yield Grade ^Color, texture, firmness scores, 8 = Extremely bright cherry red, extremely fine textured, extremely firm, l=Extremely dark red, extremely coarse textured, extremely soft ab Means in the same row with different superscripts differ (P < 0.05)
82
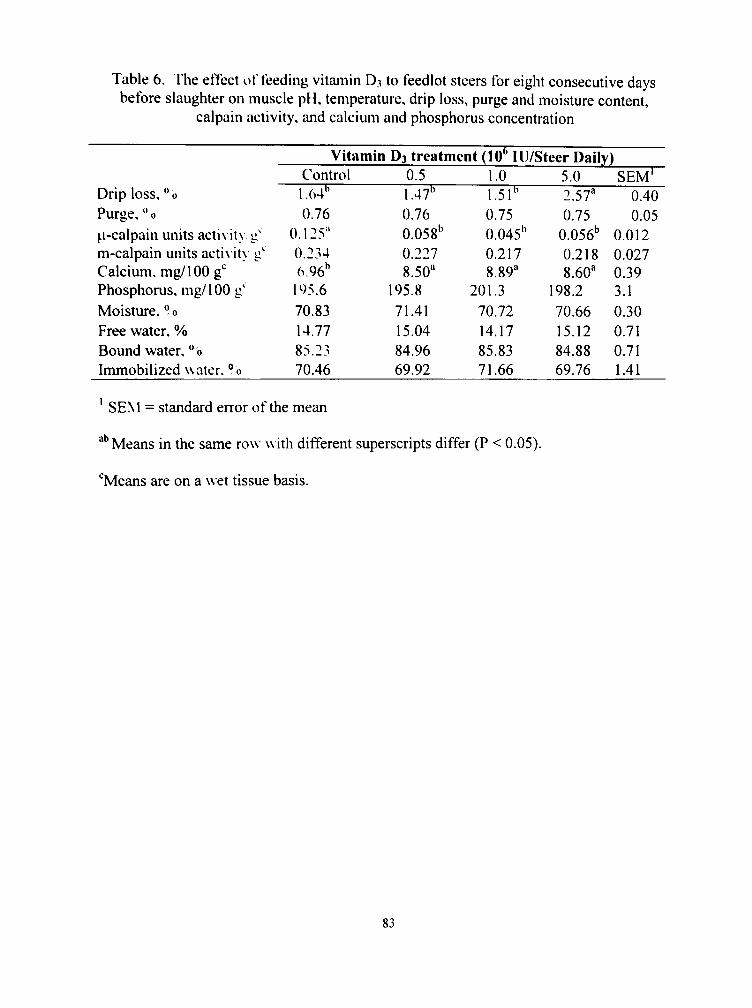
Table 6. The effect of feeding vitamin D3 to feedlot steers for eight consecutive days before slaughter on muscle pH, temperature, drip loss, purge and moisture content,
calpain activity, and calcium and phosphorus concentration
Drip loss," 0 Purge," 0 |.i-calpain units activ it> g' m-calpain units activ ity g' Calcium, nig/IOO g* Phosphorus, iiig/100 g' Moisture, °o Free water. % Bound water." b Immobilized w ater. " 0
Vitamin Dj treatment (lO* llJ/Steer Daily) Control 1.64" 0.76
0.125" 0.234 6.96"
195.6 70.83 14.77 85.23 70.46
0.5 1.47" 0.76 0.058" 0.227 8.50"
195.8 71.41 15.04 84.96 69.92
1.0 1.51" 0.75 0.045" 0.217 8.89"
201.3 70.72 14.17 85.83 71.66
5.0 2.57" 0.75
0.056" 0.218 8.60"
198.2 70.66 15.12 84.88 69.76
SEM' 0.40 0.05
0.012 0.027 0.39 3.1 0.30 0.71 0.71 1.41
' SEM = standard error of the mean
"" Means in the same row with different superscripts differ (P < 0.05).
•"Means are on a w et tissue basis.
83
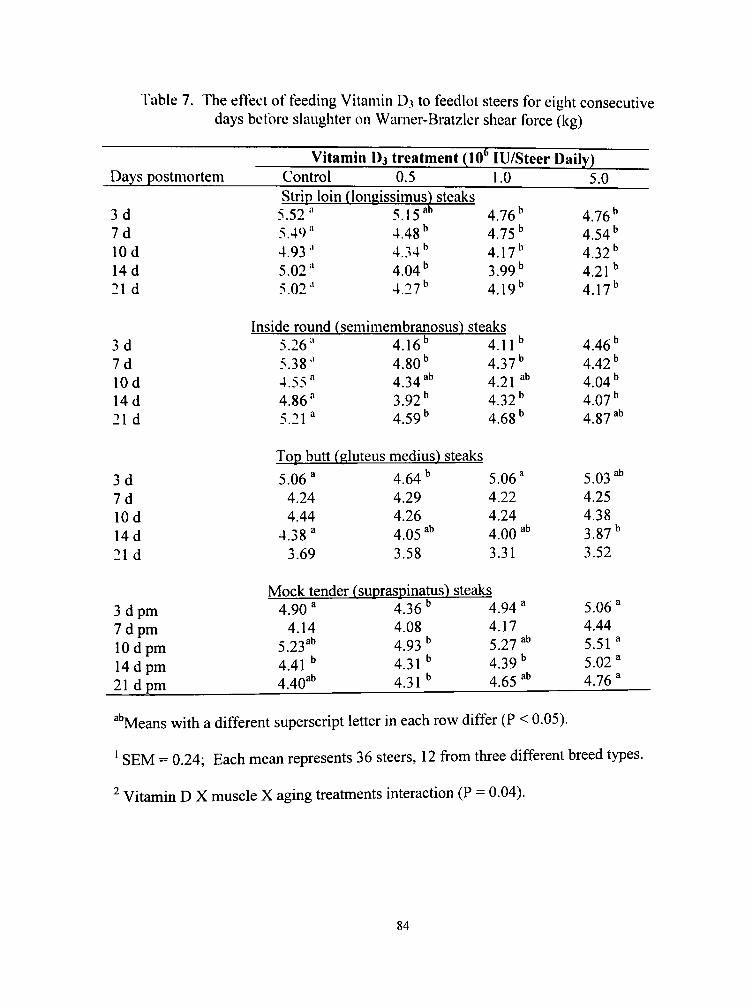
Table 7. The etfect of feeding Vitiuiiin D3 to feedlot steers for eight consecutive days before slaughter on Warner-Bratzler shear force (kg)
Days postmortem
3d 7d lOd 14 d 21 d
3d 7d lOd 14 d 21 d
3d 7d lOd 14 d 21 d
3 dpm 7 dpm 10 dpm 14 dpm 21 dpm
Vitamin Dj treatment (1[ Confrol 0.5 Strip loin (loneissimus) steaks
5.52" 5.49" 4.93 •' 5.02" 5.02"
5.15"" 4.48" 4.34" 4.04" 4.27"
1" lU/Stecr 1.0
4.76" 4.75" 4.17" 3.99" 4.19"
Inside round (semimembranosus) steaks 5.26" 5.38" 4.55" 4.86" 5.21"
4.16" 4.80 " 4.34"" 3.92" 4.59"
Top butt (gluteus medius) steaks
5.06" 4.24 4.44
4.38" 3.69
4.64" 4.29 4.26 4.05"" 3.58
4.11" 4.37" 4.21 "" 4.32" 4.68"
5.06" 4.22 4.24 4.00 "" 3.31
Mock tender (supraspinatus) steaks 4.90"
4.14 5.23"" 4.41" 4.40""
4.36" 4.08 4.93" 4.31" 4.31"
4.94" 4.17 5.27 "" 4.39" 4.65 ""
Daily) 5.0
4.76" 4.54" 4.32" 4.21" 4.17"
4.46" 4.42" 4.04" 4.07" 4.87""
5.03"" 4.25 4.38 3.87" 3.52
5.06" 4.44 5.51" 5.02" 4.76"
""Means with a different superscript letter in each row differ (P < 0.05).
' SEM = 0.24; Each mean represents 36 steers, 12 from three different breed types.
^ Vitamin D X muscle X aging treatments interaction (P = 0.04).
84

Table S. The elTecl oT feeding \itamin 1), to feedlot steers for eight con.secutive davs before slaughter on cooking loss (%)
Vitamin Dj treatment (10" Ill/Steer Daily) Davs Postmortem Control 0.5 | o 50
Strip loin Kvs: IS.31 16.0.> 1 7.03 IS. 3 )
(longissimus) steak 16.96 17.73 16.36 17.15 IS.14
Inside round (semimembianostis) -23.24 20.69
24.14"" 23.58 24.05
Top butt (ij
22.95 19.37 21.53
21.90"" 16.18
Mock tendei 26.28" 19.35
27.04^ 23.02''
22.49 26.92 24.91 " 23.08 23.63
gluteus medius) steal
22.66 20.68 20.37 23.43" 15.96
s 17.03 17.75 16.72 17.24 18.19
Ueaks 22.13 26.69 22.89" 24.46 24.56
vS
23.18 19.19 20.23 21.27" 16.30
• (supraspinatus) steaks 26.46" 18.77 28.27"" 22.16"
23.24" 19.80 29.67" 23.30""
17.02 16.79 17.08 17.10 18.47
22.35 26.97 22.96 "" 23.05 23.96
22.51 19.64 20.44 21.55"" 16.21
23.68" 19.58 28.95"" 25.20"
>d 7d lOd 14 d 21 d
7d lOd I4d 21 d
3d 7d lOd 14d 21 d
3d 7d lOd 14d 21 d 26.76 25.59 26.71 24.92
" Means with a different superscript letter in each row differ (P < 0.05).
SEM = 1.07; Each mean represents 36 steers, 12 from three different breed types.
^ Vitamin D X muscle X aging treatments interaction (P = 0.049).
85

Table 9. The effect of feeding Vitamin D3 to feedlot steers for eight consecutive days before slaughter on sensory traits of longissimus and semimembranosus
steaks aged to seven days postmortem.
Item
Initial juiciness' Sustained juiciness^ Initial tenderness" Sustained tendemess" Amount connective tissue" Beef flavor" Beef flavor intensity' Beef mouthfeel' Off-flavor^
Vitamin D3 treatment (10^ Control 0.5
Loin (loncissimus) steaks 5.45 5.47
4.8I" 4.87" 5.83 5.94 5.89 5.13 1.03
Inside round (semimembranosus) steaks
Initial juiciness Sustained juiciness' Initial tendemess Sustained tendemess"^ Amount connective tissue
Beef flavor^ Beef flavor intensity^ Beef mouthfeeP Off-flavor^
5.38 5.55
4.19" 4.29" 4.56
5.73 5.78 4.55 1.05
5.58 5.57 5.34" 5.39" 6.10 6.09 6.03 5.35 1.05
5.45 5.54 4.58" 4.77" 4.85 5.78 5.79 4.78 1.04
1.0 1
5.69 5.69 5.44" 5.42" 5.85 6.03 6.11 5.39 1.02
5.21 5.36 4.50"" 4.67"" 4.70 5.69 5.64 4.59 1.05
lU/Steer 5.0
5.54 5.66 5.63" 5.61" 6.07 6.10 5.97 5.53 1.06
5.54 5.66 4.60" 4.78"" 4.78 5.88 5.91 4.84 1.05
Daily) SEM'
0.08 0.07 0.20 0.14 0.14 0.05 0.05 0.13 0.02
0.08 0.07 0.20 0.14 0.14 0.05 0.05 0.13 0.02
^Juiciness, tendemess, connective tissue, flavor, flavor intensity, and mouthfeel scores are based on an 8 point scale, 1 = extremely dry, extremely tough, abundant, extremely uncharacteristic, exfremely bland, and extremely beef-like uncharacteristic, 8 -exfremely juicy, exfremely tender, none, extremely characteristic, extremely intense, and exfremely beef-like characteristic
3 Off-flavor scores were based on a 5 point scale, 1 = none, 2 = extremely off-flavor
"" Means in the same row with different superscripts differ (P < 0.05)
' Vitamin D X muscle interaction (P = 0.01) for initial tenderness. There was a vitam in D main effect (P = 0.04), but not a vitamin D muscle interaction (P =0.07) for sustained tendemess.
86
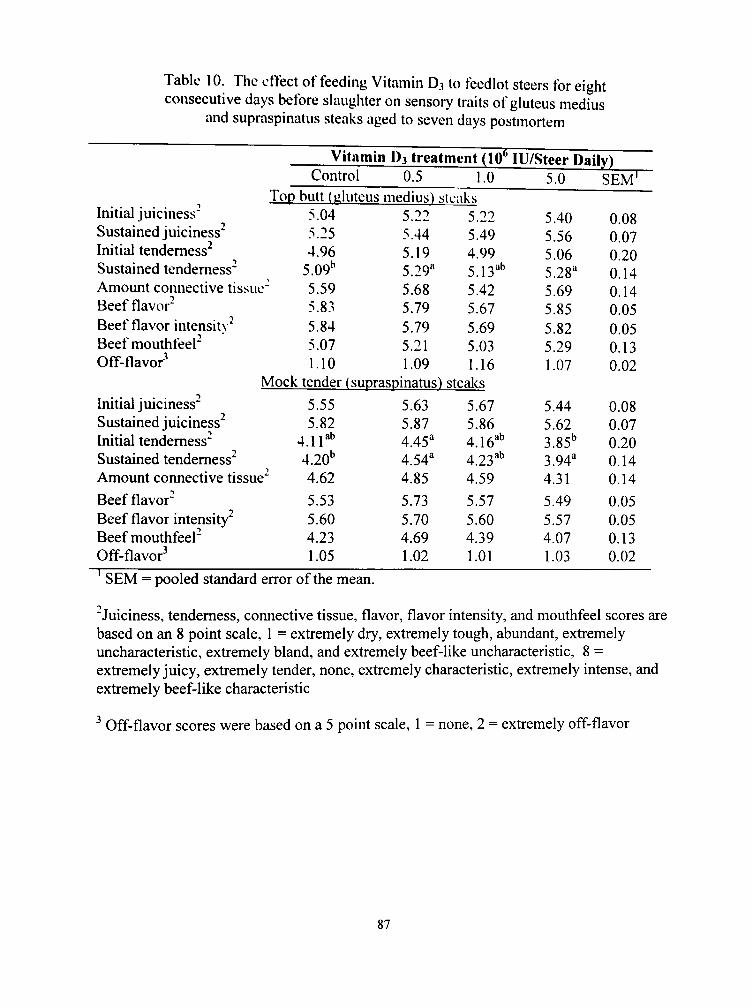
Table 10. The effect of feeding Vitamin D3 to feedlot steers for eight consecutive days before slaughter on sensory traits of gluteus medius
and supraspinatus steaks aged to seven days postmortem
Initial juiciness" Sustained juiciness' Initial tenderness' Sustained tendemess'
Vitamin Control
Top butt (tiluteus 5.04 5.25 4.96
5.09" Amount connective tissue" 5.59 Beef flavor" Beef flavor intensitv" Beef mouthfeel' Off-flavor''
Initial juiciness' Sustained juiciness Initial tendemess' Sustained tendemess'
5.83 5.84 5.07 1.10
11)3 treatment (lO'' 0.5 1.0
medius) steaks 5.22 5.44 5.19 5.29" 5.68 5.79 5.79 5.21 1.09
5.22 5.49 4.99 5.13"" 5.42 5.67 5.69 5.03 1.16
Mock tender (suprasoinatus) steaks
5.55 5.82
4.11"" 4.20"
Amount cormective tissue' 4.62 Beef flavor" Beef flavor intensity^ Beef mouthfeel" Off-flavor^
5.53 5.60 4.23 1.05
5.63 5.87 4.45" 4.54" 4.85
5.73 5.70 4.69 1.02
5.67 5.86 4.16"" 4.23"" 4.59
5.57 5.60 4.39 1.01
lU/Steer Daily) 5.0
5.40 5.56 5.06 5.28" 5.69 5.85 5.82 5.29 1.07
5.44 5.62 3.85" 3.94" 4.31
5.49 5.57 4.07 1.03
SEM'
0.08 0.07 0.20 0.14 0.14 0.05 0.05 0.13 0.02
0.08 0.07 0.20 0.14 0.14
0.05 0.05 0.13 0.02
SEM = pooled standard error of the mean.
"Juiciness, tendemess, cormective tissue, flavor, flavor intensity, and mouthfeel scores are based on an 8 point scale, I = extremely dry, extremely tough, abundant, extremely uncharacteristic, extremely bland, and extremely beef-like uncharacteristic, 8 = extremely juicy, extremely tender, none, extremely characteristic, extremely intense, and extremely beef-like characteristic
^ Off-flavor scores were based on a 5 point scale, 1 = none, 2 = extremely off-flavor
87

Table 11. The effect of feeding Vitamin D3 to feedlot steers for eight consecutive da>s before slaughter on vitamin D3, 25-hydroxy-vitamin D3, and 1,25-dihydroxy-\itaniin D3 concentrations in liver, kidney, strip loin and plasma samples
Tissue/Item Liver
Vitamin D3 ng/g 25-Hydroxy-vitaniin D3 ng/g 1,25-Dihydroxy-vitaniin D3 pg/g
Kidney Vitamin D3 ng/g 25-Hydroxy-vitaiiiin D3 ng/g 1,25-Dihydroxy-vitaniin D3 pg/g
Stiip loin (loneissimus) Vitamin D3 ng/g 25-Hydroxy-vitamin D3 ng/g 1.25-Dihydroxy-vitamin D3 pg/g
Strip loin cooked to 71°C Vitamin D3 ng/g 25-Hydroxy-vitamin D3 ng/g 1,25-Dihydroxy-vitaniin D3 pg/g
Plasma Vitamin D3 ng/mL 25-Hydroxy-vitamin D3 ng/mL 1,25-Dihydroxy-vitamin D3 pg/mL
Vitamin D3 treatment (10* Control
13.3' 0.8"
176.1""
p ^ ' L6"
67.6
5.3" 0.3*
152.1
22.3 0.4'
915.6
4.0" —
107.9'
.5
91.5'" 2.0'
162.0"
224.7 " 2.0"
58.7
12.8' 0.4 "'
157.2
20.4 0.5 '
893.4
146.3 ' —
143.3 "
1
196.0" 2.9"
209.2 "
261.1 " 2.0"
60.8
20.5" 0.6"
188.1
31.1 0.7"
1062.6
253.4" —
174.7"
lU/Steer 5
995.67" 6.9"
211.7"
405.2 " 5.1"
56.2
45.5" 1.2"
156.7
40.6 1.9"
1170.9
797.6" —
368.7"
Daily) SEM
45.2 0.3
13.1
32.2 0.5 5.0
2.5 0.1
17.5
8.9 0.1
122.7
24.2 —
11.8
"""* Means m the same row with different letters differ (P < 0.05)
-— indicates a Breed X Vitamin D3 treatment interaction
88
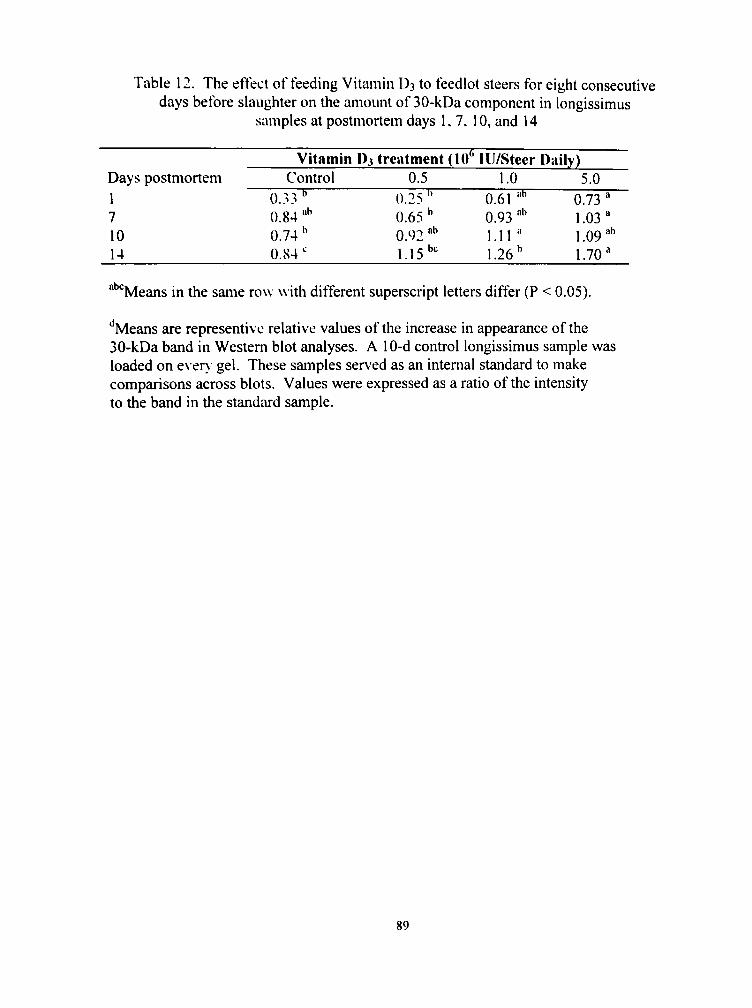
Table 12. The effect of feeding Vitamin D3 to feedlot steers for eight consecutive days before slaughter on the amount of 30-kDa component in longissimus
samples at postmortem days 1,7, 10, and 14
Days postmortem 1 7 10 14
Vitamin Control
0.33 " 0.84"" 0.74 " 0.84'
D3 treatment 0.5
0.25 " 0.65 " 0.92"" 1.15"'
(U)'' lU/Steer 1.0
0.61 "" 0.93 "" 1.11" 1.26"
Daily) 5.0
0.73" 1.03" 1.09"" 1.70"
""'Means in the same row with different superscript letters differ (P < 0.05).
"Means are representive relative values of the increase in appearance of the 30-kDa band in Western blot analyses. A 10-d control longissimus sample was loaded on ever>- gel. These samples served as an internal standard to make comparisons across blots. Values were expressed as a ratio of the intensity to the band in the standard sample.
89
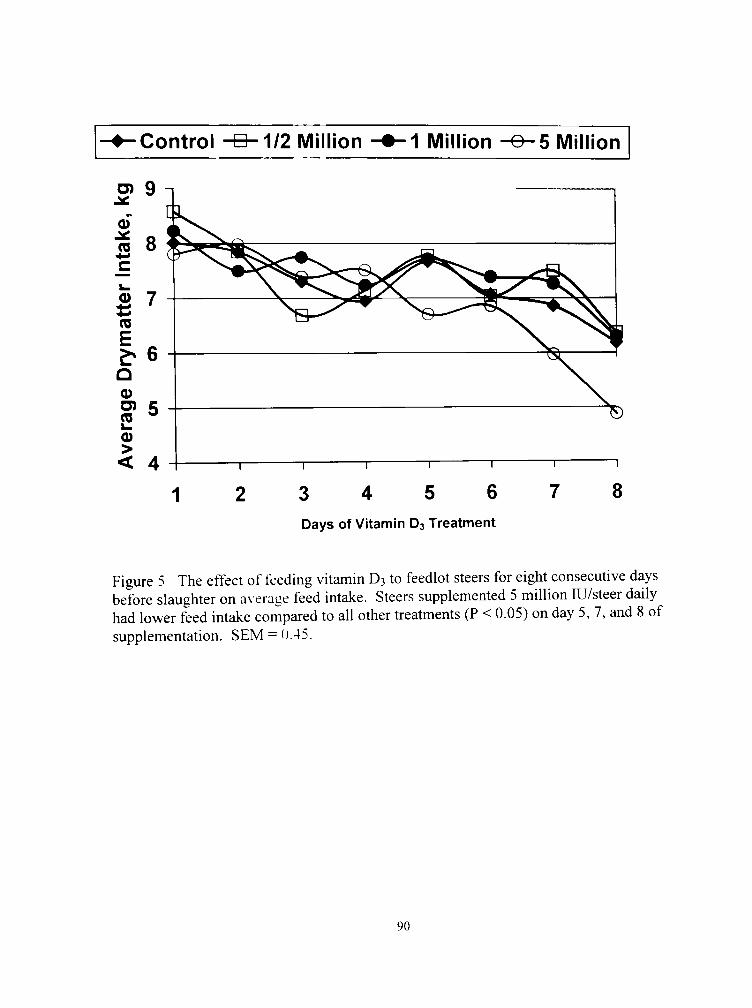
Control 1/2 Million 1 Million 5 Million
n r
3 4 5 6 Days of Vitamin D3 Treatment
Figure 5 The effect of feeding vitamin D3 to feedlot steers for eight consecutive days before slaughter on a\ erage feed intake. Steers supplemented 5 million lU/steer daily had lower feed intake compared to all other treatments (P < 0.05) on day 5, 7, and 8 of supplementation. SEM = 0.45.
90
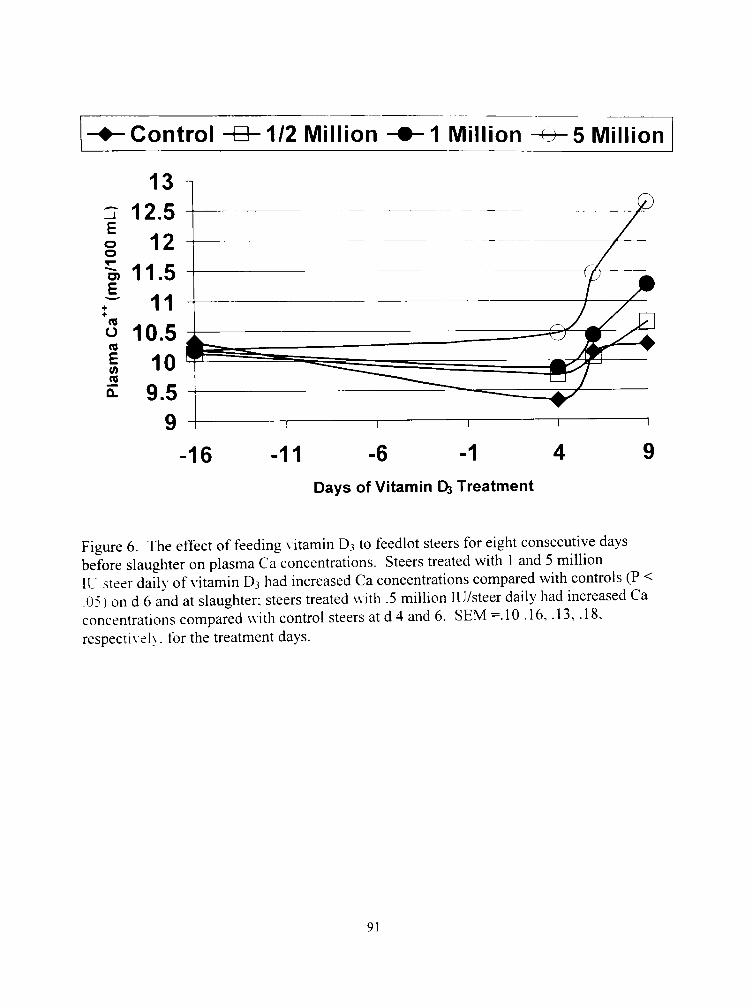
Control ^ - 1 / 2 Million 1 Million -^^5 Million
o o
+ +
(0 O re E (A iS Q.
-16 -11 -6 -1 Days of Vitamin D Treatment
Figure 6. The effect of feeding \itamin D3 to feedlot steers for eight consecutive days before slaughter on plasma Ca concentrations. Steers treated with 1 and 5 million IL" steer daily of vitamin D3 had increased Ca concentrations compared with controls (P < .05) on d 6 and at slaughter; steers treated with .5 million lU/steer daily had increased Ca concentrations compared with control steers at d 4 and 6. SEM =.I0 .16. .13, .18. respecti\ eh. for the treatment days.

Control 1/2 Million 1 Million Million
-16 -13 -10 -7 -4 -1 2
Days on Vitamin D Treatment
8
Figure 7. The effect of feeding \ itamin D3 to feedlot steers for eight consecutive days before slaughter on plasma P concentrations. Steers treated with 1 and 5 million lU/steer daily of vitamin D3 had increased P concentrations compared with controls and steers fed .5 million lU/steer daily (P < .05) on d 6 and at slaughter. SEM = .15, .34, .23, .21, respecti\ eh.
92
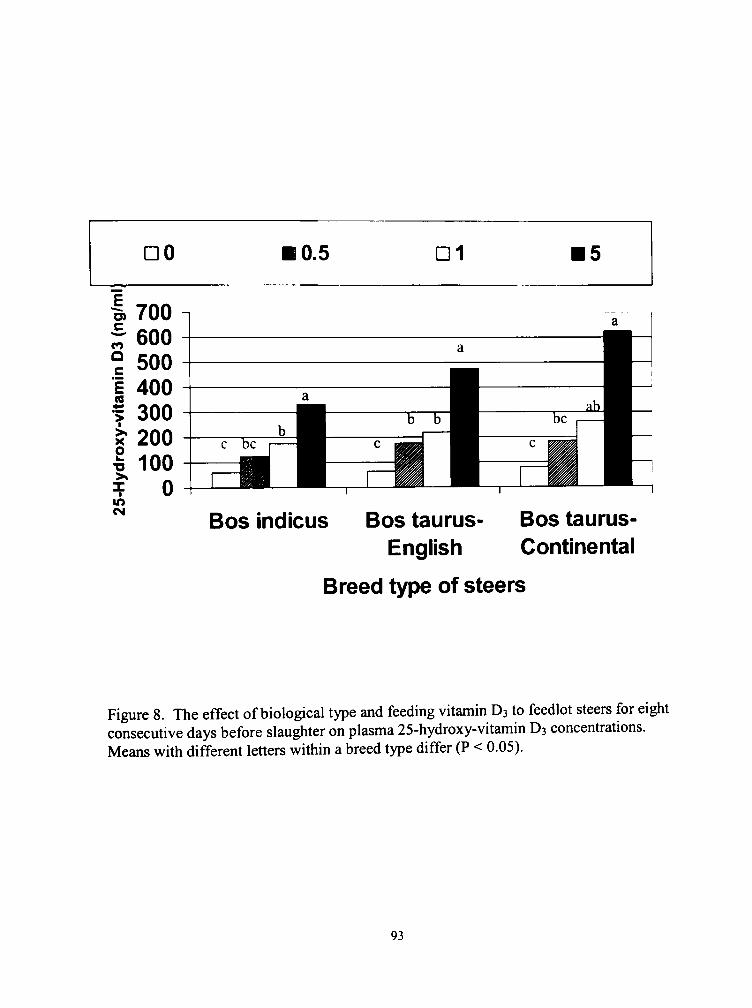
Bos indicus Bos taurus-English
Breed type of steers
Bos taurus-Continental
Figure 8. The effect of biological type and feeding vitamin D3 to feedlot steers for eight consecutive days before slaughter on plasma 25-hydroxy-vitamin D3 concentrations. Means with different letters within a breed type differ (P < 0.05).
93
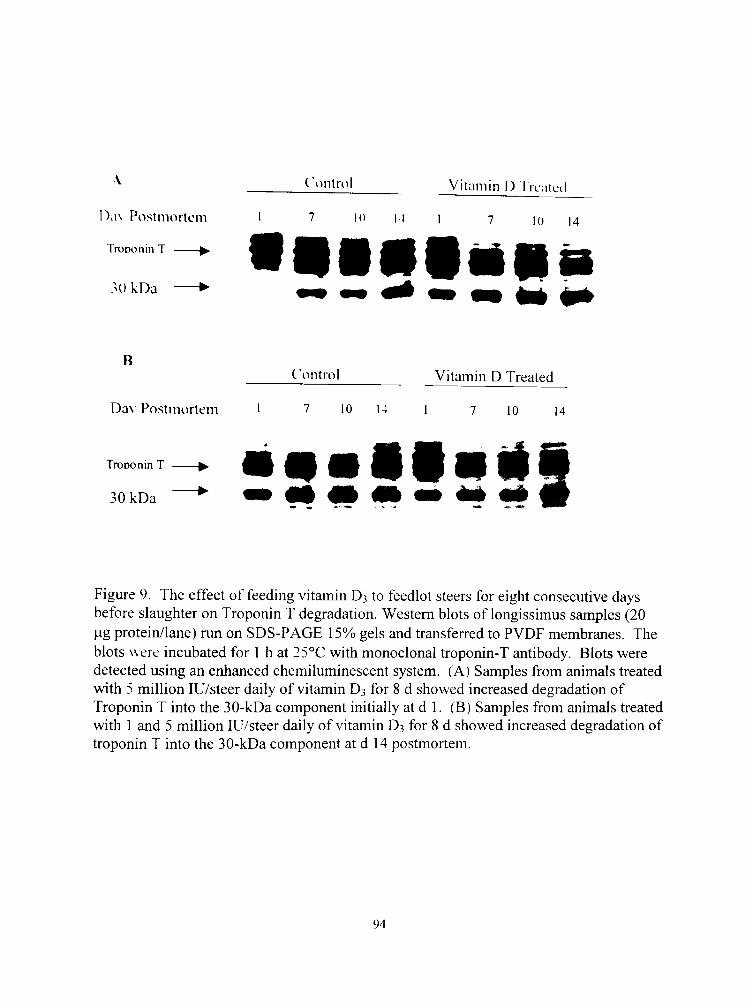
Dax Postmortem
TroDonin T ^
30 kDa •
Control Vitamin I) frcalcd
7 10 M 7 10 14
'9?9!*5" R
Control Vitamin D Treated
Da\ Postmortem 1 7 1 0 1 4 i 7 10 14
Trooonin T ^
30 kDa ^ • jijlljill
Figure 9. The effect of feeding vitamin D3 to feedlot steers for eight consecutive days before slaughter on Troponin T degradation. Western blots of longissimus samples (20 |ag protein/lane) run on SDS-PAGE 15% gels and transferred to PVDF membranes. The blots were incubated for 1 h at 25°C with monoclonal troponin-T antibody. Blots were detected using an enhanced chemiluminescent system. (A) Samples from animals treated with 5 million lU/steer daily of vitamin D3 for 8 d showed increased degradation of Troponin T into the 30-kDa component initially at d 1. (B) Samples from animals treated with 1 and 5 million lU/steer daily of vitamin D3 for 8 d showed increased degradation of troponin T into the 30-kDa component at d 14 postmortem.
94
CilAI'll RIV
1:FF1 C I OF \ 1T.\MIN D, SUPPl f MI'NTA flON Of S fFLRS
ON fllH MINF:RAL C 0 N C I : N IRA flONS AND DIS IRIBUTION
Of C.\l Cll'M Wfl HIN 1 ONCilSSlMllS MDSCLF:
.Abstract
The etfect of supplementing steers with \ar>ing le\els of vitamin D3 on the
mineral content of longissimus muscle and muscle fragments was studied during the
postmortem aging process. Differential centrifugation techniques were used to determine
the distribution of minerals in the different fragments of muscle. Supplementing steers
with 1 and 5 million lU/steer daily of VITD increased (P < 0.05) the Ca "" and P
concentration in the c\ tosol. Soluble c> tosolic Ca ^ concentrations increased over the
aging treatment from d 3 to 21 postmortem. Bound Ca, Mg, P, and Al concentrations
were increased (P < 0.05) in nuclei and myofibril proteins when samples were from steers
supplemented 1 and 5 million lU of VITD daily. Supplementing steers with VITD also
increased Mg concentrations in the cytosol regardless of aging treatment, and the bound
concentrations within the mitochondria at d 3 postmortem. Electron microscopy
visualization of bound Ca indicated VITD mobilized Ca from the sarcoplasmic reticulum
and transverse tubule system into the myofibrils. Bound calcium was concentrated near
the Z-line at the A-band. I-band juncture within the sarcomere. Therefore, the
supplementation of feedlot steers with VITD levels of .5 to 5 million daily apparentiy
increased Ca metabolism within the live muscle resulting in increased bound Ca. When
95
die muscle is converted to meat, increased bound Ca concentrations due to VITD
tieatment resulted in increased free cytosolic Ca ^ concentrations with increasing length
of aging. This study indicates that cytosolic Ca ^ is increased because of VITD treatment
at .5. 1, and 5 million lU daily and postmortem aging.
Introduction
Because of tiie link between Ca'' and tenderness, a number of studies have been
conducted to increase muscle Ca"^ concentrations. Carcasses have been infused with
CaCL solutions to acti\ ate the calpain proteases and improve tenderness (Koohmaraie et
al.. 1988a, 1989, 1990). Meat and muscle (prerigor) also have been injected with CaCb,
thereby enhancing tendemess. Currently, research is being conducted to determine
whether muscle Ca and tendemess can be enhanced by antemortem supplementation of
vitamin D3 (Swanek et al., 1999; Montgomery et al., 2000).
There is considerable evidence to suggest that muscle is a target organ for vitamin
D (Boland, 1986). Electron microscopy studies have demonstrated that animal VITD
deficiency results in muscle with degenerative ultrastmctural alterations (George et al.,
1981). Electrophoretic measurements of myofibrils from vitamin D-deficient chicks and
rabbits also have confirmed muscle degeneration as a result of vitamin D-deficiency, with
a loss of troponin C and actin bands (Boland et al., 1983). Only an enhancement of free
cytosolic Ca " could provoke the stimulation of the Ca^^-activated calpains responsible
for muscle stmctural alterations. Thus, muscle weakness resulting from VITD deficiency
96

might be explained by increased cytosolic Ca " concentrations. However, Toury et al.
(1990) foimd that vitamin D repletion of rats increased bound Ca concentrations to the
myofibril and free c> tosolic levels of Ca'^ and P
CurrenUy, little is known about the direct impact of VITD supplementation of
steers on mineral metabolism. Swanek et al. (1999) noted that VITD increased free Ca ^
concentrations in meat, and Montgomery et al (2000b) also found that cytosolic Ca "
concentrations increased in prerigor longissimus muscle as a result of VITD
supplementation of steers. Bound myofibril P and Ca concentrations also were increased.
Although. VITD treatments seem to be increasing Ca mobilization into the live muscle
cells, it is still not clear whether the activation of the calpain system and increased
myofibrillar proteolysis are a result from increased in cytosolic Ca " within live muscle
or from postmortem changes in cytosolic Ca " Therefore, the objective of this study was
to determine the effects of vitamin D3 supplementation of steers and postmortem aging
time on the mineral content of longissimus samples.
Materials and Methods
Animals
To alleviate sampling problems, a total of three animals from each of the four
vitamin D3 treatment groups described in chapter III were chosen to visualize Ca
localization via potassium pyroantimonate staining and electron transmission
microscopy. The steers had been supplemented with VITD for 8 d before slaughter as
explained in Chapter III. The steer had been supplemented with 0, .5, 1.0, or 5.0 million
lU of VITD daily to improve beef tendemess. Mineral analyses was determined on a
97
subsample of six samples that were closest to the Ca mean of the four individual VITD
tieatments. Mineral analyses were tiien determined on longissimus samples at
postmortem d-3 and d-21 to determine bound mineral differences as a result of vitamin
D3 tieatment.
Muscle Fractionation
The fibrous envelope, exterior fat, and connective tissue of the muscles were
carefiilly removed and the muscle fibers were rapidly minced and homogenized for 60 s
in 0.25 M sucrose using a tissue homogenizer. Samples were then strained through a
metal strainer. Next, samples were differentially centrifiiged to separate different protein
fractions. Nuclei, cell debris and large fragments of the myofibrils were removed by
centrifugation at 1,500 X g, small myofibril fragments were sedimented at 3,000 X g,
mitochondria at 8,000 X g, and sarcoplasmic reticulum at 180,000 g (Appendix Q; Toury
et al., 1990). The supematant fluid of the last centrifugation retained soluble elements
only and constituted the isolated cytosol. Proteins were then quantified by the biuret
reaction using bovme semm albumin as the standard (Layne, 1957).
Muscle Ca, P, Mg, and Al were then measured on the subcellular fractions.
Samples were first digested using nitric and perchloric acid wet ashing procedures
(Appendix R; Muchovej et al., 1986). Then minerals were quantified using a Thermo
Jarrell Ash Trace Scan (Franklin, MA) inductively coupled plasma spectophotometer by
measuring atomic emission.
98
Election microscopy
Samples of longissimus muscle (5 g) were taken from 12 animals at 20 min
postiiiorteni. Samples were then cut longitudinally to approximately 100- to 200-^m
tiiick slices and fixed in pyroantimonate solution to determine bound Ca localization
according to the procedures of Mentre and Escaig (1988; Appendix S). In addition, a
sample was treated with the fixation solution plus 2 niM ethylenebis
(oxyethylenenitt-ilotetiaaceticacid; EGTA) as a negative control. Once fixed the samples
were visualized on a Hitachi H 60 (Hitachi, Tokoyo, Japan) electron-transmission
microscope.
Statistical Analyses
Mineral data from the muscle fragments were analyzed using a split-plot design.
The main plot included the VITD tieatments and used an error term of vitamin D
treatment nested within animal. The subplot contained postmortem aging and the vitamin
D X aging interaction and used an error term of vitamin D nested within animal and
aging tieatments. Pooled standard errors were calculated according to Steel and Torrie
(1980), and means were separated by the least significance difference (LSD) method.
Critical differences were calculated for the LSD by calculating the Saiterthwaite degrees
of freedom for the t values (Saiterthwaite, 1946). An alpha level of 5% and the Proc
GLM procedure of SAS (1994, SAS Inst. Inc., Gary, NC) were used for the analyses.
99
Results
Supplementing stccis with 1 or 5 million llj/stecr of VffD daily increased (P <
0.05) free c\tosolic Ca'' concentrations at d 3 and 21 postmortem (fable 13). Free Ca"'
concentrations increased during postmortem aging. When samples were aged to
postmortem d 21 and steers treated with I and 5 million 111 daily, the amount of nuclei
and niNofibril cellular contents of bound Ci\ also were increased (P < 0.05). Vitamin D3
treatments did not significanth affect bound Ca concentrations of small sedimented
myofibrils, mitochondria, or sarcoplasmic reticulum proteins.
\isualization of Ca binding to li\e longissimus samples is presented in figures 10,
11. 12. 13. and 14. When EGT.\ was included in the fixati\'e there was an eliminations
of dark potassium-pyroantimonate precipitates (Figure 10). Visualization of muscle
samples treated with no \'ITD indicated that the Ca-pyroantimonate granules were
massed in the trans\ erse tubule (T-system) system and in the terminal cistemae (Figure
11). .A small portion of the Ca granules were located near the Z-line. In steers treated
with .5 million lU of N'lTD (Figure 12). 1 million lU of VITD (Figure 13), and 5 million
lU of \'ITD (Figure 14). Ca-pyroantimonate granules appeared massed close to the Z-
lines and constituted large dark lines at the I-band. A-band juncture. Bound Ca deposits
also were observed in the interior of the myofibril. In general, VITD treatments
decreased the quantity of Ca bound within the T-system and the sarcoplasmic reticulum
and increased binding in the myofibril near the Z-lines.
Thel and 5 million lU/steer of VITD daily also increased the concentrations of
free P within the cytosol, regardless of aging treatment (Table 14). These two treatments
100
also increased the binding of P to the niNofibril and other larger cellular proteins. All the
\ 1 ID treatments increased soluble concentrations t>f Mg in the cytosol regardless of
aging treatments (fable 15). ,\ll Vfl'l) treatments increa.scd mitochondrial binding of
Mg at d 3 postmortem, wheieas treating steeis with .5 million lU of Vffl) was the only
treatment to maintain increased bound Mg within the mitochondria at 21 d postmortem
( fable 1 5). freaiing steers with I and 5 million Rl/stecr ol VffD dailv of VII I)
increased Mg bound to m>ofibril proteins.
N'ery little information exists on .\1 concentrations in beef muscle. Treating steers
witii 5 million lU of \1TD daily increased free Al concentrations of the cytosol (Table
16). Supplementing 1 and 5 million lU of VITD also increased the amount of Al bound
to myofibril and cellular proteins. Thus. VITD supplementation seems to increase the
concentrations of bound and soluble Ca. P. Mg, and Al within meat.
Discussion
Tour\ et al. (1990) demonstrated that repletion of VITD-deficient animals
doubled c>iosolic Ca~" concentrations. The present study found that VITD
supplementation resulted in a 2.6-fold increase in free Ca "" within 3 d postmortem and a
six-fold increase by d 21 postmortem. Taylor et al. (1995b) reported that extracellular Ca
begins to leak into the muscle cell during the conversion of live muscle to meat.
Cytosolic Ca " also increases in muscle because of the drop in pH when muscle enters
rigor (Gulati and Babu. 1989; El-Saleh and Solaro, 1988; Parsons et al., 1997). Jeacocke
(1993) showed that intracellular free Ca^^ levels are tightly maintained between .1 and .2
101

(.iM in the li\e muscle cell, and both Ca and Mg concentrations increase within the
e>1osol when muscle enters rigor. The present study provides evidence to support the
belief that cytosolic Ca"^ and Mg concentrations increase as a consequence of
postmortem aging. Furthermore, VITD supplementation increases the amount of bound
Ca in the muscle cell before harvest and subsequent rigor development. Thus, the
induction of rigor in VITD-fed steers seems to result in a process whereby cytosolic Ca "
concentrations increase faster and to a greater extent than in control animals. It also is
important to note that increased concentiations of Ca ^ in the initial periods of
postmortem aging can activate the calpains to a greater extent resulting in increased
myofibrillar proteolysis (Edmunds et al., 1991; Boehm et al., 1998).
The present study showed that Ca, P, Mg, and Al all increased within meat as a
result of VITD supplementation and postmortem aging. Aluminum has been noted to be
correlated negatively to Ca and l,25-(OH)2 D3 concentrations (Allen et al., 1994),
however in this study Al seemed to be enhanced by VITD supplementation. Also,
mitochondria have been noted as a binding storehouse for Ca (Greaser, 1977), yet in the
present study, mitochondria only increased the binding of Mg.
Yarom and Meiri (1972) and McCallister and Hadek (1973) were the first to note
that pyroantimonate precipitates indicated Ca-binding sites within skeletal muscle. In
their samples, Ca-binding was only slight near the Z-lines and less dramatic than in the
present stiidy. The use of osmium within the fixation step also has been suggested to
improve the electron microscopy transmission, but was noted as problematic and less
repeatable by Locker and Wild (1984). The binding of Ca in the electron-microscopy
102
slides in the present study may be a result of Ca"* binding to a number of proteins located
in the A-band/I-band juncture that have Ca-binding affinities, such as troponin C, titin,
nebulin, actin, and (or) nnosin (Sjodin, 1982; Tatsumi et al., 1997).
Results of the present study indicated that VITD supplementation and postmortem
aging both dramaticalh impacted the Ca. P. Mg. and P concentrations of muscle and
meat. Vitamin D3 feeding at .5 to 5 million lU/steer daily seems to increase the bound
concentiations of Ca in muscle, which is then released during postmortem aging and rigor
development. An increase in the content of Ca within the live muscle cell and the
postmortem changes presumably lead to a greater activation of the calpain system,
potentialh m-calpain during the aging period, resulting in further myofibrillar proteolysis
and improvement of meat tendemess.
103
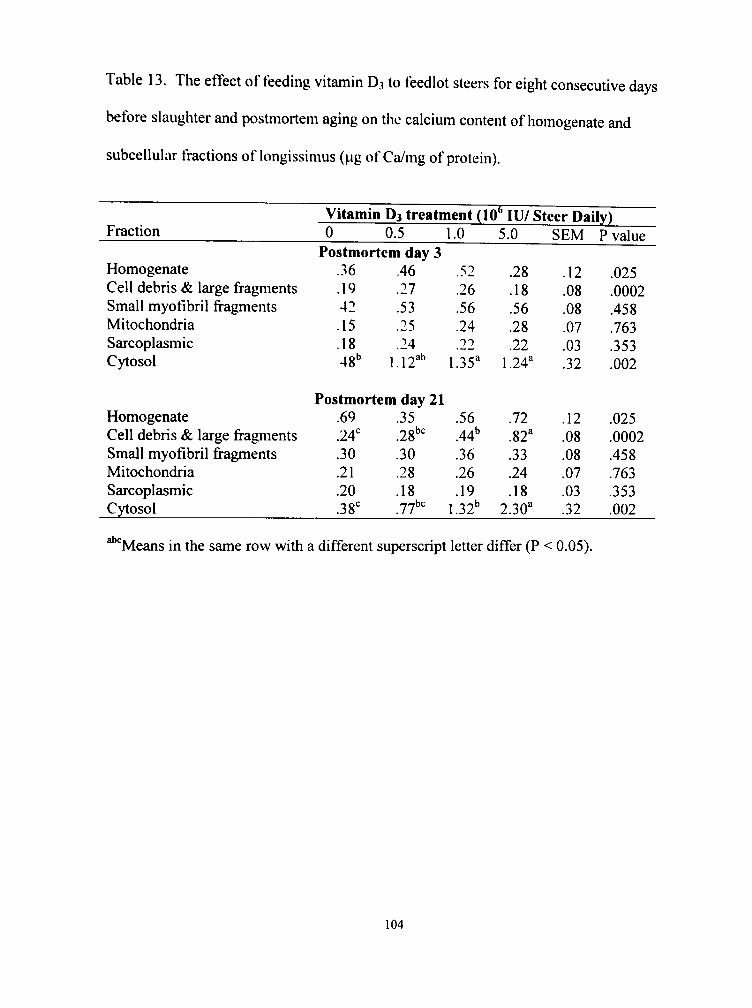
Table 13. The effect of feeding vitamin D3 to feedlot steers for eight consecutive days
before slaughter and posUiiortem aging on the calcium content of homogenate and
subcellular fractions of longissimus (|.ig of Ca/mg of protein).
Fraction
Homogenate Cell debris & large fragments Small myofibril fragments Mitochondria Sarcoplasmic Cytosol
Homogenate Cell debris & large fragments Small myofibril fragments Mitochondria Sarcoplasmic Cytosol
Vitamin 0
D3 treatment (10" lU/ Steer Daily) 0.5 1.0
Postinortem day 3 .36 .19 42 .15 .18 48"
.46 .52
.27 .26
.53 .56
.25 .24
.24 22 1.12'" 1.35"
Postmortem day 21 .69 .24' .30 .21 .20 .38'
.35 .56
.28"' .44"
.30 .36
.28 .26
.18 .19
.77"' 1.32"
5.0
.28
.18
.56
.28
.22 1.24"
.72
.82'
.33
.24
.18 2.30"
SEM
.12
.08
.08
.07
.03
.32
.12
.08
.08
.07
.03
.32
P value
.025
.0002
.458
.763
.353
.002
.025
.0002
.458
.763
.353
.002
abc Means in the same row with a different superscript letter differ (P < 0.05).
104

Table 14. The effect of feeding vitamin D3 to feedlot steers for eight consecutive days before slaughter and postmortem aging on the phosphorus content of homogenate and
subcellular fractions of longissimus (|j,g of P/mg of protein).
Fraction
Homogenate Cell debris & large fragments Small myofibril fragments Mitochondria Sarcoplasmic Cytosol
Homogenate Cell debris &. large fragments Small myofibril fragments Mitochondria Sarcoplasmic Cytosol
Vitamin 0
1 D3 Treatment (10* 0.5
Postmortem day 7.85 2.65 1.05 .818 .72
13.78'
9.03 3.08 1.38 1.20 1.17
23.49"'
Postmortem day 10.80 2.95' 1.36 1.17 1.03 7.75'
8.18 3 ggbc 1.34 1.44 .96
21.01"'
1.0 3
8.37 3.14 1.35 1.27 1.09
23.71"
21 9.90 5.22" 1.85 .97 .75
27.52"
'' lU/ Steer Daily) 5.0
7.42 3.00 1.25 1.14 1.31
38.75"
12.19 9.29" 1.68 1.14 .83
47.76"
SEM 1
1.66 .92 .26 .17 .25
5.26 •
1.66 .92 .26 .17 .25
5.26
r* value
.146
.001
.445
.058
.232 —
.146
.001
.445
.058
.232 —
abc 'Means in tiie same row wdth a different superscript letter differ (P < 0.05).
— There was a vitamin D3 main effect (P < 0.0001).
105

Table 15. The effect of feeding vitamin D3 to feedlot steers for eight consecutive days before slaughter and postmortem aging on the magnesium content of homogenate and
subcellular fractions of longissimus (j g of Mg/mg of protein).
Fraction
Homogenate Cell debris & large fragments Small myofibril fragments Mitochondria Sarcoplasmic Cytosol
Homogenate Cell debris & large fragments Small myofibril fragments Mitochondria Sarcoplasmic Cytosol
Vitamin Dj treatment (lO' 0 0.5 1.0 Postmortem day 3
.93 1.07 .98
.25 .30 .30
.15 .19 .19
.12" .18" .19"
.11 .18 .16 1.90' 3.21" 3.15"
Postmortem day 21 1.45"" 1.02" 1.39"" .34' .43"' .59" .19 .19 .22 .17" .21" .14" .15 .14 .12
1.06' 2.86" 3.75"
' lU/ Steer Daily) 5.0
.88
.29
.18
.17"
.20 5.25"
1.72" 1.08" .22 .16" .12
6.64"
SEM I
.21
.11
.03
.02
.04
.73 -
.21
.11
.03
.02
.04
.73 -
* value
.050
.0008
.598
.039
.221
.050
.0008
.598
.039
.221 —
abc Means in the same row with a different superscript letter differ (P < 0.05).
— There was a vitamin D3 main effect (P < 0.0001).
106
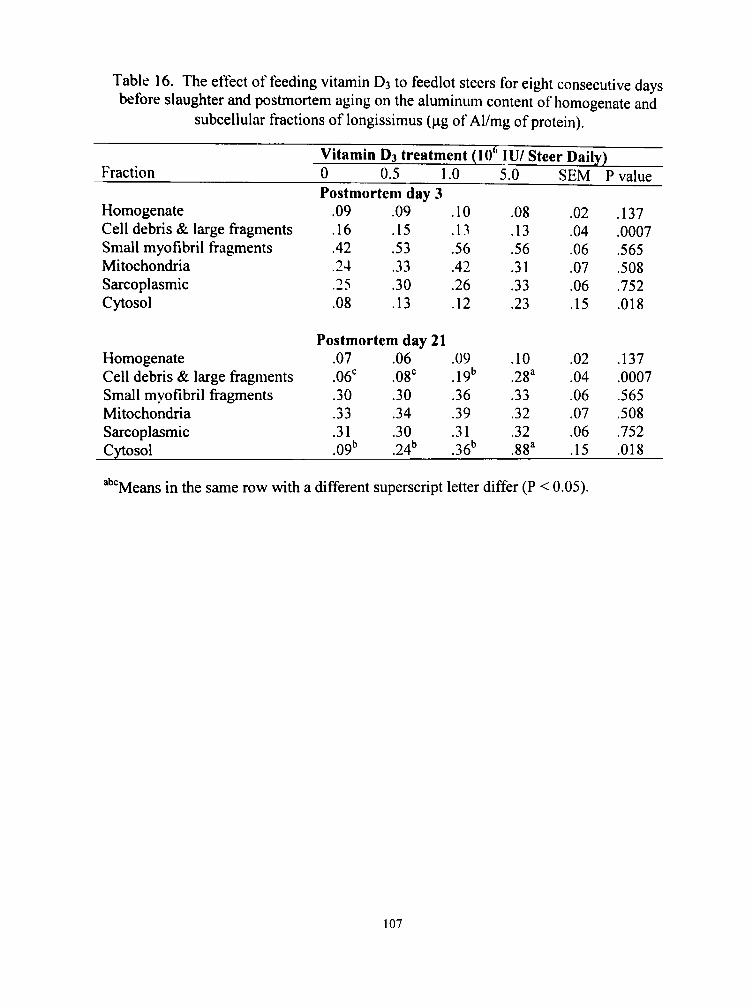
Table 16. The effect of feeding vitamin D3 to feedlot steers for eight consecutive days before slaughter and postmortem aging on the aluminum content of homogenate and
subcellular fractions of longissimus (|ag of Al/mg of protein).
Fraction
Homogenate Cell debris & large fragments Small myofibril fragments Mitochondria Sarcoplasmic Cytosol
Homogenate Cell debris & large fragments Small myofibril fragments Mitochondria Sarcoplasmic Cytosol
Vitamin D3 treatment (10* 0 0.5 Postmortem day
.09
.16
.42
.24
.25
.08
.09
.15
.53
.33
.30
.13
Postmortem day .07 .06' .30 .33 .31 .09"
.06
.08'
.30
.34
.30
.24"
1.0 3
.10
.13
.56
.42
.26
.12
21 .09 .19" .36 .39 .31 .36"
lU/Steer Daily) 5.0
.08
.13
.56
.31
.33
.23
.10
.28"
.33
.32
.32
.88"
SEM I
.02
.04
.06
.07
.06
.15
.02
.04
.06
.07
.06
.15
* value
.137
.0007
.565
.508
.752
.018
.137
.0007
.565
.508
.752
.018
abc Means in the same row with a different superscript letter differ (P < 0.05).
107
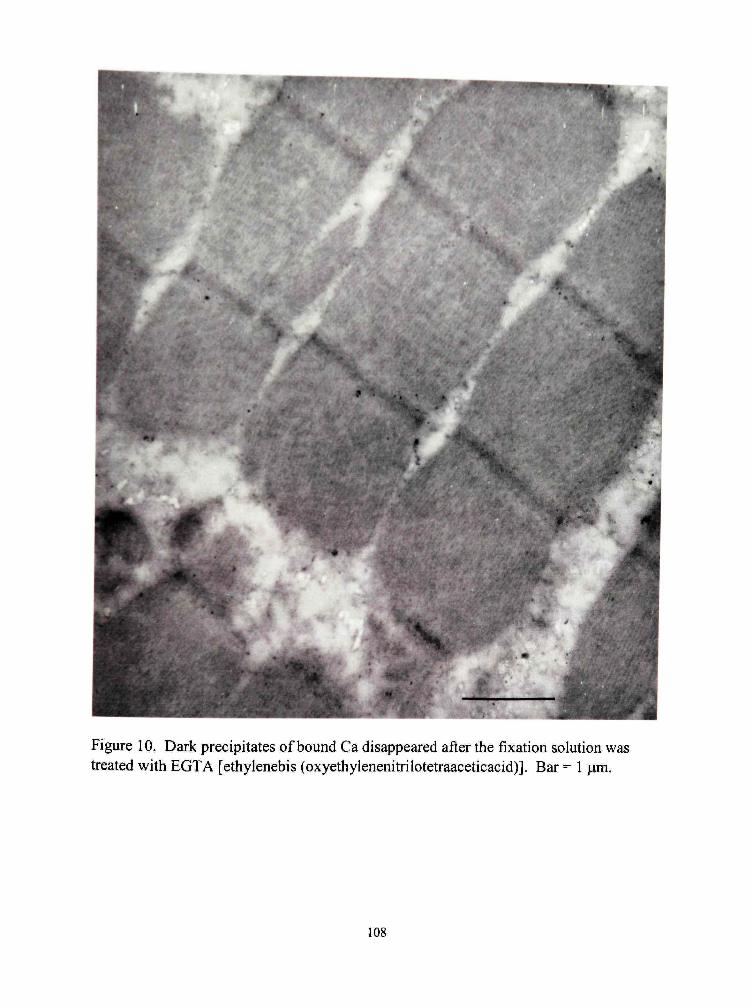
Figure 10. Dark precipitates of bound Ca disappeared after the fixation solution was treated with EGTA [ethylenebis (oxyethylenenitrilotetraaceticacid)]. Bar = 1 |am.
108

Figure 11. Effect of supplementing steers 0 million lU/steer daily of vitamin D3 (control) for 8 d on the bound Ca distribution. Calcium-pyroantimonate granules appear concentiated in the T-system and terminal cistemae. A small portion of the calcium-pyroantimonate granules were near the Z-lines. Bar = 1 |im.
109
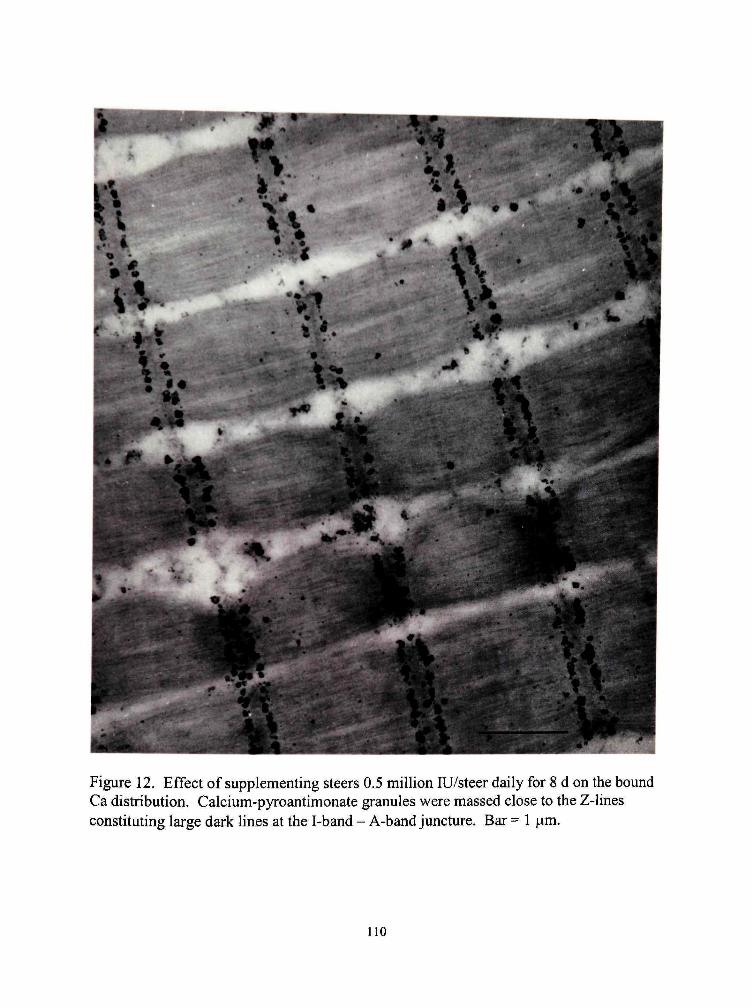
Figure 12. Effect of supplementing steers 0.5 million lU/steer daily for 8 d on the bound Ca distribution. Calcium-pyroantimonate granules were massed close to the Z-lines constituting large dark lines at the 1-band - A-band juncture. Bar = 1 |im.
110
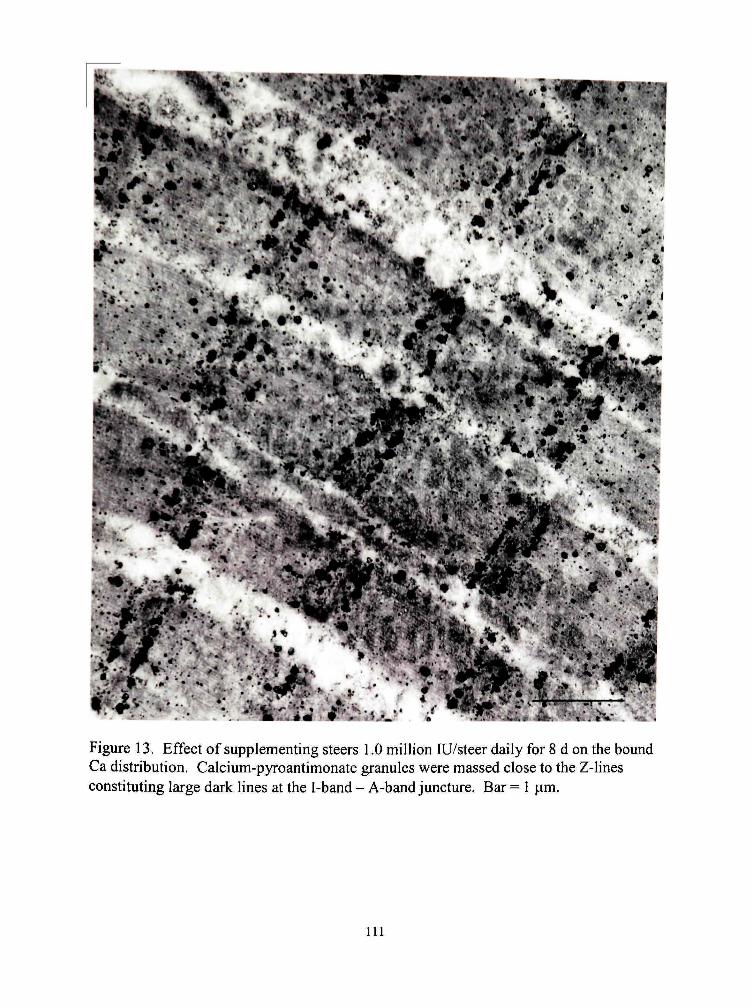
r*" • . ^'; -J^J^^. ••''•'"^^ ' '.'X.^.Cy:'^'*^
^•'•'^'fe^'^*^^ • \
V * • • ' • • • • ' ' A
.:>y ,.. • V . . . . • ^ ; .• ... :• f J^wm^:^^^ -^^
Figure 13. Effect of supplementing steers 1.0 million lU/steer daily for 8 d on the bound Ca distribution. Calcium-pyroantimonate granules were massed close to the Z-lines constituting large dark lines at the I-band - A-band juncture. Bar = 1 ^m.
I l l
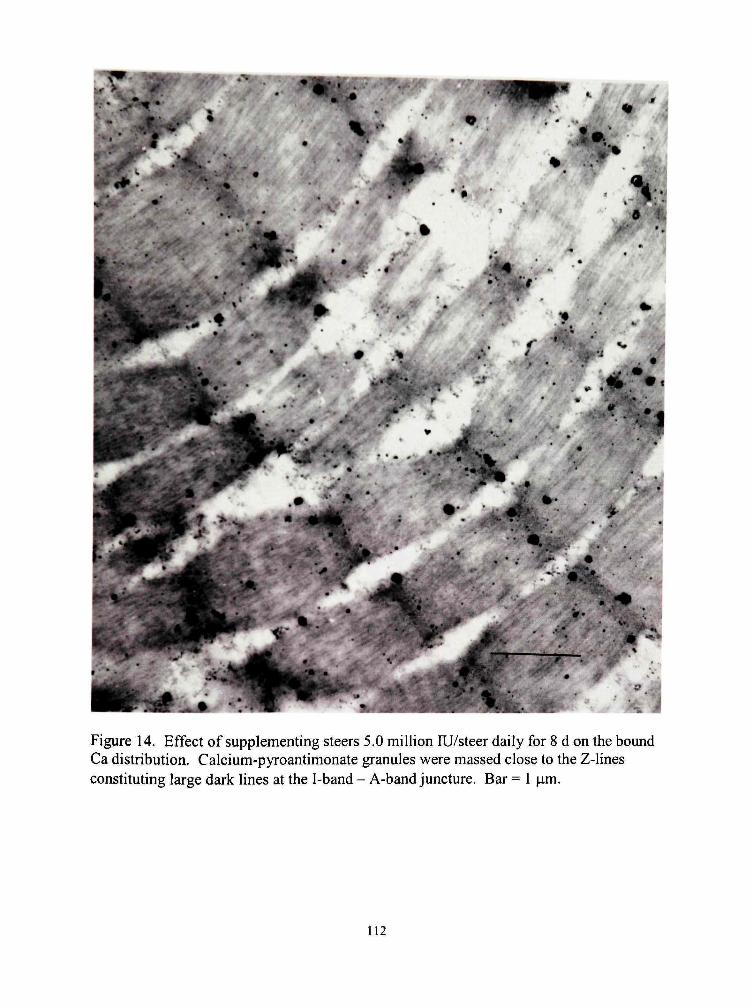
^ Trrw/
Figure 14. Effect of supplementing steers 5.0 million fU/steer daily for 8 d on the bound Ca distribution. Calcium-pyroantimonate granules were massed close to the Z-lines constituting large dark lines at the I-band - A-band juncture. Bar = 1 j^m.
112
CllAPfi;R V
IFFHC 1 OF VITAMIN I),, SUPPl f:Ml'NTAfION ON PROTEIN
TURNOVER AND PROl i;iN RlXiUI AflON USING
ACEI.I.CUI lUREMODl'L
Abstract
file effect of 1.25-diIiydrox>\ itamin D3 11.25-(OI I). D3] treatment of cell cultures
on proteui sNutiiesis. degradation, and protein expression was studied using an in vitro
cell culture model. C 2C12 ni>oblasts and myotubes were treated with 100 nM of 1,25-
(OH): D3 for 24 or 48 h. Treatment with 1.25-(OH)2 D3 decreased (P < 0.05) cellular
protein sNuthesis of C2C12 myoblasts and myotubes, and increased (P < 0.05) protein
degradation of C2C12 m>otubes. Primary bovine myoblasts were also treated with
muscle extracts from steers supplemented with 0, .5, 1. and 5 million lU/steer daily of
vitamin D3 to determine cellular protein synthesis and degradation. There was a vitamin
D3 treatment X breed t} pe interaction (P < 0.02) for protein degradation when samples
w ere taken from muscle extracts. All vitamin D supplementation levels increased (P <
0.05) protein degradation of the primary bovine muscle cultures when the extracts were
taken from Bos-taurus-English type steers, however, muscle extracts taken from steers
treated with 5 million lU of VITD/steer daily were the only extracts that increased bovine
myoblast protein degradation when samples were collected from Bos indicus and Bos
towrwi'-Continental steers. Enzyme linked immunoabsorption assays (ELISA) were
conducted on C2C12 myoblasts and myotubes to determine l,25-(OH)2 D3 treatment
113
effects on expression of calpastatin. p-calpain, m-calpain. calbindin, and the Ca''-sensing
receptor, freatment with 1.25-(Oin2 D; dccieased the cellular content of all proteins
tested in the C2C12 myoblasts, fhus, \ itamin I) eliects on protein turnover within the
muscle cell seems to be partially explamed h\ the regulation of the calpain and
calpastatin s\ stem, as well as calbindin and the Ca'"^-sensing receptor.
Introdtiction
Vitamin D is an essential nutrient in higher animals and mammals. It is one of the
most important regulators of Ca metabolism. 1,25-dihydroxyvitamin D, is the
biologicalh active fomi of \ itamin D that modulates Ca homeostasis. This hormone
functions biologicalh through mediation of a specific vitamin D nuclear receptor that
modulates gene transcription of Ca"*-binding proteins (Wecksler and Norman, 1980;
Pike. 1985) and by non-genomic mechanisms that involves the activation of signal
transduction pathways (DeBoland and Nemere, 1992). The ubiquitous distribution of this
receptor also has been shown to be involved in a number of physiological functions
unrelated to mineral homeostasis (Walters, 1992; Boland et al., 1995). 1,25-
Dihydroxyvitamin D3 has been reported to play a role in regulating both cell growth and
differentiation (Capiati et al., 1999).
Myoblasts are myogenic cells that are first mononucleated and undergo active
proliferation and then differentiation into multinucleated myotubes. Myotubes rather
than myoblasts express phenotypic and physiological characteristics similar to mature
fibers in vitro (O'Neill and Stockdale, 1972; Wakelam, 1985). Both myoblasts and
114
myotubes have been shown to have a cytosolic/nuclear steroid receptor specific for
l,25(OH)2D3 (Boland et al.. 1985; Simpson et al., 1985; Costa et al., 1986). Thus,
vitamin D via l,25(OH)2D3 has been shown to be a hormone that is an effective
modulator of cytosolic Ca~ concentiations in the muscle cell (Boland et al., 1995;
Vazquez et al., 1997).
The calpain faniih is a multi-component system composed of several isoforms of
the enzyme, calpain, and endogenous inhibitor of the enzyme, named calpastatin. The
calpains and calpastatin are ubiquitously distiibuted, being found in every vertebrate cell
type (Goll et al., 1992; Sorimachi et al., 1997). The calpains are cysteine proteases that
have an absolute requirement for Ca to initiate full activity. The two most
characterized forms of the enzyme are ).i-calpain and m-calpain. Although calpastatin, \i-
calpain, and m-calpain are ubiquitously distributed, they are found exclusively
intracellular. The Ca " requirement for |i-calpain is between 5 and 65 i M for half-
maximal activity, while the calcium requirement for m-calpain is between 300 and 1000
^M Ca^"'for half-maximal activity (Cong et al., 1989; Barrett et al., 1991; Edmunds et al.,
1991). The addition of 1,25(OH)2D3 to cell culture media has been shown to upregulate
the expression of ^-calpain in carcinoma cell cultures (Ravid et al., 1994; Berry and
Meckling-Gill, 1999), although effects of l,25(OH)2D3 on calpain and calpastatin
expression in muscle cells have not been studied.
Recent research has shown that a number of cells contain a cell surface, Ca
sensing receptor (Diaz et al., 1997; Riccardi, 1999; Yarden et al., 2000). This Ca^*
sensing receptor fimctions to sense increases in extracellular Ca concentiations and
115

ti-ansports Ca into the cell. While the Ca''-sensing receptor has been localized in the
kidney, paratiiyroid, brain, stomach, and pancreas, the physiological role and possible
relevance of the receptor on Ca homeostasis remains unclear (Riccardi, 1999).
Moreover, Uie existence of tiie Ca^^-sensing receptor in muscle is not presently known.
Yet, when \ itaniin D-deficient rats were repleted with vitamin D, the expression of the
Ca'^-sensing receptor iiiRNA was increased in the parathyroid (Brown et al., 1996).
Calbindin is a \ itaniin D-dependent Ca"*-binding protein that binds four atoms of
Ca and is found in muscle and other tissues. There are two types of vitamin D-dependent
Ca binding calbindins found in mammalian tissues, including a 9 kDa protein found
exclusively in mammalian tissues and a 28 kDa calbindin protein that is ubiquitously
distributed throughout the animal kingdom as are other Ca binding proteins such as
calmodulin and par\'albumin (Christakos et al., 1989; Zanello et al., 1995). Treatment of
myoblasts and animals with l,25(OH)2D3 has been shown to increase the expression of
calbindin (Varghese et al., 1988; Drittanti et al., 1994; Hemmingsen, 2000). The
objectives of these three experiments were to determine the effect of l,25(OH)2D3 on
cellular protein synthesis and degradation and expression of calpains, calpastatin, the
Ca ' -sensing receptor, and cabindin in C2C12 myoblasts and myotubes.
Materials and Methods
Experiment 1
The C2C12 myoblast cell cultiire line was cultiired in Dulbecco's Modified Eagle
Medium (DMEM; GibcoBRL, Grand Island, NY, cat. # 12100-046) supplemented with
116
15% (Nol/vol) fetal bovine serum (FBS) and 100 U/mL of penicillin and streptomycin
(Signia-Aldrich, St. Louis. MO, cat. # A-7292) and 1 mg/100 mL gentamycin
(GibcoBRL, cat # 15750-060) at 37°C in a humidified atmosphere of 95% air and 5%
CO2. Cells were grown in 75-cm- canted neck tissue cluture flasks and subcultured
every 2. Cells were subcultured using a 0.25% trypsin (yol/vol)and 1 mM EDTA
solution into 24 well plates (each well = 2 cm') at a density of 2,500 cells/cml Cells
were grown in tiie DMEM media for 72 h until they had reached 70% confluence. At this
time half tiie plates had the growtii media replaced with fusion media consisting of the
DMEM and antibiotics as described previously and 2% horse serum (vol/vol). The
ftision media was changed every 2 d, and cells were allowed to fiise for 8 d, at which time
100% of the cells were fused.
Protein synthesis assay. The procedure for determining the rate of protein
synthesis as measured by uptake of labeled amino acids was conducted essentially as
described by Reecy et al. (1994). Briefly, C2C12 myoblasts and C2C12 myotubes were
subcultured and grown in 24 well plates as described above. For the myoblasts, the
DMEM medium was aspirated and replaced with 1.0 mL of skeletal muscle cell basal
medium (SKBM; Clonetics, San Diego, CA, cat # CC-3161) with 15% (vol/vol) FBS and
penicillin, streptomycin, and gentamycin. The SKBM media either contained no added
l,25(OH)2 D3 (control) or 100 nM of l,25(OH)2 D3. For the C2C12 myotubes, the
DMEM medium was aspirated and replaced with 1.0 mL of SKBM with 2% (vol/vol)
horse serum and penicillin, streptomycin, and gentamycin. Again, the SKBM media
either contained no added l,25(OH)2 D3 (control) or 100 nM of l,25(OH)2 D3. Cells
117

were treated for 24 or 48 h with the SKBM control with treatment media changed every
24 h for the 48-h tieatment.
After a 24- or 48-h incubation with treatments, 1 |.iCi of a '''C-labeled amino acid
mixUu-e (New England Nuclear, Boston, MA, cat# NEC-445E) was added to each well.
The cells were labeled for 2 h, after which the medium was removed, the wells were
rinsed, and the cells were lysed by adding 0.5 iiiL of 1 M NaOH to each well. After 2 h,
0.5 mL of 20% (wt/vol) trichloroacetic acid (TCA) was added, and the plates were placed
in tiie refrigerator ovemight. A 200-|aL sample was obtained from each well to determine
the protein concentration. Protein assays were performed on all samples in quadmplicate
according to Bradford (1976) using a kh from Bio-Rad Laboratories, Inc., (Hercules, CA;
Appendix T). Cells then were harvested and counted with a liquid scintillation counter.
All assays were replicated six times, with an experimental unit representing the average
of three wells and counts per minute were expressed as a percentage increase over cells
that were tieated with DMEM and 15% fetal bovine serum as an intemal control on a per
microgram of protein basis (Appendix U).
Protein degradation assay. Muscle cell protein degradation percentage was
determined by following steps similar to those of Ballard et al. (1986). The C2C12
myoblasts and myotubes were grown in 24 well plates as explained previously. The
medium then was replaced with 1.0 mL of SKBM with 15% (vol/vol) FBS for myoblasts
and with 1.0 mL of SKBM with 2% (vol/vol) horse semm for myotubes. Each well
received I iCi of ''^C-labelled amino acids. After a 24-h incubation period, labeling
medium was removed, and each well was washed three times with fresh medium. One
118
niL of SKBM witii FBS or horse serum containing either no l,25(OH)2 D3 or 100 nM
l,25(OH)2 D3 was placed in each well and incubated for 24 or 48 h (again the media was
changed after 24 h for the 48-h treatments). The chase medium was removed, each well
was rinsed, and 1.0 niL of SKBM containing the appropriate previous treatment was
placed in each well. Each plate tiien was incubated for an additional 2 h. Four hundred
^1 of tiie medium was transferred to a 1.5-niL tube. To this tube, 400 |aL of cold 20%
TCA (vol/vol; final concentiation of 10% TCA) was added, vortexed, transferred to a
glass-fiber filter, and rinsed witii 5% (vol/vol) TCA. Additionally, 400 ^L of the media
was transferred to a scintillation vial and counted for total medium cpm. The remaining
medium was removed for protein determination. Finally, the cells were lysed, harvested,
and counted as described for the protein synthesis procedure. A 100-^L sample of the
TCA precipitate and a 200 fiL sample of the media and cell layer were taken for protein
determination as described previously. The samples for each treatment of each cell type
and at each time period were replicated six times. Percent protein degradation (Appendix
V) was expressed as follows on a per |ag of protein basis:
cpm of TCA precipitate X 100 % protem degradation
cpm of total media -1- cpm of cell layer -1- cpm of TCA precipitate.
Experiment 2
The C2C12 myoblast cell culture line was cultured in DMEM (GibcoBRL)
supplemented with 15% (vol/vol) FBS and 100 U/mL of penicillin and streptomycin
(Sigma-Aldrich) and 1 mg/100 mL gentamycin (GibcoBRL) at 37°C in a humidified
119
atinosphere of 95% air and 5% CO:. Cells were grown in 75-cm' canted neck tissue
cluture flasks and subcultured every 2 day. Cells were subcultured using a 0.25%
(vol/vol) tiypsin and 1 niM EDTA solution into 6-cni petri dishes at a density of 15,000
cells/cm^. Cells were allowed to attach overnight and were then treated with SKBM
(Clonetics) with 15% (\ol/vol) FBS and penicillin, streptomycin, and gentamycin. The
SKBM medium contained either no added l,25(OH)2 D3 (control) or 100 nM of
l,25(OH)2 D3. Cells were tieated for 24 or 48 h before harvesting. Each set of
tieatments were replicated eight times for each time period. In addition, another set of
C2C12 cells was administered DMEM and 2% (vol/vol) horse serum after subculturing to
enhance fusion and myotube formation. Cells were treated with the fusion medium for
eight consecuti\e days, at which time 100% of the cells had fused. The fusion medium
was removed, and cells were treated for 24 or 48 h with the SKBM and 2% (vol/vol)
horse serum media containing either no added l,25(OH)2 D3 or supplemented with 100
nM l,25(OH)2 D3. Cells were harvested from the 6-cm petri dishes with cell scrapers in
6 mL of PBS with protease inhibitors (100 mg ovomucoid trypsin inhibitor/mL, Sigma
Type U-0; 2.5 of ^M E-64; 13 |aM of Leupeptin).
ELISA Assays. Enzyme-linked immunoabsorption assays (ELISA) were
conducted to determine the expression of calpastatin, \x- and m-calpain, vitamin D-
dependent 28 kDa calbindin, and the Ca^^-sensing receptor in C2C12 myoblasts and
myotiibes as a resuh of l,25-(OH)2 D3 treatment for 24 and 48 h. The concentiation of
protein in the collected cell culture samples was determined in triplicate according to
Bradford (1976). ELISA assays were then conducted according to the procedures
120
outiined in Morrow et al. (1991). The full procedure is given in Appendix W. For each
of tiie five proteins, samples were pipetted on 96 well FILISA plates. Each sample was
pipetted in quadruplicate and averaged after reading. Each plate contained a nontreated
myoblast sample at 24 h of treatment as an internal control. The average reading for each
sample was tiien expressed as a ratio of the internal control reading (nontreated cells).
For calpastatin expression, samples were pipetted at 1 f-ig/well, whereas for i- and m
calpain samples were pipetted at 2 |.ig/well, and for calbindin and the Ca ' -sensing
receptor samples were pipetted at 7 ng/well. Each ELISA plate also contained four wells
witii PBS for determination of non-specific binding. Each ELISA plate was air dried and
then incubated w ith borate buffer overnight. The ELISA assays were then conducted as
outlined in Appendix W.
Westem blots. Westem blots were conducted on samples of myoblasts treated
with and without 1.25-(OH)2 D3 as outlined in Appendix P. Briefly, samples were
suspended in LaemmLi SDS sample buffer (LaemmLi, 1970) and then boiled for 5 min
and agitated with a syringe five times to break up DNA coagulates. Next, 2 p,g of protein
from the treated and nontreated cells and standards (BioRab, Kaleidoscope prestained
standards. Cat. # 161-0324) were subjected to reducing conditions using 10%
polyacrylamide gels mn at 150 v for approximately 75 min. Samples were then
transferred to rutrocellulose membranes (Amersham Pharmacia Biotech, Piscataway, NJ,
Hybond ECL) using a semidry apparatus (Hoefer Scientific Instruments, San Francisco,
CA model # TE70). The nitrocellulose membranes then were blocked 1 h with PBS and
tween 20 with 5% (wt/vol) nonfat dry milk. The appropriate primary antibody was then
121
applied for 150 min. The antibodies were diluted in PBS and tween 20 with 1% (wt/vol)
BSA. The antibodies for calpastatin (Affinity Bioreagents, Inc., Golden, CO, Cat. #
MA3-945), |.i-calpain (AfTmity. Cat. # MA3-940), calbindin (Chemicon Inter. Inc.,
Temecula, CA, Cat. # AB1778). and the Ca''-sensing receptor (Affinity, Cat. # PA 1-934)
were diluted 1:2000 and the antibody for m-calpain (Affinity, Cat. # MA3-942) was
diluted 1:4000. The membranes were washed with PBS and tween 20 three times for 10
min. Next, the antibodies were detected with a horseradish peroxidase-conjugated goat
anti-mouse IgG (American Qualex Antibodies. San Clemente, CA, Cat. # A106PN)
incubation for 1 h. rinsed witii PBS and tween 20 three times for 10 min, and enhanced
with chemiluminescence (NEN. Renaissance Westem blot chemiluminescence reagent,
Cat.#NEL101).
Experiment 3
The cell culture procedures for experiment 3 were in outlined detail by Kerth
(1999). Primary bovine muscle cell cultures were prepared following procedures
outlined by Hembree et al. (1991). A 50 to 55 d bovine fetus was placed in a sterile field,
and the skin was removed from the hind limb. Small pieces of muscle tissue were
removed and placed in a vial of cold RPMI-1640 Cell Culture Media without L-
glutamine (RPMI, Sigma-Aldrich Co., St. Louis, MO) media containing 10% (vol/vol)
FBS. The samples then were transported (4°C) to the laboratory. The muscle was
minced with a razor blade and transferred to a vial containing RPMI with 10% (vol/vol)
FBS and 5% (wt/vol) coUagenase. The sample was stirred constantly for 1.5 h at room
122
temperature. The upper portion of the culture was transferred into a centrifuge tube and
centiifuged for 10 min at 1.000 x g. The collagenase media was removed and replaced
witii fresh RPMI plus 10% (vol/vol) FBS and resuspended by vortexing. The cells were
transferred to 75-cm' culture flasks and incubated at 37"C with 100% humidity, 5% CO2
and 95% air. The cells were allowed to grow for 48 h, then were trypsinized to release
them from tiie flask, tt-ansferred to a 15-niL conical tube, centrifuged (1,000 x g, for 5
min), tiie Uspsin medium was aspirated, and the cells were resuspended in fresh RPMI
buffer witii 10% (\ol/vol) FBS.
Serum preparatioa To prepare tiie serum for the cell culture assays, blood from
each animal in the experiment Chapter III was collected during exsanguination and held
at 4°C for about 12 h. Each tube tiien was centrifuged (500 x g, for 10 min) to separate
the clot from the serum. Serum from each animal was added to SKBM media (5%
vol/vol). The serum/media mixture then was filtered through a .22-^m sterile filter.. No
antibiotics were add to the mixture.
Muscle extiact preparatioa Preparation of muscle extract was done essentially
following the procedures of Haugk et al. (1995), with the modifications described by
Kerth (1999). A 10-g sample of longissimus muscle from each carcass in the experiment
in Chapter III was removed from the left side of the carcass prerigor (20 min after
exsanguination) for muscle extraction. All visible fat and cormective tissue were
removed, and the sample was placed in a 50-mL conical tube with 30 mL of extraction
buffer (50 mM Tris and 10 mM EDTA with leupeptin, ovomucoid, and PMSF
[phenylmethylsulfonyl fluoride to inhibit proteolysis]. The sample was homogenized for
123

45 s using a tissue teai-er and tt-ansferred to a 50-niL high-speed centrifuge tube. The
samples were centiifuged (40,000 x g for 30 min), and filtered through cheesecloth to
clarify. The protein concentration of each sample was determined (biuret assay using
known BSA concentiations of 0, 2.5, 5.0, 7.5, and 10.0 mg/niL of protein; Layne, 1957)
and 400 |ag/niL of muscle protein and 3"o (vol/vol) FBS were added to SKBM medium,
and filtered tiirough a .22-|.im filter to sterilize for treatment of primary bovine muscle
cultures.
Protein synthesis assay. The procedure for determining the rate of protein
synthesis as measured by uptake of labeled amino acids was done essentially as described
by ReecN et al. (1994). Briefly, primary bovine muscle cell cultures were subcultured
from the flasks above into 24 well plates (approximately 5,000 cells/well determined
using hemocytometry) and allowed to grow for 72 h to a confluence rate of 70%. The
medium then was aspirated and replaced with 1.0 mL of SKBM medium containing
treatment semm or muscle extract. After a 24 h of incubation, 1 |j,Ci of a '''C-labeled
amino acid mixture was added to each well. The cells were labeled for 2 h, then the
medium was removed and the cells were lysed by adding 0.5 mL of 1 M NaOH to each
well. After 2 h, 0.5 mL of 20% (wt/vol) TCA was added, and the plates were placed in
the refrigerator ovemight. Cells were then harvested and counted in a liquid scintillation
counter. All assays were performed in triplicate and counts per minute were expressed as
a percent increase over the SKBM intemal control (without semm).
Protein degradation assay. Muscle cell protein degradation percent was
determined by following steps similar to those of Ballard et al. (1986). Once again.
124

primary bovine muscle cultures were plated in 24 well plates (approximately 5,000
cells/well determined by hemocytometry) and allowed to grow for 72 h. The medium
then was replaced with 1.0 mL of SKBM with 10% (vol/vol) FBS and 1 iCi of ''Re
labelled amino acids. .After a 24 h incubation, the labeling medium was removed, and
each well was washed twice with fresh media. One mL of SKBM with treatment serum
or muscle extract was placed in each well and incubated for 4 h. The chase medium was
removed, each well was rinsed, and 1.0 niL of SKBM containing 5% (vol/vol) treatment
serum or muscle extract was placed in each well. Each plate then was incubated for an
additional 2 h. One-half mL of the medium was transferred to a 1.5-mL tube. To this, .5
mL of cold 20% TCA (final concentration of 10% TCA) was added, vortexed, transferred
to a glass-fiber filter, and rinsed wdth 5% TCA. Additionally, 0.5 mL of the medium was
transferred to a scintillation vial and counted for total cpm. Finally, the cells were lysed,
harvested, and counted as described for amino acid uptake. The samples for each animal
were analyzed in triplicate. Percent protein degradation was expressed using the formula
in Exp. 1.
Statistical Analyses
The data in Exp. 1 and 2 were analyzed as a 2 x 2 factorial arrangement consisting
of two vitamin D treatments and two treatment times. Because of vast differences in
physiological and biochemical behavior of muscle myoblasts and myotubes, this 2 x 2
factorial arrangement was used for each cell type. Data for Exp. 1 and 2 were not
analyzed as a repeated measure because the 24 h and 48 h treatment times were
125
completed on different petri dishes and well plates. An experimental unit consisted of the
average of tiiree wells for Exp. 1 and of a petri dish for I'xp. 2. For experiment 3 the data
were analyzed as a 4 b> 3 factorial arrangement consisting of four vitamin D treatments
and tiiree biological types of cattle. For l-xp. 3, an experimental unit consisted of muscle
and serum extiacts from a pen of tiiree steers. Data were analyzed according to Steel and
Torrie (1980). and means were separated with the pdiff option using Proc GLM
procedures of SAS using a Fishers's least significance difference and an alpha level of
5% (1994, SAS Inst. Inc.. Cary, NC).
Results
Treatment of C2C12 mouse myoblasts with 1,25-dihydroxyvitamin D3 for 24 and
48 h resulted in a decrease (P = 0.04) in cellular protein synthesis (Table 17), however
protein degradation was not affected by the vitamin D treatment. For C2C12 myoblasts,
there was not a treatment by treatment time interaction for cellular protein synthesis or
degradation. There was however, a vitamin D treatment by treatment time interaction for
protein synthesis (P = 0.05) and degradation (P = 0.04) in C2C12 myotubes. When
C2C12 myotubes were treated with 100 nM of l,25-(OH)2 D3 for 24 h, protein synthesis
was decreased, although treatment for 48 h resulted in no differences (P > 0.05) in
cellular protein synthesis (Figure 15). Protein degradation was increased four-fold by
vitamin D treatment for 24 h in C2C12 myotubes, yet 48 h treatment with 100 nM of
I,25-(OH)2 D3 resulted in no differences in protein degradation (Figure 15). Thus, there
126
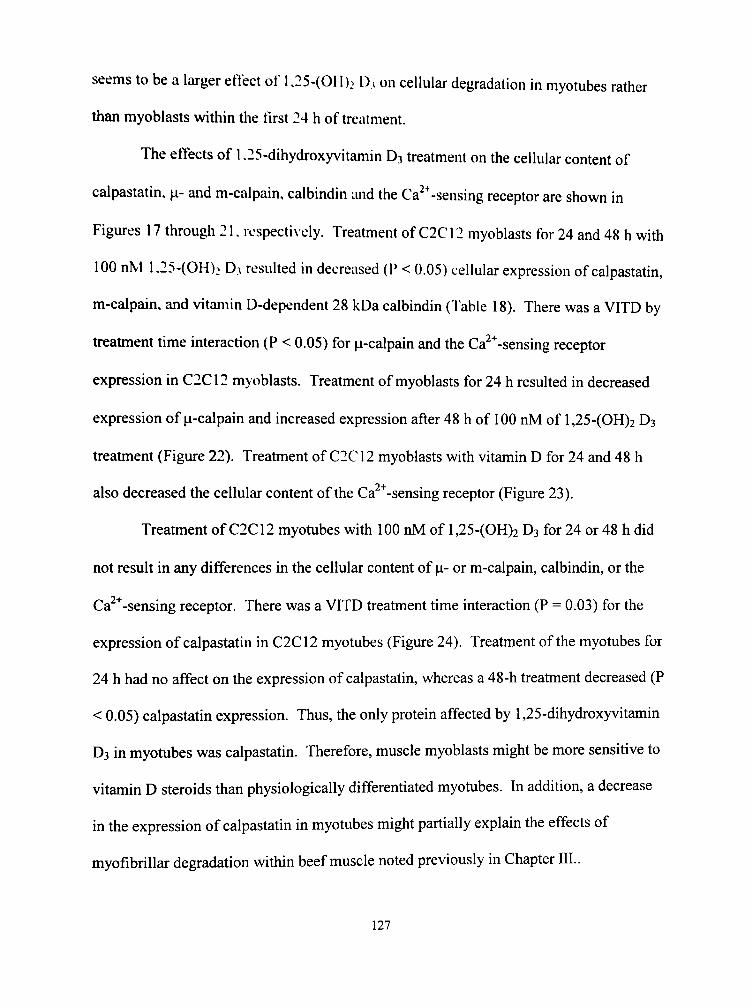
seems to be a larger effect of l,25-(OFI)2 D, on cellular degradation in myotubes rather
than myoblasts within the first 24 h of treatment.
The effects of 1.25-dihydroxyvitamin D3 treatment on the cellular content of
calpastatin, [x- and m-calpain, calbindin and the Ca ' -sensing receptor are shown in
Figures 17 through 21, respecti\ ely. Treatment of C2C12 myoblasts for 24 and 48 h with
100 nM l,25-(OH)2 D3 resulted in decreased (P < 0.05) cellular expression of calpastatin,
m-calpain, and vitamin D-dependent 28 kDa calbindin (Table 18). There was a VITD by
tieatment time interaction (P < 0.05) for |a-calpain and the Ca ' -sensing receptor
expression in C2C12 myoblasts. Treatment of myoblasts for 24 h resulted in decreased
expression of |i-calpain and increased expression after 48 h of 100 nM of l,25-(OH)2 D3
tieatment (Figure 22). Treatment of C2C12 myoblasts with vitamin D for 24 and 48 h
also decreased the cellular content of the Ca^^-sensing receptor (Figure 23).
Treattnent of C2C12 myotiibes with 100 nM of l,25-(OH)2 D3 for 24 or 48 h did
not result in any differences in the cellular content of p,- or m-calpain, calbindin, or the
Ca^^-sensing receptor. There was a VITD treatment time interaction (P = 0.03) for the
expression of calpastatin in C2C12 myotubes (Figure 24). Treatment of the myotubes for
24 h had no affect on the expression of calpastatin, whereas a 48-h treatment decreased (P
< 0.05) calpastatin expression. Thus, the only protein affected by 1,25-dihydroxyvitamin
D3 in myotubes was calpastatin. Therefore, muscle myoblasts might be more sensitive to
vitamin D steroids than physiologically differentiated myotubes. In addition, a decrease
in the expression of calpastatin in myotubes might partially explain the effects of
myofibrillar degradation within beef muscle noted previously in Chapter III..
127
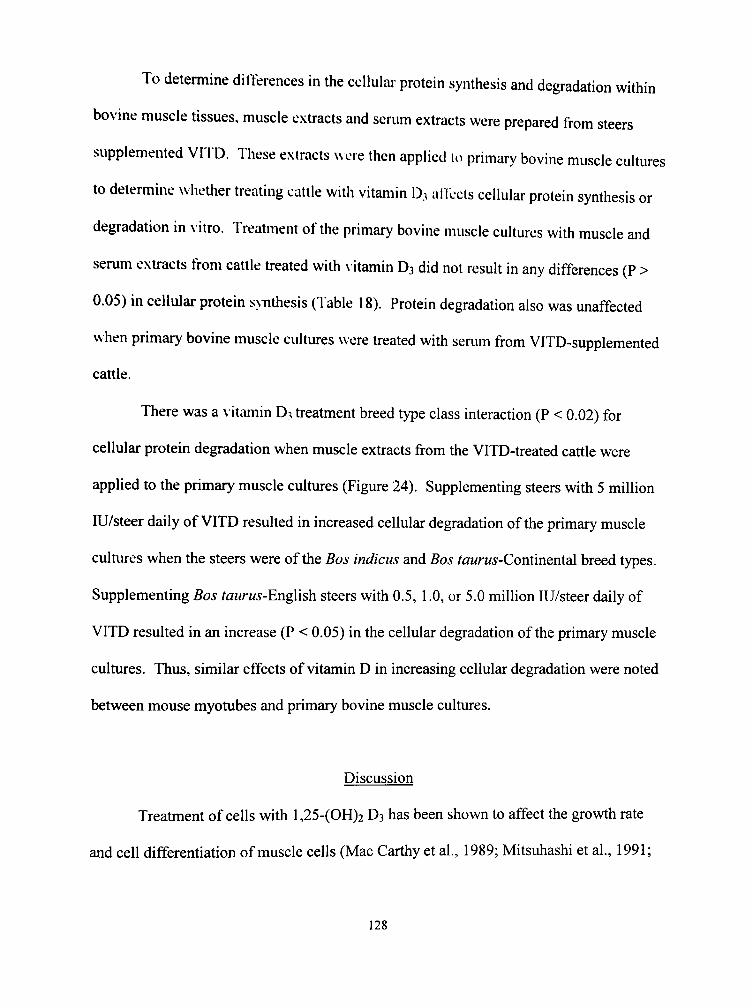
To determine differences in the cellular protein synthesis and degradation within
bovine muscle tissues, muscle extiacts and serum extracts were prepared from steers
supplemented VITD. These extracts were then applied to primary bovine muscle cultures
to determine whetiier treating cattle with vitamin D3 aflects cellular protein synthesis or
degradation in \ itro. Treatment of the primary bovine muscle cultures with muscle and
serum exU-acts from cattle treated with \itamin D3 did not result in any differences (P >
0.05) in cellular protein s>Titiiesis (Table 18). Protein degradation also was unaffected
when primary bovine muscle cultures were tt-eated with serum from VITD-supplemented
cattle.
There was a \ itaniin D3 tt-eatment breed type class interaction (P < 0.02) for
cellular protein degradation when muscle extracts from the VITD-treated cattle were
applied to the primary muscle cultures (Figure 24). Supplementing steers with 5 million
lU/steer daily of VITD resulted in increased cellular degradation of the primary muscle
cultures when the steers were of the Bos indicus and Bos towrw^-Continental breed types.
Supplementing Bos rawrw^-English steers with 0.5, 1.0, or 5.0 million lU/steer daily of
VITD resulted in an increase (P < 0.05) in the cellular degradation of the primary muscle
cultures. Thus, similar effects of vitamin D in increasing cellular degradation were noted
between mouse myotubes and primary bovine muscle cultures.
Discussion
Treatment of cells with l,25-(OH)2 D3 has been shown to affect the growth rate
and cell differentiation of muscle cells (Mac Carthy et al., 1989; Mitsuhashi et al., 1991;
128
Capiati et al., 1999). The steroid l,25-(OH)2 D3 also has been shown to increase the
synthesis of eellulai- protein in intestinal cells (Wilson and Lawson, 1978) and vascular
smooth muscle (Inoue and Kawashima, 1988; Bukoski et al.. 1989). In the present
experiments, 1.25-(OH)2 D3 decreased eellulai- protein synthesis in myoblasts and
myotubes, whereas protein degradation was increased.
Tw o major proteohlic systems have been studied with regard to protein turnover
in muscle growth: calpains and the ubiquitin-proteasome. The calpains are Ca^ -
acti\ated c>steine proteases that have been shown to play a role in muscle cell protein
degradation (Goll et al., 1998; Huang and Forsberg, 1998). The calpains also function in
membrane fusion, apoptosis and cell proliferation (Schollmeyer, 1986, 1988; Squier et
al., 1994). Many of these same fimctions also are affected by l,25-(OH)2 D3 (Abe et al.,
1983; Walters, 1992; Welsh et al., 1994). Thus, it is possible to imagine that l,25-(OH)2
D3 regulates the expression of the calpain family, and this regulation leads to the
differences in protein s> nthesis and degradation seen within these experiments and
others.
Berry and Meckling-Gill (1999) demonstrated that expression of |i-calpain was
upregulated by vitamin D analogs [including l,25(OH)2D3 ] in NB4 promyelocytic
leukemia cells, while Ravid et al. (1994) showed that l,25(OH)2D3 treatment increased
the expression of ^-calpain in renal carcinoma cells. However, Berry and Meckling-Gill
(1999) also noted the increase in calpain expression after 8 h of l,25(OH)2D3 tieatment
was blocked by addition of ip,25-dihydroxyvitamin D3, an antagonist to the nongenomic
activities of l,25(OH)2D3, to the cultiire media, indicating that the nongenomic signaling
129
patiiways are required for this response to l,25(OH)2D3. The present experiments, 1,25-
(0H)2 D3 decreased the expression of calpastatin, |a-calpain, and m-calpain within 24 h of
treatment, whereas expression of p-calpain was increased after 48 h of treatment. The
C2C12 cells are derived from a subclone from a myoblast line established from normal
adult mouse leg muscle, ^^'hether the differences in l,25-(OH)2 D3-induced ^i-calpain
expression between our study and the ones conducted by Ravid et al. (1994) and Berry
and Meckling-Gill (1999) are because our study was conducted on muscle cells or
because of differences between noncarcinoma and carcinoma cells remains unclear. It is
important to note that this work is the first to demonstrate 1,25-(OH)2 D3 affects the
cellular content of calpastatin and \i- and m-calpain in muscle cells.
This work also demonstrates that calpastatin and { -calpain are both expressed in
myogenic C2C12 myoblasts prior to fusion and myotube formation. Recent studies have
indicated that calpain activity is required for myoblasts to progress through Gl to S phase
of tiie mitotic cycle and for myoblast fiision (Mellgren, 1997; Goll et al., 1998; Temm-
Grove et al., 1999). Both Cottin et al. (1994) and Temm-Grove et al. (1999) have
previously shown, as in this sttady, that [i- and m-calpain, and calpastatin expression are
greatly mcreased when C2C12 myoblasts begin fusion. Results of the present stiidy also
indicated that fusion increased expression of the Ca^^-sensing receptor and calbindin.
1,25-Dihydroxyvitamin D3 induces the cellular synthesis of both a 9kDa and 28
kDa Ca-binding protein, calbindin, in myoblasts (Walters, 1992). Induction of the
calbindin protein by l,25-(OH)2 D3 in avian muscle and myoblasts has been shown by
Drittanti et al. (1993, 1994) and Christakos et al. (1989). Varghese et al. (1988)
130
demonstiated tiiat calbindin 28 kDa was not expressed in rat skeletal muscle, whereas the
present results indicate that calbindin 28 kDa is expressed in C2C12 myoblasts and
myotubes. The reason why 1.25-(OH)2 D3 treatment decreased the expression of
calbindin in myoblasts but not in myotubes remains unknown. Treatment of myoblasts
with 1.25-(OH)2 D3 has been shown to down-regulate the expression of the vitamin D
receptor (Boland, 1986; Walters, 1992; Boland et al., 1995). A decrease in the vitamin D
receptor expression could also decrease the cellular content of calbindin.
The extracellular Ca"^-sensing receptor has been shown to be expressed in a
\ariety of tissues (Riccardi, 1999). The present is the first experiment to indicate that the
extracellular Ca"*-sensing receptor is expressed in myoblasts and myotubes. The effect
of expression by l,25-(OH)2 D3 treatment is not fully understood. Treatment of vitamin
D-deficient rats with 1.25-Dihydroxyvitamin D3 did not affect Ca -sensing receptor
expression in parathyroid glands or kidney cells (Rogers et al., 1995). Yet, Brown et al.
(1996) and Yarden et al. (2000) found that l,25-(OH)2 D3 treatment upregulated the
extracellular Ca '* -sensing receptor. In agreement with the present experiments Yano et
al. (2000) found 1,25-(OH)2 D3 treatment dowoi-regulated both the vitamin D and
extiacellular Ca^"'-sensing receptors. Therefore, l,25-(OH)2 D3 seems to a play a distinct
role in the regulation of calpastatin, i^-calpain, m-calpain, calbindin, and the extracellular
Ca^"^-sensing receptor of the muscle cell.
131
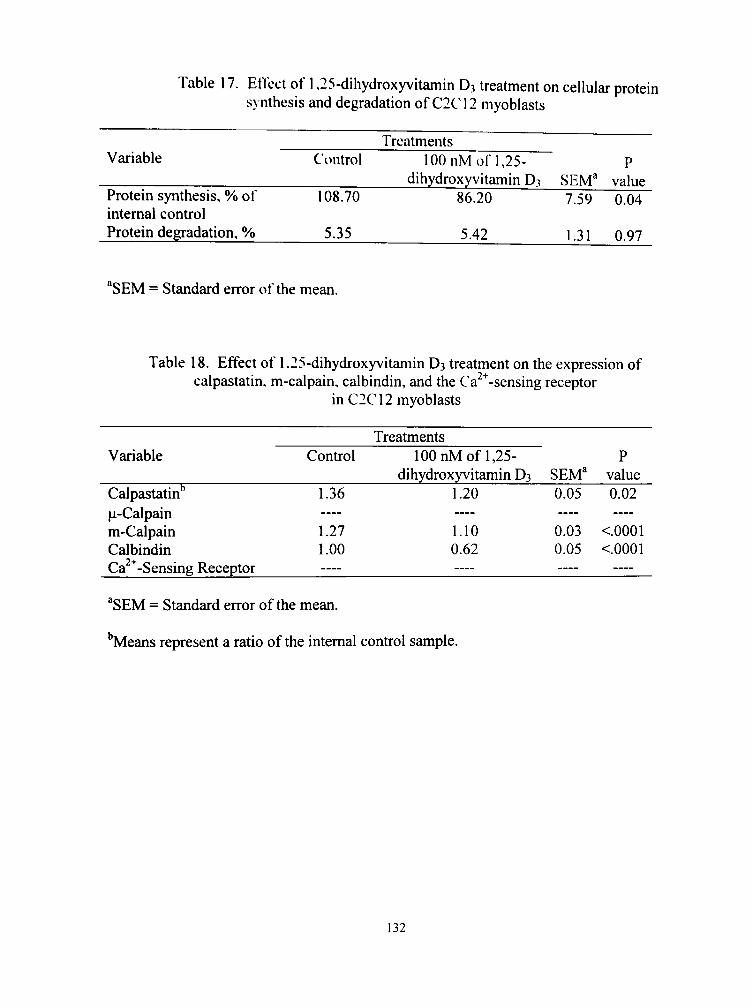
Table 17. Effect of 1.25-dihydroxyvitamin D3 treatment on cellular protein synthesis and degradation of C2C12 myoblasts
Treatments Variable Control 100 nM of 1,25- p
dihydroxyvitamin D3 SEM" value Protein syntiiesis, % of 108.70 86.20 7.59 0.04 intemal control Protein degradation, % 5.35 5.42 1.31 0.97
"SEM = Standard error of the mean.
Table 18. Effect of 1.25-dihydroxyvitaniin D3 treatment on the expression of calpastatin. m-calpain, calbindin, and the Ca ' -sensing receptor
in C2C12 myoblasts
Variable
Calpastatin" |i-CaIpain m-Calpain Calbindin Ca *-Sensing Receptor
Control
1.36
1.27 1.00
Treatments 100 nM of 1,25-
dihydroxyvitamin D3 1.20
1.10 0.62
SEM" 0.05
0.03 0.05
P value 0.02
<.0001 <.0001
"SEM = Standard error of the mean.
"Means represent a ratio of the intemal control sample.
132
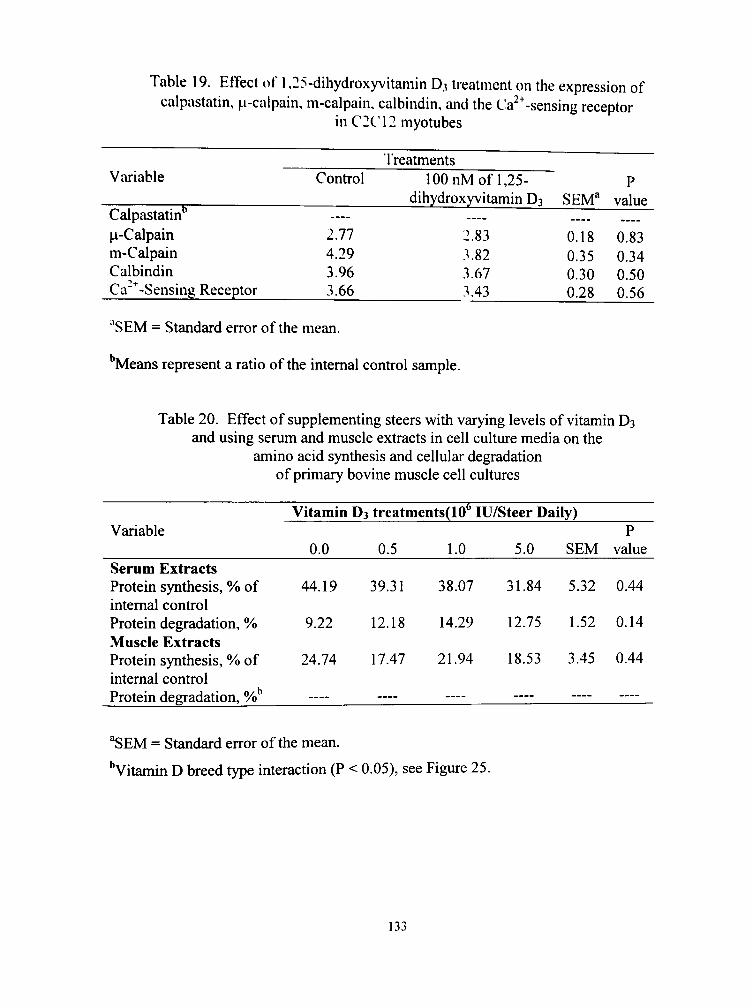
Table 19. Effect of 1.25-diliydroxyvitamin D3 treatment on the expression of calpastatin, ^i-calpain, m-calpain, calbindin, and the Ca^^-sensing receptor
inC2C12 myotubes
Variable
Calpastatin" |a-Calpain m-Calpain Calbindin Ca"*-Sensing Receptor
Contiol
—
2.77 4.29 3.96 3.66
Treatments 100 nM of 1,25-
dihydroxyvitamin D3 —
2.83 3.82 3.67 3.43
SEM"
0.18 0.35 0.30 0.28
P value
. . . .
0.83 0.34 0.50 0.56
"SEM = Standard error of the mean.
"Means represent a ratio of the intemal control sample.
Table 20. Effect of supplementing steers with varying levels of vitamin D3 and using serum and muscle extracts in cell culture media on the
amino acid synthesis and cellular degradation of primary bovine muscle cell cultures
Variable
Serum Extracts Protein synthesis, % of intemal control Protein degradation, % Muscle Extracts Protein synthesis, % of intemal control Protein degradation, %
Vitamin D
0.0
44.19
9.22
24.74
—
3 treatments(10*' lU/Steer Daily)
0.5
39.31
12.18
17.47
—
1.0
38.07
14.29
21.94
—
5.0
31.84
12.75
18.53
—
SEM
5.32
1.52
3.45
—
P value
0.44
0.14
0.44
—
"SEM = Standard error of the mean.
"Vitamm D breed type interaction (P < 0.05), see Figure 25.
133
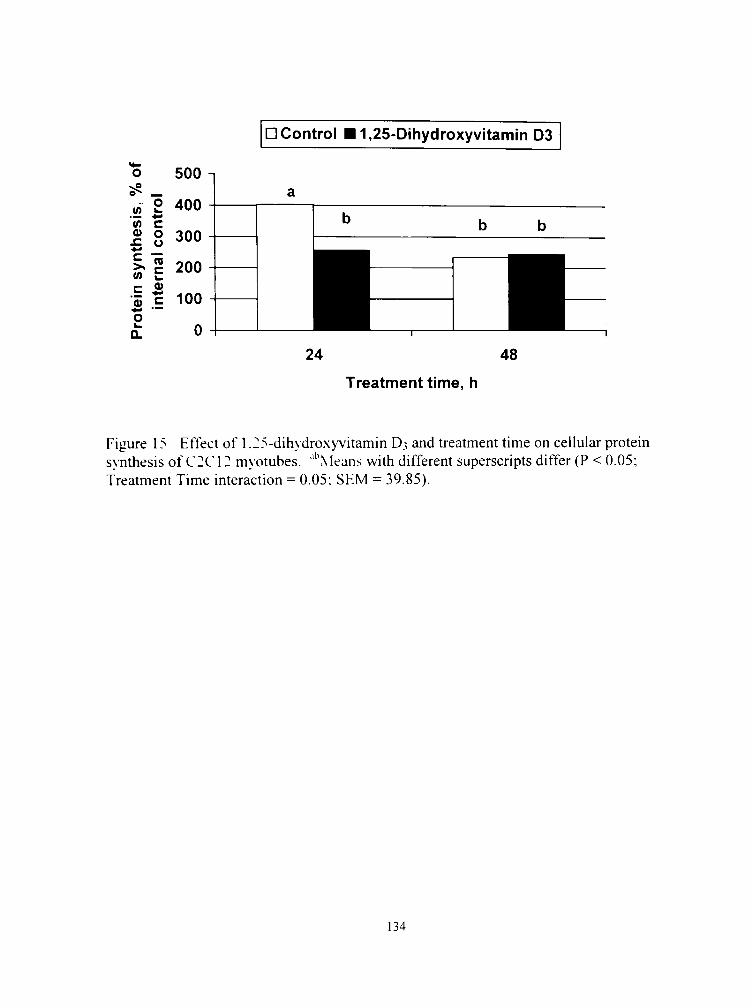
D Control •1,25-Dihydroxyvitamln 03
24 48
Treatment time, h
Figure 15 Effect of 1.25-dih>droxyvitamin D3 and treatment time on cellular protein SNTithesis of C2C12 myotubes. '''Means with different superscripts differ (P < 0.05; Treatment Time interaction = 0.05: SEM = 39.85).
134
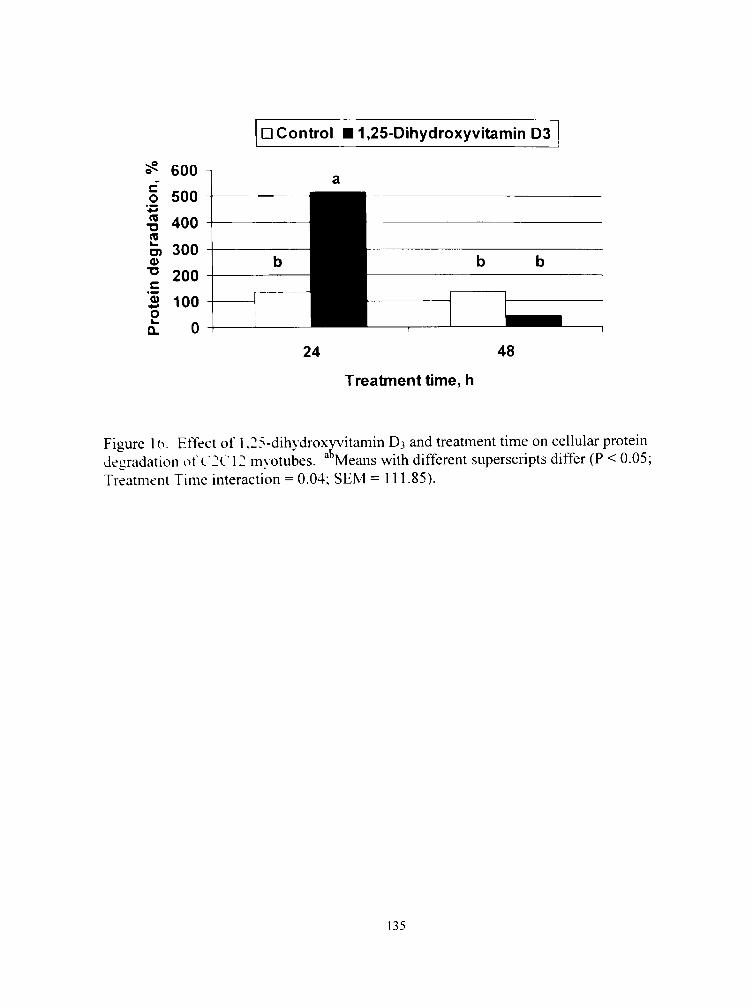
n Control •1,25-Dihydroxyvitamin 03
5 on
,
<-> T3 n D) 0) •a
tei
o Q.
600
500
400
300
200
100
0
24 48
Treatment time, h
Figure 1 b. Effect of 1.25-dihydroxyvitamin D3 and treatment time on cellular protein degradation of C2C12 m>otubes. Means with different superscripts differ (P < 0.05; Treatment Time interaction = 0.04; SEM = 111.85).
135
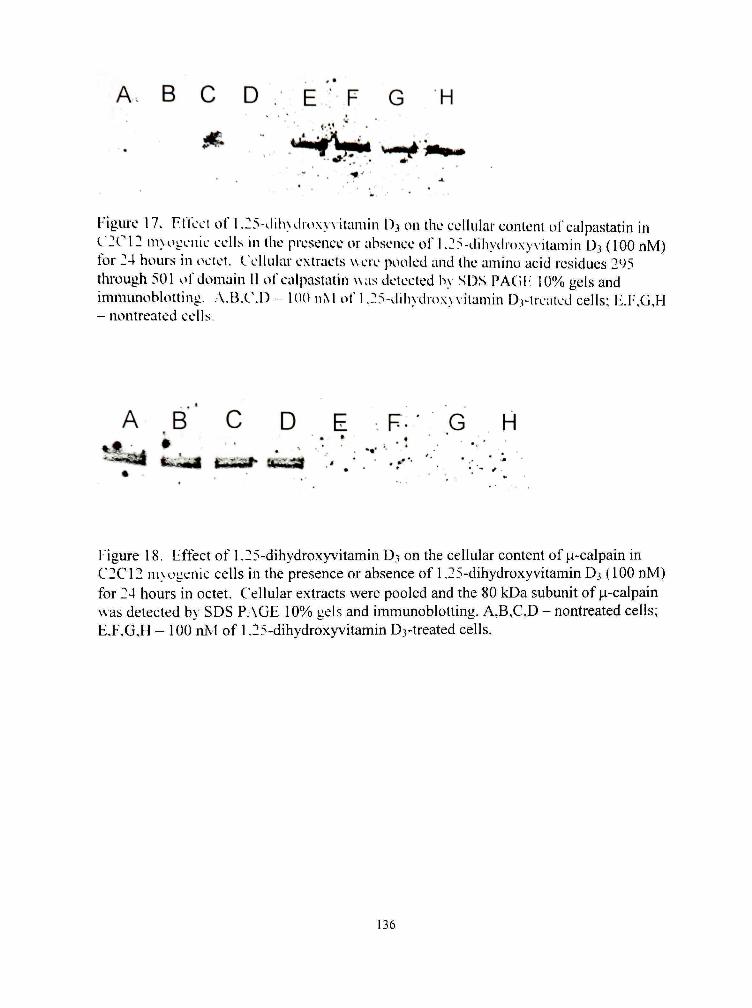
A B C D E ' F G H
i..
Figure 17. Effect of 1.25-dih\d!o\y\ itamin D3 on the cellular content of calpastatin in C2C12 nnogenic cells in the presence or absence of l,25-dihydro.\yvitamin D3 (100 nM) for 24 hours in octet. Cellular extracts were pooled and the amino acid residues 295 tiirough 501 of domain II of calpastatin was detected b\ SDS PAGf; 10% gels and imnumoblotting. .A.B.C.D - 100 nM of 1.25-dihydio\yvilamin D3-lrealed cells; 1%F.G,H - nontreated cells.
A B' C D E F- • G H
' — ^ fe.«^ t-iirf- tfciisa
Figure 18. Effect of 1.25-dihydroxyvitamin D3 on the cellular content of p-calpain in C2C12 m\oeenic cells in the presence or absence of 1.25-dihydroxyvitamin D3 (100 nM) for 24 hours in octet. Cellular extracts were pooled and the 80 kDa subunit of p-calpain was detected by SDS P.AGE 10% gels and immunoblotting. A,B,C,D - nontreated cells; E.F.G.H - 100 nM of 1.25-dihydroxyvitamin D3-treated cells.
136

A B C D -E F ' G H . * ^ '> ^^ (HI
Figure l*-). Effect of 1.25-dih>dro\y\itanun Ds on the cellular content of m-calpain in C2C12 niNogenic cells in the piesence or absence of 1.25-dihydroxyvitaiTiin D3 (100 nM) for 24 hours in octet. Cellular extracts wcie pooled and the 80 kDa subunit of m-calpain was detected by SDS PA(il l()"o gels and immunoblotting. A.B.C.D - 100 nM of 1.25-dih\droxyvitamin D;-tieated cells; E.F.Ci.l 1 - nontreated cells.
A B C D ' ^
Figure 2U. Effect of 1.25-dihydroxyvitamin D3 on the cellular content of the vitamin D-dependent 28 kDa protein calbindin in C2C12 myogenic cells in the presence or absence of 1.25-diliydrox\v'itamin D3 (100 nM) for 24 hours in octet. Cellular extracts were pooled and the protein calbindin was detected by SDS PAGE 10% gels and immunoblotting. A3 - nontreated cells; C,D - 100 nM of 1,25-dihydroxyvitamin D3-treated cells.
137

• A . B C D . • •
Figure 21. 1 tTect of l,25-dihydro\>\ itaniin 1); on the cellular content of the calcium-sensing receptor in C2C12 nnogeiuc cells in the presence or absence of 1,25-dihydrox) \ itamin D-, (100 iiM) for 24 hours in octet. Cellular extracts were pooled and the 12'" through the 27"' residues of the calcium-sensing receptor were detected by SDS P.ACTI: lO^o gels and immunoblotting. .\.C - nontreated cells; C.D - 100 nM of 1,25-dihvdroxN"\itaiiiin D, treated cells.
138

D Control • 1,25-Oihydroxyvitamin 03
24 48
Treatment time, h
Figure 22. Fffect of 1.25-dih\droxyvitamin D3 and treatment time on the expression of p-calpain of C2C12 myoblasts. """Means with different superscripts differ (P < 0.05; Treatment Time interaction = 0.02; SEM = 0.12).
139

n Control •1,25-Oihydroxyvitamin 03
•S 1.6 n
Treatment time, h
Figure 23 Effect of 1.25-dili>droxyvitamin D3 and treatment time on the expression of the calcium-sensing receptor of C2C12 myoblasts. ""Means with different superscripts differ P < 0.05; Treatment Time interaction = 0.005; SEM = 0.06).
140
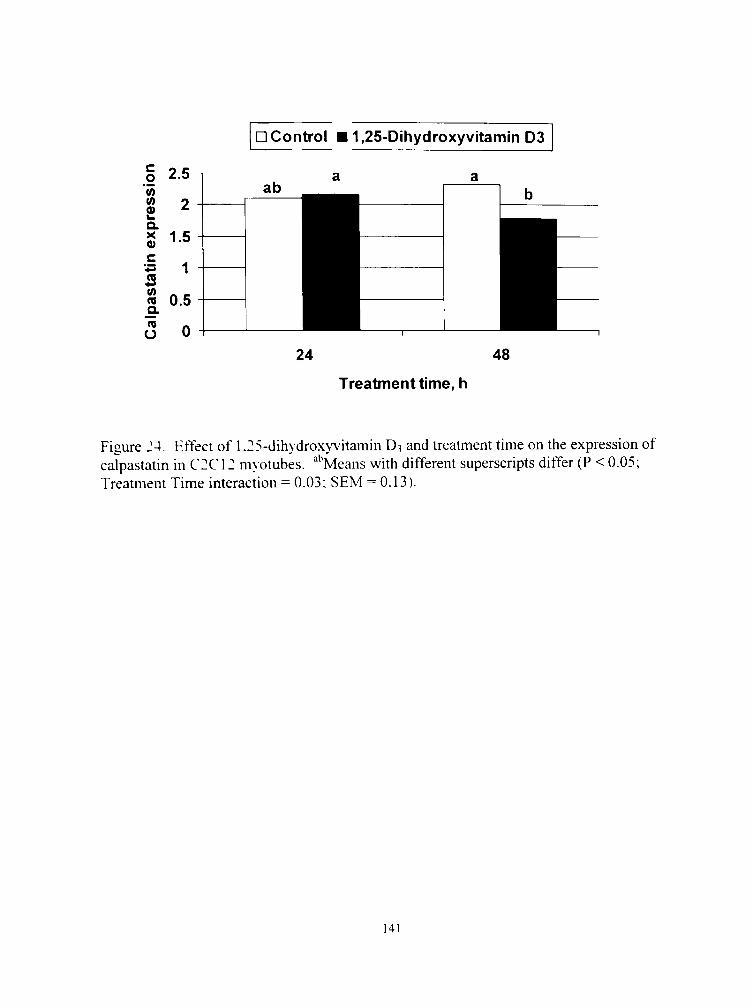
UO
IS
in
Kpr
e
a> c
ista
t al
ps
u
2.5 n
2 -
1.5 -
1
0.5 -
0 -
D Control
ab
24 48
Treatment time, h
Figure 24. Effect of 1.25-dihydroxyvitamin D3 and treatment time on the expression of calpastatin in C2C12 m\ otubes. ^"Means with different superscripts differ (P < 0.05; Treatment Time interaction = 0.03; SEM = 0.13).
141
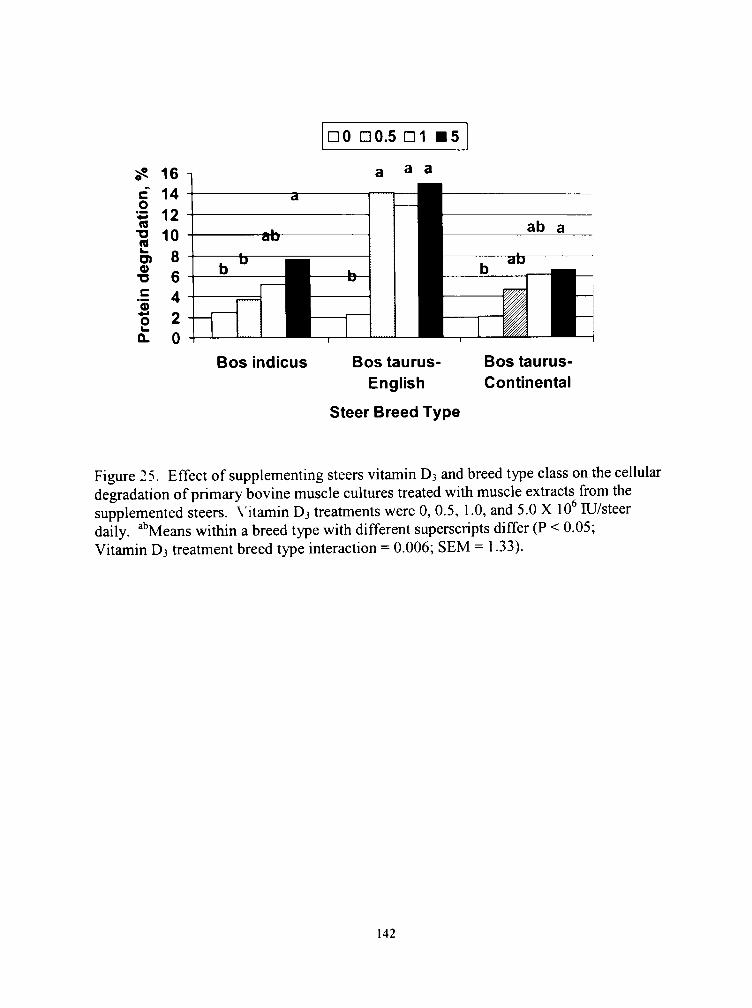
DO no.5 D I
a a
Bos indicus Bos taurus-English
Steer Breed Type
Bos taurus-Continental
Figure 25. Effect of supplementing steers vitamin D3 and breed type class on the cellular degradation of primary bovine muscle cultures treated with muscle extracts from the supplemented steers, \itamin D3 treatments were 0, 0.5, 1.0, and 5.0 X 10 lU/steer daily. ""Means within a breed type with different superscripts differ (P < 0.05; Vitamin D3 treatment breed type interaction = 0.006; SEM = 1.33).
142

CIIAI'fER VI
SUMMARY Of f.XPl'RlMI'NlS
fhe elTect of supplemental \^I fD dose concentration and breed type of cattle on
tcedlot performance, residues, meat tenderness, and muscle calcium homeostasis was
studied. Supplementing cattle with \ l 11) at a dose t)f 5 million lU/sleer daily negatively
impacted a\ erage daily gain and feed intake, but feeding.5 million lU/steer daily did not
negatively impact feedlot performance data. .All the VITD levels studied improved meat
tenderness. Sensor\ panel scores and W BS indicated that the longissimus and
semimembranosus muscles were the most VITD responsive. Tissue VITD residues in the
li\er. kidne\, and muscle were increased b\' supplementing steers with VITD. Cooking
samples decreased treatment effects on residues. Supplementing steers with VITD also
increased the calcium content of meat and activated p-calpain, thereby increasing
m\ofibrillar proteohsis and degradation of troponin T. Therefore, vitamin D
supplementation at a lexei as low as .5 X 10*' lU/steer daily of beef cattle can improve
meat tendemess.
The effect of VITD supplementation on muscle mineral metabolism also was
investigated. VITD increased the binding of Ca near the Z-line and to myofibril proteins.
Moreo\ er. VITD supplementation and postmortem aging increased the concentration of
Ca"* and P in the cytosol of longissimus muscle.
Several of cell culture experiments were devised to try and explain the role of
vitamin D in muscle cell protein synthesis and degradation. Treatment of myoblasts and
143
myotubes witii 1,25-(011): D3 resulted in a decrease in protein synthesis. Treatment of
C2C12 cells with l,25-(OH): D3 and treatment of primary bovine muscle cultures with
muscle extracts from xitaniin Ds-treated steers resulted in an increase in cellular protein
degradation. The eellulai- content of calpastatin, n- and m-calpain, calbindin, and the
calcium-sensing receptor as affected by l,25-(OH)2 D3 treatment also was investigated.
Expression of p- and m-calpain, calbindin, and the calcium-sensing receptor were not
affected by vitamin D tieatment in C2C12 myotubes, although calpastatin content was
decreased by 48 h 1.25-(OH)2 D3 tieatment. The expression of calpastatin, m-calpain,
calbindin, and the calciimi-sensing receptor was down-regulated by l,25-(OH)2 D3
treatment of C2C12 myoblasts. The content of p-calpain in myoblasts was increased by
48 h 1.25-(OH)2 D3 tteattnent. Therefore, the effects of l,25-(OH)2 D3 treatment on
cellular degradation might be attiibuted to regulation of calpastatin, ^-calpain, and m-
calpain expression in muscle tissue.
Supplementation of beef cattle from different biological types with .5 million
lU/animal daily of VITD seems to have the potential for improving meat tendemess and
the marketability of beef without negatively impacting feedlot performance or residues in
the meat or liver. Supplementing VITD to beef cattle appears to increase cytosolic Ca in
muscle, which is partially bound near the Z-line. This increase in bound myofibrillar Ca
and free cytosolic Ca^^ activates the calpain system and increases myofibrillar proteolysis
thereby improving meat tenderness. VITD supplementation also has a role in regulating
tiie calpain system independent of Ca metabolism alone.
144
TTERATURF: CITI:D
AAP (American Academy of Pediatiics). 1963. The prophylactic requirement and the toxicity of vitamin D. Pediatiics. 31:512-525.
Abe, E., C. Miyura, H. Tanaka, Y. Shina, T. Kuribayashi, S. Suda, Y. Nishii, H. F. DeLuca, and T. Suda. 1983. l(x25-Dihydroxyvitamin D3 promotes fusion of mouse alveolar macrophages both by direct mechanism and by spleen cell-mediated indirect mechanism. Proc. Natl. Acad. Sci. 80:201-204.
Airey, J. A., C. F Beck. K.. Murakami. S. J. Tanksley, T. J. Deerinck, M. H. Elhsman, and .1. L. Sutko. 1990. Identification and localization of two triad junctional foot protein isoforms in mature avian fast twitch skeletal muscle. J. Biol. Chem. 265:14187-14194.
Allen, V. G., J. P. Fontenot, and J. H. Herbein. 1994. Influence of aluminum citrate and containing-containing antacids on magnesium metabolism in sheep. In: Magnesium, S. Golf, D. Dralle, and L. Vecchiet, ed). John Libbey and Co. pp 127-133.
AMSA. 1995. Research Guidelines for Cookery, Sensory Evaluation and Instmmental Tendemess of Fresh Meat. National Live Stock and Meat Board, Chicago, IL.
Anderson, T. J., and F. C. Parrish, Jr. 1989. Postinortem degradation of titin and nebulin ofbeefmuscles varying in tendemess. J. Food Sci. 54:748-749.
AOAC. 1990. Official Methods of Analysis. 15'"ed. Association of Official Analytical Chemists, Arlington, VA.
Bakolitsa, C . J. M. de Pereda, C. R. Bagshaw, D. R. Critchley, and R. C. Liddington. 1999. Crystal stmcture of the vinculin tail suggests a pathway for activation. Cell 99:603-613.
Ballard, F.J., L.C. Read, G.L. Francis, C.J. Bagley, and J.C. Wallace. 1986. Binding properties and biological potencies of insulin-like growth factors in L6 myoblasts. Biochem.J. 233:223-230.
Bandman, E. 1987. Chemistry of animal tissues. Part 1 - Proteins. In: The Science of Meat and Meat Products. J. F. Price and B. S. Schweigert, (ed). Food and Nutrition Press. Westport, CT pp 61-101.
145

Barrett, M.J. 1987. The cystatins: A new class of cysteine proteinase inhibitors. Trends Biocdhem. Sci. 12:193-196.
Ban-ett, M. J., D. E. Goll, and V. F. Thompson. 1991. Effect of substrate on Ca ^ concentration required for activity of the Ca'*-dependent proteinases, p- and m-calpain. Life Sci. 48:1659-1669.
Bate-Sniitii, E. C , and J. R. Bendall. 1947. Rigor mortis and adenosinctriphosphate. J. Physiol. 106:177-185.
Bate-Smith, E. C . and J. R. Bendall. 1949. Factors determining the time course of rigor mortis. J.Physiol. 110:47-65.
Bechtel, P. J. and F. C. Parrish, Jr. 1983. Effects of postmortem storage and temperature on muscle protein degradation: Analysis by SDS gel electrophoresis. J. Food Sci. 48:294-295. 297.
Beckman, M. J., J. A. Johnson, J. P. Goff, T. A. Reinhardt, D. C. Beitz, and R. L. Horst. 1995. The role of dietar> calcium in the physiology of vitamin D toxicity: Excess dietary \itamin D3 blunts parathyroid hormone induction of kidney 1 -hydroxylase. Arch. Biochem. Biophys. 319:535-539.
Bellin, R. M., S. W. Semett. B. Becker, T. W. Huiatt, and R. M. Robson. 1996. Complete sequence and molecular interaction studies of the intermediate filament protein synemin. Mol. Biol. Cell 7:555a.
Bellin. R. M., S. W. Semett, B. Becker, T. W. Huiatt, and R. M. Robson. 1999. Molecular characteristics and interactions of the intermediate filament protein synemin. J. Biol. Chem. 274:29493-29499.
Bendall, J. R. 1951. The shortening of rabbit muscles during rigor mortis: hs relation to the breakdown of adenosine triphosphate and creatine phosphate and to muscular contraction. J.Physiol. 114:71-88.
Bennett, P. M., and M. Gautel. 1996. Titin domain patterns correlate with the axial disposition of myosin at the end of the thick filament. J. Mol. Biol. 259:869-903.
Berry D M and K. A. Meckling-Gill. 1999. Vitamin D analogs, 20-epi-22-oxa-' 24a.26a,27a,-Trihomo-vitamin D3 and l,24(OH)2-22-ene-24-Cyclopropyl-vitamm
D3 and la,2'5(OH)2-lumisterol3 prime NB4 Leukemia cells for monocytic differentiation via nongenomic signaling pathways, involving calcium and calpain. Endocrinology 140:4779-4788.
146
Bloom, W., and D. W. Fawcett. 1969. A Textbook of 1 listology, 8'" ed. W. B. Saunders Company, Philadelphia, PA. pp. 131-357.
Boehm, M. L., T. L. Kendall, V. F. fhompson, and D. E. Goll. 1998. Changes in the calpains and calpastatin during postmortem storage of bovine muscle J Anim Sci. 76:2415-2434.
Boland, R. 1986. Role of vitamin D in skeletal muscle function. Endocr Rev 7434-448.
Boland, A. R.. and R. Boland. 1985. Suppression of 1.25-dihydroxy-vitamin D3-dependent calcium transport by protein synthesis inhibitors and changes in phospholipids in skeletal muscle. Bioch. Biophys. Acta 845:237-241.
Boland, A. R., and R. L. Boland. 1987. Rapid changes in skeletal muscle calcium uptake induced in vitro by 1,25-dihydroxyvitamin D3 are suppressed by calcium channel blockers. Endocrinology 120:1858-1864.
Boland, A. R., and R. L. Boland. 1994. Non-genomic signal transduction pathway of vitamin D in muscle. Cell. Signaling 6:717-724.
Boland, A. R., and I. Nemere. 1992. Rapid actions of vitamin D compounds. J. Cell. Biochem. 49:32-36.
Boland, A. R., L. E. Albomoz, and R. Boland. 1983. The effects of cholecalciferol in vivo on proteins and lipids of skeletal muscle from rachitic chicks. Calcif Tissue Int. 35:798-803.
Boland, R., A. Norman, E. Ritz. and W. Hasselbach. 1985. Presence of a 1,25-dihydroxy-vitamin D3 receptor in chick skeletal muscle myoblasts. Biochem. Biophys. Res. Comm. 128:305-311.
Boland, A. R., M. Flawia, O. Coso, and R. Boland. 1991. A guanine nucleotide-binding protein mediates 1,25-dihydroxy-vitamin D-3-dependent rapid stimulation of Ca * uptake in skeletal muscle. Bioch. Biophys. Acta 1094:238-242.
Boland, R., A. R. Boland, M. J. Marinissen, G. Santillan, G. Vazquez, S. Zanello. 1995. Avian muscle cells as targets for the secosteroid hormone 1,25-dihydroxy-vitamin D3. Mol. Cell. Endocrinol. 114:1-8.
Bradford, M. M. 1976. a rapid and sensitive method for the quantitation of microgram quantities of protein utilizing the principle of protein-dye binding. Anal. Biochem. 72:248-256.
147

Brown, A. J., M. Zhong, J. Finch, C. Ritter. R. McCracken. J. Morrissey, and E. Slatopolsky. 1996. Rat calcium-sensing receptor is regulated by vitamin D but not by calcium. Am. J. Physiol. 270:F454-460.
Bukoski, R. D.. P. DeWan, and D. A. McCarron. 1989. 1.25 (OH), vitamin D3 modifies growtii and contiactile function of vascular smooth muscle of spontaneously hypertensive rats. Am. J. Hypertens. 2:553-556.
Busch, W. A., F. C Pai-rish, Jr.. and D. E. Goll. 1967. Molecular properties of postmortem muscle. 4. Effect of temperature on adenosine triphosphate degradation, isometiic tension paiameters, and shear resistance of bovine muscle J Food Sci 32:390-394.
Busch, W. A.. D. E. Goll, and F. C. Parrish, Jr. 1968. Molecular properties of postmortem muscle. Isomett-ic tension development and decline in bovine, porcine and rabbit muscle. J. Food Sci. 37:289-299.
Busch, W A.. M. H. Stromer, D. E. Goll, and A. Suzuki. 1972. Ca^^-specific removal of z-lines from rabbit skeletal muscle. J. Cell Biol. 52:367-381.
Bygra\e. F. L., and H. R. Roberts. 1995. Regulation of cellular calcium through signaling cross-talk mvolves an intricate interplay between the actions of receptors, G-proteins, and second messengers. FASEB J. 9:1297-1303.
Capiati, D. A., M. T. Tellezifion, R. L. Boland. 1999. Participation of protein kinase C a in I.25-dihydrix\'-vitamin D3 regulation of chick myoblast proliferation and differentiation. Mol. Cell. Endocrinol. 153:39-45.
Carafoli, E.. and D. Guerini. 1997. The plasma membrane calcium pump. In: Calcium and Cellular Metabolism: Transport and Regulation. J. R. Sotelo and J. C. Benech, eds). Plenum Press, New York, NY, pp 73-84.
Cassens, R.G. 1987 Stmcture of muscle. In: The Science of Meat and Meat Products. (J. F. Price and B. S. Schweigert, eds.) Food and Nutrition Press, Inc. Westport, CT.
Christakos, S., C. Gabrielides, and W. B. Rhoten. 1989. Vitamin D-dependent calcium-binding proteins: chemistry, distribution, functional considerations and molecular biology. Endocr. Rev. 10:3-26.
Ciechanover, A., Y. Hod, and A. Hershko. 1978. A heat-stable polypeptide component of an ATP-dependent proteolytic system from reticulocytes. Biochem. Biophys. Res. Commun. 81:1100-1105.
148

Cong. J.. D. E. Goll, A. M. Peterson, and H-. P Kapprell. 1989. The role of autolysis in activity of the Ca''-dependent proteinases (p-calpain and m-calpain) J Biol Chem. 264:10096-10103.
Conrad, H. R., and S. L. Hansard. 1957. Effects of massive doses of vitamin D on physiological behavior of calcium in cattle. J. Applied Physiol. 10:98-102.
Costa, E. M., H. M. Blau, and D. Feldman. 1986. 1,25-diliydroxyvitamin D3 receptors iuid hormonal responses in cloned human skeletal muscle cells. Endocrinology 119:2214-2220.
Cottin, P., J. J. Brustis. S. Poussard, N. Elamrani, S. Broncard, A. Dicastaing. 1994. Ca2+ -dependent proteinases (calpains) and muscle cell differentiation. Biochim. Biophys. Acta 1223:170-178.
Cross, H. R., R. Moen, and M. S. Stanfield. 1978. Training and testing of judges for sensory analysis of meat quality. Food Technol. 32:48-54.
Culler, R. D., F. C. Parrish, Jr., G. C. Smith, H. R. Cross. 1978. Relationship of the myofibril firagmentation index to certain chemical, physical and sensory characteristicsof bovine longissimus muscle. J. Food Sci. 43:1177-1180.
Dabrowska, R., B. Barylko, E. Nowak, and W Drabikowski. 1973. The origin of the 30,000 dalton protein in troponin preparations. FEBS Lett. 29:239-242.
Davey, C. L., and C. L. Dickson. 1970. Studies in meat tendemess. 8. Ultrastmctural changes in meat during aging. J. Food Sci. 35:56-60.
Davey, C. L., and K. V. Gilbert. 1967. Stmctural changes in meat during aging. J. Food Technol. 2:57-59.
Davey, C. L., and K. V Gilbert. 1969. Studies in meat tendemess. 7. Changes in the fine stmcture of meat during aging. J. Food Sci. 34:69-74.
Davey, C. L. and A. E. Graafhuis. 1976. Stmctural changes in beef muscle during aging. J. Sci. Food Agric. 27:301-306.
Dayton, W. R., D. E. Goll, M. G. Zeece, R. M. Robson, and W. J. Reville. 1976a. A Ca^'^-activated protease possibly involved in myofibrillar protein tumover. Purification from porcine muscle. Biochemistry 15:2150-2158.
Dayton, W. R., W. J. Reville, D. E. Goll, and M. H. Stromer. 1976b. A Ca'^-activated protease possibly involved in myofibrillar protein turnover: Partial characterization of the purified enzyme. Biochemistry 15:2159-2167.
149
Daxton. W R.. .1. I Schollmcwcr, R. \. l.cplc>. and L. R. Coites. I')8I. A calcium-actixated protease possibK invoked in inNolibrillar protein turnoxer. Isolation of a low-calcium-requiring form of the protea.sc. Biochim. Biophys. Acta. 659:48-
Deluca. 11. F U)79. Ihc vitamin D s>sieiu in the regulation of calcium and phosphorus metabolism. Nutr. Rev. 37:1M-1')3.
DeLuca. 11. F.. and C /ierold. 1^98. Mechanisms and functions of \ itamin D Nutr Rev. 5(vS4-S10.
Diaz. R., S. Hurwitz. N. Chattopadh>a>. M. Pines. ' ^•ang. O. Kifor, M. S. Einat. R. Butters. S. C. Hebert. and E. M. Brown. 1997. Am. J. Physiol. 273:R1008-1016.
Drittanti. L. N.. S. B. Zanello. R. L. Boland. 1993. Induction of calbindin D-9K-like protein in avian muscle by a 1.25-dih\droxyvitamin D3. Biochem. Molec. Biol. Int. 32;S59-8(nS.
Drittanti. L. X. S B. Zanello. and R. Boland. 1994. Induction of A calbindin-9kDa-like protein in avian muscle cells h\ 1,25-dihydroxy-vitamin D3. Biochem. Mol. Biol. Int 32:859-867.
Edmunds. T.. P. A. Nagainis. S. K. Sathe. V. F. Thompson, and D. E. Goll. 1991. Comparison of the autolyzed and unautolyzed forms of p.- and m-calpain from bovine skeletal muscle. Biochim. Biophys. Acta 1077:197-208.
El-Saleh, S. C . and R. J. Solaro. 1988. Troponin I enhances acidic pH-induced depression of C a"* binding to the regulatory sites in skeletal troponin C. J. Biol. Chem. 263:3274-3278.
Enright, K. L.. D. K. Anderson. M. Ellis, F. K. McKeith, L. L. Berger, and D. H. Baker. 1998. The effects of feeding high levels of vitamin D3 on pork quality. J. Anim. Sci. 76(Suppl. l):149(Abstr.).
Enright, K. L., K. D. Miller. L. L. Berger, F. K. McKeith, G. Lynch, and M. Ellis. 2000. Influence of level of vitamin D and level and time of feeding of vitamin D3 on growth, carcass, and pork quality characteristics in pigs. J. Anim. Sci. 77(Suppl. l):29(Abstr.).
Feldman, D.. F. H. Glorieux. and J. W. Pike, (eds). 1998. Vitamin D. Academic Press, San Diego, CA, pp. 1-1285.
150

Flicker, P. F.. G. N. Phillips, and C Cohen. 1982. Troponin and its interaction with tropomyosin. J. Mol. Biol. 162:495-501.
Franzini-Armstt-ong, C , F. Protasi, and V. Ramesh. 1998. Comparative ultrastructure of Ca' release imits in skeletal and cardiac muscle. Ann. New York Acad Sci 853:20-30.
Fritz, J. D., L. J. Dietrich, and M. L. Greaser. 1992. Cooking effects on titin in fresh and processed beef products. J. Muscle Foods 3:133-140.
Fuchs, F., and Y- P. Wang. 1996. Saicomere length verses interfilament spacing as detemiinants of cardiac myofilament Ca'"" sensitivity and Ca "" binding J Mol Cell Cardiol. 28:1375-1383.
Fiirst, D. O., M. Osborn, R. Nave, and K. Weber. 1988. The organization of titin filaments in the lialf-sarcomere revealed by monoclonal antibodies in immunoelectron microscopy: A map often nonrepetitive epitopes starting at the Z-line extends close to tiie M-line. J. Cell Biol. 106:1563-1572.
FiJrst, D. O.. R. Nave, M. Osbom, and K. Weber. 1989. Repetitive titin epitopes with a 42 nm spacing coincide in relative position with known A-band striations also identified by major myosin-associated proteins: An immunoelectron microscopial study on myofibril. J. Cell Sci. 94:119-125.
Fyrberg, E., M. Kelly, E. Ball, C. Fryberg, and M. C. Reedy. 1990. Molecular genetics of Drosophila alpha-actinin: Mutant alleles dismpt Z disc integrity and muscle insertions. J. Cell Biol. 110:1999-2011.
Gabellini, N., A. Zatti, and E. Carafoli. 2000. The Na-H/Ca2-(- exchanger: Stmctiiral aspects, fimction and regulation. In: Calcium Homeostasis. E. Carafoli and J. Krebs, eds. Springer-Verlag, Berlin, Germany, pp. 173-188.
Garm, G. L., and R. A. Merkel. 1978. Ultrastmctural changes in bovine longissimus dorsi muscle during postmortem ageing. Meat Sci. 2:129-144.
Gautel, M., D. Goulding, B. Bullard, K. Weber, and D. O. FiJrst. 1996. The central Z-disc region of titin is assembled from a novel repeat in variable copy numbers. J. Cell Sci. 109:2747-2754.
Geiger, B. 1979. A 130K protein from chicken gizzard: Its localization at the termini of microfilament bundles in cultured chicken cells. Cell 18:193-205.
George, J. C , B. J. Bamett, C. Y. Cho, and S. J. Slinger. 1981. Vitamin D3 and muscle function in rainbow trout. Cytobios. 31:7-18.
151
Gerday, C. 1988. Soluble calcium binding proteins in vertebrate and invertebrate muscles. In: Calcium and Calcium Binding Proteins, Molecular and Functional Aspects. (C. Gerday, L. Bolis, and R. Gilles, eds.). Springer-Veriag, Beriin, pp. 23-39.
Goll, D. E. 1991. Role of proteinases and protein turnover in muscle growth and meat quality. Proc. Recip. Meat Conf 44:25-33.
Goll, D. E. W C. Kleese. and Z. Szacenko. 1989. Skeletal muscle proteases and protein turno\er. In D. R. Campion, G. J. Hausman, and R. J. Martin (Ed) Animal Growtii Regulation. p l41 . Plenum Publishing, New York.
Goll, D. E., W. R. Dayton, I. Singh, and R. M. Robson. 1991. Studies of the a-actinin/actin interaction in tiie Z-disk by using calpain. J. Biol. Chem. 2668501-8510.
Goll, D. E., V. F. Thompson, R. G. Taylor, and T. Zalewska. 1992. Is calpain activity regulated by membranes and autolysis or by calcium and calpastatin? BioEssays 14:549-556.
Goll, D. E., V. F. Thompson, R. G. Taylor, and A. Ouali. 1998. The calpain system and skeletal muscle growtii. Can. J. Anim. Sci. 78:503-512.
Granger, B. L., and E. Lazarides. 1979. Desmin and vimentin coexist at the periphery of tiie myofibril Z disc. Cell 18:1053-1063.
Granger, B. L., and E. Lazarides. 1980. Synemin: a new high molecular weight protein associated with desmin and vimentin filaments in muscle. Cell 22:727-738.
Greaser. M. L. 1977. Mechanism of calcium uptake and binding of sarcoplasmic reticulum and mitochondria. Proc. Recip. Meat Conf 30:149-154.
Greaser, M. L. 1991. An overview of the muscle cell cytoskeleton. Proc. Recip. Meat Conf. 44:1-5.
Gulati, J., and A. Babu. 1989. Effect of acidosis on Ca ^ sensitivity of skinned cardiac muscle with troponin C exchange. FEBS Lett. 245:279-282.
Hadari, T., J. V. Warms, I. A. Rose, and A. Hershko. 1992. A ubiquitin C-terminal isopeptidase that acts on polyubiquitin chains. Role in protein degradation. J. Biol. Chem. 267:719-727.
152
Hamby. P. 1992. Palatability problems in restaurant beef In: G.C. Smith (Ed.) The Final Report of the National Beef Quality Audit-1991. pp 194-195. Colorado State Univ., Fort Collins, and Texas A&M Univ., College Station.
Haugk. K. L., R. A. Roeder, M. J. Garber, and G. T. Schelling. 1995. Regulation of muscle cell proliferation by extracts from crushed muscle. J. Anim. Sci. 73:1972-1981.
Haussler, M. R. 1986. Vitamin D receptors: Nature and function. Ann. Rev. Nutr. 6:527-562.
Hay, J. D., R. W. Currie. and F. H. Wolfe. 1973. Polyacrylamide disc gel electrophoresis of fresh and aged chicken muscle proteins in sodium dodecylsulfate. J. Food Sci. 38:987-990.
Hembree, J.R., M.R. Hathaway, and W.R. Dayton. 1991. Isolation and culture of fetal porcine myogenic cells and the effect of insulin, IGF-1, and sera on protein tumover in porcine myotube cultures. J. Anim. Sci. 69:3241-3250.
Hemken. P. M., B. Becker. R. M. Bellin, T. W. Huiatt, and R. M. Robson. 1996. Nucleotide sequence of paranemin reveals it is a novel intermediate filament protein. Mol. Biol. Cell 7:557a.
Hemken, P. M.. R. M. Bellm, S. W. Semett, B. Becker, T. W. Huiatt, and R. M. Robson. 1997. Molecular characteristics of the novel intermediate filament protein paranemin. J. Biol. Chem. 272:32489-32499.
Herzberg, O., J. Moult, and M. N. G. James. 1986. A model for the Ca ' -induced conformational transition of troponin C. J. Biol. Chem. 261:2638-2644.
Hibbs, J. W., and W. D. Pounden. 1955. Stiidies on milk fever in dairy cows. IV. Prevention by short-time prepartum feeding of massive doses of vitamin D. Dairy Sci. 38:65-72.
J.
Hibbs, J. W., W. E. Kraus, W. D. Pounden, C. F. Monroe, and T. S. Sutton. 1946. Stiidies on milk fever in dairy cows. II. The effect of vitamin D on some of the blood changes in normal and milk fever cows at parturition. J. Dairy Sci. 29:767-781.
Hibbs, J. W., W D. Pounden, and W. E. Krauss. 1951. Studies on milk fever in dairy ' cows'. III. Further studies on the effect of vitamin D on some of the blood
changes at parturition and the composition of colostmm in normal and milk-fever cows. J. Dairy Sci. 34:855-864.
153

Hill, G. M., G. Brito, T. D. Pringle, and S. E. Williams. 1999. Performance, plasma Ca, p and Mg, carcass characteristics, and meat tenderness in beef steers fed high levels of vitamin D3. J. Anim. Sci. 77(Suppl. l):18-19(Abstr.).
Ho, C. -Y.. M. W. Stromer, and R. M. Robson. 1994. Identification of the 30 kDa polypeptide in postinortem skeletal muscle as a degradation product of troponin-T. Biochimie 76:369-375.
Ho, C. -Y., M. W. Stiomer, and R. M. Robson. 1996. Effect of electiical stimulation and postmortem storage on changes in titin, nebulin, desmin, and troponin-T degradation and ultrastructural changes in bovine longissimus muscle. J. Anim. Sci. 74:1563-1575.
Hodnett, D. W., N. A. Jorgensen, and H. F. Deluca. 1992. la-Hydroxyvitamin D3 plus 25-hydroxdroxyvitaniin D3 reduces parturient paresis in dairy cows fed high dietary calcium. J. Dairy Sci. 75:485-491.
Hofmann, F., H.-J. Oeken, T. Schneider, and M. Sieber. 1988. The biochemical properties of L-t>pe calcium charmels. J. Cardiovasc. Pharmacol. 12(Suppl. 1):S25-S30.
Hollis, B. W., H. R. Conrad, and J. W. Hibbs. 1977. Changes in plasma 25-hydroxycholicalciferol and selected blood parameters after injection of massive doses of cholecalciferol or 25-hydroxycholecalciferol in non-lactating dairy cows. J.Nutt. 107:606-613.
Horst, R. L. 1986. Regulation of calcium and phosphoms homeostasis in the dairy cow. ' J. Dairy Sci. 69:604-616.
Hove, K., R. L. Horst, and E. T. Littledike. 1983. Effects of la-hydroxyvitamin D3, 1,25-dihydroxyvitamin D3, 1,24,25-trihydroxyvitamin D3, and 1,25,26-trihydroxyvitamin D3 on mineral metabolism and 1,25-dihydroxyvitamin D concentration in dairy cows. J. Dairy Sci. 66:59-66.
Huang, J. and N. E. Forsberg. 1998. Role of calpain in skeletal-muscle protein 'degradation. Proc. Nati. Acad. Sci. 95:12100-12105.
Huff-Lonergan E., F. C. Parrish, Jr., and R. M. Robson, 1995. Effects of postmortem aging time, animal age, and sex on degradation of titin and nebulin in bovine longissimus muscle. J. Anim. Sci. 73:1064-1073.
154
lluff-1 onergan, E., T. Mitsuhashi, I). 1). Beckman, f C Parrish, Jr., I). G. Olson, and R. M. Robson. 199(,a. Proteolysis of specilie mu.scle structural proteins by m-calpam at low pi 1 and temperature is similar to degradation in po.stmortcm bovine muscle. J. .\nim. Sci. 74:993-1008.
Huff-l.onetuan, 1 ., f. Mitsuhashi, F. C Parri.sh. Jr.. and R. M. Robson. |996b. SDS-P.XCil-: iuid Western blotting comparisons ol'purified myofibrils and whole mu.scle preparations for e\aluating titin and nebulin in postmortem bo\ ine muscle. J. Anim. Sci. 74:77')-785
Hiu-witz. S. I99(v Homeoslatic control of plasma calcium concentration. Critical Rev. Biochem. Nlolecuku- Biol. 31:41-100.
HiLxle\.H. E. 1958. The contraction of muscle. Sci. Am. 199:67-82.
Huxley. H E . I )(i5 fhe mechanism of muscle contraction. Sci. Am. 213:18-27.
Huxle\. H. E.. and .1. Hiuison. 1954. Changes in the cross-striations of muscle during contraction and stretch and their structural interpretation. Nature 173:973-976.
Inoue. T. and H. Kawashima. 1988. 1,25-dihydroxyvitamin D3 stimulates '*^Ca^"'-uptake b>- cultured \ ascular smooth muscle cells derived from rat aorta. Biochem. Biophys. Res. Comm. 152:1388-1394.
Itoh. Y.. T. Suzuki, S. Kimura. K. Ohahi. H. Higuchi, H. Sawada, Y. Shimizu, M. Shibata, and K. .Maruyama. 1988. Extensible and less-extensible domains of connectin filaments in stretched vertebrate skeletal muscle sarcomeres as detected b\ immunofluorescence and immunoelectron microscopy using monoclonal antibodies. J. Biochem. 104:504-508.
Jeacocke. R. 1993. The concentrations of free magnesium and free calcium ions both increase in skeletal muscle fibers entering rigor mortis. Meat Sci. 35:27-45.
Jennings. T. G.. B. W. Berry, and A. L. Joseph. 1978. Influence of fat thickness, marbling and length of aging on beef palatability and shelf-life characteristics. J. Anim. Sci. 46:658-665.
Jin, J. -P.. and K. Wang. 1991. Cloning, expression, and protein interaction of human nebulin fragments composed of varying numbers of sequence modules. J. Biol. Chem. 266:21215-21223.
Johnson, R. P., and S. W. Craig. 1995. F-actin binding site masked by the intramolecular association of vinculin head and tail domains. Nature 373:261-264.
155

Judge, M. D., E. D. Aberie, J. C Forrest, II. B. Hedrick, and R. A. Merkel. 1989. Principles of Meat Science. Second Edition. Kendall/Hunt Publishing Co., Dubuque, lA.
Kam, Y. A., W. Xu, G. N. Demartino, and R. E. Cohen. 1997. Editing of ubiquitin conjugates b\' an isopeptidase in the 26S proteasome. Nature. 385:737-740.
Kapprell, H. P., and D. E. Goll. Effect of Ca'' on binding of the calpains to calpastatin J. Biol. Chem. 264:17888-17896.
Karges, K.. F. N. Owens. D. R. Gill, and J. B. Morgan. 1998. Effects of vitamin D3 levels on feed intake by yearling steers. 1998 Plains Nuti. Counc. Spring Conf, April 16-17, San Antonio, TX.
Karges. K., J. B. Morgan, F. N. Owens, and D. R. Gill. 1999. Effects of feeding vitamin D3 on carcass characteristics of beef cattle. J. Anim. Sci. 77(Suppl. l):I72(Abstt-.).
Kendall, T. L., M. Koohmaraie, J. R. Arbona, S. E. Williams, and L. L. Young. 1993. Effect of pH and ionic strength on bovine m-calpain and calpastatin activity. J. Anim. Sci. 71:96-104.
Kentish, J. C , H. E. D. J. Keurs, L. Ricciardi, J. J. J. Bucx, and M. I. M. Noble. 1986. Comparison between the sarcomere length-force relations of intact and skinned tiabeculae from rat right ventricle. Influence of calcium concentrations on these relations. Circ. Res. 58:755-768.
Kerth, C. R., M. F Miller, and C. B. Ramsey. 1995. Improvement of beef tendemess and quality traits with calcium chloride injection in beef loins 48 hours postmortem. J. Anim. Sci. 73:750-756.
Kerth, C. R. 1999. Characterizing muscle growth and meat quality in callipyge sheep using a muscle cell culture system. A Ph.D. Dissertation. Texas Tech University, Lubbock.
Kim, Y. S., R. D. Sainz, and Y-. B. Lee. 1993. Note on the comparison of calpains I, II and calpastatin activity in two different types of porcine skeletal muscle. Comp. Biochem. Physiol. 105A:235-237.
Kimura, S., T. Matsuura, S. Ohtsuka, y. Nakauchi, A. Matsuno, and K. Mamyama. 1992. Characterization and localization of a-connectin (titin 1): An elastic protein isolated from rabbit skeletal muscle. J. Muscle Res. Cell Motil. 13:39-47.
156
King, N. L. 1984. Breakdown of connectin during the cooking of meat. Meat Sci. 11:27-43.
King, N. L., L. Kurth, and W. R. Shorthose. 1981. Proteolytic degradation of connectin, a high molecular weight myofibrillar protein, during heating of meat Meat Sci 5:389-396.
Kisselev, A. F., T. N. Akopian. and A. L. Goldberg. 1998. Range of sizes of peptide products generated during degradation of different proteins by arcaeal proteasomes. J. Biol. Chem. 273:1982-1989.
Konishi, M. 1998. C>toplasniic fi-ee concentrations of Ca2-H and Mg2-h in skeletal muscle fibers at rest and during contraction. Jap. J. Physiol. 48:421-438.
Koohmaraie. M. 1990. Quantification of Ca-'^-dependent protease activites by hydrophobic and ion-exchange chromatography. J. Anim. Sci. 68:659-665.
Koohmaraie, M. 1992a. Ovine skeletal muscle multicatalytic proteinase complex (proteasome): Purification, characterization, and comparison of its effects on myofibrils wdtii p-calpain. J. Anim. Sci. 70:3697-3708.
Koohmaraie, M. 1992b. The role of Ca ' -dependent proteases (calpains) in postmortem proteolysis and meat tendemess. Biochime 74:239-245.
Koohmaraie, M., and S. D. Shackelford. 1991. Effect of calcium chloride infusion on the tendemess of lambs fed a p-adrenergic agonist. J. Anim. Sci. 69:2463-2471.
Koohmaraie, M., W. H. Kennick, A. F. Anglemier, E. A. Elgasim, and T. K. Jones. 1984a. Effect of postmortem storage on cold-shortened bovine muscle: Analysis by SDS-polyacrylamide gel electrophoresis. J. Food Sci. 49:290-291.
Koohmaraie, M., W. H. Kennick, E. A. Elgasim, and A. F. Anglemier. 1984b. Effects of postmortem storage on muscle protein degradation: Analysis by SDS-polyacrylamide gel electrophoresis. J. Food Sci. 49:292-293.
Koohmaraie, M., J. E. Schollmeyer, and T. R. Dutson. 1986. Effect of low calcium activated protease (CAF) on bovine myofibrils tmder varying pH and temperature conditions. J. Food Sci. 51:28-32,65.
Koohmaraie, M., S. C. Seideman, J. E. Schollmeyer, T. R. Dutson, and J. D. Crouse. 1987. Effect of postmortem storage on Ca" "" dependent proteases, their inhibitor and myofibril fragmentation. Meat Sci. 19:187-196.
157
Koohmaraie, M., A. S. Babiker, A. L. Schroeder, R. A. Merkel, and T. R. Dutson. 1988a. Acceleration of postmortem tenderization in ovine carcasses through activation of Ca-'"-depeiident proteases. J. Food Sci. 53:1638-1641.
Koohmaraie, M., S.C. Seideman, J. E. Schollmeyer, T. R. Dutson, and A. S. Babiker. 1988. Factors associated witii the tenderness of three bovine muscles J Food Sci. 53:407-410.
Koohmaraie. M., J. B. Crouse, and H. J. Mersmann. 1989. Acceleration of postmortem tenderization in o\ ine carcasses through infusion of calcium chloride: Effect of concentt-ation and ionic stiength. J. Anim. Sci. 67:934-942.
Kooliniaraie, M.. G. Whipple, and J. D. Crouse. 1990. Acceleration of postmortem tenderization in lamb and brahman-cross beef carcasses through infusion of calcium chloride. J. Anim. Sci. 68:1278-1283.
Krishnan, A. V., and D. Feldman. 1991. Activation of protein kinase-C inhibits vitamin D receptor gene expression. Mol. Endocrinol. 5:605-612.
Kmger, M., J. Wright, and K. Wang. 1991. Nebulin as a length regulator of thin filaments of vertebrate skeletal muscles: Correlation of thin filament length, nebulin size, and epiotope profile. J. Cell Biol. 115:97-107.
Labeit, S., T. Gibson, A. Lakey. K. Leonard, M. Zevani, P. Knight,, J. Wardale, and J. Trinick. 1991. E\ idence that nebulin is a protein-ruler in muscle thin filaments. FEBS Lett. 282:313-331.
LaemmLi, U. K. 1970. Cleavage of stmctural proteins during the assembly of the head of bacteriophage T4. Nature. 227:680-685.
Lansdell, J. L., M. F Miller, T. L. Wheeler, M. Koohmaraie, and C. B. Ramsey. 1995. Postmortem injection of calcium chloride effects on beef quality traits. J. Anim. Sci. 73:1735-1740.
Layne, E. 1957. Spectrophotometric and turbidimetric methods for measuring proteins, hi "Methods in Enzymology." (Ed.) S.P. Colowick and N.O. Kaplan. Vol. 13, p. 450. Academic Press, Inc., New York.
Lazarides, E. 1982. intermediate filaments: A chemically heterogeneous, developmentally regulated class of proteins. Annu. Rev. Biochem. 51:219-250.
158

Lazarides, i:., and Y. G. Capetanaki. 1986. The stiiated muscle cytoskeleton: Expression and assembly in development. In Molecular Biology of Muscle Development (C. Emerson, D. Fischman, B. Nadal-Ginard, and M. A. Q. Siddiqui, eds). Alan R Liss.. New York, pp. 749-772.
Lecker, S. H., V. Solomon, W. E. Mitch, and A. L. Goldberg. 1999. Muscle protein breakdown and the critical role of the ubiquitin-proteasome pathway in normal and disease states. J. Nutr. 129:227S-237S.
Littledike, E. T.. and J. Goff 1987. Interactions of calcium, phosphorus, magnesium and vitamin D that influence their status in domestic meat animals. J. Anim. Sci 65:1727-1743.
Littledike. E. T., and R. L. Horst. 1982. Vitamin D3 toxicity in dairy cattle. J. Dairy Sci. 65:749-759.
Locker, R. H., and N. G. Leet. 1975 Histology of highly-stretched beef muscle. I. The fine structure of grossly sttetched single fibers. J. Ultrastmct. Res. 52:64-75.
Locker. R. H., and D. J. C. Wild. 1984. The N-lines of skeletal muscle. J. Ultrastmct Res. 88:207-222.
Lusby. M. L., J. F. Ridpatii, F. C. Parrish, Jr., and R. M. Robson. 1983. Effect of postmortem storage on degradation of the myofibrillar protein titin in bovine longissimus muscle. J. Food Sci. 48:1781-1790,1795.
MacBride. M. A., and F. C. Parrish, Jr. 1977. The 30,000-dalton component offender bovine longissimus muscle. J. Food Sci. 42:1627-1629.
MacCartiiy. E. P.. W. Yamashita, A. Hsu, and B. S. Ooi. 1989. 1,25-dihydroxyvitamin D3 and rat vascular smooth muscle cell growth. Hypertension 13:954-959.
Maki, M., W Takano, T. Osawa, T. Ooi, T. Murachi, and M. Hatanaka. 1988. Analysis of stmcture-fimction relationship of pig calplastatin by expression of mutated cDNAs in Eschericha coH. J. Biol. Chem. 263:10254-10261.
Maki, M., M. Hatanaka, E. Takano, and T. Murachi. 1990. Stmcture-function relationship of calpastatins. hi: Intracellular calcium-dependent proteiolysis (R. L. Mellgren, and T. Murachi, eds.) CRC Press, Inc. Boca Raton, FL, p. 37-54.
Martyn, D. A., and A. M. Gordon. 1988. Length and myofilament spacing-dependent changes in calcium sensitivity of skeletal fibres: effects of pH and ionic strength. J. Muscle Res. Cell Motil. 9:428-445.
159

Matsukura, U., A. Okitani. T. Nishimura, and H. Kato. 1981. Mode of degradation of myofibrillar proteins by an endogenous protease cathepsin L. Biochem. Biophys Acta. 662:41-47
Matsukura, U., T. Matsumoto, Y. Tashiro, A. Okitani, and II. Kato. 1984. Morphological changes in myofibrils and glycerinated muscle fibers on treatment with cathepsin D and L. Int. J. Biochem. 16:957-962.
Matsuura, T. S.. S. Kimura, S. Ohtuska, and K. Maruyama. 1991. Isolation and characterization of 1.200 kDa peptide of a-connectin. J. Biochem. 110:474-478.
McCallister, L. P., and R. Hadek. 1973. The localization of calcium in skeletal muscle: Its distiibution in muscles in which the caffeine-induced contracture was arrested. J. Ultt-astt-uc. Res. 45:59-81.
McComas, .A. J. 1996. Skeletal Muscle Form and Function. Human Kinetics, Champaign, IL.
McDermott, C. M., D. C Beitz, E. T. Littledike, and R. L. Horst. 1985. Effects of vitamin D3 on concentrations of vitamin D and its metabolites in blood plasma andmilkof dairy cows. J. Dairy Sci. 68:1959-1967
McNeill. P. A., and G. Hoyle. 1967. Evidence for superthin filaments. Am. Zool. 7:483-498.
Mellgren, R. L. 1980. Canine cardiac calcium-dependent proteases: Resolution of two forms with different requirements for calcium. FEBS Lett. 109:129-133.
Mellgren, R. L. 1997. Evidence for participation of a calpain-like cysteine protease in cell cycle progression through the late Gl phase. Biochem. Biophys. Res. Comm. 236:555-558.
Mentie, P., and F Escaig. 1988. Localization of cations by pryroantimonate. I. hifluence of fixation on distribution of calcium and sodium. An approach by analytical ion microscopy. J. Histochem. Cytochem. 36:49-54.
Michiel, D. F., and J. H. Wang. 1984. Calcium binding proteins. In: Intracellular Calcium Regulation. (H. Bader, K. Gietzen, J. Rosenthal, R. Rudel, and H. U. Wolf). Manchester University Press, Manchester England, pp. 121-138.
Miller D R and K. C. Hayes. 1982. Vitamin excess and toxicity. In: J. N. Hathcock, ' (ed.)'Nutritional Toxicology. Vol.1, pp. 81-133. Academic Press, New York.
160

Miller, M. F., L. C, Hoox er, K. D. Cook, A. L. Guerra, K. L. Huffman, K. S. Tinney, C. B. Ramsey, H. C. Britten, and L. M. I luffman. 1995. Consumer acceptability of beefsteak tenderness in the home and restaurant. J. Food Sci. 60:963-965.
Miller, M. F.. C. B. Ramsey, L. C. Hoover, M. A. Carr, and K. L. Crockett. Consumer thresholds for establishing the value of beef tenderness. 1998. Proc Recip Meat Conf 51:4-9.
Miller, M. P.. M. A. Carr, C. B. Ramsey, K. L. Crockett, and L. C. Hoover. Consumer tiiresholds for establishing the value of beef tenderness. 2001. J. Anim. Sci. In Press.
Minami, Y.. Y. Eniori, II. Kawasaki, and K. Suzuki. 1987. E-F hand structure-domain of calcium-acti\ated neutt-al protease (CANP) can bind Ca^* ions. J. Biochem. 101:889-895.
Mitch, W. E., and A. L. Goldberg. 1996. Mechanisms of muscle wasting. The role of the ubiquitin-proteasome pathway. N. Engl. J. Med. 335:1897-1905.
Mitsuhashi, T., R. C. Morris, Jr., and H. E. Ives. 1991. 1,25-dihydroxyvitamin D3 modulates growth of vascular smooth muscle cells. J. Clin. Invest. 87:1889-1895.
Montgomery, J. L., F. C. Parrish, Jr., D. C. Beitz, R. L. Horst, E. J. Huff-Lonergan, and A. H. Trenkle. 2000. The use of vitamin D3 to improve beef tendemess. J. Anim. Sci. 78:2615-2621.
Montgomery, J. L., M. A. Carr, C. R. Kerth, G. G. Hilton, B. P. Price, M. L. Galyean, R. L. Horst, and M. F Miller. 2001a. Effect of vitamin D3 supplementation level on the postmortem tenderization of beef fi:om steers. J. Anim. Sci. In review.
Montgomery, J. L., K. J. Morrow, Jr., R. L. Horst, J. R. Blanton, Jr., and M. F. Miller. 2001 b. Effect of vitamin D3 supplementation of steers on the calcium and phosphoms content and tendemess of beef J. Food Sci. In review.
Morgan, J. B., J. W. Savell, D. S. Hale, R. K. Miller, D. B. Griffin, H. R. Cross, and S. D. Shackelford. 1991. National beef tendemess survey. J. Anim. Sci. 69:3274-3283.
Morgan, J. B. 1995. Enhance taste-palatability. In: G. C. Smith (Ed.) The Final Report of the Second Blueprint for Total Quality Management in the Fed-Beef (Slaughter Steer/Heifer) Industry, pp 188-193. Colorado State University, Fort Collins; Texas A&M University, College Station; and Oklahoma State University, Stillwater.
161

Morrow, K. J., Jr.. E. Uniivar, S. W. King, and J. B. Mteczko. 1991. Techniques for the production of monoclonal and polyclonal antibodies. In: Colloidal Gold Principles, Methods, and Applications, Volume 3, M. A. Hayat (ed.). pp 31-57.
Mortensen, J. T., P. Brinck, and L. Binderup. 1993. Toxicity of vitamin D analogues in rats fed diets with standard or low calcium contents. Pharm. Toxic. 72:124-127.
Muchovej, R. M. C , V. G. Allen, D. C. Martens, L. W. Zelazny, and D. R. Notter. 1986. Aluminum, citt-ic acid, nitioltiiacetic acid and soil moisture effects on aluminum and iron concentrations in ryegrass. Agron. J. 78:138-145.
Murachi, T. 1984. Calcium-dependent proteinases and specific inhibitors: calpain and calpastatin. Biochem. Soc. Synip. 49:149-167.
Murray, J. M., and A. Weber. 1974. The cooperative action of muscle proteins. Sci. Am. 230:58-71.
Mykles. D. L. 1998. Intracellular proteinases of invertebrates: Calcium-dependent and proteasome/ubiquitin-dependent systems. Int. Rev. Cytology 184:157-289.
Nave, R., D. O. Furst, and K. Weber. 1989. Visualization of the polarity of isolated titin molecules: a single globular head on a long thin rod as the M band anchoring domain? J. Cell Biol. 109:2177-2187.
Negishi, H., E. Yamamoto, and T. Kuwata. 1996. the origin of the 30 kDa component appearing during post-mortem ageing of bovine muscle. Meat Sci. 42:289-303.
Nemere, I., Z. Schwartz, H. Pedrozo, V. L. Sylvia, D. D. Dean, and B. D. Boyan. 1998. Identification of a membrane receptor for 1,25-dihydroxyvitamin D3 which mediates rapid activation of protein kinase C. J. Bone Mineral Res. 13:1353-1359.
Norman, A. W. 1998. Receptors for la,25(OH)2D3: Past, present, and future. J. Bone Mineral Res. 13:1360-1369.
Norman, A. W., and H. L. Henry. 1993. Vitamin D: Metabolism and mechanism of action. In: Primer on the Metabolic Bone Diseases and Disorders of Mineral Metabolism. (M. J. Favus, ed.). Raven Press, New York, pp. 63-70.
NRC. 1989. Recommended Dietary Allowances. 10'"ed. National Academy Press, Washington, DC.
162
Okitani, A., U. Matsukara, H. Kato, and M. Fujimaki. 1980. Purification and some properties of a myofibrillar protein-degrading protease, cathepsin L, from rabbit skeletal muscle. J. Biochem. 87:1133-1143.
Okitani, A., U. Matsukara, Y. Kitamura, and H. Kato. 1981. Purification of cathepsin D from rabbit skeletal muscle and its action towards myofibrils. Biochem Biophys Acta. 662:202-209.
Olson, D. G., and F. C. Parrish, Jr. 1977. Relationship of myofibril fragmentation index to measures of beefsteak tenderness. J. Food Sci. 42:506-509.
Olson, E. N., and R. S. Williams. 2000. Calcineurin signaling and muscle remodeling Cell 101:689-692.
Olson, W. G., N. A. Jorgensen, A. N. Bringe, L. H. Schultz, and H. F. DeLuca. 1972. Effect of high or continued administration of 25-hydroxycholecalciferol (25-HCC) to dairy cows on vitamin D activity in tissue, serum electrolytes and soft tissue integrity. J. Dairy Sci. 55:698 (Abstr.).
Olson, D. G., F. C. Parrish, Jr., and M. H. Stromer. 1976. Myofibril fragmentation and shear resistance of three bovine muscles during postmortem storage. J. Food Sci. 41:1036-1041.
Olson, D. G., F. C. Parrish, Jr., W. R. Dayton, and D. E. Goll. 1977. Effect of postmortem storage and calcium activated factor on the myofibrillar proteins of bovine skeletal muscle. J. Food Sci. 42:117-124.
O'Neill, M. C . and F. E. Stockdale. 1972. A kinetic analysis of myogenesis in vitro. J. Cell Biol. 52:52-65.
Orcutt, M. W., and T. R. Dutson. 1985. Postmortem degradation of gap filaments at different post-mortem pHs and temperatures. Meat Sci. 14:221-241.
OuaH, A. 1990. Meat tenderization: Possible causes and mechanisms. A review. J. Muscle Foods. 1:129-165.
Ouali, A., and A. Talmant. 1990. Calpains and calpastatin distribution in bovine, porcine and ovine skeletal muscle. Meat Sci. 28:331-348.
Parekh, A. C , and D. H. Jung. 1970. Semm inorganic phosphoms determination using p-phenylenediamine as a reducing agent. Clin. Chim. Acta. 27:373-377.
163

Pan-ish, F. C , Jr., R. B. Young, B. E. Miner, and L. D. Anderson. 1973. Effect of postmortem conditions on certain chemical, morphological and organoleptic properties of bovine muscle. J. Food Sci. 38:690-695.
Parrish, F. C , Jr., Selvig, C. J., Culler, R. D., and Zeece, M. G. 1981. CAF activity, calcium concentration, and the 30,000-dalton component of tough and tender bovine longissimus muscle. J. Food Sci. 46:308-309, 311.
Parsons, B., D. Szczesna, J. Zhao, B. Van Slooten, W. G. L. Kerrick, J. A. Putkey, and J. D. Potter. 1997. The effect of pH on the Ca ^ aflinity of the Ca ^ regulatory sites of skeletal and cardiac tioponin C in skinned muscle fibres. J. Muscle Res. Cell Motil. 18:599-609.
Paterson, B. C , and F. C Parrish, Jr. 1986. A sensory panel and chemical analysis of certain beef chuck muscles. J. Food Sci. 51:876-879, 896.
Paterson, B. C , and F C. Parrish, Jr. 1987. SDS-PAGE conditions for detection of titin and nebulin in tender and tough bovine muscles. J. Food Sci. 52:509-510.
Paul, P., B. Lowe, and B. R. McClurg. 1944. Changes in histological stmcture and palatability of beef during storage. Food Res. 9:221-233.
Pearson, A. M., and R. B. Young. 1989. Composition and stmcture. In: Muscle and Meat Biochemistr). pp. 1-33. Academic Press, Inc., San Diego, CA.
Permy, I. F. 1974. The action of a muscle proteinase on the myofibrillar proteins of bovine muscle. J. Sci. Food Agric. 25:1273-1284.
Permy, I. F. 1980. The enzymology of conditioning. In: Developments in Meat Science (Lawrie, R., ed.). Applied Science. Barking, U.K. p. 115-143.
Perkin-Elmer Corp. 1965. Analytical methods for atomic absorption spectrophotometry. Perkin-Elmer Corp., Norwalk, CT.
Perry, S. V. 1996. Calcium and the regulation of contraction. In: Molecular Mechanisms in Striated Muscle. Cambridge University Press, Cambridge, England, pp. 51-74.
Pickart, C M . 1997. Targeting of substrates to the 26S proteasome. FASEB J. 11:1055-1066.
Pike, J. W. 1985. hitracellular receptors mediate the biologic action of 1,25-dihydroxyvitamin D3. Nutr. Rev. 43:161-168.
164

Price. M. Ci.. 1). R. Capiette, and R. 11. Comer. 1994. Different temporal patterns of expression result in the same t\ |v. amount and distribution of lilamin (ABP) in cardiac and skeletal niNofibrils. Cell Motil. and Cvto.skel. 27:248-261.
Pringle, J. W S. 1977. Ihe mechanical properties of insect tlight muscle. In: Insect flight muscle (R. freager. ed.) North Holland Publihishing. Am.sterdam New ^•ork. Oxford, p. 177-190.
Puis. R. 1994. \itaminlevelsin Animal Health, p 84. Sherpa Int. Clearbrook, BC.
Raeymaekers. L.. and F Wuytack. 1996. Calcium pumps. In: Biochemistry of Smooth Muscle Contraction. M. Baranv. ed. .Academic Press. San Diew) CA pn 241-253 "
Ra\id. A.. R. Korea. C. Rothem. O. Garach-Jehoshua. f. Glaser. and U. A. Liberman. 1994. 1.25-dih> diox> vitamin D3 increases the cellular content of the calcium-acti\ated neutral protease p-calpain in renal cell carcinoma. Endocrinology 135:2822-2825.
Reecy. J.M.. J.E. Williams. .M.S. Kerley, R.S. MacDonald, W.H. Thornton, Jr., and L.M. Wallace. 1994. .\bomasal casein infusion enhances the mitogenic activity of sertmi from protein-restricted steers. J. Nutr. 124:67-77.
Reichel. H.. H. P. Koeffler. and N. W. Norman. 1989. The role of vitamin D endocrine s\ stem in health and disease. New Eng. J. Med. 320:980-991.
Riccardi, D. 1999. Cell surface. Ca"^ (cation)-sensing receptor(s): one or many? Cell Calcium. 26:77-83.
Rider. X. C. W B. Mikel. J. M. Behrends. R. W. Scaletti, Y. L. Xiong, and D. K. Aaron. 2000. Effects of dietar> vitamin D3 supplementation of cull beef cows on longissimus and semitendinosus muscle tendemess. J. Anim. Sci. 78(Suppl. 2):16(Abstr.).
Robbins, F M.. J. E. Walker. S. H. Cohen, and S. Chatterjee. 1979. Actions of proteolytic enzymes on bovine myofibrils. J. Food Sci. 44:1672-1677, 1680.
Robson, R. M. 1995. M> ofibrillar and cytoskeletal structures and proteins in mature skeletal muscle cells. In Expression of Tissue Proteinases and Regulation of Protein Degradation as Related to Meat Quality. (A. Ouali, D. I. Demeyer, and F. J. M. Smulders. eds.). ECCEAMST, Utrecht. The Netherlands, pp. 267-288.
165

Robson, R. M.. M. ^•amaguchi, f. W 1 luiatt, F. L. Richardson. J. M. ()-Shca, M K llait/er, W !• Rathbun. P. J. Schreiner. M. II. Stionier. S. Pang. R. R Evans, and J. F. Ridpath. 1081. Biochemistry and molecular architecture of muscle cell 10-nm filaments and /-line. Roles of desmin and a-aclinin. Proc. Recip. Meat Conf 34:5-11.
Robson. R. M.. .1. Nf OShea. M. K. Ilait/ei, W i:. Rathbun. F. laSallc. P. J. Schreiner, L. i:. Ka.sang. M. II. Stromer. M. L. Lusby,.I. F Ridpath, Y ' Pang, R. R. Fvans. M. Ci./ecce. F C Parrish, Jr., and T. W Huiatt. 1984. Role of new cNtoskeletal elements in maintenance of muscle integrity. J Food Biochem 8 1 -24.
Robson, R. M . T. W Huiatt, and I C Parrish, Jr. 1991. Biochemical and structural properties of titin, nebulin and intermediate filaments. Proc. Recip Meat Conf 44:7-20.
Robson, R. M.. F. Huff-1 onergan, F C Parrish, Jr., C. Y. Ho, M. H. Stromer, T. W. Huiatt. R. .\1. Bellin. and S. W' Sernett. 1997. Postmortem changes in the myofibrillar and other cMoskeletal proteins in muscle. Proc. Recip. Meat Conf 50:43-52.
Rock. K. L.. C. Gramm. L. Rothstein. K. Clark, R. Stein, L. Dick, D. Hwang, and A. L. Goldberg. 1994. Inhibitors of the proteasome block the degradation of most cell proteins and the i:eneration of peptides presented on MHC class 1 molecules. Cell 78:761-77L
Rogers. K. \ ' . , C. K. Dunn. R. L. Conklin, S. Hadfield, B. A. Petty, E. M. Brown, S. C. Hebert, E. F Xemeth, and J. Fox. 1995. Calcium receptor messenger ribonucleic acid le\ els in the parathyroid glands and kidney of vitamin D-deficient rats are not regulated b> plasma calcium or 1,25-dihydroxyvitamin D3. Endocrinol. 136:499-504.
Root, D. R., and K. Wang. 1994. Calmodulin-sensitive interaction of human nebulin fragments with actin and myosin. Biochemistry 33:12581-12591.
Saiterthwaite. F. E. 1946. An approximate distribution of estimates of variance components. Biometrics Bulletin 2:110-114.
Samejima, K.. and F. H. Wolfe. 1976. Degradation of myofibrillar protein components during postmortem aging of chicken muscle. J. Food Sci. 41:250-254.
SAS. 1994. SAS/STAT® Users Guide (Version 6, 4'" Ed.). SAS Inst. Inc., Cary, NC.
166
Savell, J. W., R. E. Branson, H. R. Cross, D. M. Stiffler, J. W. Wise. D. B. Griffin, and G. C. Smitii. 1987. National consumer retail beef study: palatability evaluktions of beef loin steaks that differed in marbling. J. l-ood Sci. 52:517-519, 532
Savell, J. W., II. R. Cross, J. J. Francis, J. W. Wise, D. S. Hale, D. L. Wilkes, and G. C. Smith. 1989. National consumer retail beef study: Interaction of trim' level, price and grade on consumer acceptance of beef steaks and roasts. Food Qual 12 251-274.
Scanga, J. A., K. E Belk, J. D. Tatuni, M. Koohmaraie, and G. C Smith. 1999. Effects of supranutiitional oral supplementation with vitamin D3 and calcium to improve beef tenderness. Proc. Recip. Meat Conf 52:120( Abstr).
Schmidt, J. G., and F. C Pan-ish, Jr. 1971. Molecular properties of postmortem muscle. 10. Effect of intemal temperature and carcass maturity on structure of bovine longissimus. J. Food Sci. 36:110-119.
Schollmeyer, J. E. 1986. Ca-"" and Ca' ^-activated protease in myoblast fiasion. Exp Cell Res. 162:411-422.
Schollmeyer, J. E. 1988. Calpain H involvement in mitosis. Science. 240:911-913.
Schwartz. M. K. 1975. Recent advances in calcium and phosphoms metabolism. Ann. Clin. Lab. Sci. 5:176-184.
Schwartz. W. N., and J. W. C. Bird. 1977. Degradation of myofibrillar proteins by cathepsins B and D. Biochem.J. 167:811-820.
Selles, J., and R. L. Boland. 1990. In vitro calcium transport properties of skeletal muscle mitochondria from vitamin D-deficient and 1,25-dihydroxy-vitamin D3-treated chicks. Calcified Tissue Inter. 47:46-50.
Selles, J., and R. Boland. 1991. Evidence on the participation of the 3',5'-cychc AMP pathway in the non-genomic action of 1,25-dihydroxy-yitamon D3 in cardiac muscle. Molec. Cell. Endocrinology 82:229-235.
Shackleford, S. D., M. Koohmaraie, G. Whipple, T. L. Wheeler, M. F. Miller, J. D. Crouse, and J. O. Reagan. 1991. Predictors of beef tendemess: Development and verification. J. Food Sci. 56:1130-1134,1140.
Shacklock, P. S., W. G. Wier, and C. W. Blake. 1995. Local Ca ^ transients (Ca^* sparks) originate at transverse tubules in rat heart cells. J. Physiol. 487.3:601-608.
167
Shoshan-Barmatz, V., S. Weil, H. Meyer, M. Barsanyi, L. M. G. Heilmeyer. 1994. Endogenous, Ca"^-dependent c> steine-protease cleaves specifically the ryanodine receptor/ Ca** release channel in skeletal muscle. J. Membrane Biol 142281-288.
Simpson, R. U., G. A. Thomas, and A. J. Arnold. 1985. Identification of 1,25-dihydroxyvitamin D3 receptors and activities in muscle. J. Biol. Chem. 260:8882-8891.
Sjodin, R. A. 1982. Calcium ion movements. In: Transport in Skeletal Muscle. John Wiley and Sons, Inc., New York, pp. 123-147.
Smitii, G. C , J. W. Sa\ ell, H. G. Dolezal, T. G. Field, D. R. Gill, D. B. Griffin, D. S. Hale, J. B. Morgan, S. L. Nortiicutt, and J. D. Tatum. 1995. The final report of the National Beef Quality Audit. Colorado State Univ., Fort Collins; Texas A«feM Univ., College Station; and Oklahoma State Univ., Stillwater. NCA, Englewood, CO.
Sorimachi, H.. and K. Suzuki. 1992. Sequence comparison among muscle-specific calpain, p94, and calpain subunits. Biochim. Biophys. Acta. 1160:55-62.
Sorimachi. H.. S. Imajoh-Ohmi, Y. Emori, H. Kawasaki, S. Ohno, Y Minami, and K. Suzuki. 1989. Molecular cloning of a novel mammalian calcium-dependent protease distinct from both m- and p-types. Specific expression of the mRNA in skeletal muscle. J. Biol. Chem. 264:20106-20111.
Sorunachi, H., S. Ishiura, and K. Suzuki. 1997. Stmcture and physiological fimction of calpains. Biochem.J. 328:721-732.
Squier, M. K. T., A. C. K., Miller, A. M. Malkinson, and J. J. Cohen. 1994. Calpain activation in apoptosis. J. Cell Physiol. 159:229-237.
St. Angelo, A. J., M. Koohmaraie, K. L. Crippen, and J. Crouse. 1991. Acceleration of tenderization/inhibition of warmed-over flavor by calcium chloride-antioxidant infusion into lamb carcasses. J. Food Sci. 56:359-362.
Steel, R. G. D., and J. H. Torrie. 1980. Principles and Procedures of Statistics a Biometrical Approach. McGraw-Hill Book Co., New York, NY.
Stromer, M. H., D. E. Goll, L. E. Roth. 1967. Morphology of rigor-shortened bovine muscle and the effects of trypsin on pre- and postrigor myofibrils. J. Cell Biol. 34:431-445.
168

Suzuki, K. 1990. The structure of calpains and the calpain gene. In: Intracellular calcium-dependent proteolysis (R. L. Mellgren, and T. Murachi, eds ) CRC Press Inc., Boca Raton, FL, p. 25.
Suzuki, K., S. Tsuji. S. Ishiura, Y. Kimura, S. Kubota, and K. Imahori. 1981. Autolysis of a calcium-activated neutral protease of chicken skeletal muscle J Biochem 90:1787-1793.
Suzuki, A., D. E. Goll, 1. Singh, R. E. Allen, R. M. Robson, and M. H. Stromer. 1976. Some properties of purified skeletal muscle a-actinin. J. Biol. Chem 251 6860-6870.
Suzuki, J., S. Kimura, and K. Mamyama. 1994. Electron microscopic filament lengths of connectin and its fragments. J. Biochem. 116:406-410.
Swanek, S. S., J. B. Morgan, F. N. Owens, D. R. Gill, C. A. Strasia, H. G. Dolezal, and F K. Ray. 1999. Vitamin D3 supplementation of beef steers increases longissimus tendemess. J. Anim. Sci. 77:874-881.
Tan, F C , D. E. Goll, and Y. Otsuka. 1988. Some properties of the millimolar Ca " -dependent proteinase from bovine cardiac muscle. J. Mol. Cell Cardiol. 20:983-997.
Tanabe, R., R. Tatsumi, and K. Takahashi. 1994. Purification and characterization of the 1,200-kDa subfragment of cormectin filaments produced by 0.1 mM calcium ions. J. Biochem. 115:351-355.
Tatsumi, R., K-. Shimada, and A. Hattori. 1997. Fluorescence detection of calcium-binding proteins with quinoline Ca-indicator quin2. Anal. Biochem. 254:126-131.
Taylor, R. G., G. H. Geesink, V. F. Thompson, M. Koohmaraie, and D. E. Goll. 1995a. Is Z-disk degradation responsible for postmortem tenderization? J. Anim. Sci. 73:1351-1367.
Taylor, R. G., D. E. Goll, and A. Ouali. 1995b. Enzyme localization during postmortem muscle tenderization. In: Expression of Tissue Proteinases and Regulation of Protein Degradation as Related to Meat Quality. A. Ouali, D. J. Demeyer, and F. J. M. Smulders (ed). pp 347-358.
Temm-Grove, C. J., D. Wert, V. F. Thompson, R. E. Allen, and D. E. Goll. 1999. Microinjection of calpastatin inhibits fiision in myoblasts. Exp. Cell Res. 247:293-303.
169
Toury, R., N. Stelly, E. Boisonneau, M. Convert, and Y. Dupuis. 1990. Relationship between vitamin D status and deposition of bound calcium in skeletal muscle of tiie rat Bio. Cell 69:179-189.
Trinick. J., P Knight, and A. Whiting. 1984. Purification and properties of native titin J. Mol. Biol. 180:331-356.
Turnacioglu. K. K.. B. Mittal. G. A. Dabiri, J. M. Sanger, and J. W Sanger. 1997. Zeugmatin is part of the Z-band targeting region of titin. Cell Struct, and Funct 22:73-82.
Uytterhaegen. L., E. Clae>s. and D. Demeyer. 1994. Effects of exogenous protease effectors on beef tenderness development and myofibrillar degradation and solubility. J. Anim. Sci. 72:1209-1223.
Vargas, D. N., .A. E. Down. D. S. Webb. J. B. Morgan, and H. G. Dolezal. 1999. Effect of supplementing feedlot steers with vitamin D3 and E on carcass traits, shelf-life attributes and longissimus muscle tendemess. J. Anim. Sci. 77(Suppl. l)172(Abstt-.).
Varghese, S., S. Lee, Y. C. Huang, and S. Christakos. 1988. Analysis of rat vitamin D-dependent calbindin-D28k gene expression. J. Biol. Chem. 263:9776-9784.
Vazquez, G., R. Boland, and A. R. Boland. 1995. Modulation by l,25(OH)2-vitamin D3 of the adenylyl c>clase/cyclic AMP pathway in rat and chick myoblasts. Biochim. Biophys. Acta 1269:91-97.
Vazquez, G., A. R. Boland, and R. Boland. 1997. Stimulation of Ca^* release-activated Ca'* channels as a potential mechanism involved in non-genomic l,25(OH)2-vitamin Ds-induced Ca^* entry in skeletal muscle cells. Biochem. Biophys. Res. Comm. 239:562-565.
Vieth, R. 1999. Vitamin D supplementation, 25-hydroxyvitamin D concentrations, and safety. Am. J. Clin. Nuti. 69:842-856.
Wakelam, M. J. O. 1985. The fusion of myoblasts. Biochem.J. 228:1-12.
Walters, M. R. 1992. Newly identified actions of the vitamin D endocrine system. Endocr. Rev. 13:719-764.
Wang, K. 1981. Nebulin, a giant protein component of N2-line of striated muscle. J. Cell Biol. 91:355a.
Wang, K. 1982. Purification of titin and nebulin. Methods Enxymol. 85:264-274.
170

Wang, J. -H., and S. -T. Jiang. 1991. Properties of calpain 11 from Tilapia muscle (Tilapia nilotica x Tilapia aurea). Agric. Biol. Chem. 55:339-345.
Wang, K., and J. Wright. 1988. Architecture of the sarcomere matrix of skeletal muscle: Immunoelectron microscopic evidence that suggests a set of parallel inextensible nebulin filaments anchored at the Z line. J. Cell. Biol. 107:2199-2212.
Wang, K., J. McClure, A. Tu. 1979. Titin: Major myofibrillar components of striated muscle. Proc. Natl. Acad. Sci. 76:3698-3702.
Wang, K., R. McCarter, J. Wright, J. Beveriy, and R. Ramirez-Mitchell. 1991. Regulation of skeletal muscle stiffness and elasticity by titin isoforms: A test of the segmental extension model of resting tension. Proc. Natl. Acad. Sci. 88:7101-7105.
Wang, K., M. Knipfer, Q. -Q. Huang, A. van Heerden. L. C. -L. Hsu, G. Gutierrez, X. -L. Quian, H. Stedman. 1996. Human skeletal muscle nebulin sequence encodes a blueprint for thin filament architecture. Sequence motifs and affinity profiles of tandem repeats and terminal SH3. J. Biol. Chem. 271:4304-4314.
Weber, A., and J. M. Murray. 1973. Molecular control mechanisms in muscle contraction. Physiol. Rev. 53:612-673.
Wecksler, W R., and A. W. Norman. 1980. Biochemical properties of la,25-dihydroxyvitamin D receptors. J. Steroid Biochem. 13:977-989.
Welsh, J.. M. Simboli-Campbell, M. Tenniswood. 1994. Induction of apopotic cell death by l,25-(OH)2 D3 in MCF-7 breast cancer cells. Ninth Workshop on Vitamin D, Oriando, p 174.
Wheeler. T. L., M. Koohmaraie, J. L. Lansdell, G. R. Siragusa, and M. F. Miller. 1993. Effects of postmortem injection time, injection level, and concentration of calcium chloride on beef quality traits. J. Anim. Sci. 71:2965-2974.
Wheeler, T. L., M. Koohmaraie, and S. D. Shackelford. 1997. Effect of postmortem injection time and postinjection aging time on the calcium-activated tenderization process in beef J. Anim. Sci. 75:2652-2660.
Whipple, G., and M. Koohmaraie. 1991. Degradation of myofibrillar proteins by extractable enzymes and m-calpain and the effects of zinc chloride. J. Anim. Sci. 69:4449-4460.
171
Whipple, G., and M. Koohmaraie. 1993. Calcium chloride marination effects on beef steak tenderness and calpain proteolytic activity. Meat Sci. 33:265-275.
Whipple, G., M. Koohmaraie, M. E. Dikeman, and J. D. Crouse. 1990. Predicting beef longissimus tenderness from various biochemical and histological muscle traits J. Anim. Sci. 64:4193-4199.
Wierbicki, E., and F. E. Deatherage. 1958. Determination of water-holding capacity of fresh meats. J. Agric. Food Chem. 6:387-392.
Wilson, P W.. and D. E. M. Lawson. 1978. Incorporation of [ H] leucine into an actin-like protein in response to 1.25-diliydroxycholecalciferol in chick intestinal brush borders. Biochem.J. 173:627-631.
Wright, J.. Q. Huang, and K. Wang. 1993. Nebulin is a fiall-length template of actin filaments in the skeletal muscle sarcomere: an immunoelectron microscopic study of its orientation and span with site-specific monoclonal antibodies. J. Muscle Res. Cell Motil. 14:476-483.
Wroblewski, R., and L. Edstrom. 1994. Distribution of sodium, magnesium, chlorine, calcium, potassium, phosphorus and sulphur in Z-, I- and A-bands in mammalian striated muscle. Scanning Microscopy 8:601-611.
Yagyu, M., R. M. Robson, M. H. Stiomer. Identification of intermediate filaments in mature mammalian skeletal muscle by transmission electron microscopy. 1990. Proc. 12'" Intem. Congr. Electron Microscopy 3:454-455.
Yano, S., T. Sugimoto, T. Tsukamoto, K. Chihara, A. Kobayashi, S. Kitazawa, S. Maeda, and R. Kitazawa. 2000. Association of decreased calcium-sensing receptor expression with proliferation of parathyroid cells in secondary hyperparathyroidism. Kidney Inter. 58:1980-1986.
Yarden, N., I. Lavelin, O. Genina, S. Hurwitz, R. Diaz, E. M. Brown, and M. Pines. 2000. Expression of calcium-sensing receptor gene by avian parathyroid gland in vivo: Relationship to plasma calcium. Gen. Comp. Endocrinol. 117:173-181.
Yarom, R., and U. Meiri. 1972. Ultrastmctiiral cation precipitation in frog skeletal muscle. J. Ultrastmct. Res. 39:430-442.
Young, O. A., A. E. Graafliuis, and C. L. Davey. 1980. Postmortem changes in cytoskeletal proteins of muscle. Meat Sci. 5:41-55.
Zanello, S. B., R. L. Boland, and A. W. Norman. 1995. cDNA sequence identity of A vitamin D-dependent calcium-binding protein in the chick to calbindin D-9K.
172

y.cc^c. M. Ci., K. Katoh. R. M. Robson, and f C Parrish. .Ir. 1986. flffecl of cathepsin D on bo\ ine m>ofibrils under dilTerenl conditions of pi I and temperature. J. Food Sci. 51:769-773.780.
Zeece. M. C.. T. 1.. W oods. M. \. Keen, and W . .1. Re\ille. 1992. Kok- of proteinases and inhibitors in postmortem muscle protein dciiradation. Pioc. Recip. Meat Conf 45:51-dl.
Zimmerman, I' .1. P., and W' W. Schlaepfer. 1988. .Actixation of calpain 1 and calpain 11: .\ comparati\c study using terbium as a fluorescent probe for calcium-binding sites. .\rch. Biochem. Biophys. 26(i:4()2-469.
173

.M'l'l'NDIX A
s o n fU)\ AND REAGENT FORMULATIONS
174

Phosphate Buffer Saline (PBS)
Use: multipurpose pH: 7.4 Storage: 4°C
80 g sodium chloride (NaCI) 2 g potassium chloride (KCl) 11.5 g sodium phosphate dibasic (Na2llP04) 2 g potassiimi phosphate monobasic (KH2PO4) lOLH^O
Borate Buffer Use: ELISA pH: 8.2 Storage: 4°
6.2 g boric acid (H3BO3) 100 niM 9.5 g sodium borate Na-B4O7*10 H2O (Borax) Fill to 1 L with water
Citric Acid Buffer Use: ELISA pH: 4.9 Storage: 4°C
10.2 g citric acid monohydrate (CeHgO? H2O) 26.8 g sodium phosphate dibasic (Na2HP04) Fill close to 1 L with water, pH with phosphoric acid (H3PO4) Bring to volume.
Tris-Glycine lOX Buffer (Dilute by 10 when running a gel)
Use: gel mrming buffer pH: 7.0 Storage: 4°C
For 6 L for 1 L 181.25 g Tris 30.21 g Tris 864 g Glycine 144 g Glycine 60 g SDS 10 g SDS add EDTA 2mM .58 g EDTA
175

Stain (stain gels overnight)
0.1 g Comniassie Brilliant Blue (R250/100 iiiL destain)
Destain (destain minimum 6 h, changing every 2 h)
For2L 140 mL Acetic Acid 800 mL MeOH 1060niLH2O
5 N NaOH
50 g NaOH 250 mL H2O
25-Hydroxyvitamin D3 RIA Buffer
Purpose: 25-RIA pH: 6.2 F o r l L 6.88 g Sodium phosphate monobasic (NaP04) 1 g Gelatin, 0.1 % 3.92 g polyvinyl acetate (PVA, Aldrich cat # 36,317-0) 1 gm of sodium azide,. 1 %
lUA Wash Solution
Purpose:RIA wash pH: 6.2 50 mM sodium phosphate monobasic 0.1 % gelatin 0 .1% sodium azide 0.025 % Tween 20
176
Donke> AntiGoat Antibody - Precipitating Complex
Purpose: 25-h>droxyvitaiiiin D3 RIA Incstarcat#22915
Wang's Tracking Dye
Purpose: SDS gel sample buffer pH: 8.0
363 mg Tris 88 mg EDTA 3gSDS Dissolve in 50 niL water, adjust pH Add 30 mL glycerol Add 3 mg pyronin Add water to lOOmL
Stock Acrylamide
Purpose: SDS gels 30 g acrylimide dissolved in 50 mL water
if 37:1 gel = 0.8 g bis if 50:1 gel = 0.6 g bis if 100:1 gel = 0.3 g bis stir until dissolved fill to 100 mL, put into beaker add chunk charcoal and stir filter through Watman 541 or 542 filter paper into dark bottle store at 4°C
20 % SDS 20% SDS in water
10%AMPER
10 % ammonium persulfate in water .5 g in 5 mL dd water
177

SDS PAGE Solubilizing Buffer
2% SDS 10 mM phosphate, pH 7.0
2 M Tris-HCl
Purpose:SDS PAGE Gels pH:8.8 24.2 g Tris add 50 niL water add HCI to pH to 8.8 Bring to \olunie, 100 niL Store at 4°C in brown plastic bottles
M Tris-HCl
Purpose:SDS-PAGE Gels pH:6.8 12.1 g Tris add to 50 mL water pH witii HCI to 6.8 Bring to volume, 100 mL Store at 4°C in brown plastic bottles
178
lOX IransferBuffer
Piu-pose: Transferring SDS-PAGE Gels to PVDC Fori L 30 g Tris 140 g Glycine
1 X Transfer Buffer
Purpose: Transferring SDS-PAGE Gels to PVDC Fori L 100 niL 10 X Transfer Buffer 150 mL methanol Fill to 1 L and store at 4°C
Western Blotting PBS
Purpose: Westem blots
pH : 7.5
For 1 X solution
11.5gNa2HP04(8omM)
2.96 g Na2H2P04 (20 mM)
5.84gNaCl
5 X Westem Blotting PBS
57.5gNa2HP04
14.8gNa2H2P04
29.2 g NaCl
Dilute to 1000 mL with dd Water Before using dilute by 5 to make 1 X Transfer Buffer
179

PBS-1 ween
\dd 0.1" 0 I weeii-20 to a 1 X workiiii: solution iil PBS (1 ml /! )
Blocking Solution
.\dd 5"o by weight volume nonfat dr\ milk to 1 X PBS-1 ween (5 g NFDM in 100 mL 1 X PBS-Tween)
180
APPENDIX B
DETERMINATION OF PLASMA CALCIUM
(Perkin-Elmer Corp., 1965)
1. Collect w hole blood samples via jugular puncture using at least an 18-gauge
needle. It is best to collect blood samples into 13 x 100 borosilicate sodium
heparin \ acutainer tubes (Becton Dikinson, Franklin Lakes, NJ; VWR cat. #
VT6480). Never collect blood into EGTA treated tubes if determining calcium
concentrations.
2. Store blood tubes at 4°C or on ice and transport back to laboratory.
3. Centrifiige tubes at 500 g for 15 minutes.
4. Collect the top la\ er of plasma using plastic transfer pipettes and transfer to 4 mL
crjTOtubes.
5. Store plasma at -20°C imtil determination of calcium and/or phosphorus.
6. Thaw cryotubes in warm tap water and vortex cryotubes before pipetting samples.
7. Pipet 100 pL of plasma into 16 x 100 mm test tubes in duplicate.
8. Add 5.4 mL dd H20 and .5 mL of I M Lanthanum chloride solution. Vortex
tubes.
9. Prepare standards of 0, 5, 10, and 15 mg/100 mL in duplicate.
10. Standardize atomic absorption spectrometer.
11. Read samples. Express values as mg/100 mL of plasma.
181
-»
APPENDIX C
DETERMINATION OF PLASMA PHOSPHORUS
(Parekh and Jung, 1970)
1. DissoK e 5 g of ammonium molybdate (NH4)6Mo7O24H20 in 100 mL of 30 %
sulfiiric acid \ol'vol solution.
Mix 1 volume of the above mohbdic acid solution with 2 volumes of 10 %
trichloroacetic acid (TCA) solution vol/vol.
3. p-Phenylenediamine reagent: Dissolve 1 g of p-phenylenediamine
dihydochlorided in 100 mL of 5% sodium bisulfite (Na2S205) solution. **Make
this up fresh daily using fresh sodium bisulfite and keep at room temperature.
4. Dissolve 0.6589 g of pure, well-dried mono potassium phosphate (KH2PO4) in 10
mL of 10 N sulfuric acid. Bring to volume in a 1 L volumetric flask. This is the
stock 15 mg inorganic phosphoms/ 100 mL standard. Dilute out to get standards
of 1, 3, 5, 7, 10, and 15 mg/100 mL.
5. Pipet 125 il of plasma sample into 12 x 75 mm test tubes. Do the same for the
standards and the blank using water for a blank and zero standard.
6. Add 1 mL of molybdic-TCA reagent. Vortex and let stand for 5 min.
7. Centrifuge for 10 min at 500 g.
182

8. Iransfer 100 pi of supernatant from the 12 \ 75 tubes into appropriate wells of a
'o well microtiter plate in duplicate.
9. Add 150 pi of p-phen>lcndiamine icai;enl and agitate for 30 min.
10. Read on microplate reader at o90 sdO nm.
11. fhe \ allies w ill be expressed at mg V 100 ml. of plasma.
183

APPENDIX D
COOKING METHODS USING FOR USING A MAGIGRILL
MODEL TBG-60 ELECTRIC CONVEYOR GRILL
1. All samples should be cut frozen to exactly 2.54-cni in thickness.
2. Renio\e all exterior fat and extra muscles.
3. Thaw frozen steaks at 2°C for 24 h.
4. To determine cooking loss make sure to weigh each steak before and after
cooking.
5. For strip steaks (Longissimus) set cooking program to have a top and bottom
cooking temperature of 325°F, a thickness of .85-in, and a cooking time of 5 min
40 s.
6. For mock tender (Supraspinatus) and top sirloin (gluteus medius) steaks set
cooking program to have a top and bottom cooking temperature of 325°F, a
thickness of .85-in, and a cooking time of 5 min 5 s.
7. For inside/top round (Semimembranosus) steaks set cooking program to have a
top and bottom cooking temperature of 345°F, a thickness of .95-in, and a
cooking time of 5 min.
184

APPENDIX E
WATER-HOLDING CAPACITY OF FRESH MEAT
(Wierbicki and Deatherage, 1958)
1. Weigh out two sheets of Whatiuan # 1 filter paper, stored in a desicator.
2. Grind or well mince 0.5 g of meat and place between two sheets. Do steps 1 and
2 in duplicate
3. Weigh sheets and the sample.
4. Place the sample and sheets between two Plixiglass sheets and press at 500 psi for
1 min using a Carver Press.
5. Remo\ e sheets from the press and trace the two apparent rings, the inner or meat
ring, and the outer or water ring.
6. Measure the area of both rings in square cm using a planimeter (Tamaya digital
plaiumeter, Planix 7®, Overland Park, KS).
7. Convert the aboxe measurements to square inches.
8. Determine the percent moisture by the following:
a. Weigh an aluminum weigh dish and record pan weight.
b. Add 5 g of meat and record pan -i- sample weight.
c. Place in drying oven at 100°C for 24 h.
d. Weigh the pan and sample after 24 h and record weight.
e. Determine moisture content.
185

) fotal moisture of the sample is calculated in the I'ollowing manner: Total
moisture (mg) Sample wt. (sample into car\cr pivss) X 1 ()()() X percent moisture
(in decimal form).
10. Percent free water is:
do ta l Surlacc Area, in' - Meat Film Area, iii^) * (61.1)
1 otal Moisture of the Sample
11. Percent bound water is 100 - percent lice water.
12. Percent immobilized water is percent bound water - percent Iree water.
186
APPENDIX F
DETERMININATION OF THE CALCIUM CONTI'NT OF MEAT
(AOAC, 1990)
1. Weigh out approximately a 5 g sample of meat, place the sample in a 50 mL
ashing (Coors, Golden CO) crucible and record the actual weight.
2. Repeat step I for duplicate.
3. Dry samples o\ernight in a 100°C drying oven.
4. Next, ash samples at 625°C for 18 h.
5. Let cmcibles cool 4 - 24 h.
6. Rinse each cmcible with 50 mL of 3 N HCI into a 400 mL beaker.
7. Add I mL of 70 % nitric acid (HNO3) to each beaker.
8. Boil beakers until 20 mL of sample remains and let cool to room temperature.
9. Filter sample through (Q2 Filterpaper, Fisher) into a 100 mL volumetric flask.
10. Bring sample to volume.
11. Vortex each flask prior to pipetting.
12. Pipet 5 mL of sample in duplicate into 16 x 100 mm test tubes.
13. Add 4.5 mL of dd H2O and 0.5 mL of 5% (vol/vol) Lanthanum chloride solution.
Vortex before reading.
14. Standardize atomic spectrometry with standards of 0, 5, 10, and 15 mg Ca /100
mL.
15. Read samples and report samples as mg/100 g tissue.
187

APPENDIX G
DETERMINATION OF THE PHOSPHORUS CONTENT OF FRESH MEAT
(AOAC, 1990)
1. Follow steps I through 11 of Appendix E for the ashing process of samples.
2. Pipet 1 iiiL of sample into 13 x 100 mm test tubes in duplicate.
3. Add 4 iiiL of phosphorus reagent and let samples stand 10 min.
4. Also pipette standards of 0, 1,3, 6, and 9 mg of phosphoms per 100 mL in
duplicate into test tubes.
5. Standardize the Beckman DU-50 Spectrophotometer (Beckman Coulter, Chaska,
MN) with the standards.
6. Read samples.
7. Report phosphoms concentrations as mg /100 g tissue.
188
3
APPENDIX H
EXTRACTION OF TISSUE FOR VITAMIN D ASSAYS
(Montgomery et al, 2000)
1. Thinh slice 2 g of tissue. Add 8 niL of PBS in a 15 mL conical tube.
Homogenize for 60 s.
2. Transfer 2 mL of homogenate to a 50 mL capped centrifuge tube (29 x 147 mm).
Add approximately 50 ng of vttamin D2 and 1000 cpm of ^H-25-hydroxyvitamin
D3and H-1,25-dihydroxyvitamin D3 for recovery estimates. Also keep a
separate scintillation vial for each of these compounds for total counts.
4. Add 2 mL of methanol and 6 mL of hexane to the tube and shake for 10 min.
Centrifuge the samples for 5 min at 500 g. Keep the upper layer (Hexane) in a
separate 13 x 100 mm test tube.
5. Repeat step 4. Dry down the hexane layers.
6. Add 2 mL of chloroform and vortex. Add 2 mL of 2:1 methanol/chloroform, add
2 mL of water, and then shake 10 min and centrifuge for 5 min at 500 g. Keep the
bottom layer in the dried tube from step 5.
7. Add 2 mL of chloroform, shake 10 min and centrifuge for 5 min at 500 g. Add
the bottom layer to the 13 x 100 tube in step 6.
8. Vortex and centrifuge 10 min at 500 g, then remove and discard the top buffer
(water) layer.
9. Dry down the sample and prepare minicolumns.
189

10. Suspend the residue in 1 niL of hexane and let stand 15 min.
11. Wash tiie columns (Varian Bond Elut LRC 81 silica cartiidge) with 5 mL each in
tiie order, methanol, chloroform, and hexane.
12. Apply suspended sample to tiie Varian Bond Elut LRC 81 silica cartridge. Follow
witii 8 niL hexane, then 3 mL 99:1 hexane/isopropanol, this is waste.
13. Collect 6 iiiL 99:1 hexane/isopropanol as the vitamin D3 fraction.
14. Collect 12 iiiL 95:5 hexane/isopropanol as the 25-hydroxyvitamin D3 fraction.
You will need to collect two 13 x 100 tubes for this volume.
15. Collect 8 mL 75:25 hexane isopropanol as the 1,25-dihydroxyvitamind D3
fraction.
16. Once all fractions are collected they can be stored at -20°C in ethanol or dried
and prepared for HPLC.
17. For Vitamin D3. reconstimte in 25 pi of 99:1 hexan:isopropanol. Load onto a
Supelco Sil LC-5 column (.46 x 25 cm) at 2 mL /min. Collect Vitamin D3 peaks.
Dry sample and reconstitute in 25 pi of 85:15 Acetonitril:Methanol and load onto
the Vydac Reverse phase C18 4.6 x 250 mm column. Rim standards including
range of expected vitamin D (10, 20, 40, and 80 ng of vitamin D3 plus the intemal
vitamin D2 standard). Use the vitamin D2 peak to determine percent recovery for
each sample and determine the concentration of vitamin D3 using the above
standard curve. Remember to account for dilution effects.
190
i8. For 25-h\dro\\\ itamin 1); load onto the Inst column in step 17 in 25 pi of
88:U):2 iiexane, meth\lene chloride, isopropanol run at 2 niL/min. Collect
fractions and determine concentrations using an ria on the samples.
19. For l,25-dihydro\\\ itamin 1)3 load samples from minicolumns onto the column
in step 17 and 1S in 25 pi of 9(): 10 hexane/isopropanol and run at 2 mL/min.
Collect fractions and determine concentrations using an ria on the samples.
191
APPENDIX I
25-HYDROXYVITAMIN D3 RADIOIMMUNOASSAY FOR TISSUES
(Montgomery et al.. 2000)
1. Dr> the 25-hydrox>'vitamin D3 sample from the HPLC When dry add 1 mL of
acetonitrile and \ ortex. Let samples stand for 5 min.
2. Label 12 x 75 mm tubes in duplicate for the samples and standards. Standards are
0, N. 1. 4. 16. 64. 256 pg/25 pi and TCT.
3. Put ''^'l-25-hydroxyvitaniin D3 (about 10,000 cpm) in all tubes.
4. Pipet 25 pi of acetonitrile in tiie 0 and N tubes. Set aside the TCT and N tubes.
5. Pipet 25 pi of standards in the appropriate tubes and 25 pi of sample in to the
appropriate tubes.
6. Dilute primary antibody (goat 25-OH vitamin D3 antibody) 1 mL in 30 mL of
RIA buffer, let stand 5 min.
7. Add 1 mL of this primary antibody solution to all sample tubes and all standard
tubes except the TCT and N tubes. Add 1 mL of the buffer to the N tube.
8. Vortex all the tubes and incubate at room temperature for 90 min.
9. Add .5 mL of the second antibody (Donkey antiGoat) to all tubes including the N
tube, but not the TCT. Vortex and incubate at room temperature for 20 min.
10. Add .75 mL of wash buffer and centrifiige at 20°C at 750 g for 20 min.
11. Discard the supemate (radioactive waste) and count the tubes in a gamma counter.
12. Determine concentrations using the standard curve.
192

\ I M M ; N D I X . I
1.25-DIIlYDRC)XY\lfAMlN I), R ADU )IMMl INOASSAV FOR TISSl IliS
(Montgomery etaf, 2000)
1. Dr\ the 1.25-Dlii\dio\\\ itaniin 1)3 sample from the HPLC. When dry add 105
pi of ethanol and \ ortex. Let samples stand for 15 min.
2. Prepare antibod\ by diluting the Rabbit #86 antibody 1/30,000 in the 1,25-RlA
butYcr.
3. Label 12 x 75 mm tubes in duplicate for the samples and standards. Standards are
0, N. 1,4. 16, 64. 256 pg 25 pi and TCT.
4. Put '" I-1.25-dihydrox\v'itamin D3 (about 10,000 cpm) in all tubes (approx. 25
pi).
5. Pipet 25 pi of ethanol in the 0 and N tubes. Set aside the TCT and N tubes.
6. Pipet 25 pi of standards in the appropriate tubes and 25 pi of sample in to the
appropriate tubes.
7. Pipet 400 pi of RIA buffer into the N tube.
8. Pipet 400 pi of the diluted primary antibody into the sample, standards, and 0
tubes.
9. Incubate the tubes at room temperature for 2 h.
10. Add 500 pi of the precipitating complex (Goat antiRabbit) and incubate for 30
min.
11. Add .75 mL of wash buffer.
193

12. C\Mitrifuge at 750 g for 20 min al 2()"C Pour off supernatant and count for 2
minutes on the gamma counter.
13 Determine concentratiiMis usin^ the standard cur\ e.
194

^
APPENDIX K
DETERMINATION OF THE VITAMIN D3 CONCENTRATION IN PLASMA
(Montgomery et al., 2000)
1. Pipet 200 pi of sample plasma into 13 x 100 tubes. Add internal standard of
\ itaniin D2.
Add 200 pi of methanol and vortex.
3. Add 1.5 mL of hexane and vortex.
4. Centrifuge tubes at 1950 RPM (750 g) at 25°C for 10 min. Remove top layer
and keep in another tube.
5. Add another 1.5 mL of hexane to the original sample tube. Vortex and
centrifiige as in step 4. Again remove the top layer and add to fraction from
step 4.
6. Dry down tubes in savant.
7. Add 1 mL hexane and add to minicolumns (step 12 Appendix H).
8. For fiirther determinations follow appendix H.
195
APPENDIX L
RADIOIMMUNOASSAY FOR 25-HYDROXYVITAMIN D3 IN PLASMA
(Montgomery et al., 2000)
1. Label 12x75 mm tubes for staiidards(0, 7.5, 15, 30, 60, 120, 240, 480 ng) and
samples. Add 0.5 iiiL of acetonitrile to the standard tubes, and 1 mL to sample
tubes.
Add 50 pi of sample plasma to appropriate tubes.
Add 50 pi of \itaniin D free calf plasma to the standard tubes. Add the standards
in 10 pi of ethanol to the appropriate standards.
4. Vortex. And centrifuge at 500 g for 5 min at 4°C.
5. Add 25 pi of '''I-25-hydroxyvitamin D3 to each tube. Vortex.
6. Follow step 7 through 12 of Appendix I.
-)
J .
196
APPENDIX M
RADIOIMMUNOASSAY FOR 1,25-DIIIYDROXYVITAMIN D3 IN PLASMA
(Montgomery et al., 2000)
1. Pipet 500 pi of samples and vitamin D free calf plasma in duplicate into 12 x 75
mm test tubes. For standards add 0, 4, 16, 64, 256, and 512 pg of 1,25-
dilndroxyvitamin D, into the \ itaniin D free plasma.
2. Add 500 pi of acetonitt-il and vortex 3 to 4 times in 10 min.
3. Centrifuge tubes for 10 min at 750 g at 20°C.
4. Pour off supematant into clean 12 X 75 mm tube and add 500 pi of PBS to each
tube. Let sit for 30 to 60 min at room temperature.
5. Prepare extta clean Baker 10 SPE silica gel #7086 by washing with 5 mLs of
90/10 Hexane/Methylene Chloride, 5 mLs of Isopropanol, and 5 mL of methanol.
6. Just before samples are ready to be added to columns was with 1 mL of methanol
and add samples to appropriate columns.
7. Add the following solvents as waste, 5 mLs of 70/30 methanol:water, 5 mLs of
90/10 hexane:Methylene Chloride, and 5 mils of 99/1 Hexane:Isopropanol.
8. Collect 3 mLs of 92/8 Hexane:Isopropanol.
9. Dry samples in Savant.
10. Take samples out 12 at a time and add 50 pi of 95% ethanol and 125 pi of '^^Ipl-
1,25-dihydroxyvitamin D3 and vortex. Immediately pipette two 75 pi aliquots of
197
this mixture into clean 12 x 75 mm test tubes. Proceed with this step until all
samples and standards are all finished.
11. Now add 300 pi of rabbit #86 antibody to all tubes except the TCT and NSB.
Add 300 pi of NSB solution to NSB tubes.
12. Vortex and let sit at room temperature for 2 h.
13. Add 500 pi of the Goat Antirabbit precipitating complex to all tubes except the
TCT.
14. Vortex tubes and incubate 20 min at room temperature.
15. Centtnfiige all tubes except TCT at 1000 g for 20 min at 25°C.
16. Decant the supernatant from all tubes except TCT.
17. Count each tube for 2 min on gamma counter.
18. Use standard cur\'e and dilutions to determine concentrations.
198

APPENDIX N
WHOLE MUSCLE SAMPLE PREPARATION FOR SDS-PAGE
(Bechtel and Parrish, 1983)
1. Fineh knife mince 0.2 g of muscle and add to 5 niL of solubilizing buffer.
2. Homogenize tiie sample in a motor driven Dounce Homogenizer (Heidolph
#RZR1, Germans; 30 stiokes) on high speed.
3 Centrifuge the sample at 500 g for 15 min ate 25°C. Keep supernatant.
4. Determine the protein concentration using either the BCA (Pierce) or DC
(BioRad) protein assay method.
5. Dilute samples to 6.4 mg/mL with dd water.
6. Combine 1 mL of samples with 0.5 mL of Wang's tracking dye and buffer.
7. Add . 1 mL of MCE. This makes the total volume 1.6 mL of solution.
8. Put tubes in 50°C heating block on low (or water bath) for 20 min.
9. Freeze at -80°C immediately.
199
a
APPI- :NI)IX()
BiOR.M) (ii.;i s i-oR wiioi I Musc i . i rns s i i i ;
1. Before pouring ..-Is it 4 x Separating (iel Builer and 4 x Stacking Gel Buffer
must be made.
4XJieEaraimo Gel Buffer, 1()0 ml, 4AStacl<iim Gel Buffer. 100 ml,
75 mL 2 M Iris-HCl (pH 8.8) a. 50 mL 1 M Tns-HCl (pH 6.8)
b .2mL20°oSns b. 2 niL 20% SDS
c. 23 mL distilled w ater c. 48 mL distilled water
2. For 15% gels. 60 niL add the following:
a. .Acr> lamide Bis solution 30 mL
b. 4 X Separating Gel Buffer 15 mL
c. Distilled Water 15mL
d. 10% Ammonium Persulfate 300 pL
e. TEMED 30 pL
3. Pour four biorad gels, don't forget the wax paper as gel separations.
4. Allow to polymerize for a minute and add 10 mL of water to the top of the gel.
5. Allow the seals to set for 90 minutes.
6. Pour off the water on the top of the separating gel.
7. Mix Stacking Gel:
a. Distilled Water 4.6 mL
200
b. i\cr\lamide Bis 1.34 ml.
c. 4 X Stacking Gel Buffer 2 mL
d. 10"o .\mmonium Persulfate 60 pi
f lMl-D 10 pi
8. Pour on the stacking gels and insert the combs as soon as possible alter pouring
the slacking gel. \llow gels to set 9() min.
9 .-Xdd samples, 15 pi (60 pg of protein), and 5 pi of molecular weight standards per
lane.
10. Run gels at a starting of 120 \ olts (ending will be approximately 200 volts) for
150 to 180 min. until the tracking d> e has nearly run off the gel (Hoefer Scientific
Instruments, Hoefer Tall Mitght>' Small vertical Slab Gel Unit, Model SE280, San
Francisco, C.\; Power supple, Biorad Power Pac 100).
11. Stop gel and prepare for Western-blots.
201
APPI NDIX P
S lANDARl) W ES 1IIRN BLOn ING PROTOCOL
(Huff-Lonergan et al.. 1996a)
1. W hile Sns-P..\GE gel ,s mnning cut PVDF membrane and blotting paper to size
of the gel.
2. Briefl) wet the lADF membrane in 1 ()()»« Methanol, then allow to soak in cold
4°C transfer buffer 10 min before the gel is finished running.
3 When the gel has finished running remoxe it from the glass plates and assemble
\our gel sandwich in the transfer cassette. When putting together the gel
sandwich keep all components submerged in transfer buffer as you assemble and
take care to remo\ e an\ bubbles that may form between layers, this can be done
by rolling each la\ er w ith a test tube. A sandwich consists (in order) a transfer
sponge, blotting paper (Schleicher & Schuell, GB004), the gel, PVDF membrane
(Scleicher & Schuell, Westran PVDF), blotting paper, and a transfer sponge.
4. Fill the transfer tank (Hoefer TE Series Transphor electrophoresis unit) with cold
transfer buffer. .And insert the cassettes. Place the lid on the tank so that the
anode is toward the gel side of the sandwich and the cathode is toward the PVDF
side of the sandwich.
>. Transfer at a constant voltage setting using 90 v for a total time of 90 minutes
(Fisher Biotech Electrophoresis Systems, Model # FB 570, Pittsburgh, PA;
cooling unit: Lauda Brinkmann Ecoline Rel06, set at 0.5°C). When the transfer
202
is complete, disassemble the sandw ich and allow the PVD1< to dry, wrap in Saran
and place in retrigeiator o\ ernighl. The transfer buffer should be maintained at 4
to IO"C
0. W et the membrane w ith 100"., methanol. When ready to begin the detection
sequence, place the membrane in blocking solution on a rocker and allow to rock
al room temperature for 1 h.
7. While the membrane is blocking prepare the primary antibody solution. For
troponin- f detection, I use antibody .11.1 -12 from Sigma. Dilute the particular
antibody 1:15,000 (1 pi antibod> for e\ery 15 mL PBS-Tween).
8. .\fter blocking the membrane for 1 h.. pour off the blocking solution, discard and
pour on the diluted primary antibody. Allow to rock for 1 h at room temperature.
9. Pour off the primary antibod>' solution and discard. Wash the membrane by
pouring on enough PBS-Tween to cover the blot and rock for 10 min. Pour off
and discard. Repeat washing step 2 more times.
10. Prepare the second antibody during the last wash. 1 use product number A-2554
from Sigma. This is a goat anti mouse IgG antibody that is labeled with
horseradish peroxidase. 1 dilute A-2554 at a ratio of 1:5000 (1 pi antibody for
every 5 mL of PBS-Tween)
11. After the last wash, pour off and discard the PBS-Tween, and pour on the
secondary antibody solution. Allow to rock at room temperature for 1 h.
12. After 1 h, pour off and discard the secondary antibody solution and wash the
plates three times as in step 9.
203
13 For detection, 1 use a chemilumenescent protocol using a kit from Amersham
(1A L, product number RPN 21 Ob), fhis method requires exposing the plot to
film so \ ou need access to a dark room and film de\ eloping chemicals. Add
according to kit suggestions and expose film 30 or 60 s. Develop film. Use
Kodak imaging computer package to determine dillcrcnces in pixels. Express as
a percentage of a control run on each blot.
204
D.
APPENDIX O
DlFFfREN 1 lAI, CflNfRlFUGATION OF MUSCLE
(Toury etal., 1990)
Remo\e the fibrous en\ elope, fat. and connectixe tissue of the muscle. Remove
approximateh 5 g of muscle tissue and place in a 50 mL centriluge tube. Add 30
niL of 0.25 M sucrose in the tube and rapidly mince the sample with a tissue
homogenizer for oO s. fhe samples were then strained through a wire strainer to
remos e an>- large fragments into another tube.
Remo\e 5 niL of homogenate for mineral analysis. Place the remaining
homogenized sample in centrifuge tube and centrifuge samples at 1500 X g for 30
min. Decant the supematant into another centrifuge tube. Resuspend the pellet
with 20 mL of 0.25 M sucrose and place in a tube for mineral analysis.
Centrifuge the supemate from step 2 at 3000 X g for 30 min. Decant the
supemate into anther centrifuge tube. Resuspend the pellet with 10 mL of 0.25 M
sucrose and place in a 15 mL centrifuge tube for mineral analysis.
Centrifuge the supemate from step 3 at 8000 X g for 60 minutes. Decant the
supemate into another centrifuge tube. Resuspend the pellet with 10 mL of 0.25
.\1 sucrose and place in a 15 mL centrifuge tube for mineral analysis.
Centrifiige the supemate from step 4 at 180,000 X g for 120 minutes. Place the
supemate into a 15 mL centrifuge tube. Resuspend the pellet with 10 mL of 0.25
M sucrose and place into a 15 mL centrifiige tube for mineral analysis.
205
fhe sedimented and resuspended iragments from step 2 represented the nuclei,
cell debris, and large myofibril fragments, fhe resuspended pellet from step 3
constituted small m\ofibril fragments, fhe resuspended pellet from step 4
consisted of sedimented mitochondria, fhe sediment from step 5 retained the
sarcoplasmic proteins, fhe supernate from step 5 retained soluble elements only,
and was considered isolated CNIOSIU.
206

APPENDIX R
PERCLORIC DIGESTION OF TISSUE AND DETERMINATION
OF FHE MINERAL CONTENT
(Muchovej etal., 1986)
1. Pipet 2 iiiL of homogenate from each sample into 50 mL digestion tubes (Kimax
# 47125) using trace metal free pipette tips (Fisher cat # 21-197-8L).
2. Add 1 niL of 70% nitt-ic acid (HNO3) to each tube and let digest at 25°C
ovemight.
3. Add 2 mL of 70% perchloric acid (HCIO4) to each tube and place on the heating
block.
4. Heat samples to 120°C. Agitate samples every 5 min to reduce nitric gas
production. The nitric fiimes will appear as red fiimes.
5. Once rutric fumes haves stopped heat samples to 180C agitating lightly every 4
min. Remove tubes from heating block when samples clear or there is only 1 mL
or less of sample solution in the digestion tube.
6. Cool samples to room temperature and fill to 25 mL.
7. Place samples in sample tubes and measure as atomic emission by a Thermo
Jarrell Ash Trace Scan Inductively coupled soectriogitinter (Franklin, MA).
8. Determine the protein concentration of the samples prior to digestion using the
biurett method. Express as pg of mineral per 100 g of tissue.
207

APPENDIX S
VlSl)ALl/.\ flON OF CAl CllJM PliRClPlTAI I'S IN TlSSUf;
( louiy et al.. 1990; Mentie and liscaig. 1988)
1. Rapidly remove mu.scle samples from the carcass immediately after death. Cut
100 to 1000 pm samples b\ hand with a razor blade.
2. Place the sections in fixation solution (4% cold potassium pyroantimonate, 2%
paraformaldehyde, 1% pheonol pH 7.4) for 4 h at 4°C. Samples can be fixed for
up to 24 h. but a minimum of 4 h is required. Also, 1% osmium tetroxide can also
be added to tiie fixation solution to enliance resolution of the samples.
3. Deh\drate sections through a graded series of ethanol/water solutions consisting
of 50%. 75%. 85%, 95%, 95%, 100%, 100%, 100%, and 100% ethanol with 10
minutes each change.
4. Incubate sections in ethanol Embed 812 (Electron Microscope Sciences) mixture
of 2:1. and 1:2 for 2 h each change.
5. Xext. in two changes 100% Epon-Araldite for 2 h each change. Any one of the
changes can occur longer, ovemight.
6. Embed section in freshly degassed Embed 812.
7. Polymerize blocks in 60°C oven for 48 h.
8. Cut blocks to sih er-gray interference color and pick up on copper grids (Sorvall,
MT2-B Ultra-Microtome).
208

9. Stain sections in 4% uranyl acetate for 15 min. fhen stain in Reynolds lead
citrate for 2 min.
10. Cut 1 pm Reynolds lead citrate stained sections with a glass slide. Stain sections
with l"o methyline blue and azure II.
11. Wash grids in distilled water.
12. Dry grids in grid box or on no-linting filter paper and view with Hitachi
transmission-electron microscope (Hitachi, Tokoyo, Japan, #H 600).
13. Take pictures of desired areas.
209
APPENDIX 1
DETERMINATION OF fllE, PROTFdN CONTENT OF HARVESTED CELLS
(Bradford, 1976)
1. There are three major types of protein assays that can be used to determine pg
concentrations of protein. fhe\ are the BCA, Bradford and Lowry methods. For
the Bradford or BCA methods:
2. Pipet standards of 100, 75, 50, 25, 12.5, 6.25, and 3.13 pg of BSA/mL in
triplicate into 96 well plates. The total volume of each well should be 100 pi.
Make sure that there are some empty wells to deduct background from your
standard curve (this is the blank).
3. Next, pipette the samples. Depending on the protein concentration this may be as
much as 100 pi of sample or as little as 5 pi diluted up to 100 pi. It is important
to \erify the concentration of proteins in the samples is within the range of the
standards.
4. Next, add 100 pi of BCA or Bradford reagent (this can be purchased as a kit from
BioRad). Incubate the plate for 10 min.
5. Read the plate at 595 nm on a plate reader. Determine the standard curve r ,
should be .95 or greater. Use the standard curve to determine protein
concentration.
6 The BioRad DC Protein Assay is another colorimetric protein assay that functions
very well at low protein concentrations. To use this assay (Lowry method) follow
210

the BioRad directions. This kit takes longer than a Bradford or BCA and is just
as accurate.
211
J .
APPENDIX U
DETERMINATION OF CELLULAR PROTEIN SYNTHESIS OF C2C12 CELLS
(Reecy etal., 1994)
Aspirate the media from a culture flask containing C2C12 myoblasts, ft is
important to subculture C2C12 cells prior to 100% confluence as they begin to
change physiological 1\ when they reach high confluence rates. Replace the
DMEM + 15%. FBS with 8 niL of a .25% trypsin and I mM ethyenediamine
tett-aacetic acid (EDTA) solution.
Incubate at room temperature until all of the cells release from the flask (about 10
min).
Transfer the media and cells to a 15-niL centrifuge tube. Centrifuge at 500 X g
for 5 min.
4. Discard the supematant. Resuspend the cells in DMEM -i- 15% FBS. Vortex to
resuspend the cells.
5. Determine the number of cells per mL using a hemocytometer.
6. Transfer sufficient volume of the media and cells so that 5,000 cells are in each
well of a 24 well culture plate.
7. Allow the cells to grow for approximately 48 to 72 h at which time they should
reach a confluence rate of 60% to 70%. Remove the media and replace with 1.0
mL of skeletal Muscle Basal Media (SKBM) and 15 % FBS and antibiotics. To
this media any treatment, whether serum from animals (added at 5%), muscle
212

extracts, or steroids can be directly added to the media before pipetting onto the
24 well plates. I also prefer to use straight DMEM -i- 15% FBS (including
imtibiotics) as an internal control. Incubate for 24 to 48 h depending on type of
treatments (steroid treatments take longer to see effects).
8. Add 1 pCi of' V-labelled amino acids and incubate for 2 h at 37°C
9. Remove the labeling media and rinse the fresh media to remove any residual label
(rinse tiiree times).
10. Add 0.5 mL of 1 M NaOH to each well and incubate for 2 h at 37°C.
11. Add 0.5 mL of 20% cold TCA. Incubate the plates overnight at 4°C.
12. Remove 200 pi sample from each well and store separately in a 1.5 mL tube.
This sample is used to determine the protein concentration per well. Next transfer
the remaining contents of each well to a glass-fiber filter placed on a vacuum
manifold. Wash the well and the filter with about 3 mL of additional 5% TCA.
13. Place the filter under a heating lamp for about 10 min to dry.
14. Transfer the dried filter to a liquid scintillation vial and add 5 mL of liquid
scintillation counting cocktail.
15. Determine the counts per minute in a scintillation counter (it is best to count for 5
minutes per tube).
16. Divide the counts for the 0.8 mL sample by the appropriate amount of determined
protein from appendix T. Amino acid uptake is as follows:
%) Protein synthesis = CPM treatment/ ug protein X 100
CPM DMEM (intemal control)/ pg protein
213
APPENDIX V
DETERMINATION OF CELLULAR DEGRADATION OF C2C12 MYOBLASTS
(Ballard etal., 1986)
1. Aspirate tiie DMEM + 15% FBS media from the culture flask and subculture
C2C12 cells into 24 well plates as explained in appendix U.
2. Once tiie cells have reached 60% to 70% confluence, remove the media and
replace witii 1.0 luL of SKBM media containing 15% FBS and antibiotics (no
tieattuents are in the SKBM media at this time). Add 1 pCi of "*C-labeIIed amino
acids to each well. Incubate for 24 h.
3. Remove the labeling media and wash each well three times with fresh media.
4. Place 1.0 mL of SKBM + FBS and the treatments in each well and incubate for 4
to 48 h. (For steroids I incubate for 24 to 48 h, making sure to replace the media
e\er> 24 h with fresh treatment media).
5. Once the cells have incubated for a long enough period of time, remove the chase
media, rinse each well and place 1.0 mL of SKBM containing the treatment.
Incubate for 2 h.
6. Place 0.4 mL of the media in a 1.5 mL tube. To this add 0.4 mL of cold 20%
TCA. Vortex, and remove 100 pi to a 1.5 mL tube for protein determination.
Transfer the remaining TCA precipitate to a glass-fiber filter and rinse with 5%o
TCA. Dry the filter, place in a scintillation vial with 5 mL counting cocktail, and
count in a liquid scintillation counter.
214
7. Transfer 0.4 mL of the remaining media to a scintillation vial, add 5 mL of
counting cocktail, and count in a liquid scintillation counter. Remove the
remaining media and store in a 1.5 niL vial for determination of the protein
concentration.
8. Rinse each well w ill fresh media three times. Add 0.5 mL of 1 M NaOH.
Incubate at 37°C for 2 h.
9. Add 0.5 niL of cold 20% TCA to each well and incubate at 4°C overnight.
10. Remove a 200 pi sample from each well and place in a 1.5 mL tube for protein
determination. Transfer the remaining contents of each well onto a glass-fiber
filter placed on a vacuum manifold. Wash the well and the filter with about 3 mL
ofadditional5%TCA.
11. Dry the filter and count on a liquid scintillation counter as explained previously.
12. Determine the counts per minute per pg of protein for the media, TCA precipitate,
and cell layer.
% protein degradation = cpm TCA Precipitate X 100 X 100
cpm TCA Precipitate 4- cpm Media -i- cpm Cell Layer
215
-)
APPENDIX W
ENZYME LINKED IMMUNOABSORBANCE ASSAY
(Morrow et al., 1991)
1. Pipet 1 to 10 pg of protein of the sainples in question in quadruplicate into 96
well ELISA plates. For calpastatin determination I use 1 pg, for the calpains I use
2 pg, and for calbindin and the calcium-sensing receptor I use 7 pg of protein per
well. Also pipette PBS in four wells to determine nonspecific binding. Also
make sure each plate has an internal control sample pipetted. Dry the samples
and add 200 pi of Borate Buffer. Incubate at 4°C for 12 h.
Decant the Borate Buffer and block each plate with 200 pi of PBS and 1% BSA
for 1 h at 4°C. Approximately 10 min before the plates are finished blocking,
dilute the primary antibody.
3. Dilute the primary antibody in PBS -i-1% BSA and Tween 20. For calpastatin
(Affinity Bioreagents, Golden, CO, cat # MA3-945) I dilute 1:2000, for p-calpain
(Affinity, cat # MA3-940) I dilute 1:4000, for m-calpain (Affinity, MA3-942) I
dilute 1:8000, for calbindin (Chemicon Inter. Inc., Temecula, CA, cat # AB1778)
I dilute 1:4000, and for the calcium sensing receptor (Affinity, cat # PAl-934) I
dilute 1:2000. Pipet 150 pi of the primary antibody to each well. Incubate for
150minat4°C.
4. Rinse each plate 5 times with PBS + Tween.
5. Dry any excess PBS from each plate with a towel.
216

6. Dilute the second antibody (American Qualix Antibodies, San Clemente, CA,
goat anti mouse IgG horseradish peroxidase conjugated, cat # A106PN)in PBS +
1 % BSA and 1"w ecu at 1:1000. Pipet 150 pi of secondary antibody to each well.
Incubate at room temperature for 1 h.
7. Rinse each plate as in step 4.
8. For each plate mix up 8 mg of o-Phenylenediamine in 20 mL of Citric Acid
Buffer. To tiiis add 80 pi of H2O2 (hydrogen peroxide). Incubate in the dark for
10 min at 25°C. After the color development has occurred (this should happen in
5 to 15 min) add 50 pi of H2SO4 to stop the reaction. Incubate for 10 min at room
temperature in the dark.
9. Read plates at 490 nm on a plate reader. Average the quadmplicates and express
as a ratio of the intemal control.
217