Embed Size (px)
Citation preview

Murray-Darling Basin Plan
SDL Limits of Change Review
Independent Expert Advisory Panel Report
September 2017
Peter Davies (Chair), Brett Tucker, Darren Baldwin, Justin Brookes,
Trevor Jacobs, Ross Thompson

[INTENTIONALLY BLANK]

Independent Expert Panel | Confidential report i
Murray-Darling Basin Plan SDL Limits of Change Review
Contents
1. Executive summary .............................................................................................................................. 1
1.1. Background .............................................................................................................................................. 1
1.2. Panel findings........................................................................................................................................... 1
1.3. Responses to key tasks in the Terms of Reference .................................................................................. 2
2. Introduction........................................................................................................................................... 4
3. Uncertainties and errors ...................................................................................................................... 7
3.1. Ecological responses ............................................................................................................................... 7
3.2. SFIs ......................................................................................................................................................... 7
3.3. Hydrology and Model Performance .......................................................................................................... 7
3.4. Spatial representation .............................................................................................................................. 8
3.5. Uncertainties in Base flow evaluation ....................................................................................................... 9
3.6. Summary .................................................................................................................................................. 9
4. Methodology ....................................................................................................................................... 11
4.1. Assessment of Overbank Flow event breach cases ................................................................................ 11
4.2. Assessment of Base Flow breach cases ................................................................................................ 14
5. Issue 1: SFI’s in the Lower Darling ................................................................................................... 15
5.1. Summary of key points ........................................................................................................................... 15
5.2. Description of SFI ................................................................................................................................... 15
5.3. Description of SFI breach and ecological scoring outcomes ................................................................... 16
5.4. Results of risk-based assessment .......................................................................................................... 20
5.5. Findings ................................................................................................................................................. 22
6. Issue 2: SFI’s in Barmah-Millewa ...................................................................................................... 23
6.1. Summary of key points ........................................................................................................................... 23
6.2. Description of SFI ................................................................................................................................... 23
6.3. Description of SFI breach and ecological scoring outcomes ................................................................... 24
6.4. Results of risk-based assessment .......................................................................................................... 27
6.5. Findings ................................................................................................................................................. 28
7. SFI’s – Offsets at the regional scale ................................................................................................. 30
8. Issue 3: Base Flows ........................................................................................................................... 31
8.1. Summary of key points ........................................................................................................................... 31
8.2. Description of Base Flows ...................................................................................................................... 31
8.3. Description of Base Flow breaches ........................................................................................................ 32
8.4. Recommendations ................................................................................................................................. 38
9. Other issues and observations ......................................................................................................... 39
9.1. Declaring and Addressing uncertainty .................................................................................................... 39
9.2. Flexible operations and flow management .............................................................................................. 39
9.3. Water quality .......................................................................................................................................... 39
9.4. The Flow Targets ................................................................................................................................... 40
10. References .......................................................................................................................................... 41
Appendix A – Panel Terms of Reference ............................................................................................... 43
Appendix B – SDL adjustment mechanism ........................................................................................... 44
Appendix C – Limits of change ............................................................................................................... 48
Appendix D – Basin Plan Limits of Change ........................................................................................... 50
Appendix E – 4 September Modelling Outcomes .................................................................................. 52
Appendix F – Assessment Results - Lower Darling River reach ......................................................... 54
Appendix G – Assessment Results – Upper Murray River reach (Barmah-Millewa) .......................... 58
Appendix H – Ecological Scores ............................................................................................................ 62
Document history ..................................................................................................................................... 67

Independent Expert Panel | Confidential report ii
Murray-Darling Basin Plan SDL Limits of Change Review
Tables
Table 1: Combinations of SDL adjustment volume and benchmark type for LOC breach assessment. ....................... 6
Table 2: Ecological risk resulting from LOC breaches given ecological response types ............................................ 13
Table 3: Levels of concern given ecological risk and regional and southern Basin offsets ......................................... 13
Table 4: Assessment of material risk based on level of concern and confidence in the evidentiary relationships ...... 13
Table 5: Recommended actions associated with levels of risk of material impact on an ecological component (Birds, Fish, or Vegetation) due to a Limit of Concern breach. ............................................................................... 13
Table 6: Event Frequencies for Option A: 605 GL SDL adjustment relative to Benchmark 1 (with IRRM) for the Lower Darling at Weir 32, for each SFI. ................................................................................................................. 18
Table 7: Event Frequencies for Options B, C and D: 605, 620 and 635 GL SDL adjustments relative to Benchmark 2 (without IRRM) for the Lower Darling at Weir 32, for each SFI. ................................................................... 18
Table 8: Overall Reach Ecological Scores for Options A - D against Benchmark runs for the Lower Darling River .... 19
Table 9: Risk Analysis of a breach of the 17,000 ML/day for 18 days SFI for the Lower Darling River ...................... 20
Table 10: Event Frequencies for Option A: 605 GL SDL adjustment relative to Benchmark 1 (with IRRM) for the Upper Murray (Barmah-Millewa Forest) reach for each SFI. .................................................................................. 25
Table 11: Event Frequencies for Options B, C and D: 605, 620 and 635 GL SDL adjustments relative to Benchmark 2 (without IRRM) for the Upper Murray (Barmah-Millewa Forest) reach, for each SFI. ................................... 25
Table 12: Upper Murray reach Ecological Elements scores for Options A, B, C and D and their relevant benchmarks. ............................................................................................................................................... 27
Table 13: Risk Analysis of a breach of the 150 day 15,000 ML/day SFI for the Upper Murray River reach ................ 27
Table 14: Regional Environmental Outcome Scores for the Southern Basin for Options A, B, C and D under starting conditions of minimum, medium and maximum environmental condition. .................................................... 30
Table 15: Base flow comparison of Option A, Option B, Option C and Option D ....................................................... 34
Table 16: Minimum flow targets in the River Murray System and key tributaries ....................................................... 35
Table 17: South Australia’s Monthly water entitlements ............................................................................................ 36
Table 18: Limits of change requirements / assumptions for the Lower Lakes, Coorong and Murray Mouth ............... 49
Figures
Figure 1: Risk assessment method for assessing ecological materiality of Overbank Flow event breaches. ............. 12
Figure 2: Method for assessing ecological materiality of Base flow breaches. ........................................................... 14
Figure 3: The relationship between flow and number of wetlands inundated in the Lower Darling River.................... 17
Figure 4: LoC breaching the 17,000 ML/day for 18 days SFI for the Lower Darling River. ......................................... 17
Figure 5: Comparison of Flow Exceedance Probability Curves for Wycot on the Greater Darling River Anabranch. .. 20
Figure 6: Flow inundation curve for Barmah Millewa Forest showing area of different vegetation types inundated at different flows (from MDBA 2012b). ............................................................................................................ 24
Figure 7: Percentage of years with above 150 days flow for the Benchmark 2 run and the Option B run. .................. 26
Figure 8: Modelled benchmark and base flow requirement on the River Murray @d/s Torrumbarry .......................... 37
Figure 9: Modelled Flow for scenario SDLA_637 and base flow requirement on the River Murray @d/s Torrumbarry ................................................................................................................................................ 37
Figure 10: For assets other than the Lower Lakes, Coorong and Murray Mouth ....................................................... 48

Independent Expert Panel | Confidential report iii
Murray-Darling Basin Plan SDL Limits of Change Review
Abbreviations
ANAE Australian National Aquatic Ecosystem
BOC Basin Officials Committee
CLLMM Coorong, Lower Lakes and Murray Mouth
CSIRO Commonwealth Scientific and Industrial Research Organisation
ESLT Environmentally Sustainable Level of Take
GL Gigalitres
HIS Hydrologic Indicator Sites
IRRM Improved Regulation of the River Murray supply measure project
M&E Monitoring and Evaluation
MDBA Murray-Darling Basin Authority
ML Megalitres
NSW New South Wales
NVIS National Vegetation Information System
SDL Sustainable Diversion Limit
SDLAAC SDL Adjustment Advisory Committee
SFI Site-specific flow indicator
TWG SDL Adjustment Technical Working Group

Independent Expert Panel | Confidential report iv
Murray-Darling Basin Plan SDL Limits of Change Review
Glossary
37-pack A group of 37 supply measures tested in the default method.
Baseline
scenario
The baseline scenario represents a starting point against which the effect of
implementing the Basin Plan (in particular, the introduction of SDLs) can be
assessed. It is a best available estimate of current use of water resources of the basin
as at 2009 and reflects the water sharing arrangements that were in place in June
2009.
BDL Baseline diversion limit is the limit of take from an SDL resource unit.
Benchmark
conditions of
development
The benchmark conditions of development are the conditions of development that
are assumed in the benchmark model described in Schedule 6 of the Basin Plan (and
as described below).
Benchmark
model
The benchmark model is a modification of the BP-2800 scenario (model run 847
(MDBA, 2012b)), which informed development of the Basin Plan, with a set of
mandated refinements described in Schedule 6 (Part 2) of the Basin Plan and a
number of non-mandated changes that jurisdictions have agreed to be included.
CSIRO method The component of the default method documented in Overton et al. (2014) and
associated reports.
Default method
The method used to determine the supply contribution component of the SDL
adjustment mechanism unless another method is agreed by the MDBA and Basin
Officials Committee.
Efficiency
measure
A measure that operates to decrease the quantity of water required for one or more
consumptive uses in a set of surface water SDL resource units, compared with the
quantity required under the benchmark conditions of development.
Ecological
Class
A class of biota e.g. Fish, Birds, Vegetation, as used in the Ecological Elements
Method
Ecological
Element
A key ecological characteristic associated with a specific Ecological Component (e.g.
water bird breeding), as used in the Ecological Elements Method
Ecological
significance
weighting
A weighting used in the default method to recognise the different ecological value of
areas of the floodplain
ESLT
Environmentally Sustainable Level of Take: According to the Water Act 2007 (Cwlth),
it is the level at which water can be taken from a water resource which, if exceeded,
would compromise:
• key environmental assets of the water resource; or
• key ecosystem functions of the water resource; or
• productive base of the water resource; or
• key environmental outcomes for the water resource.
Flow
constraints
River management practices and structures that govern the volume and timing of
regulated water delivery through the river system.
Hydro cues
operation
A method of operating a river system that involves making regulated releases from
storages to coincide with rainfall/runoff events, when dams are filling and downstream
tributaries are flowing. This is a semi-translucent flows approach.
Independent Expert Panel | Confidential report v
Murray-Darling Basin Plan SDL Limits of Change Review
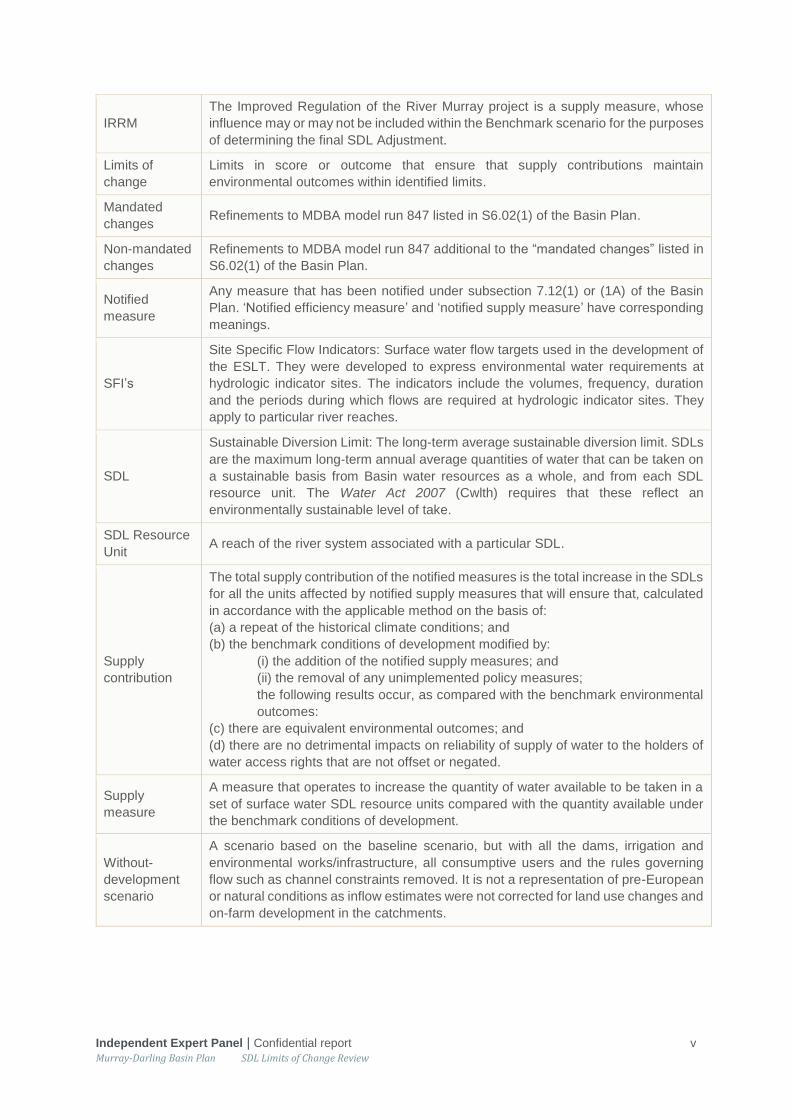
IRRM
The Improved Regulation of the River Murray project is a supply measure, whose
influence may or may not be included within the Benchmark scenario for the purposes
of determining the final SDL Adjustment.
Limits of
change
Limits in score or outcome that ensure that supply contributions maintain
environmental outcomes within identified limits.
Mandated
changes Refinements to MDBA model run 847 listed in S6.02(1) of the Basin Plan.
Non-mandated
changes
Refinements to MDBA model run 847 additional to the “mandated changes” listed in
S6.02(1) of the Basin Plan.
Notified
measure
Any measure that has been notified under subsection 7.12(1) or (1A) of the Basin
Plan. ‘Notified efficiency measure’ and ‘notified supply measure’ have corresponding
meanings.
SFI’s
Site Specific Flow Indicators: Surface water flow targets used in the development of
the ESLT. They were developed to express environmental water requirements at
hydrologic indicator sites. The indicators include the volumes, frequency, duration
and the periods during which flows are required at hydrologic indicator sites. They
apply to particular river reaches.
SDL
Sustainable Diversion Limit: The long-term average sustainable diversion limit. SDLs
are the maximum long‐term annual average quantities of water that can be taken on
a sustainable basis from Basin water resources as a whole, and from each SDL
resource unit. The Water Act 2007 (Cwlth) requires that these reflect an
environmentally sustainable level of take.
SDL Resource
Unit A reach of the river system associated with a particular SDL.
Supply
contribution
The total supply contribution of the notified measures is the total increase in the SDLs
for all the units affected by notified supply measures that will ensure that, calculated
in accordance with the applicable method on the basis of:
(a) a repeat of the historical climate conditions; and
(b) the benchmark conditions of development modified by:
(i) the addition of the notified supply measures; and
(ii) the removal of any unimplemented policy measures;
the following results occur, as compared with the benchmark environmental
outcomes:
(c) there are equivalent environmental outcomes; and
(d) there are no detrimental impacts on reliability of supply of water to the holders of
water access rights that are not offset or negated.
Supply
measure
A measure that operates to increase the quantity of water available to be taken in a
set of surface water SDL resource units compared with the quantity available under
the benchmark conditions of development.
Without-
development
scenario
A scenario based on the baseline scenario, but with all the dams, irrigation and
environmental works/infrastructure, all consumptive users and the rules governing
flow such as channel constraints removed. It is not a representation of pre-European
or natural conditions as inflow estimates were not corrected for land use changes and
on-farm development in the catchments.

Independent Expert Panel | Confidential report 1
Murray-Darling Basin Plan SDL Limits of Change Review
1. Executive summary
1.1. Background
This report details the findings of an Independent Expert Panel commissioned by the MDBA to review
the effectiveness of a package of Supply Measures projects being proposed under the Murray-Darling
Basin Plan.
Under the Basin Plan, it was agreed by Governments that as much as 650 GL of the 2,750 GL to be
recovered from consumptive use, could be “offset” by implementing works and measures that resulted
in at least the same ecological outcomes using less water, referred to as the SDL Adjustment
Mechanism. Under the mechanism, more than 53 site-specific flow indicators are linked to targeted
ecological outcomes for Birds, Fish and Vegetation communities.
Modelling results (as at 4 September 2017) have reached the stage where a volume between 605 GL
and 635 GL is considered achievable from the 37 projects proposed by jurisdictions, except for
outcomes at six locations across the Basin, where results fall outside the acceptable Limits of Change
or departure from the target values.
The Panel was asked to identify the nature and magnitude of any real world or material ecological
outcomes associated with these breaches of the Limits of Change, and to make recommendations for
mitigation or related activities where these breaches resulted in a high ecological risk.
1.2. Panel findings
The Panel finds that:
1) The 37-Pack is resulting in failure to achieve specific targets for 2 sites (river reaches) with respect
to overbank flows and 4 sites with respect to base flows.
2) None of these identified breaches of Site-Specific Flow Indicators are material or significant in terms
of their likely impact on ecological responses of Birds, Fish and Vegetation.
3) All of the breaches are sufficiently close to their targets to be either:
(a) within the limits of modelling (and assumptions made within the models) or measurement
precision, and or;
(b) within the capacity of river operators to optimise releases and flows to achieve the
“missed” targets, and / or;
(c) within the limits of our current understanding of cause and effect relationships between
hydrology and ecosystem function.
4) The definition and calculation of base flows in the model has some major limitations with respect to
their relationships with ecosystem definitions, objectives and outcomes.
5) The extent of intervention monitoring must be increased if we are to develop a better understanding
of the links between target flow indicators and ecological outcomes.

Independent Expert Panel | Confidential report 2
Murray-Darling Basin Plan SDL Limits of Change Review
1.3. Responses to key tasks in the Terms of Reference
The subsections below show the Panel’s responses to specific tasks contained in the Terms of
Reference established to guide the Panel’s work (see Appendix A).
Task #1 - Review SFI’s and associated limits of change at specific sites and for specific model
runs as advised by the MDBA.
Across four modelled options, the SFIs and associated Limits of Change were examined for all river reaches where breaches occurred (model results from 4 September 2017 output).
Results were presented primarily as differences in % frequency of SFI events over the 114 year period of record between the Option volume case and the appropriate benchmark (with standardised starting conditions), along with the relevant Ecological Elements scores and other supporting information.
In order to move beyond the coarse, binary approach to assessing the ecological equivalence as prescribed in the Basin Plan, the Panel developed a complementary, risk-based assessment framework for the assessment of each breach. The recommended level of response in each case was determined by considering a combination of:
the magnitude of the breach (as a departure of an SDL volume adjustment case from a
benchmark case, in event frequency or in shortfall volume);
the types of known ecological responses to the SFI flow event that had been breached
the level confidence in the evidentiary basis for these responses; and
the magnitude of any ecological offsets to the breach, at scales of both river reach and the
Southern basin region.
Task #2 - For these sites undertake ecological analysis to assess whether ecological
outcomes, consistent with the ecological target(s) for the site will be delivered. The analysis
shall include the use of existing or proposed works and measures (e.g. regulators) that will
influence the hydrology and associated ecology.
Examining the evidence available to it, and using a risk assessment approach to evaluating the ecological materiality of the breaches, the Panel found that the breaches were only minor, whilst noting that the results were significantly dependent on modelling assumptions, particularly regarding the method used to disaggregate monthly modelled flows into daily flows.
The risk of material ecological outcomes from these breaches was considered minimal to low, given the state of ecological knowledge, the non ‘binary’ or ‘threshold’ nature of likely ecological responses and the equivalent to large offsets at the Southern Basin regional scale to the observed changes in reach scale ecological scores (satisfying the offset requirement under Plan Section S6.0.7(a) of the Plan).
Breach magnitudes were close to or within error bounds likely for model predictions, which would not necessarily be ‘cancelled out’ by the SDL adjustment case vs the benchmark case.
The provenance and quality of the ecological knowledge underpinning the formulation of the SFIs that were breached was examined and found to be variable in quality. The level of confidence in the evidentiary base for some ecological components was low while or others, supported by work more recent than that used to formulate the SFIs, the confidence was moderate to high.

Independent Expert Panel | Confidential report 3
Murray-Darling Basin Plan SDL Limits of Change Review
Task #3 - Advise whether there are any practical measures available, including changes to
river operations that could mitigate any ecological outcomes that are less than the target.
No specific mitigatory actions are required to address the breaches identified by the modelling.
Strong recommendations are made to conduct well designed and adequately resourced
intervention monitoring at Barmah-Millewa, and surveillance monitoring for all other breach-
affected ecological components in the Barmah-Millewa and the Lower Darling River (including
the Anabranch and associated assets). The latter particularly has a weak ecological monitoring
history.
Further recommendations are made to address the poor level of documentation and
understanding of the uncertainties around the hydrological modelling, especially as it pertains
to overbank flow events and extremely low flows, and relevant issues such as disaggregation
of monthly to daily flows, error bounds around model output estimates and their various sources
of error promulgated through data collection, and via model development and parameterisation.
A similar recommendation to address key ecological knowledge gaps and uncertainties around
the understanding of ecology-hydrology relationships leads to an appeal for a well-designed
and resourced knowledge and tool improvement strategy.
The Panel notes that river managers and operators can generally out-perform models once
they know the targets and outcomes being sought. We strongly support active appropriate
operational management of the flow hydrographs to achieve such targets, provided existing
flow constraints are lifted.
The Panel also notes that a shift toward a predominance of flow targets falling close to the high
uncertainty bounds of the SFI event frequencies may reduce the resilience of the river
ecosystem to further changes in flow event frequencies or other threats.

Independent Expert Panel | Confidential report 4
Murray-Darling Basin Plan SDL Limits of Change Review
2. Introduction
The Murray-Darling Basin Plan (the Plan) details a pathway for the sustainable management of the
Basin’s water resources. The Basin Plan identifies a Sustainable Diversion Limit (SDL) across the
Murray–Darling Basin (the Basin) that signifies a reduction in consumptive water use when compared
to use at June 2009.
Under the Plan, a long-term average sustainable diversion limit (SDL) is established for the Basin, while
individual SDLs are established for each of the surface water and groundwater resources that span the
Basin. In each instance, these SDLs are to represent an environmentally sustainable level of take
(ESLT) of water for those water resources.
At the time of the Plan’s development, a computer model was used to estimate the existing Baseline
Diversion Limit (BDL) and found it to be 13,623 gigalitres (GL) per year. The SDL was estimated to be
10,873 GL per year, therefore requiring a reduction of 2,750 GL per year from the MDBA’s estimate of
the BDL for all surface water SDL resource units.
The SDL Adjustment Mechanism was also developed as a mechanism through which the Basin-wide
SDL may be varied up or down. Projects to be considered under the SDL adjustment mechanism are
either supply measures (same environmental outcomes using less water) or efficiency measures
(increase the environmental water by improving consumption efficiency of water users). Supply
measures are being actively developed by the jurisdictions in the form of ‘works and measures’ that
allow for an increase in SDL’s whilst maintaining or improving the overall ecological outcomes
compared to Benchmark conditions. For the purposes of SDL adjustments, a modified benchmark is
used. It is adjusted by the mandated changes outlined in Appendix B.
The MDBA is required to assess the implication of these supply works and measures projects and
adjust the SDLs through a formal adjustment process as required under section 23A of the Water Act
2007 (Cwlth). This assessment is conducted within the constraints imposed by Section S6.07 of the
Plan, which sets out the agreed default method for testing environmental equivalence. This default
method, also known as the ‘Ecological Elements’ method:
• Scores the predicted ecological outcomes by assessing the flood frequency, duration and length of
dry spells generated from model runs taking into account the area of inundated land, a measure of
environmental significance, water quality and in-channel health and any other relevant matters, and
• Compares the benchmark model run with a model run that represents an agreed collective suite of
eligible supply measures.
In effect, the test for environmental equivalence provides for the comparison of ecosystem responses
under the Basin Plan with any new model runs representing the suite of supply measures to be delivered
for SDL adjustment. In order to protect ecological assets from significant deviations from the agreed
event frequencies, the Basin Plan establishes allowable Limits of Change across 53 site specific flow
indicators (SFIs). Section S6.07 of the Plan defined four sets of limits, each with their own specific rules,
used under the adjustment mechanism:
• Section S6.07(a) applies to the northern and southern regions of the basin. It includes an offset
measure as part of the Limits of Change. This allows some reduction in a reach for individual
ecological elements if they are offset by increases in other elements. However, there can be no
reduction in the overall ecological score produced with the supply measure projects in place when
compared to the (modified) benchmark case. See Section S6 of this report for more information.
• Section S6.07(b) applies to reaches – described in terms of limits on the percentage change in the
frequency that an overbank flow indicator is achieved.

Independent Expert Panel | Confidential report 5
Murray-Darling Basin Plan SDL Limits of Change Review
• Section S6.07(c) applies to the Coorong, Lower Lakes, Murray Mouth (CLLMM) – described in
terms of river flow volumes, depths and water quality limits, with no flexibility around achievement
of targets;
• Section S6.07(d) applies to all base flows and fresh requirements within each reach – stating that
the magnitude of volume outcomes of within bank flows and freshes shall not change from that
achieved in the benchmark run.
It is important to note that Section S6.07(b)(iv) enables SFI reach breaches to not apply where a supply
measure or a combination of supply measures can achieve the ecological outcomes sought by the Plan.
The ecological outcomes sought by the Plan are represented by an ecological target or targets and a
flow indicator or indicators and associated benchmark results.
Blackmore et al (2017) have previously identified that:
• The magnitude of the Limits of Change were a negotiated outcome during the development of the
Plan and were not based on scientific knowledge about thresholds of ecological concern.
• The Limits of Change rules are binary in nature, with modelling results showing that the suite of
supply measures either ‘successfully achieved’ or ‘failed to achieve’ the Limit of Change targets at
each site.
Notwithstanding some of the limitations of the SDL Adjustment Mechanism, modelling as at 4
September 2017 (results supplied by MDBA to the Panel team) has indicated that the current package
of 37 Supply Measures projects put forward by jurisdictions can achieve an SDL offset of greater than
600 GL. However, at this level of offset, Limits of Change are being exceeded (i.e. termed a “breach”)
in up to 6 locations:
• With respect to overbank flows – breaches in the Lower Darling and Barmah Millewa Forest.
• With respect to base flows – breaches at Balranald, Yarrawonga Weir, Torrumbarry Weir and
Euston Weir.
In response to these modelled breaches at the above sites, the Murray-Darling Basin Authority (MDBA)
commissioned the work of this Independent Expert Panel to review the significance of the results and
in particular:
• undertake ecological analysis to assess whether ecological outcomes, consistent with the Basin
Plan ecological target(s) for the site, will be delivered without compromise to the integrity of the
SDL adjustment and its supporting methodology;
• provide advice to the Authority for the sites and specific flow indicators identified by the MDBA as
to whether the analysis indicates S6.07 (b) (iv) of the Basin Plan is applicable.
The primary task of the review was to identify the nature and magnitude of any real world or material
ecological outcomes associated with any Limit of Change breaches occurring under four separate
combinations of SDL adjustment volume and Benchmark characterisation (known as ‘Options’, see
Table 1), and make recommendations for mitigation or related activities for any cases with a high risk
of material changes in ecological outcome.
More specifically, the Panel was asked to:
Review SFI’s and associated limits of change at specific sites and for specific model runs as advised by the MDBA (Table 1).
Undertake ecological analysis for these sites and model outputs to assess whether outcomes, consistent with the ecological target(s) for the site will be delivered, including the use of existing or proposed works and measures (e.g. regulators) that will influence the hydrology and associated ecology.
Independent Expert Panel | Confidential report 6
Murray-Darling Basin Plan SDL Limits of Change Review
Advise the MDBA whether there are any practical measures available, including changes to river operations, that could mitigate any ‘material’ ecological outcomes that are less than the target.
Consider data provided by the MDBA based on a June 2017 model run, and other supporting information, to develop an analysis method.
Provide advice to the MDBA regarding additional hydrological analysis and other supporting information that could assist in making a final assessment.
Use the data provided by the MDBA based on an end of August 2017 model run as the basis of final advice to the Authority.
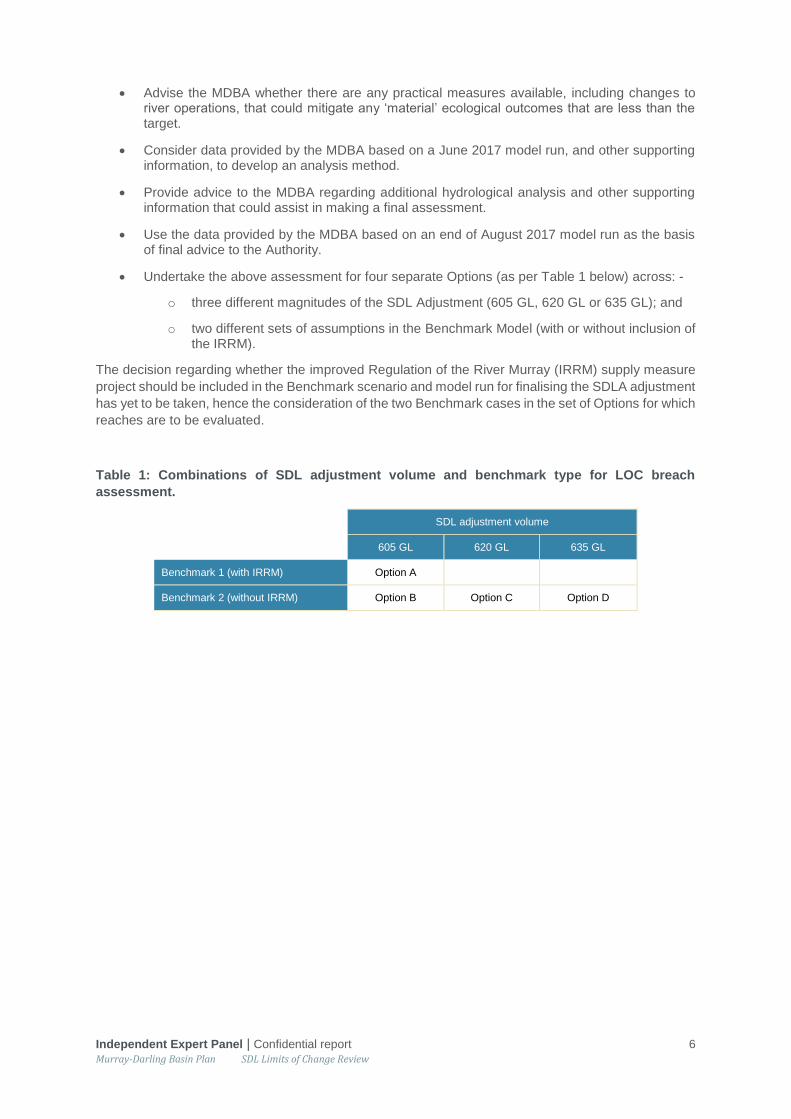
Undertake the above assessment for four separate Options (as per Table 1 below) across: -
o three different magnitudes of the SDL Adjustment (605 GL, 620 GL or 635 GL); and
o two different sets of assumptions in the Benchmark Model (with or without inclusion of the IRRM).
The decision regarding whether the improved Regulation of the River Murray (IRRM) supply measure
project should be included in the Benchmark scenario and model run for finalising the SDLA adjustment
has yet to be taken, hence the consideration of the two Benchmark cases in the set of Options for which
reaches are to be evaluated.
Table 1: Combinations of SDL adjustment volume and benchmark type for LOC breach
assessment.
SDL adjustment volume
605 GL 620 GL 635 GL
Benchmark 1 (with IRRM) Option A
Benchmark 2 (without IRRM) Option B Option C Option D

Independent Expert Panel | Confidential report 7
Murray-Darling Basin Plan SDL Limits of Change Review
3. Uncertainties and errors
A range of uncertainties affect the evaluation of the materiality of the ecological effects of breaching the
Limits of Change within the SDL Adjustment Mechanism. These uncertainties pertain to issues of
ecological knowledge; flow event characterisation; hydrological data and model performance (including
assumptions made); spatial representation; target frequency selection and breach definition.
They collectively amount to a substantial ‘error space’ in relation to making judgements about relatively
small differences in frequencies of flow events and the reality of consequent ecological effects.
3.1. Ecological responses
Ecological responses to changes in drivers such as flow and flooding are frequently not binary nor
‘crisp’. Relatively few ecological responses show a ‘threshold’ response to environmental change,
especially in the riverine environment. Responses are often gradational or semi-continuous’ as well as
heterogeneous in space and time.
The Ecological Elements (Overton et al. 2014) method can be used to quantitatively represent the
relative ecological implications of changes in flow event frequency resulting from SDL adjustment. The
scoring system is based on autecological knowledge of responses of key ecological elements and
components to changes in flow conditions, represented by a suite of preference curves and rules. When
they were developed, they represented the best current approximation of relative ecological condition
responses to watering events and event sequences.
For the most part, expert judgment has been used to formulate the relationship between ecological
responses and flow events, both in the formulation of the SFIs and in the derivation of curves used in
the ecological elements method. Therefore, they are only partly based on knowledge of robust
provenance, partly due to the low level of investment in large scale aquatic ecological observations over
the last two decades. Expert knowledge and elicitation processes are associated with considerable
uncertainty and bias (Kynn 2008, Burgman et al. 2011) and frequent under or overconfidence in
assigning strengths to driver-response relationships (Speirs‐Bridge et al. 2010).
Therefore there is considerable uncertainty in the representation of real changes in ecological condition
when using the Ecological Elements method’s scoring. In addition, there are error bounds of unknown
magnitude around individual score values. Differences between scores will not fully ‘cancel out’ scoring
errors and will compound the relative uncertainty in difference estimates.
3.2. SFIs
As a result of the above, the quantified estimates of flow events which support key ecological
components or processes, the Site-Specific Flow Indicators (SFIs), have unquantified error bounds.
The desired ecological response is likely to occur across a range about the SFI values of flow event
magnitudes, durations, timing and frequency, with this range being controlled in part by local or regional
biophysical contexts.
3.3. Hydrology and Model Performance
Hydrological knowledge is also uncertain, with uncertainties associated with flow rating curves
(particularly for higher and very low river flows) and other parameters promulgating through modelling
analyses in an often-unquantified manner. This is particularly relevant to estimation of small differences
in the frequency of annual events in the relatively short (in a statistical sense) climatic series of 114

Independent Expert Panel | Confidential report 8
Murray-Darling Basin Plan SDL Limits of Change Review
years used in SDL modelling. Comparisons of two modelled data sets, while potentially correcting for
some consistent bias, do not ‘cancel out’ the error terms and may rather compound the degree of
relative uncertainty in derived differences.
Error ranges in model estimates of flow event magnitudes are believed to be of the order of 5-10%
(MDBA advice), but are as yet unquantified for key variables used in this assessment. This is a
substantial issue when considering breaches of SFI values which are of the same order of magnitude.
There is also considerable uncertainty in the ‘reality’ and comprehensiveness represented by both the
benchmark and SDLAM cases (the latter being partially dependent on adequate representation of the
influence of works on hydrology and ecology). Comparison between model run outcomes can cancel
some of the resulting ‘real world’ bias but will still be influenced by the adequacy of the formulation of
the cases. This still deemed to be fit for purpose, using the best modelling available currently - though
uncertainty or error was not considered or fully documented in the modelling. This means a degree of
tolerance may be permissible when assessing the SDL adjustment volume scenario outcomes against
those for the benchmark in the four Options.
The river system models employed for developing the Basin Plan and SDL adjustments generally use
monthly time steps and monthly data. Their results are therefore only approximate when monthly
outputs are disaggregated into daily time steps in order to analyse limits of change in relation to a
specified period of time (e.g. in attaining a flow above say 17,000 ML/day for 18 days).
Drilling down into the actual triggering events within the modelled hydrological results reveals a lot. The
assumptions made for the disaggregation of monthly data into daily data appear to be generating some
unrealistically shaped (daily) hydrographs that are then used to determine a breach (this applies to both
the adjusted benchmark and SDL Adjustment target volume model runs). Thus, assumptions made
regarding the disaggregation methodology may impact on the assessment of Limits of Change
breaches.
3.4. Spatial representation
The significance of magnitudes and differences in ecological outcomes is influenced by the spatial
extent of the responses to flow events on the floodplain. Spatial representation of key ecological
components in the ecological elements method is poor – with inadequate mapping of ecological
distributions (for a number of key communities/species/habitats) currently available in the Southern
Basin. In addition, areal aggregation to derive regional scores uses the unweighted average of scores
across all reaches. This does not account for real-world differences between reaches and flow events
in the areal extent of habitats or species distributions. Underpinning this is the unknown spatial
representation of ecological components across reaches subtended by the Hydrological Indicator Sites
for which the SFIs have been formulated. There is considerable work underway to compile an
adequately representative characterisation of key ecological element and asset distributions across the
Basin. The outcomes of this work are not yet available.
Therefore there is a degree of uncertainty in estimating the significance of ecological responses to
changes in flow event magnitudes and frequencies across the southern connected system when using
the SFI and Ecological Elements approaches.
Choice of Target Frequency
The SFIs are defined with a target frequency range - the lower bound of which is associated with a high
uncertainty of achieving the desired ecological outcomes. These high uncertainty values have been
adopted as the Limits of Change. Hence there is considerable uncertainty about the magnitude of
ecological outcomes at these frequencies or at values near them. Identifying the materiality of

Independent Expert Panel | Confidential report 9
Murray-Darling Basin Plan SDL Limits of Change Review
differences in ecological outcome then becomes highly uncertain when comparing small changes in
frequency values around the Limits of Change.
3.5. Uncertainties in Base flow evaluation
There are additional uncertainties associated with the evaluation of material ecological changes in base
flows.
The definition of base flows used in the SDL and ESLT process (Alluvium 2010) is purely hydrological
– 60% of the 80th percentile flow. While a general perception of ecological relevance underpinned the
selection if this statistic, it has not foundation in defensible ecological knowledge, and also cannot be
universally applied across the river system so as to achieve similar ecological outcomes.
The base flow metric was developed by Alluvium (Alluvium 2010), and in that report it was stated:
“The proposed metrics and targets were not developed for system optimisation, nor have they been
developed for the purpose of developing more detailed catchment scale water planning. System
optimisation and more detailed catchment water planning should be the subject of more detailed reach
by reach and system by system environmental flow investigations.”
Nonetheless that base flow metric has been used for the SDL adjustment modelling.
Further, the use of volumes as a measure of base flow achievement or shortfall has no ecological
underpinning. There is no set of established relationships between base flow volume, river level/stage
and habitat areas that allow base flow magnitudes to be translated into ecological risks or benefits.
The use of shortfall volumes, without acknowledging exceedances or allowing base flow shortfall
offsets, is a significant limitation of the base flow assessment approach in the SDL assessment. It
introduces another source of uncertainty in interpretation.
As with overbank flows, where Limit of Change breaches are defined in binary terms (pass/fail), the
breach rule for base flows is binary, focused on no decline in base flow volume. This fails to recognise
the generally continuous nature of ecology-flow relationships when considering in-channel base flows
and sets up and leads to an assessment process that does not consider the continuous nature of the
ecological response to flow.
Finally, in many cases the Benchmark base flows are substantially higher than without development
base flows, particularly in the summer-autumn seasons. Thus, a shift in base flows toward lower flows
under breach conditions is actually a shift toward a more natural base flow pattern, with potentially
positive ecological benefits. A breach may therefore represent an ecological benefit, even while falling
below the Benchmark target.
3.6. Summary
This review is tasked with assessing the ‘real world’ materiality of ecological outcomes from breaches
of the Limits of Change resulting from SDL adjustment. There is a diverse array of sources of
uncertainty, reflecting the need to model and assess management implications of a complex hydro-
ecological system.
This is a necessary result of attempting to manage a system in the presence of imperfect information
on the system’s biophysical parameters. It does not preclude assessment of relative risks of absolute
ecological change, but does constrain the ability to robustly assess absolute changes in ecological
condition. That is especially the case when considering whether volume changes of the order of 600 -
650 GL could have a material ecological outcome when set against a total SDL of about 10,500 GL.

Independent Expert Panel | Confidential report 10
Murray-Darling Basin Plan SDL Limits of Change Review
While the Ecological Elements method contains several substantial sources of uncertainty, we
recognise that there is no systematic alternative capable of providing a robust, consistent and
standardised assessment of likely relative ecological change caused by changes in flow event
frequency. We have therefore adopted the Ecological Elements method in assessing likely ecological
outcomes, and used it to assess the degree of likely offset of any ecological effects at both reach and
Southern basin region scales.
Given all the above, we have conducted this assessment using a degree of judgement of the likely
scale of uncertainty around Limit of Change breaches. However, we also acknowledge that if large
breaches were to occur, they may be likely to cause substantial negative ecological effects. This is
especially the case since the Limits of Change are linked to the high uncertainty frequency bounds
identified for each SFI.
We have attempted to account for some of the above uncertainty in our use of a risk assessment
method for assessing Overbank Flow event breaches. We have done this by:
selecting ranges of breach magnitudes that reflect the likely errors in flow event frequency estimation;
judging the nature of an ecological response as being threshold, semicontinuous or continuous;
identifying the relative level of confidence in ecological knowledge underpinning the SFIs and Limits of Change;
using assessment bands and ratings rather than quantified values.

Independent Expert Panel | Confidential report 11
Murray-Darling Basin Plan SDL Limits of Change Review
4. Methodology
Given the known level of uncertainties in attempting to assess materiality of ecological impacts by
breaching Limits of Change (see Section 3) under SDL adjustment Options A to D, assessment
methods were developed to identify the risks of ecological impact that took those uncertainties explicitly
into account. A method was developed which addressed Overbank Flow event SFI breaches and also
for Base flow breaches. The methods were developed within the context of the following requirements
under Section S6.07 of the Basin Plan:
S6.07(a) for each region of the Basin—no reduction in the benchmark environmental outcome
scores, although some reductions in individual elements may be permitted if they are offset by
increases in other elements. (see also S6.07(b))
S6.07 (d) For all base flows and fresh requirements within each reach—no reduction in
outcomes achievement in the benchmark run.
The methods described below were applied to each reach where the set of SDL Adjustment Options
showed at least one breach of one of the SFIs relevant to that reach.
4.1. Assessment of Overbank Flow event breach cases
A risk assessment method was developed for the assessment of SDL Adjustment options which caused
Overbank Flow SFI breaches (Figure 1). This considered information on:
1. the magnitude of the breach as derived from the hydrological modelling, and the latter’s likely range of error in reporting overbank event frequency;
2. the type of ecological response which is known to be exhibited by each of the three key ecological components (Birds, Fish, Vegetation) and their respective elements – based on specialist ecological knowledge and published information;
3. the likely degree of ecological offset at reach and Southern Basin region scales – assessed using the scores derived using the Ecological Elements method (Overton et al. 2016) at reach and Southern Basin scales for each Option, as well as other relevant ecological information. In each case, Ecological Elements scores were derived for the Birds, Fish and Vegetation components, and for each of three modelling starting conditions (low, moderate and high condition);
4. the level of confidence in the quality of the knowledge used to set the SFIs and the Limits of Change, and which demonstrates the response of the ecological component to flow events for the relevant SFIs – based on examination of the evidence used in the reports of Environmental Water Requirement assessment analyses for each reach undertaken to establish the SDL (see MDBA 2012a, b), as well as other current, relevant ecological information.
Ratings were associated with ranges of each of the above information (Tables 2 to 4), and used to
identify whether a specific scenario, with its accompanying breaches, showed no or minimal, low,
moderate, high or very high risk of causing material ecological impact (Table 4).
For each level of risk of material ecological impact, a high-level recommendation for action was
developed. A general requirement for surveillance monitoring was required for cases of minimal or no
perceived risk, to support adaptive management as a matter of principal.
For low levels of risk, a recommendation was made for intervention monitoring (Table 5), that is, a
specifically designed program of investigation which formally and quantitatively evaluates the ecological
outcomes of the SDL adjustment scenario and its flow and non-flow causes.

Independent Expert Panel | Confidential report 12
Murray-Darling Basin Plan SDL Limits of Change Review
More specific partial or full mitigation recommendations were considered in case of high or very high
risk.
Dark borders = risk analysis steps, light grey = supporting information.
Figure 1: Risk assessment method for assessing ecological materiality of Overbank Flow
event breaches.
Magnitude of Limit of Change
Breach
Level of Ecological Risk
Level of Ecological Concern
Level of Risk of Material
Ecological Impact
Recommended Actions
Ecological Response type
Net Ecological Offset
Confidence in Ecological Evidence

Independent Expert Panel | Confidential report 13
Murray-Darling Basin Plan SDL Limits of Change Review
Table 2: Ecological risk resulting from LOC breaches given ecological response types
Limit of Change Breach
Ecological Response Type
From ecological knowledge & interpretation
Threshold Semi-continuous Continuous Minimal/Not relevant to breach
Minimal (1%) Low risk Minimal Minimal Minimal
Small (>1-5%) Moderate risk Low risk Minimal Minimal
Moderate (>5-10%) High risk Moderate risk Low risk Minimal
Large (>=10%) High risk High risk Moderate risk Low risk
Table 3: Levels of concern given ecological risk and regional and southern Basin offsets
Other Net ecological benefits/offsets at reach to Southern Basin regional scales
From Ecological Elements Score interpretation
Ecological risk of breach
None or Small Moderate Large
0-1% increase in reach & regional scores for any
ecological class
1-5% reach & regional score increases for other ecological
classes &/or for same class
>5% reach & regional score increases for other ecological
classes &/or for same class
Minimal Low concern Least concern Least concern
Low Moderate concern Low concern Least concern
Moderate High concern Moderate concern Low concern
High High concern High concern Moderate concern
Table 4: Assessment of material risk based on level of concern and confidence in the evidentiary
relationships
Confidence in SFI evidence & Response
Level of concern
From assessment of confidence in evidentiary basis
Low Moderate to High
Weak evidentiary basis &/or low confidence statement in EWR
Assessment
Moderate or good evidentiary basis &/or high confidence statement in EWR
Assessment
Least No or minimal risk No or minimal risk
Low No or minimal risk Low risk
Moderate Low risk Moderate risk
High : Non-threshold responses Moderate risk High risk
High : Threshold response High risk Very high risk
Table 5: Recommended actions associated with levels of risk of material impact on an ecological
component (Birds, Fish, or Vegetation) due to a Limit of Concern breach.
Level of risk Recommended Actions
No or minimal risk Surveillance monitoring
Low risk Intervention monitoring (IM)
Moderate risk Partial Mitigation or Offset; & IM
High risk Mitigation & IM
Very high risk Revise SDLAM with Mitigation & IM

Independent Expert Panel | Confidential report 14
Murray-Darling Basin Plan SDL Limits of Change Review
4.2. Assessment of Base Flow breach cases
A formal risk based approach could not be developed for the assessment of Base flow breaches
associated with the four SDL Adjustment options due to the extremely high level of uncertainty in
attributes of the definition of base flows and characterisation of base flow thresholds in the Basin Plan
(see Section 3).
A stepped assessment approach was however developed (Figure 2). This considered information on:
1. the magnitude of the base flow shortfall, derived from the hydrological modelling, for the formally identified base flow breach;
2. The magnitude of likely error ranges in hydrological modelling outputs for base flow shortfall and duration volumes;
3. the direction of seasonal changes in base flow volume durations relative to both the benchmark and the without development cases, with an emphasis on detecting whether a more ‘natural’ seasonal base flow pattern may occur when a formal breach is identified;
4. the type of ecological response to changes in base flows known to be exhibited by each of the three key ecological components (Birds, Fish, Vegetation) and their respective elements – based on specialist ecological knowledge and published information;
5. the level of confidence in the quality of the knowledge of base flow-ecological relationships.
High level recommendations were then made based on considerations of problems with base flow
articulation in the SDL adjustment process and of known ecological relationships to base flow volumes
and flow patterns and established minimum flows.
Light grey = supporting information.
Figure 2: Method for assessing ecological materiality of Base flow breaches.
Magnitude and durations of
volume shortfalls
Substantial shortfall?
Shift toward natural?
Likely Risk of Material
Ecological Impact
Recommended Actions
Hydrological modelling error
No development case
Magnitude of established
minimum flows
Hydrology-Ecology
knowledge

Independent Expert Panel | Confidential report 15
Murray-Darling Basin Plan SDL Limits of Change Review
5. Issue 1: SFI’s in the Lower Darling
5.1. Summary of key points
• Modelling shows that under all four scenarios (Options A-D) there is a breach to the limit of change
for the Weir 32 flow indicator “17,000 ML/day for 18 days with a 20%1 return frequency”.
• Small reductions in either:
o the target duration (to 16 days) or
o target flow (to 16,800 ML/day) or
o return frequency (to 19%)
would result in no breach to the permissible limit of change.
The minor practical differences between target flow and benchmark flow frequencies, together with the
uncertainty in the modelling of ecological cause and effect relationships and the projected occurrence
of adequate offsets at reach and regional scales means that, in the opinion of the Panel, this breach is
not significant under any of the four Options evaluated. No material ecological consequence of this
specific breach is envisaged. A recommendation of surveillance monitoring is also made, as well as for
a significant investment to optimise the use of infrastructure (including using hydro cues) to maximise
benefits and minimise risks.
5.2. Description of SFI
The rationales for setting the 17,000 ML/day for 18 days for the Lower Darling River Hydrologic Indicator
Site are discussed in MDBA (2012a). This SFI is comprised of three parts – a target flow (17,000
ML/day), a duration (18 days of continuous flows) and a return frequency (20% of years).
Target flow: The target flow of 17,000 ML/day at Weir 32 is based on analysis of remote sensing data
(principally Landsat imagery) of inundated wetlands adjacent to the lower Darling River, and comparing
that to river flows at Weir 32 (Green et al., 1998; Shaikh et al., 2001). Based on this analysis a
relationship between flow at Weir 32 and percentage of wetlands inundated (by number not surface
area) was developed (Figure 3 in Shaikh et al., 2001: also see Figure 3 below). A flow of 17,000 ML/day
would result in about 68% of wetlands being inundated. In addition, these flows would inundate
approximately 71% of benches in the Lower Darling River (MDBA, 2012a). Benches putatively play an
important role in delivering nutrients and carbon to the Darling River (Thoms and Sheldon, 1997) as
well as being important habitat for riparian vegetation, but are not specifically included in SDL
adjustment modelling for the Lower Darling River Hydrologic Indicator Site.
There are inconsistencies with the data analysis underpinning the setting of this SFI. For example, the
relationship between flow at Weir 32 and percentage of wetlands inundated presented in Figure 12 of
a draft copy of Green et al.(1998) (supplied to the Expert Panel by the MDBA) is substantially different
than presented in Figure 3 (b) of Shaikh et al. (2001). The latter is based on 3 additional flow events
than the Green et al. (1998) report. Similarly, MDBA (2012a at Table 3) quotes Green et al. (1998)
suggesting that flows greater than 29,000 ML/day at Weir 32 would result in 100 % of wetlands in the
Lower Darling River being inundated. Conversely Shaikh et al. (2001) suggest that less than 95% of
wetlands would be inundated at flows of about 45,000 ML/day. As Green et al. (1998) note in their draft
1 In the case of Option A the return frequency target increases to 21%

Independent Expert Panel | Confidential report 16
Murray-Darling Basin Plan SDL Limits of Change Review
report at page 64 “ [t]he lack of data points makes these relationships [between flow at Weir 32 and
percent of wetlands inundated] fairly preliminary.”
Furthermore, there was no discussion in MDBA (2012a) of why the target of 68% of wetlands inundated
was chosen, compared to some other arbitrary value. Critical to this analysis is that the metric
underlying the choice of this SFI is based on the number of wetlands inundated not the surface area of
wetlands, or the duration that these wetlands would retain water (both important in determining
Ecological Elements for the SDL adjustment process (Overton et al., 2014).
Duration: The duration of this SFI is 18 days. MDBA (2012a) states at page 13 “[t]he recommended
duration of these two flow events (7,000 and 17,000 ML/d) is based on an analysis of flow data, to align
with typical events experienced in the Darling”. By contrast, flow data from 1960-1996 showed that the
mean duration of flows equalling or exceeding 15,000 ML/day at Weir 32 was 79 days with a range
varying from 3 to 212 days (Green et al., 1998).
Frequency: MDBA (2012a) quotes a frequency range for this SFI of between 20% (high uncertainty)
and 40% (low uncertainty). The principal driver for this range is that “it is broadly consistent with the
frequency of inundation specified for vigorous growth of river red gums in Roberts and Marston (2011)”
(MDBA, 2012a at page 13). Roberts and Marston (2011) actually state “[n]atural flooding frequency for
river red gums depends on whether they are on low-lying or higher parts of the floodplain, so is usually
given as a range. Along the River Murray, its natural average return interval (ARI) ranged from one to
two years, to one to three years (Overton and Doody 2007). On the Chowilla floodplain [probably more
consistent with the Lower Darling River], River Red Gum forest was naturally inundated in 83 percent
to 49 per cent of years (Sharley and Huggan, 1995).” (Roberts and Marston, 2011 at page 42). A return
interval for inundation of 1 year in 5 to maintain River Red Gum condition is probably at the very edge
for long term survivability (e.g. see MDFRC, 2011).
5.3. Description of SFI breach and ecological scoring outcomes
MDBA modelling shows that there will be a Breach of the Limit of Change rules for the 17,000 ML/day
for 18 days SFI for the Lower Darling River Hydrologic Indicator Site for all 4 options (Tables 6 and 7).
Modelling also shows that a breach does not occur if the flow requirement is reduced from 17,000
ML/day to about 16,800 ML/day (Figure 4). Taking the data for the relationship between flow at Weir 32
and percentage of wetlands inundated (Figure 3 from Shaikh, 2011) and fitting this data to a sigmoidal
model (r2 = 0.99; Figure 32 generates an empirical relationship between flow at Weir 32 and % of
wetlands inundated:
𝑓 =𝑎
1 + 𝑒−(𝑥−𝑥0𝑏
)
where f = % of wetlands inundated at a flow of x at Weir 32 (in ML/day) and a, b and x0 are constants
(95.16, 4260 and 13183 respectively). Based on this relationship, a flow of 17,000 ML/day would
inundate 68% of Lower Darling River Wetlands, while a flow of 16,800 ML/day would inundate 67% of
wetlands. The practical difference between flows of 16 days and 18 days on floodplain wetland
inundation would, for all practicable purposes, be minimal.
2 Data was extracted from Figure 3(b) Shaikh et al., 2001 using the program Webplot digitizer; the model fit was performed using the program Sigmaplot.

Independent Expert Panel | Confidential report 17
Murray-Darling Basin Plan SDL Limits of Change Review
The data points were abstracted from Shaikh et al., 2001. The line is a best fit sigmoidal relationship (r2 = 0.99)
Figure 3: The relationship between flow and number of wetlands inundated in the Lower Darling
River.
Figure 4: LoC breaching the 17,000 ML/day for 18 days SFI for the Lower Darling River.
Flow at Weir 32 (ML/day)
0 10000 20000 30000 40000 50000
Wetl
an
ds i
nu
nd
ate
d (
%)
0
20
40
60
80
100

Independent Expert Panel | Confidential report 18
Murray-Darling Basin Plan SDL Limits of Change Review
Table 6: Event Frequencies for Option A: 605 GL SDL adjustment relative to Benchmark 1 (with IRRM) for the Lower Darling at Weir 32, for each SFI.
SFIs
Without
development
Frequency
%
Baseline
Frequency
%
Comparison with Benchmark 1 (with IRRM)
SFI event LOC: Benchmark 1 Option A - 605 GL
Magnitude and duration High
Uncertainty
Target
frequency
%
Frequency
%
Limit of
Change
%
Frequency
%
Distance
from LoC
%
Breach
Rating
%
1 17,000 ML/d, 18 days 20% 47% 18% 21% 20% 19% -1% Minimal
2 20,000 ML/d, 30 days 14% 27% 10% 11% 10% 15% 5% None
3 25,000 ML/d, 45 days 8% 14% 8% 8% 8% 9% 1% None
4 45,000 ML/d, 2 days 7% 10% 7% 7% 7% 8% 1% None
(Breaches of Limits of Concern are indicated by pink shading)
Table 7: Event Frequencies for Options B, C and D: 605, 620 and 635 GL SDL adjustments relative to Benchmark 2 (without IRRM) for the Lower
Darling at Weir 32, for each SFI.
SFIs
Without
development
Frequency
%
Baseline
Frequency
%
Comparisons with Benchmark 2 (without IRRM)
SFI event LOC: Benchmark 2 Option B - 605 GL Option C - 620 GL Option D - 635 GL
Magnitude and duration
High
Uncertainty
Target
frequency
%
Frequency
%
Limit of
Change
%
Frequency
%
Distance
from LoC
%
Breach
Rating
%
Frequency
%
Distance
from LoC
%
Breach
Rating
%
Frequency
%
Distance
from LoC
%
Breach
Rating
%
1 17,000 ML/d, 18 days 20% 47% 18% 20% 20% 19% -1% Minimal 19% -1% Minimal 19% -1% Minimal
2 20,000 ML/d, 30 days 14% 27% 10% 11% 11% 15% 4% None 15% 4% None 15% 4% None
3 25,000 ML/d, 45 days 8% 14% 8% 7% 8% 9% 1% None 9% 1% None 9% 1% None
4 45,000 ML/d, 2 days 7% 10% 7% 6% 7% 8% 1% None 8% 1% None 8% 1% None
(Breaches of Limits of Concern are indicated by pink shading)
Independent Expert Panel | Confidential report 19
Murray-Darling Basin Plan SDL Limits of Change Review
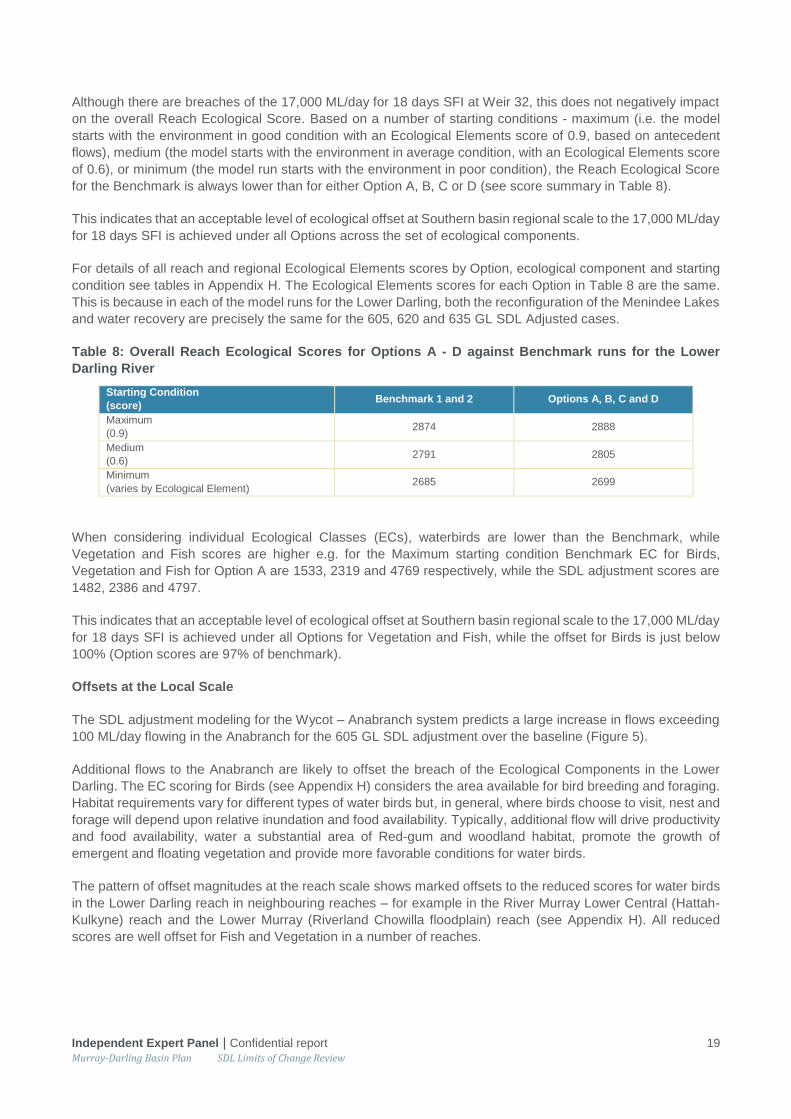
Although there are breaches of the 17,000 ML/day for 18 days SFI at Weir 32, this does not negatively impact
on the overall Reach Ecological Score. Based on a number of starting conditions - maximum (i.e. the model
starts with the environment in good condition with an Ecological Elements score of 0.9, based on antecedent
flows), medium (the model starts with the environment in average condition, with an Ecological Elements score
of 0.6), or minimum (the model run starts with the environment in poor condition), the Reach Ecological Score
for the Benchmark is always lower than for either Option A, B, C or D (see score summary in Table 8).
This indicates that an acceptable level of ecological offset at Southern basin regional scale to the 17,000 ML/day
for 18 days SFI is achieved under all Options across the set of ecological components.
For details of all reach and regional Ecological Elements scores by Option, ecological component and starting
condition see tables in Appendix H. The Ecological Elements scores for each Option in Table 8 are the same.
This is because in each of the model runs for the Lower Darling, both the reconfiguration of the Menindee Lakes
and water recovery are precisely the same for the 605, 620 and 635 GL SDL Adjusted cases.
Table 8: Overall Reach Ecological Scores for Options A - D against Benchmark runs for the Lower
Darling River
Starting Condition
(score) Benchmark 1 and 2 Options A, B, C and D
Maximum
(0.9) 2874 2888
Medium
(0.6) 2791 2805
Minimum
(varies by Ecological Element) 2685 2699
When considering individual Ecological Classes (ECs), waterbirds are lower than the Benchmark, while
Vegetation and Fish scores are higher e.g. for the Maximum starting condition Benchmark EC for Birds,
Vegetation and Fish for Option A are 1533, 2319 and 4769 respectively, while the SDL adjustment scores are
1482, 2386 and 4797.
This indicates that an acceptable level of ecological offset at Southern basin regional scale to the 17,000 ML/day
for 18 days SFI is achieved under all Options for Vegetation and Fish, while the offset for Birds is just below
100% (Option scores are 97% of benchmark).
Offsets at the Local Scale
The SDL adjustment modeling for the Wycot – Anabranch system predicts a large increase in flows exceeding
100 ML/day flowing in the Anabranch for the 605 GL SDL adjustment over the baseline (Figure 5).
Additional flows to the Anabranch are likely to offset the breach of the Ecological Components in the Lower
Darling. The EC scoring for Birds (see Appendix H) considers the area available for bird breeding and foraging.
Habitat requirements vary for different types of water birds but, in general, where birds choose to visit, nest and
forage will depend upon relative inundation and food availability. Typically, additional flow will drive productivity
and food availability, water a substantial area of Red-gum and woodland habitat, promote the growth of
emergent and floating vegetation and provide more favorable conditions for water birds.
The pattern of offset magnitudes at the reach scale shows marked offsets to the reduced scores for water birds
in the Lower Darling reach in neighbouring reaches – for example in the River Murray Lower Central (Hattah-
Kulkyne) reach and the Lower Murray (Riverland Chowilla floodplain) reach (see Appendix H). All reduced
scores are well offset for Fish and Vegetation in a number of reaches.

Independent Expert Panel | Confidential report 20
Murray-Darling Basin Plan SDL Limits of Change Review
Grey line is using the Baseline run, the orange line using the Benchmark 1 Run and the blue line is for 605 GL SDL
adjustment.
Figure 5: Comparison of Flow Exceedance Probability Curves for Wycot on the Greater Darling River
Anabranch.
5.4. Results of risk-based assessment
A risk framework was used to assess the level of ecological risk, ecological concern and the proposed actions
with respect to the breach of the limit of change (Section 3.1) for each ecological class (Birds, Fish and
Vegetation).
The results of applying this risk framework to the Limits of Change breach of the 18 day 17,000 ML/day SFI for
the Lower Darling River are presented in Table 9 for the three ecological classes.
Details of the risk analysis steps and results for each Ecological Component are shown in Appendix F, while
Ecological Elements scores are shown in Appendix H.
Table 9: Risk Analysis of a breach of the 17,000 ML/day for 18 days SFI for the Lower Darling River
Ecological
Classes
Limit of
Breach
Ecological
response type
Levels of
Ecological
Risk
Other Net
Ecological
Benefits and
Offsets
Risk of
Material
ecological
impact
Confidence in
SFI evidence
Recommended
Actions
Birds Minimal Minimal Minimal None or
Small Low concern Low
Surveillance
monitoring
Fish Minimal Semi-
continuous Minimal Moderate
Least
concern
Moderate to
high
Surveillance
monitoring
Vegetation Minimal Semi-
continuous Minimal Large
Least
concern
Moderate to
high
Surveillance
monitoring
Birds: The limit of change breach was 1% (Tables 6 and 7), which is characterised as minimal in magnitude.
One purpose of the 17,000 ML/day for 18 days SFI was to fill adjacent wetlands creating habitat (standing water)
for water birds. This type of response to environmental watering is best described as semi-continuous, and the
Ecological risk level is therefore classified as minimal (Appendix F).
Outputs of the Ecological Elements analysis indicate (Appendix H) that this breach is offset (though minimally)
at the Southern Basin Regional scale with overall Bird component score equivalency with that of the Benchmark
for all of Options A to D. Moderate offsets also occur in the scores when integrated across all three ecological
components (Birds, Fish and Vegetation) at the Regional Scale relative to the Benchmark, i.e. there is a

Independent Expert Panel | Confidential report 21
Murray-Darling Basin Plan SDL Limits of Change Review
moderate Net overall ecological offset for this breach. This results in a least level of Ecological Concern for this
breach (Appendix F).
There is a relatively poor bird-related evidentiary basis for both the setting of the SFI and bird responses to this
event (see MDBA, 2012a), and hence a low rating for evidentiary confidence. Therefore, as shown in the final
assessment table (Table 9; Appendix F), we consider there to be no or minimal risk of material impact on
vegetation due to the breach of the 17,000 ML/day for 18 days SFI and recommend only on-going surveillance
monitoring with no mitigation (see Section 3.1).
Fish: As above, the limit of change breach was 1% (Tables 6 and 7), which is defined as minimal in magnitude.
Fish responses to an 18 day 17,000 ML/day event are related to promoting lateral and longitudinal connectivity
and movement of native species into anabranches and low lying floodplain wetlands (MDBA 2012a – see also
Ellis et al., in prep.). This ecological response type is best described as semi-continuous, and the Ecological
risk level is therefore classified as minimal (Appendix F).
Outputs of the Ecological Elements analysis indicate (Appendix H) that this breach is moderately offset at the
Southern Basin Regional scale, with overall Fish component scores for any of the Options A to D being slightly
larger than that of the Benchmark. Moderate offsets also occur in the scores when integrated across all three
ecological components (Birds, Fish and Vegetation) at the Regional Scale relative to the Benchmark, i.e. there
is a moderate Net overall ecological offset for this breach.
There is a moderate evidentiary basis for both setting the SFI and Fish response to the SFI (MDBA 2012a, Ellis
et al., in prep.) The confidence level for this ecological class is therefore moderate. As a results, we consider
there to be no or minimal risk of material impact on Fish due to the breach of the 17,000 ML/day for 18 days
SFI and recommend only on-going surveillance monitoring with no mitigation recommended.
Vegetation: The limit of change breach was 1% (Tables 6 and 7), which is defined as minimal in magnitude.
Vegetation responses to the 18 day 17,000 ML/day SFI are related to providing watering and habitat (including
standing water) for vegetation, in particular riparian river red gums. These ecological responses are best
described as semi-continuous, and the Ecological risk level is therefore classified as minimal (Appendix F).
Outputs of the Ecological Elements analysis indicate (Appendix H) that this breach is substantially offset at the
Southern Basin Regional scale, with overall Vegetation component scores for any of the Options A to D being
larger than that of the Benchmark. Moderate offsets also occur in the scores when integrated across all three
ecological components (Birds, Fish and Vegetation) at the Regional Scale relative to the Benchmark, i.e. there
is a moderate Net overall ecological offset for this breach.
This results in a least level of Ecological Concern for this breach (Appendix F). There is a moderate vegetation-
related evidentiary basis for the setting of the SFI and for vegetation responses to this event (see MDBA, 2012a),
and hence a moderate rating for evidentiary confidence. Therefore, as shown in the final assessment table
(Table 9, and see Appendix F), we consider there to be no or minimal risk of material impact on vegetation due
to the breach of the 17,000 ML/day for 18 days SFI and recommend only on-going surveillance monitoring with
no additional activities recommended.

Independent Expert Panel | Confidential report 22
Murray-Darling Basin Plan SDL Limits of Change Review
5.5. Findings
This assessment has shown:
That the breach reported for the 17,000 ML/day 18-day duration SFI was small, and likely within the
error margins of hydrological modelling results;
That the SFI and its breach has low relevance to Birds, but high relevance for Fish and Vegetation
which would show a semi-continuous response to such an event;
That the breach is associated with minimal ecological risk to all three components;
That the level of concern about this breach is low for Birds and minimal for Fish and Vegetation;
That the level of risk of a material ecological change is low for Birds and minimal for Fish and Vegetation.
We do not, as a result, recommend any specific mitigation measures related to the breach in question.
We do recommend that well designed, long-term surveillance monitoring be conducted across the Lower Darling
reach (and its Umbrella Environmental Asset including the lakes and wetlands, floodplain and Anabranch)
including all three ecological components (Birds, Fish and Vegetation), along with regular assessment of
hydrology, floodplain inundation and water quality. This will facilitate adaptive management of an already
degraded system, to which this SFI flow event sequence will be minimally supplied. We deem this to be an
“allowable” management and legal response permitted under Basin Plan Section S6.07(b)(iv), as it represents
a significant part of the process that will deliver the desired ecological outcomes.
We also strongly recommend that a significant investment be made to optimise the use of infrastructure
(including using ‘hydro cues’) to maximise benefits and minimise risks. This will rely on a targeted knowledge
investment strategy.

Independent Expert Panel | Confidential report 23
Murray-Darling Basin Plan SDL Limits of Change Review
6. Issue 2: SFI’s in Barmah-Millewa
6.1. Summary of key points
• Modelling shows that under Option B there is a breach to the limit of change for the Yarrawonga flow
indicator “15,000 ML/day for 150 days with a 38% return frequency”.
• Small reductions in either:
o the target duration (to 145 days) or
o target flow (to 14,500 ML/day) or
o return frequency (to 32% of years)
would result in no breach to the permissible limit of change.
The small practical differences between target flow and benchmark flow frequencies, together with the
uncertainty in the modelling of ecological cause and effect relationships and the projected occurrence of
adequate offsets at reach and regional scales means that, in the opinion of the Panel, this breach is not
significant under any of the four Options evaluated. The likelihood of a material ecological consequence of this
specific breach is therefore minimal.
The Panel recommends that intervention monitoring should be undertaken to evaluate if this is materially the
case, as well as to improve our understanding of the relevant ecological-hydrological relationships.
6.2. Description of SFI
The rationale for setting the 15,000 ML/day for 150 days for the Murray River downstream of Yarrawonga
Hydrologic Indicator Site are discussed in MDBA (2012b). This SFI is comprised of three parts – a target flow
(15,000 ML/day), a duration (150 days), and a return frequency (30% of years).
Target Flow: all of the SFI’s for this reach are based on the overall water requirements for the Barmah-Millewa
forest with multiple flow indicators contributing to overall ecological targets. Hence a target of 15,000 ML/day
would inundate approximately 17,500 ha of floodplain in the Barmah Millewa Forest (Figure 6), as well creating
a high probability of breeding attempts by ibis, spoonbills, herons and egrets (Overton et al., 2009, reported in
MDBA, 2012b). MDBA (2012b) also note that overbank flows aimed at vegetation and waterbird responses are
“expected to be sufficient to support life-style and habitat requirements of native fish” (MDBA 2012b at page
13).
Duration: Prior to river regulation, Moira grass (Pseudoraphis spinescens) communities would have been
inundated for a period of 5-9 months and River red gum forests for a period of about 5 months (MDBA, 2012b).
For colonial nesting water birds, there is a high probability of breeding events being initiated if flows over 15,000
ML/day are maintained for longer than 50 days. For successful fledging colonial nesting water birds require an
additional 2.5 to 3.5 months of flooding (MDBA 2012b).

Independent Expert Panel | Confidential report 24
Murray-Darling Basin Plan SDL Limits of Change Review
Figure 6: Flow inundation curve for Barmah Millewa Forest showing area of different vegetation types
inundated at different flows (from MDBA 2012b).
Frequency: MDBA (2012b) noted that the flow metric with the greatest level of uncertainty is frequency of
inundation. The setting frequency of inundation targets for Barmah-Millewa forest relied on a wealth of site-
specific information, most focussed on vegetation responses. Most of the colonial nesting waterbirds are long-
lived and wide-ranging and so do not necessarily require annual breeding events (CSIRO Report).
6.3. Description of SFI breach and ecological scoring outcomes
Modelling runs show that only Option B (605 GL SDL adjustment volume without IRRM) would result in a breach
to the limit of change for the 150 day 15,000 ML/day SFI downstream of Yarrawonga; Option B could achieve
the Specific Flow Indicator in 32% of years vs the 38% achieved under Benchmark 2, and would fall above the
Limit of Change of 34% (Tables 10 and 11).
Modelling also shows that a breach would not occur if the SFI was reduced from 15,000 ML/day to about 14,500
ML/day (Figure 7) or if the duration was reduced from 150 days to 145 days.

Independent Expert Panel | Confidential report 25
Murray-Darling Basin Plan SDL Limits of Change Review
SFIs Comparisons with Benchmark 1 (without IRRM)
SFI event LOC: Without
development Baseline Benchmark 1 605 GL (Option A)
Magnitude and duration
High Uncertainty
Target frequency
(%)
Frequency (%)
Frequency (%)
Frequency (%)
Limit of Change
(%)
Frequency (%)
Distance from LoC
(%)
Breach Rating
(%)
1 12,500 ML/d, 70 days 70% 87% 50% 76% 70% 75% 5% None
2 16,000 ML/d, 98 days 40% 66% 30% 53% 48% 50% 2% None
3 25,000 ML/d, 42 days 40% 66% 30% 50% 45% 48% 3% None
4 35,000 ML/d, 30 days 33% 53% 24% 36% 33% 33% 0% None
5 50,000 ML/d, 21 days 25% 39% 18% 17% 17% 18% 1% None
6 60,000 ML/d, 14 days 20% 33% 14% 14% 14% 15% 1% None
7 15,000 ML/d, 150 days 30% 44% 11% 35% 32% 32% 0% None
Table 10: Event Frequencies for Option A: 605 GL SDL adjustment relative to Benchmark 1 (with IRRM) for the Upper Murray (Barmah-Millewa Forest)
reach for each SFI.
SFIs Comparisons with Benchmark 2 (without IRRM)
SFI event LOC: Without
development Baseline Benchmark 2 605 GL (Option B) 620 GL (Option C) 635 GL (Option D)
Magnitude and duration
High Uncertainty
Target frequency
(%)
Frequency (%)
Frequency (%)
Frequency (%)
Limit of Change
(%)
Frequency (%)
Distance from LoC
(%)
Breach Rating
(%)
Frequency (%)
Distance from LoC
(%)
Breach Rating
(%)
Frequency (%)
Distance from LoC
(%)
Breach Rating
(%)
1 12,500 ML/d, 70 days 70% 87% 50% 76% 70% 75% 5% None 75% 5% None 71% 1% None
2 16,000 ML/d, 98 days 40% 66% 30% 54% 49% 50% 1% None 52% 3% None 49% 0% None
3 25,000 ML/d, 42 days 40% 66% 30% 50% 45% 48% 3% None 49% 4% None 49% 4% None
4 35,000 ML/d, 30 days 33% 53% 24% 36% 33% 33% 0% None 33% 0% None 33% 0% None
5 50,000 ML/d, 21 days 25% 39% 18% 16% 16% 18% 2% None 17% 1% None 18% 2% None
6 60,000 ML/d, 14 days 20% 33% 14% 12% 12% 15% 3% None 12% 0% None 13% 1% None
7 15,000 ML/d, 150 days 30% 44% 11% 38% 34% 32% -2% Small 34% 0% None 34% 0% None
(Breaches of Limits of Concern are indicated by pink shading)
Table 11: Event Frequencies for Options B, C and D: 605, 620 and 635 GL SDL adjustments relative to Benchmark 2 (without IRRM) for the Upper
Murray (Barmah-Millewa Forest) reach, for each SFI.

Independent Expert Panel | Confidential report 26
Murray-Darling Basin Plan SDL Limits of Change Review
Figure 7: Percentage of years with above 150 days flow for the Benchmark 2 run and the Option B run.
A reduction in flows from 15,000 ML/day to 14,500 ML/day (see Figure 6) would result in a decrease in total
floodplain inundation area from about 17,665 ha to 15,475 ha (a reduction about 10%). Modelling also suggests
that if the SFI duration was reduced to 145 instead of 150 days, a breach would also not occur. From an
ecological sense, there is no substantive difference between a flow of 145 days duration and one of 150 days.
Furthermore, from a practical perspective, if additional flows were required to, for example, maintain a bird
breeding event, the additional water would be supplied operationally, with many of the bird breeding sites being
able to be watered when Murray River flows are at normal irrigation supply levels (K. Ward, GBCMA, pers.
comm).
The Ecological Elements Scores for the Upper Murray River Reach are presented in Table 12. For most of
these model predictions the Ecological Scores are less than the appropriate benchmark for all Options and
starting conditions, the exception being Option A under Minimum Starting Conditions. When considering
individual ecological classes, Waterbirds and Fish scores fall lower than the Benchmark while Vegetation
exceeds the Benchmark.

Independent Expert Panel | Confidential report 27
Murray-Darling Basin Plan SDL Limits of Change Review
Table 12: Upper Murray reach Ecological Elements scores for Options A, B, C and D and their relevant
benchmarks.
Starting Condition
(score)
Benchmark Score Option Reach Ecological Score
Maximum
(0.9)
1 5188 A 5168
2 5292 B 5168
2 5292 C 4982
2 5292 D 5096
Medium
(0.6)
1 5100 A 5087
2 5158 B 5087
2 5158 C 4900
2 5158 D 5010
Minimum
(varies by Ecological Element)
1 4933 A 4975
2 4989 B 4975
2 4989 C 4787
2 4989 D 4892
6.4. Results of risk-based assessment
A risk framework was used to assess the level of ecological risk, ecological concern and the proposed actions
with respect to the breach of the limit of change (Section 3.1) for each ecological class (Birds, Fish and
Vegetation, see Table 13).
The results of applying this risk framework to the Limits of Change breach of the 150 day 15,000 ML/day SFI
for the Upper Murray River reach are presented in Table 13 for the three ecological classes.
Details of the risk analysis steps and results for each Ecological Component are shown in Appendix G, while
Ecological Elements scores are shown in Appendix H.
Table 13: Risk Analysis of a breach of the 150 day 15,000 ML/day SFI for the Upper Murray River reach
Ecological
Classes
Limit of
Breach
Ecological
response
type
Levels of
Ecological
Risk
Other Net
Ecological
Benefits and
Offsets
Risk of
Material
ecological
impact
Confidence in
SFI evidence
Recommended
Actions
Birds Small Semi-
continuous Low Risk Moderate Low Concern
Moderate to
high
Intervention
monitoring
Fish Small Semi-
continuous Low Risk Moderate Low Concern
Moderate to
High
Intervention
monitoring
Vegetation Small Continuous Minimal Moderate Least Concern Moderate to
High
Surveillance
monitoring
Birds: The limit of change breach was 2% (see Tables 10 and 11), which is characterised as small in magnitude.
Bird responses to the 150 day 15,000 ML/day SFI are related to bird breeding and fledging. These responses
to environmental watering are best described as semi-continuous, and the Ecological risk level is therefore
classified as low (Appendix G).
Outputs of the Ecological Elements analysis indicate (Appendix H) that this breach is offset at the Southern
Basin Regional scale, with overall Bird component scores for any of the Options A to D being moderately larger
than that of the Benchmark. Moderate offsets also occur in the scores when integrated across all three

Independent Expert Panel | Confidential report 28
Murray-Darling Basin Plan SDL Limits of Change Review
ecological components (Birds, Fish and Vegetation) at the Regional Scale relative to the Benchmark, i.e. there
is a moderate Net overall ecological offset for this breach. This results in a least level of Ecological Concern for
this breach (Table 13, Appendix G). There is a strong bird-related evidentiary basis for both the setting of the
SFI and for bird responses to this event (see MDBA, 2012b), and hence a high rating for evidentiary confidence.
Therefore, as shown in the final assessment table (Table13, Appendix G), we consider there to be essentially
no material consequence of this breach to in the Upper Murray Reach birds and recommend Intervention
monitoring (see Section 3.1).
Fish: As above, the limit of change breach was 2% (see Tables 10 and 11), which is defined as small in
magnitude. Fish responses to the 150 day 15,000 ML/day event are related to fish use of floodplain habitat and
food resources. This ecological response type is best described as semi-continuous, and the Ecological risk
level is therefore classified as low (Appendix G).
Outputs of the Ecological Elements analysis indicate (Appendix H) that this breach is moderate to substantial
offset at the Southern Basin Regional scale, with overall Fish component scores for any of the Options A to D
being larger than that of the Benchmark. Moderate offsets also occur in the scores when integrated across all
three ecological components (Birds, Fish and Vegetation) at the Regional Scale relative to the Benchmark, i.e.
there is a moderate Net overall ecological offset for this breach. There is a moderately strong evidentiary basis
for both setting the SFI and fish response to the SFI (MDBA, 2012b; also see Ellis et al. in prep.), therefore the
confidence level for this ecological class is moderate. Therefore, as shown in the final assessment table (Table
13), we consider the risk of material consequence of this breach to in the Upper Murray Reach fish to be low,
though not necessarily minimal. We recommend a dedicated intervention monitoring program to confirm the
nature of the response of the fish community to this breach.
Vegetation: The limit of change breach was 2% (see Tables 10 and 11), which is defined as small in magnitude.
Vegetation responses to the 150 day 15,000 ML/day SFI are related to vegetation condition, especially for Moira
grass and river red gums. These ecological responses are best described as continuous, and the Ecological
risk level is therefore classified as minimal (Appendix G).
Outputs of the Ecological Elements analysis (Appendix H) indicate that this breach is substantially offset at the
Southern Basin Regional scale, with overall Vegetation component scores for any of the Options A to D being
larger than that of the Benchmark. Moderate offsets also occur in the scores when integrated across all three
ecological components (Birds, Fish and Vegetation) at the Regional Scale relative to the Benchmark, i.e. there
is a moderate Net overall ecological offset for this breach. This results in a Least Level of Ecological Concern
for this breach (Appendix G). There is a strong vegetation-related evidentiary basis for the setting of the SFI
and for vegetation responses to this event (see MDBA, 2012b and references therein), and hence a strong
rating for evidentiary confidence. Therefore, as shown in the final assessment table (Table 13, Appendix G), we
consider there to be no or minimal risk of material impact on vegetation in the Upper Murray Reach due to the
breach of the 15,000 ML/day for 150 days SFI and recommend only on-going surveillance monitoring.
6.5. Findings
This assessment has shown:
That the breach reported for the 150 day 15,000 ML/day duration SFI in the Upper Murray and
associated assets (Barmah-Millewa) was small, and likely within the error margins of hydrological
modelling results;
That the SFI and its breach has low relevance to Birds, Fish and Vegetation which would show a semi-
continuous response to such an event;
That the breach is associated with a low level of ecological risk to Birds, Fish and Vegetation;
That the level of concern about this breach is low for Birds, Fish and Vegetation;
That the level of risk of a material ecological change is low for Birds and Fish and minimal for Vegetation.

Independent Expert Panel | Confidential report 29
Murray-Darling Basin Plan SDL Limits of Change Review
We do not, as a result, recommend any specific mitigation measures related to the breach in question.
We strongly recommend that well designed, intervention monitoring be conducted across the Upper Murray
reach (and its Umbrella Environmental Asset including the lakes and wetlands, floodplain and Barmah-Millewa
forests) including birds and fish to elucidate the response of the Bird and Fish ecological elements (breeding,
etc.) to the adopted SDL adjustment Option and the resulting frequency of SFI events. We deem this to be an
“allowable” management and legal response permitted under Basin Plan Section S6.07(b)(iv), as it represents
a significant part of the process to support delivery of the desired ecological outcomes.
We also recommend long-term surveillance monitoring of the vegetation and regular assessment of hydrology,
floodplain inundation and water quality. This will facilitate adaptive management of the reach and its assets, to
which this SFI flow event sequence will be minimally supplied.

Independent Expert Panel | Confidential report 30
Murray-Darling Basin Plan SDL Limits of Change Review
7. SFI’s – Offsets at the regional scale
Section S6.07(a) of the Basin Plan states that the following applies: “for each region of the Basin – no reduction
in the benchmark environmental outcome scores, although some reductions in individual elements may be
permitted if they are offset by increases in other elements”.
Table 14 summarises the regional environmental outcome scores for the Southern Basin for Options A, B, C
and D against their relevant Benchmark. For each Option and Benchmark, three Environmental Outcomes
scores are described, one where the model run started with maximal ecological condition (i.e. the reaches were
all in good environmental condition at the beginning of the model run, set by using a score of 0.9), one which
started in a medium condition (environment was in average condition, set by using a score of 0.6) and one
which started in minimum condition (the environment was in a poor condition, set by using the set of lowest
scores relevant to each Ecological Element).
Even though there were some reductions in individual element scores (see Appendix H, and as described in
Sections 4.3 and 5.3 of this report), none of the Options produced overall environmental outcomes at the
Southern Basin regional scale that were less than their relevant benchmark. In all cases the ratio of the Output
Score to the Benchmark Score at the regional scale was greater than 1. This satisfies the requirement of Section
S6.07(a) of the Basin Plan.
Table 14: Regional Environmental Outcome Scores for the Southern Basin for Options A, B, C and D
under starting conditions of minimum, medium and maximum environmental condition.
Option Benchmark
(min) Benchmark
(med) Benchmark
(max) Option (min)
Option (med)
Option (max)
Ratio O/B (min)
Ratio O/B (med)
Ratio O/B (max)
A 4787 4928 5026 4930 5066 5169 1.030 1.028 1.029
B 4748 4890 4993 4930 5066 5169 1.038 1.036 1.035
C 4748 4890 4993 4878 5014 5119 1.027 1.025 1.025
D 4748 4890 4993 4896 5026 5131 1.031 1.028 1.028

Independent Expert Panel | Confidential report 31
Murray-Darling Basin Plan SDL Limits of Change Review
8. Issue 3: Base Flows
8.1. Summary of key points
• Base flows are critical to environmental sustainability, providing refuge via remnant pool connectivity, riffle
habitats and water quality benefits during extreme dry periods. Base flows target environmental attributes
in the lower elevation of a river channel.
• The base flow metric was developed from the report by Alluvium (2010). In that report, it was stated that:
“The proposed metrics and targets were not developed for system optimisation, nor have they been
developed for the purpose of developing more detailed catchment scale water planning. System
optimisation and more detailed catchment water planning should be the subject of more detailed
reach by reach and system by system environmental flow investigations.”
Nonetheless this base flow metric has been used for SDL adjustment purposes.
• There is little ecological rationale for the way this metric and the breach mechanism have been defined.
• Modelling of the 37-pack indicates that base flow limits are breached at 4 locations.
• However, the shortfall in average annual base volumes at these 4 sites is small relative to the benchmark
base flow volumes and most likely beyond the limits of accuracy of modelling and measurement.
• The Panel has some concerns over the basis upon which base flow volumes have been calculated
including:
o the adoption of a 1% tolerance between the option shortfall and the benchmark shortfall which
is an extremely strict tolerance;
o base flows requirements can be high and may exceed the intention for which they were
developed, which was to achieve ecological outcomes at the lower range of flow within a river
channel;
o the differences in shortfalls are generated in the model runs by a difference in flow event timing,
which is a function of water management decisions upstream. These timing differences are
quite small and are likely to have little ecological effect.
• The Panel believes that there is unlikely to be any ecological consequence of the breaches identified in the
model runs.
• The Panel strongly recommends that a complete review of the target base flow volumes be undertaken.
The review should consider ecological outcomes and the use and operation of structures which maintain
water levels (e.g. locks and weirs) and which accordingly modify the role of base flows in that locality.
8.2. Description of Base Flows
During the development of the Basin Plan, the approach adopted for consideration of base flows was that
described in “The proposed ‘environmentally sustainable level of take’ for surface water of the Murray–Darling
Basin: Method and outcomes” (November 2011).
In summary, base flows are the flows confined to the low flow part of the channel, which would typically inundate
pools and riffle areas between pools. By contrast, freshes are larger flows that inundate the sides of the banks
and any in‐channel benches. Base flows maintain aquatic habitats for fish, plants and invertebrates. They
provide drought refuge during dry periods and constantly dilute and refresh water in pools, maintaining water
quality. Also, they help to dilute nutrients during wet periods or after a flood event. Base flows are important to
fish communities by creating riffle and flowing water habitats, and by providing habitats for sheltering, feeding

Independent Expert Panel | Confidential report 32
Murray-Darling Basin Plan SDL Limits of Change Review
and spawning. They establish connectivity enabling movement of fish between pools. Large bodied fish may
not move during base flows due to inadequate water depth within riffles, and small bodied fish may move if
conditions are suitable.
MDBA developed a metric for system modelling using a standardised hydrologic approach across the entire
Basin. In 2010, MDBA contracted Alluvium (2010) to provide a set of hydrological metrics associated with key
ecosystem functions, including base flows. Alluvium reported that base flow outcomes could be measured by
comparing the 80th percentile flows (Q80) under different scenarios, and that this comparison should be made
separately for the low and high flow seasons. Furthermore, this work indicated that a desired outcome would
be for a scenario to achieve a Q80 value that was at least 60% of the without development Q80 value (i.e. 0.6Q80).
This study provided a long-term metric to measure low and high flow season base flow performance.
In 2010–11, MDBA further expanded upon this work. Base flows were included as a watering requirement in
the modelling by disaggregating the 0.6Q80 target volume into a monthly demand series spread over the 114-
year modelling period. In summary, the method develops a time series of base flow demand based on delivering
and equivalent of 60% of the 80th percentile flow from the without development modelling scenario.
The metric measures shortfalls from the demand, noting that shortfall volumes are not offset by flows in excess
of the target flow. The metric was not based on any specific ecological criteria and does not take into account
changes to the water regime in the river (e.g. weir pools). Thus, while the metric has been very useful as a guide
for the multiple iterations of the model, it does not indicate whether a difference in scores relates to a difference
in ecological outcomes.
MDBA’s Technical Working Group (Meeting 9 Sep 2015) considered the issue of the accuracy of the
calculations and agreed to allow a 1% tolerance in base flow shortfalls. This decision is crucial to understanding
the very small breach volume shortfall numbers in comparison with the much higher annual base flow
requirement. It can set an extremely low trigger for a breach. The reporting of the metric is expressed as the
average annual shortfall (GL/yr).
8.3. Description of Base Flow breaches
8.3.1. Base flow breaches
Breaches of the targeted base flows occurred at 4 locations in the Basin: Murrumbidgee at Balranald, Murray
at downstream Yarrawonga Weir, Murray River at downstream Torrumbarry and Murray at downstream Euston
Weir (Table 15).
The volumetric difference between the options and the benchmark shortfall volume (average annual difference)
are negligible relative to the base flow requirement volume. The breaches that are observed are considered to
be a function of the method adopted to define a breach rather than having a material consequence relative to
the ecological outcomes.
8.3.2. Review of the methodology to determine base flow Limits of Change
For Basin Plan development, base flow achievement was measured using a shortfall analysis. Under this
approach, the model scenario was compared to the base flow demand series and all shortfalls were aggregated
to provide a mean annual shortfall volume (GL).
An inter-jurisdictional SDL adjustment technical working group established the LoC parameters to be within
1% of the benchmark shortfall. This means that the Option shortfall needs to be within 1% of the benchmark
shortfall. Whilst their intention is clear, there are several weaknesses with the adopted methodology including
the strict rule that triggers a breach. For example, under the adopted approach, an increase in shortfall
volume from 100 GL/year to 101 GL/year would breach the base flow limit of change. This is in contrast to the
method for assessing overbank SFI performance, which includes a 10% allowance in recognition of the
Independent Expert Panel | Confidential report 33
Murray-Darling Basin Plan SDL Limits of Change Review
underlying uncertainties. There is little ecological rationale for the way the base flow metric and the breach
mechanism have been defined.
8.3.3. Base flows vs Historical minimum flow targets
The base flow metrics were not developed for system optimisation (Alluvium 2010) and their original intent was
for broad scale planning not specific catchment water planning.
An existing set of minimum flow targets developed by MDBA and State authorities for river systems under their
control is provided at Table 16. The minimum flows were established mainly to satisfy water supply needs and
maintain water level for navigation. These have been refined over time to include improved ecological outcomes
achieve water quality objectives
The minimum flow targets form part of a larger flow management strategy that is being embraced under
continuous improvement such as increasing flow variability and returning flow regimes to a more natural flow
pattern as far as possible. Consequently, they have a more solid ecological foundation than the SDL adjustment
base flow metric.
The current minimum flows are generally lower than the base flows in the SDL adjustment modelling package.
As base flows are currently defined, they are high and exceed the intention for which they were developed (to
achieve ecological outcomes at the lower range of within channel flows). These outcomes relate to maintenance
of water level, connection of habitat and diversity of habitat comprised on pools and riffles. The current minimum
flows which include flow variability contribute significantly to meeting the base flow ecological outcomes.

Independent Expert Panel | Confidential report 34
Murray-Darling Basin Plan SDL Limits of Change Review
Table 15: Base flow comparison of Option A, Option B, Option C and Option D
Site Description Base flow requirement
(GL/yr)
Compare for Option A Compare for Options B, C and D
Benchmark 1 Option A Benchmark 2 Option B Option C Option D
Murrumbidgee @ Darlington Point 645 1 1 1 1 1 1
Murrumbidgee @ Balranald 597 21 22 20 22 22 22
Goulburn @ u/s Goulburn Weir 757 0 0 0 0 0 0
Goulburn @ McCoys Bridge 746 0 0 0 0 0 0
Campaspe @ u/s Campaspe Weir 19 0 0 0 0 0 0
Campaspe @ Rochester 36 0 0 0 0 0 0
Loddon @ u/s Serpentine Weir 12 0 0 0 0 0 0
Loddon @ Appin South 12 0 0 0 0 0 0
Murray @ d/s Yarrawonga Weir 1,516 2 5 3 5 5 6
Murray River @ d/s Torrumbarry 2,065 4 26 10 26 29 32
Murray River @ Euston 3,113 9 10 9 10 11 12
Flow to SA 3395 9 7 8 7 7 7
Darling @ Burtundy 155 1 1 1 1 1 1
(Breaches of Limits of Concern are indicated by pink shading)

Independent Expert Panel | Confidential report 35
Murray-Darling Basin Plan SDL Limits of Change Review
Table 16: Minimum flow targets in the River Murray System and key tributaries
Note: during drought periods lower minimum flows may apply.
Site River Period Minimum flow/height Who has
Authority?
Colemans Mitta Mitta At all times 200 ML/day MDBA
Dart storage
60% - 70%
Average of 200 – 300 ML/day MDBA
Dart storage
70% - 80%
Average of 200 – 400 ML/day MDBA
Dartmouth
storage > 80%
Average of 200 – 500 ML/day MDBA
Heywoods Murray All times 600 ML/day MDBA
Doctors Point Murray All times 1,200 ML/day MDBA
D/S
Yarrawonga
Murray All times 1,800 ML/day MDBA
Edward offtake Edward All times 100 ML/day MDBA
Gulpa Offtake Gulpa Ck All times 80 ML/day. The minimum may be less than 80 ML/day
when the Murray is low and the regulator gates are fully
open.
MDBA
D/S Stevens
Weir
Edward All times 150 ML/day most times
(However during summer a minimum flow of about 600
ML/day is normally targeted)
MDBA
Darlot Billabong Ck 50 ML/day WaterNSW
Rice’s Weir Broken Ck No minimum GMW
McCoys Bridge Goulburn November to
June
Minimum 300 ML/day and an average monthly minimum
flow of 350 ML/day.
GMW
July to October Minimum 350 ML/day and an average monthly minimum
flow of 400 ML/day.
GMW
Rochester Campaspe No minimum GMW
Swan Hill Murray All year 0.6 m (~1,600 - 1,900 ML/day) MDBA
Kerang Loddon No minimum GMW
Balranald Murrumbidgee January 186 ML/day WaterNSW
February 180 ML/day WaterNSW
March 180 ML/day WaterNSW
April 180 ML/day WaterNSW
May 297 ML/day WaterNSW
June 429 ML/day WaterNSW
July 829 ML/day WaterNSW
August 1087 ML/day WaterNSW
September 1330 ML/day WaterNSW
October 1030 ML/day WaterNSW
November 568 ML/day WaterNSW
December 254 ML/day WaterNSW
Weir 32 Lower Darling January to March
350 ML/day
MDBA, when
MDBA can call
on water
April, November
and December 300 ML/day
NSW Watera,
MDBA
May to October
200 ML/day
NSW Watera,
MDBA
Whenever
storage above
FSL 500 ML/day
NSW Water,
MDBA
Wentworth Murray All times Contribution of at least 700 ML/day from the Murray MDBA
Mullaroo Ck
offtake
Mullaroo Ck (for
Lindsay River
Allowance)
All year About 250 ML/day MDBA
Inlet to Lake Vic Frenchmans Ck All times No minimum MDBA
Outlet from
Lake Vic
Rufus River All times No minimum. Small releases may be made to dilute
salinity.
MDBA
Flow to South
Australiab
Murray All times South Australia’s monthly entitlementc + e-water deliveries
+ trade into SA + any Additional Dilution Flows + delivery
of SA previously deferred water – trade out of SA - minus
any SA deferred water.
MDBA
a NSW Water may target 0 ML/day during severe drought.

Independent Expert Panel | Confidential report 36
Murray-Darling Basin Plan SDL Limits of Change Review
b The rate of entitlement flow to South Australia may be reduced in periods of low water availability for the River Murray
System. The reduction (below the standard 1,850 GL/year) is determined by the water accounting rules in a period of special
accounting under the Murray-Darling Basin Agreement. Within this reduced annual entitlement, South Australia may choose
the pattern of monthly entitlement volumes.
c South Australia’s monthly entitlement follows are presented in Table 17
Table 17: South Australia’s Monthly water entitlements
Month Monthly volume (GL)
June 90.0
July 108.5
August 124.0
September 135.0
October 170.5
November 180.0
December 217.0
January 217.0
February 194.0
March 186.0
April 135.0
May 93.0
8.3.4. Seasonality of base flows and flow magnitude
The base flow requirement is expressed as a function of the natural flow regime without development. With river
system development, the flow is delayed by river regulation through effects such as storage of water in large
reservoirs. Consequently, the modelled flow with development means there are shortfalls in base flows relative
to benchmark at certain times of year (see Figures 8 and 9 below).
The shortfall method only takes negative differences into account when determining a breach of the Limit of
Change. There is no credit for earlier, or subsequent, flow events of similar magnitudes that may achieve the
desired ecological outcomes.
The methodology adopted for determining the magnitude base flows results in base flows that include mid-to-
high within bank flows. For example, the base flow demand series at the South Australian border requires a
flow greater than 20,000 ML/day for more than 10% of the 114 year modelling period. A flow of 20,000 ML/day
near Lock 7 is near river full.
The largest modelled base flow breach occurred at downstream Torrumbarry Weir. The LoC breach for
Torrumbarry is used to illustrate the nature of a base flow breach (see Figures 8 and 9). The benchmark run
has small base flow shortfalls averaging 4 GL/year (Figure 8), whereas the SDL adjustment option (Figure 9)
has larger shortfalls averaging 26 GL/year. These shortfalls occur early in 2001 and 2004 as a result of a delay
in the flow event. There is unlikely to be a significant ecological consequence from such a delay in base flow.

Independent Expert Panel | Confidential report 37
Murray-Darling Basin Plan SDL Limits of Change Review
Figure 8: Modelled benchmark and base flow requirement on the River Murray @d/s Torrumbarry
Figure 9: Modelled Flow for scenario SDLA_637 and base flow requirement on the River Murray @d/s
Torrumbarry

Independent Expert Panel | Confidential report 38
Murray-Darling Basin Plan SDL Limits of Change Review
8.4. Recommendations
A review of the overall base flow methodology (including base flow definition, indicators, breach definition,
modelling assumptions made, ecological and operational relationships) is recommended, as several
shortcomings have been identified that warrant further analysis.
• standard application of a 60% of 80th percentile base flow has no ecological evidentiary basis, little
geographic environmental consistency, and occasionally moves into high within channel flows;
• Base flow shortfall differences between the Option volume target and Benchmark runs are generally small,
and fall well within the spread of modelling error (errors in rating curves, model parameters etc) which is at
least of the order of 5-10% (MDBA advice). The use of a 1% tolerance on base flow shortfall difference
(between the Benchmark and option volumes) to identify breaches is therefore an extremely strict and
unrealistic trigger. That trigger rule results in breaches where a material breach is unlikely;
• The timing of flow events results in breaches occurring that are unlikely to be material in terms of ecological
outcomes attached to base flows.
The review we recommend should include an examination of whether any water released in the modelling to
meet base flows could be de redeployed, giving operational flexibility to target other overbank/fresh events.
That may assist with resolving other SFI breaches or shifting frequencies away from near-breach values in
some reaches.

Independent Expert Panel | Confidential report 39
Murray-Darling Basin Plan SDL Limits of Change Review
9. Other issues and observations
9.1. Declaring and Addressing uncertainty
A major issue in assessing compliance of SDL adjustment outcomes with the Plan requirements is the mismatch
between the adjustment rules and associated indicators, and the reality of the level of uncertainty in the tools
used and knowledge available.
A level of uncertainty is inevitable in complex systems whose management is increasingly reliant on modelling.
While modelling is a fundamentally useful approach for supporting choices between management scenarios, or
making relative judgements about outcomes in complex interdependent systems, the accuracy and precision of
both the models themselves and the knowledge, assumptions and parameters that underpin them need to be:
evaluated in detail and transparently reported;
acknowledged in management practice, rules and policies;
supported by ongoing investment aimed at decreasing critical uncertainties and improving real world representation in model outcomes.
The Panel found a lack of enquiry and investment in documenting and clarifying the types and magnitude of
uncertainty in the Basin’s hydrological models and the ecological models that link to them. To resolve this
requires a targeted, well designed and funded support effort in information and model management, and in
adequate real-world data collection on hydrology and ecology. Such a program is lacking, which is surprising
given the prominence of the debates and investment around environmental watering in the Murray Darling
Basin.
A culture of reactionary information management is inevitable in the current poorly resourced environment, with
a strong reliance on expert opinion and models that lack rigorous testing and transparent documentation. This
is coupled with a philosophy of ‘making do’ with the current tools available while assuming that comparisons of
models may ‘factor out’ uncertainties. Regarding the occurrence or otherwise of Limit of Change breaches in
model outcomes appears to be significantly dependent on the modelling assumptions made, in particular the
method used to disaggregate monthly flow data into daily flows.
This highly undesirable state leaves management of environmental watering in the Basin open to confusion,
error and potential abuse. The Panel strongly recommends a thorough evaluation of uncertainties in
environmental water management, tied to a well-resourced R&D program based around a knowledge and tool
improvement strategy.
9.2. Flexible operations and flow management
It will be important to establish a process into the future under Plan Section S6.07(b)(iv) to deliver environmental
outcomes so that the use of breaches can be set aside. Past management practice with big river interventions
is to take an adaptive management approach and solve problems iteratively in order to achieve desired
outcomes. That same approach should be continued.
The delivery of freshes and flow events as per the hydro cues method is crucial to mobilising carbon, avoiding
large scale blackwater events and may help with reducing the incidence or severity of large scale algal blooms.
9.3. Water quality
One of the stated objectives of the SDL adjustment process is improved River Murray river water quality (Section
7.09(d)). Overton et al. (2014) did not include River Murray water quality as one of their ecological elements,

Independent Expert Panel | Confidential report 40
Murray-Darling Basin Plan SDL Limits of Change Review
hence water quality is not considered within the adjustment process. This is notwithstanding the fact that there
have been a number of serious water quality issues (in particular large scale blue-green algal blooms and
hypoxic blackwater events) in the last two decades in the Murray River. We recommend that detailed water
quality monitoring and contingency plans are developed during the implementation of the SDL adjustment
process and that formal rules be set in place to manage water quality effectively. These actions would be
supplementary to the arrangements being implemented for river management entities to “have regard” to the
water quality targets specified in the Basin Plan (S9.14) when managing water flows.
9.4. The Flow Targets
The ecological outcomes sought by the Plan need to be clearly defined and transparent – both in terms of their
ecological description (as attempted in the Basin Watering Strategy) and in the identification of watering event
targets. Achievement of the desired ecological outcomes will be in large part dependent on the SFIs and the
SFI event frequencies that are adopted under the SDL adjustment process. It should be noted that these are
likely to be, for many SFIs, set at or near the Limits of Change e.g. close to 90% of Benchmark frequencies.
This will not be the same as the set of original and independently developed early Basin Plan target frequencies.
It should be noted that this may affect the resilience of the river ecosystem, making it more vulnerable to any
further changes in event frequencies or to other threats.

Independent Expert Panel | Confidential report 41
Murray-Darling Basin Plan SDL Limits of Change Review
10. References
Alluvium (2010). Key ecosystem functions and their environmental water requirements, Report by Alluvium for
Murray-Darling Basin Authority, Canberra
Blackmore, D, Tucker, B, Arnott, C, Davies, P. (2017) Murray-Darling Basin SDL Adjustment Mechanism -
Report by the Victorian and NSW Ministers’ Independent Expert Panel
Burgman M, Carr, A, Godden, L, Gregory, R, McBride, M, Flander, L, Maguire, L. (2011) Redefining expertise
and improving ecological judgment. Conservation Letters 4:81-87.
Ellis, I, Cheshire, K, Townsend, A, Copeland, C, Danaher, K, and Webb, L. (in prep) Fish and Flows in the
Southern Murray-Darling Basin: A review of environmental water requirements for native fish in the Southern
Murray-Darling Basin. NSW Department of Primary Industries, Queanbeyan.
Green, DL, Shaikh, M, Maini, N, Cross, H and Slaven, J. (1998) Assessment of environmental flow needs for
the Lower Darling River, a report to the Murray–Darling Basin Commission by NSW Land and Water
Commission, Sydney.
Kynn, M. (2008) The ‘heuristics and biases’ bias in expert elicitation. Journal of the Royal Statistical Society:
Series A (Statistics in Society) 171:239-264.
Murray-Darling Basin Authority (2011) The proposed environmentally sustainable level of take for surface water
of the Murray-Darling Basin: Method and outcomes.
Murray-Darling Basin Authority (2012a) Assessment of environmental water requirements for the proposed
Basin Plan: Lower Darling River System Forest, MDBA publication no: 29/12, Murray-Darling Basin Authority,
Canberra.
Murray-Darling Basin Authority (2012b) Assessment of environmental water requirements for the proposed
Basin Plan: Barmah–Millewa Forest, MDBA publication no: 16/12, Murray-Darling Basin Authority, Canberra.
MDFRC (2011) Determining water regimes to protect floodplains under hyperdrought conditions. A report to the
Department of Sustainability, Environment, Water, Populations and Communities Commonwealth Environment
Research Facilities prepared by the Murray-Darling Freshwater Research Centre, Wodonga Victoria.
Overton, IC, and Doody, TM, (2007) Flooding frequency and vegetation health for environmental flows in the
River Murray in Victoria. Interim Report Stage 1. CSIRO Water for a healthy Country Technical Report. CSIRO
land and Water.
Overton, I, CA Pollino, Roberts, J, Reid, JRW, Bond, NR, McGinness, HM, Gawne, B, Stratford, DS, Merrin,
LE, Barma, D, Cuddy, SM, Nielsen, DL, Smith, T, Henderson, BL, Baldwin, DS, Chiu, GS, Doody, TM. (2014)
Development of the Murray-Darling Basin Plan SDL Adjustment Ecological Elements Method. Report prepared
for the Murray-Darling Basin Authority. CSIRO, Canberra
Roberts, J and Marston, F. (2011) Water regime for wetland and floodplain plants. A source book for the Murray–
Darling Basin. National Water Commission, Canberra.
Shaikh, M, Green, D and Cross, H. (2001) ‘A remote sensing approach to determine environmental flows for
wetlands of the Lower Darling River, New South Wales, Australia’, International Journal of Remote Sensing,
vol. 22, no. 9, pp. 1737–1751.

Independent Expert Panel | Confidential report 42
Murray-Darling Basin Plan SDL Limits of Change Review
Sharley, T, and Huggan, C. (1995) Chowilla Resource Management Plan. Final Report. Prepared for the
Murray–Darling Basin Commission’s Chowilla Working Group in consultation with the Chowilla Reference
Group Canberra, ACT.
Speirs-Bridge A, Fidler, F, McBride, M, Flander, L, Cumming, G, Burgman, M. (2010) Reducing Overconfidence
in the Interval Judgments of Experts. Risk Analysis 30:512-523.
Thoms, M. C. & Sheldon, F. (1997) River channel complexity and ecosystem processes: the Barwon-Darling
River (Australia). In Klomp, N. & I. Lunt (eds), Frontiers in Ecology: Building the Links. Elsevier Science, Oxford:
193-205.

Independent Expert Panel | Confidential report 43
Murray-Darling Basin Plan SDL Limits of Change Review
Appendix A – Panel Terms of Reference
Purpose of the Panel
1. The purpose of the proposed Expert Advisory Panel (the Panel) is to:
i) to undertake ecological analysis to assess whether ecological outcomes, consistent with the Basin Plan ecological target(s) for the site, will be delivered without compromise to the integrity of the SDL adjustment and its supporting methodology.
ii) provide advice to the Authority for the sites and specific flow indicators identified by the MDBA as to whether the analysis indicates S6.07 (b) (iv) of the Basin Plan is applicable.
Tasks and activities
2. Review SFI’s and associated limits of change at specific sites and for specific model runs as advised by the MDBA.
3. For these sites and model output undertake ecological analysis to assess whether ecological outcomes, consistent with the ecological target(s) for the site will be delivered. The analysis shall include the use of existing or proposed works and measures (e.g. regulators) that will influence the hydrology and associated ecology (refer to Basin Plan Schedule 6 - S6.07(b) for SFI related sites and S6.07 (d) for base flow related sites for detail).
4. The panel will advise the whether there are any practical measures available, including changes to river operations, that could mitigate any ecological outcomes that are less than the target.
5. Members of the Panel will consider the data provided by the MDBA based on the June model run, and other supporting information, to develop their analysis.
6. The Panel will provide advice to the MDBA regarding additional hydrological analysis and other supporting information that could assist them in making their final assessment. The MDBA will endeavour to supply this supporting information by 30 August.
7. The Panel will use the data provided by the MDBA based on the end of August 2017 model run as the basis of their advice to the Authority.
8. The advice shall be in the form of a stand-alone technical report
9. The report will be provided by COB 15 September 2017.
10. The Panel will meet on an as needs basis.
Governance and membership
11. The Panel will consist of three members.
12. The chair of the panel will be Peter Davies.
13. Where more than one Panel member is advising on a particular issue, the panel members will use best endeavours to provide a consensus view.
Conflict of interest
14. Members of the Panel must declare any conflicts of interest to the MDBA and other Panel members before providing advice.
Project manager
15. The project leader will be the MDBA General Manager of the Eco-hydrology Branch.
Duration
16. The Panel will operate from July 2017 to October 2017, but may be renewed according to the needs of the MDBA.

Independent Expert Panel | Confidential report 44
Murray-Darling Basin Plan SDL Limits of Change Review
Appendix B – SDL adjustment mechanism3
Intent of the Basin Plan
The Plan is the legislative basis for the sustainable and adaptive management of Basin water resources. It is
made under the Commonwealth’s Water Act 2007. The objectives for the Plan (s. 5.02) as a whole are:
(a) to give effect to relevant international agreements through the integrated management of Basin water resources; and
(b) to establish a sustainable and long-term adaptive management framework for the Basin water resources, that takes into account the broader management of natural resources in the Murray-Darling Basin; and
(c) to optimise social, economic and environmental outcomes arising from the use of Basin water resources in the national interest; and
(d) to improve water security for all uses of Basin water resources.
The core to achieving these objectives is the need to determine the long-term average (SDL).
Sustainable Diversion Limit (SDL)
Under the Plan, SDLs are established that set environmentally sustainable limits on the amount of surface and
groundwater that can be taken for consumptive use from Basin water resources. SDLs ensure that water use
for production and by communities does not have adverse effects on the health of Basin ecosystems.
The SDLs were determined using a ‘building block’ method that:
• identifies important ecological values and functions (assets) across the Basin
• determines the watering requirements of those assets in order for them to be maintained in a long-term,
sustainable condition
• uses a hydrologic and hydraulic model of the system to determine how much additional water, compared
with current conditions (known as the Baseline Diversion Limit, BDL) is needed to achieve the watering
requirements of those assets.
The process is broadly encompassed by:
• determining the BDL – all water pumped, diverted or intercepted for consumptive purposes at 2009 (13,623
GL per year)
• determining watering requirements for important environmental assets defined as a flow event with the
following components:
- volume (ML/d)
- duration (number of days)
- timing (seasonality)
- frequency (number of events within a time period)
- maximum period between flow events (intervals between watering events)
3 Taken from “Murray-Darling Basin SDL Adjustment Mechanism - Report by the Victorian and NSW Ministers’ Independent Expert Panel” (Blackmore et al)

Independent Expert Panel | Confidential report 45
Murray-Darling Basin Plan SDL Limits of Change Review
- extent and thresholds for groundwater dependency
- required inundation depth at the site.
• determining the SDL – the amount of water that is determined to be an environmentally sustainable limit
that can be taken for consumptive use from Basin water resources, having regard to social and economic
impacts.
Based on these known points, the SDL for the Basin surface water resources as a whole was, at the time of
writing the Plan, estimated as 10,873 GL per year (s. 6.04). As a result of setting the SDL at 10,873 GL, there
is a need to reduce the BDL from the existing 13,623 GL by 2,750 GL. These volumes are determined using
three important elements:
• benchmark conditions of development (s. 7.02)
• benchmark environmental outcomes (s. 7.15)
• benchmark model (s. S6.02)
SDL adjustment mechanism
The Plan (s. 5.06(1)) describes the objective of operation of the SDL adjustment mechanism as to ‘adjust SDLs
in a way that increases environmental outcomes while maintaining or improving social or economic outcomes’.
In effect, operation of the SDL adjustment mechanism allows for continued achievement of a healthy and
working Murray-Darling Basin by enabling surface water SDLs to be adjusted to take account of changes to
infrastructure and other measures that increase the supply of water or the efficiency of water use.
The SDL adjustment mechanism has two major components.
Implementation of efficiency measures means less water is required for use by towns, industry and irrigators
and allows for the SDL to be decreased (and target water recovery increased) provided there is neutral or
improved socio-economic outcomes.
Improved supply of water to the environment, through implementation of supply measures, provides an
opportunity to achieve environmental outcomes using less environmental water, thereby reducing the total
volume of water needed to achieve the benchmark environmental outcomes. Hence the SDL will be increased
(and target water recovery reduced) via the SDL adjustment mechanism, provided that infrastructure or
measures result in:
• equivalent environmental outcomes
• no detrimental impacts on reliability of supply for rights holders.
Where this is the case, the MDBA must propose adjustments to the SDL on the behalf of Basin states, and
assess proposals against the building block model.
The Panel is considering the supply measure component of the SDL adjustment mechanism.
The net change in the SDL from application of supply and efficiency measures must not exceed ±5%, i.e. ±544
GL.

Independent Expert Panel | Confidential report 46
Murray-Darling Basin Plan SDL Limits of Change Review
Description of method to determine the supply contribution
The supply measure component of the SDL adjustment mechanism is intended to function according to the
process set out in Schedule 6 of the Basin Plan – Default method for calculation of supply contribution4.
The method is summarised by the following steps.
• S6.02 – Benchmark model
• S6.03 – Indicator sites and regions that are to be used
• S6.04 – Things that are to be measured or assessed
• S6.05 – Ecological elements of the scoring method
• S6.06 – How the method is to be applied
• S6.07 – Limits of change in score or outcomes.
Assumptions for each step of the SDL adjustment mechanism are outlined below.
Benchmark model (Section S6.02)
The benchmark model is a means of estimating the volume of water within the Basin across time and space
and is defined as comprising the MDBA model run 847, described in MDBA (2012b), with a series of refinements
to be undertaken in consultation with Basin jurisdictions through the Basin Officials Committee. Over time, these
refinements have come to be known as “mandated changes”.
The benchmark model is fundamental to the calculation of the SDL and the calculation of any adjustments (both
up and down) to the SDL that may result from a range of changes including, but not necessarily limited to:
• the seven refinements defined in s. S6.02 (“mandated changes”)
• ongoing updates to address identified errors in model run 847
• enhancements to enable the model to assess supply measures (or packages of supply measures) to adjust
the SDL.
Indicator sites and regions that are to be used (S6.03)
The indicator sites that are to be used in the SDL adjustment mechanism method are those used in development
of the environmentally sustainable level of take (ESLT) method for which detailed assessments of environmental
water requirements were done for input into the building block method.
Each reach is to incorporate one hydrologic indicator site used in the ESLT method.
The regions to be used in the SDL adjustment mechanism are:
• the Northern Basin region
• the Southern Basin region
• the disconnected Lachlan and Wimmera Rivers, if supply contributions are proposed within these valleys.
4 The Plan does permit the MDBA and Basin Officials Committee to agree to use another method (s. 7.15(2))

Independent Expert Panel | Confidential report 47
Murray-Darling Basin Plan SDL Limits of Change Review
Things that are to be measured or assessed (S6.04)
The flow regime characteristics that are assessed include:
• frequency of flow events
• duration of dry spells (i.e.: intervals between watering events)
Scores are generated for each flow regime characteristic at the reach and region scale.
Ecological elements of the scoring method (S6.05)
The method will use science based, independently reviewed, fit for purpose:
• preference curves to describe the relationship between an environmental outcome and flow statistic
• metrics for weighting environmental significance of the flood dependent area
Metrics to be used for weighting environmental significance may include:
• water dependent ecosystems
• the relative area of water dependent ecosystems
• ecosystem functions provided by flow regimes.
Weighting for environmental significance is discussed in more detail in Basin Plan Section S6.0.5(3).
How the method is to be applied (S6.06)
The method is based on the achievement of the same overall environmental scores for each region under the
benchmark model run, and a run with a SDL adjusted for the supply contribution together with the improved
environmental outcomes associated with the supply measures being considered.
Limits of change in score or outcomes (S6.07)
• no reduction in benchmark environmental score
• for each reach, a number of tests assessing the model run (including proposed measures) against the
benchmark model run to ensure that they are within defined tolerance limits (e.g.: must not vary by more
than 10%)

Independent Expert Panel | Confidential report 48
Murray-Darling Basin Plan SDL Limits of Change Review
Appendix C – Limits of change5
For assets other than Lower Lakes, Coorong and Murray Mouth
Figure 10: For assets other than the Lower Lakes, Coorong and Murray Mouth
5 Taken from “Murray-Darling Basin SDL Adjustment Mechanism - Report by the Victorian and NSW
Ministers’ Independent Expert Panel” (Blackmore et al)

Independent Expert Panel | Confidential report 49
Murray-Darling Basin Plan SDL Limits of Change Review
For the Lower Lakes, Coorong and Murray Mouth the targets are fixed (no allowance for variance)
Table 18: Limits of change requirements / assumptions for the Lower Lakes, Coorong and Murray Mouth
Characteristic
sought
Minimum hurdles that modelled supply measures package must achieve
Lake Alexandria Coorong Murray Mouth
Salinity
< 1,500 EC 100% of the time
and
< 1,000 EC for 95% of days
South Lagoon average daily
salinity less than 100 grams per
litre for 96% of days
N/A
Barrage flows
> 2,000 GL / per year on a three
year rolling average basis with a
minimum of 650 GL in any year,
to be achieved for 95% of years
and
> 600 GL over any two year
period, to be achieved for 100%
of the time
N/A N/A
Connection to
ocean N/A N/A
Mouth open to an average
annual depth of 1 metres (-1.0
m AHD) or more for at least 90%
of years and 0.7 metres (-0.7 m
AHD) for 95% of years;
Source: Basin Plan, s. S6.07

Independent Expert Panel | Confidential report 50
Murray-Darling Basin Plan SDL Limits of Change Review
Appendix D – Basin Plan Limits of Change
The limits of change are set out in the Basin Plan (S6.07), defining the rules that are applicable for the different
categories of site-specific flow indicators; bankfull and overbank (S6.07(b)), CLLMM (S6.07(c)) and base flow
and fresh (S6.07(d)).
S6.07 Limits of changes in score or outcomes. The following limits of change in score or outcome will apply in
the method under the historic climate conditions:
(a) for each region of the Basin—no reduction in the benchmark environmental outcome scores,
although some reductions in individual elements may be permitted if they are offset by increases in
other elements;
(b) for each reach:
(i) where the benchmark model run achieves or exceeds the target frequency range for a flow
indicator, achievement of the target frequency range must be retained and the frequency result
must not vary by more than 10% of the benchmark result; and
(ii) where the benchmark model run does not achieve the target frequency range for a flow
indicator, the frequency result must not vary by more than 10% of the benchmark result, and
not fall below the baseline model result; and
(iii) where the benchmark model run provides little improvement in frequency for a flow indicator
(less than 50% progress toward the target range from the baseline model result), the frequency
result must not vary by more than 15% of the benchmark result, and not fall below the baseline
model result; and
Note: Where a flow indicator exceeds these limits of change, but other indicators at the site are
within the limits of change, modelling under the method will redistribute the use of
environmental water amongst flow indicators to balance outcomes with respect to
subparagraphs (i) to (iii). Consistent with section S6.06(3) redistribution of environmental water
will occur to the minimum extent necessary to ensure that the limits of change are met and not
to otherwise affect environmental flow outcomes in the benchmark model.
(iv) where a supply measure or combination of measures can achieve the ecological outcomes
sought by the plan as represented by an ecological target or targets, and a flow indicator or
indicators and associated benchmark model results, then subparagraphs (i) to (iii) do not apply
to that flow indicator or indicators;
(c) for the Coorong, Lower Lakes, Murray Mouth—maintenance or improvement of the following:
(i) Lake Alexandrina salinity: less than 1500EC for 100% of the time and less than 1000EC for
95% of days;
(ii) Barrage flows: greater than 2000 GL per year on a three year rolling average basis with a
minimum of 650 GL in any year, to be achieved for 95% of years;
(iii) Barrage flows: greater than 600 GL over any two year period, to be achieved for 100% of
the time;
(iv) Coorong salinity: South Lagoon average daily salinity less than 100 grams per litre for 96%
of days;

Independent Expert Panel | Confidential report 51
Murray-Darling Basin Plan SDL Limits of Change Review
(v) Mouth openness: Mouth open to an average annual depth of 1 metres (-1.0 m AHD) or more
for at least 90% of years and 0.7 metres (-0.7 m AHD) for 95% of years;
(d) for all base flows and fresh requirements within each reach—no reduction in outcomes achieved in
the benchmark run.
Note: These limits of change are for the purpose of modelling SDL adjustment and do not necessarily
represent environmental watering or management targets.

Independent Expert Panel | Confidential report 52
Murray-Darling Basin Plan SDL Limits of Change Review
Appendix E – 4 September Modelling Outcomes
Lower Darling River Results vs Limits of Change
Barmah Millewa Results vs Limits of Change

Independent Expert Panel | Confidential report 53
Murray-Darling Basin Plan SDL Limits of Change Review
Base Flow Results vs Limits of Change

Independent Expert Panel | Confidential report 54
Murray-Darling Basin Plan SDL Limits of Change Review
Appendix F – Assessment Results - Lower Darling
River reach
F1 – Assessment risk tables for Lower Darling Birds
F2 – Assessment risk tables for Lower Darling Fish
F3 – Assessment risk tables for Lower Darling Vegetation

Independent Expert Panel | Confidential report 55
Murray-Darling Basin Plan SDL Limits of Change Review
F-1: Birds - Lower Darling (Dark borders indicate assessment results)
Table F1.1: Ecological risk to Lower Darling Birds resulting from LOC breaches given a particular
ecological response type
Ecological response type
Limit of Change Breach Threshold Semi-continuous Continuous Minimal/Not relevant to breach
Minimal (1%) Low risk Minimal Minimal Minimal
Small (>1-5%) Moderate risk Low risk Minimal Minimal
Moderate (>5-10%) High risk Moderate risk Low risk Minimal
Large (>=10%) High risk High risk Moderate risk Low risk
Table F1.2: Levels of concern for Lower Darling Birds given ecological risk and regional and southern
Basin offsets
Other net ecological benefits/offsets at reach to Basin regional scales
None or Small Moderate Large
Ecological risk
of breach
0-1% increase in reach &
regional scores for any
ecological class
1-5% reach & regional score
increases for other ecological
classes &/or for same class
>5% reach & regional score
increases for other ecological
classes &/or for same class
Minimal Low concern Least concern Least concern
Low Moderate concern Low concern Least concern
Moderate High concern Moderate concern Low concern
High High concern High concern Moderate concern
Table F1.3: Assessment of material risk to Lower Darling Birds based on level of concern and
confidence in the evidentiary relationships
Confidence in SFI evidence & Response
Low Moderate to High
Level of concern
Weak evidentiary basis &/or low
confidence statement in EWR
Assessment
Moderate or good evidentiary basis &/or
high confidence statement in EWR
Assessment
Least No or minimal risk No or minimal risk
Low No or minimal risk Low risk
Moderate Low risk Moderate risk
High : Non-threshold responses Moderate risk High risk
High : Threshold response High risk Very high risk

Independent Expert Panel | Confidential report 56
Murray-Darling Basin Plan SDL Limits of Change Review
F-2: Fish - Lower Darling
Table F2.1: Ecological risk to Lower Darling Fish resulting from LOC breaches given a particular
ecological response type
Ecological Response Type
Limit of Change Breach Threshold Semi-continuous Continuous Minimal/Not relevant to breach
Minimal (1%) Low risk Minimal Minimal Minimal
Small (>1-5%) Moderate risk Low risk Minimal Minimal
Moderate (>5-10%) High risk Moderate risk Low risk Minimal
Large (>=10%) High risk High risk Moderate risk Low risk
(Dark borders indicate assessment results)
Table F2.2: Levels of concern for Lower Darling Fish given ecological risk and regional and southern
Basin offsets
Other Net ecological benefits/offsets at reach to Basin regional scales
None or Small Moderate Large
Ecological risk of breach
0-1% increase in reach &
regional scores for any
ecological class
1-5% reach & regional score
increases for other ecological
classes &/or for same class
>5% reach & regional score
increases for other ecological
classes &/or for same class
Minimal Low concern Least concern Least concern
Low Moderate concern Low concern Least concern
Moderate High concern Moderate concern Low concern
High High concern High concern Moderate concern
(Dark borders indicate assessment results)
Table F2.3: Assessment of material risk to Lower Darling Fish based on level of concern and confidence
in the evidentiary relationships
Confidence in SFI evidence & Response
Low Moderate to High
Level of concern
Weak evidentiary basis &/or low
confidence statement in EWR
Assessment
Moderate or good evidentiary basis &/or
high confidence statement in EWR
Assessment
Least No or minimal risk No or minimal risk
Low No or minimal risk Low risk
Moderate Low risk Moderate risk
High : Non-threshold responses Moderate risk High risk
High : Threshold response High risk Very high risk
(Dark borders indicate assessment results)

Independent Expert Panel | Confidential report 57
Murray-Darling Basin Plan SDL Limits of Change Review
F-3: Vegetation - Lower Darling
Table F3.1: Ecological risk to Lower Darling Vegetation resulting from LOC breaches given a particular
ecological response type
Limit of Change Breach
Ecological Response Type
Threshold Semi-continuous Continuous Minimal/Not relevant to breach
Minimal (1%) Low risk Minimal Minimal Minimal
Small (>1-5%) Moderate risk Low risk Minimal Minimal
Moderate (>5-10%) High risk Moderate risk Low risk Minimal
Large (>=10%) High risk High risk Moderate risk Low risk
(Dark borders indicate assessment results)
Table F3.2: Levels of concern for Lower Darling Vegetation given ecological risk and regional and
southern Basin offsets
Other net ecological benefits/offsets at reach to Basin regional scales
None or Small Moderate Large
Ecological risk of breach
0-1% increase in reach &
regional scores for any
ecological class
1-5% reach & regional
score increases for other
ecological classes &/or for
same class
>5% reach & regional score
increases for other
ecological classes &/or for
same class
Minimal Low concern Least concern Least concern
Low Moderate concern Low concern Least concern
Moderate High concern Moderate concern Low concern
High High concern High concern Moderate concern
(Dark borders indicate assessment results)
Table F3.3: Assessment of material risk to Lower Darling Vegetation based on level of concern and
confidence in the evidentiary relationships
Confidence in SFI evidence & Response
Low Moderate to High
Level of concern
Weak evidentiary basis &/or low
confidence statement in EWR
Assessment
Moderate or good evidentiary basis &/or
high confidence statement in EWR
Assessment
Least No or minimal risk No or minimal risk
Low No or minimal risk Low risk
Moderate Low risk Moderate risk
High : Non-threshold responses Moderate risk High risk
High : Threshold response High risk Very high risk
(Dark borders indicate assessment results)

Independent Expert Panel | Confidential report 58
Murray-Darling Basin Plan SDL Limits of Change Review
Appendix G – Assessment Results – Upper Murray
River reach (Barmah-Millewa)
G1 – Assessment risk tables for Upper Murray Birds
G2 – Assessment risk tables for Upper Murray Fish
G3 – Assessment risk tables for Upper Murray Vegetation

Independent Expert Panel | Confidential report 59
Murray-Darling Basin Plan SDL Limits of Change Review
G-1: Birds - Upper Murray (Dark borders indicate assessment results)
Table G1.1: Ecological risk to Upper Murray Birds resulting from LOC breaches given a particular
ecological response type.
Ecological Response Type
Limit of Change Breach Threshold Semi-continuous Continuous Minimal/Not relevant to breach
Minimal (1%) Low risk Minimal Minimal Minimal
Small (>1-5%) Moderate risk Low risk Minimal Minimal
Moderate (>5-10%) High risk Moderate risk Low risk Minimal
Large (>=10%) High risk High risk Moderate risk Low risk
Table G1.2: Levels of concern for Upper Murray Birds given ecological risk and regional and southern
Basin offsets
Other net ecological benefits/offsets at reach to Basin regional scales
None or Small Moderate Large
Ecological
risk of
breach
0-1% increase in reach &
regional scores for any
ecological class
1-5% reach & regional score
increases for other ecological
classes &/or for same class
>5% reach & regional score
increases for other ecological
classes &/or for same class
Minimal Low concern Least concern Least concern
Low Moderate concern Low concern Least concern
Moderate High concern Moderate concern Low concern
High High concern High concern Moderate concern
Table G1:3. Assessment of material risk to Upper Murray Birds based on level of concern and
confidence in the evidentiary relationships.
Confidence in SFI evidence & Response
Low Moderate to High
Level of concern
Weak evidentiary basis &/or low
confidence statement in EWR
Assessment
Moderate or good evidentiary basis &/or
high confidence statement in EWR
Assessment
Least No or minimal risk No or minimal risk
Low No or minimal risk Low risk
Moderate Low risk Moderate risk
High : Non-threshold responses Moderate risk High risk
High : Threshold response High risk Very high risk
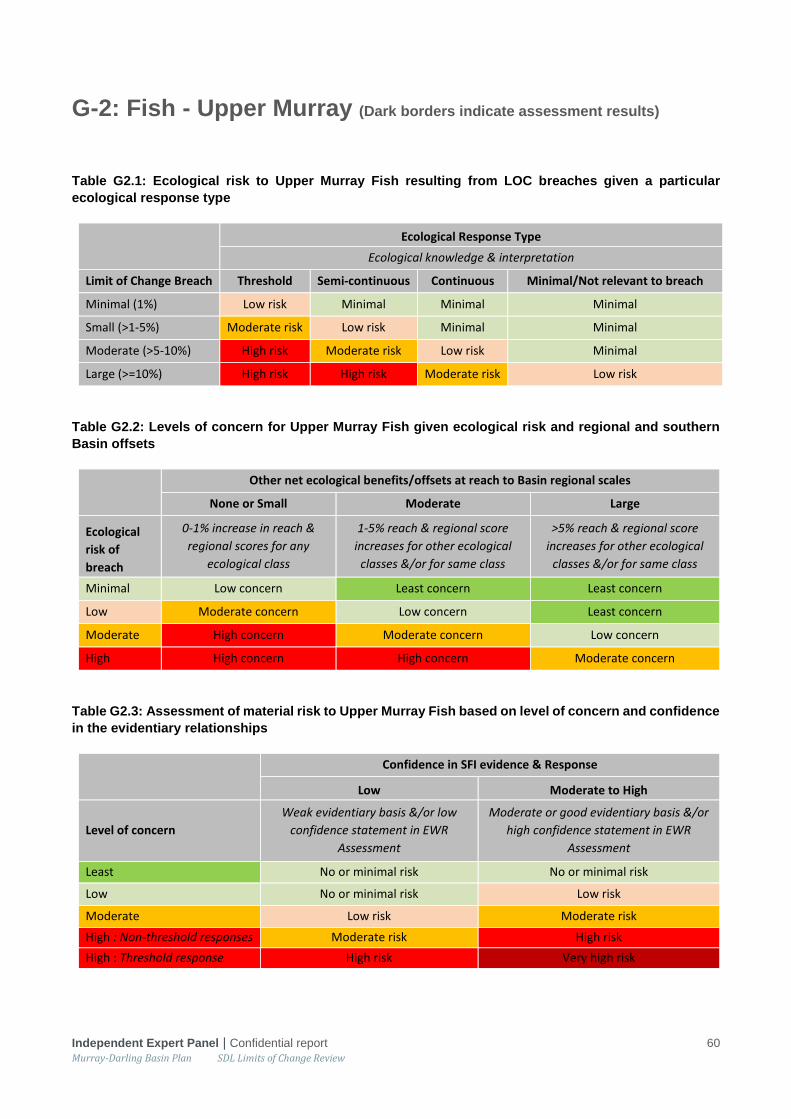
Independent Expert Panel | Confidential report 60
Murray-Darling Basin Plan SDL Limits of Change Review
G-2: Fish - Upper Murray (Dark borders indicate assessment results)
Table G2.1: Ecological risk to Upper Murray Fish resulting from LOC breaches given a particular
ecological response type
Ecological Response Type
Ecological knowledge & interpretation
Limit of Change Breach Threshold Semi-continuous Continuous Minimal/Not relevant to breach
Minimal (1%) Low risk Minimal Minimal Minimal
Small (>1-5%) Moderate risk Low risk Minimal Minimal
Moderate (>5-10%) High risk Moderate risk Low risk Minimal
Large (>=10%) High risk High risk Moderate risk Low risk
Table G2.2: Levels of concern for Upper Murray Fish given ecological risk and regional and southern
Basin offsets
Other net ecological benefits/offsets at reach to Basin regional scales
None or Small Moderate Large
Ecological
risk of
breach
0-1% increase in reach &
regional scores for any
ecological class
1-5% reach & regional score
increases for other ecological
classes &/or for same class
>5% reach & regional score
increases for other ecological
classes &/or for same class
Minimal Low concern Least concern Least concern
Low Moderate concern Low concern Least concern
Moderate High concern Moderate concern Low concern
High High concern High concern Moderate concern
Table G2.3: Assessment of material risk to Upper Murray Fish based on level of concern and confidence
in the evidentiary relationships
Confidence in SFI evidence & Response
Low Moderate to High
Level of concern
Weak evidentiary basis &/or low
confidence statement in EWR
Assessment
Moderate or good evidentiary basis &/or
high confidence statement in EWR
Assessment
Least No or minimal risk No or minimal risk
Low No or minimal risk Low risk
Moderate Low risk Moderate risk
High : Non-threshold responses Moderate risk High risk
High : Threshold response High risk Very high risk

Independent Expert Panel | Confidential report 61
Murray-Darling Basin Plan SDL Limits of Change Review
G-3: Vegetation – Upper Murray (Dark borders indicate assessment
results)
Table G3.1: Ecological risk to Upper Murray Vegetation resulting from LOC breaches given a particular
ecological response type
Ecological Response Type
Limit of Change Breach Threshold Semi-continuous Continuous Minimal/Not relevant to breach
Minimal (1%) Low risk Minimal Minimal Minimal
Small (>1-5%) Moderate risk Low risk Minimal Minimal
Moderate (>5-10%) High risk Moderate risk Low risk Minimal
Large (>=10%) High risk High risk Moderate risk Low risk
Table G3.2: Levels of concern for Upper Murray Vegetation given ecological risk and regional and
southern Basin offsets
Other Net ecological benefits/offsets at reach to Basin regional scales
None or Small Moderate Large
Ecological
risk of
breach
0-1% increase in reach &
regional scores for any
ecological class
1-5% reach & regional score
increases for other ecological
classes &/or for same class
>5% reach & regional score
increases for other ecological
classes &/or for same class
Minimal Low concern Least concern Least concern
Low Moderate concern Low concern Least concern
Moderate High concern Moderate concern Low concern
High High concern High concern Moderate concern
Table G3.3: Assessment of material risk to Upper Murray Vegetation based on level of concern and
confidence in the evidentiary relationships
Confidence in SFI evidence & Response
Low Moderate to High
Level of concern
Weak evidentiary basis &/or low
confidence statement in EWR
Assessment
Moderate or good evidentiary basis &/or
high confidence statement in EWR
Assessment
Least No or minimal risk No or minimal risk
Low No or minimal risk Low risk
Moderate Low risk Moderate risk
High : Non-threshold responses Moderate risk High risk
High : Threshold response High risk Very high risk

Independent Expert Panel | Confidential report 62
Murray-Darling Basin Plan SDL Limits of Change Review
Appendix H – Ecological Scores
Scores for the Birds, Fish and Vegetation Ecological Components are presented in the following tables for
assessment Options A, B, C and D – for each modelling run starting condition, both by reach and at Southern
Basin Regional scale.
Scores are presented as absolute values and as ratios of the SDL adjustment volume case to its relevant
benchmark case. Using these ratios, the degree of offset at the regional scale has been rated (by this Review
Panel) as Minimal (at or close to 1.0), Moderate (>1.0 to < 1.05) or large (>1.05). These rating bounds recognise
the inherently conservative nature of the scoring system.
Score values are derived using the Ecological Elements method (Overton et al. 2014) separately for Birds, Fish
and Vegetation (ecological components) and for overall condition (combined across the three components).
Modelling run starting condition = starting condition score for each ecological component, set at either the
relevant minimum value (which varies by element within component), at 0.6 (medium value) or 0.9 (maximum
value).

Independent Expert Panel | Confidential report 63
Murray-Darling Basin Plan SDL Limits of Change Review
OPTION A EC Scores Ratio
Regional Offset
Ecol Class Reach (Key Asset) Benchmark with IRRM 605 GL (605 GL Score/Benchmark
Score) size
Minimum 0.6 0.9 Minimum 0.6 0.9 Minimum 0.6 0.9
Birds River Murray Upper (Barmah-Millewa Forest) 3301 3485 3526 3066 3097 3139 0.929 0.889 0.890
River Murray Upper Central (Gunbower-Koondrook-Perricoota) 3114 3161 3226 3538 3648 3703 1.136 1.154 1.148
River Murray Lower Central (Hattah-Kulkyne) 1830 1853 1903 2327 2351 2403 1.271 1.269 1.263
River Murray Lower (Riverland Chowilla Floodplain) 2589 2611 2660 2819 2852 2916 1.089 1.093 1.096
Edward Wakool River System 3220 3401 3433 3265 3355 3386 1.014 0.986 0.986
Goulburn River (Lower Goulburn River Floodplain) 7521 7604 7604 7183 7267 7267 0.955 0.956 0.956
Lower Darling River (River, Anabranch, lakes, floodplains) 1432 1467 1533 1381 1416 1482 0.964 0.965 0.966
Mid Murrumbidgee River 2614 2723 2778 2387 2408 2475 0.913 0.884 0.891
Lower Murrumbidgee River 5233 5340 5362 4851 4874 4926 0.927 0.913 0.919
Southern Basin Regional score (mean) 3428 3516 3558 3424 3474 3522 0.999 0.988 0.990 Minimal
Fish River Murray Upper (Barmah-Millewa Forest) 6759 6831 6880 6694 6758 6798 0.990 0.989 0.988
River Murray Upper Central (Gunbower-Koondrook-Perricoota) 7071 7142 7192 7645 7714 7747 1.081 1.080 1.077
River Murray Lower Central (Hattah-Kulkyne) 5043 5122 5183 5565 5649 5710 1.103 1.103 1.102
River Murray Lower (Riverland Chowilla Floodplain) 5495 5575 5630 5868 5948 6001 1.068 1.067 1.066
Edward Wakool River System 5537 5611 5658 5666 5739 5786 1.023 1.023 1.023
Goulburn River (Lower Goulburn River Floodplain) 8613 8639 8639 8520 8546 8546 0.989 0.989 0.989
Lower Darling River (River, Anabranch, lakes, floodplains) 4637 4716 4769 4666 4744 4797 1.006 1.006 1.006
Mid Murrumbidgee River 6143 6207 6285 6036 6115 6207 0.983 0.985 0.988
Lower Murrumbidgee River 7359 7394 7432 7401 7447 7491 1.006 1.007 1.008
Southern Basin Regional score (mean) 6295 6360 6407 6451 6518 6565 1.025 1.025 1.025 Moderate
Vegetation River Murray Upper (Barmah-Millewa Forest) 4741 4986 5158 5164 5407 5567 1.089 1.085 1.079
River Murray Upper Central (Gunbower-Koondrook-Perricoota) 6040 6396 6636 7078 7531 7762 1.172 1.177 1.170
River Murray Lower Central (Hattah-Kulkyne) 2962 3186 3431 3637 3874 4130 1.228 1.216 1.204
River Murray Lower (Riverland Chowilla Floodplain) 3495 3725 3912 3841 4133 4330 1.099 1.110 1.107
Edward Wakool River System 3268 3495 3649 3500 3714 3866 1.071 1.063 1.059
Goulburn River (Lower Goulburn River Floodplain) 8098 8413 8413 7947 8301 8301 0.981 0.987 0.987
Lower Darling River (River, Anabranch, lakes, floodplains) 1985 2188 2319 2052 2255 2386 1.034 1.031 1.029
Mid Murrumbidgee River 4704 5008 5530 4634 4966 5570 0.985 0.992 1.007
Lower Murrumbidgee River 6443 6772 6952 6391 6665 6881 0.992 0.984 0.990
Southern Basin Regional score (mean) 4637 4908 5111 4916 5205 5421 1.060 1.061 1.061 Large
Combined Southern Basin Regional score 4787 4928 5026 4930 5066 5169 1.030 1.028 1.029 Moderate

Independent Expert Panel | Confidential report 64
Murray-Darling Basin Plan SDL Limits of Change Review
OPTION B EC Scores Ratio
Regional Offset
Ecol Class Reach (Key Asset) Benchmark without IRRM 605 GL (605 GL Score/Benchmark
Score) size
Minimum 0.6 0.9 Minimum 0.6 0.9 Minimum 0.6 0.9
Birds River Murray Upper (Barmah-Millewa Forest) 3511 3694 3755 3066 3097 3139 0.873 0.838 0.836
River Murray Upper Central (Gunbower-Koondrook-Perricoota) 3087 3134 3199 3538 3648 3703 1.146 1.164 1.157
River Murray Lower Central (Hattah-Kulkyne) 1846 1869 1919 2327 2351 2403 1.260 1.258 1.252
River Murray Lower (Riverland Chowilla Floodplain) 2507 2529 2579 2819 2852 2916 1.124 1.128 1.131
Edward Wakool River System 3079 3260 3291 3265 3355 3386 1.060 1.029 1.029
Goulburn River (Lower Goulburn River Floodplain) 7521 7604 7604 7183 7267 7267 0.955 0.956 0.956
Lower Darling River (River, Anabranch, lakes, floodplains) 1432 1467 1533 1381 1416 1482 0.964 0.965 0.966
Mid Murrumbidgee River 2614 2723 2778 2387 2408 2475 0.913 0.884 0.891
Lower Murrumbidgee River 5233 5340 5362 4851 4874 4926 0.927 0.913 0.919
Southern Basin Regional score (mean) 3426 3514 3558 3424 3474 3522 0.999 0.989 0.990 Minimal
Fish River Murray Upper (Barmah-Millewa Forest) 6713 6786 6846 6694 6758 6798 0.997 0.996 0.993
River Murray Upper Central (Gunbower-Koondrook-Perricoota) 6983 7054 7104 7645 7714 7747 1.095 1.094 1.091
River Murray Lower Central (Hattah-Kulkyne) 5038 5117 5177 5565 5649 5710 1.105 1.104 1.103
River Murray Lower (Riverland Chowilla Floodplain) 5475 5554 5609 5868 5948 6001 1.072 1.071 1.070
Edward Wakool River System 5427 5500 5547 5666 5739 5786 1.044 1.043 1.043
Goulburn River (Lower Goulburn River Floodplain) 8613 8639 8639 8520 8546 8546 0.989 0.989 0.989
Lower Darling River (River, Anabranch, lakes, floodplains) 4637 4716 4769 4666 4744 4797 1.006 1.006 1.006
Mid Murrumbidgee River 6143 6207 6285 6036 6115 6207 0.983 0.985 0.988
Lower Murrumbidgee River 7359 7394 7432 7401 7447 7491 1.006 1.007 1.008
Southern Basin Regional score (mean) 6265 6330 6379 6451 6518 6565 1.030 1.030 1.029 Moderate
Vegetation River Murray Upper (Barmah-Millewa Forest) 4742 4994 5274 5164 5407 5567 1.089 1.083 1.056
River Murray Upper Central (Gunbower-Koondrook-Perricoota) 5779 6149 6389 7078 7531 7762 1.225 1.225 1.215
River Murray Lower Central (Hattah-Kulkyne) 2987 3211 3456 3637 3874 4130 1.218 1.207 1.195
River Murray Lower (Riverland Chowilla Floodplain) 3451 3680 3867 3841 4133 4330 1.113 1.123 1.120
Edward Wakool River System 2801 3028 3179 3500 3714 3866 1.250 1.227 1.216
Goulburn River (Lower Goulburn River Floodplain) 8098 8413 8413 7947 8301 8301 0.981 0.987 0.987
Lower Darling River (River, Anabranch, lakes, floodplains) 1985 2188 2319 2052 2255 2386 1.034 1.031 1.029
Mid Murrumbidgee River 4704 5008 5530 4634 4966 5570 0.985 0.992 1.007
Lower Murrumbidgee River 6443 6772 6952 6391 6665 6881 0.992 0.984 0.990
Southern Basin Regional score (mean) 4554 4827 5042 4916 5205 5421 1.079 1.078 1.075 Large
Combined Southern Basin Regional score 4748 4890 4993 4930 5066 5169 1.038 1.036 1.035 Moderate

Independent Expert Panel | Confidential report 65
Murray-Darling Basin Plan SDL Limits of Change Review
OPTION C EC Scores Ratio
Regional Offset
Ecol Class Reach (Key Asset) Benchmark without IRRM 620 GL (620 GL Score/Benchmark
Score) size
Minimum 0.6 0.9 Minimum 0.6 0.9 Minimum 0.6 0.9
Birds River Murray Upper (Barmah-Millewa Forest) 3511 3694 3755 3154 3184 3230 0.898 0.862 0.860
River Murray Upper Central (Gunbower-Koondrook-Perricoota) 3087 3134 3199 3610 3721 3776 1.170 1.187 1.180
River Murray Lower Central (Hattah-Kulkyne) 1846 1869 1919 2316 2341 2392 1.255 1.252 1.247
River Murray Lower (Riverland Chowilla Floodplain) 2507 2529 2579 2735 2767 2837 1.091 1.094 1.100
Edward Wakool River System 3079 3260 3291 3260 3351 3383 1.059 1.028 1.028
Goulburn River (Lower Goulburn River Floodplain) 7521 7604 7604 7183 7267 7267 0.955 0.956 0.956
Lower Darling River (River, Anabranch, lakes, floodplains) 1432 1467 1533 1381 1416 1482 0.964 0.965 0.966
Mid Murrumbidgee River 2614 2723 2778 2387 2408 2475 0.913 0.884 0.891
Lower Murrumbidgee River 5233 5340 5362 4851 4874 4926 0.927 0.913 0.919
Southern Basin Regional score (mean) 3426 3514 3558 3431 3481 3530 1.001 0.991 0.992 Minimal
Fish River Murray Upper (Barmah-Millewa Forest) 6713 6786 6846 6545 6610 6651 0.975 0.974 0.971
River Murray Upper Central (Gunbower-Koondrook-Perricoota) 6983 7054 7104 7695 7764 7797 1.102 1.101 1.098
River Murray Lower Central (Hattah-Kulkyne) 5038 5117 5177 5536 5620 5681 1.099 1.098 1.097
River Murray Lower (Riverland Chowilla Floodplain) 5475 5554 5609 5827 5905 5958 1.064 1.063 1.062
Edward Wakool River System 5427 5500 5547 5515 5588 5638 1.016 1.016 1.016
Goulburn River (Lower Goulburn River Floodplain) 8613 8639 8639 8520 8546 8546 0.989 0.989 0.989
Lower Darling River (River, Anabranch, lakes, floodplains) 4637 4716 4769 4666 4744 4797 1.006 1.006 1.006
Mid Murrumbidgee River 6143 6207 6285 6036 6115 6207 0.983 0.985 0.988
Lower Murrumbidgee River 7359 7394 7432 7401 7447 7491 1.006 1.007 1.008
Southern Basin Regional score (mean) 6265 6330 6379 6416 6482 6530 1.024 1.024 1.024 Moderate
Vegetation River Murray Upper (Barmah-Millewa Forest) 4742 4994 5274 4663 4906 5065 0.983 0.982 0.961
River Murray Upper Central (Gunbower-Koondrook-Perricoota) 5779 6149 6389 7090 7549 7773 1.227 1.228 1.217
River Murray Lower Central (Hattah-Kulkyne) 2987 3211 3456 3624 3864 4120 1.213 1.203 1.192
River Murray Lower (Riverland Chowilla Floodplain) 3451 3680 3867 3777 4063 4257 1.095 1.104 1.101
Edward Wakool River System 2801 3028 3179 2906 3140 3319 1.038 1.037 1.044
Goulburn River (Lower Goulburn River Floodplain) 8098 8413 8413 7947 8301 8301 0.981 0.987 0.987
Lower Darling River (River, Anabranch, lakes, floodplains) 1985 2188 2319 2052 2255 2386 1.034 1.031 1.029
Mid Murrumbidgee River 4704 5008 5530 4634 4966 5570 0.985 0.992 1.007
Lower Murrumbidgee River 6443 6772 6952 6391 6665 6881 0.992 0.984 0.990
Southern Basin Regional score (mean) 4554 4827 5042 4787 5079 5297 1.051 1.052 1.051 Large
Combined Southern Basin Regional score 4748 4890 4993 4878 5014 5119 1.027 1.025 1.025 Moderate

Independent Expert Panel | Confidential report 66
Murray-Darling Basin Plan SDL Limits of Change Review
OPTION D EC Scores Ratio
Regional Offset
Ecol Class Reach (Key Asset) Benchmark without IRRM 635 GL (635 GL Score/Benchmark
Score) size
Minimum 0.6 0.9 Minimum 0.6 0.9 Minimum 0.6 0.9
Birds River Murray Upper (Barmah-Millewa Forest) 3511 3694 3755 3201 3232 3274 0.912 0.875 0.872
River Murray Upper Central (Gunbower-Koondrook-Perricoota) 3087 3134 3199 3610 3684 3720 1.170 1.175 1.163
River Murray Lower Central (Hattah-Kulkyne) 1846 1869 1919 2348 2372 2424 1.272 1.269 1.263
River Murray Lower (Riverland Chowilla Floodplain) 2507 2529 2579 2790 2816 2868 1.113 1.113 1.112
Edward Wakool River System 3079 3260 3291 3212 3297 3328 1.043 1.011 1.011
Goulburn River (Lower Goulburn River Floodplain) 7521 7604 7604 7183 7267 7267 0.955 0.956 0.956
Lower Darling River (River, Anabranch, lakes, floodplains) 1432 1467 1533 1381 1416 1482 0.964 0.965 0.966
Mid Murrumbidgee River 2614 2723 2778 2387 2408 2475 0.913 0.884 0.891
Lower Murrumbidgee River 5233 5340 5362 4851 4874 4926 0.927 0.913 0.919
Southern Basin Regional score (mean) 3426 3514 3558 3440 3485 3529 1.004 0.992 0.992 Minimal
Fish River Murray Upper (Barmah-Millewa Forest) 6713 6786 6846 6627 6692 6732 0.987 0.986 0.983
River Murray Upper Central (Gunbower-Koondrook-Perricoota) 6983 7054 7104 7606 7672 7707 1.089 1.088 1.085
River Murray Lower Central (Hattah-Kulkyne) 5038 5117 5177 5538 5622 5683 1.099 1.099 1.098
River Murray Lower (Riverland Chowilla Floodplain) 5475 5554 5609 5814 5893 5945 1.062 1.061 1.060
Edward Wakool River System 5427 5500 5547 5564 5637 5684 1.025 1.025 1.025
Goulburn River (Lower Goulburn River Floodplain) 8613 8639 8639 8520 8546 8546 0.989 0.989 0.989
Lower Darling River (River, Anabranch, lakes, floodplains) 4637 4716 4769 4666 4744 4797 1.006 1.006 1.006
Mid Murrumbidgee River 6143 6207 6285 6036 6115 6207 0.983 0.985 0.988
Lower Murrumbidgee River 7359 7394 7432 7401 7447 7491 1.006 1.007 1.008
Southern Basin Regional score (mean) 6265 6330 6379 6419 6485 6532 1.025 1.025 1.024 Moderate
Vegetation River Murray Upper (Barmah-Millewa Forest) 4742 4994 5274 4847 5106 5282 1.022 1.022 1.002
River Murray Upper Central (Gunbower-Koondrook-Perricoota) 5779 6149 6389 7039 7396 7665 1.218 1.203 1.200
River Murray Lower Central (Hattah-Kulkyne) 2987 3211 3456 3634 3871 4135 1.217 1.205 1.196
River Murray Lower (Riverland Chowilla Floodplain) 3451 3680 3867 3799 4072 4273 1.101 1.106 1.105
Edward Wakool River System 2801 3028 3179 3104 3324 3478 1.108 1.098 1.094
Goulburn River (Lower Goulburn River Floodplain) 8098 8413 8413 7947 8301 8301 0.981 0.987 0.987
Lower Darling River (River, Anabranch, lakes, floodplains) 1985 2188 2319 2052 2255 2386 1.034 1.031 1.029
Mid Murrumbidgee River 4704 5008 5530 4634 4966 5570 0.985 0.992 1.007
Lower Murrumbidgee River 6443 6772 6952 6391 6665 6881 0.992 0.984 0.990
Southern Basin Regional score (mean) 4554 4827 5042 4827 5106 5330 1.060 1.058 1.057 Large
Combined Southern Basin Regional score 4748 4890 4993 4896 5026 5131 1.031 1.028 1.028 Moderate

Document history
Revision:
Revision no. 092017-6
Author/s Brett Tucker & Peter Davies
Checked Panel members
Approved Peter Davies (Chair)
Distribution:
Issue date 15/09/2017
Issued to Panel members