Embed Size (px)
Citation preview
of March 29, 2018.This information is current as
Murine MHC Class II LocusDependent Chromatin Architecture of the−
Reprogramming the CCCTC Binding Factor B Cell Differentiation Is Associated with
and Jeremy M. BossParimal Majumder, Christopher D. Scharer, Nancy M. Choi
http://www.jimmunol.org/content/192/8/3925doi: 10.4049/jimmunol.1303205March 2014;
2014; 192:3925-3935; Prepublished online 14J Immunol
MaterialSupplementary
5.DCSupplementalhttp://www.jimmunol.org/content/suppl/2014/03/14/jimmunol.130320
Referenceshttp://www.jimmunol.org/content/192/8/3925.full#ref-list-1
, 15 of which you can access for free at: cites 51 articlesThis article
average*
4 weeks from acceptance to publicationFast Publication! •
Every submission reviewed by practicing scientistsNo Triage! •
from submission to initial decisionRapid Reviews! 30 days* •
Submit online. ?The JIWhy
Subscriptionhttp://jimmunol.org/subscription
is online at: The Journal of ImmunologyInformation about subscribing to
Permissionshttp://www.aai.org/About/Publications/JI/copyright.htmlSubmit copyright permission requests at:
Email Alertshttp://jimmunol.org/alertsReceive free email-alerts when new articles cite this article. Sign up at:
Print ISSN: 0022-1767 Online ISSN: 1550-6606. Immunologists, Inc. All rights reserved.Copyright © 2014 by The American Association of1451 Rockville Pike, Suite 650, Rockville, MD 20852The American Association of Immunologists, Inc.,
is published twice each month byThe Journal of Immunology
by guest on March 29, 2018
http://ww
w.jim
munol.org/
Dow
nloaded from
by guest on March 29, 2018
http://ww
w.jim
munol.org/
Dow
nloaded from
The Journal of Immunology
B Cell Differentiation Is Associated with Reprogramming theCCCTC Binding Factor–Dependent Chromatin Architectureof the Murine MHC Class II Locus
Parimal Majumder, Christopher D. Scharer, Nancy M. Choi,1 and Jeremy M. Boss
The transcriptional insulator CCCTC binding factor (CTCF) was shown previously to be critical for humanMHC class II (MHC-II)
gene expression. Whether the mechanisms used by CTCF in humans were similar to that of the mouse and whether the three-
dimensional chromatin architecture created was specific to B cells were not defined. Genome-wide CTCF occupancy was defined
for murine B cells and LPS-derived plasmablasts by chromatin immunoprecipitation sequencing. Fifteen CTCF sites within the
murine MHC-II locus were associated with high CTCF binding in B cells. Only one-third of these sites displayed significant CTCF
occupancy in plasmablasts. CTCF was required for maximal MHC-II gene expression in mouse B cells. In B cells, a subset of the
CTCF regions interacted with each other, creating a three-dimensional architecture for the locus. Additional interactions occurred
between MHC-II promoters and the CTCF sites. In contrast, a novel configuration occurred in plasma cells, which do not express
MHC-II genes. Ectopic CIITA expression in plasma cells to induce MHC-II expression resulted in high levels of MHC-II proteins,
but did not alter the plasma cell architecture completely. These data suggest that reorganizing the three-dimensional chromatin
architecture is an epigenetic mechanism that accompanies the silencing of MHC-II genes as part of the cell fate commitment of
plasma cells. The Journal of Immunology, 2014, 192: 3925–3935.
The murine MHC class II (MHC-II) region spans ∼250 kbon chromosome 17 (1, 2). In many murine haplotypes, theI-A and I-E a/b heterodimeric MHC-II products are
expressed on the surfaces of APCs and function to present anti-genic peptides to CD4 T lymphocytes for initiation and/or regu-lation of adaptive immune responses. However, due to a promoterregion and first exon deletion, some haplotypes, such as the H-2b
haplotype of the C57BL/6 mouse, do not express the I-E a-chaingene IEa (3), resulting in the expression of one functional MHC-IImolecule. In addition to the classical MHC-II genes, other genesassociated with Ag processing, such as those encoding H2-DMand H2-O, as well as some genes that function in MHC-I Agpresentation (Tap1 and Tap2), are located in this locus (4).Expression of MHC-II genes is cell-type specific and regulated
at the level of transcription (reviewed in Refs. 5–8). Within a fewhundred bases from the transcriptional start sites of each of the
MHC-II gene are conserved regions (W, X1, X2, and Y boxes) thatare essential for MHC-II transcription (9, 10). A group of tran-scriptional factors, regulatory factor X (RFX) (11), CREB (12),and NFY (13), bind constitutively and cooperatively to the X andY boxes (14), respectively. Alone, these DNA-binding factors arenot sufficient to activate MHC-II gene expression. The transcrip-tional coactivator termed the MHC CIITA is also required (15).CIITA expression itself is tightly regulated and the limiting factorgoverning whether these genes can be expressed or not. Whenexpressed, CIITA is recruited to the RFX–CREB–NFY complexand mediates further interactions between chromatin remodelingcomplexes and various components of the general transcriptionmachinery (7, 16–19).The mammalian insulator factor CCCTC-binding factor (CTCF)
is involved in the formation of higher-order chromatin structures ineukaryotes (20). When bound to DNA, CTCF functions to blockthe activity of enhancer elements from acting downstream and caninsulate genes from heterochromatic silencing mechanisms (21).The ability to block enhancer activity from one region to anotheris thought to occur through CTCF’s ability to form long-rangechromatin loops with other sites bound by CTCF (22). The for-mation of such CTCF-mediated chromatin loops was particularlystriking in the human MHC-II locus, where CTCF binding sitesoccurred at the boundaries between subregions encoding MHC-IIa/b gene pairs (e.g., HLA-DR and HLA-DQ), and chromatinloops/interactions occurred between adjacent regions (23, 24).These CTCF binding site interactions were independent of theknown MHC-II–specific regulatory factors, including CIITA.RNA interference (RNAi)–mediated knockdown of CTCF in thehuman Raji B lymphoblastoid cell line resulted in decreasedMHC-II gene expression and loss of the interactions between theCTCF sites, suggesting that these interactions were important formaximal MHC-II expression (23). Thus, these sites were termedMHC-II insulators. MHC-II insulators also interacted with MHC-II promoter regions that were within ∼200 kb. This set of inter-actions was dependent on CIITA expression, suggesting that two
Department of Microbiology and Immunology, Emory University School of Medi-cine, Atlanta, GA 30322
1Current address: Department of Immunology and Microbial Science, The ScrippsResearch Institute, La Jolla, CA.
Received for publication December 2, 2013. Accepted for publication February 4,2014.
This work was supported by National Institutes of Health Grants AI43000 andGM47310.
The sequences presented in this article have been submitted to the Gene ExpressionOmnibus (http://www.ncbi.nlm.nih.gov/geo/) under accession number GSE44637.
Address correspondence and reprint requests to Dr. Jeremy M. Boss, Department ofMicrobiology and Immunology, Emory University School of Medicine, 1510 CliftonRoad, Room 3001, Atlanta, GA 30322. E-mail address: [email protected]
The online version of this article contains supplemental material.
Abbreviations used in this article: BAC, bacterial artificial chromosome; 3C, chro-matin conformation capture; ChIP, chromatin immunoprecipitation; ChIP-seq, ChIPsequencing; CTCF, CCCTC binding factor; MHC-II, MHC class II; P3X, P3X63Ag8;qPCR, quantitative PCR; RNAi, RNA interference; RFX, regulatory factor X; siRNA,small interfering RNA.
Copyright� 2014 by The American Association of Immunologists, Inc. 0022-1767/14/$16.00
www.jimmunol.org/cgi/doi/10.4049/jimmunol.1303205
by guest on March 29, 2018
http://ww
w.jim
munol.org/
Dow
nloaded from
chromatin architectural arrangements are set in the MHC-II locusof human B cells: one that is independent of expression (insulator–insulator) and a second that correlates with expression (insulator–promoter/CIITA).To further establish a role and mechanisms of action for MHC-II
insulators, the relationship between MHC-II gene expression in themouse and the existence of MHC-II insulators was investigated.Advantage was taken of the ability to isolate primary cells andin vivo–derived short-lived plasmablasts to determine if therewere differences in how potential MHC-II insulators may functionduring this fundamental developmental stage. Plasma cell differ-entiation leads to the loss of both CIITA and MHC-II gene ex-pression (25–27). Chromatin immunoprecipitation sequencing(ChIP-seq) for CTCF demonstrated both similarities and signifi-cant differences in CTCF site occupancy between the B cells andplasma cells. Notably, several CTCF binding sites identified in theI-A and I-E subregions in B cells exhibited reduced or absentCTCF binding in plasmablasts. Using chromatin conformationcapture (3C) assays (28), interaction maps were generated for eachof the murine CTCF-binding sites in B cells. A set of extensiveinteractions that defined the B cell and MHC-II–expressing phe-notype were observed and included those between insulator ele-ments, as well as interactions between the CTCF-binding sites andMHC-II gene promoters. 3C interaction profiles for a plasma cellline and in vivo–derived plasmablasts displayed a distinct set ofinteractions when compared with B cells. Stable, ectopic expres-sion of CIITA in a plasma cell line was used to activate MHC-IIexpression and potentially reprogram the architecture of the locus.Despite, the ability to generate high levels of MHC-II expressionand induce interactions between MHC-II promoters and someCTCF sites, the three-dimensional architecture of the locusremained mostly in the plasma cell configuration. These resultssuggest that commitment to the plasma cell lineage is associatedwith architectural and epigenetic changes in the MHC-II locus.This novel architecture accompanies the silencing of MHC-II geneexpression in this terminally differentiated cell type. Its potentialcontribution to this silencing is discussed.
Materials and MethodsMice, primary B cell, and plasmablast purification
C57BL/6 mice were purchased from The Jackson Laboratory. Mice werehoused in the Emory University School of Medicine Facilities. All animalexperiments were approved by the Emory University Institutional AnimalCare and Use Committee. To obtain primary mouse B cells, spleens wereisolated from 6-wk-old C57BL/6 mice. Following homogenization, theCD432 B cell population was purified using a magnetic separation procedureaccording to the manufacturer’s recommendations (Miltenyi Biotec). Purityof these preparations was verified by flow cytometry for B cell phenotypicmarkers using anti–B220-APC and anti–CD43-FITC. Mouse plasmablastswere obtained by injecting 50 mg LPS retro-orbitally into 6-wk-old C57BL/6mice. Three days postinjection, spleens were harvested and total splenocytesstained with anti–CD138-PE and anti–B220-APC. CD138+B220int plasma-blasts and CD138+B2202 plasma cells were sorted to high purity by FACS.Abs for FACS staining were purchased from BD Biosciences.
Cells and cell culture
The murine P3X 63Ag8 (CRL-1580; termed P3X in this study) plasma cellline and A20 (TIB-208) B cell line were purchased from the American TypeTissue Collection. All murine cells were grown in RPMI 1640 medium(Mediatech) supplemented with 10% heat-inactivated FBS (Sigma-Aldrich,St. Louis, MO), 10 mM HEPES (HyClone Laboratories), 1 mM sodiumpyruvate (HyClone Laboratories), 13 nonessential amino acids (HyCloneLaboratories), and 0.05 mM 2-ME (Sigma-Aldrich).
CIITA plasmid construction
Double-stranded oligonucleotides encoding a Kozak sequence, an N-terminal biotin ligase recognition site, a tobacco etch virus site, and His
6 tag were digested with NheI and cloned into the pREP4 vector (LifeTechnologies, Carlsbad, CA) to form a base expression vector. For otherpurposes, an internal ribosome entry site and the Escherichia coli biotinligase BirA were cloned into the XhoI and BamHI sites on the 39 side ofthe expression cassette of the vector. The full-length cDNA sequence ofCIITA isoform III was amplified using the Phusion High-Fidelity DNAPolymerase (New England BioLabs, Ipswich, MA), and this CIITA PCRproduct was inserted into the NotI site of the vector using the In-FusionDry-Down PCR Cloning Kit (Clontech Laboratories) according to themanufacturer’s recommendations. Following the creation of this multi-tagged CIITA expression vector, the 747-bp sequence of the XL9 insulator(24) was cloned into the XbaI site present downstream of the poly-adenylation signal of the CIITA-BirA coding sequence. Restriction en-zyme digestion and DNA sequencing were used to verify the integrity ofthe construct.
Transfection and stable cells
The Amaxa Nucleofector kit V (Lonza) was used for transfection of P3Xcells, and for each transfection, 4 3 106 P3X cells and 4 to 5 mg CsCl-prepared DNA was used. For selection of successfully transfected cells,hygromycin (Millipore, Billerica, MA) was added to the culture to a finalconcentration of 400 mg/ml 24 h after transfection. Cells were grown inmedia supplemented with 400 mg/ml hygromycin for 10 d until the se-lection was complete and then transferred to 100 mg/ml hygromycin toprevent loss of the episomal plasmid during prolonged maintenance of thestable cell lines.
Flow cytometry. For flow cytometry, the experimental and control cells werecollected and washed with cold PBS and resuspended in FACS sortingbuffer (13 PBS, 1 mM EDTA, and 1% BSA, 0.2-mm filter sterilized). Tomeasure the level of cell-surface MHC-II expression, cells were labeled onice with 1:300 dilution of PE-conjugated anti–IA-E Ab (BD Pharmingen),and isotype control (BD Pharmingen) (0.5 ng/ml) was added to all cells.Prior to Ab staining, cells were incubated with anti-CD16/32 (Fc blockclone 2.4G2) on ice for 5 min. Stained cells were washed twice with FACSsorting buffer. A BD FACSCalibur flow cytometer (BD Biosciences) wasused for data collection, and FlowJo computer software (Tree Star, Ash-land, OR) was used for analyses.
SDS-PAGE and immunoblot. SDS-PAGE and Western blotting were per-formed following standard laboratory procedures to determine the levelsof CTCF in B cells and plasma cells as indicated (29, 30). Anti-CTCF(Millipore) and anti–b-actin (Chemicon International) were diluted (1:1000)in 5% milk and incubated with the membrane at 4˚C overnight. Followingwashing, the membrane was incubated with HRP-conjugated secondarygoat anti-rabbit (Rockland Immunochemicals) and rabbit anti-goat (Sigma-Aldrich) at 1:5000 dilution for 1 h at room temperature prior to autoradi-ography.
ChIP assay
ChIP assays were performed as described previously (16, 23, 24, 30). Cellswere cross linked with 1% formaldehyde for 10 min. For immunoprecip-itations, 5–10 mg anti-CTCF (catalog number 06-917; Upstate Biotech-nology) or rabbit IgG (nonspecific control) Abs were used. Protein A beads(60 ml) were used to isolate the chromatin–Ab complexes. The DNA waspurified and used as a template in real-time PCR reactions or for prepa-ration of sequencing libraries. The immunoprecipitated DNA was quanti-tated by real-time PCR using a five-point genomic DNA standard curveand an I-cycler (Bio-Rad). Sequences for all primers used in the ChIP real-time PCR assays are listed in Supplemental Table II. All ChIP experimentswere performed at least three times from independent preparations ofchromatin. The data were averaged and plotted with respect to the inputchromatin.
ChIP-seq
Sequencing libraries were prepared from CTCF ChIP and input DNA fromthe indicated samples according to the manufacturer’s instructions (Illu-mina). Briefly, DNA was end-repaired, sequencing adaptors ligated, andPCR amplified for four cycles to ensure libraries were double-stranded.A total of 200–400 bp DNA was agarose gel purified and amplified fora further eight cycles to PCR-enrich adaptor-ligated DNA into a sequenc-ing library. Library quality was determined on an Agilent BioAnalyzer(Agilent Technologies) and quantitated by quantitative PCR (qPCR) priorto sequencing. The B cell CTCF ChIP and input libraries were sequencedon an Illumina GAII (Illumina), and the plasmablast CTCF ChIP and inputlibraries were sequenced on a HiSeq2000 platform (Illumina).
Raw sequencing reads were mapped to the mm9 version of the mousegenome using Bowtie (31). Only uniquely mapped and nonredundant reads
3926 CTCF ARCHITECTURE OF THE MURINE MHC-II LOCUS
by guest on March 29, 2018
http://ww
w.jim
munol.org/
Dow
nloaded from
were used for subsequent analyses. Significantly enriched CTCF peaksover input control were determined for each sample using HOMER soft-ware (32). All sequence manipulation, annotation, and analysis was per-formed using HOMER software, bedTools (33), and custom R and perlscripts. All sequencing data can be found under accession numberGSE44637 in the Gene Expression Omnibus database (http://www.ncbi.nlm.nih.gov/geo/).
Quantitative 3C assay
A modified 3C assay protocol was performed in this experiment as de-scribed previously (23, 34). For B cells and P3X cells, 107 cells was used.For plasmablasts and plasma cells, 0.5 3 106 cells was used. Formalde-hyde was added to cells to a final concentration of 1% and incubated for 10min at room temperature. Glycine (final concentration 125 mM) was addedto stop the cross-linking reaction. Nuclei were collected from the cross-linked cells and digested overnight with either EcoRI or BglII as indicated.Restriction enzymes were heat inactivated, diluted into ligation buffer ata ratio of ∼40:1, and then ligated with T4 DNA ligase. Quantitation of the3C products was performed by real-time PCR against a five-point standardcurve as described previously (23). Standard curve templates for the 3Cproducts were generated in vitro by restriction enzyme cleaving and reli-gating a bacterial artificial chromosome (BAC) containing the region beingstudied. The following BACs were used to cover the murine MHC-II locus:RP24-169M8, RP24-100G18, and RP24-286E13 (purchased from Chil-dren’s Hospital Oakland Research Institute). All primer combinations(Supplemental Table II) were tested prior to use in the 3C assay to de-termine whether they could efficiently amplify a single product on thecleaved/religated BAC DNA. This includes the anchor primers, whichwere used to assess interactions between one restriction fragment and theothers tested in the assay. All primers had a .90% PCR efficiency anddisplayed only one product. Negative control restriction fragments werechosen with the following bias. Control fragments had to be more than tworestriction sites away from the test sequence and contained within a frag-ment that was ,10 kb in length, as we have empirically found that verylarge fragments score poorly in these assays. Data are presented as crosslinked frequency and represent an average derived from three independentbiological replicates. SE is provided for the dataset. The Student t test wasused to determine if observed differences were significant.
RNAi and quantitative RT-PCR
RNAi using small interfering RNA (siRNA) was performed to knockdownCTCF mRNA levels from primary B cells using siRNA oligonucleotideSMART pools from Dharmacon (Lafayette, CO). These siRNAs weretransfected into 43 106 primary B cells using a Nucleofection apparatus andtransfecting reagents (Kit V) from Amaxa Biosystems as previously de-scribed (30, 35). Following transfection, cells were cultured for 72 h. TotalRNA was isolated and used for the subsequent qPCR assays. 18s primerswere used in each of the experiments to normalize the data. Primers used inthis experiment are listed in the Supplemental Table II. The data presentedrepresent the average with SD of three independent experiments. Statisticalsignificance was calculated using a Student t test and specifically comparedthe values obtained using the GFP siRNAs compared with the CTCF siRNAs.
ResultsCTCF binding profile dynamics during B cell to plasmablastdifferentiation
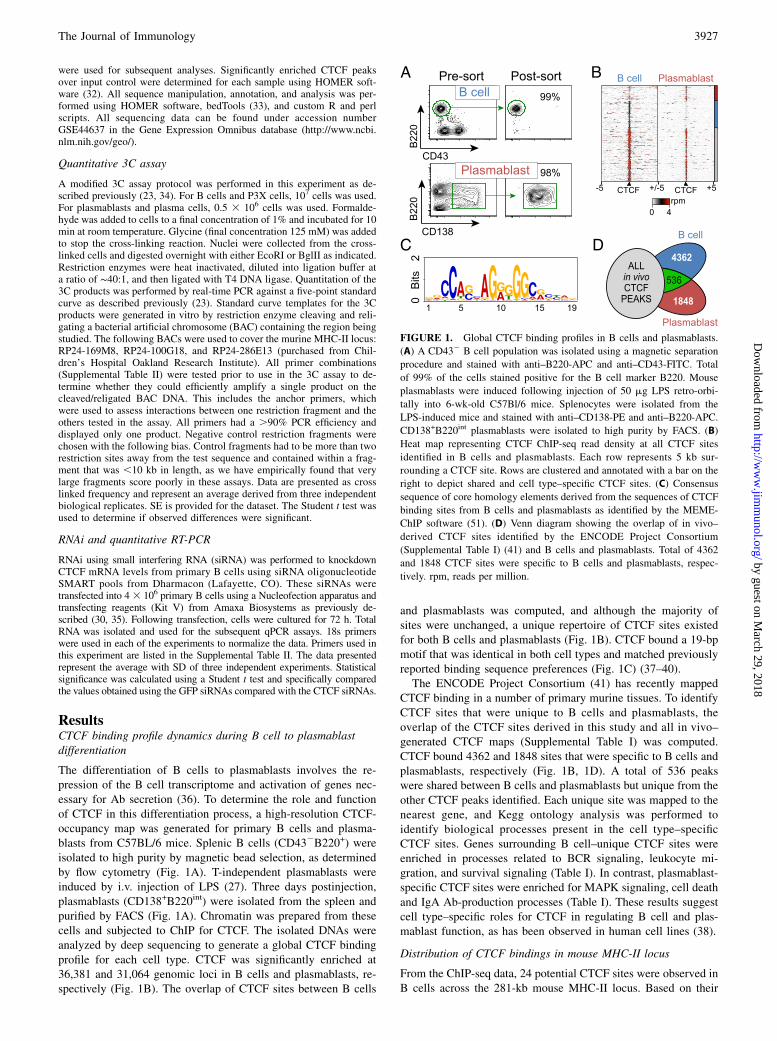
The differentiation of B cells to plasmablasts involves the re-pression of the B cell transcriptome and activation of genes nec-essary for Ab secretion (36). To determine the role and functionof CTCF in this differentiation process, a high-resolution CTCF-occupancy map was generated for primary B cells and plasma-blasts from C57BL/6 mice. Splenic B cells (CD432B220+) wereisolated to high purity by magnetic bead selection, as determinedby flow cytometry (Fig. 1A). T-independent plasmablasts wereinduced by i.v. injection of LPS (27). Three days postinjection,plasmablasts (CD138+B220int) were isolated from the spleen andpurified by FACS (Fig. 1A). Chromatin was prepared from thesecells and subjected to ChIP for CTCF. The isolated DNAs wereanalyzed by deep sequencing to generate a global CTCF bindingprofile for each cell type. CTCF was significantly enriched at36,381 and 31,064 genomic loci in B cells and plasmablasts, re-spectively (Fig. 1B). The overlap of CTCF sites between B cells
and plasmablasts was computed, and although the majority ofsites were unchanged, a unique repertoire of CTCF sites existedfor both B cells and plasmablasts (Fig. 1B). CTCF bound a 19-bpmotif that was identical in both cell types and matched previouslyreported binding sequence preferences (Fig. 1C) (37–40).The ENCODE Project Consortium (41) has recently mapped
CTCF binding in a number of primary murine tissues. To identifyCTCF sites that were unique to B cells and plasmablasts, theoverlap of the CTCF sites derived in this study and all in vivo–generated CTCF maps (Supplemental Table I) was computed.CTCF bound 4362 and 1848 sites that were specific to B cells andplasmablasts, respectively (Fig. 1B, 1D). A total of 536 peakswere shared between B cells and plasmablasts but unique from theother CTCF peaks identified. Each unique site was mapped to thenearest gene, and Kegg ontology analysis was performed toidentify biological processes present in the cell type–specificCTCF sites. Genes surrounding B cell–unique CTCF sites wereenriched in processes related to BCR signaling, leukocyte mi-gration, and survival signaling (Table I). In contrast, plasmablast-specific CTCF sites were enriched for MAPK signaling, cell deathand IgA Ab-production processes (Table I). These results suggestcell type–specific roles for CTCF in regulating B cell and plas-mablast function, as has been observed in human cell lines (38).
Distribution of CTCF bindings in mouse MHC-II locus
From the ChIP-seq data, 24 potential CTCF sites were observed inB cells across the 281-kb mouse MHC-II locus. Based on their
FIGURE 1. Global CTCF binding profiles in B cells and plasmablasts.
(A) A CD432 B cell population was isolated using a magnetic separation
procedure and stained with anti–B220-APC and anti–CD43-FITC. Total
of 99% of the cells stained positive for the B cell marker B220. Mouse
plasmablasts were induced following injection of 50 mg LPS retro-orbi-
tally into 6-wk-old C57Bl/6 mice. Splenocytes were isolated from the
LPS-induced mice and stained with anti–CD138-PE and anti–B220-APC.
CD138+B220int plasmablasts were isolated to high purity by FACS. (B)
Heat map representing CTCF ChIP-seq read density at all CTCF sites
identified in B cells and plasmablasts. Each row represents 5 kb sur-
rounding a CTCF site. Rows are clustered and annotated with a bar on the
right to depict shared and cell type–specific CTCF sites. (C) Consensus
sequence of core homology elements derived from the sequences of CTCF
binding sites from B cells and plasmablasts as identified by the MEME-
ChIP software (51). (D) Venn diagram showing the overlap of in vivo–
derived CTCF sites identified by the ENCODE Project Consortium
(Supplemental Table I) (41) and B cells and plasmablasts. Total of 4362
and 1848 CTCF sites were specific to B cells and plasmablasts, respec-
tively. rpm, reads per million.
The Journal of Immunology 3927
by guest on March 29, 2018
http://ww
w.jim
munol.org/
Dow
nloaded from
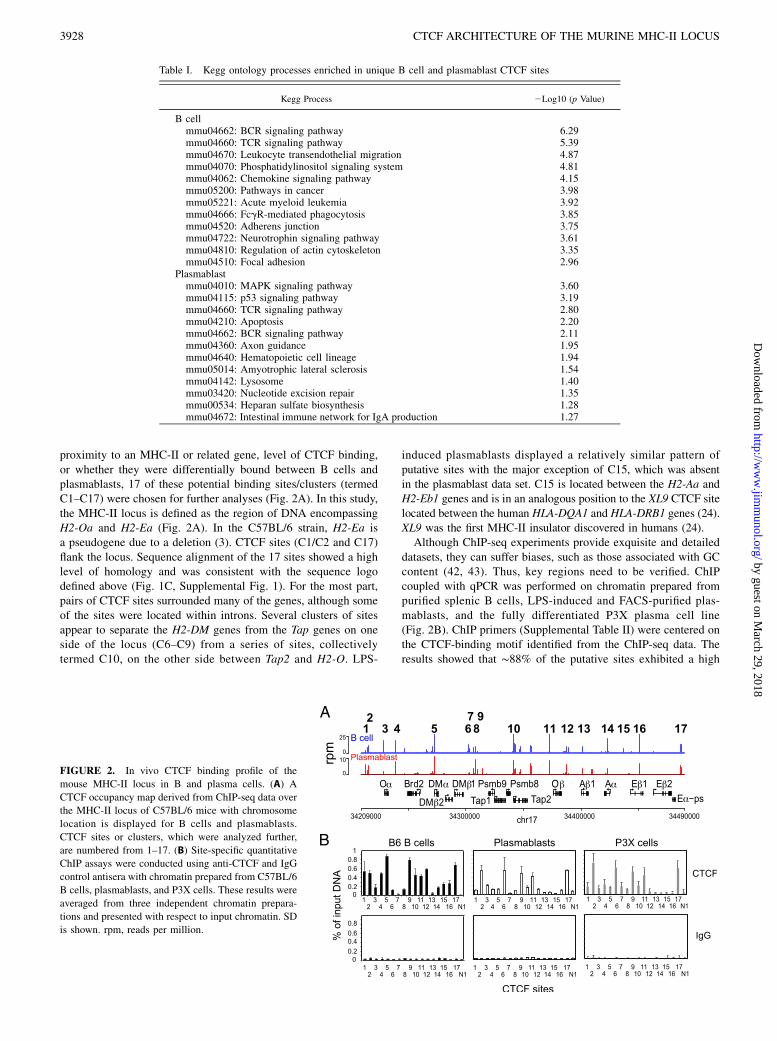
proximity to an MHC-II or related gene, level of CTCF binding,or whether they were differentially bound between B cells andplasmablasts, 17 of these potential binding sites/clusters (termedC1–C17) were chosen for further analyses (Fig. 2A). In this study,the MHC-II locus is defined as the region of DNA encompassingH2-Oa and H2-Ea (Fig. 2A). In the C57BL/6 strain, H2-Ea isa pseudogene due to a deletion (3). CTCF sites (C1/C2 and C17)flank the locus. Sequence alignment of the 17 sites showed a highlevel of homology and was consistent with the sequence logodefined above (Fig. 1C, Supplemental Fig. 1). For the most part,pairs of CTCF sites surrounded many of the genes, although someof the sites were located within introns. Several clusters of sitesappear to separate the H2-DM genes from the Tap genes on oneside of the locus (C6–C9) from a series of sites, collectivelytermed C10, on the other side between Tap2 and H2-O. LPS-
induced plasmablasts displayed a relatively similar pattern ofputative sites with the major exception of C15, which was absentin the plasmablast data set. C15 is located between the H2-Aa andH2-Eb1 genes and is in an analogous position to the XL9 CTCF sitelocated between the human HLA-DQA1 and HLA-DRB1 genes (24).XL9 was the first MHC-II insulator discovered in humans (24).Although ChIP-seq experiments provide exquisite and detailed
datasets, they can suffer biases, such as those associated with GCcontent (42, 43). Thus, key regions need to be verified. ChIPcoupled with qPCR was performed on chromatin prepared frompurified splenic B cells, LPS-induced and FACS-purified plas-mablasts, and the fully differentiated P3X plasma cell line(Fig. 2B). ChIP primers (Supplemental Table II) were centered onthe CTCF-binding motif identified from the ChIP-seq data. Theresults showed that ∼88% of the putative sites exhibited a high
Table I. Kegg ontology processes enriched in unique B cell and plasmablast CTCF sites
Kegg Process 2Log10 (p Value)
B cellmmu04662: BCR signaling pathway 6.29mmu04660: TCR signaling pathway 5.39mmu04670: Leukocyte transendothelial migration 4.87mmu04070: Phosphatidylinositol signaling system 4.81mmu04062: Chemokine signaling pathway 4.15mmu05200: Pathways in cancer 3.98mmu05221: Acute myeloid leukemia 3.92mmu04666: FcgR-mediated phagocytosis 3.85mmu04520: Adherens junction 3.75mmu04722: Neurotrophin signaling pathway 3.61mmu04810: Regulation of actin cytoskeleton 3.35mmu04510: Focal adhesion 2.96
Plasmablastmmu04010: MAPK signaling pathway 3.60mmu04115: p53 signaling pathway 3.19mmu04660: TCR signaling pathway 2.80mmu04210: Apoptosis 2.20mmu04662: BCR signaling pathway 2.11mmu04360: Axon guidance 1.95mmu04640: Hematopoietic cell lineage 1.94mmu05014: Amyotrophic lateral sclerosis 1.54mmu04142: Lysosome 1.40mmu03420: Nucleotide excision repair 1.35mmu00534: Heparan sulfate biosynthesis 1.28mmu04672: Intestinal immune network for IgA production 1.27
FIGURE 2. In vivo CTCF binding profile of the
mouse MHC-II locus in B and plasma cells. (A) A
CTCF occupancy map derived from ChIP-seq data over
the MHC-II locus of C57BL/6 mice with chromosome
location is displayed for B cells and plasmablasts.
CTCF sites or clusters, which were analyzed further,
are numbered from 1–17. (B) Site-specific quantitative
ChIP assays were conducted using anti-CTCF and IgG
control antisera with chromatin prepared from C57BL/6
B cells, plasmablasts, and P3X cells. These results were
averaged from three independent chromatin prepara-
tions and presented with respect to input chromatin. SD
is shown. rpm, reads per million.
3928 CTCF ARCHITECTURE OF THE MURINE MHC-II LOCUS
by guest on March 29, 2018
http://ww
w.jim
munol.org/
Dow
nloaded from
level of CTCF occupancy in MHC-II–expressing mouse primaryB cells. Low or nearly background levels of CTCF were found atC7 and C12, suggesting that these may not be true CTCF-bindingsites. In both LPS-induced plasmablasts and P3X cells, the level ofCTCF occupancy at sites C1, C4, C5, C10, C12, C14, and C16 wasreduced when compared with B cells (Fig. 2B). Unlike in B cells,C15 displayed only background binding in plasmablasts and P3Xcells. As with B cells, C7 and C13 showed only background levelsof CTCF binding. Importantly, this pattern was the same forprimary-induced plasmablasts and the P3X model plasma cell line.Thus, unique CTCF binding patterns exist for B cells and plasmacells in the MHC-II locus, with C1, C4, C5, C10, C12, C14, C15,and C16 displaying differential CTCF binding.
CTCF is essential for MHC-II gene expression in murineB cells
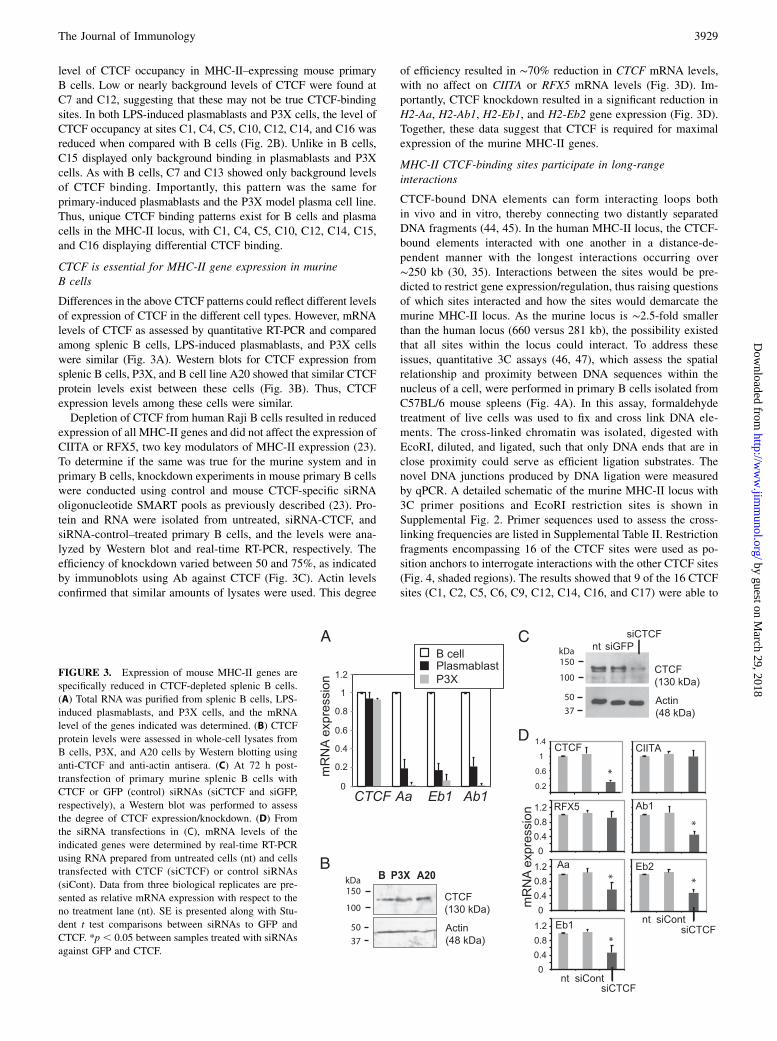
Differences in the above CTCF patterns could reflect different levelsof expression of CTCF in the different cell types. However, mRNAlevels of CTCF as assessed by quantitative RT-PCR and comparedamong splenic B cells, LPS-induced plasmablasts, and P3X cellswere similar (Fig. 3A). Western blots for CTCF expression fromsplenic B cells, P3X, and B cell line A20 showed that similar CTCFprotein levels exist between these cells (Fig. 3B). Thus, CTCFexpression levels among these cells were similar.Depletion of CTCF from human Raji B cells resulted in reduced
expression of all MHC-II genes and did not affect the expression ofCIITA or RFX5, two key modulators of MHC-II expression (23).To determine if the same was true for the murine system and inprimary B cells, knockdown experiments in mouse primary B cellswere conducted using control and mouse CTCF-specific siRNAoligonucleotide SMART pools as previously described (23). Pro-tein and RNA were isolated from untreated, siRNA-CTCF, andsiRNA-control–treated primary B cells, and the levels were ana-lyzed by Western blot and real-time RT-PCR, respectively. Theefficiency of knockdown varied between 50 and 75%, as indicatedby immunoblots using Ab against CTCF (Fig. 3C). Actin levelsconfirmed that similar amounts of lysates were used. This degree
of efficiency resulted in ∼70% reduction in CTCF mRNA levels,with no affect on CIITA or RFX5 mRNA levels (Fig. 3D). Im-portantly, CTCF knockdown resulted in a significant reduction inH2-Aa, H2-Ab1, H2-Eb1, and H2-Eb2 gene expression (Fig. 3D).Together, these data suggest that CTCF is required for maximalexpression of the murine MHC-II genes.
MHC-II CTCF-binding sites participate in long-rangeinteractions
CTCF-bound DNA elements can form interacting loops bothin vivo and in vitro, thereby connecting two distantly separatedDNA fragments (44, 45). In the human MHC-II locus, the CTCF-bound elements interacted with one another in a distance-de-pendent manner with the longest interactions occurring over∼250 kb (30, 35). Interactions between the sites would be pre-dicted to restrict gene expression/regulation, thus raising questionsof which sites interacted and how the sites would demarcate themurine MHC-II locus. As the murine locus is ∼2.5-fold smallerthan the human locus (660 versus 281 kb), the possibility existedthat all sites within the locus could interact. To address theseissues, quantitative 3C assays (46, 47), which assess the spatialrelationship and proximity between DNA sequences within thenucleus of a cell, were performed in primary B cells isolated fromC57BL/6 mouse spleens (Fig. 4A). In this assay, formaldehydetreatment of live cells was used to fix and cross link DNA ele-ments. The cross-linked chromatin was isolated, digested withEcoRI, diluted, and ligated, such that only DNA ends that are inclose proximity could serve as efficient ligation substrates. Thenovel DNA junctions produced by DNA ligation were measuredby qPCR. A detailed schematic of the murine MHC-II locus with3C primer positions and EcoRI restriction sites is shown inSupplemental Fig. 2. Primer sequences used to assess the cross-linking frequencies are listed in Supplemental Table II. Restrictionfragments encompassing 16 of the CTCF sites were used as po-sition anchors to interrogate interactions with the other CTCF sites(Fig. 4, shaded regions). The results showed that 9 of the 16 CTCFsites (C1, C2, C5, C6, C9, C12, C14, C16, and C17) were able to
FIGURE 3. Expression of mouse MHC-II genes are
specifically reduced in CTCF-depleted splenic B cells.
(A) Total RNA was purified from splenic B cells, LPS-
induced plasmablasts, and P3X cells, and the mRNA
level of the genes indicated was determined. (B) CTCF
protein levels were assessed in whole-cell lysates from
B cells, P3X, and A20 cells by Western blotting using
anti-CTCF and anti-actin antisera. (C) At 72 h post-
transfection of primary murine splenic B cells with
CTCF or GFP (control) siRNAs (siCTCF and siGFP,
respectively), a Western blot was performed to assess
the degree of CTCF expression/knockdown. (D) From
the siRNA transfections in (C), mRNA levels of the
indicated genes were determined by real-time RT-PCR
using RNA prepared from untreated cells (nt) and cells
transfected with CTCF (siCTCF) or control siRNAs
(siCont). Data from three biological replicates are pre-
sented as relative mRNA expression with respect to the
no treatment lane (nt). SE is presented along with Stu-
dent t test comparisons between siRNAs to GFP and
CTCF. *p , 0.05 between samples treated with siRNAs
against GFP and CTCF.
The Journal of Immunology 3929
by guest on March 29, 2018
http://ww
w.jim
munol.org/
Dow
nloaded from
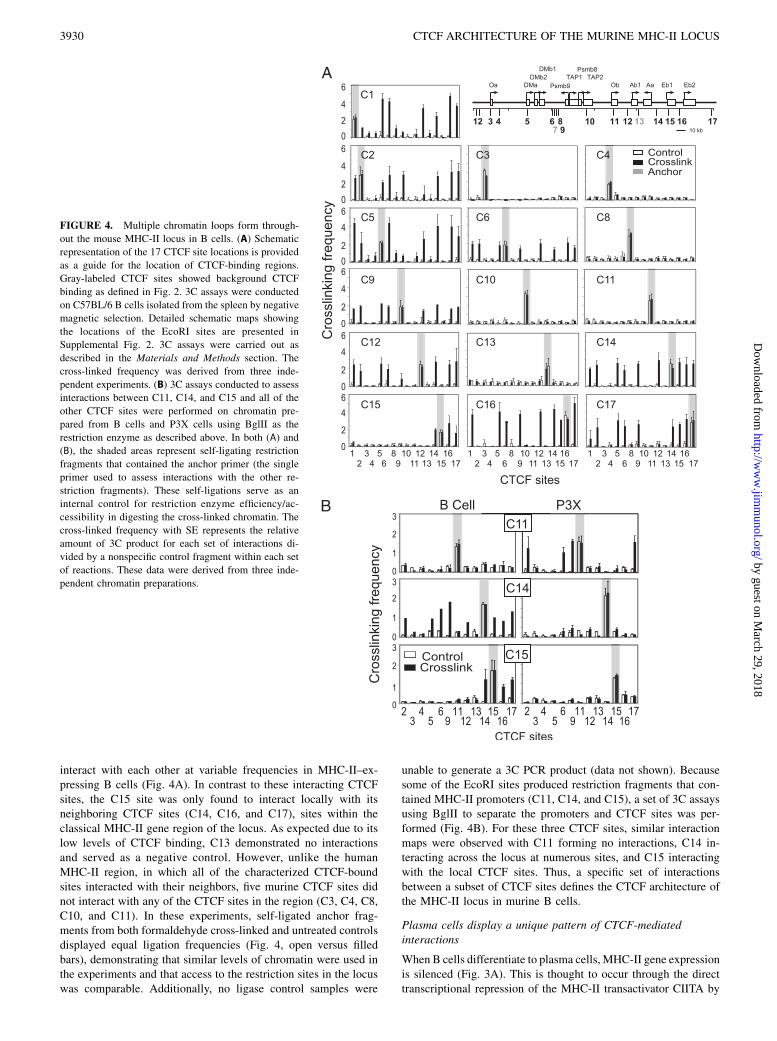
interact with each other at variable frequencies in MHC-II–ex-pressing B cells (Fig. 4A). In contrast to these interacting CTCFsites, the C15 site was only found to interact locally with itsneighboring CTCF sites (C14, C16, and C17), sites within theclassical MHC-II gene region of the locus. As expected due to itslow levels of CTCF binding, C13 demonstrated no interactionsand served as a negative control. However, unlike the humanMHC-II region, in which all of the characterized CTCF-boundsites interacted with their neighbors, five murine CTCF sites didnot interact with any of the CTCF sites in the region (C3, C4, C8,C10, and C11). In these experiments, self-ligated anchor frag-ments from both formaldehyde cross-linked and untreated controlsdisplayed equal ligation frequencies (Fig. 4, open versus filledbars), demonstrating that similar levels of chromatin were used inthe experiments and that access to the restriction sites in the locuswas comparable. Additionally, no ligase control samples were
unable to generate a 3C PCR product (data not shown). Becausesome of the EcoRI sites produced restriction fragments that con-tained MHC-II promoters (C11, C14, and C15), a set of 3C assaysusing BglII to separate the promoters and CTCF sites was per-formed (Fig. 4B). For these three CTCF sites, similar interactionmaps were observed with C11 forming no interactions, C14 in-teracting across the locus at numerous sites, and C15 interactingwith the local CTCF sites. Thus, a specific set of interactionsbetween a subset of CTCF sites defines the CTCF architecture ofthe MHC-II locus in murine B cells.
Plasma cells display a unique pattern of CTCF-mediatedinteractions
When B cells differentiate to plasma cells, MHC-II gene expressionis silenced (Fig. 3A). This is thought to occur through the directtranscriptional repression of the MHC-II transactivator CIITA by
FIGURE 4. Multiple chromatin loops form through-
out the mouse MHC-II locus in B cells. (A) Schematic
representation of the 17 CTCF site locations is provided
as a guide for the location of CTCF-binding regions.
Gray-labeled CTCF sites showed background CTCF
binding as defined in Fig. 2. 3C assays were conducted
on C57BL/6 B cells isolated from the spleen by negative
magnetic selection. Detailed schematic maps showing
the locations of the EcoRI sites are presented in
Supplemental Fig. 2. 3C assays were carried out as
described in the Materials and Methods section. The
cross-linked frequency was derived from three inde-
pendent experiments. (B) 3C assays conducted to assess
interactions between C11, C14, and C15 and all of the
other CTCF sites were performed on chromatin pre-
pared from B cells and P3X cells using BglII as the
restriction enzyme as described above. In both (A) and
(B), the shaded areas represent self-ligating restriction
fragments that contained the anchor primer (the single
primer used to assess interactions with the other re-
striction fragments). These self-ligations serve as an
internal control for restriction enzyme efficiency/ac-
cessibility in digesting the cross-linked chromatin. The
cross-linked frequency with SE represents the relative
amount of 3C product for each set of interactions di-
vided by a nonspecific control fragment within each set
of reactions. These data were derived from three inde-
pendent chromatin preparations.
3930 CTCF ARCHITECTURE OF THE MURINE MHC-II LOCUS
by guest on March 29, 2018
http://ww
w.jim
munol.org/
Dow
nloaded from
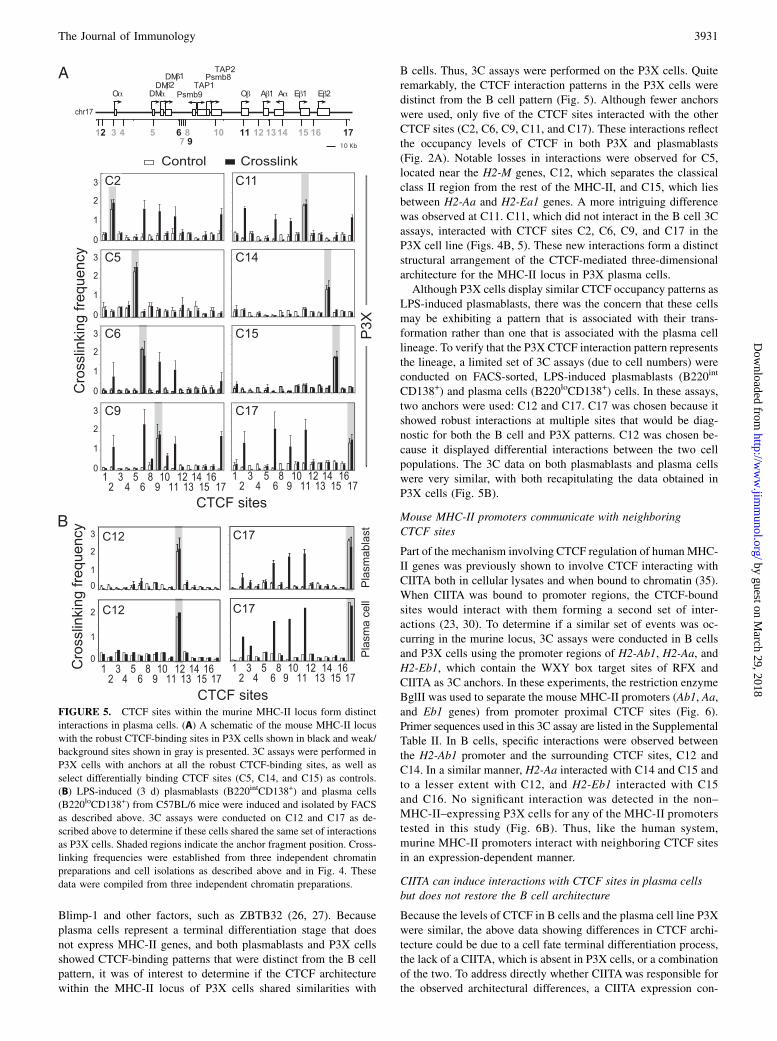
Blimp-1 and other factors, such as ZBTB32 (26, 27). Becauseplasma cells represent a terminal differentiation stage that doesnot express MHC-II genes, and both plasmablasts and P3X cellsshowed CTCF-binding patterns that were distinct from the B cellpattern, it was of interest to determine if the CTCF architecturewithin the MHC-II locus of P3X cells shared similarities with
B cells. Thus, 3C assays were performed on the P3X cells. Quiteremarkably, the CTCF interaction patterns in the P3X cells weredistinct from the B cell pattern (Fig. 5). Although fewer anchorswere used, only five of the CTCF sites interacted with the otherCTCF sites (C2, C6, C9, C11, and C17). These interactions reflectthe occupancy levels of CTCF in both P3X and plasmablasts(Fig. 2A). Notable losses in interactions were observed for C5,located near the H2-M genes, C12, which separates the classicalclass II region from the rest of the MHC-II, and C15, which liesbetween H2-Aa and H2-Ea1 genes. A more intriguing differencewas observed at C11. C11, which did not interact in the B cell 3Cassays, interacted with CTCF sites C2, C6, C9, and C17 in theP3X cell line (Figs. 4B, 5). These new interactions form a distinctstructural arrangement of the CTCF-mediated three-dimensionalarchitecture for the MHC-II locus in P3X plasma cells.Although P3X cells display similar CTCF occupancy patterns as
LPS-induced plasmablasts, there was the concern that these cellsmay be exhibiting a pattern that is associated with their trans-formation rather than one that is associated with the plasma celllineage. To verify that the P3X CTCF interaction pattern representsthe lineage, a limited set of 3C assays (due to cell numbers) wereconducted on FACS-sorted, LPS-induced plasmablasts (B220int
CD138+) and plasma cells (B220loCD138+) cells. In these assays,two anchors were used: C12 and C17. C17 was chosen because itshowed robust interactions at multiple sites that would be diag-nostic for both the B cell and P3X patterns. C12 was chosen be-cause it displayed differential interactions between the two cellpopulations. The 3C data on both plasmablasts and plasma cellswere very similar, with both recapitulating the data obtained inP3X cells (Fig. 5B).
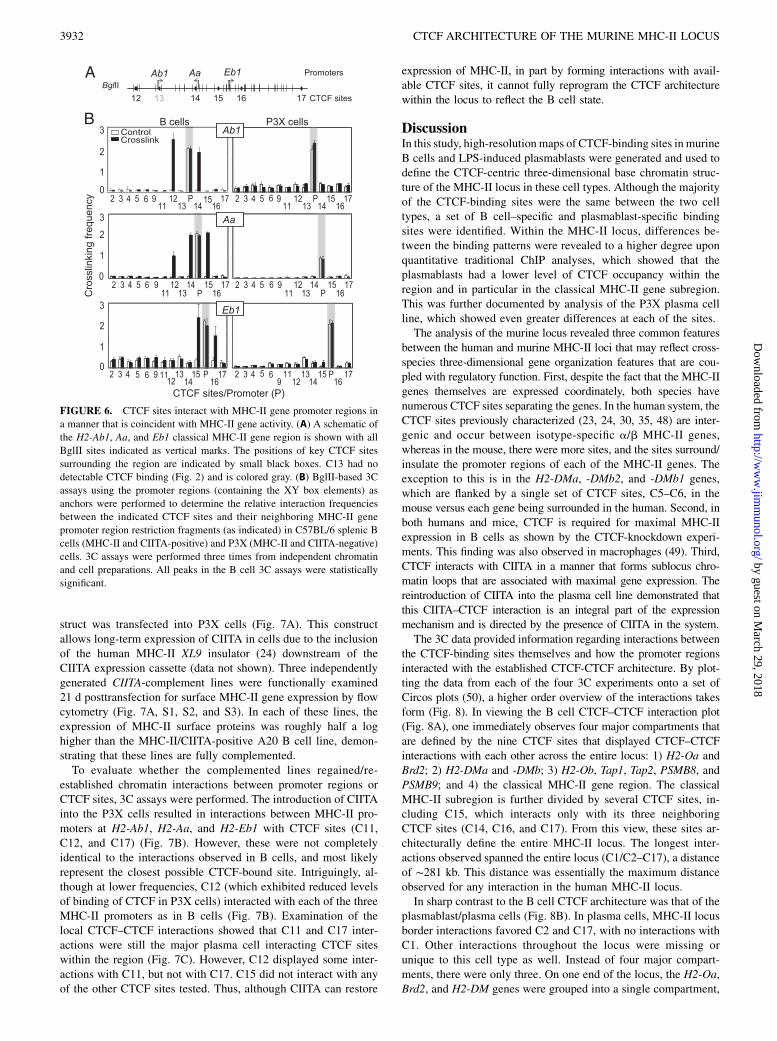
Mouse MHC-II promoters communicate with neighboringCTCF sites
Part of the mechanism involving CTCF regulation of human MHC-II genes was previously shown to involve CTCF interacting withCIITA both in cellular lysates and when bound to chromatin (35).When CIITA was bound to promoter regions, the CTCF-boundsites would interact with them forming a second set of inter-actions (23, 30). To determine if a similar set of events was oc-curring in the murine locus, 3C assays were conducted in B cellsand P3X cells using the promoter regions of H2-Ab1, H2-Aa, andH2-Eb1, which contain the WXY box target sites of RFX andCIITA as 3C anchors. In these experiments, the restriction enzymeBglII was used to separate the mouse MHC-II promoters (Ab1, Aa,and Eb1 genes) from promoter proximal CTCF sites (Fig. 6).Primer sequences used in this 3C assay are listed in the SupplementalTable II. In B cells, specific interactions were observed betweenthe H2-Ab1 promoter and the surrounding CTCF sites, C12 andC14. In a similar manner, H2-Aa interacted with C14 and C15 andto a lesser extent with C12, and H2-Eb1 interacted with C15and C16. No significant interaction was detected in the non–MHC-II–expressing P3X cells for any of the MHC-II promoterstested in this study (Fig. 6B). Thus, like the human system,murine MHC-II promoters interact with neighboring CTCF sitesin an expression-dependent manner.
CIITA can induce interactions with CTCF sites in plasma cellsbut does not restore the B cell architecture
Because the levels of CTCF in B cells and the plasma cell line P3Xwere similar, the above data showing differences in CTCF archi-tecture could be due to a cell fate terminal differentiation process,the lack of a CIITA, which is absent in P3X cells, or a combinationof the two. To address directly whether CIITAwas responsible forthe observed architectural differences, a CIITA expression con-
FIGURE 5. CTCF sites within the murine MHC-II locus form distinct
interactions in plasma cells. (A) A schematic of the mouse MHC-II locus
with the robust CTCF-binding sites in P3X cells shown in black and weak/
background sites shown in gray is presented. 3C assays were performed in
P3X cells with anchors at all the robust CTCF-binding sites, as well as
select differentially binding CTCF sites (C5, C14, and C15) as controls.
(B) LPS-induced (3 d) plasmablasts (B220intCD138+) and plasma cells
(B220loCD138+) from C57BL/6 mice were induced and isolated by FACS
as described above. 3C assays were conducted on C12 and C17 as de-
scribed above to determine if these cells shared the same set of interactions
as P3X cells. Shaded regions indicate the anchor fragment position. Cross-
linking frequencies were established from three independent chromatin
preparations and cell isolations as described above and in Fig. 4. These
data were compiled from three independent chromatin preparations.
The Journal of Immunology 3931
by guest on March 29, 2018
http://ww
w.jim
munol.org/
Dow
nloaded from
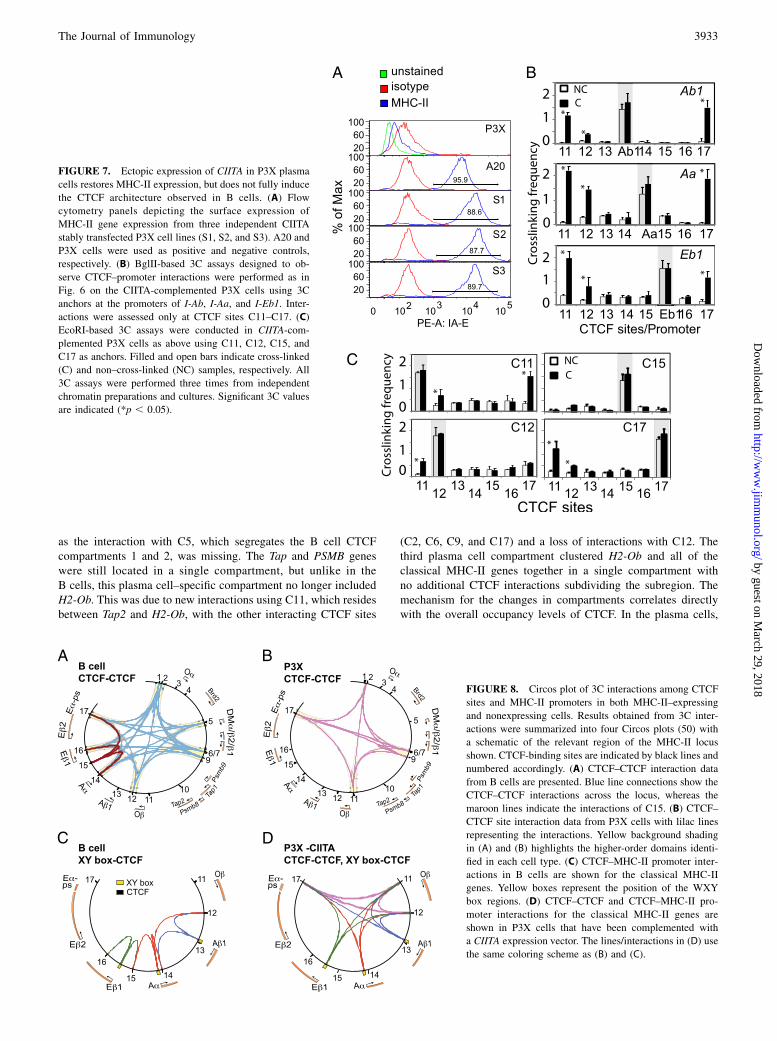
struct was transfected into P3X cells (Fig. 7A). This constructallows long-term expression of CIITA in cells due to the inclusionof the human MHC-II XL9 insulator (24) downstream of theCIITA expression cassette (data not shown). Three independentlygenerated CIITA-complement lines were functionally examined21 d posttransfection for surface MHC-II gene expression by flowcytometry (Fig. 7A, S1, S2, and S3). In each of these lines, theexpression of MHC-II surface proteins was roughly half a loghigher than the MHC-II/CIITA-positive A20 B cell line, demon-strating that these lines are fully complemented.To evaluate whether the complemented lines regained/re-
established chromatin interactions between promoter regions orCTCF sites, 3C assays were performed. The introduction of CIITAinto the P3X cells resulted in interactions between MHC-II pro-moters at H2-Ab1, H2-Aa, and H2-Eb1 with CTCF sites (C11,C12, and C17) (Fig. 7B). However, these were not completelyidentical to the interactions observed in B cells, and most likelyrepresent the closest possible CTCF-bound site. Intriguingly, al-though at lower frequencies, C12 (which exhibited reduced levelsof binding of CTCF in P3X cells) interacted with each of the threeMHC-II promoters as in B cells (Fig. 7B). Examination of thelocal CTCF–CTCF interactions showed that C11 and C17 inter-actions were still the major plasma cell interacting CTCF siteswithin the region (Fig. 7C). However, C12 displayed some inter-actions with C11, but not with C17. C15 did not interact with anyof the other CTCF sites tested. Thus, although CIITA can restore
expression of MHC-II, in part by forming interactions with avail-able CTCF sites, it cannot fully reprogram the CTCF architecturewithin the locus to reflect the B cell state.
DiscussionIn this study, high-resolutionmaps of CTCF-binding sites in murineB cells and LPS-induced plasmablasts were generated and used todefine the CTCF-centric three-dimensional base chromatin struc-ture of the MHC-II locus in these cell types. Although the majorityof the CTCF-binding sites were the same between the two celltypes, a set of B cell–specific and plasmablast-specific bindingsites were identified. Within the MHC-II locus, differences be-tween the binding patterns were revealed to a higher degree uponquantitative traditional ChIP analyses, which showed that theplasmablasts had a lower level of CTCF occupancy within theregion and in particular in the classical MHC-II gene subregion.This was further documented by analysis of the P3X plasma cellline, which showed even greater differences at each of the sites.The analysis of the murine locus revealed three common features
between the human and murine MHC-II loci that may reflect cross-species three-dimensional gene organization features that are cou-pled with regulatory function. First, despite the fact that the MHC-IIgenes themselves are expressed coordinately, both species havenumerous CTCF sites separating the genes. In the human system, theCTCF sites previously characterized (23, 24, 30, 35, 48) are inter-genic and occur between isotype-specific a/b MHC-II genes,whereas in the mouse, there were more sites, and the sites surround/insulate the promoter regions of each of the MHC-II genes. Theexception to this is in the H2-DMa, -DMb2, and -DMb1 genes,which are flanked by a single set of CTCF sites, C5–C6, in themouse versus each gene being surrounded in the human. Second, inboth humans and mice, CTCF is required for maximal MHC-IIexpression in B cells as shown by the CTCF-knockdown experi-ments. This finding was also observed in macrophages (49). Third,CTCF interacts with CIITA in a manner that forms sublocus chro-matin loops that are associated with maximal gene expression. Thereintroduction of CIITA into the plasma cell line demonstrated thatthis CIITA–CTCF interaction is an integral part of the expressionmechanism and is directed by the presence of CIITA in the system.The 3C data provided information regarding interactions between
the CTCF-binding sites themselves and how the promoter regionsinteracted with the established CTCF-CTCF architecture. By plot-ting the data from each of the four 3C experiments onto a set ofCircos plots (50), a higher order overview of the interactions takesform (Fig. 8). In viewing the B cell CTCF–CTCF interaction plot(Fig. 8A), one immediately observes four major compartments thatare defined by the nine CTCF sites that displayed CTCF–CTCFinteractions with each other across the entire locus: 1) H2-Oa andBrd2; 2) H2-DMa and -DMb; 3) H2-Ob, Tap1, Tap2, PSMB8, andPSMB9; and 4) the classical MHC-II gene region. The classicalMHC-II subregion is further divided by several CTCF sites, in-cluding C15, which interacts only with its three neighboringCTCF sites (C14, C16, and C17). From this view, these sites ar-chitecturally define the entire MHC-II locus. The longest inter-actions observed spanned the entire locus (C1/C2–C17), a distanceof ∼281 kb. This distance was essentially the maximum distanceobserved for any interaction in the human MHC-II locus.In sharp contrast to the B cell CTCF architecture was that of the
plasmablast/plasma cells (Fig. 8B). In plasma cells, MHC-II locusborder interactions favored C2 and C17, with no interactions withC1. Other interactions throughout the locus were missing orunique to this cell type as well. Instead of four major compart-ments, there were only three. On one end of the locus, the H2-Oa,Brd2, and H2-DM genes were grouped into a single compartment,
FIGURE 6. CTCF sites interact with MHC-II gene promoter regions in
a manner that is coincident with MHC-II gene activity. (A) A schematic of
the H2-Ab1, Aa, and Eb1 classical MHC-II gene region is shown with all
BglII sites indicated as vertical marks. The positions of key CTCF sites
surrounding the region are indicated by small black boxes. C13 had no
detectable CTCF binding (Fig. 2) and is colored gray. (B) BglII-based 3C
assays using the promoter regions (containing the XY box elements) as
anchors were performed to determine the relative interaction frequencies
between the indicated CTCF sites and their neighboring MHC-II gene
promoter region restriction fragments (as indicated) in C57BL/6 splenic B
cells (MHC-II and CIITA-positive) and P3X (MHC-II and CIITA-negative)
cells. 3C assays were performed three times from independent chromatin
and cell preparations. All peaks in the B cell 3C assays were statistically
significant.
3932 CTCF ARCHITECTURE OF THE MURINE MHC-II LOCUS
by guest on March 29, 2018
http://ww
w.jim
munol.org/
Dow
nloaded from
as the interaction with C5, which segregates the B cell CTCFcompartments 1 and 2, was missing. The Tap and PSMB geneswere still located in a single compartment, but unlike in theB cells, this plasma cell–specific compartment no longer includedH2-Ob. This was due to new interactions using C11, which residesbetween Tap2 and H2-Ob, with the other interacting CTCF sites
(C2, C6, C9, and C17) and a loss of interactions with C12. Thethird plasma cell compartment clustered H2-Ob and all of theclassical MHC-II genes together in a single compartment withno additional CTCF interactions subdividing the subregion. Themechanism for the changes in compartments correlates directlywith the overall occupancy levels of CTCF. In the plasma cells,
FIGURE 7. Ectopic expression of CIITA in P3X plasma
cells restores MHC-II expression, but does not fully induce
the CTCF architecture observed in B cells. (A) Flow
cytometry panels depicting the surface expression of
MHC-II gene expression from three independent CIITA
stably transfected P3X cell lines (S1, S2, and S3). A20 and
P3X cells were used as positive and negative controls,
respectively. (B) BglII-based 3C assays designed to ob-
serve CTCF–promoter interactions were performed as in
Fig. 6 on the CIITA-complemented P3X cells using 3C
anchors at the promoters of I-Ab, I-Aa, and I-Eb1. Inter-
actions were assessed only at CTCF sites C11–C17. (C)
EcoRI-based 3C assays were conducted in CIITA-com-
plemented P3X cells as above using C11, C12, C15, and
C17 as anchors. Filled and open bars indicate cross-linked
(C) and non–cross-linked (NC) samples, respectively. All
3C assays were performed three times from independent
chromatin preparations and cultures. Significant 3C values
are indicated (*p , 0.05).
FIGURE 8. Circos plot of 3C interactions among CTCF
sites and MHC-II promoters in both MHC-II–expressing
and nonexpressing cells. Results obtained from 3C inter-
actions were summarized into four Circos plots (50) with
a schematic of the relevant region of the MHC-II locus
shown. CTCF-binding sites are indicated by black lines and
numbered accordingly. (A) CTCF–CTCF interaction data
from B cells are presented. Blue line connections show the
CTCF–CTCF interactions across the locus, whereas the
maroon lines indicate the interactions of C15. (B) CTCF–
CTCF site interaction data from P3X cells with lilac lines
representing the interactions. Yellow background shading
in (A) and (B) highlights the higher-order domains identi-
fied in each cell type. (C) CTCF–MHC-II promoter inter-
actions in B cells are shown for the classical MHC-II
genes. Yellow boxes represent the position of the WXY
box regions. (D) CTCF–CTCF and CTCF–MHC-II pro-
moter interactions for the classical MHC-II genes are
shown in P3X cells that have been complemented with
a CIITA expression vector. The lines/interactions in (D) use
the same coloring scheme as (B) and (C).
The Journal of Immunology 3933
by guest on March 29, 2018
http://ww
w.jim
munol.org/
Dow
nloaded from
CTCF binding at C1, C5, and C12 is greatly reduced comparedwith B cells. It should be noted that CTCF occupancy in P3X cellsand LPS-induced plasmablasts was similar to each other, andimportantly, overall CTCF protein and RNA levels were similarbetween the B cells and the plasma cells. This suggests that theloss of CTCF binding reflects a cell fate decision and locus-specific effect and not a general loss of CTCF in the cell. Asidefrom DNA sequence, the differential in CTCF occupancy is likelydue to changes in accessibility of the site to CTCF. Accessibility atthese regions could be controlled/regulated by epigenetic mech-anisms such as DNA methylation or repressive histone mod-ifications.Of the CTCF sites, C15 was distinct from the others in that it did
not interact across the entire locus, but instead formed local in-teractions with the CTCF sites within the MHC-II subregion. Onereason for this could be that C15 bound modest levels of CTCFcompared with the other sites. CTCF binding to C15 was alsoabsent in plasma cells. C15 was considered an important sitebecause its location (between H2-Eb1 and H2-Aa) was similar tothat of XL9, the first MHC-II insulator discovered (24). XL9resides between HLA-DRB1 and HLA-DQA1 and is important fortheir activity. Like XL9, C15 appears to function in an analogousmanner by interacting with neighboring CTCF sites and with thepromoters of its flanking genes.For the three expressed MHC-II gene promoters (H2-Eb1, -Aa,
and -Ab1), interactions with local CTCF sites were observed inB cells. Like the human system, the mouse MHC-II gene pro-moters could interact with more than one CTCF site. For H2-Ab1and H2-Eb1, the 3C data suggest that there is no preference forwhich site is chosen. H2-Aa, which resides in the middle of theMHC-II subregion, showed an equal preference for the adjacentCTCF sites but could also interact with C12 to some extent. Thus,we propose that the choice of which CTCF site to interact withmay be availability of a free CTCF protein rather than proximityto one site or the other. This conclusion is supported by the ex-periments in which CIITA was ectopically expressed in the P3Xcell line. In addition to inducing the MHC-II genes to a high level,the presence of CIITA resulted in establishment of MHC-II pro-moter–CTCF site interactions. With the exception of a modestlevel of MHC-II promoter–C12 interactions, the strongest inter-actions were with C11 and C17, sites that displayed the highestlevel of CTCF occupancy in P3X cells. We speculate that C12may be more accessible than the other regions and thus, during thereintroduction of CIITA, can be occupied in some of the cells andcontribute to the interactions and architecture of the locus thatwere observed. The presence of CIITA–CTCF interactions maystabilize or contribute to the occupancy of C12 in this experi-mental system. Intriguingly, MHC-II promoters did not interactwith C11 or C17 in B cells, even though CTCF was present at highlevels. Together, these data indicate that the MHC-II promoterscan interact with CTCF sites that are further away, but support theproposed availability model.The 3C data suggest that interactions across the locus may
form a number of architectures, including a complex rosette-likestructure with all of the CTCF-interacting sites forming a cen-tral hub. For such a structure to form, multiple CTCF–CTCF in-teractions must take place per site. A CTCF hub/rosette coupledwith the additional CIITA-mediated promoter loops is appealingin that it could allow specific transcription machinery for the Ag-processing pathway genes to be highly concentrated, which wouldpresumably allow for high levels of transcription initiation. Al-ternatively, it is possible that each CTCF site interacts witha single additional site. Such architecture would introduce con-siderable heterogeneity among chromosomes within each cell and
within the population of cells. If the CTCF–CTCF interactionsserve to limit gene expression to genes within a single regulatory-loop, dysregulation of some genes could occur through someCTCF–CTCF interactions. For example, if the constitutive Tap2gene promoter regulatory mechanism was in the same loop as theI-A genes, expression of the I-A genes might occur in all cellscontaining that loop. Considering this scenario, perhaps it is forthis reason that both the B cell and the plasma cell architecturecordoned off the Tap and PSMB genes in their own compartment.Thus, it is likely that CTCF–CTCF interactions and compartmentsserve several purposes. The first is to prevent dysregulation ofneighboring genes in non-APCs. The second is to provide readyand available access of CTCF to MHC-II promoters when CIITAis bound. Together, these interactions could lead to a high con-centration of coordinately regulated gene promoters in definednuclear spaces that could increase the efficiency of transcriptionfactor binding and transcription initiation in APCs.
AcknowledgmentsWe thank Joshua Lee and Royce Butler for excellent technical assistance
and the members of the J.M. Boss laboratory for critical comments on
the manuscript. We also thank Benjamin Barwick for the genomePlots R
scripts.
DisclosuresThe authors have no financial conflicts of interest.
References1. Steinmetz, M., K. Minard, S. Horvath, J. McNicholas, J. Srelinger, C. Wake,
E. Long, B. Mach, and L. Hood. 1982. A molecular map of the immune responseregion from the major histocompatibility complex of the mouse. Nature 300: 35–42.
2. Hood, L., M. Steinmetz, and R. Goodenow. 1982. Genes of the major histo-compatibility complex. Cell 28: 685–687.
3. Dembic, Z., M. Ayane, J. Klein, M. Steinmetz, C. O. Benoist, and D. J. Mathis.1985. Inbred and wild mice carry identical deletions in their E alpha MHC genes.EMBO J. 4: 127–131.
4. Le Bouteiller, P. 1994. HLA class I chromosomal region, genes, and products:facts and questions. Crit. Rev. Immunol. 14: 89–129.
5. Boss, J. M., and P. E. Jensen. 2003. Transcriptional regulation of the MHC classII antigen presentation pathway. Curr. Opin. Immunol. 15: 105–111.
6. Choi, N. M., P. Majumder, and J. M. Boss. 2010. Regulation of major histo-compatibility complex class II genes. Curr. Opin. Immunol. 23: 81–87.
7. Reith, W., and B. Mach. 2001. The bare lymphocyte syndrome and the regulationof MHC expression. Annu. Rev. Immunol. 19: 331–373.
8. Ting, J. P., and J. Trowsdale. 2002. Genetic control of MHC class II expression.Cell 109(Suppl): S21–S33.
9. Boss, J. M., and J. L. Strominger. 1986. Regulation of a transfected human classII major histocompatibility complex gene in human fibroblasts. Proc. Natl. Acad.Sci. USA 83: 9139–9143.
10. Dorn, A., B. Durand, C. Marfing, M. Le Meur, C. Benoist, and D. Mathis. 1987.Conserved major histocompatibility complex class II boxes–X and Y–are tran-scriptional control elements and specifically bind nuclear proteins. Proc. Natl.Acad. Sci. USA 84: 6249–6253.
11. Reith, W., S. Satola, C. Herreo-Sanchez, I. Amaldi, B. Lisowska-Grospierre,C. Griscelli, M. R. Hadam, and B. Mach. 1988. Congenital immunodeficiencywith a regulatory defect in MHC class II gene expression lacks a specific HLA-DR promoter binding protein, RF-X. Cell 53: 897–906.
12. Moreno, C. S., G. W. Beresford, P. Louis-Plence, A. C. Morris, and J. M. Boss.1999. CREB regulates MHC class II expression in a CIITA-dependent manner.Immunity 10: 143–151.
13. Dorn, A., J. Bollekens, A. Staub, C. Benoist, and D. Mathis. 1987. A multiplicityof CCAAT box-binding proteins. Cell 50: 863–872.
14. Louis-Plence, P., C. S. Moreno, and J. M. Boss. 1997. Formation of a regulatoryfactor X/X2 box-binding protein/nuclear factor-Y multiprotein complex on theconserved regulatory regions of HLA class II genes. J. Immunol. 159: 3899–3909.
15. Steimle, V., L. A. Otten, M. Zufferey, and B. Mach. 1993. Complementationcloning of an MHC class II transactivator mutated in hereditary MHC class IIdeficiency (or bare lymphocyte syndrome). Cell 75: 135–146.
16. Beresford, G. W., and J. M. Boss. 2001. CIITA coordinates multiple histoneacetylation modifications at the HLA-DRA promoter. Nat. Immunol. 2: 652–657.
17. Masternak, K., A. Muhlethaler-Mottet, J. Villard, M. Zufferey, V. Steimle, andW. Reith. 2000. CIITA is a transcriptional coactivator that is recruited to MHCclass II promoters by multiple synergistic interactions with an enhanceosomecomplex. Genes Dev. 14: 1156–1166.
3934 CTCF ARCHITECTURE OF THE MURINE MHC-II LOCUS
by guest on March 29, 2018
http://ww
w.jim
munol.org/
Dow
nloaded from
18. Masternak, K., N. Peyraud, M. Krawczyk, E. Barras, and W. Reith. 2003.Chromatin remodeling and extragenic transcription at the MHC class II locuscontrol region. Nat. Immunol. 4: 132–137.
19. Choi, N. M., and J. M. Boss. 2012. Multiple histone methyl and acetyltransferasecomplex components bind the HLA-DRA gene. PLoS ONE 7: e37554.
20. West, A. G., S. Huang, M. Gaszner, M. D. Litt, and G. Felsenfeld. 2004. Re-cruitment of histone modifications by USF proteins at a vertebrate barrier ele-ment. Mol. Cell 16: 453–463.
21. Labrador, M., and V. G. Corces. 2002. Setting the boundaries of chromatindomains and nuclear organization. Cell 111: 151–154.
22. Hou, C., H. Zhao, K. Tanimoto, and A. Dean. 2008. CTCF-dependent enhancer-blocking by alternative chromatin loop formation. Proc. Natl. Acad. Sci. USA105: 20398–20403.
23. Majumder, P., J. A. Gomez, B. P. Chadwick, and J. M. Boss. 2008. The insulatorfactor CTCF controls MHC class II gene expression and is required for theformation of long-distance chromatin interactions. J. Exp. Med. 205: 785–798.
24. Majumder, P., J. A. Gomez, and J. M. Boss. 2006. The human major histo-compatibility complex class II HLA-DRB1 and HLA-DQA1 genes are separatedby a CTCF-binding enhancer-blocking element. J. Biol. Chem. 281: 18435–18443.
25. Chang, C.-H., W. L. Fodor, and R. A. Flavell. 1992. Reactivation of a majorhistocompatibility complex class II gene in mouse plasmacytoma cells andmouse T cells. J. Exp. Med. 176: 1465–1469.
26. Piskurich, J. F., K. I. Lin, Y. Lin, Y. Wang, J. P. Ting, and K. Calame. 2000.BLIMP-I mediates extinction of major histocompatibility class II transactivatorexpression in plasma cells. Nat. Immunol. 1: 526–532.
27. Yoon, H. S., C. D. Scharer, P. Majumder, C. W. Davis, R. Butler, W. Zinzow-Kramer, I. Skountzou, D. G. Koutsonanos, R. Ahmed, and J. M. Boss. 2012.ZBTB32 is an early repressor of the CIITA and MHC class II gene expressionduring B cell differentiation to plasma cells. J. Immunol. 189: 2393–2403.
28. Dekker, J., K. Rippe, M. Dekker, and N. Kleckner. 2002. Capturing chromosomeconformation. Science 295: 1306–1311.
29. Majumder, P., and J. M. Boss. 2011. DNA methylation dysregulates and silencesthe HLA-DQ locus by altering chromatin architecture. Genes Immun. 12: 291–299.
30. Majumder, P., and J. M. Boss. 2010. CTCF controls the expression and thechromatin architecture of the human major histocompatibility complex class IIlocus. Mol. Cell. Biol. 30: 4211–4223.
31. Langmead, B., C. Trapnell, M. Pop, and S. L. Salzberg. 2009. Ultrafast andmemory-efficient alignment of short DNA sequences to the human genome.Genome Biol. 10: R25.
32. Heinz, S., C. Benner, N. Spann, E. Bertolino, Y. C. Lin, P. Laslo, J. X. Cheng,C. Murre, H. Singh, and C. K. Glass. 2010. Simple combinations of lineage-determining transcription factors prime cis-regulatory elements required formacrophage and B cell identities. Mol. Cell 38: 576–589.
33. Quinlan, A. R., and I. M. Hall. 2010. BEDTools: a flexible suite of utilities forcomparing genomic features. Bioinformatics 26: 841–842.
34. Tolhuis, B., R. J. Palstra, E. Splinter, F. Grosveld, and W. de Laat. 2002. Loopingand interaction between hypersensitive sites in the active beta-globin locus. Mol.Cell 10: 1453–1465.
35. Majumder, P., and J. M. Boss. 2011. Cohesin Regulates MHC Class II Genesthrough Interactions with MHC Class II Insulators. J. Immunol. 187: 4236–4244.
36. Nutt, S. L., N. Taubenheim, J. Hasbold, L. M. Corcoran, and P. D. Hodgkin.2011. The genetic network controlling plasma cell differentiation. Semin.Immunol. 23: 341–349.
37. Parelho, V., S. Hadjur, M. Spivakov, M. Leleu, S. Sauer, H. C. Gregson,A. Jarmuz, C. Canzonetta, Z. Webster, T. Nesterova, et al. 2008. Cohesinsfunctionally associate with CTCF on mammalian chromosome arms. Cell 132:422–433.
38. Chen, H., Y. Tian, W. Shu, X. Bo, and S. Wang. 2012. Comprehensive identi-fication and annotation of cell type-specific and ubiquitous CTCF-binding sitesin the human genome. PLoS ONE 7: e41374.
39. Kim, T. H., Z. K. Abdullaev, A. D. Smith, K. A. Ching, D. I. Loukinov,R. D. Green, M. Q. Zhang, V. V. Lobanenkov, and B. Ren. 2007. Analysis of thevertebrate insulator protein CTCF-binding sites in the human genome. Cell 128:1231–1245.
40. Wang, H., M. T. Maurano, H. Qu, K. E. Varley, J. Gertz, F. Pauli, K. Lee,T. Canfield, M. Weaver, R. Sandstrom, et al. 2012. Widespread plasticity inCTCF occupancy linked to DNA methylation. Genome Res. 22: 1680–1688.
41. The ENCODE Project Consortium. 2011. A user’s guide to the encyclopedia ofDNA elements (ENCODE). PLoS Biol. 9: e1001046.
42. Cheung, M. S., T. A. Down, I. Latorre, and J. Ahringer. 2011. Systematic bias inhigh-throughput sequencing data and its correction by BEADS. Nucleic AcidsRes. 39: e103.
43. Benjamini, Y., and T. P. Speed. 2012. Summarizing and correcting the GCcontent bias in high-throughput sequencing. Nucleic Acids Res. 40: e72.
44. Bartkuhn, M., and R. Renkawitz. 2008. Long range chromatin interactions in-volved in gene regulation. Biochim. Biophys. Acta 1783: 2161–2166.
45. Pant, V., S. Kurukuti, E. Pugacheva, S. Shamsuddin, P. Mariano, R. Renkawitz,E. Klenova, V. Lobanenkov, and R. Ohlsson. 2004. Mutation of a single CTCFtarget site within the H19 imprinting control region leads to loss of Igf2 im-printing and complex patterns of de novo methylation upon maternal inheritance.Mol. Cell. Biol. 24: 3497–3504.
46. Dekker, J. 2006. The three ‘C’ s of chromosome conformation capture: controls,controls, controls. Nat. Methods 3: 17–21.
47. Simonis, M., J. Kooren, and W. de Laat. 2007. An evaluation of 3C-basedmethods to capture DNA interactions. Nat. Methods 4: 895–901.
48. Barski, A., S. Cuddapah, K. Cui, T. Y. Roh, D. E. Schones, Z. Wang, G. Wei,I. Chepelev, and K. Zhao. 2007. High-resolution profiling of histone methyl-ations in the human genome. Cell 129: 823–837.
49. Nikolic, T., D. Movita, M. E. Lambers, C. R. de Almeida, P. Biesta, K. Kreefft,M. J. de Bruijn, I. Bergen, N. Galjart, A. Boonstra, and R. Hendriks. 2014. TheDNA-binding factor Ctcf critically controls gene expression in macrophages.Cell. Mol. Immunol. 11: 58–70.
50. Krzywinski, M., J. Schein, I. Birol, J. Connors, R. Gascoyne, D. Horsman,S. J. Jones, and M. A. Marra. 2009. Circos: an information aesthetic for com-parative genomics. Genome Res. 19: 1639–1645.
51. Machanick, P., and T. L. Bailey. 2011. MEME-ChIP: motif analysis of largeDNA datasets. Bioinformatics 27: 1696–1697.
The Journal of Immunology 3935
by guest on March 29, 2018
http://ww
w.jim
munol.org/
Dow
nloaded from

![MHC-GTR66H/GTR88 · 2020. 3. 25. · model name [MHC-GTR88] [4-165-654-71 (1)] GB. 3. filename[D:\SONY 2010\MHC-GTR66H\MHC-GTR66H\PT-BR080ADD.fm] masterpage:Left. Especificações](https://img.pdfslide.us/doc/110x75/6082b9df98ee084912593c99/mhc-gtr66hgtr88-2020-3-25-model-name-mhc-gtr88-4-165-654-71-1-gb-3.jpg)