Embed Size (px)
Citation preview

1
SCHOOL OF ENGINEERING AND INFORMATION TECHNOLOGY
MURDOCH UNIVERSITY SCIENCE
AND COMPUTING BUILDING
ENERGY SIMULATION &
MECHANICAL ENGINEERING
GREEN BUILDING DESIGN
ENG470 ENGINEERING HONOURS THESIS FINAL
REPORT
YI XIN YAW
BACHELOR OF ENVIRONMENTAL ENGINEERING
UNIT COORDINATOR: PROFESSOR PARISA ARABZADEH BAHRI
SUPERVISOR: DR MARTIN ANDA,
ACADEMIC CHAIR OF ENVIRONMENTAL ENGINEERING

2
EXECUTIVE SUMMARY
Anchored in teaching, research and community engagement approaches,
Murdoch University is setting up the development of a symbolic new mixed use
campus precinct expansion which is listed as one of Murdoch University’s strategic
plan. As stated above, a part of the strategic plan includes the development of a new
Mechanical Engineering Building (MEB) in order to engage future Mechanical
Engineering students. This newly proposed MEB would be designed and constructed as
an extension building from the existing Science and Computing Building that is located
at the Murdoch South Street campus. Hence, the major focus of this research study
investigate the new Murdoch University Mechanical Engineering green building
structure and design by analysing the energy consumption of the existing Science and
Computing building.
The annual energy consumption of the existing building is obtained through the
identification of construction materials, building design and building operational
activities. All this information is then simulated using Virtual Environment by
Integrated Environmental Solutions (IES-VE). The outline of this IES-VE modelling tool
and implementation procedures is illustrated in Chapter 3 (Methodology) and the
simulation results used to identify the major sources of the energy use are included in
Chapter 4 (Results). The results showed the massive energy consumption that being
used in the current Science and Computing building and the annual energy
consumption is broken down into different components that makes up the total
energy use.Moreover, the possibilities for building energy consumption reduction are
discussed and this is based on the low embodied energy building materials and low
existing building operational energy reduction strategies.

3
For the sake of achieving green star building standard, NABERS self rating tools
are introduced by determining the building operational routines and its design
structure. The existing building’s NABERS score will be recognised as a useful measure
for the new MEB design ideas and the selection of appliances used in order to achieve
the low energy building objectives.
Furthermore, the structure and design of the new MEB are drafted based on
the essential requirements using SketchUp drawing tool. The dimensions and working
purpose of each individual floor are illustrated and reviewed. On the other hand, basic
specifications of the MEB such as experimentation and research laboratory
requirements, computer appliances and HVAC demands are determined in order to
diagnose the NABERS rating and thus establish a new target for green building
achievement. The estimated new building energy consumption is generated and
possible strategies which include energy efficiency design, energy efficient
technologies and renewable technologies are discussed in Chapter 5.
Generally, a green building is achieved through an integration of energy
efficient programs and environmentally friendly construction projects. Thus, an
introduction of potential sustainable strategies is illustrated in Chapter 6 in order to
develop Murdoch University into a carbon-neutral community. The potential
sustainable strategies that are discussed in this thesis project included rainwater
harvesting technology, wastewater treatment plants, timber prefabricated
construction and green roof garden implementation. Lastly, project summary is
included in Chapter 6 (Conclusion) and several recommendations are discussed that
would be important to be evaluated and discussed for further improvement.

4
ACKNOWLEDGEMENT
I would like to acknowledge Dr. Martin Anda of Murdoch University; Mr Matthew
Young, Associate Director of Commercial & Project Services; Mr Andrew Haning,
Murdoch University Manager Energy; Mr Peter Carter, Murdoch University Corporate
Information Coordinator; and Mr Gary Higgins, Murdoch University General Manager
Assets and Maintenance who made this work possible with their support throughout
the course of this project.
5
GLOSSARY
Building monitoring systems or Building Management System (BMS): includes
strategies and policies for analysis and improvement. The building monitoring system
is an automated system that checks on the engineering duties, security and other
building systems for the purpose of documentation, reporting and operational
organisation of systems to maximise protection, security, operational work as well as
total cost minimisation and efficiency (Property Council of Australia, Sustainable
Development Guide 2001).
Embodied energy: The non-renewable energy consumed through the acquisition of
raw materials, their assembly processes, manufacturing, transportation to site and
construction processes. (Corus Construction Centre Glossary 2015).
Emissions: The release of greenhouse gases into the atmosphere.
Energy efficiency (general): The quantity and quality of valuable work that can be
carried out by an energy using structure per unit of energy consumption. It is usually
described as a ratio of useful energy output to energy input. A piece of device or
system is interpreted as more energy efficient to the level that it performs more
functional effort for the same energy consumption, or else achieve the same quantity
of useful work for less energy consumption.
Energy performance: Quantifiable results relating to energy use and consumption. The
phrase includes energy effectiveness, energy intensity, energy management, fuel
option and greenhouse gas emissions resulting directly and indirectly from energy use.

6
Green Building: The structural and operational processes which are environmentally
acceptable and resource-efficient throughout the whole building's life-cycle which
includes construction, operation, maintenance, renovation and demolition.
Greenhouse gases: The atmospheric gases that contributes to climate change and
global warming. The major greenhouse gases are carbon dioxide (CO2), methane (CH4),
nitrous oxide (N20), hydrofluorocarbons (HFCs), perfluorocarbons (PFCs) and sulphur
hexafluoride (SF6).
Groundwater: The body of water in the soil and this includes all pores of which are
saturated with water. If the body of water is present at all times it represents
permanent or true groundwater according to AS/NZS 1547:2000 On-site domestic
wastewater management.
Irrigation: The distribution of effluent into the topsoil by a shallow subsurface or
covered surface drip irrigation system, a shallow subsurface LPED irrigation system or
an above ground spray irrigation system.
Photovoltaic: Generating electricity from the sunlight using photocells. (Property
Council of Australia, Sustainable Development Guide 2001).
Recycled material: Disposed materials that are diverted or separated from the waste
stream. They are re-established as material feedstock and processed into marketed
end products. (Property Council of Australia, Sustainable Development Guide 2001).
11
LIST OF NOMENCLATURE AND ABBREVIATIONS
NABERS: National Australian Built Environment Rating Systems
GBCA: Green Building Council of Australia
HVAC: Heating, Ventilation, and Air Conditioning
KWh: Kilowatt hour
MWh: Megawatt hour
MJ: Megajoule
WA: Western Australia
CLT: Cross Laminated Timber
BMS: Building Management System

11
Table of Contents EXECUTIVE SUMMARY ................................................................................................................................ 2
ACKNOWLEDGEMENT ................................................................................................................................ 4
GLOSSARY .................................................................................................................................................. 5
LIST OF NOMENCLATURE AND ABBREVIATIONS ....................................................................................... 11
TABLE OF CONTENTS ................................................................................................................................ 11
CHAPTER 1: INTRODUCTION ..................................................................................................................... 13
1.1 PROJECT AIM ......................................................................................................................................... 13
1.2 BACKGROUND ....................................................................................................................................... 13
1.3 PROJECT SCOPE ..................................................................................................................................... 18
1.4 OBJECTIVES ........................................................................................................................................... 21
1.5 STRUCTURE OF PROJECT ........................................................................................................................ 23
CHAPTER 2: LITERATURE REVIEW .............................................................................................................. 25
CHAPTER 3: METHODOLOGY ..................................................................................................................... 30
3.1 ENERGY SIMULATION USING IES-VE MODELLING TOOL ........................................................................ 31
3.1.1 INTRODUCTION TO THE IES-VE MODELLING TOOL ....................................................................... 32
3.1.2 VIRTUAL ENVIRONMENT MODULES AND COMPONENTS ............................................................. 33
3.1.3 IES-VE MODELLING TOOL IMPLEMENTATION PROCEDURES ......................................................... 34
3.1.4 INPUT INFORMATION FOR THE EXISTING BUILDING ENERGY SIMULATION ................................. 40
3.1.5 EXISTING BUILDING IN 3D VIEW FROM IES-VE MODELLING TOOL ................................................. 40
3.2 INTRODUCTION TO NABERS RATING TOOL ............................................................................................ 41
3.2.1 NABERS ASSESSMENT DESCRIPTION .............................................................................................. 43
3.2.2 THE SCIENCE AND COMPUTING BUILDING INPUT DATA FOR NABERS RATING ............................. 43
3.2.3 THE NEW BUILDING DESIGN INPUT DATA FOR NABERS RATING ................................................... 45
3.3 INTRODUCTION TO SKETCHUP PROGRAMME ....................................................................................... 46
3.3.1 SKETCHUP MODELLING TOOL DRAWING PROCESS ....................................................................... 47
CHAPTER 4: RESULTS ................................................................................................................................. 49
4.1 RESULTS OF THE EXISTING BUILDING ENERGY SIMULATION BY USING IES-VE ...................................... 49
4.1.1 RESULTS OF THE TOTAL NATURAL GAS CONSUMPTION IN THE SCIENCE AND
COMPUTING BUILDING .......................................................................................................................... 50
4.1.2 RESULTS OF THE TOTAL ELECTRICITY CONSUMPTION IN THE EXISTING BUILDING ....................... 51
4.1.3 RESULTS OF THE TOTAL ENERGY CONSUMPTION IN THE EXISTING BUILDING ............................. 52
4.1.4 ANNUAL HVAC CONSUMPTION ..................................................................................................... 53

12
4.2 NABERS RATING CALCULATOR RESULTS ................................................................................................ 58
4.2.1 THE SCIENCE AND COMPUTING BUILDING NABERS RATING SCORE ............................................. 59
4.2.2 THE ESTIMATED ENERGY CONSUMPTION FOR THE NEW BUILDING WITH SAME DESIGN AND
ENERGY PERFORMANCE AS THE EXISTING BUILDING ............................................................................. 61
4.2.3 THE ESTIMATED ENERGY CONSUMPTION FOR THE NEW BUILDING WITH NABERS RATINGS 4, 5
AND 6 ...................................................................................................................................................... 62
4.3 FINAL RESULTS OF MECHANICAL ENGINEERING BUILDING 3D ............................................................. 63
DRAWINGS .................................................................................................................................................. 63
CHAPTER 5: DISCUSSION ........................................................................................................................... 64
5.1 DISCUSSION OF THE BUILDING ENERGY SIMULATION USING IES-VE MODELING TOOL ................ 64
5.1.1 LOW EXISTING BUILDING EMBODIED ENERGY BUILDING MATERIALS INVESTIGATION................ 67
5.1.2 SCIENCE AND COMPUTING BUILDING OPERATIONAL ENERGY REDUCTION STRATEGIES ............. 73
5.2 DISCUSSION ON THE NABERS RATING TOOLS - LOW ENERGY BUILDING PROPOSED STRATEGIES ........ 79
5.2.1 ENERGY EFFICIENCY DESIGN .......................................................................................................... 79
5.2.2 ENERGY EFFICIENT TECHNOLOGIES ............................................................................................... 81
5.2.3 RENEWABLE ENERGIES .................................................................................................................. 82
5.3 DISCUSSION ON THE MECHANICAL ENGINEERING BUILDING STRUCTURE DESIGN AND
MEASUREMENTS ........................................................................................................................................ 85
5.3.1 GROUND FLOOR OF THE BUILDING ............................................................................................... 87
5.3.1 1ST FLOOR OF THE BUILDING ........................................................................................................ 92
5.3.2 2ND Floor of the Building .............................................................................................................. 92
5.3.3 3RD Floor of the Building ............................................................................................................... 92
CHAPTER 6: NEW BUILDING INTEGRATION STRATEGIES REVIEW .............................................................. 93
6.1 RAINWATER HARVESTING FOR LABORATORY PURPOSE ....................................................................... 95
6.2 WASTEWATER TREATMENT PLANT ....................................................................................................... 96
6.3 TIMBER PREFABRICATED CONSTRUCTION ............................................................................................ 97
6.4 GREEN ROOF GARDEN ......................................................................................................................... 100
CHAPTER 7: CONCLUSION ....................................................................................................................... 102
CHAPTER 8: RECOMMENDATION AND FUTURE WORK ........................................................................... 104
REFERENCES ........................................................................................................................................... 105
APPENDICES ........................................................................................................................................... 116
CASE STUDIES ......................................................................................................................................... 125
PROJECT OVERVIEW FOR GREENSKILLS BUILDING .................................................................................... 125

13
TABLE 1: THE VIRTUAL ENVIRONMENT MODULES AND COMPONENTS. ........................................................... 33
TABLE 2: INPUT INFORMATION FOR THE SCIENCE AND COMPUTING BUILDING ENERGY SIMULATION. .................. 40
TABLE 3: IMPORTANT INFORMATION AND DESCRIPTION BASED ON DIFFERENT CATEGORIES IN THE EXISTING BUILDING
................................................................................................................................................. 41
TABLE 4: DESCRIPTION OF NABERS ASSESSMENT (ADAPTED FROM NABERS 2014). ..................................... 43
TABLE 5: OTHER IMPORTANT INFORMATION FROM THE SCIENCE AND COMPUTING BUILDING FOR ..................... 44
TABLE 6: THE ENERGY DATA INPUT FROM THE SCIENCE AND COMPUTING BUILDING. ....................................... 44
TABLE 7: INPUT INFORMATION OF THE NEW MEB THAT IS USED IN NABERS RATING. ..................................... 45
TABLE 8: RESULTS OF THE TOTAL NATURAL GAS CONSUMPTION IN THE SCIENCE AND COMPUTING BUILDING WHICH
SIMULATED THROUGH IES-VE PROGRAM. ........................................................................................ 50
TABLE 9: RESULTS OF THE TOTAL ELECTRICITY CONSUMPTION WHICH EXCLUDED THE LIGHTING CONSUMPTION IN THE
SCIENCE AND COMPUTING BUILDING AND SIMULATED THROUGH IES-VE MODELING SYSTEM ................... 51
TABLE 10: THE RESULTS OF THE TOTAL ENERGY CONSUMPTION IN THE EXISTING BUILDING WHICH SIMULATED
THROUGH IES-VE PROGRAM. ......................................................................................................... 52
TABLE 11: THE RESULTS OF THE ANNUAL BOILER LOAD IN THE SCIENCE AND COMPUTING BUILDING WHICH
SIMULATED THROUGH IES-VE MODELING SYSTEM. ............................................................................ 54
TABLE 12: THE RESULT OF THE ANNUAL CHILLER LOAD IN THE SCIENCE AND COMPUTING BUILDING WHICH
SIMULATED THROUGH IES-VE MODELING TOOL ................................................................................. 56
TABLE 13: THE ESTIMATED ENERGY CONSUMPTION FOR NEW BUILDING BASED ON THE SAME DESIGN AND ENERGY
PERFORMANCE AS THE EXISTING BUILDING. ....................................................................................... 61
TABLE 14: THE ESTIMATED ENERGY CONSUMPTION FOR THE NEW MECHANICAL ENGINEERING BUILDING IN ORDER
TO ACHIEVE NABERS RATINGS 4, 5 AND 6. ...................................................................................... 62
TABLE 15: THE BUILDING MATERIAL TYPES AND THEIR ASSOCIATED U-VALUE. ................................................. 66
TABLE 16: THE EXISTING BUILDING MATERIALS AND RECOMMENDED LOW ENERGY BUILDING MATERIALS ............ 67
TABLE 17: AUSTRALIAN AVERAGE ENERGY INTENSITY TRENDS BY BUILDING TYPES, 1999-2020 (DEPARTMENT OF
CLIMATE CHANGE AND ENERGY EFFICIENCY 2015). ........................................................................... 73
TABLE 18: MEASUREMENT OF THE NEW MECHANICAL ENGINEERING BUILDING. ............................................ 86
TABLE 19: TOP 10 WORLD-WIDE MECHANICAL ENGINEERING PROGRAMS ..................................................... 88
TABLE 20: COMPARISON OF CLT PANELS AND CONVENTIONAL CONCRETE CONSTRUCTION. .............................. 99

11
FIGURE 1 THE EARTH VIEW AERIAL MAP SHOWING THE LOCATION OF MURDOCH UNIVERSITY SOUTH STREET
CAMPUS (ADAPTED FROM GOOGLE EARTH 2015). ............................................................................ 14
FIGURE 2 THE SATELLITE VIEW AERIAL MAP LOCATION OF MURDOCH UNIVERSITY SOUTH STREET CAMPUS (ADAPTED
FROM GOOGLE MAPS 2015) ......................................................................................................... 14
FIGURE 3: THE EXACT LOCATION (SHADED BLUE) OF THE NEWLY PROPOSED MECHANICAL ENGINEERING BUILDING
AT MURDOCH UNIVERSITY SOUTH STREET CAMPUS. .......................................................................... 15
FIGURE 4: THE LOCATION OF THE EXISTING SCIENCE AND COMPUTING BUILDING AT MURDOCH UNIVERSITY
(ADAPTED FROM GOOGLE EARTH 2015). ......................................................................................... 15
FIGURE 5: BENEFITS OF GREEN BUILDING DESIGN. ...................................................................................... 17
FIGURE 6: THE IEC VIRTUAL ENVIRONMENT START-UP PAGE ....................................................................... 34
FIGURE 7: THE APPLICATION SECTION IN THE IES-VE .................................................................................. 35
FIGURE 8: FLOOR PLANS IN DXF FORM WHICH ARE IMPORTED INTO THE IES SOFTWARE. ................................. 36
FIGURE 9: THE DIFFERENTIATION AND DESCRIPTION OF EACH COMPONENT USED IN THE DESIGN OF THE NEW MEB
(A AND M 2015). ........................................................................................................................ 37
FIGURE 10: THE DIFFERENTIATION AND DESCRIPTION OF EACH COMPONENT (A AND M 2015). ........................ 38
FIGURE 11: THE FINAL OUTCOME AFTER ALL THE DATA IS INSERTED INTO THE VIRTUAL ENVIRONMENT SOFTWARE.
................................................................................................................................................. 39
FIGURE 12: THE EXISTING BUILDING OUTPUT IN A 3D VIEW. ........................................................................ 40
FIGURE 13: 3D VIEW OF THE SCIENCE AND COMPUTING BUILDING USING MODELVIEWER. .............................. 40
FIGURE 14: DEMONSTRATION OF THE BASE STRUCTURE DEVELOPMENT. ........................................................ 47
FIGURE 15: DEMONSTRATION OF THE PULLING UP THE SCULPT FUNCTION. .................................................... 48
FIGURE 16: DEMONSTRATION OF THE GROUND FLOOR STRUCTURE. .............................................................. 48
FIGURE 17: TOTAL ANNUAL ENERGY CONSUMPTION IN PIE CHART FORM. ...................................................... 53
FIGURE 18: PEAK DAY LOAD OF BOILER IN THE SCIENCE AND COMPUTING BUILDING ON 2 OF JULY 2015 THAT
SIMULATED THROUGH IES-VE MODELING SYSTEM ............................................................................. 55
FIGURE 19: PEAK DAY LOAD OF THE CHILLER SYSTEM AT THE SCIENCE AND COMPUTING BUILDING ON 18 OF APRIL
2015 WHICH SIMULATED THROUGH IES-VE MODELING SYSTEM .......................................................... 57
FIGURE 20: SCIENCE AND COMPUTING BUILDING’S NABERS RATING SCORE. ................................................. 59
FIGURE 21: FINAL 3D DRAWING OF THE NEW MECHANICAL ENGINEERING BUILDING. ..................................... 63
FIGURE 22: IMAGE OF LIGHTWEIGHT AGGREGATES FROM MASONRY RUBBLE. ................................................. 69
FIGURE 23: (A) SINGLE GLAZING PROPERTIES AND (B) DOUBLE GLAZING PROPERTIES (AUSTRALIAN DOUBLE GLAZING
2015). ....................................................................................................................................... 70
FIGURE 24: EXAMPLE OF PROMPTS (BIN 2012). ....................................................................................... 76

12
FIGURE 25: SCHEMATIC DETAILING OF THE SOLAR ENERGY STORAGE SYSTEM AT JOSH'S HOUSE (SOLAR BALANCE
2015). ....................................................................................................................................... 84
FIGURE 26: MECHANICS OF SOLID LABORATORY IN CURTIN UNIVERSITY........................................................ 90
FIGURE 27: THE 3D DRAWING OF THE NEW BUILDING WITH INTEGRATED SUSTAINABLE STRATEGIES. .................. 94
FIGURE 28: THE CLT LIFECYCLE FORM (LEHMANN ET AL. 2012). ................................................................. 97
FIGURE 29: SCIENCE AND COMPUTING BUILDING LEVEL 1 FLOOR PLAN ....................................................... 116
FIGURE 30: SCIENCE AND COMPUTING BUILDING LEVEL 2 FLOOR PLAN ....................................................... 117
FIGURE 31: SCIENCE AND COMPUTING BUILDING LEVEL 3 FLOOR PLAN. ...................................................... 118
FIGURE 32: EXISTING BUILDING MATERIAL INFORMATION FOR IES-VE SIMULATION. ..................................... 118
FIGURE 33: INPUT INFORMATION (LOCATION) FOR THE EXISTING BUILDING. .............................................. 119
FIGURE 34: INPUT INFORMATION (WEATHER) FOR THE EXISTING BUILDING.. ............................................. 120
FIGURE 35: EXISTING BUILDING SUN PATH DIAGRAM. .............................................................................. 121
FIGURE 36: EXISTING BUILDING WEATHER DATA. ................................................................................... 120
FIGURE 37: EXISTING BUILDING SYSTEMS ENERGY REPORT. ....................................................................... 121
FIGURE 38: ENGAGEMENT METHODS FOR WORKPLACE ENVIRONMENTAL SUSTAINABILITY PROGRAMS ............. 121
FIGURE 39: NABERS REVERSE CALCULATOR RESULT FOR 4 STAR RATINGS. .................................................. 122
FIGURE 40: NABERS REVERSE CALCULATOR RESULT FOR 5 STAR RATINGS. .................................................. 123
FIGURE 41: NABERS REVERSE CALCULATOR RESULT FOR 6 STAR RATINGS. ................................................... 124

13
CHAPTER 1: INTRODUCTION
1.1 PROJECT AIM
To develop a green building concept for the newly proposed School Of Engineering and
Information Technology Mechanical Engineering building.
1.2 BACKGROUND
Murdoch University is a public university based in Perth, Western Australia
which is recognised as one of Australia’s leading research institutions, as more
industries around the world place their belief and resources into projects carried out at
Murdoch University. This connection favours Murdoch’s research candidates and
scientists with the opportunity to make amazing discoveries (Murdoch.edu.au 2015).
Murdoch University has three Australian campuses: South Street campus, Rockingham
campus and Peel campus. The main focus of our green building project will be based
on the South Street campus, which is located 15 km south of the Perth CBD and 8 km
east of Fremantle. South Street campus consists of different facilities, research rooms
and buildings. An Earth view (Figure 1) and Satellite view (Figure 2) aerial map showing
the location of Murdoch South Street campus are provided (Whereis 2011).

14
Figure 1 The Earth view aerial map showing the location of Murdoch University South Street campus (adapted from Google Earth 2015).
Figure 2 The Satellite view aerial map location of Murdoch University South Street campus (adapted from Google Maps 2015)

15
Murdoch University is considering the development of a new Mechanical
Engineering building at the South Street campus which as an extension of the Science
and Computing Building (existing building), which in another words, annual energy
consumption of the Science and Computing building will be identified to used as a
benchmark to develop an energy reduction plans for the future Mechanical
Engineering Building. Therefore, the annual energy consumption of the Science and
Computing Building is identified by using energy simulation modeling tools and thus
design a low energy and green MEB based on those results.
Figure 4: The location of the existing Science and Computing Building at
Murdoch University (adapted from Google Earth 2015).
Figure 3: The exact location (shaded blue) of the newly proposed Mechanical
Engineering Building at Murdoch University South Street campus.

16
A green building, which is also known as green construction or sustainable
building indicates the structure of the building and the building operating process are
environmentally friendly and resource-efficient throughout a building's life-cycle.
Australia is at the leading edge of sustainable building operation by developing green
design, renewable and energy efficient building material implementation and also low
energy practices (Austrade.gov.au 2015). By designing a new Mechanical Engineering
Green building, we can promote the staff and students health as well as improve the
productivity standards and also indirectly lowering GHG emission. This low
environmental impact outcome can be achieved by minimising the use of fossil fuels
which would in turn reduce waste output, mitigates pollution and environmental
degradation (Austrade.gov.au 2015). The benefits of green building are summarised
below (Figure 5).
Moreover, it is a known that green buildings have a low running cost compared
to conventional buildings. As a result, Murdoch University is interested in upgrading
the building and facilities by proposing the new MEB to be more energy and water
efficient, which would greatly reduce the cost of the monthly energy and water bills.

17
The environmental performance of a building is quantified by a precise and
organized mechanism used to measure, rate and evaluate the building’s design and
performance – the NABERS rating tool. NABERS as known as National Australian Built
Environment Rating System is a comprehensive, national, voluntary environmental
rating system that evaluates the energy consumption of a building and its
environmental impact. In order to achieve a wide-ranging green building approach, the
cooperation between stakeholders and the government is crucial along with education
being a significant aspect in conveying the knowledge and understanding among
students.
Figure 5: Benefits of green building design.

18
1.3 PROJECT SCOPE
Working towards achieving Murdoch University’s objective
o The Green Building Program is fundamental to create an environmentally
sustainable community within Murdoch University.
Business benefits
o Significantly reduce costs by minimising energy consumption and waste
production and promote recycling activities.
o Considerably reduce water usage by implementing water efficient appliances
and fixtures.
o Greatly reduce the volume of effluent that goes into the sewer by introducing
wastewater treatment technologies.
o Substantially reduce energy consumption and its negative impacts on our
climate by using alternative renewable resources.
Protect our environment
o Green building is designed to reduce global warming, preserve resources,
improve air and water quality, protects flora and fauna and reduces landfills.
o Provide a comfortable learning environment for the Mechanical Engineering
students in the near future.

20
Enhance Murdoch University’s image
o Environmental stewardship: Universities are expected to be leaders in
conducting, supervising and managing sustainable practices and education.
o Corporate image: Improve reputation by adopting sustainable practices,
attract positive media coverage, improve goodwill and captivate more
students and staff. (The University of Western Australia 2012).

21
1.4 OBJECTIVES
Identify the annual energy consumption of the existing building
The energy sources and consumption by appliances is significant and needs to
be investigated by implementing IES-VE, Integrated Environmental Solution-
Virtual Environment modelling tool in order to set up a new benchmark for
the new green building.
Diagnose the major energy efficiency issues in the existing building By understanding the different types of material used and operating issues,
energy efficiency strategies can be established.
Classify the net energy consumption measures to achieve the green building
guideline
Fulfil the essential requirements for green building standard by getting
familiarised with the mechanisms of NABERS self-rating tool.
Design a green Mechanical Engineering building structure
Recognise the essential services and appliances that are required for
mechanical engineering purposes and outline the building structure.
Propose possible low energy building strategies Review and suggest possible energy efficient strategies by determining the
new green building concept and materials.

22
Integrate green building design and strategies Recommend potential integration strategies such as rain water harvesting,
wastewater treatments, renewable materials for construction and green roof
garden for sustainable community purpose and enhancement of Murdoch
University’s image.

23
1.5 STRUCTURE OF PROJECT
The structure of this study is as follows:
Chapter 2: Literature review is carried out to gain a basic understanding of the
current development of green buildings and gain insights into some of the
well-known eco-architecture projects around the world.
Chapter 3: Introduce the methodology that has been followed in this research
project which includes:-
I. The use of IES-VE modelling tool for existing building energy simulation in
order to get familiarised with the energy sources and consumption.
II. NABERS self-rating tool which is used to identify the major issues of the
building’s energy consumption.
III. 3D drawing tool named SketchUp that is used to outline the structure and
design of the new MEB.
Chapter 4: Results based on the implementation tools described in Chapter 3 which
include:-
I. The energy simulation results of the existing building that was obtained
using the IES-VE modelling tool.
II. Evaluation of the existing building’s environmental performance results
using NABERS rating tool which was also used to calculate the net energy
consumption for the new MEB design.
III. Outcomes of the new building’s 3D drawing by using SketchUp.
24
Chapter 5: Discussion based on all results obtained and described in Chapter 4.
I. Identify major inefficiency issues from the existing building energy use that
was simulated using IES-VE and suggest possible strategies that could be
used to reduce the annual energy consumption.
II. Propose low energy building strategies based on evaluating the NABERS
rating results generated.
III. Review the structure and measurement of the new MEB. The suggested use
of each floor is analysed and summarised.
Chapter 6: Suggestions on potential integration strategies for green building design.
Chapter 7: Summary of the issues that were diagnosed and possible strategies that
could be implemented.
Chapter 8: Record of lessons learnt through this project and other remedial
recommendations that could be useful for further research.

25
CHAPTER 2: LITERATURE REVIEW
Green building is known as environmentally sustainable building. It is
designed, constructed and operated in order to reduce the total environmental
impacts example like greenhouse gases emission that will lead to global warming. A
green building integrates with environmental considerations into every phases of the
building construction and focus on the design, construction, operation and
maintenance phases. (EcoMENA) Elements of green building included a development
of a sustainable site; water conservation and savings purposes; energy efficiency
strategies implementation and resource efficient materials adoption. On top of that,
healthy indoor environmental quality is required to maintain to achieve green
building standard.
With new technologies on the rise, retrofitting older buildings to create
greener and more environmental friendly structures will lead to a range of
environmental, economic and social benefits. For instance, not only can green
buildings reduce waste production, but they can also simultaneously improve air and
water quality. Therefore, designing green buildings for Murdoch University does not
only lead to potential health improvements of university staff and students, but also
reduction of environmental impacts. According to Kibert (2012) and Judelson (2007),
green buildings could be made possible by implementing and practising basic
principles and methodologies for sustainable construction resulting in energy-
efficient, healthy and environmentally friendly construction.
The ever-increasing growth in population and subsequently human

26
consumption may have serious impacts on urban development with regards to
constructing, operating and maintaining buildings. These activities are said to
account for about 40% to 50% of all energy usage and anthropogenic greenhouse
gas emissions globally. One of the key reasons for constructing green public
buildings is to enable constructors to demonstrate innovative sustainable designs
which can reduce energy consumption and greenhouse gas emissions (Deng et al.
2011). One particular case study, which was on a multi-functional green building in
Shanghai Jiao Tong University, emphasised energy systems design and GHG
emission reduction (Deng et al. 2011). Henceforth, the use of green buildings is
becoming an essential phase that must be considered for environmental
sustainability (Asif 2013). Subsequently, studies on different role models like Eco
architects who design sustainable buildings can be carried out in order to gain a
deeper understanding on the structure and requirements that enable buildings to
be classified as ‘green’. Ken Yeang, a Malaysian architect and a famous ecolologist,
has published his initiative on ecomasterplans and ecoarchitecture design. He is also
famous for bioclimatic skyscrapers and sustainable design which were implemented
in various projects in South-East Asia (Hamzah and Yeang 2015). Yeang contributes
greatly towards a sustainable living environment by designing sustainable intensive
buildings, in which he explains extensively about designing high-rise buildings in a
green way, also mentioning some of his concerns on ecological designs.
In Yeang’s design project, the National Singapore library received the highest
accreditation from the Building and Construction community and the Singaporean
government authorities. The objective of the library design is to offer a comfortable
and favourable environment for Singaporeans. Yeang’s proposed idea was to design

27
a Green Library Building that would stand out in that specific region.
The passive design that was integrated in the library included:
Good solar direction and building design
Appropriate natural ventilation structure
Day lighting system improvement
Excellent design for solar facade
Adequate sun shading mechanisms
And application of suitable building colour courts (Culture for Friends 2015).
On the other hand, the roof top garden that was located on top of the
National Singapore library provided a pleasant working and study environment. The
design methodology towards achieving the green building benchmark may have to
cover the all-inclusive concern of smart selection of low energy consumption
building material. Hence, the application of reused and recycled materials would be
favouredFor example, wall fabrics, sustainable timber construction and the use of
carpet to reduce heat loss. The utilisation of these materials as components of a low
impact design would be profitable. These sustainable features were used in tandem
to create a comfortable, low energy consumption and delightful study environment
for all students.
The Solaris building in Singapore designed by Yeang had side glazed-walls at
the ground floor's frontages which are facing a non-air-conditioned area. The Solaris
building has a central hall with glass-window blinds over the hall equipped with
sensors that detects ventilation conditions and automatically make adjustments.
Solaris' roofs are improved to promote biodiversity. The roof structure also delivers

28
an outstanding insulation effect and reduces the sunlight’s radiation into the
building. Most importantly the Solaris building green building design and structure
also receive the utmost recognition for being one of the most sustainable buildings
in Singapore.
Arno Schlueter is another person that has played a key role in sustainable
building technologies used at the Swiss Federal Institute of Technology (ETH) which
is the advanced technology and research centre located in Zurich. Arno Schlueter
was also involved in the design and construction of Singapore’s most energy
efficient workplace. This energy efficient office has featured an advanced
construction design named SEC FCL’s ‘3for2’ technology. This energy efficient office
is developed with an innovative strategy that enables builders to reduce the use of
space, cost and energy consumption. Simultaneously, this cutting edge concept
contributes in the reduction of the carbon footprint. The design of the building is
constructed with three floors within the height that is normally needed for two
levels in any other conventional structure (Eco Business 2015). Moreover, sloped
windows were one design feature that was used to enhance the daylight’s quality
while reducing heat gain.
NABERS rating tool is chosen to identify the designed building environmental
performance, NABERS Energy ratings recognise that increasing energy efficiency and
also the decreasing of the greenhouse gas intensity of grid electricity. These both
effective approaches aim to reduce the overall environmental impact of a building.
NABERS Energy ratings provide rated buildings with two different star rating results:
one measures the energy efficiency of a building, and the other measures its

29
greenhouse gas performance by taking into consideration the fuel source of
externally supplied grid electricity. By implementing NABERS rating tool in this
project, it can simultaneously lead our green building design towards environmental
friendly community.
In order to design a sustainable building, low energy consumption and high
energy use efficiency are two crucial aspects that should be analysed in detail.
Building a sustainable community has several advantages:
Contributes to lower cost and is one of the most efficient ways towards
achieving a carbon neutral community by minimising the annual
greenhouse gas emissions.
Links the issue of fossil fuel deficiency by implementing renewable energy
resources.
Improves the worldwide energy supply by implementing energy efficient
appliances.
Generates jobs opportunities and maximise occupants’ income.
Inspires people to make an improvement in building facilities and
promote education for behavioural change.
Shortens the payback time for energy efficient appliance investment

30
CHAPTER 3: METHODOLOGY
This research report is carried out using three different theoretical and analytical tools
which are described in more detail below.
1. Energy simulation using IES-VE modelling tool
The annual energy consumption of the existing building is evaluated using IES-
VE modelling tool by importing the structural floor plan of the existing building.
The materials (building embodied energy), building working hours and
infrastructural activities (operational energy) in the existing building are
identified are identified as they are major components that consume energy.
2. Identify the NABERS scores for the existing building and used as a benchmark
NABERS is an environmental rating system that evaluates the building energy
consumption. NABERS rating tool is suggested to demonstrate the effectiveness
of the building energy performance and determine the total carbon footprint
that is created. By getting familiarised with the mechanisms of NABERS self-
rating tool, the necessary requirements that would be needed to achieve the
green building standard could be met.
3. Sketch Up drawing tools for the building design and structure
A 3D Drawings tool is used to design the new MEB following the building
infrastructure requirements. For instance, total surface area and working
purpose of each floor are illustrated.

31
3.1 ENERGY SIMULATION USING IES-VE MODELLING TOOL
In recent decades, PC re-enactments of complex designing frameworks have
developed as a promising methodology (Nguyen and Reiter 2015). In building science,
scientists and architects regularly utilise dynamic thermal re-creation projects to
investigate thermal and vitality practices of a building to accomplish particular targets
through the reduction of energy consumption and also enhance the indoor
environment. (Garber 2009). For the purpose of building energy consumption
reduction purpose, energy simulation process and analysis program is decisive in order
to design a low carbon footprint building. Energy analysis programs used to study
vitality execution and thermal condition along with the building life cycle assessment.
Various tools are accessible and differ in their thermodynamic models, their graphical
client interfaces, their motivation of utilisation, their life cycle pertinence and their
capacity to trade information with other programming applications.
Since that the new Mechanical Engineering Building will be an extension of the
current Science and Computing building, we decided to simulate the Science and
Computing Building and then design an analogous yet energy efficient building by
investigating the major energy consumption sectors and evaluate possible strategies
and technologies for implementation purposes.
By considering the fact that existing buildings are generally in operation for 30
to 50 years and will account for approximately 70% of the total building stock by 2050
(Kelly 2010), investigating ways to reduce the energy consumption of these
existing buildings and also identify the l imitation of building design would be
a starting point to put in place energy reduction strategies for newly proposed building
32
design. Energy modeling which uses visual and computerised tools to estimate and
evaluate energy performance focuses on energy consumption, utility bills and life cycle
costs of different energy integrating activities in a particular building. It is also used to
evaluate the payback renewable energy technologies which include solar panels and
adaptive solar facade, wind turbines and high energy efficient appliances (Energy
Models 2013).
3.1.1 INTRODUCTION TO THE IES-VE MODELLING TOOL
IES-VE is used to simulate the energy consumption of a specific building based
on its basis activities. IES-VE is known as a dynamic building energy simulation software
which consists of a suite of integrated analysis tools. These integrated analysis tools
can review the performance of a building either reflectively or during the outline
stages of a development scheme.
The IES-VE suite of devices offers alternatives for precise and accurate
simulation process, top-level investigation through building structures and designs.
Areas for investigation would include atmosphere, theoretical building measurements,
shading, orientation, lighting, sun shading, LEED, vitality, carbon emanations, wind
assessment and others (Kegel 2015).

33
3.1.2 VIRTUAL ENVIRONMENT MODULES AND COMPONENTS
Table 1 illustrates the modules and components that are functional in the IES-VE modelling
software.
Table 1: The virtual environment modules and components.
Virtual Environment Modules Functions
ModelIT Geometry creation and editing
ApacheCalc Data analysis load
ApacheSim Thermal simulation
MacroFlo Natural ventilation
Apache HVAC HVAC’s components
SunCast Shading visualisation and investigation
MicroFlo The fluids dynamics in 3D form
FlucsPro/Radiance Design of the lightning and efficiency
DEFT The optimisation of the model
LifeCycle Cost analysis and the total building’s life cycle energy calculation
Simulex The evacuation of the specific building
The program provides an environmental analysis for the detailed evaluation of building
and system designs, allowing them to be optimised with regards to comfort criteria
and energy use.

34
3.1.3 IES-VE MODELLING TOOL IMPLEMENTATION PROCEDURES
Initially, at the start-up of the Virtual Environment programme, a clear model space is
initialised (Figure 6; The IES Virtual Environment-User Guide 2015).
(The IES Virtual Environment-User Guide 2015).
Figure 6: The IEC Virtual Environment start-up page

35
The section of the screen as shown below (Figure 7) enables a specific selection of the
required application to be made in the Virtual Environment software.
(The IES Virtual Environment-User Guide 2015).
The modeling simulation process is described in bullet points as below.
Two-dimensional models (from DXF) and 3D gbXML data are directly imported
into the IES software and facilely used to simulate a three-dimensional model
using the IES ModelIT application (Kegel 2015).
The floor plans of the Science and Computing Building in DXF form is used as an
input and imported to the IES-VE software in order to manually sketch out the
structure of the building.
The height of the building has to be inserted accurately in order to produce a
similar building structure.
The PDF form of the Science and Computing’ floor plans are attached in the
appendix which are figure 32, figure 33, and figure 34.
Figure 7: The application section in the IES-VE

36
The outcome of the Science and Computing Building floor plan in DXF form when
imported into IES software is shown below (Figure 8).
All the rooms can be created using the ‘partition of the site’ icon and drawn out
manually according to the floor plan outline.
The main way a wall is differentiated as an outside versus an inside wall is by their
adjacencies. For a component to be characterized as a ground floor piece, it is a
flat surface nearby a room (else it is a shading gadget) that is not in contact with
any room underneath. For a story, it's a flat surface that is in contact with a room
above as well as underneath. For a rooftop, it's a flat surface that is not in contact
with any room above. Exterior dividers are vertical surface that is not in contact
with a neighbouring room on one side (A and M 2015).
Figure 8: Floor plans in DXF form which are imported into the IES software.

37
To identify as an interior wall, it’s a vertical surface and it is connected with the
rooms beside. Exterior Windows are known as windows on the exterior wall,
interior windows are windows on an interior wall, and lastly skylights are
windows on a roof (A and M 2015).
Figure 9: The differentiation and description of each component used in the design of the new MEB (A and M 2015).

38
Figure 10: The differentiation and description of each component (A and M 2015).
The size and number of the doors and windows are identified and inserted as
input data in order to achieve a higher similarity of the building model to reality
The existing building energy simulation is generated based on the location of the
building, annual weather of the specific location, existing building construction
materials and the working hours of the building, which may differ from time to
time.

39
Once all the input information is imported into the IES-VE software, the final outcome
of the existing building is given as an output as shown (Figure 11).
Figure 11: The final outcome after all the data is inserted into the Virtual Environment software.

40
3.1.4 INPUT INFORMATION FOR THE EXISTING BUILDING ENERGY
SIMULATION
The Science and Computing building location information is attached in appendix figure
36 and the Science and Computing building weather information is attached in appendix
figure 25. All input information for the existing building energy simulation is tabulated
(Table 2).
Table 2: Input information for the Science and Computing building energy simulation.
Location Perth Airport, Australia
Latitude 31.93
Longitude 115.97
Altitude (m) 20
Time zone (hours ahead of GMT) 8
The existing building materials are attached in the appendix Figure 35.
All relevant information regarding the existing building materials are tabulated (Table 3).

41
Table 3: Important information and description based on different categories in the existing building
Category
Description
U value
(W/m2k)
Thickness
(mm)
External Wall Brick/Block wall 0.4396 323
Door Wooden door 2.1944 40
Internal ceiling / Floor Concrete slab internal ceiling 1.0687 420
Roof Sloping roof included loft 0.1589 1078
External Window Large Single glazed window 5.5617 6
Ground / Exposed floor Standard floor construction (2002) 0.2499 1198
Internal Partition 115mm single-leaf brick 2.2448 115
40
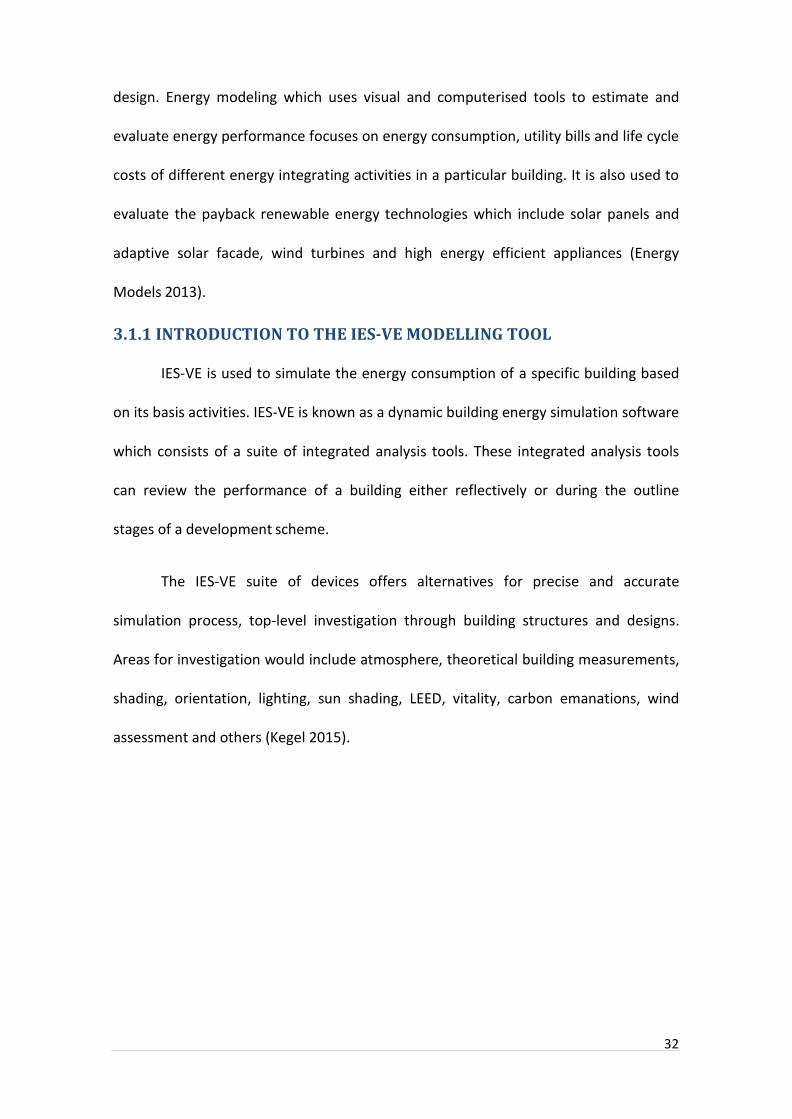
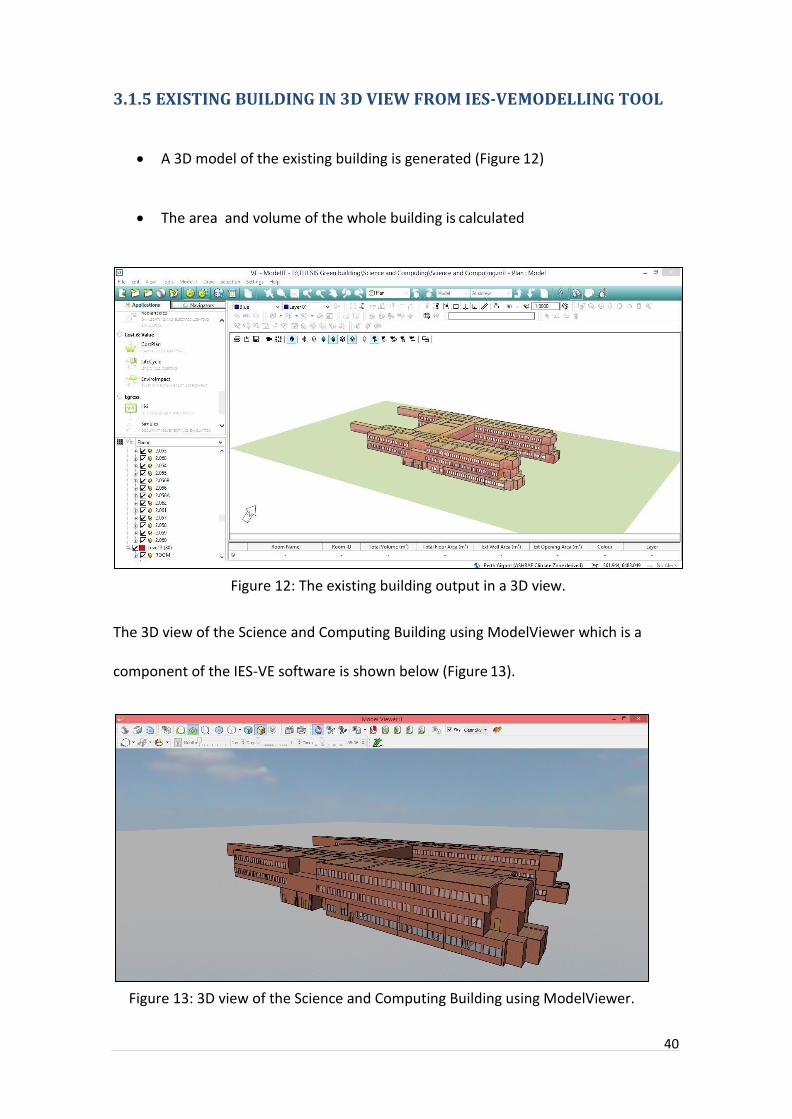
3.1.5 EXISTING BUILDING IN 3D VIEW FROM IES-VE MODELLING TOOL
A 3D model of the existing building is generated (Figure 12)
The area and volume of the whole building is calculated
The 3D view of the Science and Computing Building using ModelViewer which is a
component of the IES-VE software is shown below (Figure 13).
Figure 12: The existing building output in a 3D view.
Figure 13: 3D view of the Science and Computing Building using ModelViewer.

41
3.2 INTRODUCTION TO NABERS RATING TOOL
In this modern era, the extensive load of energy consumption has led to
environmental concerns including ozone layer depreciation, global warming, and
negative impacts on organisms natural habitat (Pérez-Lombard, Ortiz and Pout 2008).
Hence, it is important to highlight and evaluate several solutions for minimizing the
energy consumption of buildings and integrating new strategies for achieving
sustainability in built environments. Additionally, the proposed strategies promote
energy conservation awareness could be used as education tools for the future
students. The NABERS rating tool is implemented to investigate a building’s
performance towards environmental sustainability.
The NABERS rating tool demonstrates the effectiveness of the building energy
management system, which also indicates the efficiency of the building design.
NABERS also helps evaluate the existing building’s operational efficiency. In other
words, it determines how the building is utilised during usual activity rather than just
depending on the design structure of the building. Wong et al. (2015) stated that the
estimation results are assessed under four headings: energy, water, indoor
environment and waste (Table 10).
The building rating tool can contribute to the sustainability of Australia's built
form and resultant communities as when used as a leading guide for contractors or
builders. It is innovative and persuasive which enables construction practitioners to
understand the function of the tool. These findings will help develop outcomes and
practices that encourage behavioral change a m o n g construction stakeholders and
people within the construction industry and thus driving towards a reduction in carbon
42
emissions.
The building energy consumption is documented and shown as carbon
emissions per square metre of the floor area of the building (kg CO2/m2) in a 12-month
period. In the end, the building receives the NABERS star rating that follows a ranking
from one to five, which symbolises the carbon emission results based on per square
metre of the building throughout the entire period of assessment. The lesser the
carbon emissions that are generated by the specific building, the higher the rating it
will receive. This gives an indication of the status of the building’s performance
towards sustainability (Wong et al. 2015). Even though NABERS is not a legal
requirement during the design phase of building construction and development in
Australia (Mitchell 2009), it is highly recommended in order to reduce the operational
and energy cost
In the new MEB design, experimentation and research labs are included. In
order to accomplish the daily experimentation basis, it is important to point out that
laboratories often consume 3 to 4 times more energy compared to a standard office
operation. Their complex structures are recognised as a challenge in understanding the
energy sources and implementation, and therefore it is significant to diagnose and
identify possible opportunities for improvement.

43
3.2.1 NABERS ASSESSMENT DESCRIPTION
By utilizing the rating scores and carbon emission benchmark that is set by NABERS, we
can identify the building’s major energy sources and thus generate effective energy
saving plans which would simultaneously improve energy supply security and help
mitigate fluctuations of energy prices. On top of that, water usage can be reduced by
implying water reduction strategies and also mitigate massive wastewater generation.
3.2.2 THE SCIENCE AND COMPUTING BUILDING INPUT DATA FOR NABERS RATING
There are several assumptions made:
The total hours that 60% of the total staff have occupied the Science and
Computing building in a week is approximately 30 hours.
There are 150 computers being used during working hours within the building.
The electricity and natural gas input data is based on the IES-VE energy
simulation result.
Table 4: Description of NABERS assessment (adapted from NABERS 2014).

44
Table 5: Other important information from the Science and Computing building for
self-rating purposes.
Premise types Office
Premises scope Whole Building
Building details Murdoch Science and Computing Building
State and postcode Murdoch 6150
Areas of office 10956 m2
Hours of occupancy 40
Number of computers 150
The relevant input information of the existing building that is required to be imported
into the IES-VE software for the simulation process is given in (Tables 5 and 6).
Table 6: The energy data input from the Science and Computing building.
Fuel type Quantity Unit
Electricity 3746000 kWh
Gas 12744 MJ

45
3.2.3 THE NEW BUILDING DESIGN INPUT DATA FOR NABERS RATING
In order to identify the sustainability performance of the future Mechanical
Engineering Building towards our environment, NABERS rating tools is implemented at
the same time to achieve the green building standard. The relevant information on the
new MEB that is required for NABERS rating is tabulated below (Table 7).
Table 7: Input information of the new MEB that is used in NABERS rating.
New Building Total Area (m2) 2800
Building Location and Postcode Murdoch, 6150
Working Hours per week 40
Number of computers and appliances switched on during working hours 100
Assumptions
The New Mechanical Engineering Building is designed to have 4 levels and each level
has approximately 700 m2 which makes up to a total whole building area of 2800 m2
Due to the reason that the New Mechanical Engineering Building will be consisting of
workshops, offices and computer laboratories, therefore, approximately 100
computers will be installed within the building.
Total of 40 working hours per week = 5 days of working days per week × 8 hours of
working hours per day
46
3.3 INTRODUCTION TO SKETCHUP PROGRAMME
SketchUp Pro programme is used after obtaining several estimations and
considerations. It is accessible and straightforward. The SketchUp Pro programme is
specialized. It is a useful mechanism for architects and building constructors to gather
their drawings, develop their concepts and thus proceed to the planning stage.
SketchUp Pro acts as a visualisation and communication tool between designer and the
clients. SketchUp Pro is known to be a convincing tool and practice because it is
intuitive and simple. It empowers project designers to evolve their ideas and also
report their modelling concepts in both 2D and 3D formats
SketchUp Pro programme is widely utilised over all periods of Design-Build-
Operate as it encourages everyone that is working on that programme to talk the same
motives and be on the same page (Building Point Australia 2015). One of the merits of
3D modelling is that the type, breadth and source of the building material can be
imported into the 3D modelling mechanism, a vital component in the 3D building
model. In addition, it is generally recognised that a 3D computerized model
incorporates three parts: geometry, topology and semantics. Geometry characterizes
shape and measurements, topology characterizes spaces and their connections, and
semantics portrays extra qualities, for example, room capacities, typically with devoted
traits (Gimenez et al. 2015).

47
In order to assist the drawing and modelling mechanisms, general research
such as the area, the location and the height of the new mechanical engineering
building design is briefly evaluated in advance.
3.3.1 SKETCHUP MODELLING TOOL DRAWING PROCESS
The rectangular base structure of the new MEB generated using SketchUp (Figure 14).
Figure 14: Demonstration of the base structure development.

48
Demonstrated progression of setting up an entire building structure outline by pull the
sculpt of the 3D model to a certain height (Figure 15).
The operation of constructing the new MEB floor layout is shown above (Figure 16)
Figure 15: Demonstration of the pulling up the sculpt function.
Figure 16: Demonstration of the ground floor structure.

49
CHAPTER 4: RESULTS
4.1 RESULTS OF THE EXISTING BUILDING ENERGY SIMULATION BY
USING IES-VE
There are several energy simulation results generated which included:
4.1.1 Total Natural Gas consumption
4.1.2 Total Electricity consumption
4.1.3 Total Energy Consumption
4.1.4 Annual HVAC consumption
However, lightning consumption is not included as input data due to the lack of
lightning information. The types of lightings and the total quantities used is not
recorded by Murdoch University. As a result, the total energy consumption tabulation
data is based on the total electricity usage which excluded lighting consumptions and
also natural gas usage throughout the year.

50
4.1.1 RESULTS OF THE TOTAL NATURAL GAS CONSUMPTION IN THE SCIENCE AND COMPUTING BUILDING
The total natural gas consumption throughout the whole year is 3.5404 Mwh which is
relatively low compared to the total electricity consumption for the Science and
Computing Building.
In order to determine the energy consumption in MJ, we calculate it according to the
following equation
(1 MWh = 3600 MJ)
The total Science and Computing building has total area of 10967 m2,
therefore the natural gas energy consumption for the existing building is
²
Table 8: Results of the total natural gas consumption in the Science and Computing
Building which simulated through IES-VE program.

51
4.1.2 RESULTS OF THE TOTAL ELECTRICITY CONSUMPTION IN THE
EXISTING BUILDING
The total electricity used in Science and Computing Building is 3743.3 MWh which
is simultaneously equals to 13475880 MJ
(1 MWh = 3600 MJ)
The total Science and Computing building has total area of 10967 m2 which would
result in the electricity energy consumption for the existing building to be
2
Table 9: Results of the total electricity consumption which excluded the lighting
consumption in the Science and Computing Building and simulated through IES-VE
modeling system

52
4.1.3 RESULTS OF THE TOTAL ENERGY CONSUMPTION IN THE EXISTING
BUILDING
The total energy used in the existing building = the total electricity used + the total
natural gas; which sum up to a total of 3746.8 MWh as known as 13488480 MJ.
The total Science and Computing building has total area of 10967 m2, therefore the
energy consumption for the existing building is
Table 10: The results of the total energy consumption in the existing building which
simulated through IES-VE program.

53
Figure 17 illustrated the total annual energy consumption of the building which
consists of annual electricity consumption and annual natural gas consumption. Annual
electricity consumption has almost taken 100% of the total energy use.
4.1.4 ANNUAL HVAC CONSUMPTION
The annual HVAC consumption is made up of two main components:-
Annual Boiler Load
Annual Chiller Load
Annual Electricity
Consumption (MJ/m²) 1231.15
Annual Natural Gas
Consumption (MJ/m²)
1.163
Total Annual Energy Consumption (MJ/m²)
Annual Electricity Consumption (MJ/m²)
Annual Natural Gas Consumption (MJ/m²)
Figure 17: Total annual energy consumption in pie chart form.

54
4.1.4.1 RESULTS OF THE ANNUAL BOILER LOAD IN THE SCIENCE AND COMPUTING BUILDING
Table 11 illustrates the total boiler load throughout the year and the boiler is
not used from January to March and September to December due to the summer and
hot season. However, heaters are used during winter season (June to August) in order
to keep the warmth of the office.
On the other hand, there’s plenty of experimentation labs used and therefore
boiler is being implemented to operate the mechanisms and appliances like provide
hot water for experimentation purposes.
Table 11: The results of the annual boiler load in the Science and Computing building
which simulated through IES-VE modeling system.

55
Figure 18: Peak day load of boiler in the Science and Computing building on 2 of July
2015 that simulated through IES-VE modeling system
Figure 18 explained the peak day boiler use. The boiler has the highest energy
consumption from 6.00am to 7.00am on Friday 02/July in order to warm up the boiler
system for its functionality throughout the day.

56
4.1.4.2 RESULTS OF THE ANNUAL CHILLER LOAD IN THE SCIENCE AND COMPUTING BUILDING
The chiller had the highest consumption load during summer season (January
to March) which have achieved more than 80 MWh of chiller load for cooling purposes
(Table 12). On the other hand, the chiller’s consumption is comparatively higher than
boiler load which indicates that most of the energy consumed by the chiller system.
Table 12: The result of the annual chiller load in the Science and Computing building which
simulated through IES-VE modeling tool

57
The chiller load reaches its peak during midday (12pm to 1pm) on 18 of April
2015 due to the reason it has the highest temperature throughout the whole day
(Figure 20). Hence, by implementing high efficiency chiller system, it can maintain the
indoor temperature, and also educating workers’ behavior, the indoor temperature for
comfort can be maintained while reducing the total carbon emission.
Figure 19: Peak day load of the chiller system at the Science and Computing building
on 18 of April 2015 which simulated through IES-VE modeling system
58
4.2 NABERS RATING CALCULATOR RESULTS
The NABERS rating calculator results consist of:
4.2.1 Science and Computing Building NABERS rating scores;
4.2.2 The estimated energy consumption for the new building with same design
and energy performance as the existing building; and
4.2.3 The estimated energy consumption for the new building with NABERS
Ratings 4, 5 and 6.

59
4.2.1 THE SCIENCE AND COMPUTING BUILDING NABERS RATING SCORE
Figure 20: Science and Computing building’s NABERS rating score.

60
Based on the results that presented in Figure 22, the Science and Computing
building achieved 0 stars which indicated that there is a major effort necessary to reduce
its total energy consumption and also reduce the green house emission. On the other
hand, the existing building is consuming energy based on the offices purpose as well as
the laboratory operation for experimentation purpose. In addition, green power rating is
low due to the reason that renewable energies are not undertaken as part of the existing
building’s facilities to generate energy. GreenPower is a voluntary measure that
households and organisations used to increase renewable energy generation
(Thefifthestate.com.au 2016) (and it comes from energy sourced from the sun, wind,
water and waste which produce no greenhouse gas emissions. (The Facts On Greenpower,
2015)
In conclusion, the NABERS data tabulation and results showed the major issues
which had led to the inefficiency of building energy use. These results are identified as
benchmarks towards the journey on designing the new Mechanical Engineering Building.
The energy simulation results and NABERS rating results can be used as an effective
referencing tool which can provoke the new mechanical engineering building’s design
and operational use to at least achieve NABERS 4 star ratings.

61
4.2.2 THE ESTIMATED ENERGY CONSUMPTION FOR THE NEW BUILDING WITH SAME DESIGN AND ENERGY PERFORMANCE AS THE EXISTING BUILDING
An estimation of yearly Energy Consumption for the new Mechanic al Engineering
building based on the same energy sources and building design as Science and
Computing building is calculated as below
957561.15kWh/year
In order to calculate the Max total energy use in MJ per annum
Table 13: The estimated energy consumption for new building based on the same design
and energy performance as the existing building.
The new Mechanical
Engineering building with
same design and energy
performance as Science
and Computing building
The new Mechanical
Engineering building
with good high
energy efficiency
design
Estimation of yearly Energy
Consumption (kWh/year)
957,561.15
574,414.02
Max total energy use in MJ
per annum 3447,220.153 2037,890.47

62
4.2.3 THE ESTIMATED ENERGY CONSUMPTION FOR THE NEW BUILDING WITH NABERS RATINGS 4, 5 AND 6
The calculation tabulated sheets for the higher NABERS ratings are attached in the
appendix Figure 42 (NABERS 4 rating calculation), Figure 43 (NABERS rating 5 calculation),
and Figure 46 (NABERS rating 6 calculation).
Table 14: The estimated energy consumption for the new Mechanical Engineering building
in order to achieve NABERS Ratings 4, 5 and 6.
The new
building with
NABERS 4
ratings
The new
building with
NABERS 5
ratings
The new
building with
NABERS 6
ratings
Estimation of yearly Energy
Consumption (kWh/year)
412,323
293,231
146,615
Max total energy use in MJ per
annum
1484,363
1055,632
527,814

63
4.3 FINAL RESULTS OF MECHANICAL ENGINEERING BUILDING 3D
DRAWINGS
New Murdoch Mechanical Engineering Building
Total Height of the building Each floor with 3m height which make up to a total of 12m height
Total Length of the building 35m long
Total Width of the building 20m width
Total Area of the Building 2800m2 in total area
Figure 21: Final 3D drawing of the new Mechanical Engineering Building.

64
CHAPTER 5: DISCUSSION
5.1 DISCUSSION OF THE BUILDING ENERGY SIMULATION USING IES-VE MODELING TOOL
Due to the economic advancement and irresponsible acts of mankind, our
environment and climatic system is affected by greenhouse gas emissions which lead
to the issue of global warming (Prato 2008). In particular, buildings, which are one of
the major components that consume energy, lead to air contamination and carbon
outflow (You et al. 2011). Embodied and Operational energy are known as the biggest
energy consumption in a building’s life cycle. Besides, maintenance acts, demolition
work and disposal activities are major contributors towards building energy
consumption and emission of carbon dioxide. Hence, in order to reduce the total
energy consumption in a specific building, the effort to reduce the embodied energy
and operational energy has to be taken into account and evaluated.
Embodied energy (EE) is carried out during the construction stage of the
building development, which includes the total embodied energy of building materials,
transportation energy of materials and building construction energy. Specifically,
embodied energy of building materials makes up a large percentage of embodied
energy in buildings.
South Korea is widely known as a developed country and has introduced
advanced technologies for motor manufacturing and building development. Each year
South Korea generated about 27 % of the total global energy consumption and also
emit about 25% of total GHG emissions. Accordingly, the government sector played a
major role in reducing the energy use in there sectors which simultaneously reduces
the carbon emission.

65
To obtain more specific outcomes via these efforts to achieve the carbon- reduce
framework, it is mandatory and important to clearly identify the sources of the
building energy use. Similarly, energy simulation of the existing building is undertaken
in order to identify the building material and this will help in design of the new
mechanical engineering building with more environmental-friendly building materials
(Kim et al. 2012).
Based on the existing building’s IES-VE energy simulation results, the building
materials that are used for the Science and Computing building contribute a relatively
huge amount of carbon emission to our environment, because use of energy intensive
materials such as brick, cement, steel, glass results in high embodied energy.
Appropriate selection of building materials and in depth research with regard to their
embodied energy is crucial for limiting embodied energy of buildings (Praseeda, Reddy
and Mani 2015).
The type of building materials and also the U-value of the material are tabulated
(Table 15). U-values, known as heat transfer coefficient, are used to identify the
insulation effectiveness of the building’s materials and components. In another word,
it characterizes the specific building material’s resistance to heat transmitting between
the inside and the outside of a building. The lower the U-value of the building material,
the harder for the heat to pass through from the outdoor into the indoor, therefore,
the higher the insulation efficiency (Designing Buildings 2015).

66
Table 15: The building material types and their associated U-value.
Category Description U value (W/m2k)
External Wall Brick/Block wall 0.4396
Door Wooden door 2.1944
Internal ceiling/Floor Concrete slab internal ceiling 1.0687
Roof Sloping roof included loft 0.1589
External Window Large Single glazed window 5.5617
Ground/ Exposed floor Standard floor construction (2002) 0.2499
Internal Partition 115mm single-leaf brick 2.2448

67
5.1.1 LOW EXISTING BUILDING EMBODIED ENERGY BUILDING MATERIALS INVESTIGATION
Low energy building materials with low U value can be used to replace these traditional
building materials that implemented in the existing building.
Table 16: The existing building materials and recommended low energy building materials
Existing Building Material Low Energy Building Material
Category Description U value
(W/m2k)
Category Description U value
(W/m2k)
External
Wall
Brick/Block wall 0.4396 External Wall Lightweight
aggregates
from recycled
masonry
rubble
0.28
Door Wooden door 2.1944 Door NZ Generic
Door R0.88
0.9972
Internal
ceiling/Floor
Concrete slab
internal ceiling
1.0687 Internal
ceiling/Floor
Timber Frame
Attic Ceiling
0.5255
Roof Sloping roof
included loft
0.1589 Roof Sloping roof
included loft
0.1589
External
Window
Large Single
glazed window
5.5617 External
Window
Double Glazed
with 16mm
argon with
aluminium
spacer bar
1.5
Ground/
Exposed floor
Standard floor
construction
(2002)
0.2499 Ground/
Exposed floor
2013 exposed
floor
0.22
Internal
Partition
115mm single-
leaf brick
2.2448 Internal
Partition
Wood made
production
1.4615

68
5.1.1.1 LIGHTWEIGHT AGGREGATES FROM RECYCLED MASONRY RUBBLE
For the external wall section, lightweight aggregates from recycled masonry
rubble are one of the preferable options because these lightweight construction
aggregates manufactured from construction waste. They can be re-used again and
fabricated into lightweight mortars and concretes (Mueller, Schnell and Ruebner
2015). By implementing lightweight aggregates from recycled masonry rubble,
construction energy and waste can be significantly reduced. In the future, strict closed-
loop construction waste recycling on site will be undertaken by government and
authorities in order to avoid excessive construction waste that will end up in landfill.
Hence, limited landfill capacity will be recognised as a future plan from the state
government to prevent the disposal or operation of these construction wastes.
20 million tonnes of masonry rubble is generated every year from demolition
and rehabilitation phase of buildings This recycled masonry rubble is unquestionably a
notable potential source of raw material that can be used to construct walls, which
would in turn address construction demands. The lightweight aggregates could also be
used use as a bulk insulation material because of their low thermal conductivity.
The biggest achievement of the lightweight aggregate manufactured from
masonry rubble is that the production process involves nearly zero primary resources.
Manufacturer production of lightweight aggregates from recycled masonry rubble
could take the opportunity to replace natural pumice and expanded clays which will
keep the use of natural resources to a minimal (Mueller, Schnell and Ruebner 2015).

69
Figure 22: Image of lightweight aggregates from masonry rubble.
The production of lightweight concrete blocks, refulting in a concrete block of
lightweight aggregates from masonry rubble (left) and from expanded clay (right).

70
5.1.1.2 DOUBLE GLAZING
Single Glazing Properties Double Glazing Properties
(a)
(b)
Only one pane that leads to
low efficiency
Creates noise pollution
Dual panes of glass and 20mm
gas filled cavities to provide
insulation and thus improve the
energy efficiency
Reduces external noise by up to 80%
Figure 23: (a) Single glazing properties and (b) Double glazing properties (Australian Double
Glazing 2015).
71
Minimising energy use in building is one of the main considerations that can be
taken to reduce the operational cost. Pérez-Lombard et al (2009) stated that the
energy consumption by both residential and commercial buildings, in developed
countries accounts for abour 20–40% of the total energy consumption. Windows
influence the energy balance in a building in two ways: the solar radiation and thermal
transfer performance. A window transmits sun based radiation and emanates long-
wave solar radiation producing heat between the indoor and outdoor environment
(Long et al. 2015). Subsequently, double glazing windows with better solar radiation
are recommended as the low U value enhances the insulation purpose of the room.
For an example, in order to achieve the maximum daylight penetration and
thus to reduce the use of lighting, the building at 40 Albert Road, South Melbourne has
installed floor to ceiling high performance double glazing windows. It can also
accomplish several other outcomes like enabling and preventing excessive heat loss
from the building. This particular double glazing window installation also promotes
natural ventilation. This feature can results in lower energy consumption by air
conditioning. Full length shading curtains to the eastern façade along with operable
internal blinds may assist in reducing heat entering the building (Energy Efficient
Glazing 2015).
A major part of the energy consumption in the existing building is due to the
boiler and chiller systems that function to keep a constant temperature throughout the
day. Thus, the type of window selection is one of the key considerations in order to
decrease the HVAC system operational cost

72
5.1.1.3 WOOD MADE PRODUCTION
Proper choice of building materials and basic frameworks may results in a
significant decrease the essential energy use and atmosphere effect of structures.
(Buchanan and Honey 1994) Reviews of lifecycle surveys on material structures have
highlighted the energy and atmosphere advantages of wood-based building materials
(Lippke et al. 2011). Several surveys have considerable reduction in embodied energy
in a specific building (Buchanan and Honey 1994; Reddy and Jagadish 2003).
Additionally, a few studies advocate ideal utilisation of materials or assets and that of
locally accessible materials as methods used for conserving energy consumption
(Morel et al. 2001; Kofoworola and Gheewala 2009).
Wood based products are carbon-neutral, and act as a repository of carbon
which can reduce the amount of carbon emitted into the environment (Oneil and
Lippke 2010). Trees can effectively store carbon (Lehmann and Hamilton 2011), which
is widely known as carbon sequestration. It is roughly estimated that 1.1 tonnes of
carbon dioxide can be stored in 1 square m3 of wood product which
contemporaneously conserve our environment (Puettmannand and Wilson 2005).
Research also showed that wood-based products consumed 15% less energy as
compared to concrete.
Chen (2012) calculated the operational energy that is used for heating,
ventilation, air conditioning, lighting, and appliances of a five-story office building by
comparing timber based products and concrete. He concluded that wood based
buildings have a 10% lower operational energy demand with the integration of design

73
optimisation and the use of advanced technologies. Another research from a
comparative study of two mid-rise office buildings that was conducted by John et al.
(2009) also indicated that timber products have better environmental performance,
covering several environmental aspects (ozone depletion, global warming potential,
eutrophication), compared to a building built using concrete.
5.1.2 SCIENCE AND COMPUTING BUILDING OPERATIONAL ENERGY REDUCTION STRATEGIES
By evaluating the results from the existing building energy simulation, we can identify
the issues that lead to the massive annual energy consumption in that building.
Table 17: Australian Average Energy Intensity Trends by Building types, 1999-2020
(Department of Climate Change and Energy Efficiency 2015).

74
By 2020, an office, which is the whole building, would require approximately
833 MJ/m2 of energy consumption per annum. However, based on the existing
building energy simulation that was estimated using the IES-VE modelling tool, there is
a total of 1230MJ/m2 of energy used annually. The existing Science and Computing
building daily operation consumes a large quantity of energy. At the same time it has
contributes to a large amount of carbon emission into the environment. In order to
reduce these total energy consumption as well as electricity cost, strategies to
minimise the operational energy should be reviewed and also high efficiency
appliances should be considered.
Existing Science and Computing building operational energy can be reduced by
Workers behaviour change
Appliances Efficiency Improvements and Energy Saving Strategies
5.1.2.1 WORKERS’ BEHAVIOUR CHANGE
In order to effectively reduce the operational energy of the appliances, workers
behaviour needs to be analysed. Work styles allude to a heap of dispositions and
practices in the work environment. A specific work style may occur as a result of
business exercises, workplace types, standards and rules characterised by upper
administration and the general working environment and interaction. These are the
components that will determine the energy consumption in a particular building (Bin
2012). In another words, workers improvement in conserving the environment can
decide the aspiration and accomplishment of an organisation's objectives. Work
environment conduct and practices can decide levels

75
of asset consumption, and the working society may be influenced by a minimal slender
or wide consideration of sustainability (McElligott et al. 2013).
Employees are encouraged to spare PC settings, implement office shut down
strategies after office hours, utilize of electrical extensions for hardware that can be
switched off when not being used and cooperate in lighting decrease programs.
Likewise, transportation to and from work creates GHG emission and consumes a huge
amount of energy. Workers can consider carpooling, biking, or taking public
transportation (Institute for Building Efficiency 2013).
Moreover, in order to reduce the heating and cooling load of the building, staffs have an
important role to play.
Actions to reduce the heating and cooling load should be encouraged. Some of these
are listed below:-
Watch all signage and conventions for heating and cooling operation
Ensure heating and cooling indoor appliances are set to the predefined
temperatures for the particular territory – not all zones should be at the same
temperature
Wear appropriate clothing that according to the seasonal weather to keep
yourself comfortable
Use a local fan instead of relying the function of air conditioners and
Ensure that all windows and doors are closed if running an air conditioner
appliances (Australian Hotel Association 2006)

76
Communication is an important tool that is used to convey information as well
as educate workers. Through communication, workers would be able to find out the
impact of their behaviours and how they can follow environmental sustainable
practices.
There are many communication tools that are useful for energy conservation purposes.
Three of the common ones are detailed below.
Emails and websites: Suggestions promote any specific conservation activities
and gather feedback and comments from staff.
Public meetings: Building occupants obtain useful knowledge on energy efficient
practices and participate in energy conservation programs.
Prompts: Used as a visual reminders that attract attention of employees to
energy savings activities (Bin 2012).
Figure 24: Example of prompts (Bin 2012).

77
5.1.2.2 APPLIANCES EFFICIENCY IMPROVEMENTS AND ENERGY SAVING STRATEGIES
To maintain an acceptable temperature inside a particular building, the HVAC
framework must be able to handle all different kinds of loads. Practices to enhance the
effectiveness in a building's HVAC framework can be separated into two classifications.
Reduced of the HVAC loads
Improved efficiency of the HVAC mechanisms (Department of Industry,
Innovation and Science 2013)
5.1.2.2.1 REDUCTION OF THE HVAC LOADS
Reduce Equipment Load – Decreasing the usage of electricity driven appliances,
such as PCs, printers and lights will reduce a HVAC system's loads
Demand Based Ventilation – Turning on the air conditioner only when required.
A low amount of fresh air is required in a space based on the number of workers
in accordance with the Australian Standards. Carbon dioxide sensors can be used
to decide the base measure of outside air required and to reduce the amount of
natural air supplied (Department of Industry, Innovation and Science 2013)

78
5.1.2.2.2 IMPROVE EFFICIENCY OF THE HVAC MECHANISMS
System Selection – Select the suitable system which can reduce the energy usage
and maximise energy savings. For an instance, a Variable Air Volume (VAV) AHU
will adjust the volume of the incoming air to the spaces depending on the
required demand. This enables for better control and reduces airflow rates,
which simultaneously minimises the energy.
Plant Selection –The total energy consumption of a building can be affected by
the selection of HVAC plants. For example, condensing boilers implemented for
producing hot water can improve its efficiencies for more than 90%. Accurate
plant sizing also has a large impact on energy efficiency.

79
5.2 DISCUSSION ON THE NABERS RATING TOOLS - LOW ENERGY BUILDING PROPOSED STRATEGIES
In order to design a new mechanical engineering building that can at least achieve 4
star ratings; energy consumption has to be reduced by constructing energy efficient
building design structure, implementing energy efficient strategies and also integrating
with renewable energy technologies.
5.2.1 ENERGY EFFICIENCY DESIGN
To design a low energy building, on-lot demand management and high energy
efficiency measure should be undertaken. A building designed based on the key
principles of climate sensitive design as it can reduce thermal loads and energy losses.
North facing double glazed windows recommended to reduce the summer heat
and also achieve a better insulation
All windows and doors that are adjacent to air-conditioned spaces are high
performance double glazed, which will be build up based on the sun orientation
in order to avoid heat gain.
The interior lighting of the building will mainly consist of fluorescent lamps with
dimmable daylight harvesting controls and motion sensors in less frequently
used areas.

80
Lighting is grouped in zones and local dimmer controls are provided to suit usage
and prevailing conditions.
External LED and metal halide lights with photo sensor control will reduce energy
use.
On the other hand, a transparent roof window is implemented to enable roof
light to penetrate for the tutorial rooms and workshops purpose which are
located at the Mechanical Engineering building Level 2
Low VOC products are used, where possible, to replace high VOC products in
paint finishes, and laminates.
Insulation is used to ensure the comfort in the building throughout the year by
maintaining consistent indoor temperature. With suitable insulation to implemented
extra heat loss and heat gain can be mitigated thus reducing the energy consumption
of the HVAC system. Different types of materials can be used for insulation and these
include wood fibre, plant fibre, rock wool, glass wool, and so on. The quantity of
insulation that required may depend on the building plan, budgets and climate.
Compared to heating and cooling tools, insulation is undeviating and doesn't involve
much maintenance (Insightprojects.com.au)

81
5.2.2 ENERGY EFFICIENT TECHNOLOGIES
The variety of engineering structures, equipment and mechanisms are considered to
manage the net energy demand of the building (Pantelic 2014).
Appropriate scale and type of HVAC systems
It is desirable to invest in an efficient and proper size of HVAC system that
is well maintained and has a good warranty. HVAC consume the majority of the
total energy in a specific workplace. Installing an energy efficient HVAC system
can save up to 40% of the energy operating cost (Admin 2015).
Energy meter used to monitor the appliances’ energy efficiency
Use of energy efficient office/ laboratory/ research equipment that labelled
energy rating labels that illustrate the energy efficiency of the mechanisms
Use of Building Management System to monitor and maintain the building energy
use.
Building Management System is a computer based system that delivers
integrated control and monitoring of a building’s electrical appliances and
mechanical system. By using BMS in a new or existing building, its leading edge
technology can used to monitor the ventilation heating, and HVAC systems.
Further than that, BMS can also include fire alarm systems, lighting, security,
plumbing and water monitoring.

82
Building Management System is capable to record and arrange the
maintenance of the building. A system can use exclusive controls or, as is progressively
to open standard controls. A BMS can deliver early detection of problems with
electrical power via basic alarm and control notification (Data Center Knowledge 2014).
5.2.3 RENEWABLE ENERGIES
Advantages of local renewable energy generation include integration with existing
building structures (no additional land or material use) and reduction of grid
transmission losses and grid congestion issues. Determining the potential and
calculating the performance of renewables in an urban environment is important for
the design of future urban areas and the retrofit of existing structures.
Integration of Solar Photovoltaic system with solar battery storage
Adaptive Solar Facade
83
5.2.3.1 INTEGRATION OF SOLAR PHOTOVOLTAIC SYSTEM WITH SOLAR BATTERY STORAGE
Solar photovoltaic (PV) system is installed on the roof of the design building to
supply part of the building’s power needs. Photovoltaic cells have the potential to
provide a significant amount of electrical energy (Gregory et al. 1997). Photovoltaic
cells generate power by converting light from the sun into electricity. Most auspicious
photovoltaic cells in terms of mass production, standard of efficiency and affordability
are made from silicon. High efficiency mono-crystalline silicon panels are proposed for
installation on top of the roof. The solar panel will be mounted at a north-facing angle
of 25° to 30° to maximise power productivity.
Moreover, locating the photovoltaic cells on the roofs of homes, industries, and
other buildings would reduces the requirements for extra land by an estimated 20%
and reduces transmission costs. An inverter changes the direct current (DC) electricity
from the panels into alternating current (AC), which can then be used to power the
fixtures and appliances in a building, with any excess energy stored in a battery.
Solar energy storage using new innovation technology lithium iron phosphate
(LiFePO4) batteries is rising as a possible solution to this inconvenient issue (Josh's
House 2015). The battery stores excess solar power generated during the day so the
stored solar energy can be used during the night time. The surplus power that
generated from the solar PV is redirected back to the grid once the batteries are full.

84
Figure 25: Schematic detailing of the solar energy storage system at Josh's House (Solar Balance 2015).
5.2.3.2 ADAPTIVE SOLAR FAÇADE
In modern Australia, solar gains intensity due to glazed conditions and
structures is suggested that has significantly lead to the issue of global warming. Solar
energy gains are also provided by other alternative ways such as transparently
insulated walls and solar photovoltaic system. A beneficial system reinforcing the
direct gains through glazed areas included indirect gains using translucent insulation
methods on solid walls. All these solar energy gains can be collected to generate
electricity (Raicu et al. 2000). Therefore the Adaptive Solar façade is considered as one
of the options of the system integration to reduce energy loss. The Adaptive Solar
Facade (ASF) is a useful facade that integrates photovoltaic modules with soft inflated
actuators for daylight control and also solar detecting. The adaptive solar façade
enables shading, solar energy generation, and also control of the level of exposure and
transparency. The dynamic feature can rotate after responding to the alterations of
the outside environment and the occupants comfort needs (Architecture and Building
Systems 2015)

85
5.3 DISCUSSION ON THE MECHANICAL ENGINEERING BUILDING STRUCTURE DESIGN AND MEASUREMENTS
In modern days like this that emphasize the effectiveness of instruments and
appliances usage, it is today conceivable to build a definite yet simple way to utilise 3D
models in an expense effective way. As a result, in this project, we intend to discover
an effective 3D drawing tools to illustrate the animated diagram of the new
mechanical engineering building for the purpose of better understanding.
As needs be, expansive corpora of 3D models, for example, the Google 3D
Warehouse, are currently turning out to be unreservedly accessible on the web.
(Zhang et al. 2013) It is likewise noticed that for quite a while now mapping
mechanisms, similar to Google Earth, have been utilizing 3D models of urban
communities as a part of their perceptions. Such technique can thus accomplish
noteworthy results for demonstrating substantial regions with consistent
improvement and outcomes (Frahm et al. 2010)
Due to the reason that the new Mechanical Engineering Building will be the
extension of the current Murdoch Science and Computing Building, therefore the
layout plan of the new Mechanical Engineering Building will be constructed based on
the existing building’s design layout.

86
The new engineering building is designed to have 4 levels and each floor
consists of different teaching purpose which sums up to a total area of 700m2. The
measurements of building partitions are listed below (Table 17).
Table 18: Measurement of the new Mechanical Engineering Building.
Total Height of the building Each floor with 3m height which make up to a total of 12m height
Total Length of the building 35m long
Total Width of the building 20m width
Total Area of the Building 2800m2 in total area

87
5.3.1 GROUND FLOOR OF THE BUILDING
The ground floor of the Mechanical Engineering Building consists of six different
experimentation laboratories with a total area of 600 m2. Consequently, a brief survey
of mechanical engineering experimentation laboratories requirements is carried out in
order to get acquainted with the facilities that may recommend establishing. These
laboratories cover an extensive variety of mechanical building administrations,
permitting the future mechanical students to test, assess, and show an assortment of
physical standards (University of Technology Sydney 2015). The experimentation
laboratories are designed to be located on the ground floor in order for the piping
network to be constructed uncomplicatedly and to improve the efficiency of the
maintenance work.
A complete list of the Mechanical Engineering Building facilities’ strategies is
recommended, with top 10 Mechanical engineering programs around the world
reviewed below (Table 18).

88
Table 19: Top 10 world-wide Mechanical Engineering programs
Rank
Name of Institution
Location
Experimental Labs
Computational Labs
1
Massachusetts Institute of Technology (MIT)
United States
Mechanics of solid
Laboratory
Engineering Thermodynamics
Automated Modeling Laboratory
Fluid Mechanics Laboratory
Bio-MicroElectro Mechanical Systems Lab
Heat Transfer laboratory
Computational Flow Physics Laboratory
Computational Mechanics Laboratory
Computational Physics Group
2 Stanford University
United States
3 University of Cambridge
United Kingdom
4
University of California, Berkeley (UCB)
United States
5 University of Michigan
United States
6 Imperial College London
United Kingdom
7 Georgia Institute of Technology
United States
8
National University of Singapore (NUS)
Singapore
9 University of Oxford
United Kingdom
10 Harvard University
United States

89
5.3.1.1 MECHANICS OF SOLID LABORATORY
Mechanical Engineer utilizes, study and develop apparatus, machines, and
structures, extending from wrenches to autos to rockets. The instructive foundation
for this incorporates courses in statics, motion, mechanics of materials, and other
related subjects. For instance, knowledge of unbending bodies is required in summing
up the range of burdens on an auto, which is vital in characterising the vehicle's
distortions and long haul solidness (Kreith 1999). Various equipment and instruments
are essential in a mechanics of solid laboratory. A few examples include Universal
testing machine, Torsion testing machine, Impact testing machine, Brinell hardness
testing machine, Rockwell hardness testing machine. These equipment demonstrate
the fundamental the quality and mechanics of materials to prospective students. The
material properties of interest include sway quality, elasticity, compressive quality,
hardness, flexibility and so on (ACE College of Engineering 2015).

90
Figure 26: Mechanics of Solid Laboratory in Curtin University.
5.3.1.2 THERMODYNAMICS LAB
Thermodynamics is both a branch of material science and a designing science.
Mechanical Engineer are typically keen on picking up an essential comprehension of
the physical and compound conduct of fixed, tranquil amounts of substances and uses
the standards of thermodynamics to relate the properties of matter.
Engineers are by large keen on considering thermodynamics frameworks and
how they communicate with the environment. To encourage this, engineers have
extended the subject of thermodynamics to investigate the frameworks through which
matter streams. (Keith 1999). Thermodynamics laboratory may consists of different
equipment’s such as turbo charged diesel motor or generator station, calorimeter for
fuel examination, air heat-recuperation ventilator (white nook) that is used to test the
indoor air quality and motor dynamometer. Students are acquainted with the weight,
temperature, and humidity of the testing appliances, for example, transducers,
vacuum gauges, thermocouples, and other gauges. Motor proficiency and execution
tests are led, whereby students learn the fundamental properties of different liquids
(Wentworth Institute of Technology 2015).

91
5.3.1.3 HEAT TRANSFER LABORATORY
The heat transfer laboratories are utilised for trial research on heat exchange and heat
hydrodynamics. The experimentation laboratories is normally equipped with a few
stream circles, high current power and flow force supplies, high recurrence instigation
force supplies, holography and hot wire anemometry setups (UCLA Engineering 2015).
There are additionally types of appliance and sensors that enable future students to
get familiarised with and this include the transient heat exchange and lumped system
examination, radiation successes, heat sink, and heat channels (Wentworth Institute of
Technology 2015).

92
5.3.1 1ST FLOOR OF THE BUILDING
Laboratories and undergraduate workshops consists a total area of 600m2. This
enables a stronger engagement between tutors and students and thus improves the
interaction between one another. Research laboratories may consist of computers and
other electronic appliances that would assist students in conducting their research for
projects and assignments by sourcing information from journals and other resources
online.
5.3.2 2ND Floor of the Building
There would be computer labs on the 2nd floor of the building, which would have
approximately 60 computers. A common area as well as a study area will also be
included on this floor.
5.3.3 3RD Floor of the Building
The 3rd floor of the building would be designed as offices spaces. There will be 30 small
offices which make up to a total area of 600 square meters. The offices are designed
with double glazing windows with suitable insulation materials for the staff’s comfort.
Waterless urinals are implemented in the office’s toilet in order to reduce water usage.

93
CHAPTER 6: NEW BUILDING INTEGRATION STRATEGIES REVIEW
In order to achieve sustainability purpose, most green building designers utilise
technologies and computer simulations based on building information modelling (BIM)
during the first stage of the project. BIM analyses and simulates options during the
design development of a green building to optimise the building energy consumption
through energy use simulation. (Lee 2011). It is becoming an essential part of the
project implementation practice in the architecture and development industry due to
the reason that BIM technology addresses the major input elements of a building. This
modelling tool favours the developers because it integrates all building performance
modeling and enables them to implement effortlessly (Khemlani 2009). Essentially,
building information modelling (BIM) is a new approach of gathering the layout and
information of building projects.
Building - the whole lifecycle of the building is well thought-out (drawing,
manufacture, performance)
Information - all details about the building and its lifecycle are integrated
Modelling – characterising and simulating the building, its delivery, and
procedure using incorporated tools (Bentley System 2011)
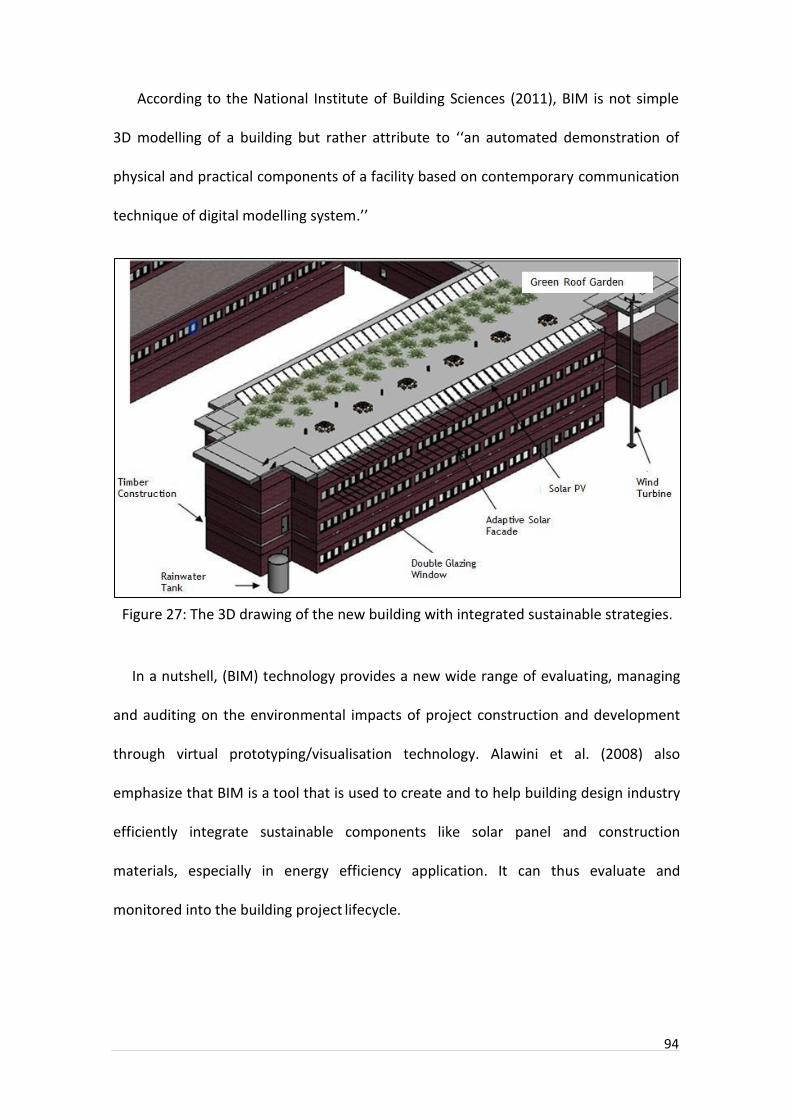
94
According to the National Institute of Building Sciences (2011), BIM is not simple
3D modelling of a building but rather attribute to ‘‘an automated demonstration of
physical and practical components of a facility based on contemporary communication
technique of digital modelling system.’’
In a nutshell, (BIM) technology provides a new wide range of evaluating, managing
and auditing on the environmental impacts of project construction and development
through virtual prototyping/visualisation technology. Alawini et al. (2008) also
emphasize that BIM is a tool that is used to create and to help building design industry
efficiently integrate sustainable components like solar panel and construction
materials, especially in energy efficiency application. It can thus evaluate and
monitored into the building project lifecycle.
Figure 27: The 3D drawing of the new building with integrated sustainable strategies.
95
6.1 RAINWATER HARVESTING FOR LABORATORY PURPOSE
The use of rainwater harvesting in conjunction with other water supplies and a
rooftop garden including rainwater harvesting system is functional for laboratory use.
Onsite rooftop rainwater with minimum treatment has been employed as a cost-
effective and alternative water resource (Ahmed et al. 2014; Zhang et al. 2009).
Harvesting rainwater can simultaneously reduce water stress and environmental
pollution, help to prevent floods created by low soil permeability and is recognised as a
flexible strategy to deal with the reduction of water availability due to climate change
(Angrill et al. 2011; Schudel 1996). Rainwater can be conveyed and distributed to rain
water storage tanks. Water leaving the tank will be filtered, disinfected and distributed
back to the Mechanical Engineering Building to supplement specific indoor potable
demands, such as laboratory uses (deionised water) and/or cooling tower make-up
water.
In research laboratories rainwater is estimated to be mainly used as a supply of
deionised (DI) water. DI water has the mineral ions removed (demineralised water)
compared to scheme water. Many laboratory procedures use deionised water
including preparation of various reagents, preparation of calibration standards or
analytic blanks, and cleaning of laboratory equipment. Due to the reason that
rainwater contains fewer impurities than treated wastewater, it requires less filtration
for high end research purposes and consequently less energy for its treatment. This
makes the business case for rainwater harvesting and reuse attractive for laboratory
purposes (Pantelic 2014).

96
6.2 WASTEWATER TREATMENT PLANT
According to the recent research, irrigation demand in Murdoch University is
currently met by groundwater level and the groundwater safety measures is a key
sustainable water driver, fully offsetting or greatly contributing to the irrigation
requirement via use of recycled water is a major sustainable water management
proposal. All the wastewater generated from the new MEB will be directed to the
proposed wastewater treatment plants located underground that right beside the
Green Mechanical Engineering building. Overflows and emergency flows from the
Wastewater Treatment plant will be sent back to the Water Corporation gravity sewer.
The collected raw wastewater will be treated in a WWTP that will be most likely be a
type of Membrane Bioreactor (MBR) sized to accommodate maximum development
flows (Pantelic 2014).
The Membrane Bioreactor system components are expected to include:
Inlet mechanical screen;
Balancing /Settling tank;
Anoxic/ Aeration tanks;
Membrane system (ultrafiltration);
Disinfection systems which includes UV disinfection + chlorine dosing;
SCADA telemetry; and
Treated effluent tanks (Pantelic 2014).

97
6.3 TIMBER PREFABRICATED CONSTRUCTION
Cross Laminated Timber (CLT) panels were developed in Austria in 1995. By
description a CLT panel consist of waste strips of structural grade timber compressed
and bonded using a biodegradable structural adhesive. These two elements are fixed
together by compressing and laminating them alternating between longitudinal and
transverse lines, which are comparable to strengthen concrete (Lehmann 2012;
Lehmann et al. 2012). The lifecycle of a CLT panel is shown below (Figure 33).
If managed properly, CLT panels can be an efficient and sustainable building alternative.
One of the more innovative features of CLT technologies is the reduction in
construction time, this varies anywhere between 15 to 30% reduction in the total time
which includes the design and procurement phases compared to a concrete
Figure 28: The CLT lifecycle form (Lehmann et al. 2012).

98
constructed building (Hayball 2014). In some cases it has been documented up to 50%
faster than conventional construction times (Lehmann 2012). An example Gantt
diagram can be seen in the Appendix A comparing construction times of a conventional
construction vs. CLT construction. The material costs are currently only around 4%
cheaper than conventional construction materials (Hixon 2014; CLT Feasibility Study
2014). As industry accepts CLT and other timber construction materials and becomes
more common, material costs and labour costs will decrease as well.
In comparison to conventional construction methods, CLT constructed buildings
can reduce the embodied energy of buildings from roughly 550 kg CO2/sqm to around
300 kg CO2/sqm. This is a combination of prefabrication of the CLT panels that are
made to exact dimensions with minimal waste and the use of low-impact finishes. The
material is highly efficient with around a 0.75 m3 of CLT per sqm of apartment space
(Lehmann et al. 2012).
A brief summary table of CLT panels in a comparison with conventional concrete
construction can be seen below (Table 19).

99
Table 20: Comparison of CLT panels and conventional concrete construction.
CLT Conventional Construction
Material Cost 4% Cheaper than BAU (Hixon
2014, CLT Feasibility Study
2014)
n/a
Time up to 30% Faster (Hayball
2015)
n/a
Embodied Carbon 300kg CO2 per sqm.
(Lehmann et al. 2012)
550kg CO2 per sqm. (Lehmann
et al. 2012)
Carbon Capture Potential 0.25 to 0.8 tonne per cubic
meter (Smith 2013; Lehmann
et al. 2012)
0
Heating and Cooling 25% reduction (Lend Lease
2012)
n/a
Other benefits of CLT include:
Building design and modelling done before CLT is manufactured, so there is minimal
waste.
Timber constructions are light weight, about 20% the weight of concrete which
reduces the foundation requirements.
High thermal performance of the panels, increased air tightness of the building which
reduces the amount of insulation required for high energy efficiency.

100
6.4 GREEN ROOF GARDEN
Urban green infrastructures like vegetative roof top garden played as a vital part
of water management and also promotes towards environmental sustainability (Gill,
Handley, Ennos and Pauleit 2007; Schmidt 2010). Green roofs provide many ecosystem
processes and services, including stormwater management, cooling and insulation of
buildings, mitigation of the urban heat island effect, contribution to human health and
habitat provisioning (Oberndorfer et al. 2007). Green roof gardens are designed to be
situated on the top of the 4th floor and includes local natives’ plants which provide
creative purpose and habitat for various species. It also acts as an effective education
and awareness tools. Green roof garden enable direct public viewing and are an
obvious and effective way to educate and raise awareness about sustainability and
resource conservation. In addition to extenuating urban heat islands, the advantage of
green roofs includes:
Reduced air pollution and carbon emission because plants can also remove air
pollutants and carbon emissions through dry deposition and carbon
sequestration and storage.
Green roof garden will be able to reduce heat transfer through the building roof
which simultaneously improving the indoor comfort and human health.
Green roof garden mitigate as well as reduce storm water runoff in the urban
environment- dampening of peak velocity run off during storm events.

101
Improvement in remnant vegetation connectivity and private open space
provision in the development, including provision of a ‘third dimension’ to a
biodiversity link.
102
CHAPTER 7: CONCLUSION
By producing this thesis report, IES-VE modelling tools are useful to simulate
the energy consumption based on the whole building materials and operation
procedures which included the staff working hours and also the building’s location and
its topography information. The 3D modelling drawing is also generated from IES-VE
drawing tool to identify the existing building structure. The 3D drawing results enable
the establishment of the new building design strategies.
Based on the results shown, the existing Science and Computing building
consume a relatively large energy demand due to the reason that existing building
materials are not sustainable which have created large carbon footprint to our
environment. On top of that, lack of annual system maintenance and energy audit are
carried out to improve the building energy use efficiency. Throughout the energy
simulation process, the existing building material types and operating issues are
identified and therefore energy efficiency strategies is discussed to reduce the total
energy consumption and total carbon footprint.
NABERS rating tools, a new environmental performance evaluation tool are
carried out by embedded the existing building total energy consumption. The NABERS
ratings enable stakeholders to classify their building net energy consumption in order
to achieve green building criteria. On the other hand, NABERS self-rating tools provide
an interpretation function which enable to calculate the allowance of maximum energy
consumption for a new design building in order to improve its sustainable achievement.
The existing Science and Computing building receive 0 stars from NABERS rating results
which indicate that building energy use is significant for improvement and building
management is necessary to enhance the building operational performance.
103
In this thesis report, analysis and in depth research based on the essential
requirement for Mechanical Engineering building is accomplished in order to fit for
itspurpose. On the other hand, a 3D drawing for the future Mechanical Engineering
building is sketched out like the buildings’ dimensions and structure description in order
to use as a reference tool for stakeholders for future design project and also gain for
public understanding.
The new Mechanical engineering building is suggested with low energy
strategies in order to upgrade its sustainable performance, which can improve
University’s reputation. The possible energy efficient strategies will be mainly focus on
the building concept and the material used. Moreover, for the purpose to lead the new
Mechanical Engineering building towards the greener community, some of the potential
sustainable integration strategies are recommended for implementation especially the
renewable resources strategies in order to preserve our environment.
104
CHAPTER 8: RECOMMENDATION AND FUTURE WORK
In depth investigation and design structure of the new Mechanical Engineering
building is significant for development based on the building’s function and its
extended use.
Retrofit the green building design and purpose to the new building development
in order to achieve a sustainable community
The energy simulation and reduction strategies like building management
system is suggested in order to monitor the future mechanical engineering
building energy use and identify any electricity power issue.
Benchmarking on the performance of the new building is significant after the
building design phase to determine their current performance and also figure
out the low energy use operation strategies. . Performing benchmarking may
enhance the pathway for attaining Green Star-Performance (GBCA, 2013) and
NABERS rating (NABERS, 2013)
In-depth or further research is crucial to identify the most efficient and
sustainable building materials and cost analysis is crucial to carry out in order to
evaluate its life time performance
Integrated strategies like rainwater treatment, wastewater treatment and
stormwater treatment plants should be evaluated based on the cost analysis and
operation performance in order to reduce water use and improve the
wastewater quality before it discharge.

105
References
A John, S., Nebel, B., Perez, N., Buchanan, A.H., 2009. Environmental Impacts of
Multistorey Buildings Using Different Construction Materials. Report.
Department of Civil and Natural Resources Engineering. University of Canterbury,
Christchurch, New Zealand
ACE College of Engineering,. 2015. 'MECHANICS OF SOLIDS LAB'.
https://www.acetvm.com/mechanics-of-solids-lab/.
Admin, S. (2015). Energy Efficient Office Buildings - Sustainability Victoria -
Sustainability Victoria. [online] Sustainability.vic.gov.au. Available at:
http://www.sustainability.vic.gov.au/services-and- advice/business/resource-
efficient-buildings/energy-efficient-office- buildings [Accessed 4 Nov. 2015].
Ahmed, W., Brandes, H., Gyawali, P., Sidhu, J.P.S., Toze, S., 2014.
Angrill, S., Farreny, R., Gasol, C.M., Gabarrell, X., Vinolas, B., Josa, A., Rieradevall,
J., 2011. Environmental analysis of rainwater harvesting infrastructures in diffuse
and compact urban models of Mediterranean climate. Int. J. Life Cycle Assess. 17
(1), 25–42, http://dx.doi.org/10.1007/s11367-011-0330-6
Austrade.gov.au,. 2015. 'Australian Green And Sustainable Building - Leaders In
Innovation And Collaboration - Austrade'.
https://www.austrade.gov.au/greenbuildings/.
Australian Double Glazing,. 2015. 'About Double Glazing | Australian Double
Glazing'.
Australian Hotel Association,. BEHAVIOUR CHANGE FOR ENERGY EFFICIENCY.
Australian Hotel Association.
106
Bentley System, 2015 About BIM
http://www.bentley.com/enAU/Solutions/Buildings/About+BIM.html.
Bin, Shui. 2012. Greening Work Styles: An Analysis Of Energy Behavior Programs
In The Workplace. Washington, DC: American Council for an Energy Efficient
Economy.
Buchanan, Andrew H., and Brian G. Honey. 1994. 'Energy And Carbon Dioxide
Implications Of Building Construction'. Energy And Buildings 20 (3): 205-217.
doi:10.1016/0378-7788(94)90024-8.
Buildingpoint.com.au,. 2015. 'Sketchup'.
http://buildingpoint.com.au/sketchup/index.html.
Chen, Y.J., 2012. Comparison of Environmental Performance of a Five- storey
Building Built with Cross-laminated Timber and Concrete (Thesis). Department of
Wood Science.
D. Kim, Y. Kim, J. Cho, Development of GHGs Emission Inventory System for
Gyeonggi-Do, Policy Research 2008-03, Gyeonggi Research Institute, Suwon,
2008.
Data Center Knowledge, (2014). Optimizing Power System Monitoring and
Control | Data Center Knowledge. [online] Available at:
http://www.datacenterknowledge.com/archives/2014/04/16/optimizing-
power-system-monitoring-control/ [Accessed 4 Nov. 2015].
Deng, S., Dai, Y., Wang, R. & Zhai, X., 2011. Case study of green energy system
design for a multi-function building in campus. Institute of Refrigeration and
Cryogenics, Shanghai Jiao Tong University. Volume 1, pp. 152-163.
Department of Climate Change and Energy Efficiency,. 2015. Baseline Energy

107
Consumption And Greenhouse Gas Emissions In Commercial Buildings In Australia
– Part 1 - Report. Australia: Department of Climate Change and Energy Efficiency.
Department of Industry, Innovation and Science,. 2013. Factsheet - Basics Of
HVAC Energy Efficiency. Department of Industry, Innovation and Science.
Designingbuildings.co.uk,. 2015. 'U-Values - Designing Buildings Wiki'.
http://www.designingbuildings.co.uk/wiki/U-values.
Eco-Business,. 2014. 'Cool Technology For Singapore’S Most Energy Efficient
Office'. http://www.eco-business.com/news/cool-technology-singapores- most-
energy-efficient-office/.
EcoMENA,. "Features Of A Green Building". N.p., 2015. Web. 28 Dec. 2015.
Energy Efficient Glazing. 2015. Ebook. 1st ed. Adelaide City Council. Accessed
October 30.
http://www.adelaidecitycouncil.com/assets/acc/Development/planning-
building/docs/glazing_fact_sheet.pdf
Energy-models.com,. 2015. 'Energy Modeling | Energy-Models.Com'.
http://energy-models.com/what-is-energy-modeling-building-simulation
Frahm, J.M., Pollefeys, M., Lazebnik, S., Gallup, D., Clipp, B., Raguram, R., Wu, C.,
Zach, C., Johnson, T., 2010. Fast robust large-scale mapping from video and
internet photo collections. ISPRS J. Photogramm. Rem. Sens. 65 (6), 538–549
Garber R (2009). Optimisation stories: The impact of building information
modelling on contemporary design practice. Architectural Design, 79(2): 6- 13.
Gill, S. E., Handley, J. F., Ennos, A. R., & Pauleit, S. (2007). Adapting cities for
climate change: The role of the green infrastructure. Built Environment, 33, 115–
133. http://dx.doi.org/10.2148/benv.33.1.115

108
Gill, S. E., Handley, J. F., Ennos, A. R., & Pauleit, S. (2007). Adapting cities for
climate change: The role of the green infrastructure. Built Environment, 33, 115–
133. http://dx.doi.org/10.2148/benv.33.1.115
Gimenez, Lucile, Jean-Laurent Hippolyte, Sylvain Robert, Frédéric Suard, and
Khaldoun Zreik. 2015. 'Review: Reconstruction Of 3D Building Information
Models From 2D Scanned Plans'. Journal Of Building Engineering 2: 24-35.
doi:10.1016/j.jobe.2015.04.002.
Google Maps, 2013.Murdoch University South Street. [Online] [Accessed 03
November 2015].
Gregory J, Silviera S, Derrick A, Cowley P, Allinson C, Paish O. 1997. Financing
Renewable Energy Projects: A Guide for Development Workers. London:
Intermediate Technology Publications.
Hamzahyeang.com,. 2013. 'Digi Technology Operation Centre | T. R. Hamzah &
Yeang Sdn. Bhd. | Ecoarchitecture | Ecomasterplanners | Green Design |
Ecoinfrastructure| Eco Master Planning And Eco Architecture Malaysia'.
http://www.hamzahyeang.com/2013/09/caag-tower-green- building-
technology/.
Hayball,. 2015. 'CLT Technology, Fact Sheet - Hayball'. Accessed October 22.
http://www.hayball.com.au/news/clt-technology-fact-sheet/.
http://australiandoubleglazing.com.au/double-glazing- information-
centre/about-double-glazing/.
http://www.institutebe.com/InstituteBE/media/Library/Resources/Building%20
Performance%20Management/Building-Performance- Management_Driving-
Behavior-Change.pdf.

109
Insightprojects.com.au,. 2015. '3 Ways To Achieve Sustainable, Energy Efficient
Office Design - Blog - Insight Projects'.
http://www.insightprojects.com.au/blog/3-ways-to-achieve-sustainable- energy-
efficient-office-design/.
Josh's House,. 2015. 'Solar Energy Storage Goes Live At Josh’S House'.
http://joshshouse.com.au/solar-energy-storage-goes-live-at-joshs-house/.
Judelson J. The green building revolution. Island Press; 2007, ISBN 978-1-59726-
178-4.
Kegel, Nathan. 2015. Autodesk Revit To IESVE. Advanced Hints And Tips For
Better Translation. Integrated Environmental Solutions (IES). Accessed October
28.
Kelly M. Energy efficiency, resilience to future climates and long-term
sustainability: The role of the built environment, Philos Trans R Soc London, Ser
A 2010; 368:1083–1089
Khemlani, L. (2009). Sustainable design tools exhibited at AIA 2009. Retrieved
September 7, 2010,
http://www.aecbytes.com/feature/2009/AIA2009_EnergyApps.html.
Kibert CJ. Sustainable construction: green building design and delivery. 3rd ed.
John Wiley & Sons, Inc; 2012, ISBN 978-1-118-33013-5
Kreith, Frank. 1999. Mechanical Engineering Handbook. Boca Raton, FL: CRC
Press.
Lehmann, S., Hamilton, C., 2011. Sustainable Infill Development Using Low
Carbon CLT Prefabrication: Adaptation for the South Australian Context. Zero
Waste SA Research Centre for Sustainable Design and Behaviour: University of

110
South Australia, Adelaide, Australia.
Lehmann, Steffen. 2012. Sustainable construction for urban infill development
using engineered massive wood panel systems. Sustainability 4 (12): 2707-42.
Lippke, Bruce, Elaine Oneil, Rob Harrison, Kenneth Skog, Leif Gustavsson, and
Roger Sathre. 2011. 'Life Cycle Impacts Of Forest Management And Wood
Utilization On Carbon Mitigation: Knowns And Unknowns'. Carbon Management
2 (3): 303-333. doi:10.4155/cmt.11.24.8.
Long, Linshuang, Hong Ye, Haitao Zhang, and Yanfeng Gao. 2015. 'Performance
Demonstration And Simulation Of Thermochromic Double Glazing In Building
Applications'. Solar Energy 120: 55-64. doi:10.1016/j.solener.2015.07.025.
Mae.ucla.edu,. 2015. 'Laboratories | MAE'.
http://www.mae.ucla.edu/laboratories-7/.
McElligott, Molly, Melissa Donnelly, Jennifer Layke, and Clay Clay. 2013. DRIVING
BEHAVIOR CHANGE Engaging Employees In Environmental Sustainability. Ebook.
1st ed. Washington DC: Johnson Controls
Mitchell L. Green star and NABERS: learning from the Australian experience with
green building rating tools. In: Bose RK, editor. Energy efficient cities:
assessment tools and benchmarking practices. United States: Washington D.C:
The World Bank; 2009.
Morel J.C., Mesbah A., Oggero M., Walker P., Building houses with local
materials: means to drastically reduce the environmental impact of construction,
Building and Environment 36 (2001), 1119 – 1126
Mueller, A., A. Schnell, and K. Ruebner. 2015. 'The Manufacture Of Lightweight
Aggregates From Recycled Masonry Rubble'. Construction And Building Materials

111
98: 376-387. doi:10.1016/j.conbuildmat.2015.07.027.
Murdoch.edu.au,. 2015. 'Eastern Precinct | Murdoch University In Perth
Australia'. http://www.murdoch.edu.au/Eastern-precinct/.
NABERS. 2014. About the NABERS Program.
http:/www.nabers.gov.au/public/WebPages/DocumentHandler.ashx?docTy
pe=3&id=12&attId=0.
National Institute of Building Sciences (2011). About the National BIM Standard-
United States™. Retrieved January 10, 2011, from
http://www.buildingsmartalliance.org/index.php/nbims/about/.
Oberndorfer, E., Lundholm, J., Bass, B., Coffman, R. R., Doshi, H., Dunnett, N., et
al. (2007). Green roofs as urban ecosystems: Ecological structures, functions, and
services. BioScience, 57, 823–833. http://dx.doi.org/10.1641/B571005
Oberndorfer, E., Lundholm, J., Bass, B., Coffman, R. R., Doshi, H., Dunnett, N., et
al. (2007). Green roofs as urban ecosystems: Ecological structures, functions, and
services. BioScience, 57, 823–833. http://dx.doi.org/10.1641/B571005
Oneil, E., Lippke, B., 2010. Integrating products, emission offsets, and wildfire
into carbon assessments of inland northwest forests. Wood Fiber Sci. 42,
144e164.
Oneil, E., Lippke, B., 2010. Integrating products, emission offsets, and wildfire
into carbon assessments of inland northwest forests. Wood Fiber Sci. 42,
144e164.
Opportunistic pathogens in roof-captured rainwater samples, determined using
quantitative PCR. Water Res. 53, 361e369.
http://dx.doi.org/10.1016/j.watres.2013.12.021.

112
Pérez-Lombard, Luis, José Ortiz, and Christine Pout. 2008. 'A Review On Buildings
Energy Consumption Information'. Energy And Buildings 40 (3): 394-398.
doi:10.1016/j.enbuild.2007.03.007.
Pérez-Lombard, Luis, José Ortiz, and Christine Pout. 2008. 'A Review On Buildings
Energy Consumption Information'. Energy And Buildings 40 (3): 394-398.
doi:10.1016/j.enbuild.2007.03.007.
Praseeda, K.I., B. V. Venkatarama Reddy, and M. Mani. 2015. 'Embodied And
Operational Energy Of Urban Residential Buildings In India'. Energy And Buildings.
doi:10.1016/j.enbuild.2015.09.072.
Praseeda, K.I., B. V. Venkatarama Reddy, and M. Mani. 2015. 'Embodied And
Operational Energy Of Urban Residential Buildings In India'. Energy And Buildings.
doi:10.1016/j.enbuild.2015.09.072.
Raicu, Alexandra, Helen Rose Wilson, Peter Nitz, Werner Platzer, Volker Wittwer,
and Ekkehard Jahns. 2002. 'Facade Systems With Variable Solar Control Using
Thermotropic Polymer Blends'. Solar Energy 72 (1): 31-42. doi:10.1016/s0038-
092x(01)00093-7.
Raicu, Alexandra, Helen Rose Wilson, Peter Nitz, Werner Platzer, Volker Wittwer,
and Ekkehard Jahns. 2002. 'Facade Systems With Variable Solar Control Using
Thermotropic Polymer Blends'. Solar Energy 72 (1): 31-42. doi:10.1016/s0038-
092x(01)00093-7.
T. Prato, Conceptual framework for assessment and management of ecosystem
impacts of climate change, Ecol. Complex. 5 (2008) 329–338.
T. Prato, Conceptual framework for assessment and management of ecosystem
impacts of climate change, Ecol. Complex. 5 (2008) 329–338.

113
The Facts On Greenpower. 1st ed. New South Wales: Green Power, 2015. Web.
28 Dec. 2015.
The Facts On Greenpower. 1st ed. New South Wales: Green Power, 2015. Web.
28 Dec. 2015.
The IES Virtual Environment-User Guide. 2015. Ebook. 1st ed. Integrated
Environmental Solutions Limited.
http://www.iesve.com/downloads/help/VE2015/VirtualEnvironment.pdf.
The IES Virtual Environment-User Guide. 2015. Ebook. 1st ed. Integrated
Environmental Solutions Limited.
http://www.iesve.com/downloads/help/VE2015/VirtualEnvironment.pdf.
Thefifthestate.com.au,. 2016. "The Fifth Estate | Threats To RET Bad For
Greenpower And Possibly NABERS".
http://www.thefifthestate.com.au/politics/government/threats-to-ret-could-
rope-in-greenpower-and-nabers/67985.
Thefifthestate.com.au,. 2016. "The Fifth Estate | Threats To RET Bad For
Greenpower And Possibly NABERS".
http://www.thefifthestate.com.au/politics/government/threats-to-ret-could-
rope-in-greenpower-and-nabers/67985.
Uts.edu.au,. 2015. 'Mechanical And Mechatronic Engineering Laboratories |
University Of Technology Sydney'. http://www.uts.edu.au/about/faculty-
engineering-and-information-technology/what-we-do/facilities-and- services-0.
Uts.edu.au,. 2015. 'Mechanical And Mechatronic Engineering Laboratories |
University Of Technology Sydney'. http://www.uts.edu.au/about/faculty-
engineering-and-information-technology/what-we-do/facilities-and- services-0.

114
Wit.edu,. 2015. 'Mechanical Engineering And Technology Laboratories :
Wentworth Institute Of Technology'. http://www.wit.edu/mechanical-
engineering/about/labs.html.
Wit.edu,. 2015. 'Mechanical Engineering And Technology Laboratories :
Wentworth Institute Of Technology'. http://www.wit.edu/mechanical-
engineering/about/labs.html.
Wong, Peter S.P., Aiden Lindsay, Lachlan Crameri, and Sarah Holdsworth. 2015.
'Can Energy Efficiency Rating And Carbon Accounting Foster Greener Building
Design Decision? An Empirical Study'. Building And Environment 87: 255-264.
doi:10.1016/j.buildenv.2015.02.006.
Wong, Peter S.P., Aiden Lindsay, Lachlan Crameri, and Sarah Holdsworth. 2015.
'Can Energy Efficiency Rating And Carbon Accounting Foster Greener Building
Design Decision? An Empirical Study'. Building And Environment 87: 255-264.
doi:10.1016/j.buildenv.2015.02.006.
You, Fang, Dan Hu, Haitao Zhang, Zhen Guo, Yanhua Zhao, Bennan Wang, and Ye
Yuan. 2011. 'Carbon Emissions In The Life Cycle Of Urban Building System In
China—A Case Study Of Residential Buildings'. Ecological Complexity 8 (2): 201-
212. doi:10.1016/j.ecocom.2011.02.003.
You, Fang, Dan Hu, Haitao Zhang, Zhen Guo, Yanhua Zhao, Bennan Wang, and Ye
Yuan. 2011. 'Carbon Emissions In The Life Cycle Of Urban Building System In
China—A Case Study Of Residential Buildings'. Ecological Complexity 8 (2): 201-
212. doi:10.1016/j.ecocom.2011.02.003.
Zhang, Man, Liqiang Zhang, P. Takis Mathiopoulos, Yusi Ding, and Hao Wang.
2013. 'Perception-Based Shape Retrieval For 3D Building Models'. ISPRS Journal

115
Of Photogrammetry And Remote Sensing 75: 76-91.
doi:10.1016/j.isprsjprs.2012.10.001
Zhang, Man, Liqiang Zhang, P. Takis Mathiopoulos, Yusi Ding, and Hao Wang.
2013. 'Perception-Based Shape Retrieval For 3D Building Models'. ISPRS Journal
Of Photogrammetry And Remote Sensing 75: 76-91.
doi:10.1016/j.isprsjprs.2012.10.001.

116
APPENDICES
Figure 29: Science and Computing Building level 1 floor plan

117
Figure 30: Science and Computing Building level 2 floor plan

118
Figure 31: Science and Computing Building Level 3 floor plan.
Figure 32: Existing Building material information for IES-VE simulation.

119
Figure 33: Input information (LOCATION) for the existing building.

120
Figure 34: Input information (WEATHER) for the existing building..
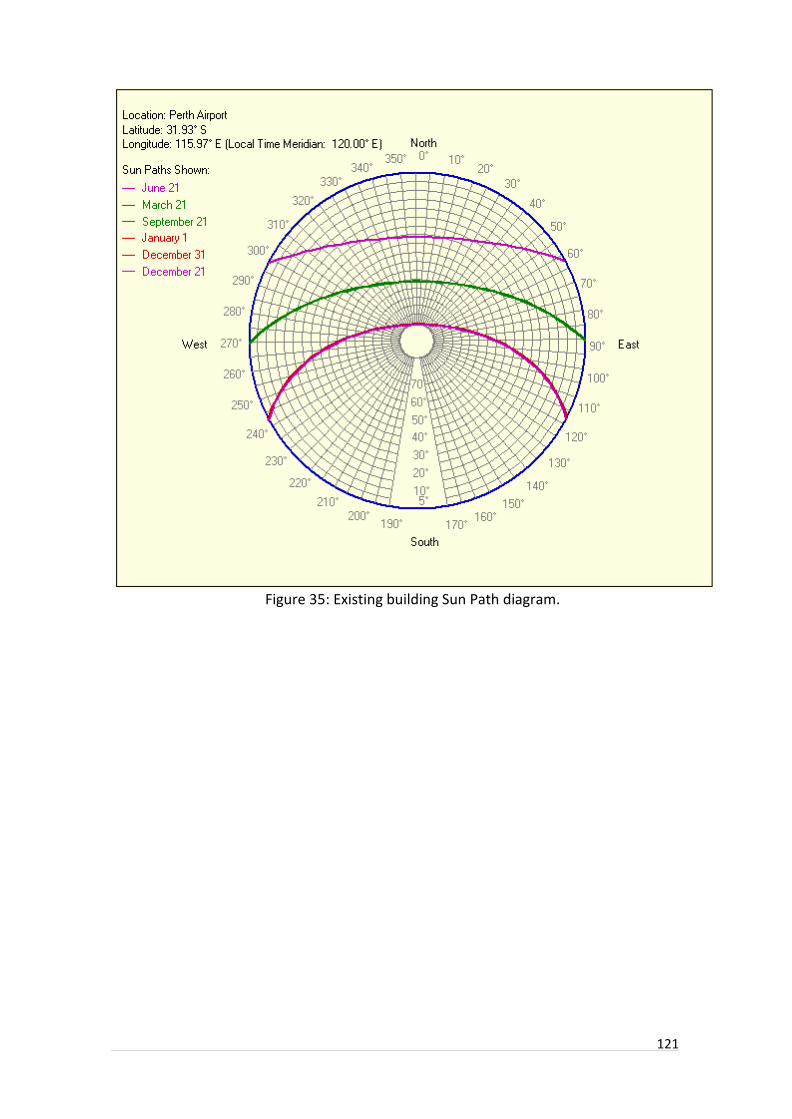
121
Figure 35: Existing building Sun Path diagram.

120
Figure 36: Existing Building Weather Data.

121
Figure 37: Existing Building systems energy report.
Figure 38: Engagement Methods for workplace environmental sustainability programs

122
.
Figure 39: NABERS reverse calculator result for 4 star ratings.
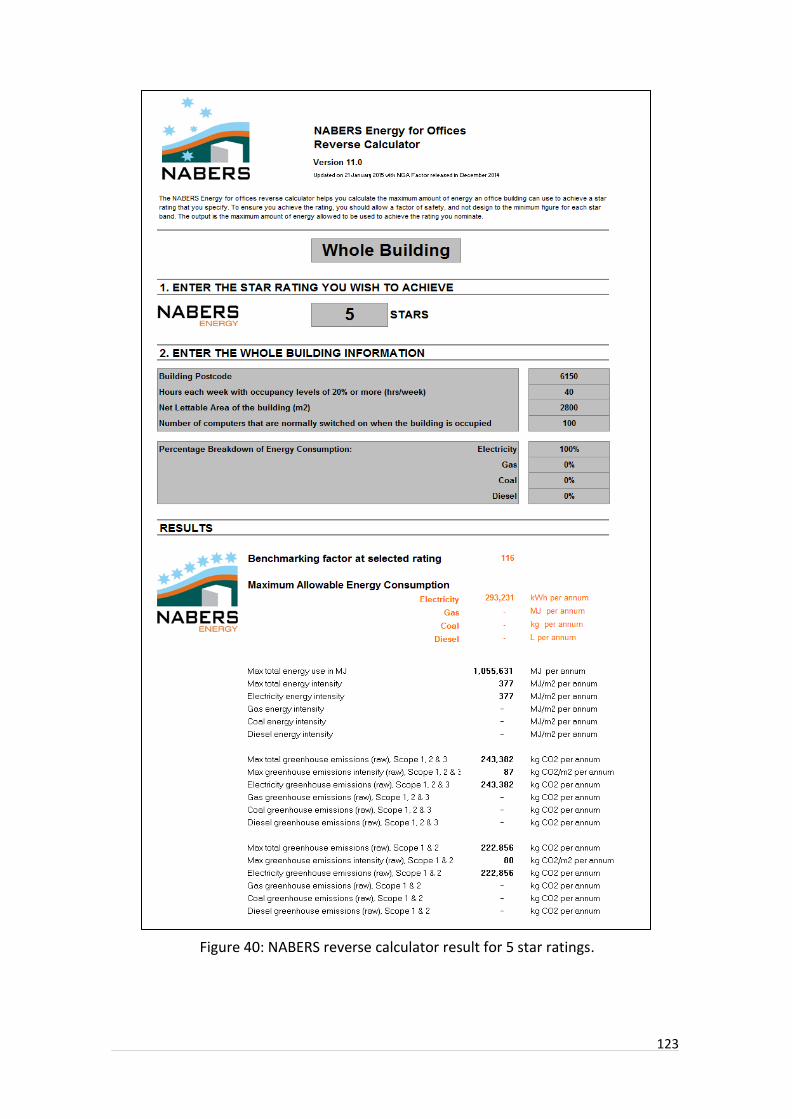
123
Figure 40: NABERS reverse calculator result for 5 star ratings.

124
Figure 41: NABERS reverse calculator result for 6 star ratings.
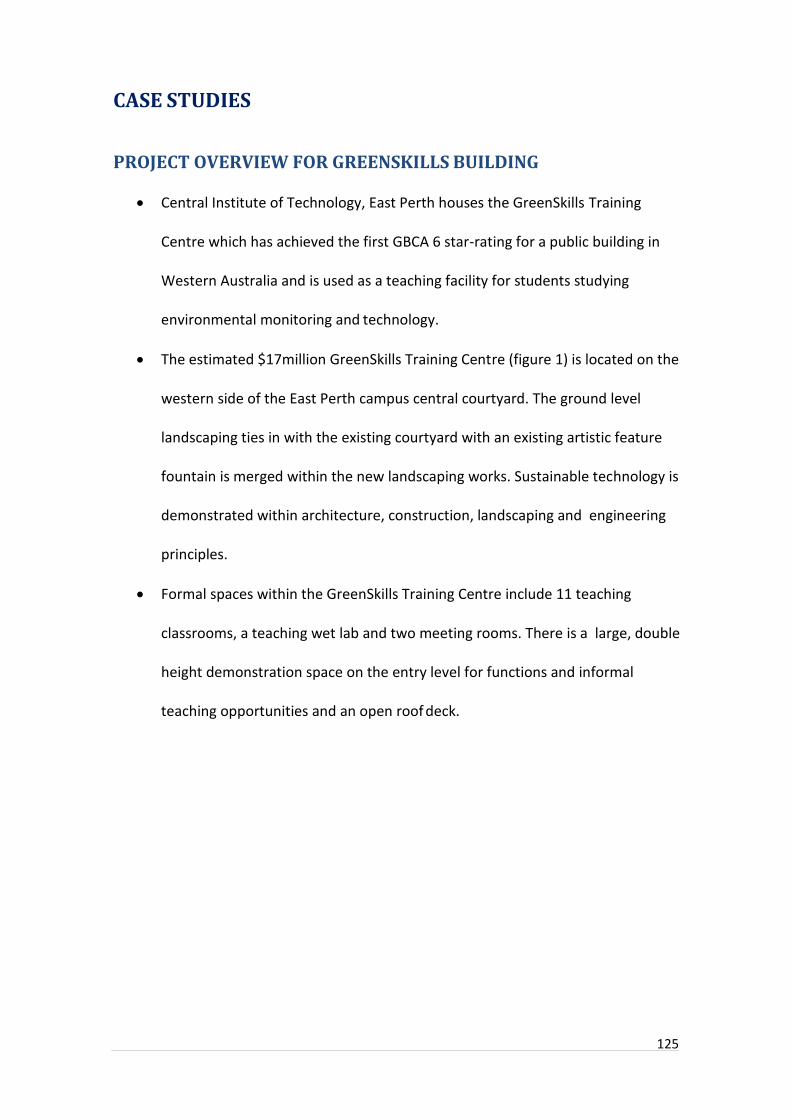
125
CASE STUDIES
PROJECT OVERVIEW FOR GREENSKILLS BUILDING
Central Institute of Technology, East Perth houses the GreenSkills Training
Centre which has achieved the first GBCA 6 star-rating for a public building in
Western Australia and is used as a teaching facility for students studying
environmental monitoring and technology.
The estimated $17million GreenSkills Training Centre (figure 1) is located on the
western side of the East Perth campus central courtyard. The ground level
landscaping ties in with the existing courtyard with an existing artistic feature
fountain is merged within the new landscaping works. Sustainable technology is
demonstrated within architecture, construction, landscaping and engineering
principles.
Formal spaces within the GreenSkills Training Centre include 11 teaching
classrooms, a teaching wet lab and two meeting rooms. There is a large, double
height demonstration space on the entry level for functions and informal
teaching opportunities and an open roof deck.

126
Figure 1. GreenSkills Training Centre. Source WAMC.
The 6 Star Green Star – Education Design v1 rating represents world leadership
in environmentally sustainable design and was achieved with use of building
information modelling (BIM) software used from design through to operation.
The BIM design software, which produces 3D imagery, allowed for the efficiency
of the building to be determined before construction and gave architects and
engineers the opportunity to improve or change the design to achieve optimal
outcomes. It is expected that there would be greenhouse gas savings of
134495kg Co2/year.
The building is comprised of a structural steel skeleton with an in-situ concrete
ground slab and pre cast flooring. Footings were constructed to accommodate
shear walls which tie in the flooring and the structural steel. The roof is
comprised of metal sawtooth roof panels so solar panels can be perfectly aligned
to capture the sun. The building also embraces biophilic urbanism with its green
rooftop design.

127
Real time data on buildings performance, energy generation and consumption
are displayed in the building foyer systems and technologies are visible to
students and visitors throughout the building.
Sustainable and renewable materials were used for the building construction,
claddings, fixtures, fittings and furniture. The structural steel and reinforcement
steel are certified to ISO 14001 standards to enable reuse at end of life. Use of
PVC materials were limited and had to meet the best practice guidelines for PVC
in the built environment when used. Timber used in the project (including
cladding timbers, joinery and furnishings, internal and external seating and
concrete formwork) was sourced from forest certification schemes or re-used.
Building elements, structure and technologies were left exposed for viewing to
create a learning tool to show students and visitors how components of the
building fit together and to demonstrate sustainable technologies (figure 2).
Mechanical building systems are automated with aid of building management
system (BMS) that is linked to the campus room booking system which turns on
and off air conditioning so that rooms are cooled when used.

128
Figure 2. Exposed structural steel and building elements.
Continuous data on the building’s energy and environment status can be view on
the LED screen in the entrance foyer. The BMS gathers information from meters
throughout the building and provides real time information on energy and water
consumption, solar power generation, savings from solar generated power and
the water recycling system.
The lighting system has been installed with high efficiency LED fittings, multiple
lighting zones and a lighting control system to allow use of lighting only in the
areas requiring it and at required levels. The lighting system turns off when
rooms are not in use and light fittings can be lowered to ground level by remote
control for servicing.
Active controls switch off lighting and air-conditioning when the building is not in
use, and active heat recovery technology has been installed in the classroom and
atrium air conditioning systems to reduce energy usage.
A building disassembly plan was created to meet the GBCA 6 star criteria and the
structure of the building is designed to be disassembled at the end of its life and
components to be recycled.

129
Figure 3. Roof Solar PV.
Solar photo voltaic (PV) system was installed to offset the buildings energy use.
212 high-efficiency 327-watt solar panels were installed on the roof of the
campus (figure 3). 130 custom made 87W solar panels were also installed on
the building’s façade (figure 4) for additional solar gain as well as shading the
building’s north face from summer sun.
Electricity generated from the solar system is used to power the building and
excess is fed back to building of the campus via a connection system. The solar
system is expected to produce 112MWHa of electricity annually and it is
estimated that it will offset more than 76 tonnes of carbon emissions.
Figure 4. Façade integrated solar PV

130
The inclusion of a blackwater treatment plant (figure 5) reduces the amount of
sewage discharge from site. All of the building’s blackwater is captured in an 11
kilolitre in-ground collection tank and is then treated in a plant that has a
processing capacity of up to 10 kilolitres per day. Treated water is held in two
inground storage tanks with a combined capacity of 38 kilolitres.
Figure 5. Exposed blackwater treatment system.
The blackwater system is designed to take water from the building flows to a
collection tank where it is pumped into the aerobic screening module that
reduces insoluble material to a negligible residue which is discharged to sewer.
Biological treatment then occurs with the aid of air diffusion into the water to
create ideal conditions for bacteria to consume impurities and maintain a
sustainable biomass concentration which metabolises all the incoming waste.
This results in negligible sludge and allows for 99.9 per cent of the incoming
water to be re-used.

131
Ultrafiltration occurs through membranes that contain microscopic pores that
stop particles, bacteria and viruses from passing through. The membranes are
cleaned by air scouring to make sure no wastewater is produced.
The resulting water is then pumped through activated carbon filter and UV unit
for purification and sterilisation before further disinfection by chlorination to
protect the water while in storage and the reticulation system.
Online instrumentation monitors conditions of the recycled water and critical
alarms will shut the system down or divert effluent to sewer via the sludge tank
if there is an issue. When treated water exceeds demand excess water is
diverted back to the sludge tank.
The system offers high recovery rates without backwashing, negligible residue
and low energy usage. These features provide maximum credits for Green Star
or environmentally sustainable design projects.
The treated water is used for buried dripper irrigation to the ground level
landscaped area and also feeds four raised orb planter beds as a demonstration
of a natural nutrient stripping process.
Rainwater is collected via the buildings downpipes and stored in two
underground water tanks (figure 6), with a total capacity of 150 kilolitres. The
rainwater is put through a sterilisation unit and then a pressure system sends
the water throughout the building for flushing of the toilets and urinals.

132
Figure 6. Rainwater tank underground water tank storage area.
Classrooms are equipped with individual CO2 and VO2 outside air controls with
heat exchangers to incorporate ventilation and outside air rates based on the
level of occupancy and rates of carbon dioxide detected through monitoring
sensors. The building is also designed to achieve selected thermal and acoustic
comfort levels. Materials used in construction were chosen to ensure reduced
levels of volatile organic compounds and formaldehyde.
An underfloor displacement air-conditioning system used in the demonstration
area is designed to distribute supply air from under the floor via ducted main
trunk lines and a heat exchanger on the chiller system requires no maintenance
and reduces the amount of air that has to be cooled in summer or warmed in
winter.

133
The underfloor heating structure was constructed using 250mm thick pre-
stressed floor panels bearing on structural steel beams. A 60mm thick in-situ
concrete structural topping was poured on these to complete the floor structure.
To insulate for the in-floor heating, a 100mm layer of high density foam was
then laid across the structural floor, covered with waterproof membrane and the
in-floor heating pipework laid within the 50mm concrete topping.
The fire system is a high efficiency fine mist fire sprinkler system which is
waterwise even when extinguishing fires.
The rooftop garden is landscaped with composite timber decking, fine gravel
pavement and beds of waterwise plants and fruit trees and is used to
demonstrate the building’s energy and water systems. The rooftop covers more
than 200sqm and sits atop the demonstration space on the north-east corner of
the building. High density foam between 75mm to 230mm was installed
between the structural slab topping and the final concrete topping to reduce
weight and help achieving the falls required to the drainage points.
Zephyrus, the Greek God of the West Wind, is the title of the artwork installed
on the north facing façade of the building. Inspired by the environment the
commissioned artists added to the visual language of the building’s architecture
by integrating powder-coated aluminium panels into the shading panels. LED
lights located behind each of the artwork panels uses real-time wind direction
data to change panels colour. Local speed and wind direction is recorded by a
rooftop anemometer and an electronic sensing

134
system feeds the collected data into the artwork and changing colours indicate
changing wind direction.
CASE STUDY IMPLICATIONS
Sustainable design increases the efficiency in which buildings use energy, water and
materials and reduces the building impacts on human health and the environment
over the entire life of a building. Officially opened in February 2015 the GreenSkills
Training Centre is still in its infancy and performance over the long term is yet to be
shown, however the building has already demonstrated many positive implications of
the uptake of sustainable design and provides a hands-on example of world leading
sustainability practices that can be adapted for application in commercial and
residential design.
CASE STUDY REFERENCES AND FURTHER INFORMATION
Aquacell Water Recycling.
http://aquacell.com.au/services/systems/blackwater/
Central Institute of Technology, GreenSkills Training Centre, East Perth
http://www.central.wa.edu.au/Campuses_Facilities/EastPerth/Pages/Greenskills-
TrainingCentre.aspx
Green Building Council Australia (GBCA). 2013. The Business case for Green Building.
https://www.gbca.org.au/uploads/63/34623/Evolution_2013_Business_Case_for_Gre
en_Building.pdf

135
Green Building Council Australia (GBCA). 2015. What is Green Star?
https://www.gbca.org.au/green-star/green-star-overview/
Melbourne Energy Institute (MEI). 2013. Zero Carbon Australia Buildings Plan. The
University of Melbourne Published by: Beyond Zero Emmissions.
http://media.bze.org.au/bp/bze_buildings_plan.pdf
Pyramid Constructions WA. Green Skills Building, Central Institute of Technology
http://www.pyramid.net.au/projects/pyramid-constructions/green-skills-building-
central-institueof-technology/
Sunpower. Western Australia’s Major Solar Educational Facility installs 48.6kW
SunPower Photovoltaic System Case study
http://www.sunpower.com.au/sites/international/files/media-library/case-
studies/cs-westernaustralias-major-solar-educational-facility-installs-sunpower-
photovoltaic-system.pdf
The builders Choice (TBC). 2015. Innovation in Design, Sustainable East Perth Training
Centre http://thebuilderschoice.com.au/sustainable-east-perth-training-center/
West Australian Mechanical Services Pty Ltd (WAMC). 2015. Project Highlights.
http://www.wamechanical.com.au/project-highlights