Embed Size (px)
Citation preview
flT l rrrr rnpvNAVAL POSTGRADUATE SCHOOL
Munterey, California
0DTIC
ELECTEI
THE SIS
ANALYTICAL EVALUATION OF UNREP METHODS
USING THE MODEL BFORM
Steven L. Barnaby
September 1988
Thesis Advisor: W. P. Hughes
Approved for public release; distribution is unlimited
S8 12 12 021
,,I, . i, ,,z,.,, . mma rm ,,iiali lill m m m f
l - -
ECURITY CLASSIFICATION OF THIS PAGE
REPORT DOCUMENTATION PAGE1s. REPORT SECURITY CLASSIFICATION lb RESTRICTIVE MARKINGS
UNCLASSIFIED2a. SECURITY CLASSIFICATION AUTHORITY 3 DISTRIBUTION /AVAILABILITY OF REPORT
Approved for public release;b. DECLASSIFICATION IDOWNGRADIN'G SCHEDULE Distribution is unlimited.
4. PERFORMING ORGANIZATION REPORT NUMBER(S) 5 MONITORING ORGANIZATION REPORT NUMBER(S)
Ba. NAME OF PERFORMING ORGANIZATION 6b OFFICE SYMBOL 7a NAME OF MONITORING ORGANIZATIONNavl Pstgadute cho (if Alipbe)Naval Postgraduate School DD Naval Postgraduate School
k. ADDRESS (City, State, and ZIP Code) 7b ADDRESS (Crty. State, and ZIP Code)
Monterey, California 93943-5000 Monterey, California 93943-5000
So. NAME OF FUNDINGSPONSORING i8b OFFICE SYMBOL 9. PROCUREMENT INSTRUMENT IDENTIFICATION NUMBERORGANIZATION (If applicable)
k. ADDRESS(City, State. and ZIP Code) 10 SOURCE OF FUNDING NUMBERS
PROGRAM PROJECT TASK WORK UNITELEMENT NO INO INO ACCESSION NO.
11 TITLE (include Security Class-icationAnalytical Evaluation Of UNREP Methods Using the ModelBFORM
12 PERSONAL AUTHOR(S) Steven L. Barnaby
13& TYPE OF REPORT 3b T ME COVERED 14 DATE OF REPORT (Year,Month,Day) 5 PAGE COUNTMaster's Thesis FROM TO September 1988 7316 SUPPLEMENTARY NOTATION The views expressed in this thesis are those of the authorand do not reflect the official policy or position of the Department ofDefense or the U.S. Government17 COSATI CODES I8 SUBJECT TERMS (Continue on reverse if necessary and ident fy by block number)
FIELD GROUP SUB-GROLP Method of UNREP, Delivery Boy, Service Station,BFORM
19 ABSTRACT (Continue on reverse ,f necessary and identify by block number)
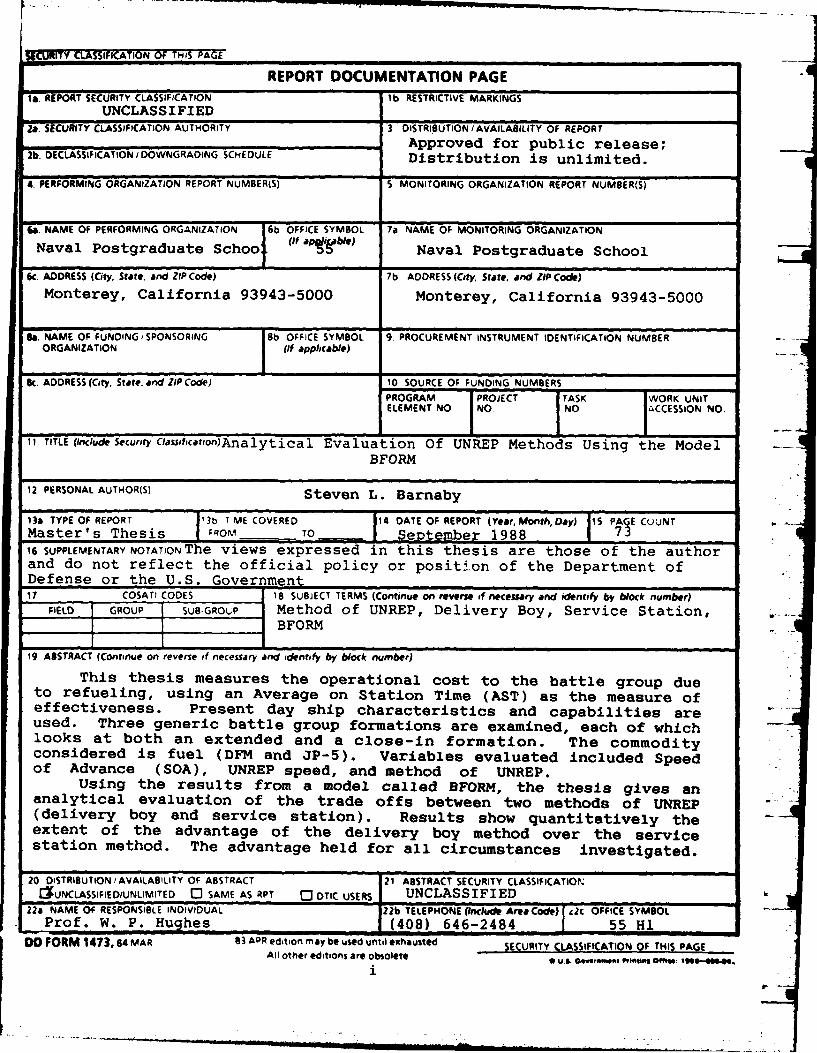
This thesis measures the operational cost to the battle group dueto refueling, using an Average on Station Time (AST) as the measure ofeffectiveness. Present day ship characteristics and capabilities areused. Three generic battle group formations are examined, each of whichlooks at both an extended and a close-in formation. The commodityconsidered is fuel (DFM and JP-5). Variables evaluated included Speedof Advance (SOA), UNREP speed, and method of UNREP.
Using the results from a model called BFORM, the thesis gives ananalytical evaluation of the trade of fs between two methods of UNREP(delivery boy and service station). Results show quantitatively theextent of the advantage of the delivery boy method over the servicestation method. The advantage held for all circumstances investigated.
20 DISTRIBUTION / AVAILABILITY OF ABSTRACT 21 ABSTRACT SECURITY CLASSIFICATIONEUNCLASSIFIEDIUNLIMITED 0 SAME AS RPT 0 DTIC USERS UNCLASSIFIED k
22a NAME OF RESPONSIBLE INDIVIDUAL 22b TELEPHONE (Include Area Code) ac OFFICE SYMBOLProf. W. P. Hughes (408) 646-2484 ,f _ 55 H1
-D FORM 1473,64 MAR 83 APR edition may be used until exhausted $ECURITY CLASSIFICATION OF THIS PAGEAll other editions are obsolete . U.. o..,,. .Wt 1111,1 Ofege of-""
i
" ............ ].... . -- " -- "- ,-, m- -- l J ~ i~ m m, i mip.i i --
M--fmTY CLAWiICATOU OP T IS PAlm
19. continuedAnother major study focus was on AOE idle time. Whenever idle time isgreater than 15% over a ten day period the formation can be serviced, nomatter how many ships are involved, how wide their separation, or howgreat the SOA.
kI
Acoession ForNTIS GRA&IDTIC TAB 0Unannounced 0Justification
By
Distribution/
Avatlability Codes
lAva il and/orDiet Special
SECURITY CLASSIPICATION OP THIS PAGE
Approved for public release; distribution is unlimited.
Analytical Evaluation of UNREPMethods Using the Model BFORM
by
Steven L. BarnabyLieutenant, United States Navy
B.S., Pennsylvania State University, 1982
Submitted in partial fulfillment of therequirements for the degree of
MASTER OF SCIENCE IN OPERATIONS RESEARCH
from the
NAVAL POSTGRADUATE SCHOOLSeptember 1988
.- 7
Author:J ZSteven L. Barnaby
Approved By:AproedByWayne P. Hughegs,'T Thsis 'Advisor
ter Pdue Cairman,Department of Operations Research
KnealeDean of Information and PM* Iences
( ABSTRACT
This thesis measures the operational cost to the battle
group due to refueling, using an Average on Station Time
(AST) as the measure of effectiveness. Present day ship
characteristics and capabilities are used. Three generic
battle group formations are examined, each of which looks at
both an extended and a close-in formation. The commodity
considered is fuel (DFM and JP-5). Variables evaluated in-
clude Speed of Advance (SOA), UNREP speed, and method of
UNREP.
Using the results from a model called BFORM, the thesis
gives an analytical evaluation of the trade offs between two
methods of UNREP (delivery boy and service station). Results
show quantitatively the extent of the advantage of the
delivery boy method over the service station method. The
advantage held for all circumstances investigated. Another
major study focus was on AOE idle time. Whenever idle time
is greater than 15% over a ten day period the formation can
be serviced, no matter how many ships are involved, how wide
their separation, or how great the SOA. (V)
iv
TABLE OF CONTENTS
I. INTRODUCTION ...... ................... I
A. BACKGROUND ......... .................. 2
II. THE MODEL BFORM ......... ................ 6
III. ANALYTICAL OBJECTIVES AND BASIC ASSUMPTIONS . 16
IV. EXPERIMENTAL DESIGN .... ............... . 20
V. ANALYSIS ....... ..................... 27
A. ANALYSIS OF THREE FLAG LEVELS .......... . 27
B. ANALYSIS OF AST vs SOA ... ............ 30
C. ANALYSIS OF UNREP SPEED vs SOA . ........ 33
D. ANALYSIS OF AOE IDLE TIME .. ........... . 36
E. ANALYSIS OF OPENING UP THE FORMATION ..... . 41
VI. RESULTS AND CONCLUSIONS ... ............. 46
A. METHOD OF UNREP ... .............. .46
B. THE PROGRAM BFORM ... .............. 49
C. RECOMMENDATIONS .... ............... . 50
APPENDIX A. STEAMING FORMATIONS .. ........... 53
APPENDIX B. CHOSEN STARTING DFM LEVELS ....... .. 57
APPENDIX C. COMPARISON BETWEEN THREE FLAG LEVELS . . . 58
LIST OF REFERENCES ...... .................. 63
INITIAL DISTRIBUTION LIST ..... ............. . 64
VI
LIST OF FIGURES
Figure 1. Flow Chart of Scheduling Algorithm . . .. 12
Figure 2. Starting Fuel Levels ... ........... ... 24
Figure 3. Comparison Between Initial Fuel Levels 25
Figure 4. Delivery Boy AST For CV .. ......... . 29
Figure 5. Service Station AST For CV .......... ... 30
Figure 6. AST vs SOA For Formation A .......... ... 31
Figure 7. AST vs SOA For Formation B .......... ... 31
Figure 8. AST vs SOA For Formation C .......... ... 32
Figure 9. Delivery Boy AST vs Service Station AST 34
Figure 10. Off Station Time Due to Transit ..... .. 36
Figure 11. Average Battle Group Mean Commodity Levels 38
Figure 12. Minimum Levels Reached .. .......... ... 38
Figure 13. AOE Idle Time .... .............. .. 40
Figure 14. AST vs SOA Extended Formation . ...... . 42
Figure 15. Average Mean Commodity Extended Formation 43
Figure 16. Minimum Levels Reached Extended Formation 43
Figure 17. AOE Idle Time Extended Formation ..... .. 44
Figure 18. Formation A ...... ................ ..54
Figure 19. Formation B ...... ................ ..55
Figure 20. Formation C ....... ................ 56
Figure 21. AST For 50% Flag ...... ............. .59
Figure 22. AST For 65% Flag ...... .............. 60
Figure 23. AST For 80% Flag ...... .............. 61
vi
Figure 24. Comparison Between 50%s and 65%s Flag . .. 62
vii
I. INTRODUCTION
This thesis concerns Battle Force/Group endurance and
sustainability of U.S. warships at sea. In order to maxi-
mize the utility of the combatants within the Battle Group,
they must remain on station ready to perform any assigned
task. When a combatant is involved with Underway Replenish-
ment (UNREP) operations, it is not performing the mission it
was constructed to perform. To arrive, and remain, on
UNREPstation at sea prepared to conduct prompt and sustained
combat operations requires logistic services (Ref. 11.
This essential support must be integrated into each
battle group. How the Battle Group Commander provides this
service is a critical element to the on station time of the
combatants. A readiness goal of the Battle Group Commander
is to maximize the on station time. Is it better to let the
combatants reach a lower level of fuel thereby remaining on
station longer on the average, or is it better to keep them
topped off at all times "to be ready"? If the answer is
somewhere in between, then what is the trade off between the
two?
This paper examines the trade offs between Speed Of
Advance (SOA), UNREP speed, and the method of UNREP. Under-
standing these relationships may provide a Battle Force/
Group Commander with additional insight on which to base his
his decisions not only on the tactical situation but also
considering the logistic constraints.
By maintaining ship logistic readiness on station, the
offensive and defensive postures of the Battle Group are
kept intact [Ref. l:p. ii]. This concern is at least on the
same level of significance as ASW, AAW or ASUW readiness
since none of these could be accomplished for very long
without logistics.
In order for the Navy to carry out its mission, fleet
units must be capable of remaining at sea for prolonged
periods of time. Incorporating logistic implications of
high SOA's or methods of UNREP in order to arrive at the
launch point for power projection at the right time must be
evaluated at the CWC level and integrated into the battle
plan. Forward combatant logistics support is essential to
maintain the combat effectiveness of the Battle Group.
A. BACKGROUND
In order to maximize the utility of units assigned to a
battle group, the Navy has developed a system to resupply a
battle force/group while at sea. This system is known as
Replenishment At Sea (RAS). Ships of the Combat Logistics
Force (CLF) are a critical part of this logistics system
(Ref. 2]. They resupply combatants at sea with fuel,
stores, and ammunition. Shuttle ships will transport the
supplies to the battle groups. Once in the operating area,
2
these shuttle ships will transfer their loads to the station
ship, which is typically a fast combat support ship, that
steams in the battle group formation. Using multi-product
station ships to transfer supplies to the combatants within
the battle group, an appropriate operational posture can be
maintained and sustained. The appropriate posture is one
which adequately maintains and sustains both offensive and
defensive capabilities of the Battle Group [Ref. 3].
Replenishing combat ships from one stop station ships
minimizes the time that the combat ships are involved in
underway replenishment operations [Ref. 2:p. x]. The method
by which this service is provided varies between: Delivery
Boy; Service Station; and Moving Service Station. The
Moving Service Station method is basically an UNREP some-
where in between a Delivery Boy and Service Station.
In this study only the delivery of Diesel Fuel Marine
(DFM) and JP-5 is analyzed. The implicit assumption is that
these are the constraining consumables, and that ammunition,
food, and all other logistic requirements can be transferred
concurrently. With regard to ammo, this will not always be
the case, but this is true frequently enough to cover the
vast majority of scenarios.
The most vulnerable time for a combatant is when it is
alongside the logistics ship conducting Replenishment At Sea
(RAS). Bringing the combatant in from the outer edge of the
screen to a point in or near the center of the formation to
3
be under the protective umbrella of the battle group may be
impractical when considering the time the combatant will
spend off station. However, sending the station ship out to
the far edges of the screen, where it is highly vulnerable,
can also be as impractical when considering the value of
this asset.
Battle Groups have a mission-essential need for a high
degree of logistical independence when deployed to forward
areas. Current tactics and naval warfare doctrine normally
require Carrier Battle Groups (CVBG) and other Task Groups
to operate in dispersed formations to achieve defense in
depth. Such formations also provide a degree of operational
deception against potential enemy sensors. They present a
unique set of factors which the Battle Group/Task Group
Commander must consider when planning for underway replen-
ishment operations in a multithreat environment. (Ref. 3:p.
1] His objective is to maintain the desired formation and
combat readiness of all units in it. To do so he must
minimize the time taken by logistics operations.
The individual tasked with battle group logistics is the
Battle Force/Group Logistics Coordinator (BFLC/BGLC). The
BFLC/BGLC frees the staff of the Composite Warfare Commander
(CWC) from extensive logistics coordination to focus more
upon warfighting coordination. The tactical organization
provides for a Battle Force Logistics System (BFLS) which
ensures that logistic support is consistent with the war
4
fighting requirements of the Battle Force/Group. The goal
of this system is to anticipate and identify requirements,
identify and allocate resources, develop methods of moni-
toring support and measure the response of the BFLS through
specified required reports. The BFLC provides recommenda-
tions and implements decisions on logistics by the Commander
Task Force/Group (CTF/CTG) and the CWC. He will modify
logistics operations to fit the needs of the battle force
and ensure that all needs in the functional areas are being
met. The expressed philosophy of BFLS operations is one of
early or pre-emptive response to emerging problems and
commitments. This will enable the execution of a plan of
action to provide support without further guidance or
tasking from the CWC. [Ref. 41
Replenishment plans must be in consonance with the CWC's
operational intentions and vice versa. A look at the trade
offs between the types of UNREP and the effects of factors
such as SOA and UNREP speed will enable the BFLC and CWC to
evaluate the decision of what type of UNREP and where it
will take place, along with what level of fuel state is
considered appropriate to initiate the UNREP. The BFLC must
ensure that logistics coordination makes tactical sense and
monitor tactical evolutions to advise the CUC if situations
are undesirable logistically.
5
II. THE MODEL BFORM
Battle Force Qperation Replenishment Model, BFORM, is a
microcomputer based simulation of intra-battle force resup-
ply. BFORM was written as a planning aid as part of a
larger study of the use of station ships. BFORM was written
by programers at the Applied Physics Laboratory Johns
Hopkins University for Chief of Naval Operations, Program
Resource Appraisal Division OP-81. The model runs on IBM or
compatible PC's and allows the user to examine the conse-
quences of different choices of station ship design and
operational methodology [Ref. 5].
BFORM provides a number of different results which may
be expressed to measure the effectiveness of the battle
force replenishment process. Two primary results relate to
operational off station time and commodity inventory levels.
Operational off station time is defined as the total time
each ship is off its assigned station. Included in this
output is the total cime the station ship is alongside a
combatant involved in UNREP. Output data is provided on
inventory levels of 15 commodities for each ship in the
battle force. Commodity data includes the minimum levels
reached, the average levels maintained, and the standard
deviation of each commodity.
6
With respect to time, output data is also provided on
the maximum time each combatant spent away from its assigned
station. Basically, this is just the largest single time
off station for each combatant during the simulation run.
Again, operational off station time is the total (cumu-
lative) time each ship spends off station. Operational off
station time includes not only UNREP time but also the
transit time needed for the combatant to either regain its
station after replenishment or to leave its station and
rendezvous with the station ship, UNREP, and return to
station. UNREP time includes the time to transfer the
needed commodities to fill the combatant plus 20 minutes.
This additional 20 minutes is for approach, connecting and
disconnecting, and is a reasonable amount of time to add to
cover these events. Because of the large number of poten-
tial variables and scenarios, and as a result of making
BFORM as flexible as possible, it is a complex model.
In BFORM, ships are given a mission type: combatants,
station ships, shuttle ships, and escorts for station and
shuttle ships. The model allows any class of ship to be
assigned to these missions. A combatant is characterized by
staying within an operating radius (patrol area) that is
fixed in the formation grid. The only time a combatant ship
leaves this area is when it is involved in an UNREP opera-
tion. DFM is expended based on ship class fuel expenditure
characteristics and the current fuel use per unit speed.
7
JP-5 is expended based on the aircraft sortie rate for that
ship (usually aircraft carriers) and a user supplied fuel
expenditure rate per sortie. This sortie rate can be modi-
fied by a user supplied event which may be used to simulate
surges or stand downs. Station ships remain with the battle
force through out the simulation run and supply commodities
(POL and ordnance) to the combatants and escorts. Shuttle
ships appear at a user defined time and then act as station
ships with the capability of supplying combatants or can be
specified to console directly with a station ship. When
shuttle ships run below a preset level of supplies they
leave the formation. Escorts are similar to combatants
except that they go everywhere their assigned station or
shuttle ship goes, instead of staying on a fixed station.
[Ref. 5:p. 2-2]
Three methods of resupply are possible. The first is
called "Delivery Boy", which performs the resupply at the
receiving ships station in the formation within the ships
patrol area. The station ship goes to each ship in turn
based on some scheduling algorithm. If the station ship is
outside of the receiving ship's patrol radius, the initial
rendezvous for an UNREP takes place at the point on the
circumference of the patrol area nearest to the station
ship. The station ship moves at designated ("flank") speed
between ships. Once an UNREP begins, the ship is moved at
the UNREP speed in the direction determined by the sea
8I
direction. Sea direction is a user supplied event. In the
event that the receiving ship leaves its patrol area during
the UNREP, it will return to its patrol area at flank speed
and the time it takes to regain station will be added to its
cumulative off station time. The station ship will then
proceed to its next UNREP (if one can be scheduled). If no
UNREP is scheduled then the station ship will proceed on
formation base course and speed at its current position at
the end of the last UNREP.
The second method, "Service Station", is similar to an
auto gas station. The point of initial rendezvous for an
UNREP is always the assigned position of the station ship.
The replenishment ship stays on a fixed station in the
formation, and each combatant comes to the station ship.
The UNREP station stays fixed throughout the simulation run.
In the event that the station ship and the combatant should
fall behind during UNREP (when UNREP speed is less than
SOA), the station ship will always return to its station
before starting another UNREP. In this mode, the station
ship can service two ships at once.
The third method, "Moving Service Station", allows the
operator to define locations, called phantom ship positions,
at which resupply takes place. Under this method there can
be several locations through out the formation at which
resupply takes place. From these phantom ship locations
resupply proceeds identical to the Service Station method.
9
__ -. lmmiS ll l i l a d. . . . . . . ..*
The variable determining when a unit is off station and
controlling when a unit is allowed to UNREP with the station
ship is called the patrol radius. In order for a ship to be
considered for UNREP it must be within the distance of the
patrol radius. The patrol radius for the station ship will
determine which ships will be allowed to UNREP under the
Service Station and Moving Service Station methods. The
patrol radius for the combatant is utilized when using the
Delivery Boy method as described above.
Scheduling of an UNREP is based on user supplied prior-
ities as well as current commodity levels and availabilities
aboard the station or shuttle ship. All UNREPs are sched-
uled from one algorithm depending on which method of UNREP
was chosen. UNREPs are scheduled on the basis of the demand
at the time the station or shuttle ship becomes available as
well as the distance from the station or shuttle ship to the
receiving ship. The user supplied priorities provide the
policy guidelines used in the decision making process of the
scheduling algorithm, which acts in the following way. [Ref.
5:p. 2-2]
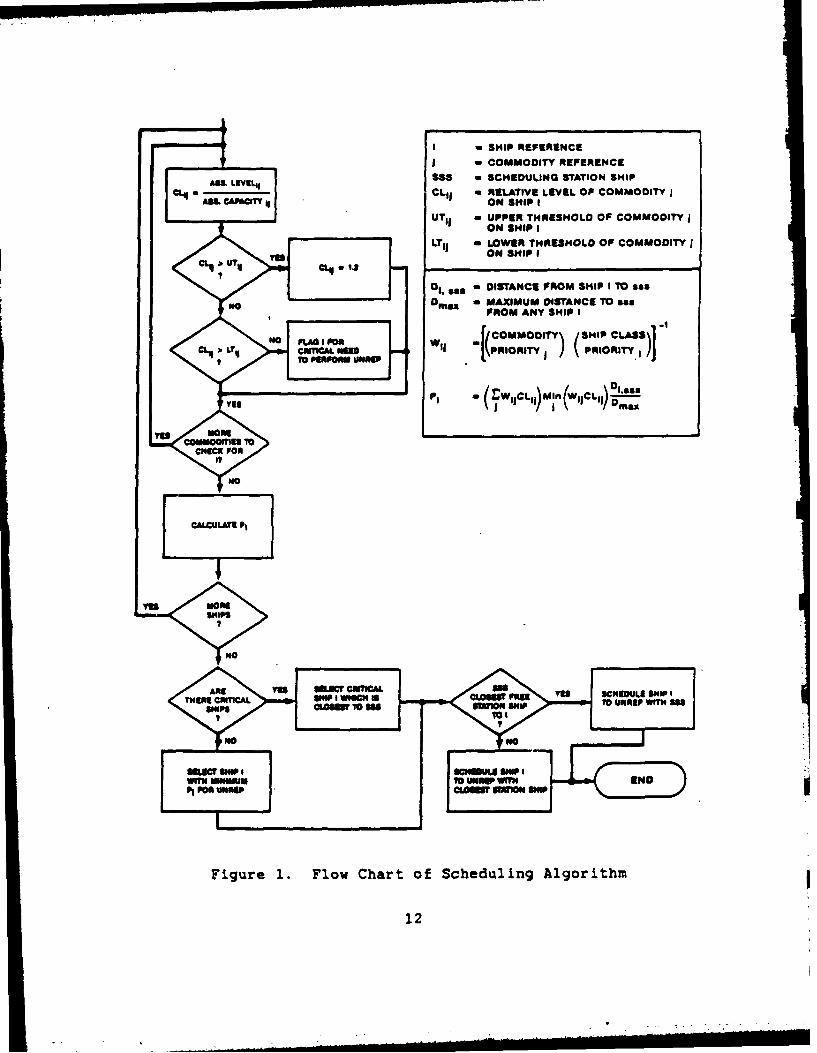
The station ship searches through all of the other ships
in the formation not already involved in UNREP in order to
determine the level of each commodity. The commodity level
is expressed as the ratio of the current level to that of
the absolute capacity. If a commodity level is greater than
the upper threshold (a user supplied input which is commonly
10
called a flag to initiate a need for UNREP), then it is
assigned a value greater than one so that it is not con-
sidered for possible UNREP. A level below the upper thresh-
old will place the ship in the queue for UNREP. Another
user supplied threshold level is the lower threshold level.
When a unit falls below the lower threshold level it is
considered to have a critical need for UNREP and is placed
ahead of other units which were flagged when they fell below
the upper threshold level. Each of the ships placed into
the queue is then assigned a priority number based on the
weighted average of its commodity levels multiplied by the
minimum weighted commodity level. The weights used are the
product of the normalized ship class priority and the
normalized commodity priority. The priority number is then
multiplied by the ship's distance from the station ship
normalized by the distance of the furthest ship considered
for UNREP. The scheduling station ship will perform the
UNREP unless there is another free station ship closer to
the selected ship. [Ref. 5:p. 2-4] Figure 1 illustrates the
scheduling algorithm. (Ref. 5:p. 2-5]
Data entered in the model by the user include: battle
force composition, each ship's formation position and speed,
ship characteristics, i.e., fuel consumption rate for
various speeds, fuel capacities, ordnance capacities,
transfer rates and starting levels for each commodity; ship
and commodity priority levels; combatant flight operations,
11
I M SHIP REFERENCE
I COMMODITY REFERENCEASIL~53 -I1. S SCHEDULING STATION SHIP
C4CLgj - OIP ELATIVEI LEVEL OF COMMODITY
UT11 - UPPER THRESHOLD OF COMMODITYON SHIP I
LT11 = LOWER THRESHOLD OF COMMODITYC4 UN CL IjON SHIP I
01, S" = DISTANCE FROM SHIP I TO IIIsDmax , MAXIMUM DISTANCE TO as
FROM ANY SNIP II[(COMMODITY SNIP CLASS~NOFLG PHIWiI 1 PRORTC4V WIA MPRIORITY PIRT
To 011"011 (r 1 cL 1 MiN 11 L,) 0 a
yes PI1MOCLSMi II
No
CACUI PIEN
FNgne 1. Fo Car ofShdln Aloi m
SHI12
i.e., sorties per day; fuel usage per sortie; UNREP speed;
and scheduled events such as ordnance expenditures, shuttle
ship arrivals or changes in weather conditions. Information
on weather conditions can be entered into what is called the
events file. Weather events can degrade transfer rates and
cause UNREPs to take place in a direction other than base
course. This is due to the idea of UNREPing either away
from the direction of the sea or into it and could cause the
UNREP course to be up to a maximum of 90 degrees off base
course. This will cause an additional delay in regaining
station after UNREP.
The program models the battle group formation, based on
a cartesian grid, moving on a base course of 000 degrees
relative and at the entered SOA. The duration of a single
simulation run is determined by the user, and is entered
prior to the start, as a number of days. Resupply will be
provided using one of the three methods described above.
Fuel consumption is continuous and automatic, depending upon
the consumption rates entered and based upon the ship's
current required speed. Each combatant operates within a
certain patrol radius around its assigned position. The
operator can not change this radius once the simulation run
has started. The effect of increasing the patrol radius is
to reduce the time "off station" due to refueling.
Output from the model includes: commodity history file,
which lists all changes to each commodity according to time;
13
I..
event history file, lists all events that cause a change in
the formation e.g., ship leaves to UNREP etc; summary sta-
tistics on all 15 commodity levels; and statistics on off
station time for all ships in the formation. Commodity
history file gives chronological information about each
ship's commodity levels and records any major change, such
as if a unit UNREPs or there is an expenditure of ordnance.
A snapshot is taken and recorded in the commodity history
file. The event history file provides a chronological
history of all significant events during the simulation run.
Summary statistics on commodity levels display the time
weighted mean level for all 15 commodities on each ship.
Also given are the standard deviations associated with the
means. Another statistical output is the minimum level of
each commodity reached by each combatant during the simula-
tion run.
The operational off station time output gives two quan-
tities, one for the longest single time each combatant was
off station, i.e., outside its patrol radius, and the second
is the sum of all the time spent off station. Remember that
on station means within a ship's patrol radius and not in-
volved with UNREP. Using these output files, MOEs can be
developed, measured, and evaluated. Sensitivity of various
variables can be observed and trade offs between them com-
pared. Cause and effect relationships can be graphed and
general trends can be learned.
14
BFORM does not consider the possibility of VERTREP.
However, the operator could account for this by increasing
the transfer rates of several commodities to simulate the
* . effects. Combatants could also use sortie rates greater
than zero to simulate the consumption of JP-5 for HIFR.
15
III. ANALYTICAL OBJECTIVES AND BASIC ASSUMPTIONS
The analytical objectives of this effort are to deter-
mine the trade offs among two methods of UNREP (delivery boy
and service station), different battle group speeds of ad-
vance (SOA), different UNREP speeds, and the various UNREP
flag levels which signal the commodity level for which UNREP
is considered appropriate. A central question is the degree
of difference between the two principle types of UNREP when
measured by the average on station time (AST), defined on
page 21, of the combatants. Depending on the operational
tempo, the CWC can decide if the delivery boy UNREP method
is justifiable, considering the threat, rather than the
safer service station method of delivery.
If the delivery boy method of UNREP is used in order to
maintain a high AST, certain risks are entailed. By doing
this kind of UNREP, the AOE (vital asset) will be exposed
miles away from the center of the formation. The AOE will
be involved in UNREPs with only one combatant at a time.
Efficient use of the AOE would suggest allowing simultaneous
UNREPs. However the doubling up of UNREPs on the outer edge
of the screen is even less desireable.
For the purposes of this study the CV and the ships of
the inner screen maintained an average speed of 3 knots
greater than SOA throughout the simulation run to simulate
16
....• ' . , /., ,: iiq~nmlm~lil/iiili ii
the needed speed and with that the fuel consumption to sus-
tain flight operations. Ships of the outer screen main-
tained an average speed of I knot greater than SOA for the
purpose of station keeping, patrolling, etc.
The following is a list of assumptions imposed by the
model BFORM.
- DFM consumption rates for the combatants are onlyconsidered for 14 - 30 knots, in 2 knot increments.
- Station ship does not expend fuel except in transfers toother ships.
- All combatants transit at maximum speed when regainipgstation or departing station to rendezvous for UNREP'.
- Replenishment ship travels at top speed when going toUNREP with a combatant in the Delivery Boy method,which is set at 26 knots tor an AOE.
- 20 minutes is added to each UNREP time for approaching,rigging and unrigging. The choice of 20 minutes isexplained on page 8.
- In the delivery boy mode, the station ship will remainat the relative position upon completion of the UNREP.It will stay there and steam at the indicated SeA untilinstructed to rendezvous with another combatant by thescheduling algorithm.
- No change to battle group base course is made during thesimulation run.
- During any given simulation run, all commodity and shippriorities are constant.
- UNREP transfer rates will be reduced if the userinputs a weather event with sea states greater than 3.
IThe program BFORM will use the maximum speed availablefrom the Ship's Characteristics file. The author limitedall combatants specifically to a maximum speed of 30 knotsbecause of this. Accordingly their fuel consumption will befor 30 knots when transitting either to or returning fromUNREP.
17
At sea state 4, transfer is reduced by one third. Atsea state 5 and above, no UNREPs will be scheduled.
- If no weather event is entered by the user, then seastate I is assumed.
The following is a list of assumptions imposed by the
author.
- A 10 day transit.
- No weather conditions were considered, thereforeall UNREPs were conducted on base course.
- UNREP speed will not be faster than the given SOA.
- The only commodities considered were DFM and JP-5.
- Only the CV consumed appreciable amounts of JP-5.
- JP-5 consumption was 2.4 kgal per sortie, and 75 sor-ties per day for the 10 day transit.
- All combatants were given a patrol radius of 0.1nautical miles in order to ascertain time off stationwith precision.
- Combatants in the inner screen steam on the average atthree knots above SOA. This includes the CV.
- Combatants in the outer screen steam at one knot aboveSOA.
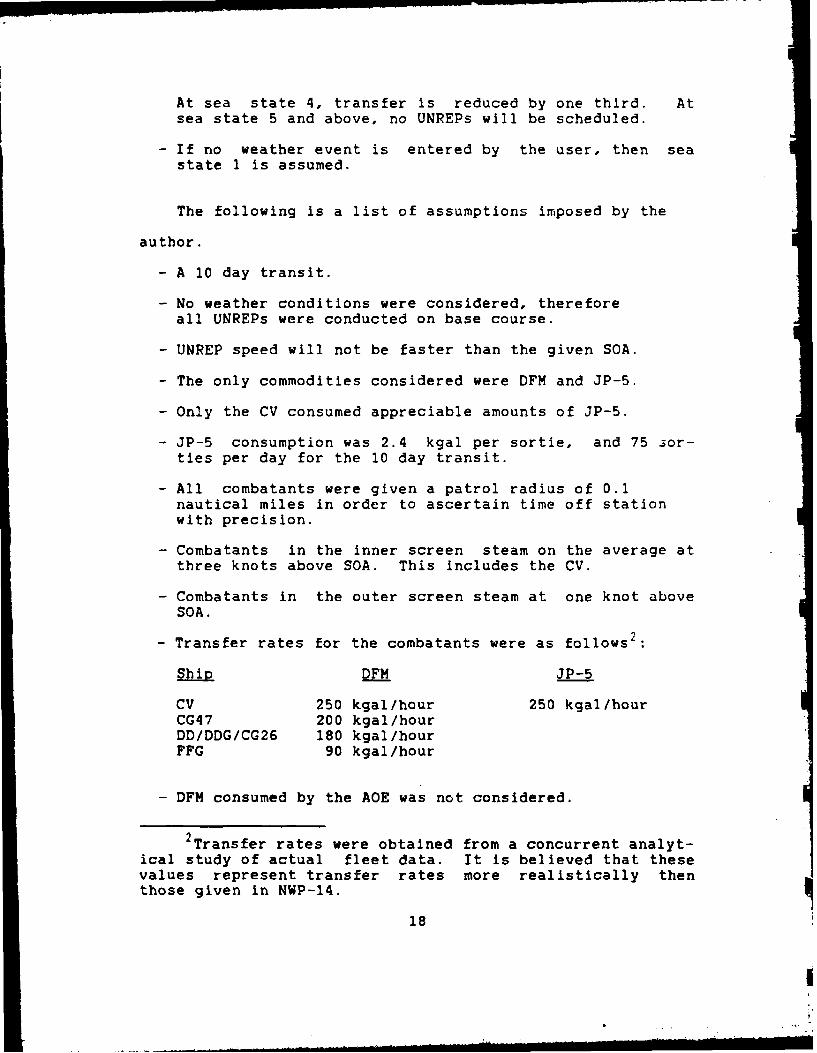
- Transfer rates for the combatants were as follows2 :
Ship DFM JP-5
CV 250 kgal/hour 250 kgal/hourCG47 200 kgal/hourDD/DDG/CG26 180 kgal/hourFFG 90 kgal/hour
- DFM consumed by the AOE was not considered.
2Transfer rates were obtained from a concurrent analyt-ical study of actual fleet data. It is believed that thesevalues represent transfer rates more realistically thenthose given in NWP-14.
18
IL ... , a
- Threat axis of 000 degrees relative, for the p,,rpose of
ship placement.
- Shuttle lifts will be available3
- The time required and the effects of transferring DFMfrom a shuttle ship to the AOE were not considered.This is further discussed on page 22.
- Flag levels, which initiate the need for an UNREP, arevaried over three levels 50%, 65%, and 80%, however the65% flag was used for the design. Refer to page 27.
3For a 10 day transit, present day capacity of an AOEis insufficient to support even the smallest battle groupconsidered in this study under all operating conditions.Therefore, to enable the model to run for each formationdesign it was necessary to increase DFM capacity on the AOE.This hypothetical capacity was set at 10,000,000 gallons.
19
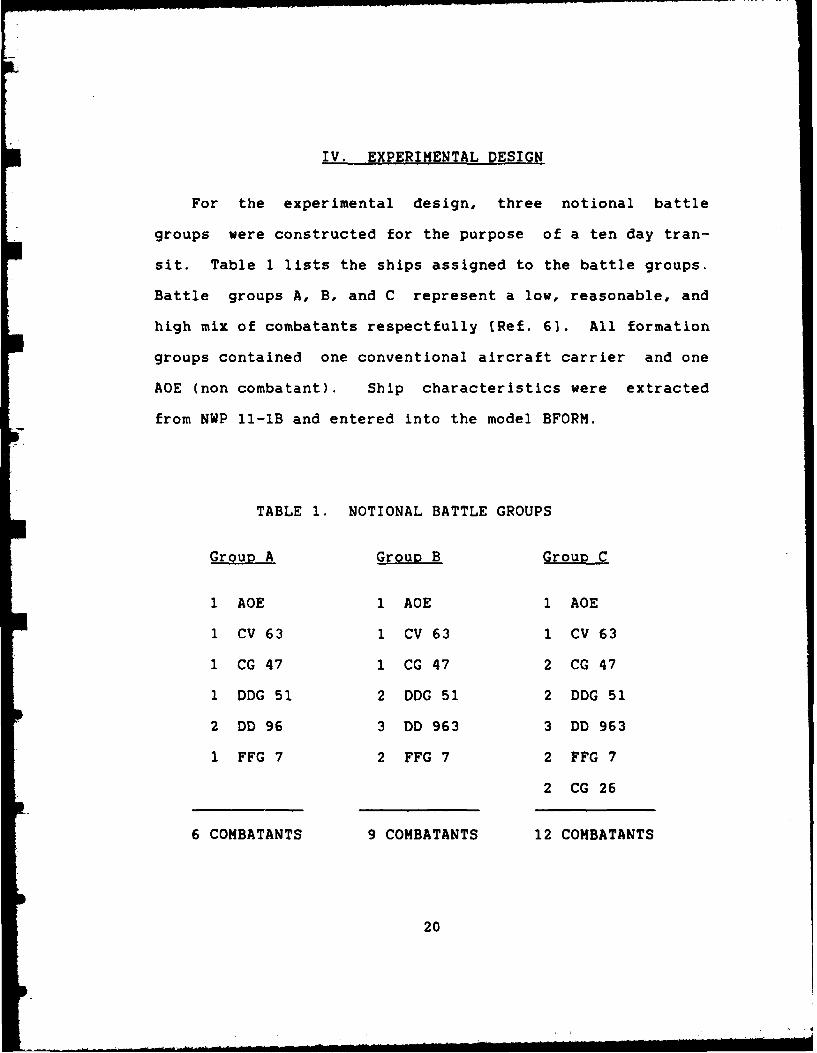
IV. EXPERIMENTAL DESIGN
For the experimental design, three notional battle
groups were constructed for the purpose of a ten day tran-
sit. Table 1 lists the ships assigned to the battle groups.
Battle groups A, B, and C represent a low, reasonable, and
high mix of combatants respectfully [Ref. 6]. All formation
groups contained one conventional aircraft carrier and one
AOE (non combatant). Ship characteristics were extracted
from NWP 11-IB and entered into the model BFORM.
TABLE 1. NOTIONAL BATTLE GROUPS
Group A Group B Group C
1 AOE 1 AOE 1 AOE
1 CV 63 1 CV 63 1 CV 63
1 CG 47 1 CG 47 2 CG 47
1 DDG 51 2 DDG 51 2 DDG 51
2 DD 96 3 DD 963 3 DD 963
1 FFG 7 2 FFG 7 2 FFG 7
2 CG 26
6 COMBATANTS 9 COMBATANTS 12 COMBATANTS
20
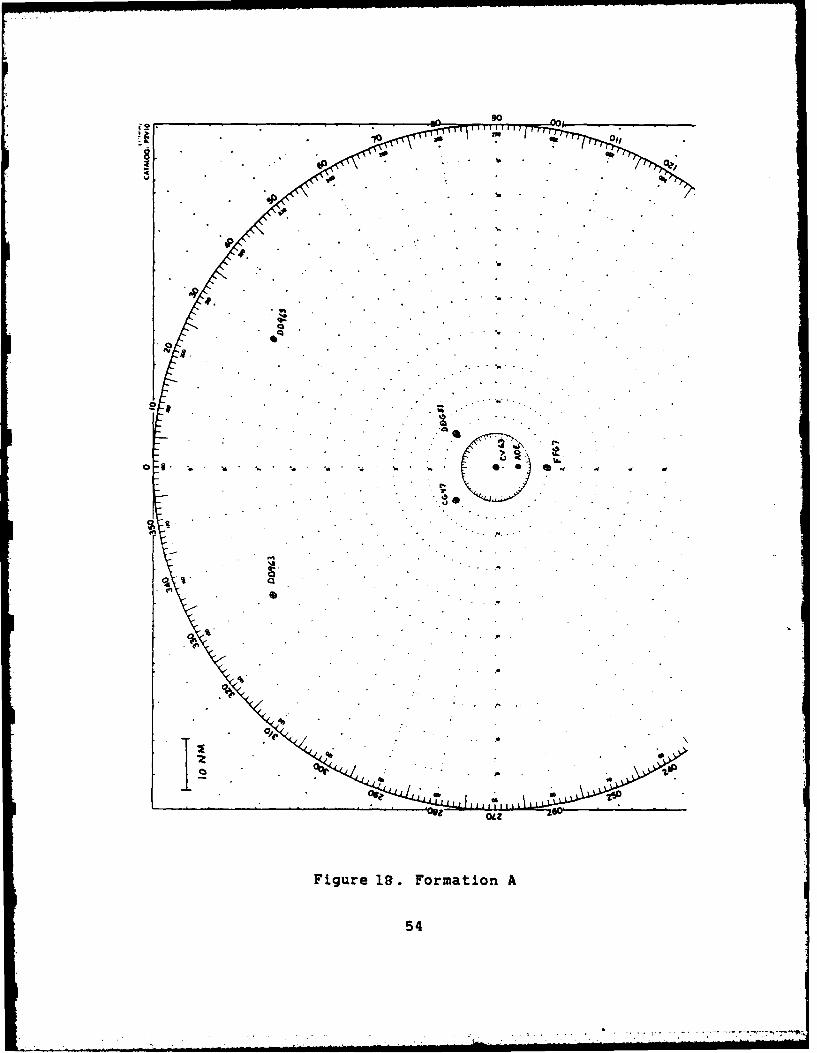
No single document was found to provide ship placement
within the formation for a generic low threat transit. The
figures in Appendix A provide the placement for the com-
batants used. Within each formation the inner and outer
screens were placed 10 and 50 nautical miles respectively
from formation center. Based on several interviews with
acknowledged experts in the field of battle group steaming
profiles, it is believed that these represent generic and
reasonable formations. Ship positions were considered for
effects of convergence zones and electromagnetic radiation,
and placed to reduce interference between combatants, and at
the same time provide adequate protection. A threat axis of
000 degrees relative was assumed for purposes of ship place-
ment. All combatants are on course 000.
One measure of effectiveness (MOE) developed was the
average on station time (AST) for the battle group as a
whole. AST being defined as:
Total time off StationA S T 1 -
Total time
This measures the time the battle group, on the average,
spent on station, i.e., not involved with UNREP.
Another measure considered was average minimum commodity
level reached by the battle group. Due to the starting
21
levels, ship placement, and the flag level set to initiate
UNREP, the minimum levels reached for the duration of the
simulation run for each commodity could be recorded and
averaged for the battle group. This could aid the CWC in
his decisions. Knowing or having a good idea what the
minimum level reached by his combatants would be, the CWC
could determine if a delivery boy or service station UNREP
method was sufficient or adequate.
Both of these measures exclude the AOE data. It is
assumed that a shuttle lift will be available on demand to
top off the AOE. Therefore AOE figures are not considered
as factors in the MOEs. All UNREPs are conducted either by
delivery boy or service station method. It is assumed that
either MOE could be maximized by using one of these resupply
methods but not both. What this means is that in order to
obtain the maximum AST you would use a delivery boy method
of UNREP. However, this would cause the combatants to reach
a lower level of a commodity due to the time delay in
waiting for the AOE to arrive at the combatants station.
Another important fact to consider is the duration of a
single UNREP. What is the maximum off station time for a
single unit? Can CWC afford to have a unit from the outer
screen off station, involved with UNREP, say up to 4 hours
at one time? As a third measure, the average maximum off
station time for the battle group will be collected and
evaluated.
22
. ..... •..-.i.. ,,inimii nnl mlmmilII
One question we answer at the outset is, what to assume
as the starting levels of DFM and JP-5 for the combatants.
Initial fuel levels were allowed to varied from 100 down to
55 percent. The flag level to initiated the need for an
UNREP was set at 80 percent. The following analysis of the
starting fuel levels is provided to support the selected
initial conditions. Formation A was used in a ten day simu-
lation run. This formation proceeded at an SOA of 13 knots
and had an UNREP speed of 12 knots. Neither the upper bound
nor the lower bound would be chosen, however this would give
an area in which an appropriate starting level could be
drawn. Using three different starting fuel levels, 55%,
80%, and 100%, Table 2 provides the recorded data of the day
by day account of AST. Figure 2 provides a graph of the re-
corded data for the three levels using the delivery boy
method of UNREP.
From Figure 2 it is clear that the AST settles out
rather quickly and maintains about some constant reasonable
well. It is felt that whether this sustained constant AST
is 97% or 94% for either method of delivery is immaterial;
however, the fact that it does settle out is important.
Obviously not all ships of a battle group will start at 100%
fuel level and Just as obviously not all will start at 55%.
From this an average starting fuel level was chosen, which
was 80%. Table 1 of Appendix B lists the chosen starting
DFM levels for each combatant within each battle formation.
23
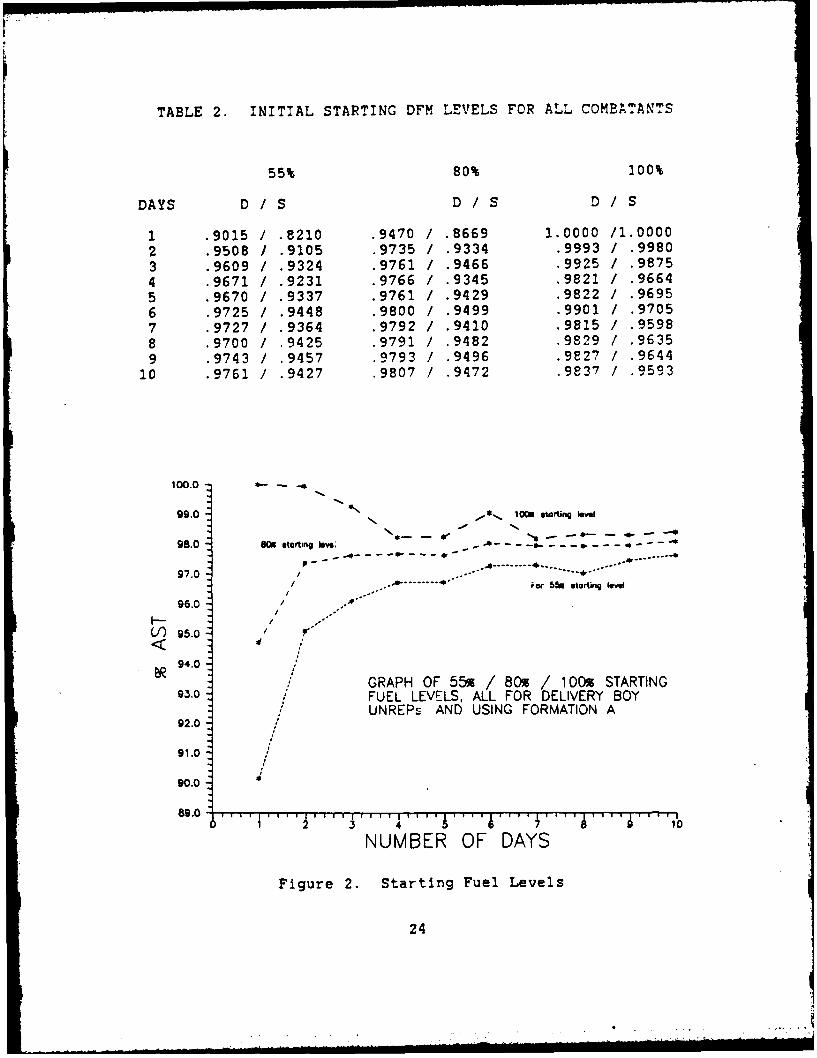
TABLE 2. INITIAL STARTING DFM LEVELS FOR ALL COMBATANTS
55% 80% 100%
DAYS D / S D / S D / S
1 .9015 / .8210 .9470 / .8669 1.0000 /1.00002 .9508 / .9105 .9735 / .9334 .9993 / .99803 .9609 .9324 .9761 / .9466 .9925 / .98754 .9671 / .9231 .9766 / .9345 .9821 / .96645 .9670 / .9337 .9761 / .9429 .9822 / .96956 .9725 / .9448 .9800 / .9499 .9901 / .97057 .9727 / .9364 .9792 / .9410 .9815 / .9598
8 .9700 / .9425 .9791 / .9482 .9829 / .96359 .9743 / .9457 .9793 / .9496 .9827 / .9644
10 .9761 / .9427 .9807 / .9472 .9837 / .9593
100.0 .-- -
99.0 Us'
99.0 lon sa;rting level
-* - - 1-
98.0 80S starting lm;A-- ~
97.0 ........../ Aor .5- starting level
/ o
96.0 /
CA 95.0
94.0/9. GRAPH OF 55% / 80 / 100 STARTING
93.0 FUEL LEVELS, ALL FOR DELIVERY BOYUNREPs AND USING FORMATION A
92.0
91.0
90.0
89.0-I ***I
4* * 1 t 1 * ..' .. 7....110NUMBER OF DAYS
Figure 2. Starting Fuel Levels
24
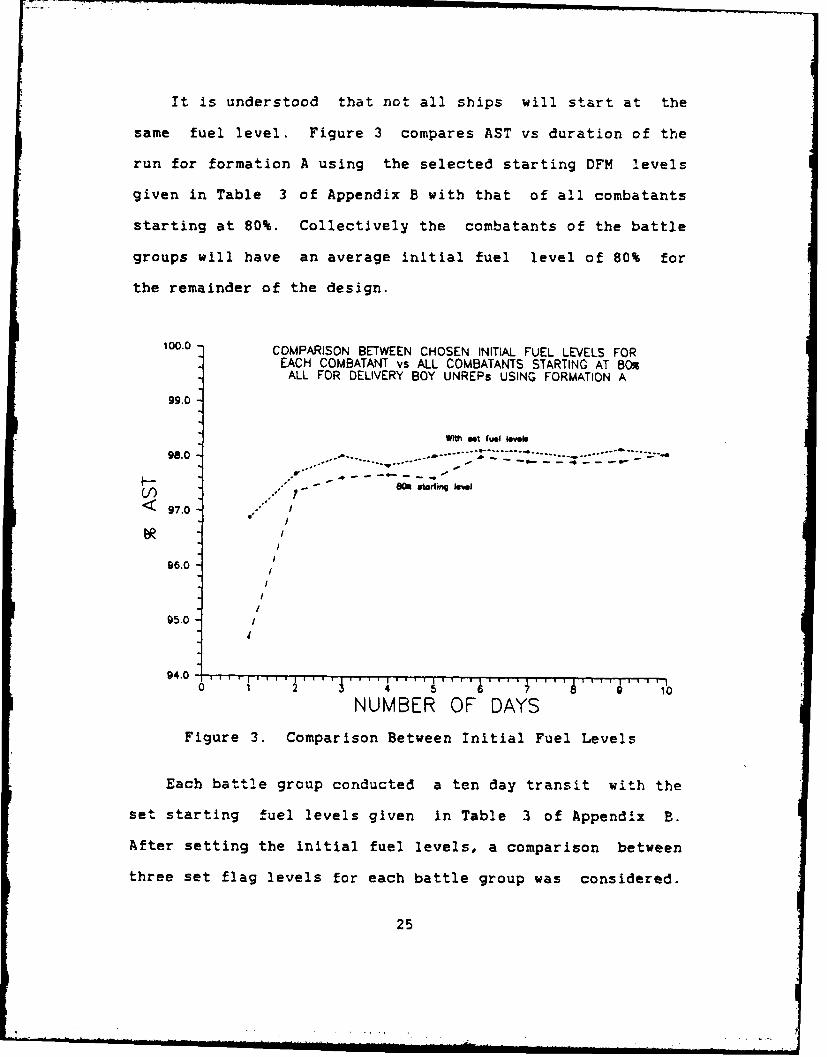
It is understood that not all ships will start at the
same fuel level. Figure 3 compares AST vs duration of the
run for formation A using the selected starting DFM levels
given in Table 3 of Appendix B with that of all combatants
starting at 80%. Collectively the combatants of the battle
groups will have an average initial fuel level of 80% for
the remainder of the design.
100.0 COMPARISON BETWEEN CHOSEN INITIAL FUEL LEVELS FOREACH COMBATANT vs ALL COMBATANTS STARTING AT 8o
ALL FOR DELIVERY BOY UNREPs USING FORMATION A
99.0
With~ set (U1 leveb
. ----- - - ... . .. ... .. .... - ; -. . ..
F- 801 S tarting hW")
97.0 ."
. I
96.0/
95.0 I
4
94.0 .... 4.. ....0 1 2 4 5 8 9 10
NUMBER OF DAYS
Figure 3. Comparison Between Initial Fuel Levels
Each battle group conducted a ten day transit with the
set starting fuel levels given in Table 3 of Appendix B.
After setting the initial fuel levels, a comparison between
three set flag levels for each battle group was considered.
25
After an analysis of these results, one flag level was
chosen for the rest of the design.
Now that the starting fuel levels and a set flag level
have been chosen, each battle group will preform a series of
ten day transits using the two UNREP methods. The series of
runs will be conducted varying the speed of advance from 13-
21 knots in two knot increments. UNREP speed will vary over
the range of 12-20 knots, also in two knot increments. Data
collected from each run will be the average battle group on
station time, total time AOE was involved in UNREP, the
average battle group maximum off station time, average mean
DFM level, and the minimum battle group DFM level reached
during the run.
26
V. ANALYSIS
A. ANALYSIS OF THREE FLAG LEVELS
Three flag level settings were used with the starting
fuel levels obtained from the Chapter IV. The flag levels
used were 50, 65, and 80 percent. The flag level queues the
scheduling algorithm to initiate an UNREP. Each formation
started with an initial fuel level average of 80%. A series
of 10 day transits were conducted for each individual level
within the model. Using the three upper threshold levels
(flag levels) data were collected from the three runs using
a delivery boy method of UNREP. The figures in Appendix C
show the results of those runs. For each run an SOA of 13
knots and an UNREP speed of 12 knots was used. A plot of
AST vs duration of the run in days clearly shows a small
change in AST given the three flag levels. This will
consistently hold true when the battle groups are not over-
taxed with logistics and when comparing the same method of
UNREP with each flag level.
With the flag set at 80%, 34 UNREPs were generated using
formation B, while 40 were generated using formation C.
This gives an average of 3.4 and 4.0 UNREPs per day for the
10 day transit. With an SOA of 13 knots and an UNREP speed
of 12 knots, this will lead to least fuel demanding condi-
tions considered within the design. An average of 3.4 and
27
4.0 UNREPs per day is very demanding for the AOE even under
the most favorable conditions, so the 80% flag was removed
from further consideration.
Left with the two alternatives, i.e., 50 and 65 percent,
and operating under the same conditions, the difference
between the ten day mean fuel levels aboard the combatants
was approximately 10%. This means that with a flag level
set at 65% vice 50%, the average fuel level aboard the
combatants within formation B throughout the ten day transit
was 10% higher. This would sustain the ships of this
formation for roughly 1.13 days longer at a sprint of say 20
knots. Comparing this kind of additional sustainability
without affecting AST by an appreciable amount (see the last
figure of Appendix C) a flag level of 65% was selected for
the rest of the design.
Additional insight is provided for a decision maker
pertaining to AST for the CV vice AST for the battle group
as a whole. Understanding the CV as the critical element of
the battle group, the AST for the CV needs to be clearly
displayed. By removing the off station time of the CV from
the rest of the battle group and plotting the CV's AST vs
duration of the simulation run this would provide a clear
picture. Again, operating under the same conditions as
above, Figure 4 shows a comparison of formation B using a
delivery boy method of UNREP for battle group AST, battle
group AST excluding the CV and AST for just the CV. The
28
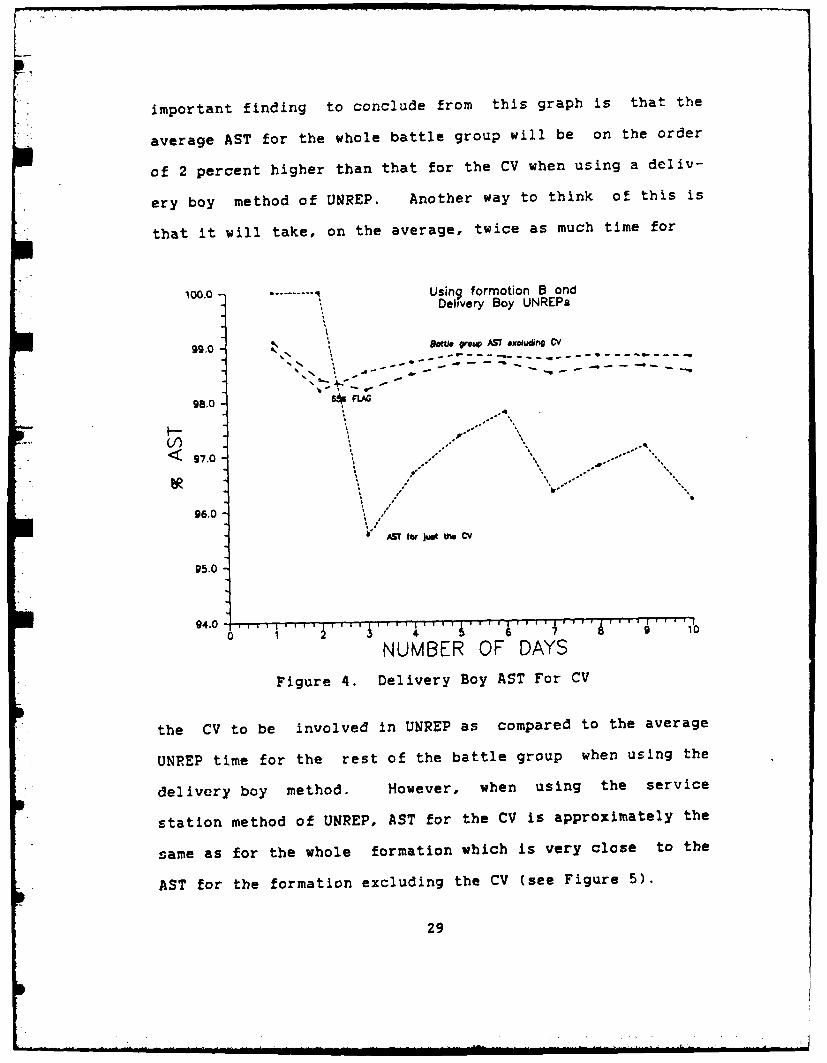
important finding to conclude from this graph is that the
average AST for the whole battle group will be on the order
of 2 percent higher than that for the CV when using a deliv-
ery boy method of UNREP. Another way to think of this is
that it will take, on the average, twice as much time for
100.0 -..------ Usinq formation B andiDevery Boy UNREPs
~DO B roup AST moludgih CV
",', . .-- " .- '." ---. __- .---.--- "- ..-4% - ----- - - - ------
98.0 -.4
97.0 4
9.0 .
95.0 V
' 4 8 9 10
NUMBER OF DAYS
Figure 4. Delivery Boy AST For CV
the CV to be involved in UNREP as compared to the average
UNREP time for the rest of the battle group when using the
delivery boy method. However, when using the service
station method of UNREP, AST for the CV is approximately the
same as for the whole formation which is very close to the
AST for the formation excluding the CV (see Figure 5).
29
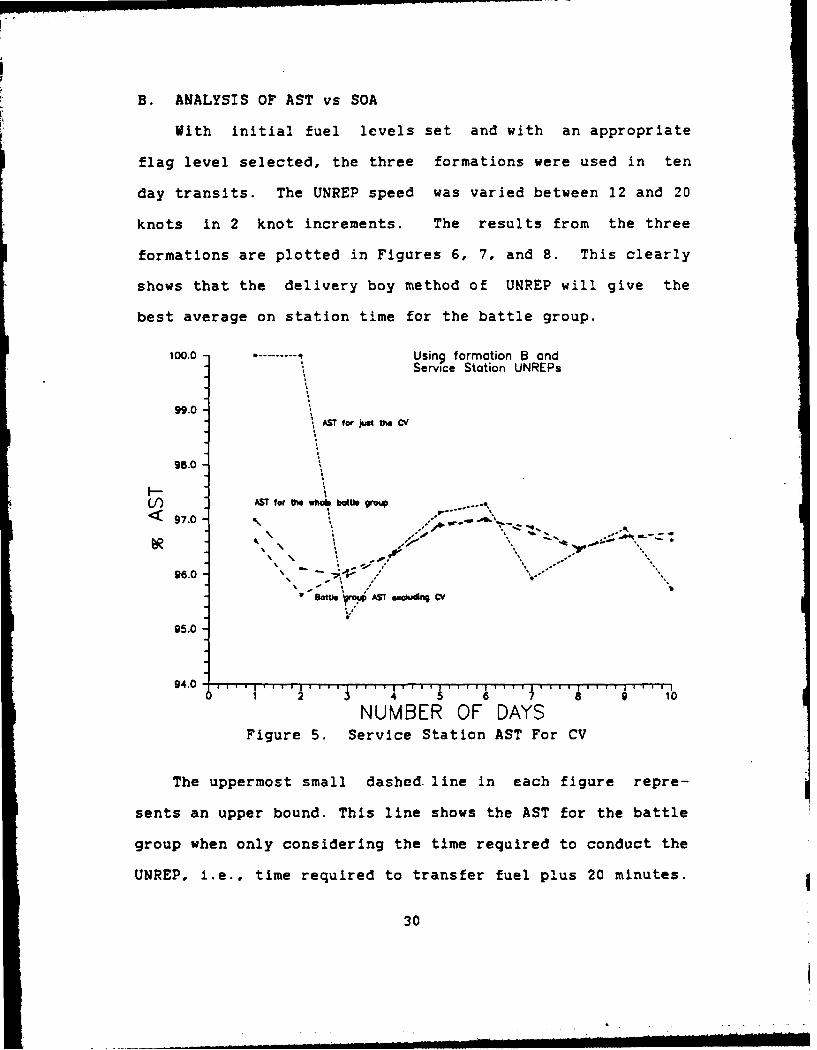
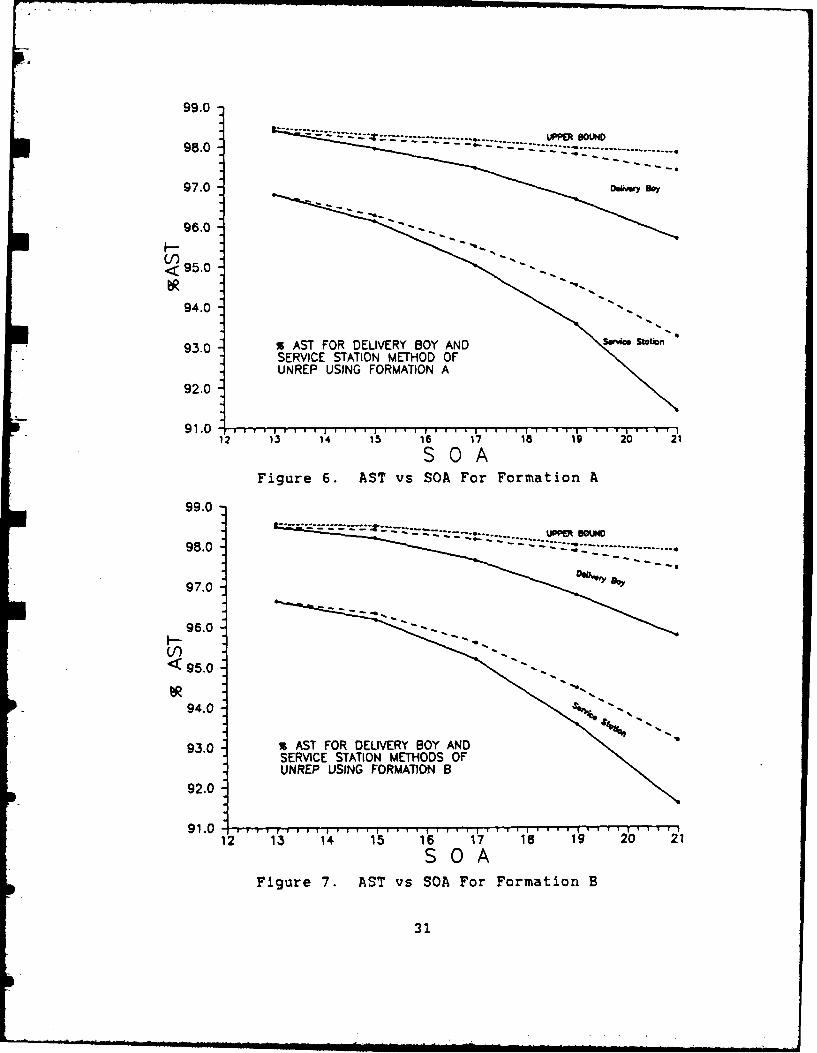
B. ANALYSIS OF AST vs SOA
With initial fuel levels set and with an appropriate
flag level selected, the three formations were used in ten
day transits. The UNREP speed was varied between 12 and 20
knots in 2 knot increments. The results from the three
formations are plotted in Figures 6, 7, and 8. This clearly
shows that the delivery boy method of UNREP will give the
best average on station time for the battle group.
100.0 ..........-- Using formotion 5 andService Stotion UNREPs
99.0tAST for wut the CV
98.0
(J) AST lt Owe whob bcitte W"
<97.0
96.0 - \
' atleurs i AST excladng CV
95.0
94. .... "": " ,,_.0 ,, 2 .... , -=
NUMBER OF DAYSFigure 5. Service Station AST For CV
The uppermost small dashed. line in each figure repre-
sents an upper bound. This line shows the AST for the battle
group when only considering the time required to conduct the
UNREP, i.e., time required to transfer fuel plus 20 minutes.
30
99.0
98.0-------------- -
97.0
96.0
(I)< 95.0
94.0
93X AST FOR DELIVERY BOY AND w*Stn
92.0
91.0 , p , p, , J I , I1 1 1 I* ~ s
12 13 14 15 16 17 1s 19 20 21
SO0AFigure 6. AST vs SOA For Formation A
99.0
98.0 ---- . .........
97.0
96.0
(I)< 95.0
94.0
93.0 sAST FOR DELIVERY BOY ANDSERVICE STATION METHODS OFUNREP USING FORMATION B
92.0
91.0-1..12 13 14 15 16 17 is 19 20 21
SQ0AFigure 7. AST vs SCA For Formation B
31
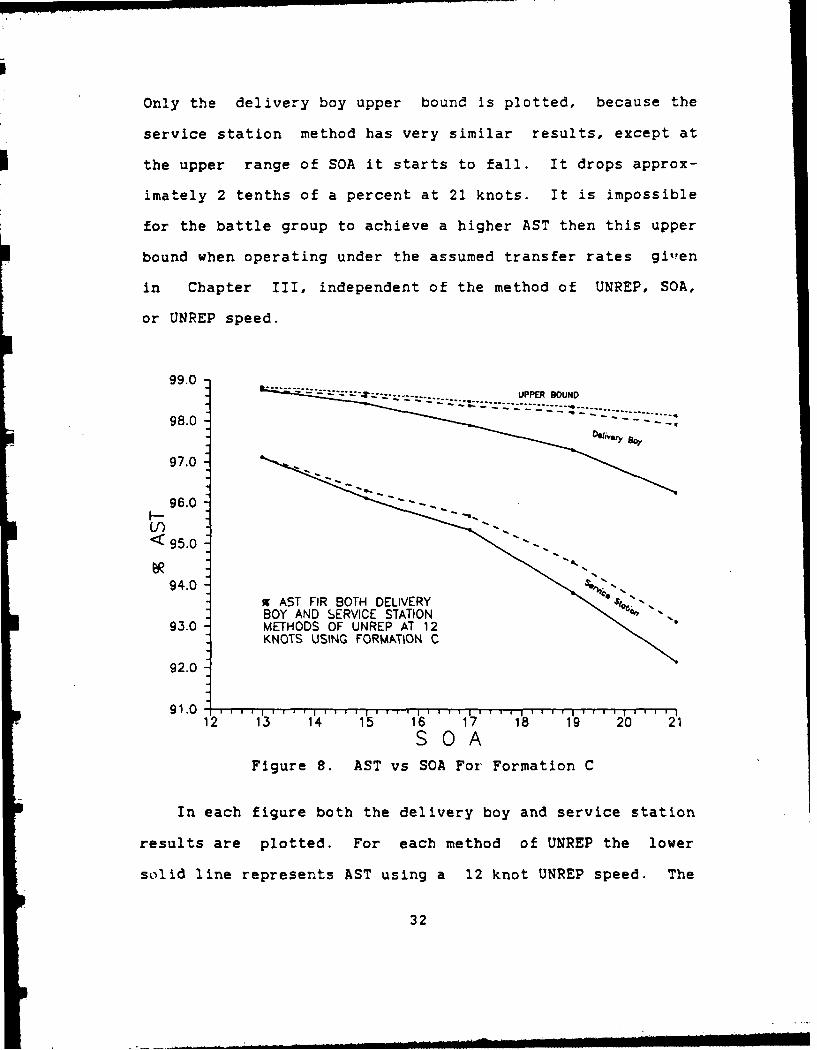
Only the delivery boy upper bound is plotted, because the
service station method has very similar results, except at
the upper range of SOA it starts to fall. It drops approx-
imately 2 tenths of a percent at 21 knots. It is impossible
for the battle group to achieve a higher AST then this upper
bound when operating under the assumed transfer rates gixen
in Chapter III, independent of the method of UNREP, SOA,
or UNREP speed.
99.0 -;.- ~ ~.Z : .....-...
.. ..... P..BUN
98.0 " -- -0
97.0
96.0F--UT)< 95.0
94.0 X AST FIR BOTH DELIVERY-.... ,,'
93.0 METHODS OF UNREP AT 12KNOTS USING FORMATION C
92.0
9 1.0 .. . j . . . . , . . . . , . . .. ., . . .* . .12 13 14 15 16 17 18 19 20 21SOA
Figure 8. AST vs SOA For Formation C
In each figure both the delivery boy and service station
results are plotted. For each method of UNREP the lower
solid line represents AST using a 12 knot UNREP speed. The
32
upper large dashed line represents an UNREP speed which is
one knot less than the given SOA. As one would expect the
higher the UNREP speed with respect to SOA the better the
AST. It is assumed that a battle group would not UNREP
faster than the given SOA.
Laying Figures 6, 7, and 8, over one another reveals an
interesting trend. The trend for AST to decrease as SOA
increases appears to be independent of the formation used.
Both delivery boy and service station AST follow the same
basic trends. The reader should keep in mind that these are
notational battle groups, and formation placement is gen-
eric. As should be expected because fuel consumption is
non-linear, as SOA increases the AST for the battle group
starts to fall off rapidly. Also as SOA increases the
benefits of a delivery boy method of UNREP also increase
with SOA as compared to the service station method.
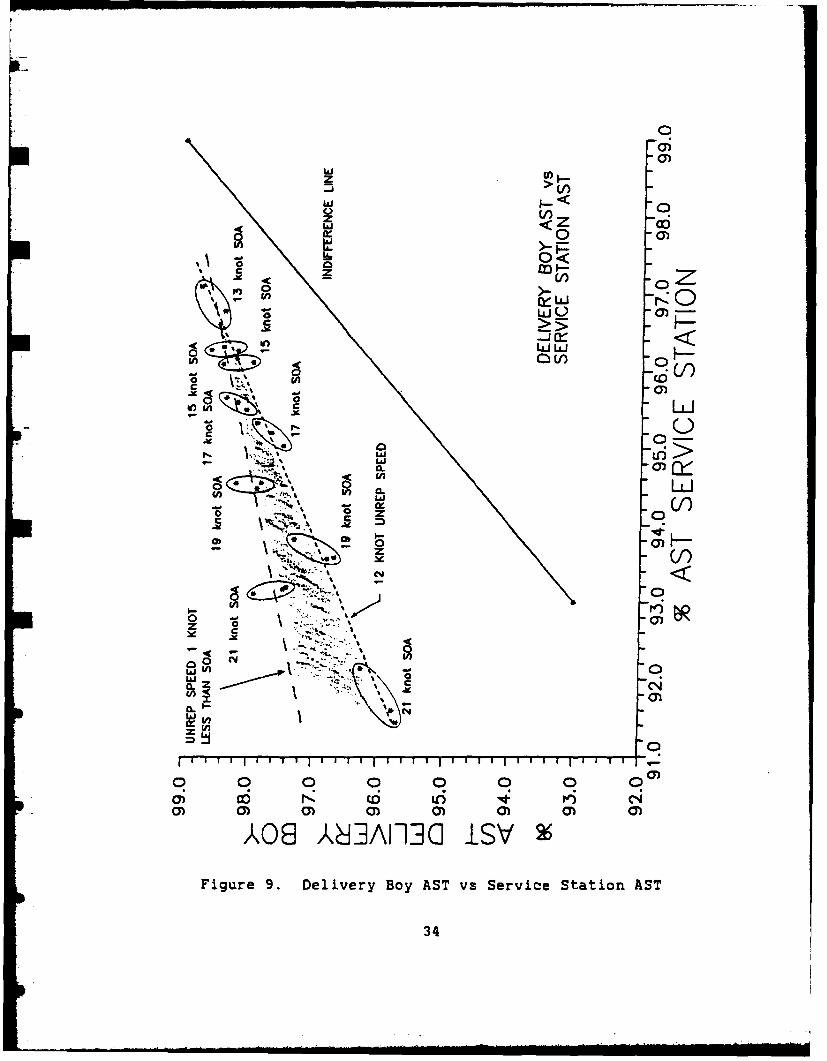
C. ANALYSIS OF UNREP SPEED vs SOA
The purpose of this study was to analyze the trade offs
between the two methods of UNREP. With this in mind a plot
was made of AST for a delivery boy method of UNREP vs AST
for a service station method. Figure 9 shows the results of
delivery boy AST vs service station AST for the three forma-
tions used. Using the method of least squares, best fit
lines were plotted for an UNREP speed set at 12 knots, which
is the lower small dashed line, and for an UNREP speed one
33
IJ
<0 0
A ~ 0<C z)
LLJ0
>-
C 0))
CA
LtI>
I) La~/
Ix0
z 0
I.
0
LAJ 0r
0.I z
Z~ I
o 0 0 0 0 0 0
) 0 ) C C) (3) )
/kO9 )\d\ AI1]G I-SVFigure 9. Delivery Boy AST vs Service Station AST
34
knot less than SOA, which is the upper large dashed line.
The results from all three formations using the same SOA are
circled, and the results from the three formations usin- the
same UNREP speed are used to fit each best fit line.
The shaded cone shaped region between the two best fit
lines represents an area in which the CWC could expect the
results to fall when UNREP speed is varied between 12 and 20
knots using similar formations. The independent line to the
right represents an indifference line, meaning one would be
indifferent between the two methods of UNREP because they
provide the same AST. In all cases the preferred method of
UNREP did not change when UNREP speeds was varied, indepen-
dent of SOA or formation used. Figure 9 shows that the
higher the SOA the more a delivery boy method of UNREP is
preferred in order to maintain a high AST.
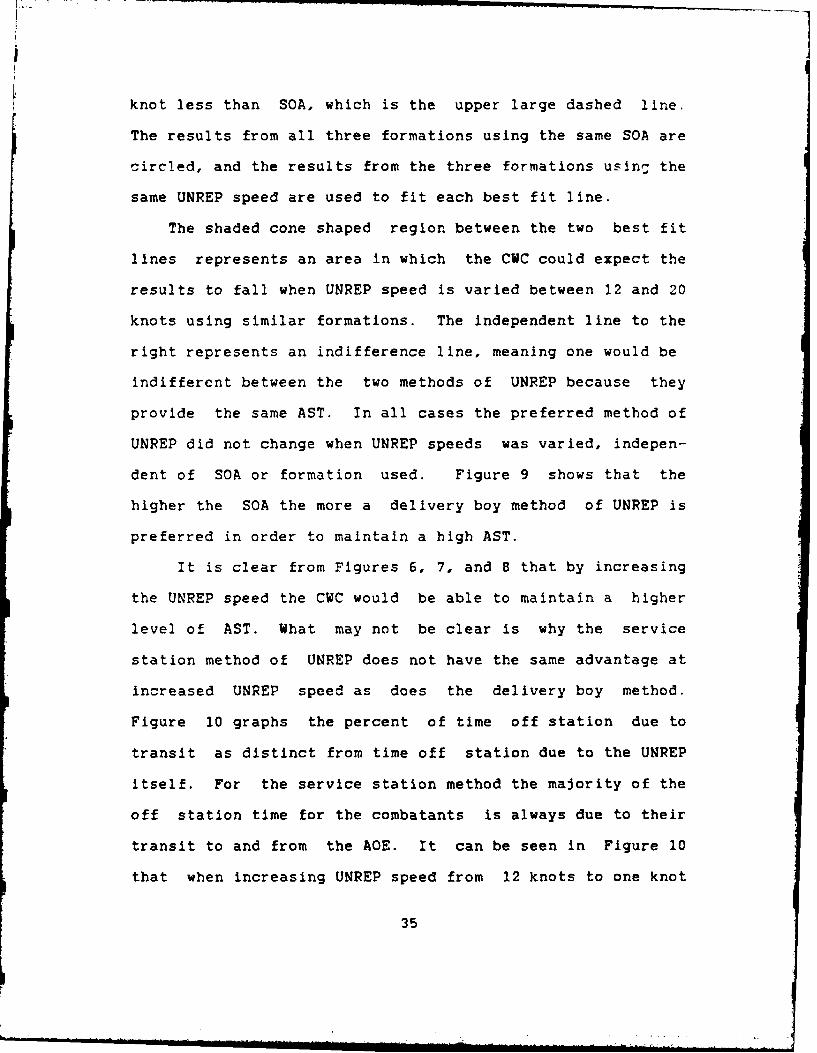
It is clear from Figures 6, 7, and 8 that by increasing
the UNREP speed the CWC would be able to maintain a higher
level of AST. What may not be clear is why the service
station method of UNREP does not have the same advantage at
increased UNREP speed as does the delivery boy method.
Figure 10 graphs the percent of time off station due to
transit as distinct from time off station due to the UNREP
itself. For the service station method the majority of the
off station time for the combatants is always due to their
transit to and from the AOE. It can be seen in Figure 10
that when increasing UNREP speed from 12 knots to one knot
35
less than SOA, comparatively little was gained for the
service station method. For delivery boy at slow SQA only a
small percentage of nff station time was due to transit
time. As SOA increases, unless UNREP speed is increased
correspondingly, a significant increase in off station time
due to transit time will occur.
90.0 a OFF STATION DUE00 TRANSIT TIME
80.0
70.0.....
~50.0 ( LNREP spo.d - 12 knou. ... '&
I.40.0 -...
Uj-
0.
20.0 ~~~DELWM Y Soi Mofr NE
opd I lknot l.B Owe SOA
012 1'3 1'4 .. .15 .. .186 175 1 19 "20 .. .21
Figure 10. Off Station Time Due to Transit
D. ANALYSIS OF AIDE IDLE TIME
The fact that AST for both methods of UNREP using
formation C was comparable to that obtained using formation
A and B lead to an expectation that commodity levels were
significantly lower due to the fact that the AQE had more
36
.. .. - ! J m uI -i -m
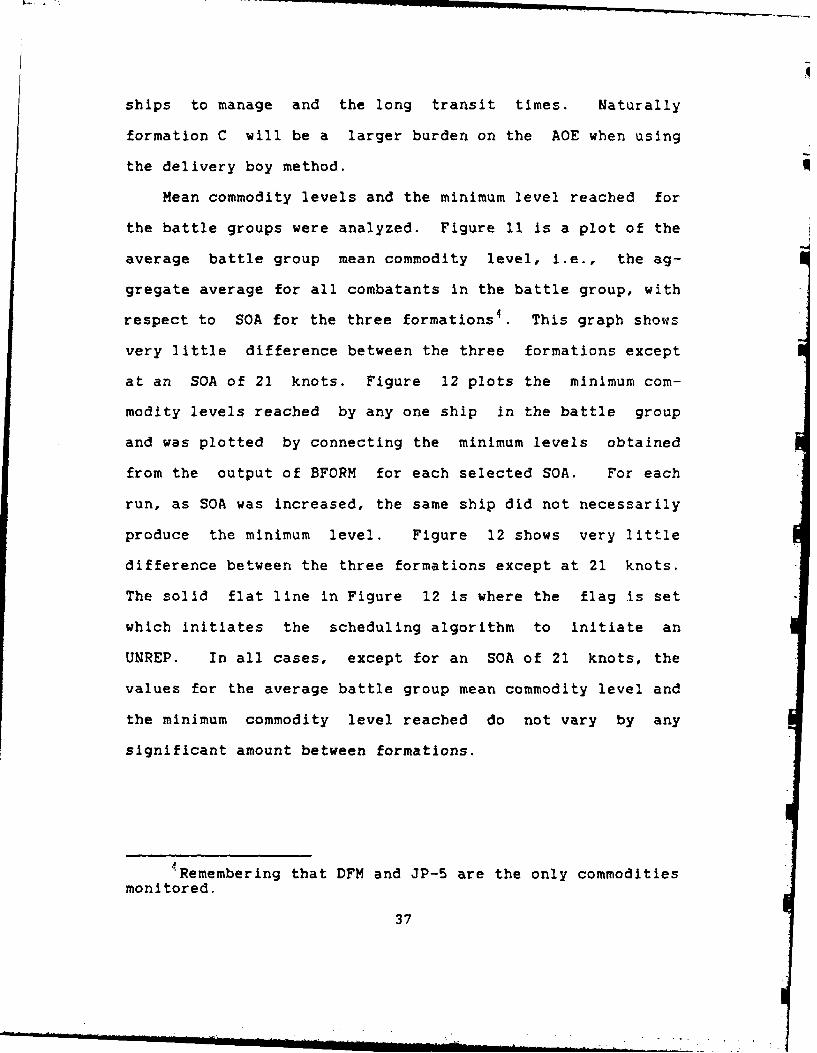
ships to manage and the long transit times. Naturally
formation C will be a larger burden on the AOE when using
the delivery boy method.
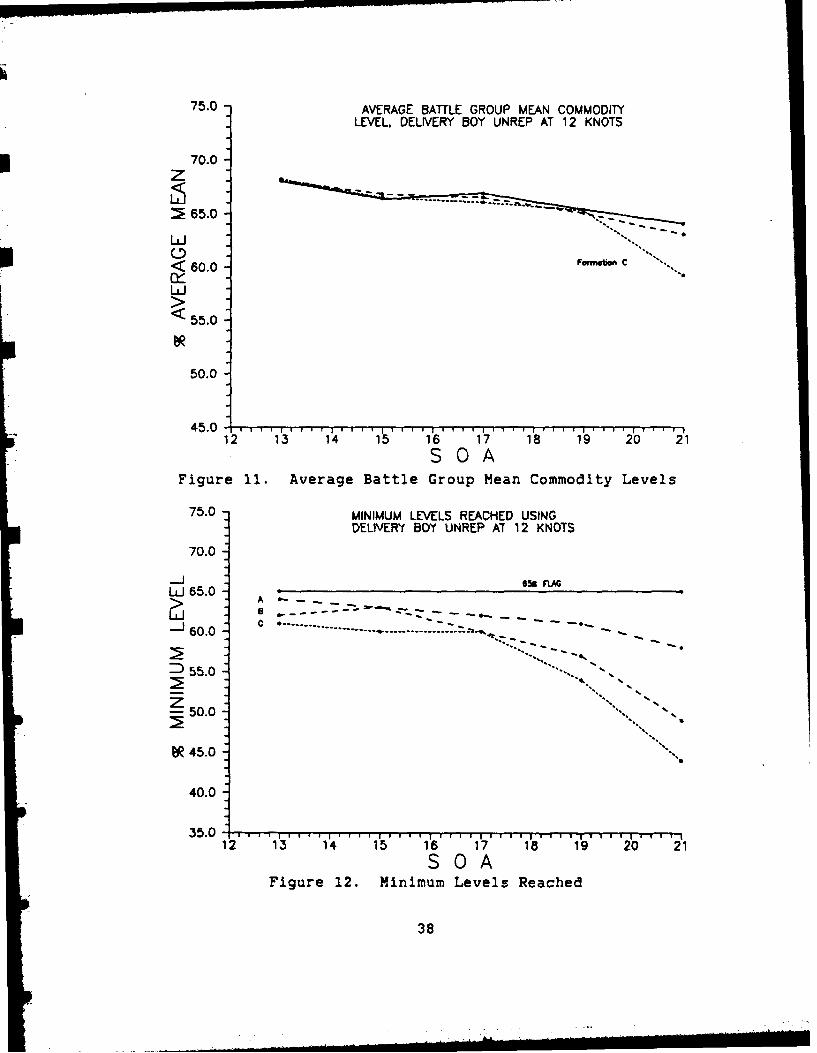
Mean commodity levels and the minimum level reached for
the battle groups were analyzed. Figure 11 is a plot of the
average battle group mean commodity level, i.e., the ag-
gregate average for all combatants in the battle group, with
respect to SOA for the three formations This graph shows
very little difference between the three formations except
at an SOA of 21 knots. Figure 12 plots the minimum com-
modity levels reached by any one ship in the battle group
and was plotted by connecting the minimum levels obtained
from the output of BFORM for each selected SOA. For each
run, as SOA was increased, the same ship did not necessarily
produce the minimum level. Figure 12 shows very little
difference between the three formations except at 21 knots.
The solid flat line in Figure 12 is where the flag is set
which initiates the scheduling algorithm to initiate an
UNREP. In all cases, except for an SOA of 21 knots, the
values for the average battle group mean commodity level and
the minimum commodity level reached do not vary by any
significant amount between formations.
4Remembering that DFM and JP-5 are the only commodities
monitored.
37
75.0 AVERAGE BATTLE GROUP MEAN COMMODITYLEVEL. DELIVERY BOY UN REP AT 12 KNOTS
70.0
S65.0
IL< 60.0 w~b'
<55.0
50.0
450 12 .... 1'3.... 14. . 1'5 .. .1 6 .. .1'7 1'8. . 91 . . 20 21
Figure 11. Average Battle Group Mean Commodity Levels
75.0 -MINIMUM LEVELS REACHED USINGDELNVERY BOY UNREP AT 12 KNOTS
70.0
65.065 *nFAG
wL -
S60.0--- -------------------- ----------- =-
S55.0 . '
50.0
S45.0
40.0
35.0 . .. . 1... . .. . .12 13 14 15 16 17 18 19 20 21
SQ0AFigure 12. Minimum Levels Reached
38
For an SOA of 21 knots it is not clear whether formation
C produced significantly different average mean commodity
levels or minimum levels reached from the other two forma-
tions. The delivery boy method of UNREP and the use of a 12
knot UNREP speed with an SOA of 21 knots made this the most
demanding case to maintain commodity levels. This is
because the combatants are required to stay on station in
the formation and wait for the AOE to arrive.
An investigation as to the cause led to an analysis of
the idle time for the AOE. Idle time for the AOE is defined
as the time the AOE was not involved in UNREP, in transit to
UNREP, or in transit from UNREP. A point which needs to be
made here is that the AOE will make a transit after UNREP
only for the service station method to regain its assigned
station. After a delivery boy UNREP the AOE will steam
along at the indicated SOA from the point at which the UNREP
was completed. Only when the scheduling algorithm cues the
next ship in need of UNREP will the AOE transit to that
ship's position to conduct an UNREP.
In Figure 13 idle time for the AOE is plotted as a
percentage of the total time available to the AOE, 240 hours
(24hr / day x 10 days). It may be deduced from the percent-
age plot of Figure 13 that the AOE only had 21.47 hours of
free time when using formation C and a delivery boy method
of UNREP at 21 knots SOA.
39
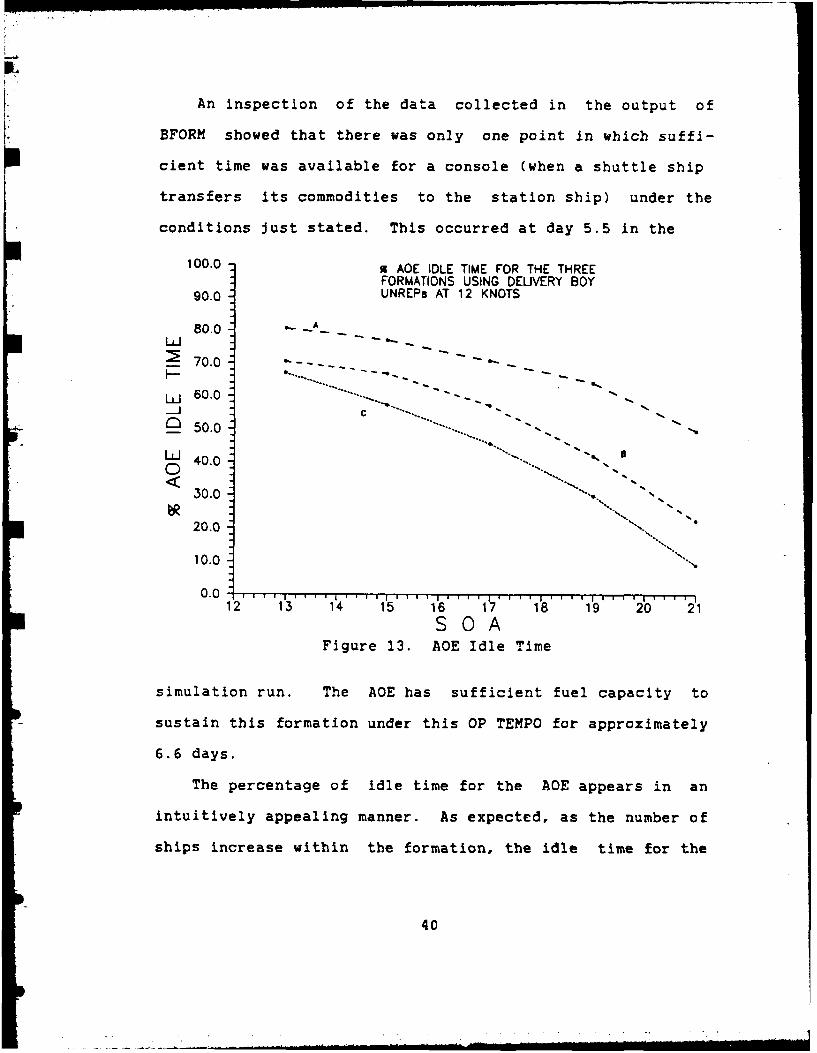
An inspection of the data collected in the output of
BFORM showed that there was only one point in which suffi-
cient time was available for a console (when a shuttle ship
transfers its commodities to the station ship) under the
conditions Just stated. This occurred at day 5.5 in the
100.0 x AOE IDLE TIME FOR THE THREEFORMATIONS USING DELIVERY BOY
90.0 UNREPS AT 12 KNOTS
8, I 0 .0 _ A _
70.0
S.. - •.%50.0 S" "
30.0 "".
20.0
10.0 ,,,
0.0 . . . . . . . . ; I . , 5
12 13 14 15 16 17 18 19 20 21SOAFigure 13. AOE Idle Time
simulation run. The AOE has sufficient fuel capacity to
sustain this formation under this OP TEMPO for approximately
6.6 days.
The percentage of idle time for the AOE appears in an
intuitively appealing manner. As expected, as the number of
ships increase within the formation, the idle time for the
40
AOE decreases. The plot for formation C does not appear to
deviate significantly from the other two formations.
E. ANALYSIS OF OPENING UP THE FORMATION
Formations A, B, and C were opened up to simulate
extended formations. These extended formations used the
same relative positions as in the base case, but with the
outer screen placed 130 nautical miles from formation center
vice 50 and the inner screen placed 30 nautical miles from
formation center vice 10.
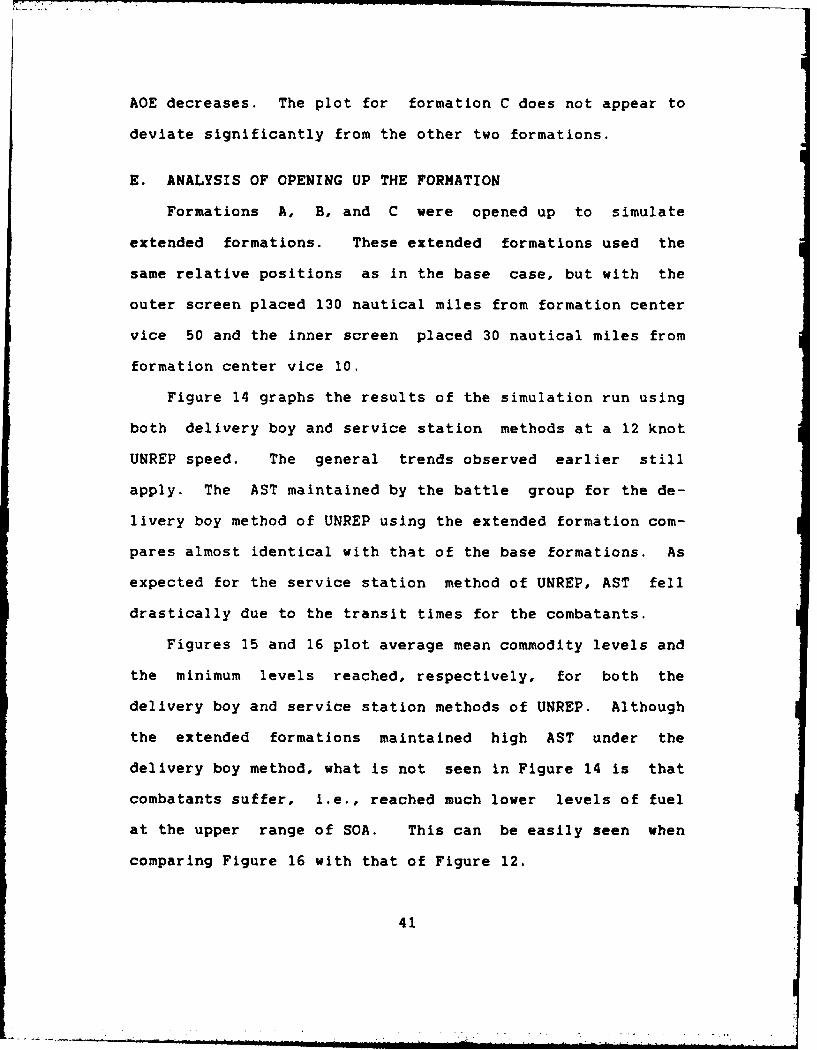
Figure 14 graphs the results of the simulation run using
both delivery boy and service station methods at a 12 knot
UNREP speed. The general trends observed earlier still
apply. The AST maintained by the battle group for the de-
livery boy method of UNREP using the extended formation com-
pares almost identical with that of the base formations. As
expected for the service station method of UNREP, AST fell
drastically due to the transit times for the combatants.
Figures 15 and 16 plot average mean commodity levels and
the minimum levels reached, respectively, for both the
delivery boy and service station methods of UNREP. Although
the extended formations maintained high AST under the
delivery boy method, what is not seen in Figure 14 is that
combatants suffer, i.e., reached much lower levels of fuel
at the upper range of SOA. This can be easily seen when
comparing Figure 16 with that of Figure 12.
41
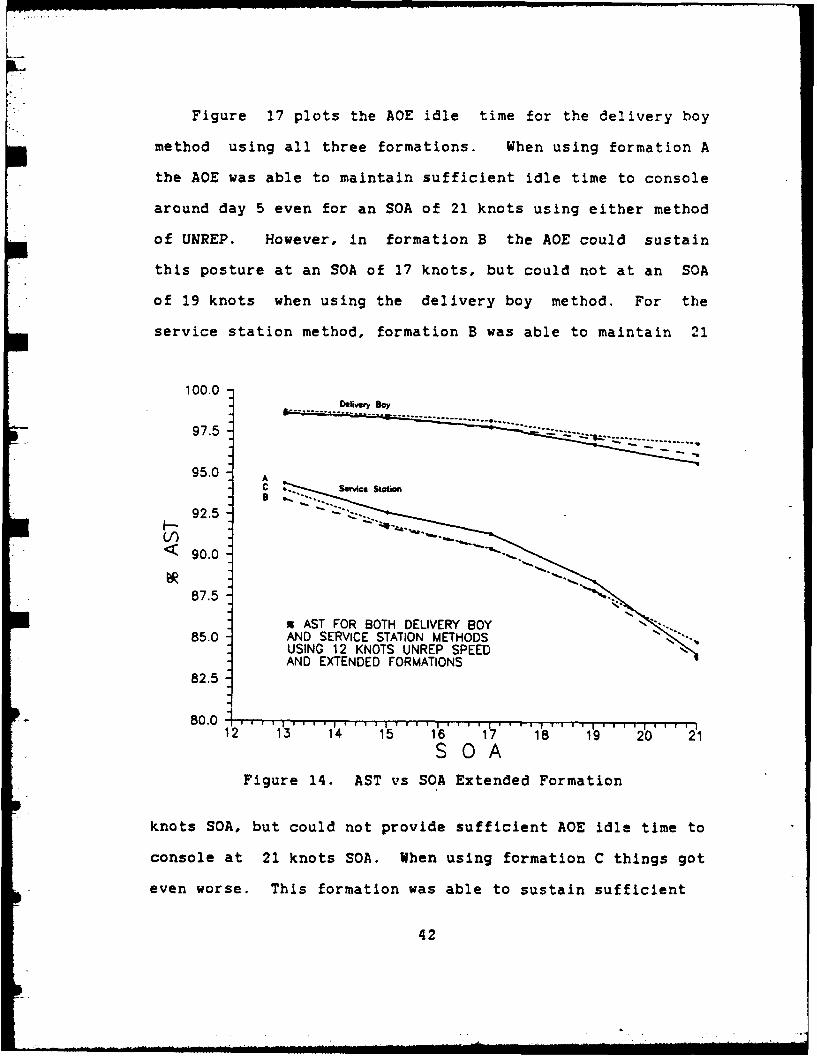
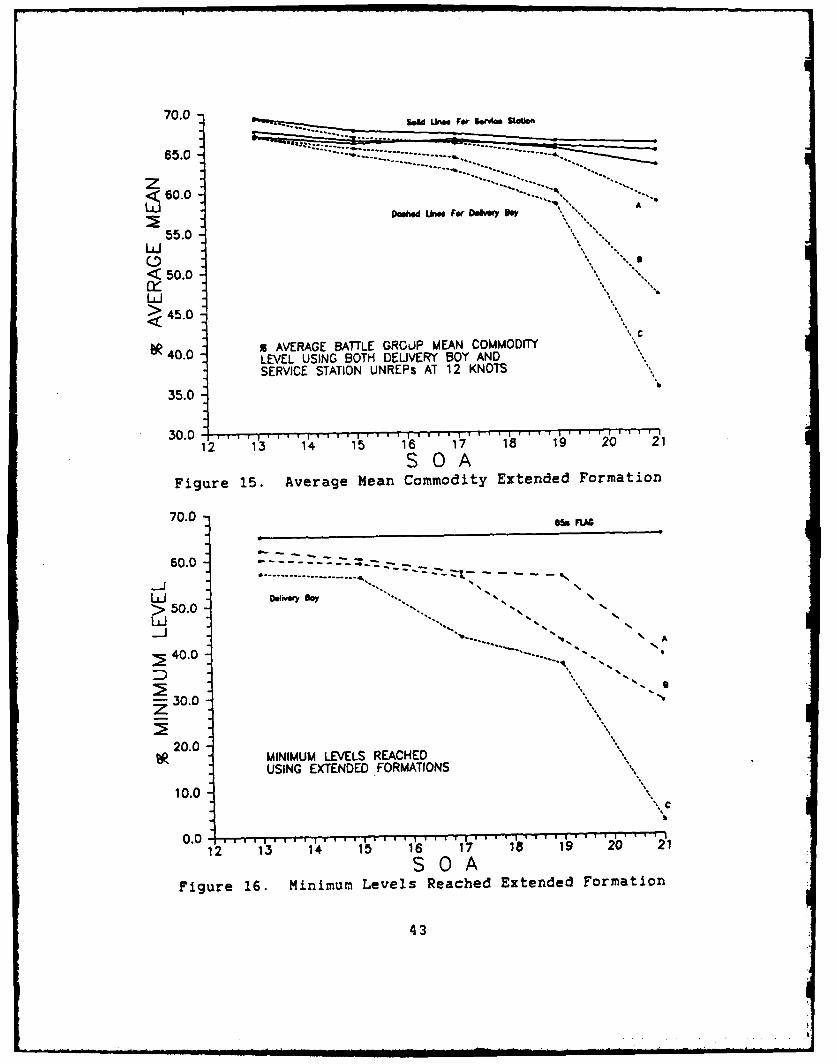
Figure 17 plots the AOE idle time for the delivery boy
method using all three formations. When using formation A
the AOE was able to maintain sufficient idle time to console
around day 5 even for an SOA of 21 knots using either method
of UNREP. However, in formation B the AOE could sustain
this posture at an SOA of 17 knots, but could not at an SOA
of 19 knots when using the delivery boy method. For the
service station method, formation B was able to maintain 21
100.0 -
97.5
95.0 A
92.5
LI)< 90.0
87.5
a AST FOR BOTH DELIVERY BOY85.0 AND SERVICE STATION METHODS
USING 12 KNOTS UNREP SPEEDAND EXTENDED FORMATIONS
82.5
80.0 12 .... I . 1I4 .... 5 .... 16 .16 . 1 .... 1' . 2b .... 2 1
SOA
Figure 14. AST vs SOA Extended Formation
knots SOA, but could not provide sufficient AOE idle time to
console at 21 knots SOA. When using formation C things got
even worse. This formation was able to sustain sufficient
42
-- - - - - - - -- - - ----------- --- - - - - -
65.0
60.0----------
55.0Lii
<50.0
> 45.0< C
40.0 uAVERAGE BATTLE GROU.P MEAN COMMODITY%%LEVEL USING BOTH DELIVERY BOY ANDSERVICE STATION UNREPS AT 12 KNOTS
35.0 l
30.0-12 1'3 14 15 16 17 18 19 20o1 121
SO0AFigure 15. Average Mean Commodity Extended Formation
70.0
60.0 .z:.--
L JLJ S..w
d
L> 50. -, 5
40.0
-30.0
20.0MINIMUM LEVELS REACHEDUSING EXTENDED FORMATIONS
10.0-\C
12 13 14 15 16 17 18 19 20 21. i
Figure 16. Minimum Levels Reached Extended Formation
43
idle time for the AOE to console when using 15 knots SOA for
delivery boy method and 17 knots SOA for service station
method. However it could not provide this posture at 17
knots SOA for delivery boy method and 19 knots SOA for
service station method.
" AOE IDLE TIME FOR EXTENDED
70.0 FORMATIONS USING 12 KNOT UNREPs
A
60.0 -
- 50.0 .
40.0 "' *
w 30.0 ",0
2 .'-.. ",S'20.0 *
10.0 MI Wivery BoW UREa~...=
12 1 3 I 'll 14 . 15 .... 1 .... 18 . 19 .... 20 .... 2'1SOA
Figure 17. AOE Idle Time Extended Formation
The program has a few hours at the start of each simula-
tion run where the AOE is idle, this is due to the fact that
no ships start the simulation at or below a 65% fuel level.
Therefore, as seen in Figure 17 the plots for formation B
and C start to level off down in the range of 5% AOE idle
44
time. In other words for formation C the AOE is essentially
busy continuously above 17 knots, and the queue of ships
waiting to fuel is building up without end. The same
situation occurs for formation B at 21 knots. As expected,
when using formation B and C in the delivery boy mode in the
upper range of SOA, once the AOE started UNREPs it never
caught up, i.e., it always had some ship waiting to be
refueled. The ships never ran out of fuel during the ten
day transit, although a few did reach some unacceptably low
levels.
45
I-" - i i liil lIiI l m
VI. RESULTS AND CONCLUSIONS
A. METHOD OF UNREP
One of the OTC's major decisions is between being
continuously topped off for battle verses the degradation of
readiness due to screening ships off station or the exposure
of the UNREP ship when the delivery boy makes its rounds.
The tactical commander must also decide between the service
station and delivery boy method of UNREP or something
between the two, a possibility we have not analyzed.
Measuring the time the battle group, on the average, spends
on station (AST) is one means of measuring the effectiveness
of the battle group. Trying to maintain a "Ready" battle
force by keeping his units topped off at 80% will degrade
the screen effectiveness and overtax personnel and equip-
ment.
In Figures 6, 7, 8, and 14 we readily see how much
better in AST the delivery boy method is than the service
station method. How much AST the decision maker must
sacrifice for a service station method will depend on the
UNREP speed, SOA, the number of combatants within the
formation, and formation dispersion. Figure 9 shows that as
SOA increases the preferred method becomes even more prefer-
red, i.e., moves further from the indifference line. As SOA
increases the AST lost using a delivery boy method is
46
smaller as compared to AST lost for a service station
method.
The additional benefit in AST due to increasing UNREP
speed is higher for a delivery boy than for a service
station method. Relative to the same SOA, this is due to
the large amounts of time involved in the total transit for
the combatants using the service station method. This can
be seen in Figure 10, which shows, as UNREP speed is in-
creased from 12 knots to one knot less than SOA, the addi-
tional decrease in the percentage of off station time due to
transit is overwhelmed by the large transit time under the
service station method.
In order for the AOE to meet combatant refueling demands
and at the same time have sufficient time to refuel from a
shuttle ship, a certain level of AOE idle time is required.
More time is required to conduct delivery boy UNREPs vice
service station UNREPs. Idle time for the AOE is dependent
on the number of ships in the formation and range of the
units from formation center. It was found that the AOE
could provide the required refueling services given that it
had approximately 15% or more idle time.
The AOE was able to serve formation A (6 ships) under
all operating conditions, even the extended formation, and
maintained commodity levels relatively close to the set
flag. Using formation B (9 ships) however, the AOE could
provide the required services when screen formation was set
47
. . . . -p' m~ l l l
at 50 nm. It could not for the extended formation (at 130
rim) above 19 knots SOA. A further constraint was observed
with formation C (12 ships). The AOE could not provide the
extended formation above 17 knots SOA. As seen in Figures
16 and 17, extremely low fuel levels in the combatants and
the AOE idle time down in the range of 5% clearly show that
the AOE is incapable of providing for more than 9 combatants
in an extended formation when required to maintain an SOA of
19 to 21 knots for any extended period of time. It was
observed that the AOE could provide an extended formation
for short periods of time.
Under these extended formations it was not uncommon to
have AOE transit times in excess of 15 hours, and even up to
24 hours when using an SOA of 21 knots. When using the
close-in formation transit times seldom exceeded 10 hours.
The scheduling algorithm comes into play here. For instance
if a ship on the outer screen enters into the queue for
UNREP and the AOE has another ship enter the queue before
the AOE starts its transit to the outer screen, due to the
scheduling algorithm, then typically the closer ship will be
UNREPed first. The major outcome of this is that very
seldom will the AOE make a transit between combatants on
opposite ends of the screen. Therefore transit times are
not as long as would otherwise be expected.
As a tactical aid for a decision maker, the analysis of
the results of BFORM provides some insight into the trade
48
offs between the methods of UNREP and the desired SOA.
Considering the mission of the battle group, training,
surveillance, or intelligence gathering, all of which typi-
cally fall under the heading of "peace time" operations, a
CWC may want to use a delivery boy method of UNREP knowing
that this method will maximize AST. Within a high threat
environment, a service station method provides the best
protection for the AOE. Consideration must be given to this
vital asset, considering that a battle group in the extended
formation B could not operate for long over 6 days without
having the majority of its combatants running out of fuel
using an SOA of just 19 knots.
Effective use of the AOE prompts the use of simultaneous
UNREPs. Consolidating UNREP evolutions will ease the over-
all work load. Battle group endurance is directly related
to the staying power of the AOE. The AOE delivers roughly
60% of its cargo to the CV, which is another reason to keep
the AOE in the vicinity of the CV.
B. THE PROGRAM BFORM
The program BFORM will abort if the user tries to use an
UNREP speed equal to that of the SOA. This is why in the
analysis an UNREP speed of at least one knot less then SOA
was chosen. BFORM also will abort if SOA is set equal to
the maximum speed of the station ship. The program will
however run if the UNREP speed is set faster than the
49
however run if the UNREP speed is set faster than the
maximum speed of the station ship.
The program is flexible and allows the user to model
realistic situations. The operator can use different flag
levels for the different combatants within the formation,
depending on the units' priority and mission. The program
should be improved in three ways; it should include the fuel
usage of the station ship, it should have the station ship
return to its assigned station after a delivery boy method
of UNREP instead of staying in the vicinity of the last
UNREP, and last it should allow the operator to input a
variable which will cause the scheduling algorithm to
initiate an UNREP when the AOE is idle and a unit comes
within some percentage above its flag level. These addi-
tions would better approximate actual battle group opera-
tions. The net result of these three changes would have
been a slight increase in AST in some cases.
C. RECOMMENDATIONS
Understanding the mechanics behind UNREP and the two
methods discussed in this paper will lead to integrating
UNREP considerations into the tactics of warfighting.
Battle group on station time can not and should not be
assumed to be 100% no matter what formation or UNREP method
if transit time is in excess of three days.
50
Employing tactics which would rotate the formation could
provide additional AST. Kcep the AOE under the protective
umbrella of the CV and rotate the formation around the outer
screen. As a unit of the outer screen requires refueling,
bring it in to replace a unit of the inner screen. Send a
topped off unit from the inner screen to the outer screen.
The AOE would service only those units within the inner
screen. However, this tactic would require units to have
comparable capabilities. This new tactic offers promise and
requires further study.
Another area of future research would be to further
consider battle group screening effectiveness. When units
depart their outer screen stations to UNREP screening effec-
tiveness degrades gracefully, not abruptly. Similarly, as
units get close to assigned stations after UNREP their
screening effectiveness would increase to full value. At
present this effect can be approximated in the model by
specifying a patrol radius instead of a point station.
However, in order to utilize the model feature, AAW and ASW
experts must analyze and determine the best choice of radius
to represent "on station" effectiveness.
While BFORM does not presently have complete flexibil-
ity, it is already very powerful and could be modified to
model additional scenarios. The goal should be to blend
screening effectiveness analysis with new UNREP tactics to
achieve better, safer battle group operations. Readiness at
51
the battle group level is more than some CASREP percentage,
manning level, spare parts and stock on hand, or even
training proficiency. Not only do we have to make do with
what we have, but allocating what we have smartly will lead
to the maximum battle group readiness. BFORM is a viable
tactical aid which can and should be adopted now by the end
user--the commands and their staff.
52
APPENDIX A
STEAMING FORMATIONS
Three steaming formations were formed using a low,
reasonable, and high mix of combatants. This appendix con-
tains those formations.
53
0'
IvaI
'I Go
Figure 1s. Formation A
54
UAU
en1
LA.
. . . . .. . . . .
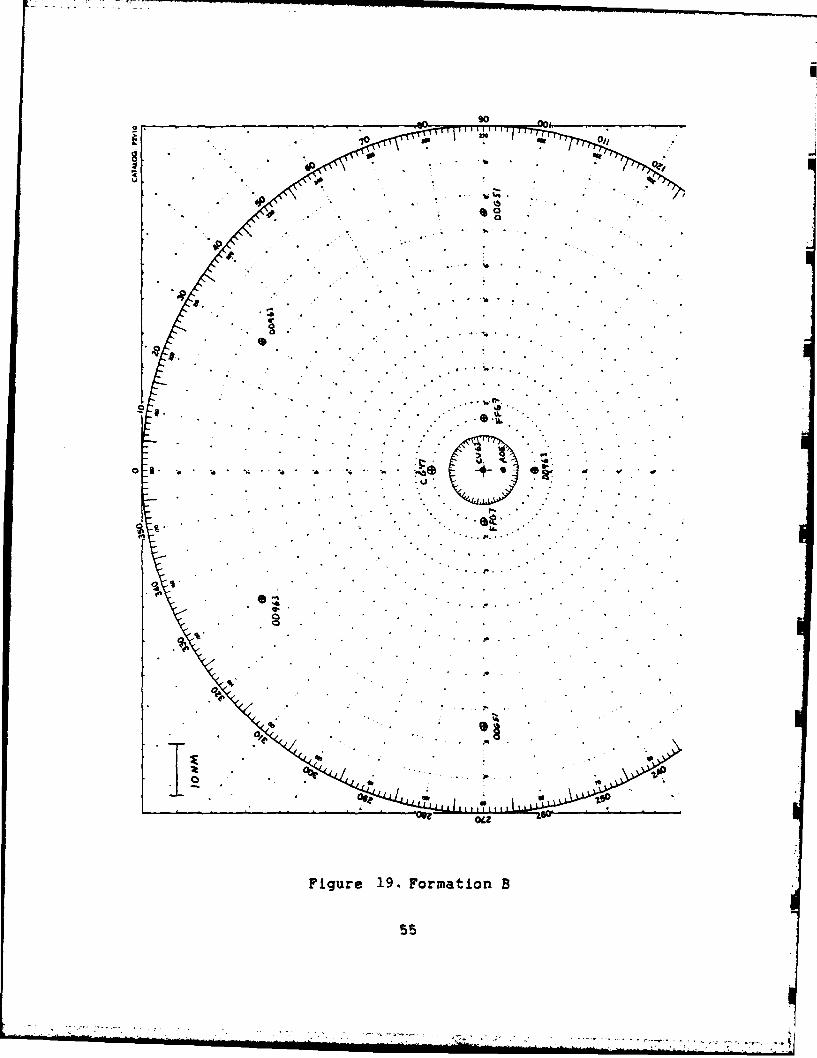
Figur 19.Formaion
55 .. .3'
44
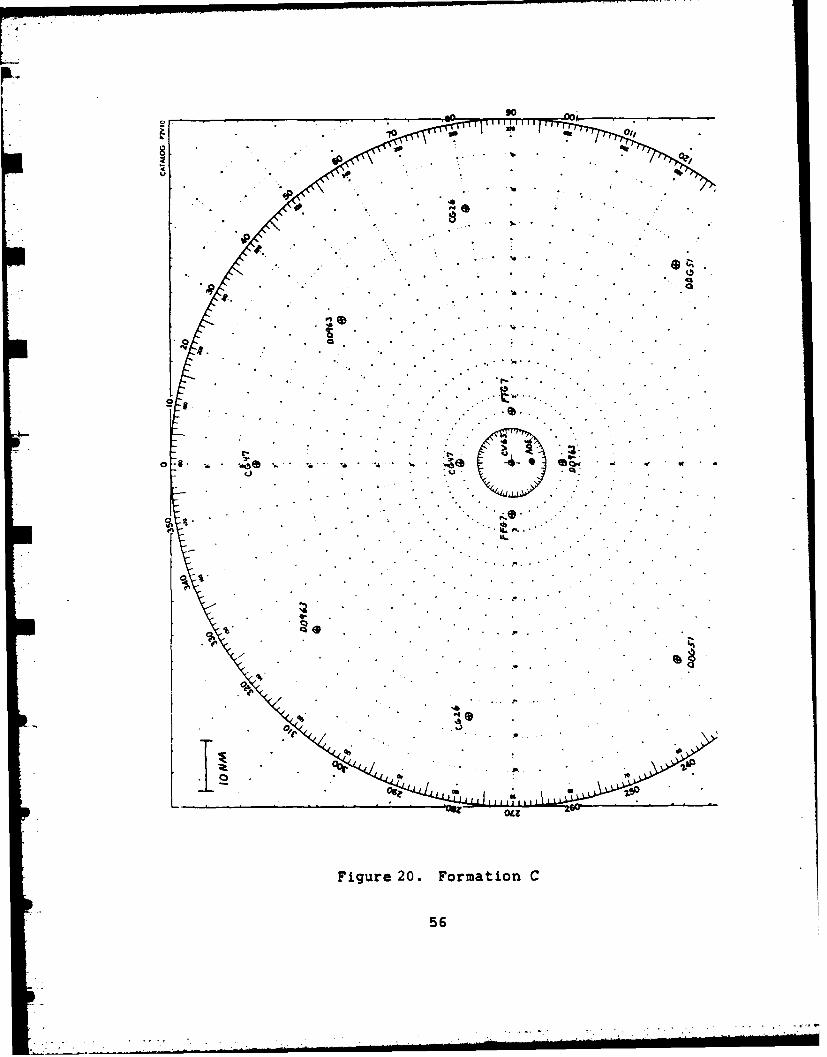
Figure~~ 20 Fomaio
* * 56
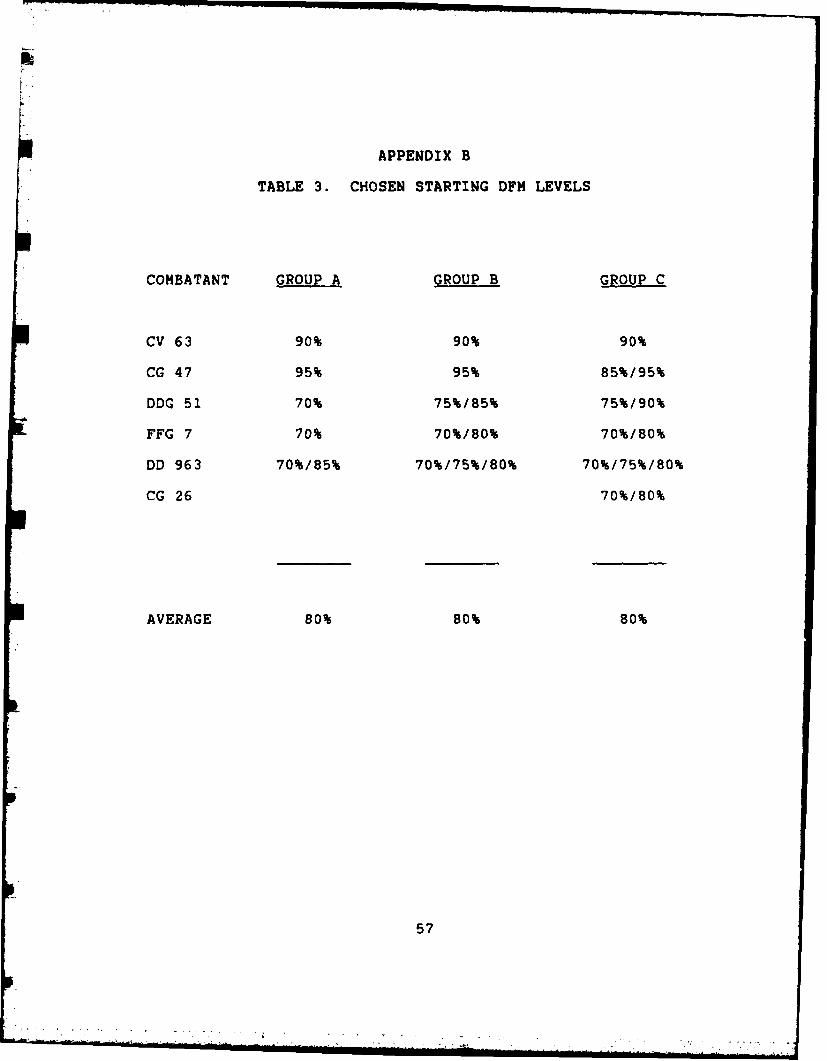
APPENDIX B
TABLE 3. CHOSEN STARTING DFM LEVELS
COMBATANT GROUP A GROUP B GROUP C
CV 63 90% 90% 90%
CG 47 95% 95% 85%/95%
DDG 51 70% 75%185% 75%/90%
FFG 7 70% 70%/80% 70%/80%
DD 963 70%/85% 70%/75%/80% 70%/75%/80%
CG 26 70%/80%
AVERAGE 80% 80% 80%
57
APPENDIX C
COMPARISON BETWEEN THREE FLAG LEVELS
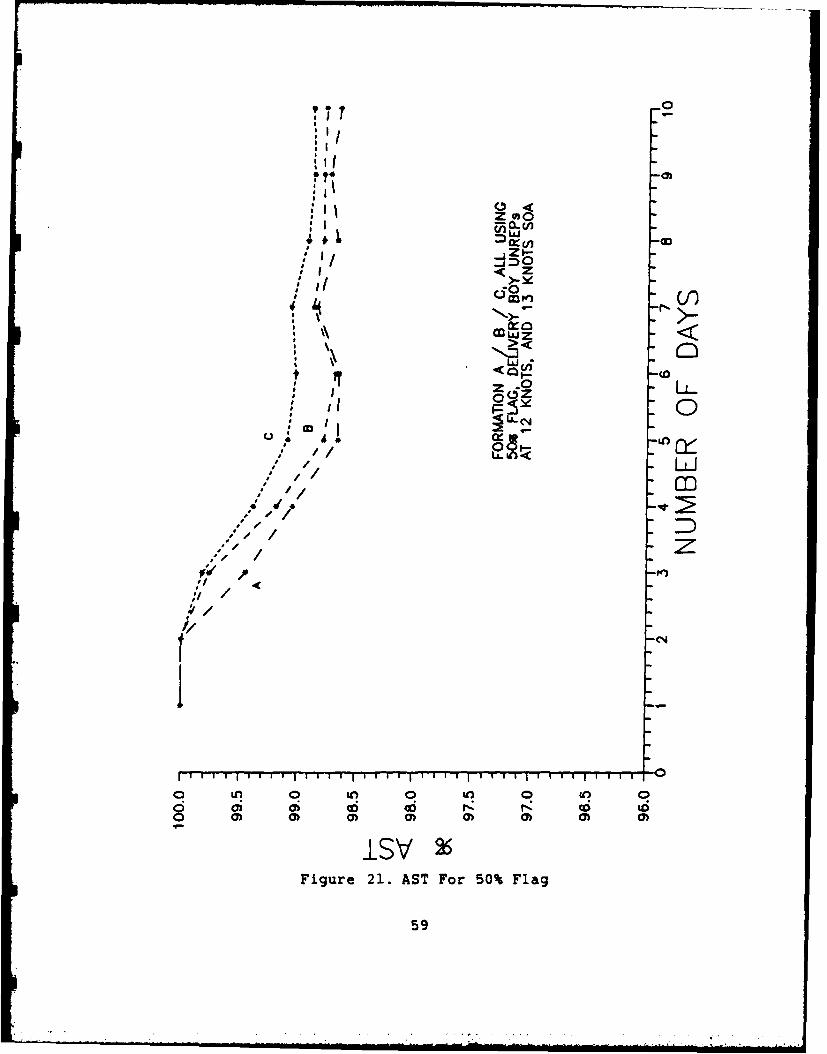
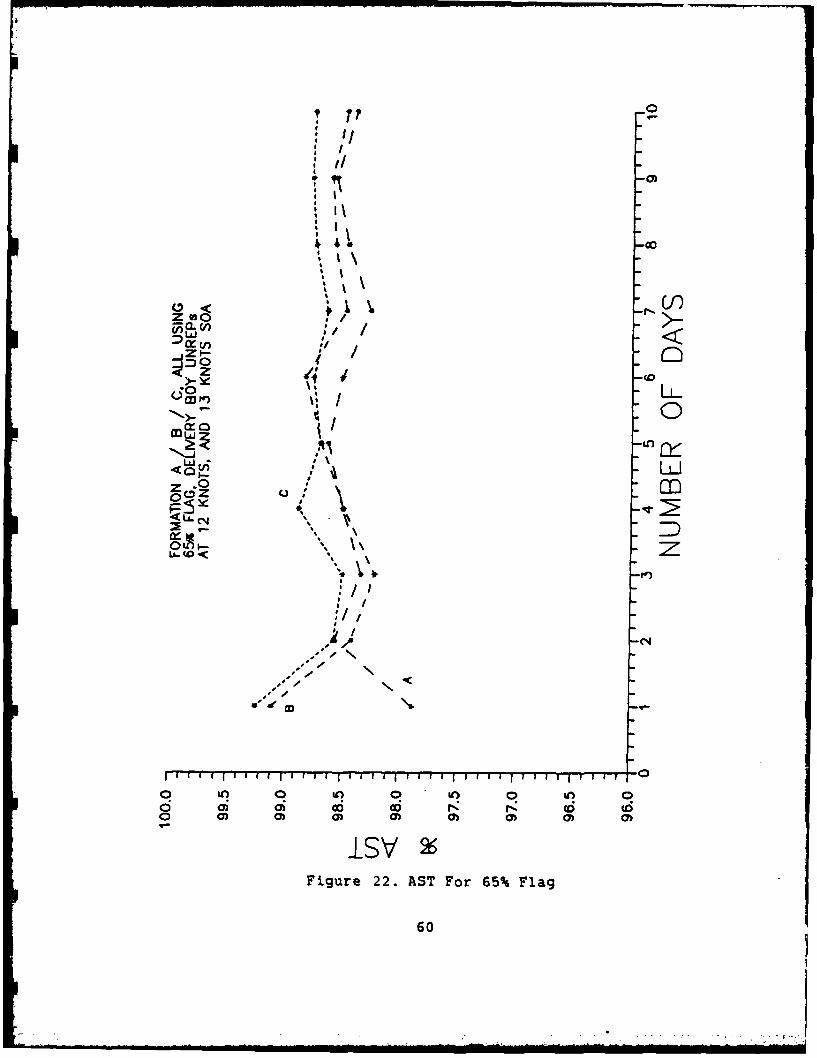
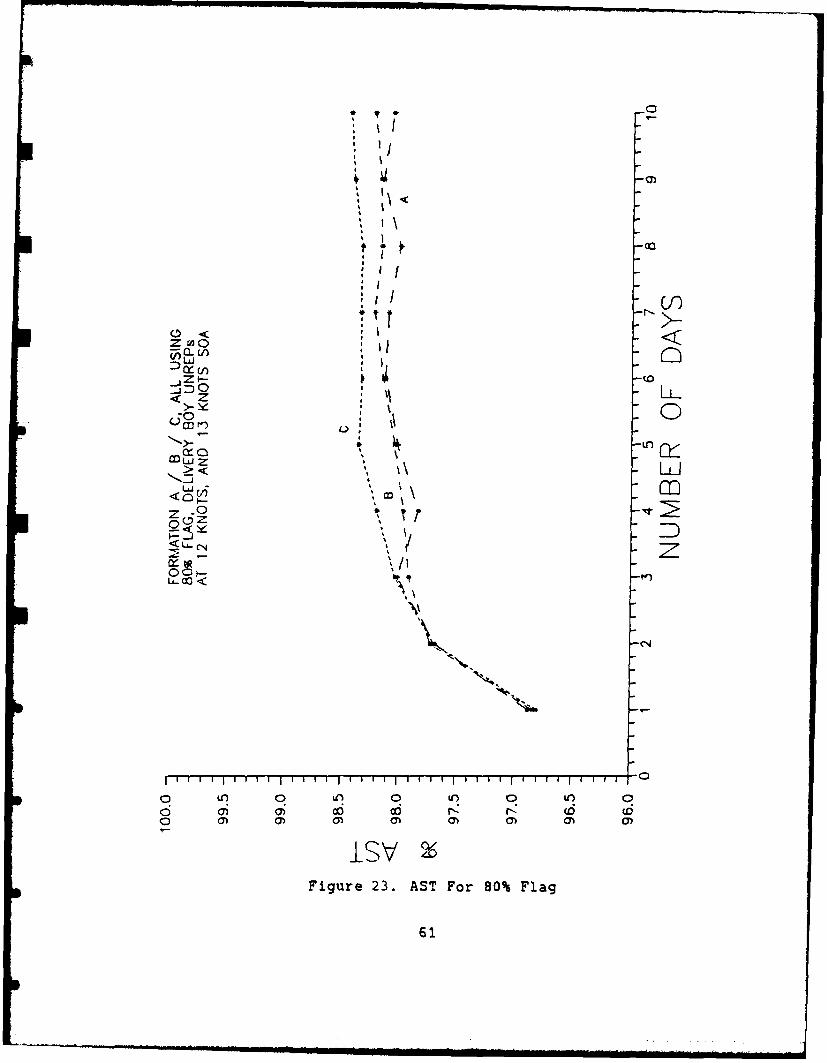
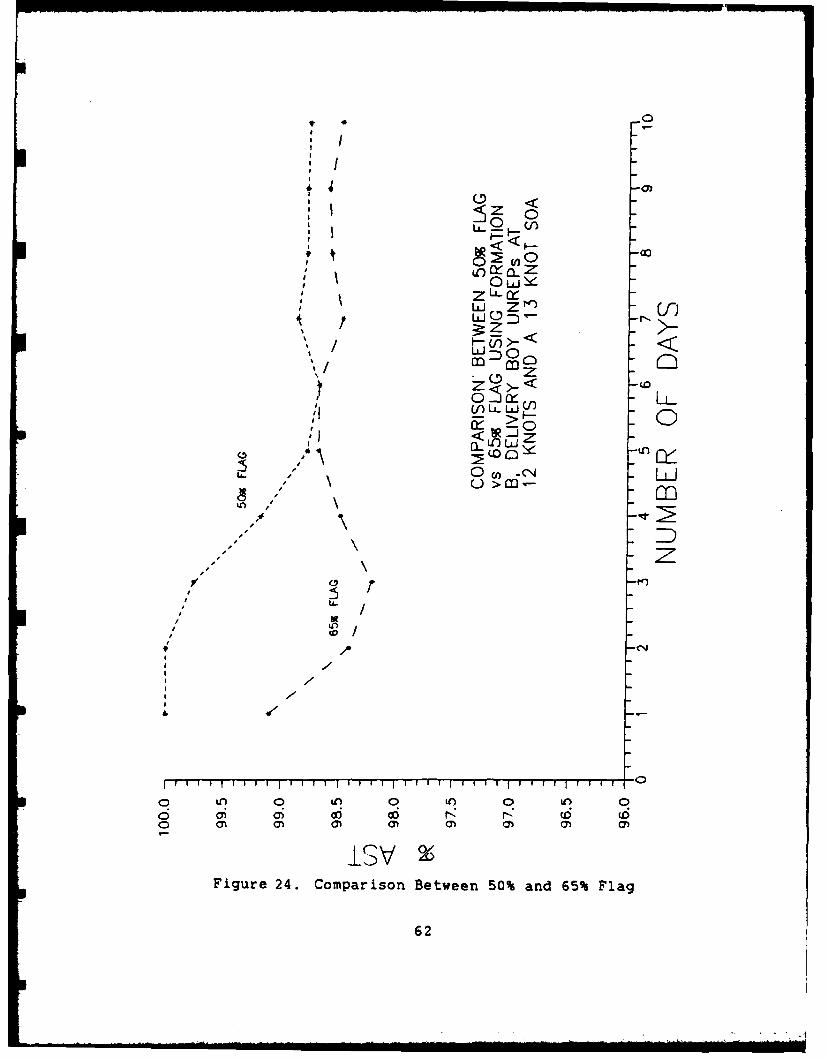
Figures 21, 22, and 23 plot, using a flag level set at
50, 65, and 80 percent respectively, AST vs duration of the
simulation run. Figure 24 compares AST using formation B
with flag levels set at 50 and 65 percent.
58
........-- - -
a_ I
?< Z
ze0at (no-CI
/
10
c i c6 v l z a0i
0
a ~ ><
iur 21 AS o 5%Fa
590
m~ /n
_JII!
0< Cl0
=/ x
( .4
LO UII
.0 0
S I /<
S I
Ifn
C, < I
z
rn.z
Z- > .0 4 -Ln
00
LL- Z w<. '/Z
S i 0 iW) 06 o6 06t
iSVFigure 23. AST For 80% Flag
61
0 jIf-
44 ,
LUt Z
0 L.L0
0- 0
H D--.
F- z</,.
61 U
T I I I I I
0 LOl 0 tn 0 atO 0 to 0M 6 0 o - (6 (6
Figure 24. Comparison Between 50%s and 65% Flag
62
LIST OF REFERENCES
1. Captain R. B. Wellborn, "Battle Group Logistics--TheMultiplier", Unpublished paper, NAVELEXCEN, Charleston,S.C., p. ii, February 1988.
2. Blum, J. L., Issues and Options for the Navy's CombatLogistics Force, Congress of the United States, Congres-sional Budget Office, p. ix, April 1988.
3. Commander Surface Warfare Development Group, COMSURFWAR-DEVGRU TACMEMO 600-1-80, Underway Replenishment DecisionMaking Aid, p. 1, June 1980.
4. Commander Second Fleet, TACMEMO-ZZ 0010-1- 85, BattleForce/Group Logistics Coordinator, p. I-1, January 1985.
5. The Johns Hopkins University Applied Physics Laboratory,Report NWA-87-039, Battle Force Operation ReplenishmentModel--BFORM Functional Description and User's Manual,Hereford, L. G., and Spiegel, R. F., March 1988.
6. Presearch Incorporated, Report No. 648, F. P. Amend andP. A. Ansoff, UNREP-88 Study--CPAM-86 UPDATE, 10 February1984.
63
INITIAL DISTRIBUTION LIST
1. Defense Technical Information Center 2Cameron StationAlexandria, VA 22314
2. Defense Logistics Studies Information Exchange 2U.S. Army Logistics Management CenterFort Lee, VA 23801
3. Library, Code 0142 2Naval Postgraduate SchoolMonterey, CA 93943-5002
4. Deputy Chief of Naval Operations (Logistics) (OP-04) 1Washington, DC 20350
5. Deputy Chief of Naval Operations (OP-375D)ATTN: CAPT S. P. DuermeyerWashington, DC 20350
6. Deputy Chief of Naval Operations (OP-814) 1ATTN: LCDR A. C. MoserWashington, DC 20350
7. Applied Physics Laboratory IATTN: Lance G. HerefordJohn Hopkins RoadLaurel, MD 20707
8. CAPT Wayne P. Hughes, Jr., USN (Ret.), Code 55H1 1Department of Operations ResearchNaval Postgraduate SchoolMonterey, CA 93943
9. CDR Mark L. Mitchell, Code 55Mi IDepartment of Operations ResearchNaval Postgraduate SchoolMonterey, CA 93943
10. LT Steven L. Barnaby 3Department Head School Class 106Surface Warfare Officers School CommandNewport, RI 02481
64