Embed Size (px)
Citation preview

Municipality of Busuanga
ECAN Resource Management Plan
2017-2022
Prepared by
College of Human Ecology1 – Department of Community and
Environmental Resource Planning
University of the Philippines, Los Baños
In partnership with
Municipal Government of Busuanga,
Municipal ECAN Board,
and Palawan Council for Sustainable Development
1 Bautista, Maria Althea; Malolos, Grace Anne; Magyaya, Ariana; Palevino, Mhaolene Leana; and Suarez, Miguel
Alfonso

Page | i
Municipality of Busuanga
ECAN Resource Management Plan
2017-2022
Prepared by
College of Human Ecology1 – Department of Community and
Environmental Resource Planning
University of the Philippines, Los Baños
In partnership with
Municipal Government of Busuanga,
Municipal ECAN Board,
and Palawan Council for Sustainable Development
1 Bautista, Maria Althea; Malolos, Grace Anne; Magyaya, Arianne; Palevino, Mhaolene Leana; Suarez,
Miguel Alfonso

Page | ii
EXECUTIVE SUMMARY
Upon the enactment of the Strategic Environmental Plan (SEP) for Palawan Act,
Environmentally Critical Areas Network (ECAN), “a graded system of protection and
development control over the whole of Palawan”, had served as “framework of municipal
planning” in the province of Palawan; accordingly, SEP law mandates (1) the creation of
an Ecological Zoning Plan (EZP) which shall serve as “general physical plan of every
city/municipality” (Section 30) and (2) the “integration/ harmonization” of the EZP with
the Municipal Comprehensive Land and Water Use Plans (MCLWUPs). In lieu of this
endeavour, ECAN Resource Management Plan (ERMP), basis of “long- term sustainable
management of the municipally- adopted Environmentally Critical Areas Network (ECAN)
Zones”, of one of the municipalities of the province was formulated. Busuanga, a
municipality located at the northernmost part of Palawan, occupying one- third of the
Calamianes Group of Islands, and home to 14 barangays, was chosen as planning site.
In developing the ERMP of the municipality, ecological profiling, integrated threats
analysis, and ECAN planning workshop were conducted. Through these measures, context
of the planning environment were identified, guide to resource management planning was
provided, and a participatory planning process was facilitated. In the conduct of eco-
profiling, primary and secondary data were used; in terms of Integrated Threats Analysis,
(1) Key Informant Interviews, (2) Stocktaking, (3) Participatory Resource Mapping, and
(4) DPSIR Matrix had served as data gathering and data analysis tools; while in ECAN
planning workshop, planning matrices for each ECAN Zones were made- these were
supplemented with information generated from ecological profiling and Integrated Threats
Analysis.
Through ecological profiling of the municipality, existing resources, opportunities
and challenges among five development sectors, environmental, social, economic,
institutional, and infrastructural, were identified and interpreted. Results generated from
the ecological profile of the municipality are as follows; (1) the environment being
distinguished of its relatively dominant brush land area, mountainous and rough
topography, high number of invertebrate species, high endemnicity, vast mangrove cover,
high coral reef cover, high composition of seagrass cover, low number of target reef fishes,
and coastal species, dugong and sea turtle, with high conservation values; (2) the social
sector attributed with 3.856% growth rate, younger population composition, 1.33 % of
dependency ratio, 97.78% literacy rate, 91.84% employment, 69.9% share of community
involved in agriculture, 87% poverty threshold, lacking number of health and police
personnel, high number of recreation and tourism areas; (3) the economic sector comprising
rice, corn, sweet potato, mango, and banana crop production, growing fishing industry of
mariculture, and livelihood opportunities in buho and sawali craft and furniture making;
(4) the infrastructural sector which prioritizes the improvement of barangay roads and
communal water sources, and lastly; (5) the institutional sector which focuses on
development initiatives aimed at capacitating employees, maximizing economic benefits,
Page | iii
and increasing revenue collection, and allocates budget for the development of tourism
sector, improvement of irrigation, domestic water supply, and barangay roads.
Meanwhile, in the conduct of integrated threats analysis across different ECAN
Zones in the Municipality, resources, pressures and existing initiatives (responses)
addressing the latter were identified. Information collected through KII, Stocktaking, and
Participatory Resource Mapping were condensed and presented in the DPSIR Matrix to
understand the nature and current status of these threats. The DPSIR matrix analysis had
emphasized the following concerns:
Drivers and problems existing among municipally-adopted ECAN Zones;
Wildlife poaching, unsustainable agricultural and forest practices (Kaingin farming),
timber poaching, harvesting of Corals, conflicting knowledge regarding MPA, need for
food livelihood, raw materials (for road construction and housing), education, access to
tourism, delivery of services (farm to market), source of water for irrigation, income,
preservation of caves, preservation of IP culture, lobbying of tribal land ownership, need
for funding in CADT
ECAN map validation is found necessary given some spatially located
activities have become inconsistent with current ECAN Zone designation.
Lastly, an ECAN planning workshop was conducted with key representatives of the
LGU for prioritizing and validating of the problems (threats) acknowledged and devising
of respective plans and programs across the different zones in the municipality. In general,
plans and programs proposed (strategies) which shall address these threats include
provision of alternative livelihood support, IEC campaign establishment of
organizations/capacity building, strengthening the implementation of laws, preservation
and conservation, strengthen implementation of laws, monitoring and surveillance, proper
communication, reviewing and updating of plans and requirements for permits,
prioritization and request of sustainable funding, and infrastructure development.
Upon the formulation of ERMP, the practicum team had given the following
recommendations;
PCSD:
- establish a PCSD office in Municipality of Busuanga
- continue conducting Information, Education, and Communication (IEC)
Campaigns regarding ECAN Zones and its processes and execute it at the
barangay level
- integrate ECAN Zoning into the academic sector from elementary to tertiary level
to their curriculum
- include tribal/ ancestral zone and Marine Protected Areas (MPA) in ECAN Map
- add Forest Protected Area for Dugong Protected Management Zone
- marking of core zones
- update the existing ECAN Map of the Municipality of Busuanga and to re-
evaluate the current criteria of the zones
Page | iv
- establish a PCSD office in Municipality of Busuanga
ECANization process:
- including representatives from each barangays of the Municipality in the target
stakeholders for the Key Informant Interview such as barangay captains and
councilors
- include PRM or even re-mapping of the ECAN Zones in the process.
Academe:
- to provide technical assistance, through manpower, to the municipality in
updating their CLUP
- partnering with developmental projects by non-government organizations such as
C3.
LGU and Community Leaders:
- establish Municipal Environment and Natural Resources Office (MENRO)
- establish monitoring team for the protection of the environment specifically for
Marine Protected Areas and for the Sea Cows (Dugong)
- integrate ECAN Zoning, ECAN Zones Management Plan and even Ancestral
Domain Sustainable Development and Protection Plan (ADSDPP) to
Comprehensive Land Use and Water Plan (CLWUP), Local Development Plans
(LDP) such as the Annual Investment Plan (AIP) and Comprehensive
Development Plan (CDP),
- stricter implementations of existing plans and laws
- draft resolutions addressed to PCSD and ECAN Board for updating of ECAN
Zones in the municipality
- GPS/GIS training to be administered by MPDO, MAO and MENRO
- coordinate with the DENR in the utilization of idle lands such as the BPR
- strong and active participation and relationship of their LGU with different NGOs
such as the Community Centered Conservation (C3)
- promote local resources (e.g. Handicraft making from Nipa and Bamboo)
- promote Dugong Conservation (e.g. Keychain making)
- engage the private sector specifically resort and beach owners in monitoring
compliance of the business community to ECAN Zoning and spearheading
rehabilitation of degraded ecosystems within their area of concern

Page | v
Acknowledgement
The success of the practicum team in crafting the ECAN Resource Management
Plan of the Municipality of Busuanga and the memorable stay of the group while in the
municipality was made possible by a lot of persons. The team wanted to extend our
appreciation with their contribution and involvement;
Palawan Council for Sustainable Development (PCSD), who have given us the
chance to render assistance to ECAN Resource Management Planning of the Municipality
of Busuanga, thank you! We are grateful of you guiding us and allowing ourselves to be in
the actual work field.
Sir Mark dela Cruz, thank you for all your effort and support to the team! We are
blessed for all the preparations you did for the practicum team’s stay in Barangay Salvacion
and assistance to each step in the formulation of ERMP.
Department of Environment and Resource Planning (DCERP), thank you for
helping us perform the responsibilities asked from us and for consistently motivating the
team as we accomplish these tasks.
Mr Ricardo Sandalo, thank you for being our practicum over- all coordinator. Your
persistence in guiding and motivating the practicum teams will always be remembered.
Ma’am Sandy Samantela, thank you for being our supervisor! We are blessed to
have you. Thank you for always encouraging us to do our best.
MPDC Marlo Dagomboy, thank you for assisting the practicum team in the conduct
of ERMP. Thank you for opening the MPDO for the team to be able to print their outputs.
Heads and staff of different offices of the Municipality, we thank you for
entertaining our inquiries and assisting the team in gathering data needed.
Barangay heads and representatives, thank you for your active participation and
commitment! We appreciate your effort and involvement in the conduct of resource
mapping activity and ECAN resource management planning.
C3, the NGO who guided the team during their activities in the Municipality, thank
you. We will always remember all the places you’ve shown us and all the lessons you’ve
taught us.
De Jesus family, who have been very accommodating to the practicum team, thank
you. Thank you for making us feel at home. We will always treasure the bonding with the
kids: Thirdy, Lorraine, Shia, Bonyx, and Ivan.
Ate Leth thank you for being our second mother. Thank you for your kindness to
the practicum team. The sumptuous meriendas you served usand the kuwentuhan we had
will always be treasured. We will always remember the mami, longsilog, embutido, and
toasted garlic you have prepared for us.
Kuya Daniel, we thank you for being our resident driver. Thank you for the patience
during our trips. Thank you for showing us around and making us appreciate the beauty of
Busuanga.

Page | vi
Our family and friends, thank you! If not of your love and support, the team have
not been motivated to do our best while in the practicum.
Most especially God, our Lord and Savior, thank you for your guidance and
blessings to the practicum team. We are gratified to experience the beauty of your creation
and the love we had from our new found friends. We also thank you for supporting us all
throughout our field work and for making such endeavor a successful one!
Page | vii
List of Acronyms
A&D Alienable and Disposable
BHS Barangay Health Station
BPR Busuanga Pasture Reserve
BUB Bottom- Up- Budgeting
C3 Community Centered Conservation
CBFM Community Based Forest Management
CBMS Community Based Monitoring System
CSO Civic Society Organization
CENRO City Environment and Natural Resources Office
DENR Department of Environment of Natural Resources
DILG Department of Interior and Local Government
DOT Department of Tourism
DOH Department of Health
DPSIR Driver, Pressure, State, Impact and Response
DRRM Disaster Risk Reduction and Management
DRRMF Disaster Risk Reduction Management Fund
ECAN Environmentally Critical Areas Network
ERMP ECAN Resource Management Plan
FLUP Forest Land Use Plan
GF General Fund
IEC Information, Education and Campaign
ILO International Labour Organization
IRA Internal Revenue Allotment
IRR Internal Rate of Return
KII Key Informant Interview
LGU Local Government Unit
LDRRMF Local Disaster Risk Reduction Management Fund
LPRAT Local Poverty Reduction Action Team
MAO Municipal Agricultural Office
MDRRMO Municipal Disaster Risk Management Office
MENRO Municipal Environment and Natural Resources Office
MPA Marine Protected Area
MSWD Municipal Social Welfare Development Office
MTOO Municipal Tourism Operations Office
NGAs Non- Government Agencies
NGO Non-government Organization
PCSD Palawan Council for Sustainable Development
PCSDS Palawan Council for Sustainable Development Staff
PINSP Police Inspector
PO People’s Organization
PRM Participatory Resource Mapping
PSA Philippine Statistics Authority
QRF Quick Response Fund
RPT Real Property Tax
SEP Strategic Environmental Plan
SEF Special Education Fund
SFR Special Purpose Fund
UPLB University of the Philippines Los Baños

Page | viii
Table of Contents EXECUTIVE SUMMARY ......................................................................................................... ii
Acknowledgement ....................................................................................................................... v
List of Acronyms ....................................................................................................................... vii
List of Tables ................................................................................................................................. x
List of Figures ............................................................................................................................ xii
CHAPTER 1: INTRODUCTION .............................................................................................. 1
A. Significance of SEP and ECAN ...................................................................................... 1
B. Ecological Zoning Plan (EZP) and ECAN Resource Management Plan (ERMP) ........ 1
C. Legal Bases of the EZP.................................................................................................... 2
CHAPTER 2: MUNICIPAL ECOLOGICAL PROFILE ....................................................... 6
A. History .............................................................................................................................. 6
B. Development Sectors ....................................................................................................... 9
1. Geophysical/ Environment Sector ................................................................................. 9
2. Social and Population ................................................................................................ 39
3. Economic .................................................................................................................... 51
4. Infrastructure ............................................................................................................... 60
5. Institutional .................................................................................................................. 64
6. Transect Mapping ..................................................................................................... 81
A. Ecological Profiling ....................................................................................................... 86
B. Participatory Resource Mapping ................................................................................. 86
C. Driver, Pressure, State, Impact, Response (DPSIR) Framework Analysis .............. 86
D. Participatory ECAN Planning Workshop ................................................................... 87
CHAPTER 4: THE ECAN ZONING STATEGY .................................................................. 87
A. Components of the ECAN Zones ................................................................................. 88
B. Criteria and Parameters in the Delineation of the ECAN Zones .............................. 88
C. Allowable Activities in the ECAN Zones ........................................................................ 92
CHAPTER 5: PARTICIPATORY RESOURCE MAPPING ............................................... 95
A. Terrestrial Core Zone ................................................................................................. 101
B. Terrestrial Resticted Use Zone ................................................................................... 101
C. Terrestrial Controlled Zone ................................................................................... 102
D. Terrestrial Traditional Use Zone ........................................................................... 102
A. Terrestrial Multiple Use Zone .................................................................................... 102
F. Coastal Multiple Use Zone ...................................................................................... 102
G. Coastal Core Zone ................................................................................................... 103
H. ECAN Zone Issues ................................................................................................... 104

Page | ix
CHAPTER 6: Driver-Pressure-State-Impact-Response (DPSIR) Analysis ....................... 106
A. DPSIR Matrices ........................................................................................................... 107
CHAPTER 7: ECAN ZONES MANAGEMENT PLAN ..................................................... 122
A. ECAN Zones of Busuanga, Palawan .......................................................................... 122
B. ECAN Zones Management Guidelines ...................................................................... 125
C. ECAN Zones Management Program Formulation .................................................. 130
D. Busanga ECAN Management Program .................................................................... 130
Outcome 1: Municipal natural resources sustainably managed ................................. 131
Output 2: Municipal socio-economic status improved ................................................. 133
Output 3: Environmental governance and partnerships enhanced ............................ 134
CHAPTER 8: ADMINISTRATION OF THE ECAN ZONING PLAN ............................. 150
ANNEXES ................................................................................................................................ 153
ANNEX A: LIST OF KEY INFORMANTS ......................................................................... 153
ANNEX B: KEY INFORMANT INTERVIEW QUESTIONNAIRE ECAN ................ 154
ANNEX C: QUESTIONNAIRE FOR STOCKTAKING OF MUNICIPAL
ENVIRONMENTAL INITIATIVES (for ECAN Zones Management Planning) ......... 158
ANNEX D: RESOURCE AND ECAN OVERLAY RESOURCE MAPS OF THE
BARANGAYS IN MUNICIPALITY OF BUSUANGA ................................................... 161
ANNEX E: OUTPUT OF THE PARTICIPATORY ECAN PLANNING WORKSHOP190
REFERENCES ........................................................................................................................ 204
Page | x
List of Tables
Table 1. Sections of PCSD Resolution No. 05-250 which serve as basis in the
formulation of EZP ........................................................................................................... 3
Table 2. List of Barangays and Land Area of Busuanga Municipality. ......................... 11
Table 3. List of Small Island and Islets of Busuanga Municipality ............................... 11
Table 4. Busuanga Municipality Land Cover Classification as of 2006 ........................ 18
Table 5. Busuanga Municipality Sea Cover Classification as of 2006 .......................... 20
Table 6. Percentage of Land Cover of the Barangays in Busuanga, Palawan .............. 21
Table 7. Percentage of Coastal Cover of the Barangays in Municipality of Busuanga . 22
Table 8. Total Forest Cover per barangay of the Municipality of Busuanga, 2006 ....... 25
Table 9. Total percentage of Mangrove Cover per barangay in the Municipality of
Busuanga ......................................................................................................................... 30
Table 10. True and Common Names of Mangrove Species present in the .................... 31
Table 11. Vulnerability to Hazards and Number of Families at Risk per Barangay...... 33
Table 12. Number of Evacuation Centers and Capacity per Barangay in the ................ 34
Table 13. Municipal Breakdown of ECAN Zones ......................................................... 37
Table 14. Actual Number of Population and Estimated Population of Busuanga
Municipality. ................................................................................................................... 39
Table 15. Actual and Projected Population Density of Busuanga Municipality ............ 40
Table 16. Tenural Status by Households in Busuanga, Palawan ................................... 41
Table 17. Computed Dependency Ratio of Busuanga Municipality .............................. 42
Table 18. Distribution and Ratio to Population of Health Personnel ............................. 43
Table 19. Ten Leading Causes of Mortality ................................................................... 43
Table 20. Ten Leading Causes of Morbidity.................................................................. 44
Table 21 Malnourishment Levels of Preschool Children by Percent and Total Weights44
Table 22. Literacy Rate of Municipality of Busuanga per Barangay. ............................ 46
Table 23. Attending Elementary School and Participation Rate .................................... 46
Table 24. Attending Elementary School and Participation Rate .................................... 47
Table 25. Type of Housing Units present in Busuanga, Palawan .................................. 48
Table 26. Sources of Drinking Water............................................................................. 48
Table 27. Types of Garbage Present in Busuanga, Palawan .......................................... 49
Table 28. Employment Rate of Busuanga, Palawan ...................................................... 49
Table 29. Tourist Destinations in the Municipality of Busuanga .................................. 50
Table 30. Recorded Types and Number of Crime in Busuanga, Palawan ..................... 51
Table 31. A table showing the total land area and total agricultural area ...................... 52
Table 32. Rice production per barangay of the municipality of Busuanga, Palawan .... 52
Table 33. Corn production in the municipality for the year 2011. ................................. 53
Table 34. Production and top producers of mango, banana, and coconut in the
municipality for 2011. ..................................................................................................... 54
Table 35. A table showing the vegetable production of the municipality in 2011 ........ 54
Table 36. A table showing the cassava production of the municipality in 2011............ 54
Table 37. List of the registered farmer associations in the municipality of Busuanga .. 55
Table 38. Chicken populations in the top three barangays with the highest produce in
2012................................................................................................................................. 56
Page | xi
Table 39. Distribution of carabao, cattle, swine, horse, and goat populations in the
different barangays in 2012. ........................................................................................... 57
Table 40. Fish production in the municipal waters of Busuanga, Palawan. .................. 58
Table 41. List of registered fisherfolk associations in the Municipality of Palawan. .... 58
Table 42. Inventory of Roads in Busuanga .................................................................... 60
Table 43. Inventory of National Bridges by Classification, Location, Length and Type of
Construction in Busuanga, Palawan ............................................................................... 62
Table 44. Statement of Condensed Cash Flows for the Year Ended December 31, 2015.
......................................................................................................................................... 68
Table 45. Statement of financial performance (General Fund) of the municipality for the
year 2015 (ending from December 31, 2015) ................................................................. 70
Table 46. Special Education Fund as of last Quarter of 2015 ........................................ 70
Table 47. Trust Fund Utilization on government projects, programs or activities;
consolidated report for the 4th Quarter of 2015.............................................................. 71
Table 48. Barangay 20% Development Fund Utilization Report as of the 4th Quarter of
2015 (categorized according to program or provisioning of services). .......................... 73
Table 49. List of Bottom-Up-Budgeting projects approved by LPRAT for the year 2015.
......................................................................................................................................... 77
Table 50. Tally of the number of resolutions/ ordinances passed or enacted in the recent
term of the municipality’s legislative body; categorized according to sector. ............... 78
Table 51. List of Local Government Unit (LGU) officials and ..................................... 78
Table 52. Criteria for delineation of land resources into the different zones. ................ 89
Table 53 Delineation of water resources into the different zones. ................................. 91
Table 54. Allowable Activities in the Terrestrial and Coastal ECAN Zones ................ 93
Table 55. ECAN Matrix showing the resources, opportunities and threats in each of the
zones present in the municipality .................................................................................. 100
Table 56. Identified issues in the ECAN Zones raised in the Participatory Resource
Mapping ........................................................................................................................ 104
Table 57. DPSIR Matrix of Core Zone (Terrestrial) .................................................... 107
Table 58. DPSIR Matrix of Core Zone (Coastal)........................................................ 109
Table 59. DPSIR Matrix of Buffer Zone (Restricted) .................................................. 110
Table 60. DPSIR Matrix of Buffer Zone (Controlled) ................................................. 111
Table 61. DPSIR Matrix of Buffer Zone (Traditional) ................................................ 113
Table 62. DPSIR Matrix of Multiple Use Zone ........................................................... 115
Table 63. DPSIR Matrix of Tribal Zone ...................................................................... 119
Table 64. Component/ Strategy Per ECAN Zone ........................................................ 137
Table 65. Estimated Budget Requirements for ECAN Zoning Implementation and
Related Environmental Management Programs (2017 – 2022) in Thousand Pesos (‘000)
....................................................................................................................................... 141
Table 66. Implementing Organizations and Key Roles ............................................... 144
Table 67. Action Planning Matrix ................................................................................ 190
Table 68. Strategies in addressing the threats to sustainable development .................. 199
Page | xii
List of Figures
Figure 1. Municipal ECAN Zoning Plan harmonized with the C/M CLUP, and integrated
with the ECAN Zoning Plan that shall be utilized in the formulation of PPFP ............... 3
Figure 2. Political Boundary Map of the Municipality of Busuanga ............................. 10
Figure 3. Slope Classes of the Municipality of Busuanga ............................................. 13
Figure 4. Slope Map of the Municipality of Busuanga .................................................. 14
Figure 5. Land Classification Map of the Municipality of Busuanga ............................ 17
Figure 6. Land Cover Map of the Municipality of Busuanga ........................................ 19
Figure 7. Land Use Map of the Municipality of Busuanga ........................................... 24
Figure 8. River Map of the Municipality of Busuanga .................................................. 28
Figure 9. ECAN Map of Busuanga ................................................................................ 36
Figure 10. Busuanga Resource Map showing areas with CADT .................................. 38
Figure 11. Age-Sex Distribution of the Municipality of Busuanga based on 2010 Census
......................................................................................................................................... 42
Figure 12. Road Network Map of Busuanga Municipality ............................................ 61
Figure 13. Organizational Structure of the Municipality of Busuanga ......................... 64
Figure 14. Transect Map of Barangay Bogtong, Busuanga, Palawan ........................... 83
Figure 15. Methodological Framework of Participatory Resource Mapping ................ 95
Figure 16. Resource Map of Busuanga Municipality ..................................................... 97
Figure 17. Busuanga ECAN Resource Overlay Map of Busuanga Municipality .......... 98
Figure 18. Sample Barangay showing the ECAN Overlay Resource Map with threats and
opportunities ................................................................................................................... 99
Figure 19. DPSIR Assessment Framework.................................................................. 106
Figure 20. Logical Framework of Busuanga ECAN Management Program ............... 131
Figure 21. Resource Map of Barangay Bogtong.......................................................... 161
Figure 22. ECAN Overlay Resource Map of Barangay Bogtong ................................ 162
Figure 23. Resource Map of Barangay Buluang .......................................................... 163
Figure 24. ECAN Overlay Resource Map of Barangay Buluang ................................ 164
Figure 25. Resource Map of Calauit Island ................................................................. 165
Figure 26. ECAN Overlay Resource Map of Calauit Island ........................................ 166
Figure 27. Resource Map of Barangay Cheey ............................................................. 167
Figure 28. ECAN Overlay Resource Map of Barangay Cheey ................................... 168
Figure 29. Resource Map of Barangay Concepcion .................................................... 169
Figure 30. ECAN Overlay Resource Map of Barangay Concepcion .......................... 170
Figure 31. Resource Map of Barangay Maglalambay ................................................. 171
Figure 32. ECAN Overlay Resource Map of Barangay Maglalambay ........................ 172
Figure 33. Resource Map of Barangay New Busuanga ............................................... 173
Figure 34. ECAN Overlay Resource Map of Barangay Maglalambay ........................ 174
Figure 35. Resource Map of Barangay Old Busuanga................................................. 175
Figure 36. ECAN Overlay Resource Map of Barangay Old Busuanga ....................... 176
Figure 37 Resource Map of Barangay Panlaitan ......................................................... 177
Figure 38. ECAN Overlay Resource Map of Barangay Panlaitan ............................... 178
Figure 39. Resource Map of Barangay Quezon ........................................................... 179
Figure 40. ECAN Overlay Resource Map of Barangay Quezon ................................. 180
Figure 41. Resource Map of Barangay Sagrada .......................................................... 181
Page | xiii
Figure 42. ECAN Overlay Resource Map of Barangay Sagrada ................................. 182
Figure 43. Resource Map of Barangay Salvacion....................................................... 183
Figure 44. ECAN Overlay Resource Map of Barangay Salvacion .............................. 184
Figure 45. Resource Map of Barangay San Isidro ....................................................... 184
Figure 46. ECAN Overlay Resource Map of Barangay San Isidro ............................ 185
Figure 47. Resource Map of Barangay San Rafael ...................................................... 186
Figure 48. ECAN Overlay Resource Map of Barangay San Rafael ............................ 187
Figure 49. Resource Map of Barangay Sto. Nino ........................................................ 188
Figure 50. ECAN Overlay Resource Map of Barangay Sto. Nino .............................. 189
Page | 1
CHAPTER 1: INTRODUCTION
A. Significance of SEP and ECAN
Palawan, though endowed with natural assets, and high number of conservation
areas, is considered as a vulnerable island ecosystem. Given this predicament, the
implementation of Strategic Environmental Plan (SEP Law) for Palawan Act responds to a
timely pursuit of achieving sustainable development in the province. Republic Act No.
7611 or SEP, a “landmark environmental legislation” made effective in 1992, functions as
comprehensive framework guiding the sustainable development approaches of the
province; plans, programs, and projects being formulated and implemented by the local
government of the province and government agencies are mandated to follow the
provisions of this law (Section 4, R.A. 7611 (1992)). It also institutionalizes the
establishment of Environmentally Critical Areas Network (ECAN) as its main strategy. In
particular, ECAN serves as “a graded system of protection and development control over
the whole of Palawan”; it encompasses tribal lands, forest, mines, agricultural areas, small
island mangroves, coral reefs, seagrass beds and the surrounding sea of the province
(Section 7, R.A. 7611 (1992)). Moreover, as stated in Section 7 of the SEP Law, the
following are expected to be satisfied upon the implementation of this core strategy;
(1) Forest conservation and protection through the imposition of total commercial
logging ban in all areas of maximum protection and in such other residential use
zones as the Palawan Council For Sustainable Development (PCSD) as hereinafter
created may provide;
(2) Protection of Watersheds;
(3) Preservation of biological diversity;
(4) Protection of tribal people and the preservation of their culture;
(5) Maintenance of maximum sustainable yield;
(6) Protection of the rare and endangered species and their habitat;
(7) Provision of areas for environmental and ecological research, education, and
training; and
(8) Provision of areas for tourist and recreation.
B. Ecological Zoning Plan (EZP) and ECAN Resource Management Plan
(ERMP)
Meanwhile, in implementing the SEP law, ecological zoning was adopted.
Specifically, Section 30 of PCSD Resolution No. 05- 250 specifies the use of “Ecological
Zoning Plan” (EZP) as the general physical plan of the municipality; more than the
adoption of SEP and its core strategy, EZP creates basis for other planning activities
including land use planning, tourism master planning and resource management planning.
As a management tool, it is expected to serve as “framework for planning” and an
“instrument” for the regulation and control of the use of resources in the Palawan. (Pacific
Consultants International, 2006). Furthermore, since EZP as a whole is a “joint
responsibility” of LGUs and the Council Staff (the administrative body of the SEP Law),
Page | 2
Section 31 of the law orders that this plan has to be crafted and “harmonized” with
Comprehensive Land and Water Use Plans (CLWUPs) of Local Government Units
(LGUs).
It is also noted that EZP shall serve as basis of “long- term sustainable management
of the municipally- adopted Environmentally Critical Areas Network (ECAN) Zones”
(PCSD Manual of Operations, n.d.). Particularly, the ECAN plan devised and proposed by
the technical working group is divided into four parts namely ecological profiling,
participatory resource mapping, DPSIR analysis, and participatory ECAN planning
workshop. This plan shall serve for resource management planning of the Municipality of
Busuanga, Palawan.
C. Legal Bases of the EZP
Given that the whole province is subject to the SEP Law, plans, programs, and
projects of the province has to be coherent and reflective of the SEP Law. Besides the
inclusion of SEP to the Regional Development Plan of Region IV- A (Section 6, R.A. 7611
(1992)), PCSD, the administrative body of the SEP Law, is also given power and function
to “coordinate with local governments to ensure that the latter’s plans, programs and
projects are aligned with the plans, programs, and policies of the SEP” (Section 19, R.A.
7611 (1992)). Shown below is the figure illustrating the hierarchy of linkages and plans
inclusive of the integration of EZP at the municipal and provincial level.

Page | 3
P ECAN Plan
C/M ECAN Plan
Figure 1. Municipal ECAN Zoning Plan harmonized with the C/M CLUP, and integrated with the
ECAN Zoning Plan that shall be utilized in the formulation of PPFP
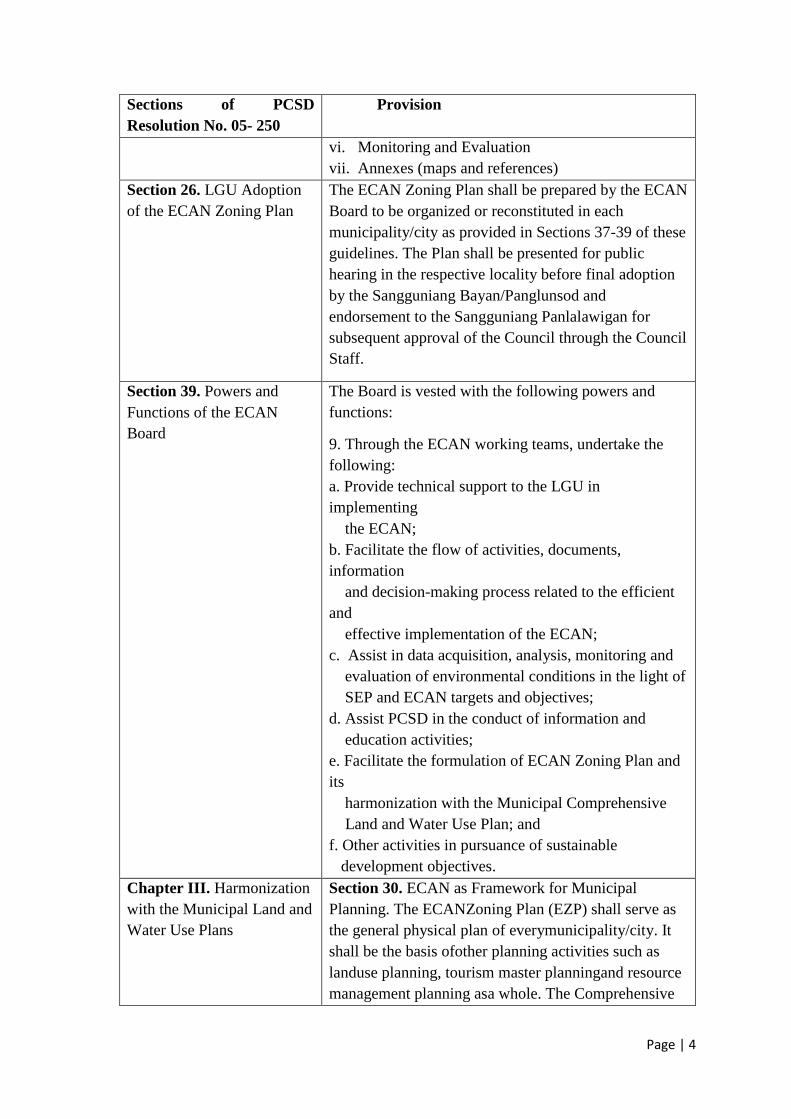
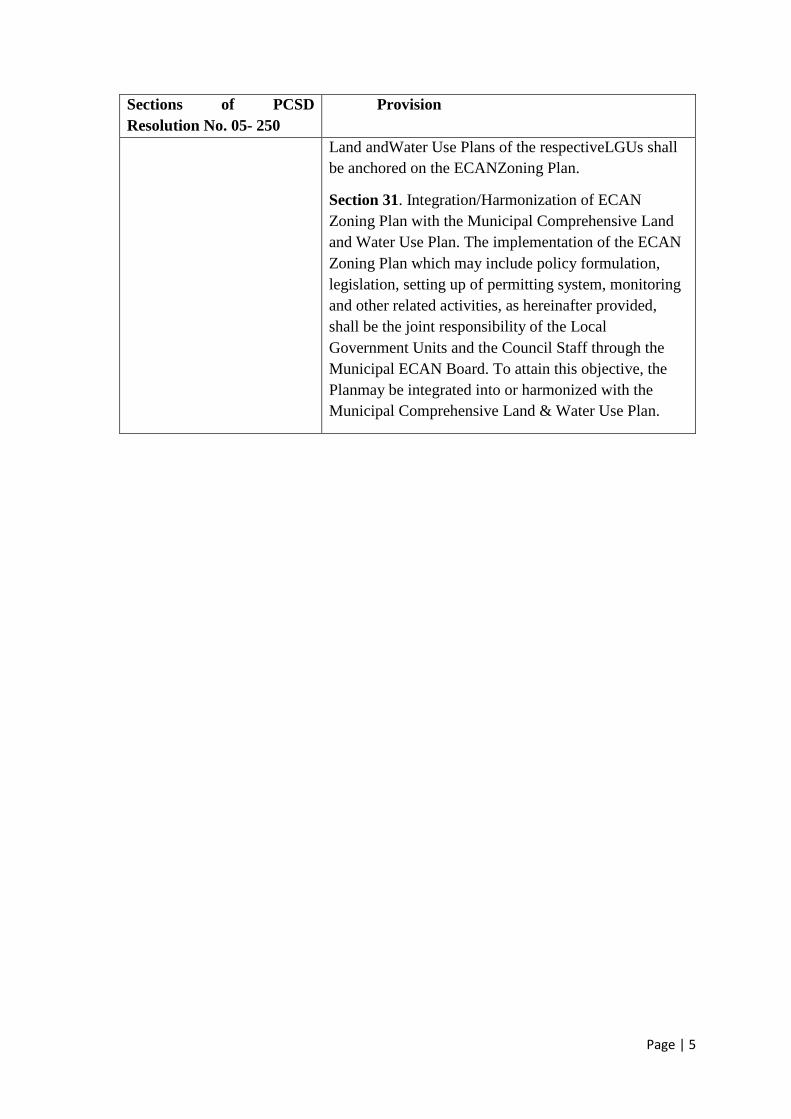
Other bases in the formulation of ECAN Zoning Plan (EZP) are shown in the table
below. These include sections of PCSD Resolution No. 05-250 which serve as guide in the
EZP.
Table 1. Sections of PCSD Resolution No. 05-250 which serve as basis in the formulation of EZP
Sections of PCSD
Resolution No. 05- 250
Provision
Section 25. Preparation of
the ECAN Zoning Plan
The ECAN Board of the LGU with the assistance of
PCSD shall formulate the ECAN Zoning plan (EZP)
after the approval of an ECAN Map. With careful
consideration of factors relevant in planning, the EZP
includes the following;
i. Description of the Area
ii. Goals/Objectives
iii. Zoning Strategy (priorities, methodologies for
marking zone boundaries)
iv. Zone Management (activities, regulatory measures
policy directions)
v. Administration
Page | 4
Sections of PCSD
Resolution No. 05- 250
Provision
vi. Monitoring and Evaluation
vii. Annexes (maps and references)
Section 26. LGU Adoption
of the ECAN Zoning Plan
The ECAN Zoning Plan shall be prepared by the ECAN
Board to be organized or reconstituted in each
municipality/city as provided in Sections 37-39 of these
guidelines. The Plan shall be presented for public
hearing in the respective locality before final adoption
by the Sangguniang Bayan/Panglunsod and
endorsement to the Sangguniang Panlalawigan for
subsequent approval of the Council through the Council
Staff.
Section 39. Powers and
Functions of the ECAN
Board
The Board is vested with the following powers and
functions:
9. Through the ECAN working teams, undertake the
following:
a. Provide technical support to the LGU in
implementing
the ECAN;
b. Facilitate the flow of activities, documents,
information
and decision-making process related to the efficient
and
effective implementation of the ECAN;
c. Assist in data acquisition, analysis, monitoring and
evaluation of environmental conditions in the light of
SEP and ECAN targets and objectives;
d. Assist PCSD in the conduct of information and
education activities;
e. Facilitate the formulation of ECAN Zoning Plan and
its
harmonization with the Municipal Comprehensive
Land and Water Use Plan; and
f. Other activities in pursuance of sustainable
development objectives.
Chapter III. Harmonization
with the Municipal Land and
Water Use Plans
Section 30. ECAN as Framework for Municipal
Planning. The ECANZoning Plan (EZP) shall serve as
the general physical plan of everymunicipality/city. It
shall be the basis ofother planning activities such as
landuse planning, tourism master planningand resource
management planning asa whole. The Comprehensive
Page | 5
Sections of PCSD
Resolution No. 05- 250
Provision
Land andWater Use Plans of the respectiveLGUs shall
be anchored on the ECANZoning Plan.
Section 31. Integration/Harmonization of ECAN
Zoning Plan with the Municipal Comprehensive Land
and Water Use Plan. The implementation of the ECAN
Zoning Plan which may include policy formulation,
legislation, setting up of permitting system, monitoring
and other related activities, as hereinafter provided,
shall be the joint responsibility of the Local
Government Units and the Council Staff through the
Municipal ECAN Board. To attain this objective, the
Planmay be integrated into or harmonized with the
Municipal Comprehensive Land & Water Use Plan.

Page | 6
CHAPTER 2: MUNICIPAL ECOLOGICAL PROFILE
A. History
1. Legend
According to the legend, a small river with a narrow and picturesque bank had
become source of livelihood of men living in Busuanga. Every day, settlers make good
spoils of nature and these have been enough for them. However, one day, a violent storm
made a rampage on the whole island and for five to fourteen days, submerged the place
with heavy rains and strong winds that swept the island. It is believed that this legend was
a real justification of the natural calamitous event occurred that caused the small rivers and
creeks in the island to branch out and unite their flow to one great stream which is now
known as the Busuanga River. Busuanga, from the vernacular word meaning “burst” in
English, is the popular rendition of this event.
2. Formation of Busuanga
Even before the establishment of Busuanga as a municipality in 1951, it had already
acquired “Busuanga” as its name. The actual name was derived from a huge river with an
average width of 100m- it is actually the largest among the rivers in the area. It was believed
that the natives of the municipality named it as such and was then passed on through the
word of mouth.
Spanish Regime: 1600-1898
In 1622, the colonization of Palawan under Count San Augustine reached the island
of Busuanga. A number of Augustinian-Recollect missionaries landed in the eastern coast
of the mainland, converted the inhabitants to Christianity and built church for them together
with the establishment of the Spanish local government in the barrio, known then as
Busuanga the oldest barrio in the municipality.
Later, in 1636, in lieu of defending the barrio from raids (almost occurring every
perennial) and onslaught of Muslim rebels, the Spaniards began fortification with small
muzzle-loading artilleries; more than these constructions, the establishment of a strong
naval station at Puerto Princepe Alfonso, now Balabac, together with the forts of Cuyo,
Taytay, Labao, etc. combined with the powerful Spanish fleets cruising the seas, Muslim
attacks were eventually put to an end. However, in 1898, the intrusion of more democratic
Americans to the island as lobbied by the Treaty of Peace between the United States and
Spain have caused an end to the epidotic Spanish rule.
The American Regime dating back 1901-1914
During the American Military Government ruling in 1904 under Governor Wright,
the whole island of Culion was made into a government reservation. Providing a colony for
lepers and a vast government farm, the island’s jurisdiction and control were eventually
served from the Municipality of Coron.On June 2nd of the same year, some former
inhabitants of Culion were resettled to a place southeastern of the mainland and founded
Page | 7
Concepcion, known then as “Kinamotean”, from the word camote, a root crop growing
abundantly in the place.
Meanwhile, sometime between 1906 and 1911, with Governor Edmund Miller in
office, a number of school buildings were erected in some of the barrios (Salvacion,
Concepcion, Calauit, etc.).
Other important events include the establishment of New Bususanga and discovery
of mining deposits in the island. The founding of New Busuanga, formerly called
“Kanyepet”, is significant. If not of its most controversial creation, a part of which would
still play in the last phase of Busuanga history. Given official recognition by Mayor
Restituto Bacnan in 1937, mainly for religious commitments to the members of the
Evangelical Church, the barrio was directed another official order in that time for its
dissolution. On the other hand, about the year 1938, four or five years before the Second
World War, manganese mine deposits were uncovered in the island. Because of mining,
national road was constructed from Coron to the northern barrios passing through Bintuan
to Concepcion.
World War II through the Liberation: 1941-1949
In 1942, a nondescript barrio in Coron, Busuanga entered the era of war. Because
manganese mines are good sources of precious metals for ammunitions, Japanese men have
occupied Coron, Busuanga. Provoked and with no alternatives, the Busuangenos formed
the Resistance Movement, foremost of which was the daring Bolo Battalion under Ignacio
Libarra.
Meanwhile, in the latter part of the same year, the spreading havoc and massacre
have led to enemies already enjoying their plunder. During these times, members of the
Resistance Movement burned down the semi-permanent school buildings in Busuanga,
Salvacion, Cheey and Calauit, which they fear would be good headquarters for the
Japanese.
On September 24, 1944, however, US bomber planes raided, and several Japanese
ships, among the big tankers, were bombed and sunked off at the Concepcion coast. The
sea became so thick laden with oil from the tankers that it burned furiously and spread out
to nearby mangroves; a bright sea-inferno was created for several days and nights. Whereas
on April 1945, two Japanese Officers coming from the manganese mines were killed in an
ambush. Moreover, within the same month three more enemy soldiers lost their lives in the
hands of the gallant Bolo Battalion. These foreshadowed the doom of Japanese invaders
and signaled the end of war.
Immediately after the war, the US Government built and caused the establishment
of Long Range (LORAN) Transmitting Station on the western coast of Panlaitan. The
Station was manned and maintained by US Coast Guards until 1970. While peacefully
reigning in the island, schools were re-opened and children were sent to school.
Accordingly, the US government gave aids and full support for rehabilitation of the people
from their low economic state.
Thus, Busuanga came out of the ashes of war still recouping. Though wavering
from the moral and economic depression which it suffered in war, it was forced to emerge
into a full-pledge independent municipality.

Page | 8
Foundation: the ABORDO Bill
1950 had been the year of birth of Busuanga as a full pledged municipality. With
13 daughter barrios already settled and populated, it only waited for its promulgation into
an independent municipality.
It was Governor Gaudencio Abordo, then Congressman of Palawan and foremost
of the earliest Palaweño Statesman, who authored and trigged the realization of the
municipality in the session of Congress in 1950. Bill no. 381, sought for the creation of
Busuanga, including all the barrios in its realm, into a municipality. Both houses of
Congress approved the bill without much restraint, and its final approval by the President
of the Philippines was eventually contained and sealed in the Republic of Act No. 560.
On the other hand, New Busuanga, the controverter, once-dissolved barrio founded
by the members of the Evangelical Church, became politically the favored site for the
municipality.
Further, on December 30, 1951, with a temporary “wood and nipa” structure for a
municipal building, Mayor Adriana Custodio, the first town mayor, ruled the first few
months of its founding years up to December 1952.
The Municipal Site Controversy
It was Tiburcio Barracoso, a southerner, of a prominent clan from Salvacion, who
ascended the mayorship by rights and virtue of popular election. His first bold act of
moving the municipal site to Salvacion created the first wave of “locality conflict” between
the southerners and the northerners. Accordingly when a northerner, Antonio Capague,
won the next election in 1955, the municipal site was moved again from Salvacion back to
New Busuanga.
The succeeding mayors however did not cause further migration of the municipal
site since the political tide and atmosphere in the higher level favored New Busuanga; and
there the municipality remained until 1974.
Relocation of the Municipal Site: The MITRA Bill
Concerning the tenure of the late Mayor Antero Hachero from 1968-1971, the
former representative of Palawan, Ramon V. Mitra, Jr. had fought for another bill in the
session of Congress; this time it provided for the proper relocation and immediate transfer
of the municipal site, from New Busuanga to Salvacion.
The bill was approved for various justifiable and sound reasons. Among the many
considerations, it had been a factor that Salvacion possessed a relatively more suitable and
strategic location geographically and more economically developed community. Salvacion
was eyed as the most suited political center for public service and strategic seat of the
municipal government.
For some nebulous reasons, however, the bill had a hard and jolty time getting its
way into the local government. Due to an admixture of conflicting personal and political
interest and motives waged from all directions at once, the bill remained unexecuted in the
local administration concerned.
Page | 9
Consequently, the barrio council of Salvacion filed a case of “Mandamus” with
some municipal councilors against the involved municipal officials. But while serving in
the middle of his tenure, the incumbent mayor, Antero Hachero, died, and the mandamus
case hung like the sword of Damocles upon the would-be successor. Eventually, when
Laureano Custodio won in the 1972 local election, the same fell hair to the mandamus.
This time it was the municipal council who sought the power of the court (CFI) to
issue an order for the execution of the municipality’s transfer to Salvacion against the
indifference of the officials concerned. A little “cold war” almost sprung to the surface
between the people of Salvacion and New Busuanga.
The Final Seat of the Municipal Government
On September 2, 1974 with men acting as pacifier and mediator, between the people
of New Busuanga and Salvacion, the municipality was finally transferred and laid to its
ultimate site. The historic transfer of the municipal site was characterized by clashing
sentiments and convictions by the people and their leaders, both from personal and political
motives and interest that made no little significance to the history of Busuanga.
B. Development Sectors
1. Geophysical/ Environment Sector
1.1.Geographical Location
At the northernmost part of the Province of Palawan, Calamianes group of island is
found. This is composed of five islands namely: Busuanga, Calauit, Coron, Culion and
Linapacan as it corresponds to four major municipalities which are Busuanga, Coron,
Culion and Linapacan. The Municipality of Busuanga is the largest island as it covers 1/3
of Busuanga Island and about 3.8% of Palawan’s total land area. Based from the
Comprehensive Land Use Plan (CLUP 2001-2009) of the municipality, the total land area
of the municipality is 52, 748 hectares while according to DENR –CENRO, the total land
area was 53, 051 ha. It is bounded by Mindoro strait on the north, municipality of Coron
on the east, South China Sea on the west and Culion Island on the south. Majority (59%)
of the land area of the Muncipality of Busuanga is comprised of the Calauit Game Preserve
and Wildlife Sanctuary (3,323ha) and the Yulo King Ranch (YKR) (28. 380ha).
1.2.Administrative Boundary
The Municipality of Busuanga is composed of 14 barangays namely: Bogtong,
Buluang, Cheey, Concepcion, Maglalambay, New Busuanga, Old Busuanga, Panlaitan,
Quezon, Salvacion, San Isidro, San Rafael, Sagrada and Sto. Niño. As shown in Figure 2,
San Isidro, Panlaitan, Maglalambay are island barangays. Meanwhile, as shown in Table 2,
Barangay Cheey has the largest area as it comprises about 32% of total land area of the
municipality. It is followed by Sto. Niño with 11%. Busuanga has also a high number of
Islets which mostly are home for the Indigenous People (Tagbanuas) in the municipality.
Table 3 shows the list of island islets in Busuanga, Palawan.

Page | 10
Figure 2. Political Boundary Map of the Municipality of Busuanga

Page | 11
Table 2. List of Barangays and Land Area of Busuanga Municipality.
Barangay Land Area (ha) Percentage of Total Land Area
Bogtong 2,966.84 5.59
Buluang 1,395.84 3.64
Calauit 3,323.59 6.26
Cheey 17,229.63 32.47
Concepcion 1,282,99 2.41
Maglalambay 437.18 0.82
New Busuanga 3,236.45 6.10
New Quezon 1,599.98 3.01
Old Busuanga 2,860.31 5.39
Panlaitan 227.47 0.42
Sagrada 3,722.36 7.01
Salvacion 2,890.09 5.61
San Isidro 448.81 0.84
San Rafael 2,323.83 4.38
Sto. Nino 5995.80 11.30
Other island 1,519. 94 2.86
Total 53, 051.63 100.00 Source: DENR-CENRO, 2016
Table 3. List of Small Island and Islets of Busuanga Municipality
Small Island and Islets Land Area (ha) Percentage of Total Land
Area
Calumboyan Island ND -
Denicolan Island ND -
Diboyayan Island 14.59 0.96
Dicoyan Island 67.89 4.49
Dimipac Island 118.15 7.82
Elet Island 1.40 0.092
Horse Island 47.28 3.12
Kalampisauan Island 15/27 1.01
Lajo Island 283.75 18.78
Malajon Island 77.80 5.15
Malcatop Island 66.04 4.37
Mangueguey Island 10.61 0.70
Manolaba Island 15.48 1.02
Manobeleng Island 30.13 1.99
Napula Island 23.84 1. 57
North Malbinchilao 43.96 2.91
Northwest Rock 1.20 0.07
Pamanlican Island 7.51 0.49
Pass Island 11.82 0.78
Rat Island 1 37.35 2.47
Rat Island 2 107.37 7.10
Salvacion Island 26. 03 1.72
South Cay Island 10.74 0.71 South Malbinchilao Island 13.90 0.92

Page | 12
Small Island and Islets Land Area (ha) Percentage of Total Land
Area
Tanabon Island 12.61 0.83
Tantangon Island 66.61 4.40
West Nalaut Island 57.66 3.81
Other Islands (no names) 289.29 19.15
Total 1,510.64 100.00 Source: ECAN Zones Management Framework and Guidelines for Busuanga Municipality, 2006
1.3. Topography
Elevation
The municipality’s western and central portions are predominantly rough and
mountainous with rolling to hilly terrain. A part of this is the Chinabayan Mountain and
Wayan Range that still support extensive parches of Molave forest and Cogon grassland
(features which are dominant in the locale). Chinabayan, also called Sinibayan, is
approximately near to Sinibayan River and the waterfalls found in Barangay New
Busuanga. Chinabayan traverses along Barangay San Rafael and Barangay Sagrada where
forest cover is much more extensive. Meanwhile, the hilly portions of the mountain range
is covered by lowland beach and limestone forest while those that are confined to the sides
of hills following the municipality’s streams and river have thicker forest covers. The
central hills have low elevation (less than 700 meters above sea level) while some have an
elevation reaching more than 500 meters. Also, on the western portion are numerous islets
while on the northern tip is the Calauit Island.
The Salvacion Mountain Range located in Salvacion, the Sinabuyan Mountain
Range between New Busuanga and Cheey, and the Naapac Moutain Range in San Rafael
are among the major mountain ranges of the municipality.
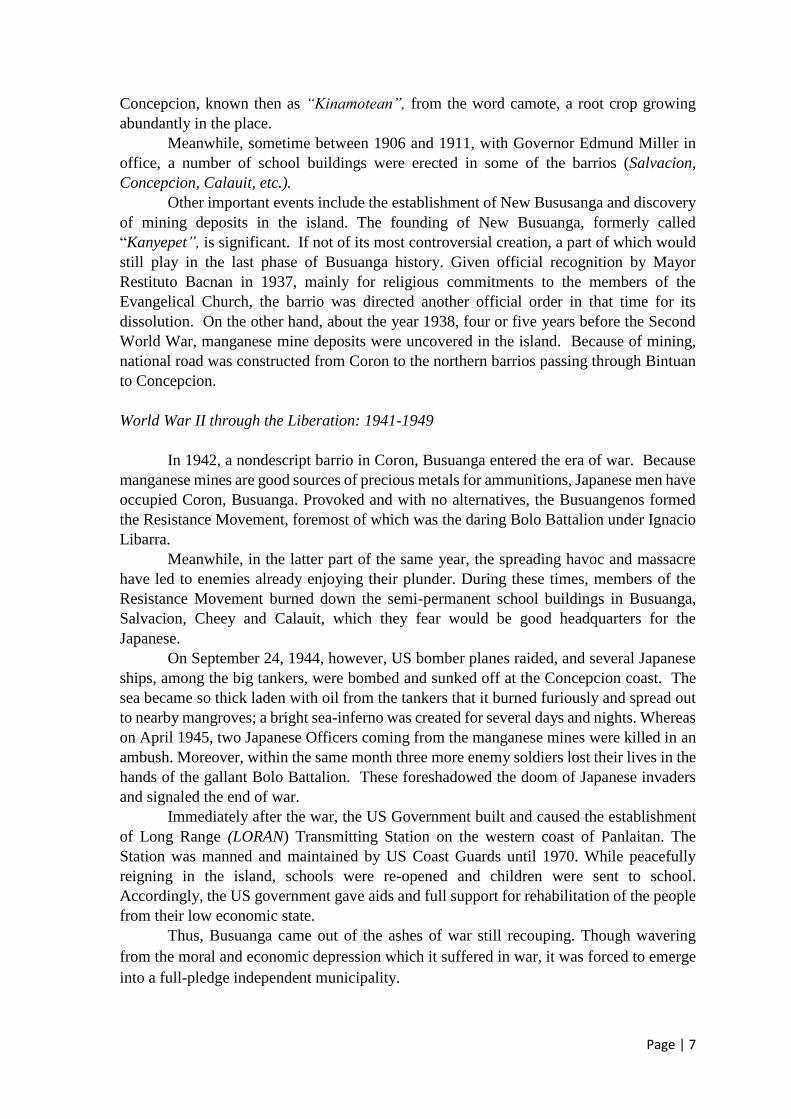
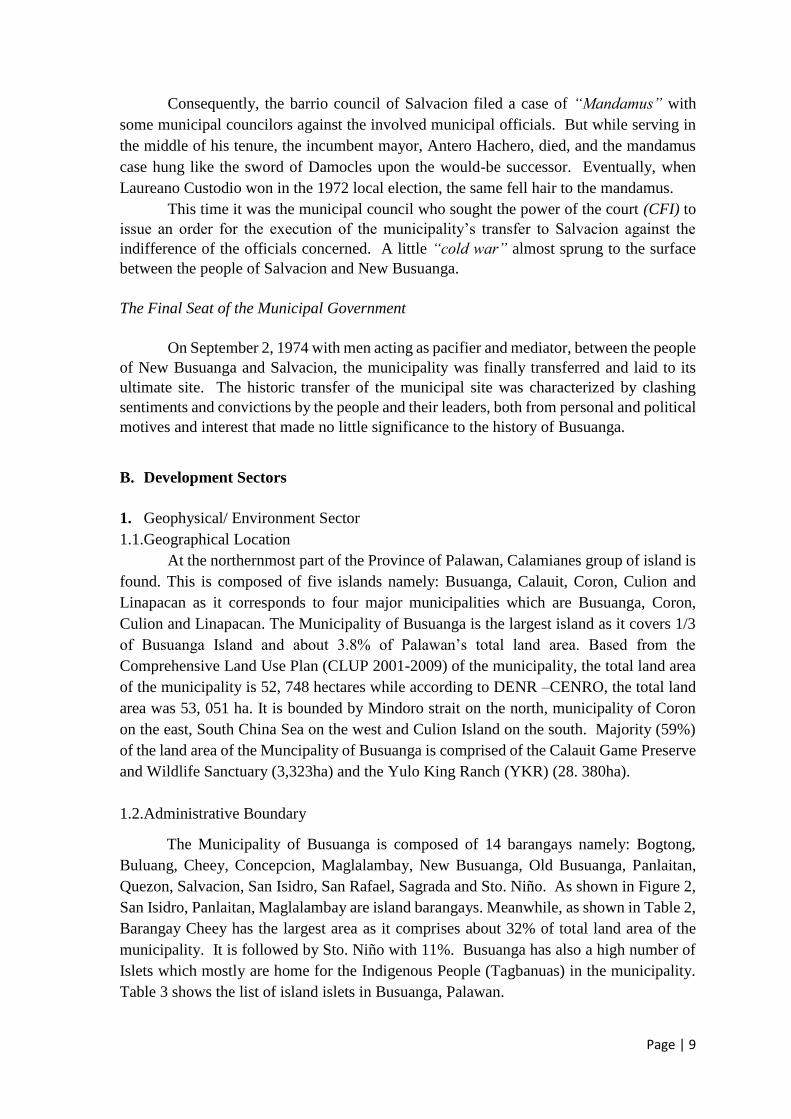
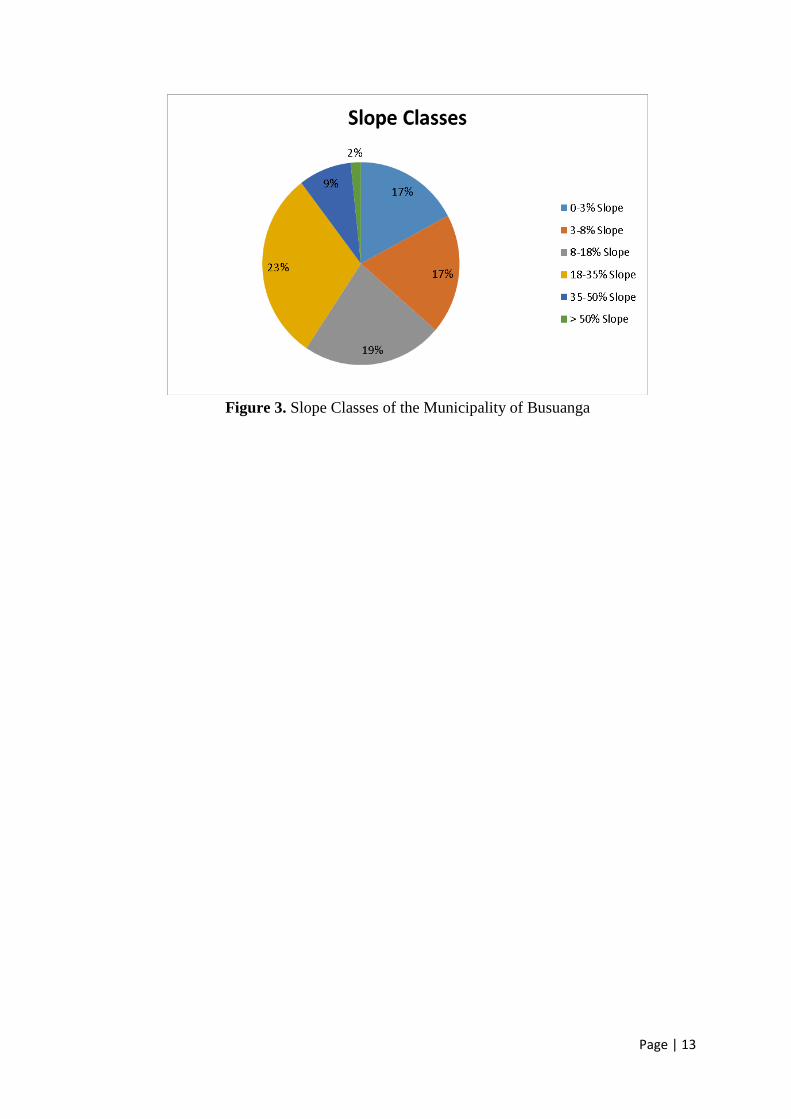
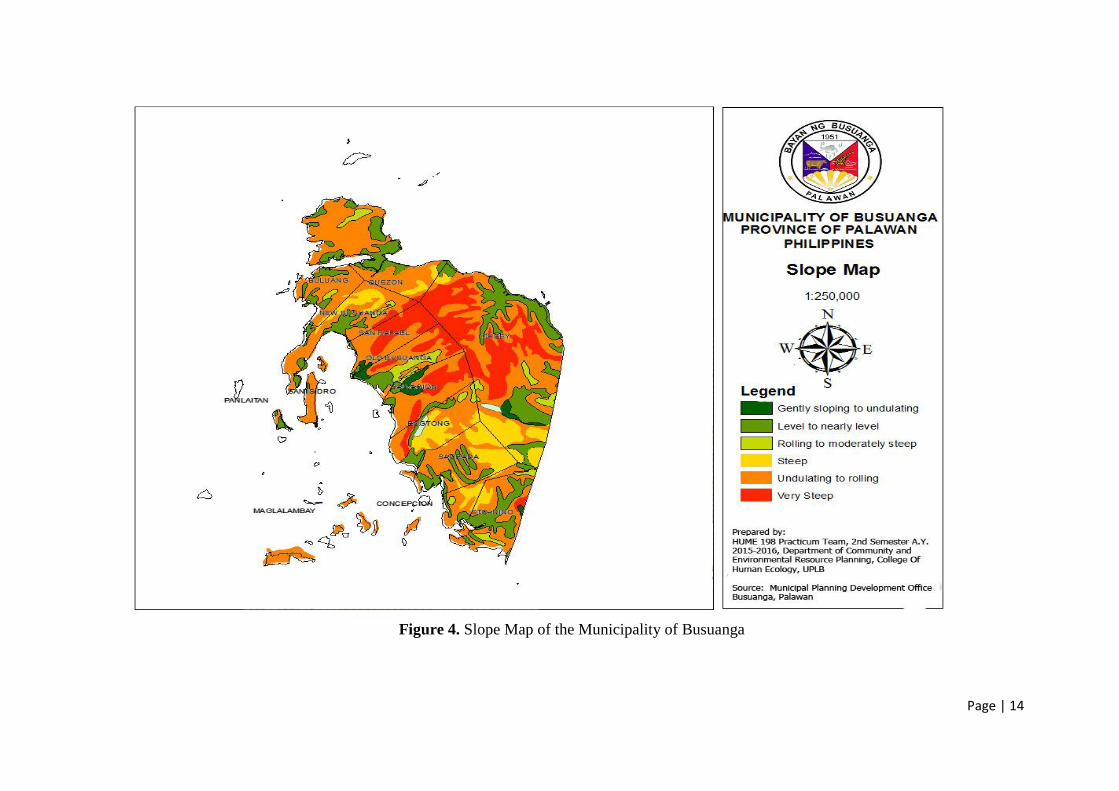
Slope
Due to the mountainous features of the municipality, most of the areas have high
variations of slope composition. Areas more than 50% slope comprise 2% of the
municipality; about 32% represent those areas with more than 18% slope but lesser than
50% slope; while 59% are areas with less than 18% slope. The relatively flat areas are
generally devoted to rice and tree plantations. Areas with slope that ranges from 0-3% can
be used for agricultural and urban development while those slope classes with 3-18% can
be allocated for human settlement expansion.
Page | 13
Figure 3. Slope Classes of the Municipality of Busuanga
Page | 14
Figure 4. Slope Map of the Municipality of Busuanga

Page | 15
1.4. Geology
The whole Busuanga Island belongs to the non-volcanic micro-continental
fragment of the northern Palawan group of islands which includes all areas on- and offshore
north of the Ulugan Bay Fault. Based on geophysical observations, these groups of islands
are believed to be part of the southeastern continental shelf of mainland China before the
Tertiary period (Mid-Oligocene) (particularly during the beginning of the sea-floor
spreading of the South China Sea).
As stated in the Flora Survey and Biodiversity Assessment for Core Zoning Report
by the PCSD in 2006, the geology of Busuanga consists of several formations. These
include King Ranch Formation, Liminangcong Formation, Quarternary Alluvium and
Malajon Limestone. The Liminangcong Formation which is distinguished of its bedded
chert is dominant in the municipality while the Quarternary Alluvium which consists of
unconsolidated floodplain deposits accumulated at the foot of the hills can be found in the
low – lying coastal areas and along the river channels of most of the barangays in Busuanga.
On the other hand, Malajon Limestone, typified by creamy to dark gray massive coralline,
marbleized limestone, is commonly found in Elet and Kalapisauan Islands located
northwest of the municipality.
Most of the land formations are karst limestone having silicon dioxide as its major
elements. Limestone distribution over the municipality, however, can only be observed in
few areas such as Barangay Buluang.
1.5. Soils
The soil classification and fertility of lands in the municipality is affected by
climate, rainfall, and its varying elevation. There are six major types of soil in Busuanga
namely: Rough Mountainous Land, Coron Clay Loam, San Miguel Clay Loam, Aborlan
Clay Loam, Busuanga Loam and Hydrosol. Sub-surface textures of these soils can be
classified as either loam to clay loam and sandy clay; these fall under the medium to fine-
textures soils.
The types of soil in the municipality vary on its geographical location. According
to the report of the Office of the Provincial Agriculturist, those soils located in the plains,
valleys and plateaus are made up of silt clay loam while those soils located in the area
where it is gently sloping to slightly steep are composed of sandy clay to sandy clay loam.
For coastal plains on the southern part of the municipality, the major type of soil is hydrosol
while in some valley areas, there is rich Busuanga loam. Of these types of soil, silt clay
loam soil, given its properties, makes it suitable for the community to plant their crops and
grow their vegetables.
1.6. Climate
Busuanga has two distinct climate types. It is dry from December to May and rainy
from June to November; the warmest months are March, April, and May while the coldest
are December, January, and February. It has an average yearly rainfall measurement of
2,873.9 mm.
Page | 16
Meanwhile, though Palawan as a whole is outside the typhoon belt, the northern
portion where Busuanga is located experiences persistent gales and torrential rains
especially during the months of July to August.
1.7. Surface Water
Busuanga has 3 mineral springs . It has several river systems as well. The major
ones are as follows:
Busuanga River in Old Busuanga
Binalayan River in Cheey
Dipuyal River in Sto. Niño
Lele River in New Busuanga
Malabnas River in San Rafael
Ditapec River in Calauit
Kiwit River in Sagrada
1.8. Land Resources
Land classification
Figure 5 shows the land classification map of the Municipality of Busuanga in 2006
(in accordance with SEMP- ECAN Zoning Project). It can be seen that majority of the land
is classified as alienable and disposable; dominance of this land classification is primarily
because secondary brushland/ shrub lands are abundant in the area.
On the other side, there are different sources of information indicating the
composition of various land classification of the municipality. Department of Environment
and Natural Resource- CENRO have identified the total municipal land area of Busuanga
with 32, 144 hectares (71.3%) classified as alienable and disposable (A&D) land and 12,
950 hectares (28.7%) of forest land; SEMP-ECAN Zoning Project which formulated a
NAMRIA-land classification map, however, revealed that the A&D land is only about 48%.
On the other hand; while CLUP showed the allocation of municipal land uses with 46%
devoted to brushland and grassland, 39% to forest, 8% for agriculture, and 1% for built-up
areas or only about 392 hectares of the total land area.

Page | 17
Figure 5. Land Classification Map of the Municipality of Busuanga
Page | 18
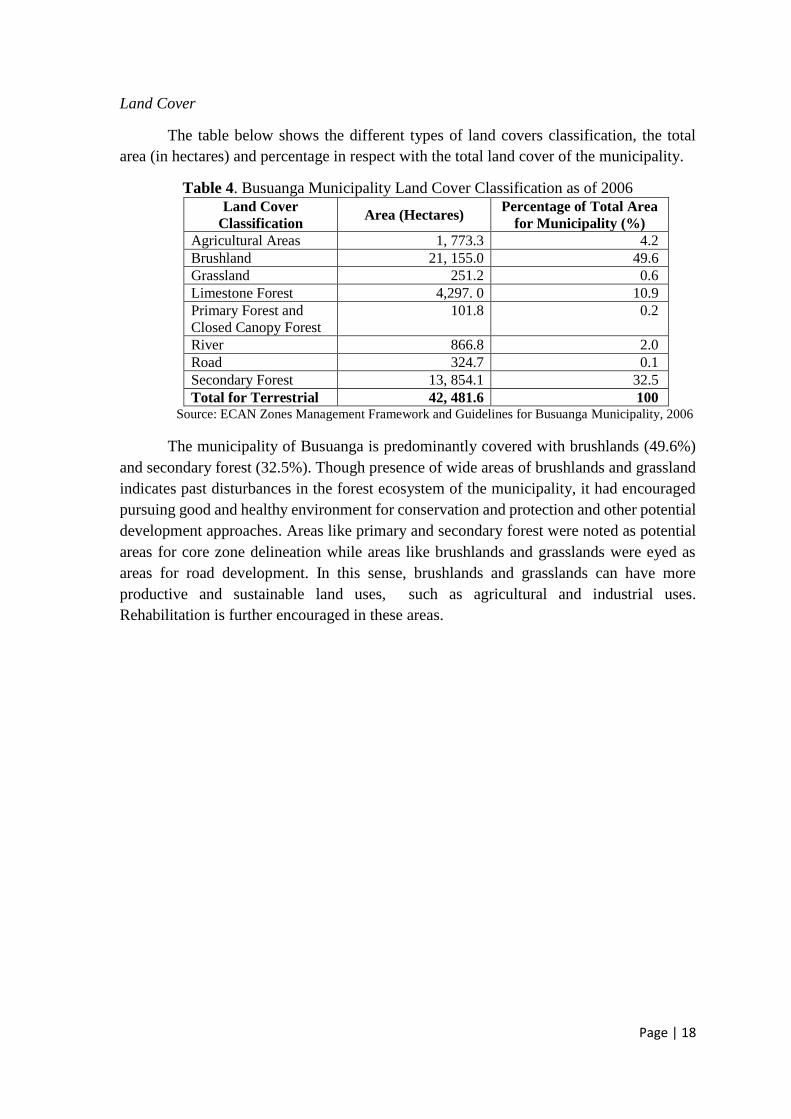
Land Cover
The table below shows the different types of land covers classification, the total
area (in hectares) and percentage in respect with the total land cover of the municipality.
Table 4. Busuanga Municipality Land Cover Classification as of 2006
Land Cover
Classification Area (Hectares)
Percentage of Total Area
for Municipality (%)
Agricultural Areas 1, 773.3 4.2
Brushland 21, 155.0 49.6
Grassland 251.2 0.6
Limestone Forest 4,297. 0 10.9
Primary Forest and
Closed Canopy Forest
101.8 0.2
River 866.8 2.0
Road 324.7 0.1
Secondary Forest 13, 854.1 32.5
Total for Terrestrial 42, 481.6 100 Source: ECAN Zones Management Framework and Guidelines for Busuanga Municipality, 2006
The municipality of Busuanga is predominantly covered with brushlands (49.6%)
and secondary forest (32.5%). Though presence of wide areas of brushlands and grassland
indicates past disturbances in the forest ecosystem of the municipality, it had encouraged
pursuing good and healthy environment for conservation and protection and other potential
development approaches. Areas like primary and secondary forest were noted as potential
areas for core zone delineation while areas like brushlands and grasslands were eyed as
areas for road development. In this sense, brushlands and grasslands can have more
productive and sustainable land uses, such as agricultural and industrial uses.
Rehabilitation is further encouraged in these areas.

Page | 19
Figure 6. Land Cover Map of the Municipality of Busuanga

Page | 20
Sea Cover
Table 5 shows the sea cover classification of Busuanga, Palawan as of 2006. The
municipality is surrounded by water body (94.9%), making it a good source of livelihood
for the community. Also this can be home for rich biodiversity of marine species such as
corals, dugongs and sea turtles which can be utilized for ecotourism development. Most of
the barangays also have their mangrove cover. Mangroves are home to terrestrial and
marine species and serves a natural barrier to storms, storm surges and other related
disasters.
Table 5. Busuanga Municipality Sea Cover Classification as of 2006
Coastal and Marine
Classification
Area
(Hectares)
Percentage of Total Area
for Municipality (%)
Mangrove Forest
(secondary)
2, 048.4 4.2
Dense Corals 62. 1 0.2
Sand/Rock 235.1 0.5
Sparse Seagrass 21.0 0.04
Dense Seagrass 151.0 0.3
Water body 46,530.0 94.9
Total 49, 047.6 100.0
Source: ECAN Zones Management Framework and Guidelines for
Busuanga Municipality, 2006
On the State of the Environment of Palawan, most of the coral reefs in 2004 in the province
including Busuanga Municipality, are classified as fair to poor condition. While the
seagrass with excellent cover has deteriorate from 2.6% in 2004 to 0.8% in 2014.
Consequently, those sited with poor cover has increased from 31.8% in 2004 to 68.7% in
2014.

Page | 21
Table 6. Percentage of Land Cover of the Barangays in Busuanga, Palawan
Barangay Agricultural
Areas
Brushland Built-up
areas
Grassland Limestone
Forest
Primary
Forest
River Roads Secondary
Forest
TOTAL
Bogtong 1.90 47.00 0.2 2.6 - 7.1 - 0.3 4.10 100
Buluang 6.40 68.20 3.3 14 1.5 - - 0.5 6.2 100.00
Calauit 3.4 50.60 0.1 12.2 - - 0 0.9 32.70 100.00
Cheey 4.00 33.00 0.1 15.7 0 1.4 0 0.8 45.00 100.00
Concepcion 1.00 87.80 0.5 3.4 - - 0.2 0.8 6.20 100.00
Maglalambay 0.20 98.70 0.6 0.5 - - - - - 100.00
New
Busuanga
4.70 65.30 0.8 7.8 - 0.2 - 1.4 19.90 100.00
Old Busuanga 8.60 35.20 0.7 0.5 - 2.3 1.5 0.2 51.10 100.00
Panlaitan 0.20 59.40 7.4 - 33 - - - - 100.00
Quezon 6.40 61.80 0.6 23.11 - 0 1.5 0.2 51.10 100.00
Sagrada 4.10 60.30 0.4 6.6 - - 0 0.4 28.10 100.00
Salvacion 3.90 42.00 0.8 0 - 0.1 0.4 0.7 52.00 100.00
San Isidro 0.40 97.80 0.8 1 - - - - - 100.00
San Rafael 1.80 32.00 1.1 0.2 - 18.1 - 0.3 46.50 100.00
Sto. Nino 5.80 73.10 0.5 16.7 - - 0.1 1.2 2.7 100.00
Municipal
Total
4.15 49.56 0.59 10.87 0.24 2.03 0.13
0.76
32.46
100.00 Source: ECAN Zones Management Framework and Guidelines for Busuanga Municipality, 2006
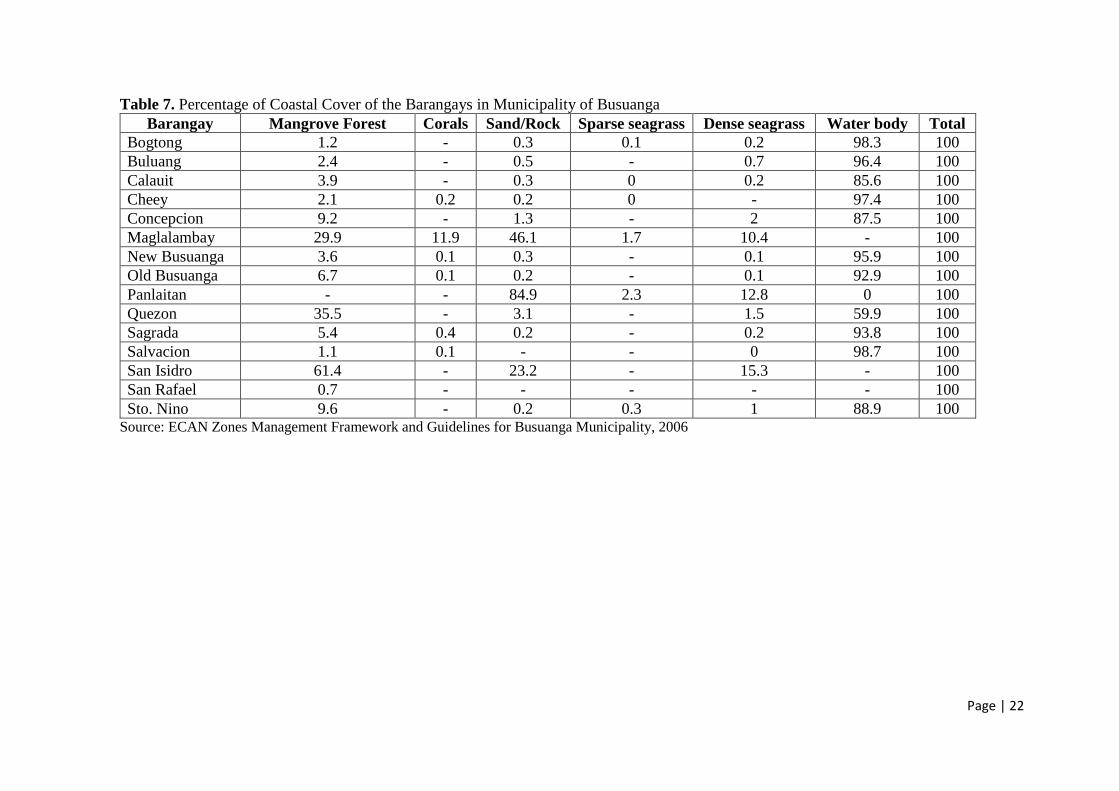
Page | 22
Table 7. Percentage of Coastal Cover of the Barangays in Municipality of Busuanga
Barangay Mangrove Forest Corals Sand/Rock Sparse seagrass Dense seagrass Water body Total
Bogtong 1.2 - 0.3 0.1 0.2 98.3 100
Buluang 2.4 - 0.5 - 0.7 96.4 100
Calauit 3.9 - 0.3 0 0.2 85.6 100
Cheey 2.1 0.2 0.2 0 - 97.4 100
Concepcion 9.2 - 1.3 - 2 87.5 100
Maglalambay 29.9 11.9 46.1 1.7 10.4 - 100
New Busuanga 3.6 0.1 0.3 - 0.1 95.9 100
Old Busuanga 6.7 0.1 0.2 - 0.1 92.9 100
Panlaitan - - 84.9 2.3 12.8 0 100
Quezon 35.5 - 3.1 - 1.5 59.9 100
Sagrada 5.4 0.4 0.2 - 0.2 93.8 100
Salvacion 1.1 0.1 - - 0 98.7 100
San Isidro 61.4 - 23.2 - 15.3 - 100
San Rafael 0.7 - - - - - 100
Sto. Nino 9.6 - 0.2 0.3 1 88.9 100 Source: ECAN Zones Management Framework and Guidelines for Busuanga Municipality, 2006

Page | 23
1.9. Land Use
Figure 7 shows the different land uses in the Municipality of Busuanga. Accordingly, the
following are noted generalizations concerning various land uses in the municipality:
a. Buluang has the largest area of built-up or urban environment, followed by San Rafael,
New Busuanga & Salvacion. These areas have high percentage of multiple use zones,
particularly Buluang and Salvacion, and are more appropriate for residential and
commercial developments;
b. Old Busuanga has the highest concentration of river channels and a potential source of
irrigation and domestic water as this barangay caters majority of the Busuanga River;
c. Cheey, being the biggest barangay in terms of land area in the municipality has the
largest concentration of road, largest area of grasslands and agriculture lands.;
d. Cheey has the highest concentration of secondary growth forest while San Rafael has
the highest concentration of primary or closed canopy forest and limestone forest;
e. Cheey, Sto. Nino and New Busuanga have the largest concentration of brushlands. Sto.
Nino has the highest concentration of degraded seagrass meadows. Sto. Nino,
Concepcion & Calauit have the highest concentration of dense or intact seagrass
meadows; and
f. Calauit has the highest concentration of secondary mangrove forest followed by Sto.
Nino, Old Busuanga & Sagrada. Sagrada has the largest area of live coral cover.

Page | 24
Figure 7. Land Use Map of the Municipality of Busuanga
Page | 25
1.10. Biological Environment
Through the various surveys and study by the SEMP-ECAN Zoning Project, the
terrestrial flora and fauna present in the municipality were profiled.
Terrestrial Flora
The vegetation of the municipality is mainly characterized by patches of grasslands,
brushlands and its conopy is dominantly vegetated with bamboo species called “buho”.
The remaining primary growth forest in the area is limestone forest. These significant
primary and closed forests (e.g. semi-evergreen & semi-deciduous, limestone & karst) were
noted in Barangays Concepcion, Sagrada, YKR presently known as Busuanga Pasture
Reserve (BPR), Cheey and San Rafael. These areas have also high percentages of alienable
lands making it suitable for vegetation and for other uses such as residential and agricultural
uses. In addition, two barangays were noted to have a stable upland agriculture, namely:
Quezon and New Busuanga.
The municipality of Busuanga rich has rich biodiversity. Flora found in the
municipality include kamagong, ipil sakat, akle, apitong, malasantol, antipolo, nato, yakal,
duguan, narra, molave, mancono and kalaum. Forest land of municipality is considered
special because six uncommon indigenous flora species are recorded. This includes Lanete,
which is classified as endangered under the International Union for Conservation of Nature
(IUCN) Red Data List. On the other hand, Barangay Cheey and Salvacion were endorsed
to be considered as biodiversity hotspots for they were observed to have high biodiversity
indices. These barangays Cheey and Salvacion are among the top barangays with high
percentage of primary and secondary forest as well as high percentage of Core Zones, 3.7%
and 2.2% respectively.
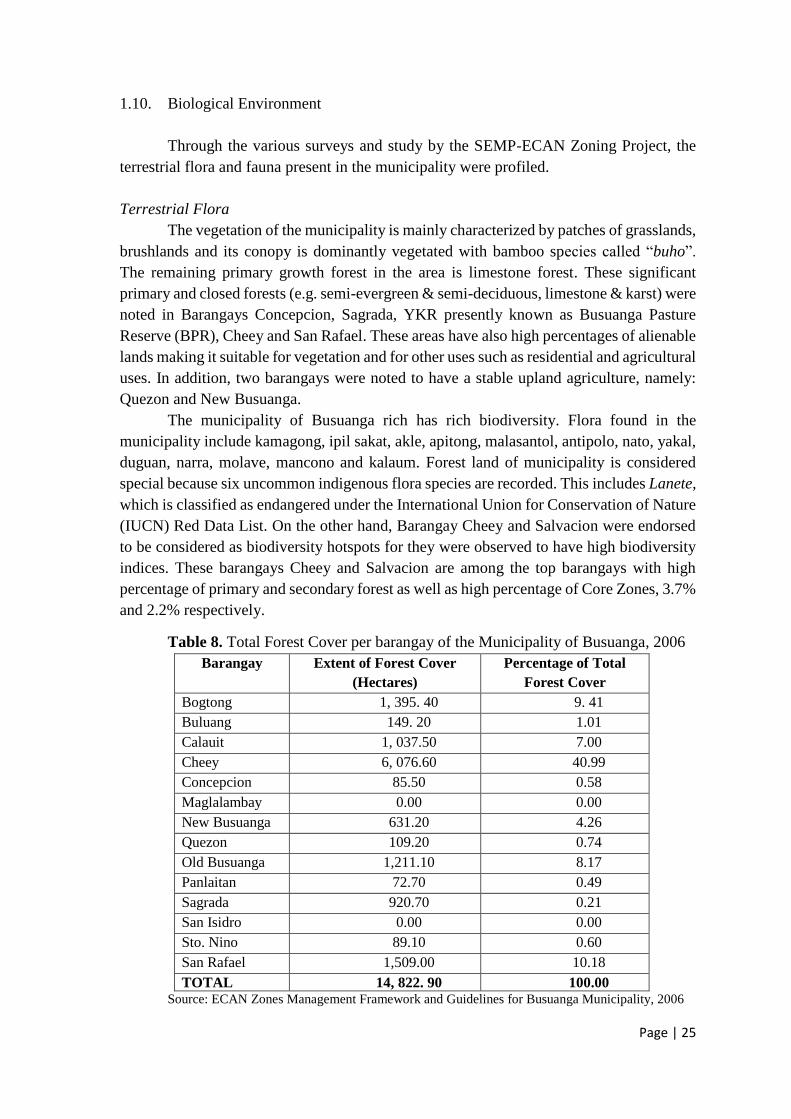
Table 8. Total Forest Cover per barangay of the Municipality of Busuanga, 2006
Barangay Extent of Forest Cover
(Hectares)
Percentage of Total
Forest Cover
Bogtong 1, 395. 40 9. 41
Buluang 149. 20 1.01
Calauit 1, 037.50 7.00
Cheey 6, 076.60 40.99
Concepcion 85.50 0.58
Maglalambay 0.00 0.00
New Busuanga 631.20 4.26
Quezon 109.20 0.74
Old Busuanga 1,211.10 8.17
Panlaitan 72.70 0.49
Sagrada 920.70 0.21
San Isidro 0.00 0.00
Sto. Nino 89.10 0.60
San Rafael 1,509.00 10.18
TOTAL 14, 822. 90 100.00 Source: ECAN Zones Management Framework and Guidelines for Busuanga Municipality, 2006
Page | 26
With respect to forest cover (Table 8), top three barangays with the highest forest
cover are: Cheey, Salvacion and San Rafael. For the primary forest, Cheey has 1.4%,
Salvacion with 0.1% and San Rafael with 18.1%, and for the secondary forest, Cheey has
45.0%, Salvacion with 52% and San Rafael with 46.5%. Besides having high forest cover,
these barangays also possess a relatively high percentage of protected areas or core zones.
On the other side, there are also barangays without forests and these are Barangay San
Isidro and Barangay Maglalambay.
Terrestrial Flora and its Threats
According to the transect lines conducted by the PCSD, Cheey, being the largest
barangay in the municipality has the highest number of endangered flora species. Among
these that appear at almost 80% of the transect area are Malasantol (Sympetalandra
densiflora) and Sakat/Teket while species which appear in almost 70% of the transect areas
is Ipil (Intsia bijuga). Barangay Salvacion follows Cheey with 7 out of 15 endangered
species identified. For the whole municipality, the common endangered species found are
Malasantol (63%), Sakat/Taket (54%), Ipil (54%) and Yakal (Shorea astylosa )(45%).
Besides species endangerment, major threats to these resources are illegal logging,
forest fires, kaingin, hunting of wildlife, and the rapid expansion of settlements in the
upland due to the increase in population, brought by natural increase and migration.
Terrestrial Fauna
The Municipality of Busuangais haven for a total of 145 species of vertebrate fauna.
Not only there are numerous counts of species but endemicity and discovery of new species
is also very significant in the area. 21% species of birds, 33% species of mammals, and
29% species of amphibians and reptiles are endemic. Addition to this, four new species of
birds and one species of frog, turtle and snake were found. Other new recorded species in
the municipality include the Philippine Hawk Eagle (Spizaetus Philippensis), Blue-capped
Kingfisher (Actenoides hombroni), Little-pied Flycatcher (Ficedula westermani
palawanensis), Small button quail (Turnix sylvatica), Slender digit Narrow mouth frog
(Kaloula picta) and Philippine pit viper (Trimereserus flavomaculatus).
Particularly, indices of its species richness, evenness, dominance and diversity were
high in the following order of habitat types: brushland-forest, brushland-bamboo thicket,
brushland ricefield, and agroforest-bamboo thicket (pure forest stand recorded the lowest
diversity of wildlife).
1.11. Water Resources
River System
The Municipality of Busuanga has a lot of river systems which are used as a water
resources. More than its domestic use, these can be a good source of livelihood and
recreation for locals and even for tourists. These river systems include the (1) Great
Busuanga River in Old Busuanga traversing around itself and Salvacion, (2) river system
which passes along Barangay Buluang, New Busuanga and Quezon, (3) another one which
crosses Barangay Bogtong, Sagrada and Concepcion, (4) Binalayan River in Barangay

Page | 27
Cheey, (5) Dipuyal River in Sto. Nino, (6) Lele River in New Busuanga, (7) Malabnas
River in San Rafael, (8) Ditapec River in Calauit, and (9) Kiwit River in Sagrada. Figure 8
shows the river map of the Municipality of Busuanga.

Page | 28
Figure 8. River Map of the Municipality of Busuanga

Page | 29
Waterfalls
A waterfall located in Barangay Concepcion has high potential for tourism
development. It has been an ideal place of locals and visitors for recreation.
Watershed
The main watershed of the Busuanga which has a total area of 1, 963.62 ha
traverses other barangays in Coron such as Bintuan. There is also another watershed with
an area of 2,771.14 ha covering Decalachao in a lineal distance of 21, 524.24 meters.
1.12. Mineral Resources
According to the DENR Data Report and the 2013 Forest Land Use Plan (FLUP)
of Coron, the total mineable area for the whole Busuanga Island is 18, 990 hectares. The
known mineral resources/reserves that are mainly found are limestone, marble, manganese,
nickel, chromite and iron. In the Municipality of Busuanga, these mineral deposits are
located in Barangays Bogtong, Sagrada and Concepcion. Mining, on the other hand, is not
rampant in the municipality and no mineral mining activities are recorded as of this year.
This implies that the municipality do not engage themselves of unsustainable mining
practices that can destroy the rich natural resources in the area. Moreover, this also reflects
how the municipality finds favor in pursuing sustainable development. However, anecdotal
accounts reported that there are sand anf gravel quarry operating without permit which is
yet to be verified.
1.13. Coastal and Marine Resources
Coral Reef
The estimated coral reef cover of Busuanga is about 11.30 km2. Of which, patchy
corals on rubbles substrate are estimated to have an area of 1.96 km2 while algae
overgrowing dead corals are estimated to be in an area of 6.29 km2. Among the barangays
with coral reefs, Barangay Panlaitan has the largest area for coral reefs (16.95 hectares).
Other barangays with coral reef areas include: Concepcion (14.12 hectares), Sagrada (11.18
hectares), Calauit (10.5 hectares), Maglalambay (6.35 hectares) and New Quezon (2.99
hectares).
Also, there are three coral reef areas identified as core zone based on their percentage
of live coral cover. These are Denicolan Island (53%), Tantangon Island (44%) and
Calumboyan Island (55%). Since high percentages of coral reef cover indicate high
percentage of coral fishes and shellfishes, core zone delineation for coral reefs on strategic
locations such as the three islands can improve and maintain the dynamics of corals and
fisheries in the area.
In the State of the Environment Report (PCSDS 2015), only 2.7% of the coral cover
is in excellent condition, 14.8% in very good condtion, 14.9% in good, 42.1% in fair, and
25.5% in poor condition. This accounted results of survey conducted in 2011.
Sea grass communities
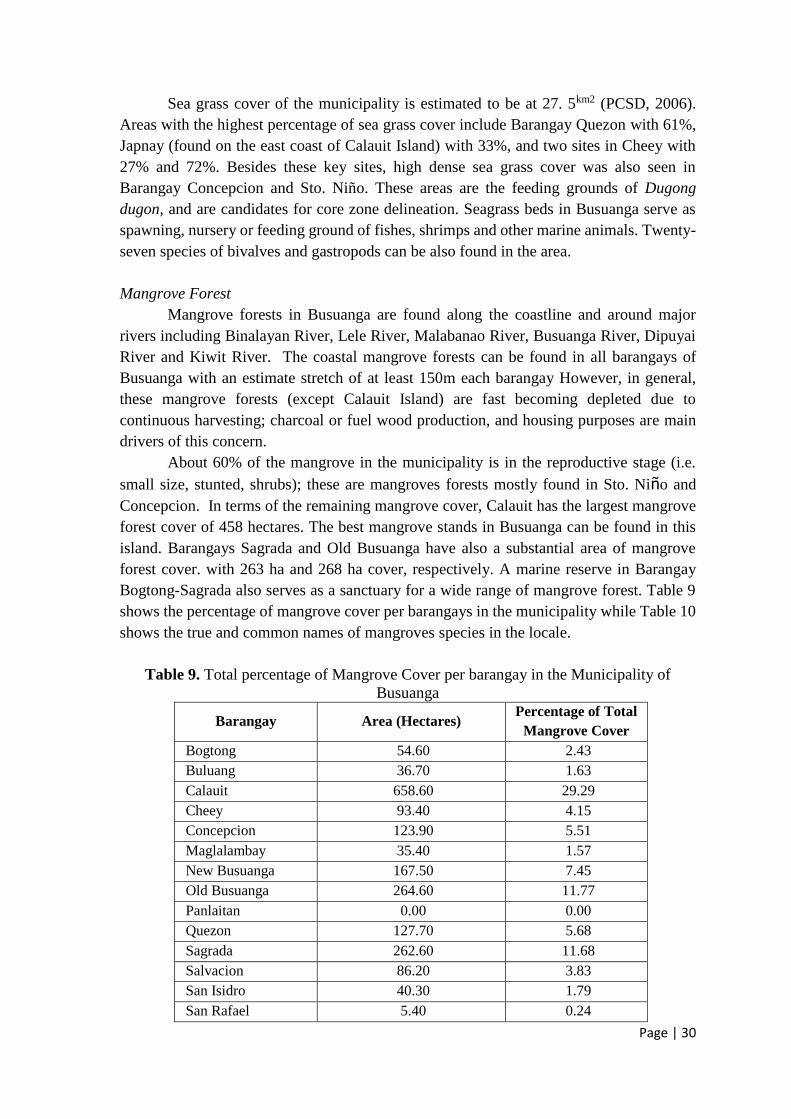
Page | 30
Sea grass cover of the municipality is estimated to be at 27. 5km2 (PCSD, 2006).
Areas with the highest percentage of sea grass cover include Barangay Quezon with 61%,
Japnay (found on the east coast of Calauit Island) with 33%, and two sites in Cheey with
27% and 72%. Besides these key sites, high dense sea grass cover was also seen in
Barangay Concepcion and Sto. Niño. These areas are the feeding grounds of Dugong
dugon, and are candidates for core zone delineation. Seagrass beds in Busuanga serve as
spawning, nursery or feeding ground of fishes, shrimps and other marine animals. Twenty-
seven species of bivalves and gastropods can be also found in the area.
Mangrove Forest
Mangrove forests in Busuanga are found along the coastline and around major
rivers including Binalayan River, Lele River, Malabanao River, Busuanga River, Dipuyai
River and Kiwit River. The coastal mangrove forests can be found in all barangays of
Busuanga with an estimate stretch of at least 150m each barangay However, in general,
these mangrove forests (except Calauit Island) are fast becoming depleted due to
continuous harvesting; charcoal or fuel wood production, and housing purposes are main
drivers of this concern.
About 60% of the mangrove in the municipality is in the reproductive stage (i.e.
small size, stunted, shrubs); these are mangroves forests mostly found in Sto. Niño and
Concepcion. In terms of the remaining mangrove cover, Calauit has the largest mangrove
forest cover of 458 hectares. The best mangrove stands in Busuanga can be found in this
island. Barangays Sagrada and Old Busuanga have also a substantial area of mangrove
forest cover. with 263 ha and 268 ha cover, respectively. A marine reserve in Barangay
Bogtong-Sagrada also serves as a sanctuary for a wide range of mangrove forest. Table 9
shows the percentage of mangrove cover per barangays in the municipality while Table 10
shows the true and common names of mangroves species in the locale.
Table 9. Total percentage of Mangrove Cover per barangay in the Municipality of
Busuanga
Barangay Area (Hectares) Percentage of Total
Mangrove Cover
Bogtong 54.60 2.43
Buluang 36.70 1.63
Calauit 658.60 29.29
Cheey 93.40 4.15
Concepcion 123.90 5.51
Maglalambay 35.40 1.57
New Busuanga 167.50 7.45
Old Busuanga 264.60 11.77
Panlaitan 0.00 0.00
Quezon 127.70 5.68
Sagrada 262.60 11.68
Salvacion 86.20 3.83
San Isidro 40.30 1.79
San Rafael 5.40 0.24

Page | 31
Sto. Nino 291.60 12.97
TOTAL 2,248.50 100
Source: Mangrove Survey, PCSD (2003)
Table 10. True and Common Names of Mangrove Species present in the
Municipality of Busuanga
True Mangrove Common Name Associate Mangrove Common Name
Aegiceras corniculatum Tinduk-tindukan Acanthus ebracteatus Tigbau
Aegiceras floridum Saging-saging Acacia farnesiana Aroma
Avicennia alba Bungalon-puti Acrostichum aureum Lagolo
Avicennia marina Bungalon Barringtonia asiatica Botong
Avicennia officinalis Api-api Barringtonia racemosa Putat
Bruguiera gymnorrhiza Busain Brownlonia tersa
Bruguiera sexangula Pototan Brownlonia lanceolata Maragomon
Bruguiera cylindrical Pototan Lalaki Caesalpinia crista
Bruguiera parviflora Langarai Caesalpinia nuga Sapinit
Camptostemon
philippinense
Gapas-Gapas Cerbera mangas Baraibai
Ceriops tagal Tangal Cynometra ramiflora Balitbitan
Ceriops decandra Malatangal Derris trifoliate Mangasin
Lumnitzera littorea Tabau Hibiscus tiliaceus Malubago
Lumnitzera racemose Kulasi Garcinia spp.
Nypa fruticans Nipa Glochidion littorale Kayong
Rhizophora apiculate Bakauan lalaki Instia bijuga Ipil
Rhizophora mucronata Bakauan babae Morinda citrifolia Bangkoro
Rhizophora stylosa Bakauan bato Osbornia octodonta Taualis
Sonneratia alba Pagatpat Pandanus tectorius Prickly Pandan
Sonneratia caseolaris Pedada Pemphis acidula Bantigi
Excoecaria agallocha Buta-Buta Pongamia pinnata Bani
Xylocarpus granatum Tabigi Scyphiphora hydrophyllacea Nilad
Xylocarpus
moluccensis
Piagau Terminalia catappa Talisai
Source: Mangrove Resource Assessment in Busuanga, Palawan, ECAN Zoning Project (2003)
Coral Life forms and associated species
Coral reef areas in Denicolan, Tantangon, and Calumboyan Islands have substantial
coral cover of at least 50%. Given the abundance of this resource, their zone reclassification
as core zone areas was found necessary. Similarly, being endowed with good grass cover,
areas in Cheey, New Quezon and Japnay are also recommended for zone updating. To
better improve the ecological dynamics in the area as well as the fisheries production, the
coral reefs of the small islands and other strategically located coral reefs are delineated as
core zone or restricted zone.
Coral reef areas are also seen as potential income generating livelihood activities.
Tourists come and go in the municipality to witness sites such as the good diving spots and
white sand beaches in the island barangays of the municipality. This includes caves and
Page | 32
shipwrecks located in Malajon Island, most popularly known as Black Island, serving as
tourist visitation spots. Moreover, Fishermen considers tourism as alternative livelihood
that allows them to minimize destructive fishing practices and devote their efforts in
protecting their tourism-based livelihood.
On the other hand, in some areas of the Municipality of Busuanga like Concepcion,
pearl are being cultured in pearl farms. These do not just help in the livelihood of the
community for these also serve as protective enclosure of coral reef areas. More than
preventing illegal intrusions of large fishing boats, pearl farms allow the coral reefs and the
reef fishery production to improve and regenerate.
Reef fish communities
The reef fish communities in Busuanga are in generally poor condition. The most
dominant families observed are the non-target species which are very low in value
commercially; commercially valuable target species are seen as generally low in number
in the whole municipality.
A total of 135 species from 27 families were recorded in the survey conducted by
the ECAN Project in 2006 in selected sites in the municipality; these sites include
Tantangon Island, Calumboyan Island, and Denicolan Island. The study showed that
Calumboyan Island has the highest number of species (103 species from 22 families),
abundance (3,128 individuals) and estimated biomass (32,355.87g) among the three survey
sites; Tantangon Island has the second highest number of species (79 species from 19
families), 1,933 individuals and 25,026.01 grams of biomass; while Denicolan Island has
the lowest number of species (56 species from 20 families), total abundance of 992
individuals and biomass of 11,595 grams- Siganidae contributed majority of the biomass.
Marine Mammals and Turtles
Sea cows (dugongs) and turtles can be seen the whole year round in many coastal
barangays except in Bogtong, Sagrada, Concepcion and Sto. Niño. Turtle nesting sites were
spotted in the islands of Tanobon, Dimipac, Elet, Malajom, Pamalican, West Nalaut, and
Salvacion. The turtles that are found in Busuanga include Olive Ridley (Lepidochelys
olivacea) or pawikan and Hawkbill turtle (Eretmochelys imbricate) or Kara which are both
common in the area. Dolphins and whales were likewise observed in the area during May
to December. The highly migratory Dermochelys coriacea or the Leather Back Katuan has
also been seen in the area.
1.14. Natural Hazards and Constraint
Aside from the natural disasters contributing to land degredation, five other casues
greatly affects the municipality. Grassland fires encroaching into forested areas, timber
poaching, unmanaged land cattle grazing, hillside farming and erosion are also occurring
in the area.
The Vulnerability Capacity Assessment conducted by the Municipal Disaster Risk
Reduction and Management Council in December 2015 showed the number of families that
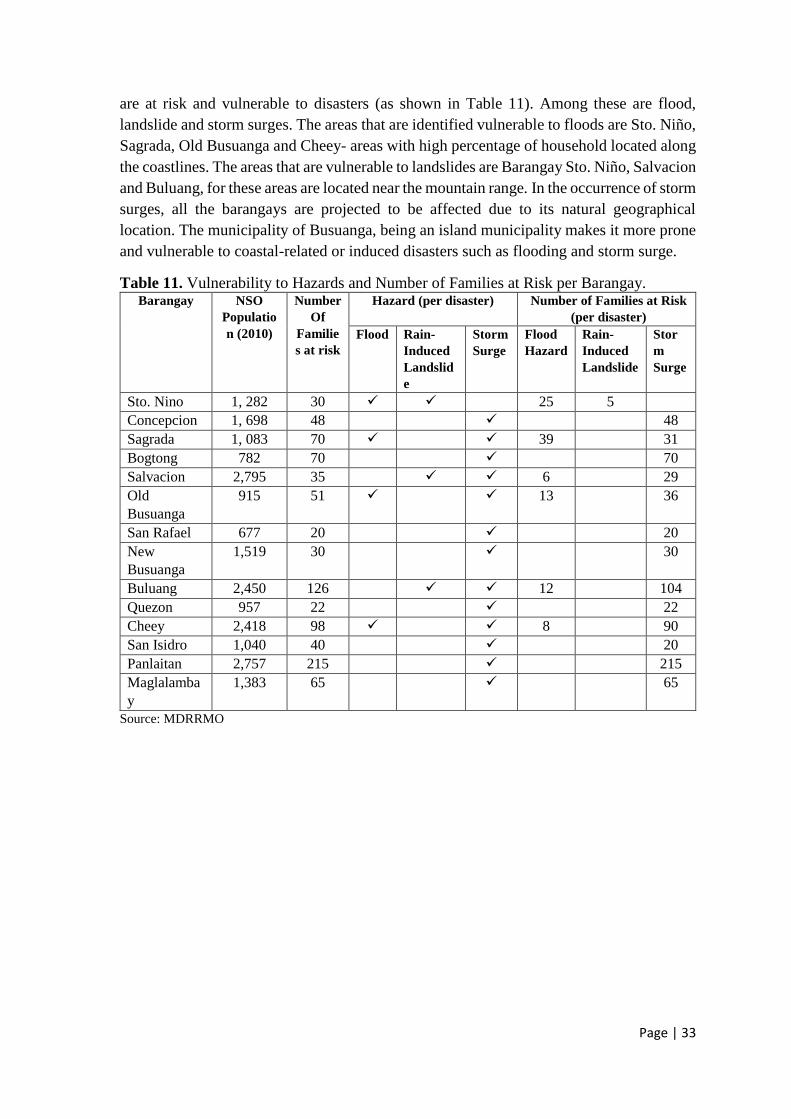
Page | 33
are at risk and vulnerable to disasters (as shown in Table 11). Among these are flood,
landslide and storm surges. The areas that are identified vulnerable to floods are Sto. Niño,
Sagrada, Old Busuanga and Cheey- areas with high percentage of household located along
the coastlines. The areas that are vulnerable to landslides are Barangay Sto. Niño, Salvacion
and Buluang, for these areas are located near the mountain range. In the occurrence of storm
surges, all the barangays are projected to be affected due to its natural geographical
location. The municipality of Busuanga, being an island municipality makes it more prone
and vulnerable to coastal-related or induced disasters such as flooding and storm surge.
Table 11. Vulnerability to Hazards and Number of Families at Risk per Barangay. Barangay
NSO
Populatio
n (2010)
Number
Of
Familie
s at risk
Hazard (per disaster) Number of Families at Risk
(per disaster)
Flood Rain-
Induced
Landslid
e
Storm
Surge
Flood
Hazard
Rain-
Induced
Landslide
Stor
m
Surge
Sto. Nino 1, 282 30 25 5
Concepcion 1, 698 48 48
Sagrada 1, 083 70 39 31
Bogtong 782 70 70
Salvacion 2,795 35 6 29
Old
Busuanga
915 51 13 36
San Rafael 677 20 20
New
Busuanga
1,519 30 30
Buluang 2,450 126 12 104
Quezon 957 22 22
Cheey 2,418 98 8 90
San Isidro 1,040 40 20
Panlaitan 2,757 215 215
Maglalamba
y
1,383 65 65
Source: MDRRMO
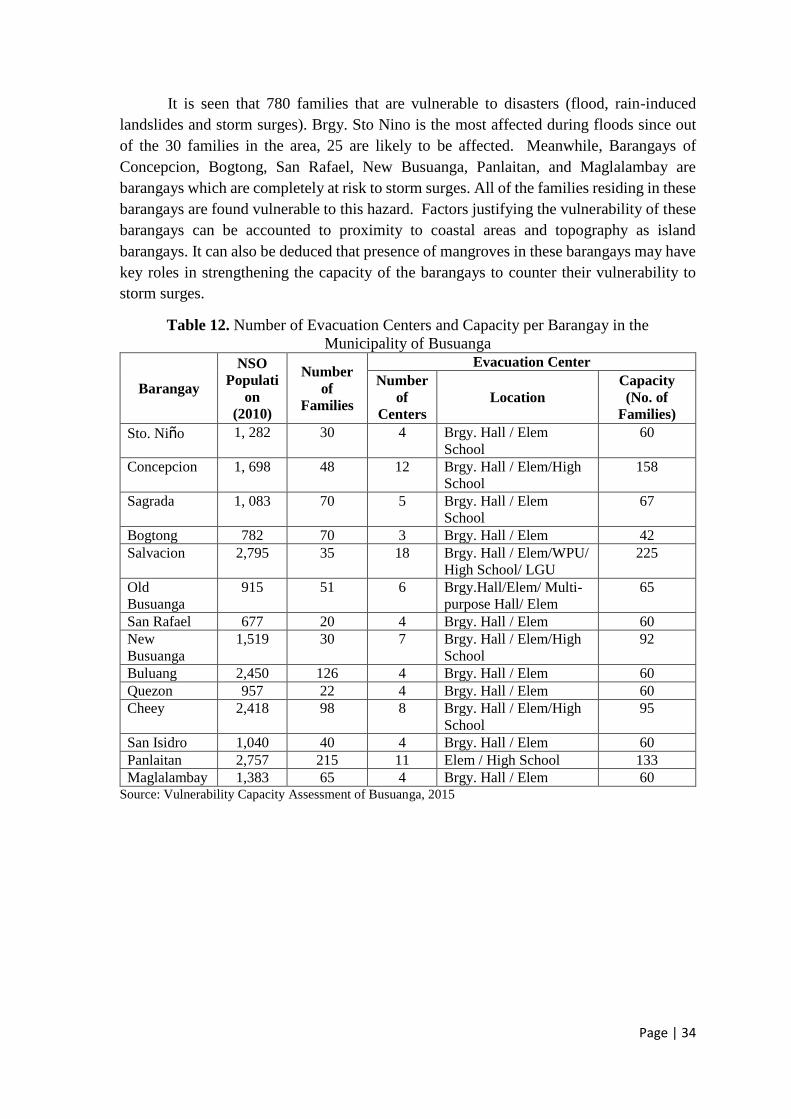
Page | 34
It is seen that 780 families that are vulnerable to disasters (flood, rain-induced
landslides and storm surges). Brgy. Sto Nino is the most affected during floods since out
of the 30 families in the area, 25 are likely to be affected. Meanwhile, Barangays of
Concepcion, Bogtong, San Rafael, New Busuanga, Panlaitan, and Maglalambay are
barangays which are completely at risk to storm surges. All of the families residing in these
barangays are found vulnerable to this hazard. Factors justifying the vulnerability of these
barangays can be accounted to proximity to coastal areas and topography as island
barangays. It can also be deduced that presence of mangroves in these barangays may have
key roles in strengthening the capacity of the barangays to counter their vulnerability to
storm surges.
Table 12. Number of Evacuation Centers and Capacity per Barangay in the
Municipality of Busuanga
Barangay
NSO
Populati
on
(2010)
Number
of
Families
Evacuation Center
Number
of
Centers
Location
Capacity
(No. of
Families)
Sto. Niño 1, 282 30 4 Brgy. Hall / Elem
School
60
Concepcion 1, 698 48 12 Brgy. Hall / Elem/High
School
158
Sagrada 1, 083 70 5 Brgy. Hall / Elem
School
67
Bogtong 782 70 3 Brgy. Hall / Elem 42
Salvacion 2,795 35 18 Brgy. Hall / Elem/WPU/
High School/ LGU
225
Old
Busuanga
915 51 6 Brgy.Hall/Elem/ Multi-
purpose Hall/ Elem
65
San Rafael 677 20 4 Brgy. Hall / Elem 60
New
Busuanga
1,519 30 7 Brgy. Hall / Elem/High
School
92
Buluang 2,450 126 4 Brgy. Hall / Elem 60
Quezon 957 22 4 Brgy. Hall / Elem 60
Cheey 2,418 98 8 Brgy. Hall / Elem/High
School
95
San Isidro 1,040 40 4 Brgy. Hall / Elem 60
Panlaitan 2,757 215 11 Elem / High School 133
Maglalambay 1,383 65 4 Brgy. Hall / Elem 60 Source: Vulnerability Capacity Assessment of Busuanga, 2015
Page | 35
Most of the evacuation centers in the municipality are Barangay Halls and Schools.
Although all the barangays in the Municipality of Busuanga have designated areas for
evacuation, there are few barangays wherein capacities of the evacuation buildings are not
enough to cater the number of families present in the area. These include: Maglalambay,
Panlaitan, Cheey and Buluang. Table 12 shows the capacity and number of evacuation
centers per barangay in the Municipality.
The municipality is also trying to mainstream DRR in their barangay development
plans. Every barangay has adopted a Disaster Risk Reduction Management Plan and on-
going contingency plans for tropical cyclones. Also, a DRRM officer was appointed and
an emergency operations center was designated in every barangay.
1.15. ECAN Zones
PCSD Resolution Nos. 99-144 and 94-44 were followed in identifying the ECAN
Zones in the Municipality of Busuanga. All the barangays have adopted the ECAN Zones
and its regulatory fucntions.
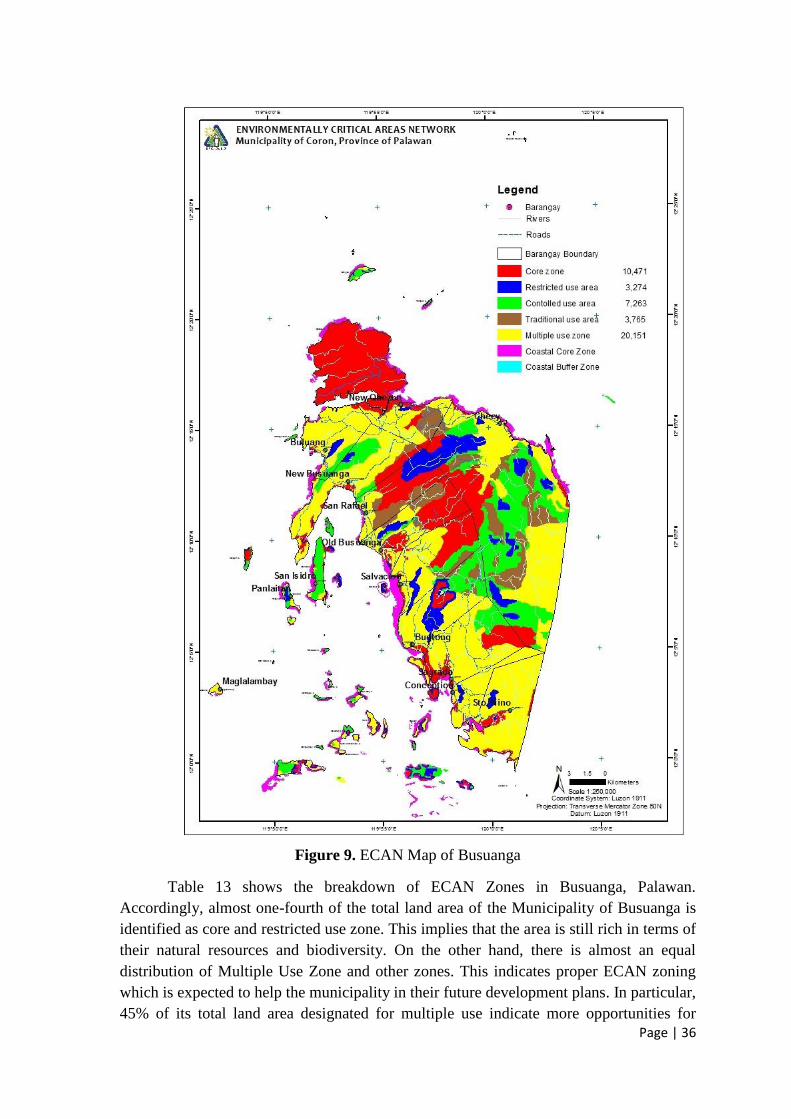
Page | 36
Figure 9. ECAN Map of Busuanga
Table 13 shows the breakdown of ECAN Zones in Busuanga, Palawan.
Accordingly, almost one-fourth of the total land area of the Municipality of Busuanga is
identified as core and restricted use zone. This implies that the area is still rich in terms of
their natural resources and biodiversity. On the other hand, there is almost an equal
distribution of Multiple Use Zone and other zones. This indicates proper ECAN zoning
which is expected to help the municipality in their future development plans. In particular,
45% of its total land area designated for multiple use indicate more opportunities for

Page | 37
physical and socio- economic growth for development; vast brushland, grasslands and idle
lands which remain to be tapped provide potentials for other productive and development
activities; while remaining areas of limestone forests and other types of forest and
marine/coastal reserve signify strict conservation and protection initiatives.
Table 13. Municipal Breakdown of ECAN Zones
ECAN Zone Area (Ha) Percentage (%)
Core Zone 7, 423 16.7
Core Zone (Protected Area) 3, 667 8.2
Restricted use zone 3, 098 7.0
Controlled use zone 5, 932 13.3
Traditional Use Zone 3, 767 8.5
Multiple use zone 19,544 43.9
Coastal Multiple Zone: Buffer (Islands) 170 0.4
Coastal Multiple Use Zone : Sustainable use Islands 1,108 2.1
Total 44, 539 100.0
*The ECAN zones map was processed based on the most recent amended guidelines on mapping
and delineation, the PCSD Resolution No. 05-250 (as of 2006)
Barangays that have the highest percentage of core zone relative to the total municipal area
include Cheey (3.7%), San Rafael (3.05%), Old Busuanga (2.7%) and Salvacion (2.2%).
For the Multiple Use Zone, the following barangays has the highest percentages; Cheey
with 9.6%, New Busuanga and Sagrada with 4.9%. Meanwhile, Cheey also has the highest
percentage of restricted use zone (2.6%) while Maglalambay and San Rafael has none. The
same with the controlled use zone, Cheey also registered the biggest percentage.
Furthermore, Calauit Island, found near Barangay Quezon and Barangay Buluang, is
classified as a protected area. This depicts that the area is rich in natural resources such as
mangroves, forest and biodiversity.
1.16. Existing Ancestral Domains
Figure 10 below shows the resource map of Busuanga indicating areas with CADT.
As shown in the map, Barangay Panlaitan and Barangay San Isidro were areas of the
municipality having ancestral domain claims. The total area for all the CADT area in the
Municipality of Busuanga is approximately 21, 000 hectares.

Page | 38
Figure 10. Busuanga Resource Map showing areas with CADT

Page | 39
2. Social and Population
2.1. Population Size and Growth Rate
The Municipality of Busuanga, Palawan has an actual population of 21,358 as of
2010 with a 2,292 increase in population from 19,066 in2007 with an annual growth rate
of 3.856%. By year 2020, the total population is projected to be 31,199 and 37,673 by the
year 2025. Among the barangays in the Municipality, Panlaitan, which is one of the rural
barangays, has the highest population with 3,509, followed by Salvacion, with 2,515 and
by Buluang with 2, 346. Table 8 shows the actual and estimated population of Busuanga,
Palawan.
Majority of the population of Busuanga reside within the Multiple Use Zone where
most of the resources are accessible. Meanwhile, Barangay Panlaitan’s population is
located within the multiple use zone, restricted use, controlled use area and coastal core
zones of the barangay, as these zones make up the entire geography of the barangay.
Accessible resources are present in these zones. Several households have small commercial
establishments that satisfy the needs of the residents. It can also be noted that fishing is one
of the main source of livelihood in the barangay since it is surrounded by water where
diverse species of fish can be found.
Table 14. Actual Number of Population and Estimated Population of Busuanga
Municipality.
Barangay
Actual Population Projected Population
2007 2010 2020 2025
URBAN BARANGAYS 4,154 4,849 6,794 8,208
Salvacion 2,225 2,515 3,639 4,396
NewBusuanga (Pob.) 1,183 1,455 1,935 2,338
Old Busuanga 746 879 1,220 1,474
RURAL BARANGAYS 14,912 16,509 24,405 29,465
Panlaitan 3,180 3,509 5,200 6,283
Buluang 2,069 2,346 3,384 4,088
Cheey 1,994 1,990 3,260 3,940
Concepcion 1,300 1,761 2,126 2,569
Maglalambay 1,189 1,227 1,944 2,349
Sto Nino 1,122 1,201 1,835 2,217
Sagrada 1,088 1,018 1,799 2,150
San Isidro 966 947 1,580 1,909
Quezon 594 943 971 1,174
Bogtong 877 888 1,434 1,733
San Rafael 533 679 872 1,053
TOTAL 19,066 21,358 31,199 37,673
2.2. Population Density
As of 2010, Busuanga, Palawan has an overall population density of 0.48. It had
increased by 0.05 from 2007 with a population density of 0.43. Among the barangays,
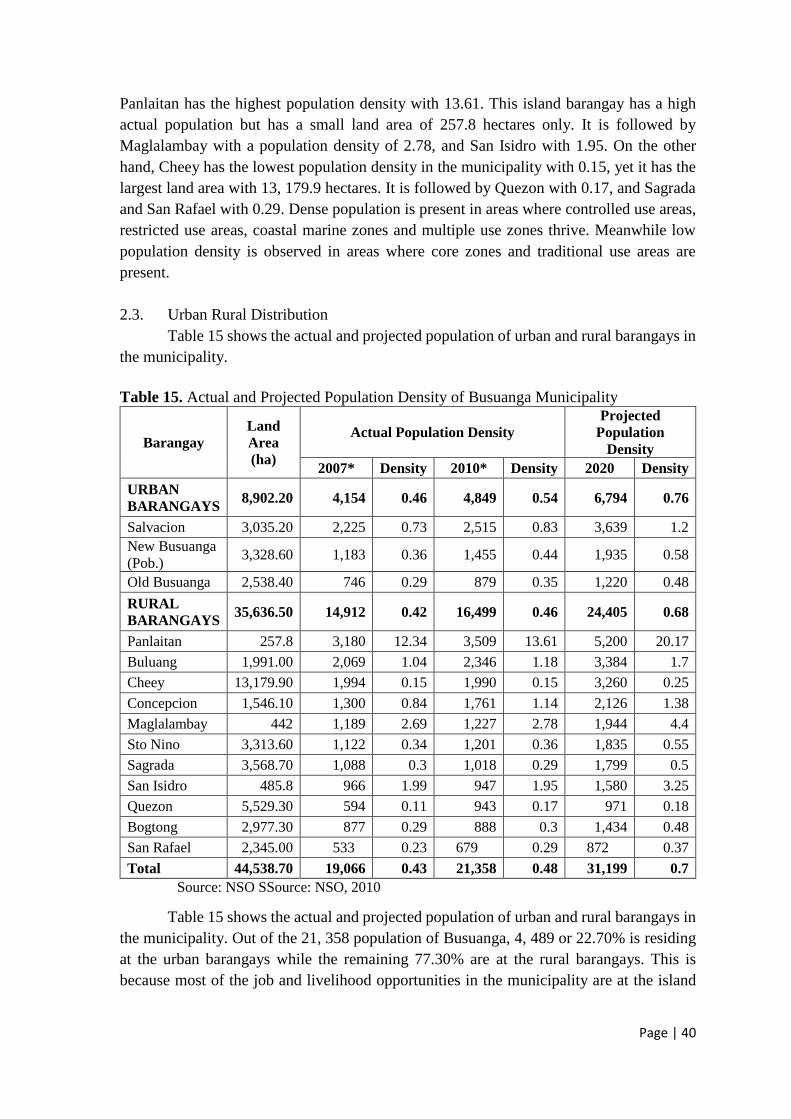
Page | 40
Panlaitan has the highest population density with 13.61. This island barangay has a high
actual population but has a small land area of 257.8 hectares only. It is followed by
Maglalambay with a population density of 2.78, and San Isidro with 1.95. On the other
hand, Cheey has the lowest population density in the municipality with 0.15, yet it has the
largest land area with 13, 179.9 hectares. It is followed by Quezon with 0.17, and Sagrada
and San Rafael with 0.29. Dense population is present in areas where controlled use areas,
restricted use areas, coastal marine zones and multiple use zones thrive. Meanwhile low
population density is observed in areas where core zones and traditional use areas are
present.
2.3. Urban Rural Distribution
Table 15 shows the actual and projected population of urban and rural barangays in
the municipality.
Table 15. Actual and Projected Population Density of Busuanga Municipality
Barangay
Land
Area
(ha)
Actual Population Density
Projected
Population
Density
2007* Density 2010* Density 2020 Density
URBAN
BARANGAYS 8,902.20 4,154 0.46 4,849 0.54 6,794 0.76
Salvacion 3,035.20 2,225 0.73 2,515 0.83 3,639 1.2
New Busuanga
(Pob.) 3,328.60 1,183 0.36 1,455 0.44 1,935 0.58
Old Busuanga 2,538.40 746 0.29 879 0.35 1,220 0.48
RURAL
BARANGAYS 35,636.50 14,912 0.42 16,499 0.46 24,405 0.68
Panlaitan 257.8 3,180 12.34 3,509 13.61 5,200 20.17
Buluang 1,991.00 2,069 1.04 2,346 1.18 3,384 1.7
Cheey 13,179.90 1,994 0.15 1,990 0.15 3,260 0.25
Concepcion 1,546.10 1,300 0.84 1,761 1.14 2,126 1.38
Maglalambay 442 1,189 2.69 1,227 2.78 1,944 4.4
Sto Nino 3,313.60 1,122 0.34 1,201 0.36 1,835 0.55
Sagrada 3,568.70 1,088 0.3 1,018 0.29 1,799 0.5
San Isidro 485.8 966 1.99 947 1.95 1,580 3.25
Quezon 5,529.30 594 0.11 943 0.17 971 0.18
Bogtong 2,977.30 877 0.29 888 0.3 1,434 0.48
San Rafael 2,345.00 533 0.23 679 0.29 872 0.37
Total 44,538.70 19,066 0.43 21,358 0.48 31,199 0.7
Source: NSO SSource: NSO, 2010
Table 15 shows the actual and projected population of urban and rural barangays in
the municipality. Out of the 21, 358 population of Busuanga, 4, 489 or 22.70% is residing
at the urban barangays while the remaining 77.30% are at the rural barangays. This is
because most of the job and livelihood opportunities in the municipality are at the island

Page | 41
barangays where fishing thrives and tourist destinations, though needs proper management,
are located.
The Urban barangays, namely, Salvacion, New Busuanga, and Old Busuanga share
more than a fourth of the municipality’s population. They are considered as urban
barangays because according to the NSO’s definition of urban space, a central district
should have the following: street pattern, at least 6 establishments (commercial,
manufacturing, recreation and/or personal services), and at least 3 of the following: town
hall, church or chapel with religious service at least once a month; public plaza, park or
cemetery; market place or building were trading activities are carried on at least once a
week; and a public building. It is also where most of the economic activities are found.
Some rural barangays share a high percentage of the population as well. However, it can
be noted that urban barangays have a higher population distribution than the rural barangays
since most of the household needs can be accessed in the former.
2.4. Housing
Tenural Status
Rent houses/rooms including lot is the top tenural status in Busuanga, Palawan.
This shows that most households, including tourists, do not have their own land, thus rent
houses/rooms for accomodations. In accordance with this figure, data from MPDO also
indicate that owned houses with rent-free lot with consent from the owner is one of the top
tenural status in the municipality. Table 16 shows the household tenural status in
Busuanga Palawan.
Table 16. Tenural Status by Households in Busuanga, Palawan
Tenure Status Number of Households
Rent house/room including lot 2,232
Own house, rent lot 55
Own house, rent-free lot without consent of owner 71
Own house, rent-free lot with consent of owner 110
Own house, rent-free lot without consent of owner 86
Rent-free house and lot with consent of owner 185
Rent-free house without consent of owner
Living in a public space with rent
20
19
Living in a public space without rent 355
Other tenure status 100
Source: MPDO, 2014
2.5. Age Distribution
Based on the 2010 total population, majority of the total population in Busuanga,
Palawan are composed of the younger population. The age structure of Busuanga (Figure
11) illustrates that of the Philippine population structure. Its broad base reflects a large
number of young population while its narrow tip shows a very small number of

Page | 42
elderly.With a large number of young population, human resources will be reinforced,
satisfying the need of the municipality for more manpower.
Figure 11. Age-Sex Distribution of the Municipality of Busuanga based on 2010 Census
2.6. Dependency Ratio
The population of 15 years old and over is considered to be the economically active
population. They can be classified as either employed or unemployed. Using the 2010
Census of Population by the NSO, the child and old age dependency ratios were identified.
As of 2010, there is a total of 12, 768 people who are in the working age group and a total
of 8,580 dependents over these working age group. The child dependency ratio is 0.61.
This means that for every one productive individual, approximately 1 child depends on
him/ her. As for the old age, 0.06 or approximately 1 elderly is dependent for every one
productive individual. This would mean that the old population would not require much
dependency among the productive individuals, thus giving them less burden for acquiring
their needs.Table 17 shows the computed dependency ratio of the municipality in 2010.
Table 17. Computed Dependency Ratio of Busuanga Municipality
Categories 2010 Percent Share
0 – 14
65 and over
Total Dependents
15 – 64
Total Working Age Group
Total Population
7,816
764
8,580
12,768
12,768
21,348
36.61
3.58
40.19
59.81
59.81
100.00
-2000 -1500 -1000 -500 0 500 1000 1500
Under 5
10 – 14
20 – 24
30 – 34
40 – 44
50 – 54
60 – 64
70 – 74
80 and over
Male Female

Page | 43
2.7. Status of Well-Being
Health and Personnel Facilities
Given the number of health personnel in the municipality (as shown in Table 18),
the need for more health personnel arises according to the standardized number of health
workers who must administer the provision of health services. There is also a need to
establish more health facilities to cater the needs of the people who might need medical
assistance. The nearest hospital from the municipality is the Coron District Hospital which
is more than 20 kilometers away from the town proper.
Table 18. Distribution and Ratio to Population of Health Personnel
Designation Male Female
Physicians / Doctors 1 0
Dentists 1 0
Nurses 0 2
Midwives 1 8
Medical Technologists 0 0
Sanitary Engineers 0 0
Sanitary Inspectors 1 0
Nutritionists 0 0
Active BHWs 1 105 Source: Municipal Health Office 2013
Ten Leading Causes of Morbidity and Mortality
In 2014, the top three leading causes of death were Acute Respiratory Infection
with 2, 661 cases followed by Diarrhea with 378 cases, and Wounds of all types with 372
cases (Municipal Health Office, 2014). Comparing the municipality’s list of causes of
morbidity with the national records, Acute Respiratory Infection ranked first as well, but
was followed by different diseases except Urinary Tract Infection which have ranked tenth
as shown in the table below.
Table 19. Ten Leading Causes of Mortality
Causes All Ages Male Female
1. ARI/UTI
2. Age / Diarrhea
3. Wounds (all types)
4. Multiple Injuries
5. Acute Gastritis
6. Bronchial Asthma
7. Hypertension
8. Animal Bite
9. Pulmonary
Tuberculosis
10. Urinary Tract Infection
2661
378
372
161
127
101
88
70
66
66
1153
195
244
97
53
41
46
38
47
23
1508
183
128
64
74
60
42
32
19
43
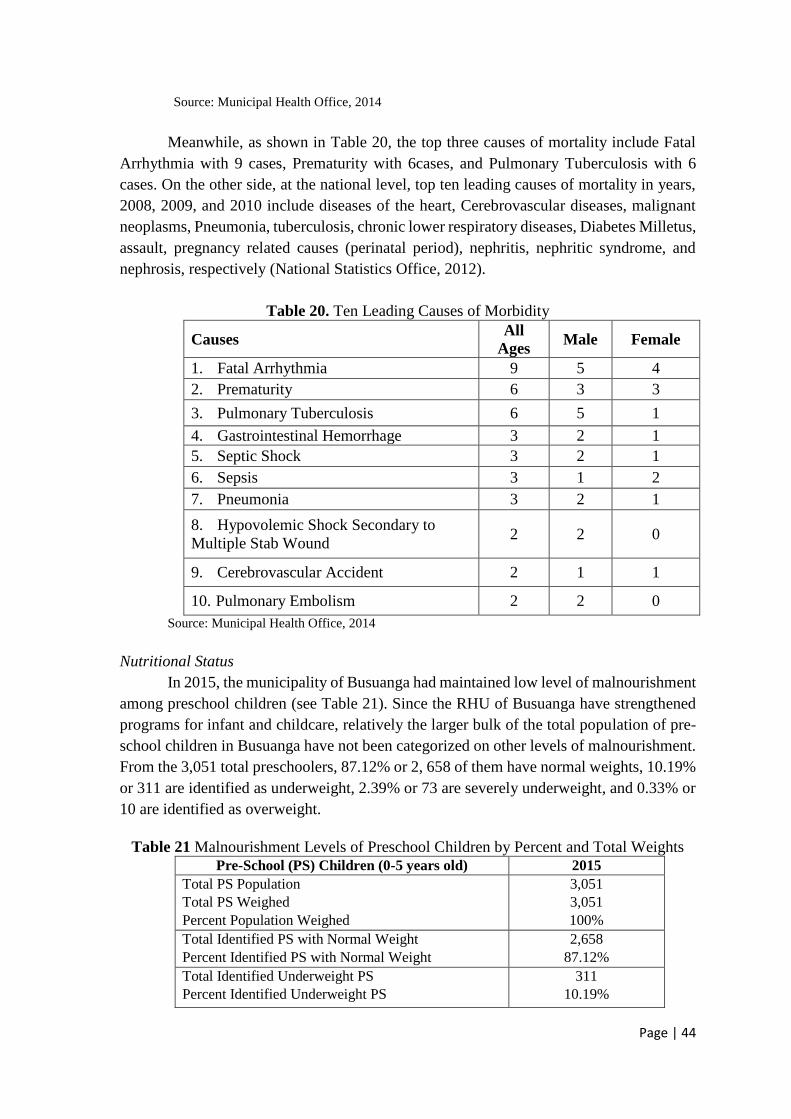
Page | 44
Source: Municipal Health Office, 2014
Meanwhile, as shown in Table 20, the top three causes of mortality include Fatal
Arrhythmia with 9 cases, Prematurity with 6cases, and Pulmonary Tuberculosis with 6
cases. On the other side, at the national level, top ten leading causes of mortality in years,
2008, 2009, and 2010 include diseases of the heart, Cerebrovascular diseases, malignant
neoplasms, Pneumonia, tuberculosis, chronic lower respiratory diseases, Diabetes Milletus,
assault, pregnancy related causes (perinatal period), nephritis, nephritic syndrome, and
nephrosis, respectively (National Statistics Office, 2012).
Table 20. Ten Leading Causes of Morbidity
Causes All
Ages Male Female
1. Fatal Arrhythmia 9 5 4
2. Prematurity 6 3 3
3. Pulmonary Tuberculosis 6 5 1
4. Gastrointestinal Hemorrhage 3 2 1
5. Septic Shock 3 2 1
6. Sepsis 3 1 2
7. Pneumonia 3 2 1
8. Hypovolemic Shock Secondary to
Multiple Stab Wound 2 2 0
9. Cerebrovascular Accident 2 1 1
10. Pulmonary Embolism 2 2 0
Source: Municipal Health Office, 2014
Nutritional Status
In 2015, the municipality of Busuanga had maintained low level of malnourishment
among preschool children (see Table 21). Since the RHU of Busuanga have strengthened
programs for infant and childcare, relatively the larger bulk of the total population of pre-
school children in Busuanga have not been categorized on other levels of malnourishment.
From the 3,051 total preschoolers, 87.12% or 2, 658 of them have normal weights, 10.19%
or 311 are identified as underweight, 2.39% or 73 are severely underweight, and 0.33% or
10 are identified as overweight.
Table 21 Malnourishment Levels of Preschool Children by Percent and Total Weights
Pre-School (PS) Children (0-5 years old) 2015
Total PS Population
Total PS Weighed
Percent Population Weighed
3,051
3,051
100%
Total Identified PS with Normal Weight
Percent Identified PS with Normal Weight
2,658
87.12%
Total Identified Underweight PS
Percent Identified Underweight PS
311
10.19%

Page | 45
Pre-School (PS) Children (0-5 years old) 2015
Total Identified Severely Underweight PS
Percent Identified Severely Underweight PS
73
2.39%
Total Identified Overweight PS
Percent Identified Overweight PS
10
0.33%
Source: Municipal Health Office, 2014
Live Births, Deaths, Rate of Natural Increase, Infant Deaths and Maternal Deaths
In the year 2014, the estimated population according to the Municipal Health Office
was 23,793 with 436 recorded live births, 90 deaths, 13 infant deaths, and 1 maternal death.
The municipality of Busuanga has a Crude Birth Rate of 18.32, it means that for every 1000
population, approximately 18 births have been delivered. The Crude Death Rate, on the
other hand is 3.78 which means that there are about 3 to 4 deaths for every 1000 population.
The Rate of Natural Increase is the rate of the increase of population in a
municipality and is computed by getting the difference between the Crude Birth Rate and
Crude Death Rate. Busuanga’s Rate of Natural Increase is 14.54. It means that there is an
increase by 14 to 15 in the population for every 1,000 people. Moreover, Busuanga’s infant
mortality rate is 0.55 and its maternal mortality rate is 0.04. With the rate of natural increase
and the low Crude Death Rate, the municipality’s population will continue to increase in
number.
Family Planning Services
According to the FHSIS (Field Health Service Information System) Report of
Busuanga, Palawan (2014), different family planning methods were adopted by a number
of residents in the municipality. As of 2014, the top three family planning methods used in
Busuanga are pills, female sterilizers, and Natural Family Planning- Lactational
Amenorrhea Method or NFP-LAM. There is a total of 533 users of pills, 405 users of female
sterilizers, and 263 users of NFP-LAM. Among others, the residents of Busuanga also use
injectables (95), male sterilizers (16), condoms (25), Natural Family Planning Method-
Standard Days Method or NFP-SDM (5) and Intrauterine Devices or IUDs (95). It can be
seen that still few number use family planning methods, as these are reflected on the
municipality’s large portion of the young population.
2.8. Education
Literacy
More than half of Busuanga’s population are literate or has the ability to read and
write. From 2014’s total population of people whose age are 10 years and above, 97.78%
or 13, 704 are literate. It can also be noted that there are more literate men than women in
Busuanga, Palawan since their population is higher than those of the women. Panlaitan and
Maglalambay have the highest literacy rate in Busuanga with 99.35 % or 1,993 and 919
respectively. From the data gathered, it can be implied that the presence of elementary and
secondary schools in the barangays plays a huge role in achieving high literacy rate in the
municipality. Table 22 shows the literacy rate in the Busuanga, Palawan.
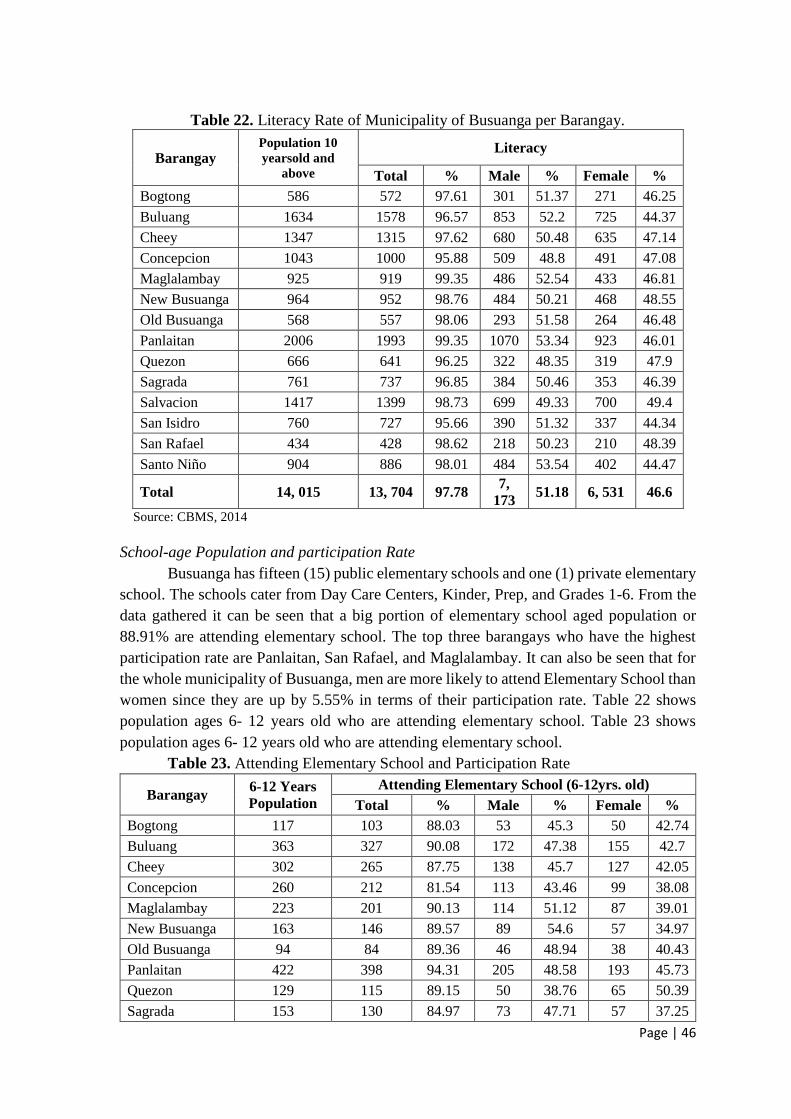
Page | 46
Table 22. Literacy Rate of Municipality of Busuanga per Barangay.
Barangay Population 10
yearsold and
above
Literacy
Total % Male % Female %
Bogtong 586 572 97.61 301 51.37 271 46.25
Buluang 1634 1578 96.57 853 52.2 725 44.37
Cheey 1347 1315 97.62 680 50.48 635 47.14
Concepcion 1043 1000 95.88 509 48.8 491 47.08
Maglalambay 925 919 99.35 486 52.54 433 46.81
New Busuanga 964 952 98.76 484 50.21 468 48.55
Old Busuanga 568 557 98.06 293 51.58 264 46.48
Panlaitan 2006 1993 99.35 1070 53.34 923 46.01
Quezon 666 641 96.25 322 48.35 319 47.9
Sagrada 761 737 96.85 384 50.46 353 46.39
Salvacion 1417 1399 98.73 699 49.33 700 49.4
San Isidro 760 727 95.66 390 51.32 337 44.34
San Rafael 434 428 98.62 218 50.23 210 48.39
Santo Niño 904 886 98.01 484 53.54 402 44.47
Total 14, 015 13, 704 97.78 7,
173 51.18 6, 531 46.6
Source: CBMS, 2014
School-age Population and participation Rate
Busuanga has fifteen (15) public elementary schools and one (1) private elementary
school. The schools cater from Day Care Centers, Kinder, Prep, and Grades 1-6. From the
data gathered it can be seen that a big portion of elementary school aged population or
88.91% are attending elementary school. The top three barangays who have the highest
participation rate are Panlaitan, San Rafael, and Maglalambay. It can also be seen that for
the whole municipality of Busuanga, men are more likely to attend Elementary School than
women since they are up by 5.55% in terms of their participation rate. Table 22 shows
population ages 6- 12 years old who are attending elementary school. Table 23 shows
population ages 6- 12 years old who are attending elementary school.
Table 23. Attending Elementary School and Participation Rate
Barangay 6-12 Years
Population
Attending Elementary School (6-12yrs. old)
Total % Male % Female %
Bogtong 117 103 88.03 53 45.3 50 42.74
Buluang 363 327 90.08 172 47.38 155 42.7
Cheey 302 265 87.75 138 45.7 127 42.05
Concepcion 260 212 81.54 113 43.46 99 38.08
Maglalambay 223 201 90.13 114 51.12 87 39.01
New Busuanga 163 146 89.57 89 54.6 57 34.97
Old Busuanga 94 84 89.36 46 48.94 38 40.43
Panlaitan 422 398 94.31 205 48.58 193 45.73
Quezon 129 115 89.15 50 38.76 65 50.39
Sagrada 153 130 84.97 73 47.71 57 37.25

Page | 47
Barangay 6-12 Years
Population
Attending Elementary School (6-12yrs. old)
Total % Male % Female %
Salvacion 243 212 87.24 125 51.44 87 35.8
San Isidro 154 138 89.61 74 48.05 64 41.56
San Rafael 77 71 92.21 37 48.05 34 44.16
Santo Niño 167 147 88.02 65 38.92 82 49.1
Total 2, 867 2, 549 88.91 1, 354 47.23 1,195 41.68
Source: CBMS, 2014
At the secondary level, it can be observed that 1, 054 out of the 1, 812 or 58.17%
aged population attend secondary school. The attending secondary school population is less
than that of the attending elementary school population. A possible reason for such is that
some of them are working to earn income and fulfill the needs of their family. It is also
noted that at the secondary school, there are more women than men but by a little
percentage only.
Table 24. Attending Elementary School and Participation Rate
Barangay
13-16 Years
Old
Population
Attending Secondary School (13-16yrs. old)
Total % Male % Female %
Bogtong 88 45 51.14 20 22.73 25 28.41
Buluang 218 138 63.3 61 27.98 77 35.32
Cheey 169 78 46.15 33 19.53 45 26.63
Concepcion 140 88 62.86 48 34.29 40 28.57
Maglalambay 133 83 62.41 43 32.33 40 30.08
New Busuanga 129 63 48.84 30 23.26 33 25.58
Old Busuanga 58 40 68.97 19 32.76 21 36.21
Panlaitan 238 151 63.45 86 36.13 65 27.31
Quezon 91 53 58.24 17 18.68 36 39.56
Sagrada 107 65 60.75 36 33.64 29 27.1
Salvacion 151 107 70.86 55 36.42 52 34.44
San Isidro 101 44 43.56 20 19.8 24 23.76
San Rafael 53 27 50.94 16 30.19 11 20.75
Santo Niño 136 72 52.94 41 30.15 31 22.79
Total 1,812 1, 054 58.17 525 28.97 529 29.19
Source: CBMS, 2014
2.9. Housing
Type of Housing Units
As shown in Table 25, most of the residents in Busuanga live in single house units.
There are very few duplex, apartment/condominium/townhouse units in the area, which can
be a factor in the progress of tourism in the municipality. Having such low units would
mean few accommodations for tourists, thus would result in low probability of having an
increase in the rate of tourism in the municipality.
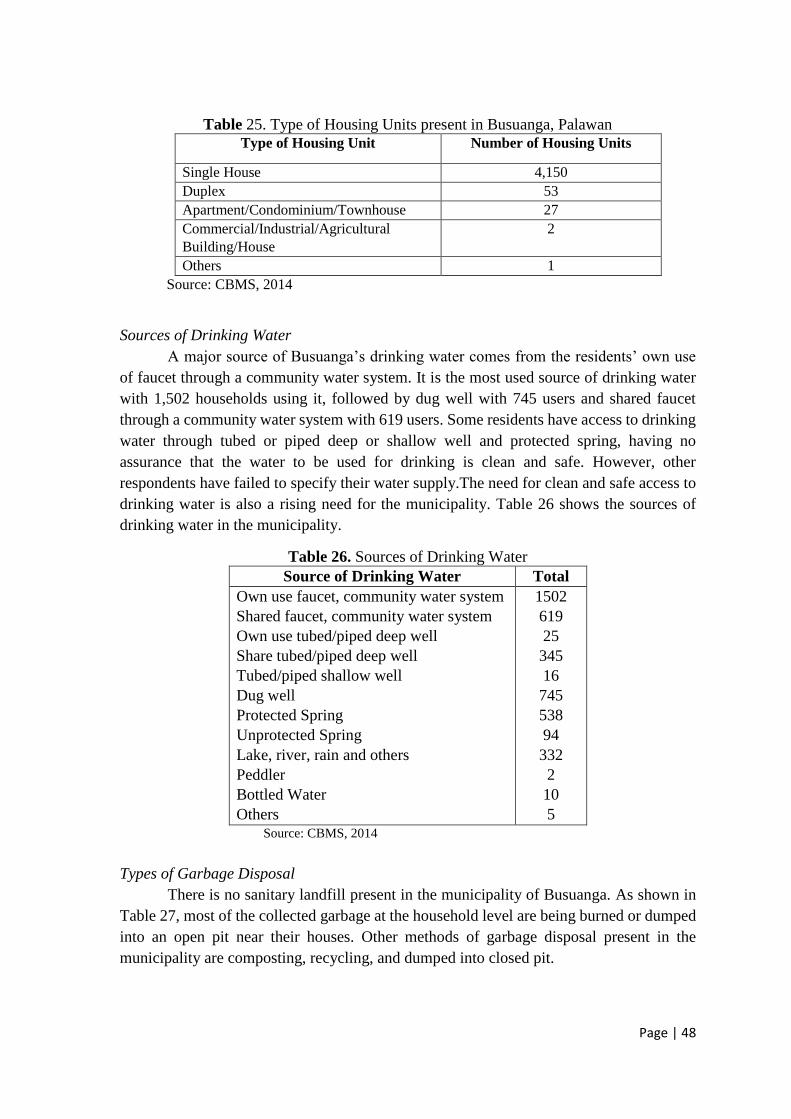
Page | 48
Table 25. Type of Housing Units present in Busuanga, Palawan
Type of Housing Unit Number of Housing Units
Single House 4,150
Duplex 53
Apartment/Condominium/Townhouse 27
Commercial/Industrial/Agricultural
Building/House
2
Others 1
Source: CBMS, 2014
Sources of Drinking Water
A major source of Busuanga’s drinking water comes from the residents’ own use
of faucet through a community water system. It is the most used source of drinking water
with 1,502 households using it, followed by dug well with 745 users and shared faucet
through a community water system with 619 users. Some residents have access to drinking
water through tubed or piped deep or shallow well and protected spring, having no
assurance that the water to be used for drinking is clean and safe. However, other
respondents have failed to specify their water supply.The need for clean and safe access to
drinking water is also a rising need for the municipality. Table 26 shows the sources of
drinking water in the municipality.
Table 26. Sources of Drinking Water
Source of Drinking Water Total
Own use faucet, community water system
Shared faucet, community water system
Own use tubed/piped deep well
Share tubed/piped deep well
Tubed/piped shallow well
Dug well
Protected Spring
Unprotected Spring
Lake, river, rain and others
Peddler
Bottled Water
Others
1502
619
25
345
16
745
538
94
332
2
10
5 Source: CBMS, 2014
Types of Garbage Disposal
There is no sanitary landfill present in the municipality of Busuanga. As shown in
Table 27, most of the collected garbage at the household level are being burned or dumped
into an open pit near their houses. Other methods of garbage disposal present in the
municipality are composting, recycling, and dumped into closed pit.

Page | 49
Table 27. Types of Garbage Present in Busuanga, Palawan
Type of Garbage Disposal Total
Collected
Burned
Composted
Recycled
Segregated
Dumped to Close Pit
Dumped to Open Pit
Other Waste Management
321
3896
447
194
188
270
948
11
Source: CBMS, 2014
2.10. Employment
Table 28 shows the employment rate in the municipality. Majority of the members
of the labor force or 5,022 (91.84%) are currently employed. It can be seen that Cheey has
the most employed members of the labor force with 97.12% of its labor force population,
followed by Salvacion with 96.25% or 616 of its labor force members. Employment is
abundant in the municipality since it promotes ecotourism, needs people to run and manage
parks, resorts, and other establishments.
Table 28. Employment Rate of Busuanga, Palawan
Barangay
Members of the labor
Force (15-64 yrs old)
Employed members of the labor Force (15-64
yrs old)
Total Male Female Total % Male % Female %
Bogtong 268 203 65 248 92.54 194 72.39 54 20.15
Buluang 798 588 210 747 93.61 568 71.18 179 22.43
Cheey 521 429 92 506 97.12 419 80.42 87 16.7
Concepcion 442 329 113 408 92.31 313 70.81 95 21.49
Maglalambay 344 293 51 293 85.17 259 75.29 34 9.88
New
Busuanga 216 152 64 182 84.26 135 62.5 47 21.76
Old
Busuanga 267 203 64 253 94.76 198 74.16 55 20.6
Panlaitan 740 641 99 657 88.78 584 78.92 73 9.86
Quezon 276 208 68 239 86.59 178 64.49 61 22.1
Sagrada 246 199 47 229 93.09 185 75.2 44 17.89
Salvacion 640 458 182 616 96.25 445 69.53 171 26.72
San Isidro 131 78 53 114 87.02 72 54.96 42 32.06
San Rafael 178 139 39 158 88.76 125 70.22 33 18.54
Sto. Nino 401 314 87 372 92.77 288 71.82 84 20.95
Total 5, 468 4,
239 1, 234 5,022 91.84 3,963 72.48 1,059 19.37

Page | 50
2.11. Recreation and Tourism
Busuanga is an abundant source of natural sceneries, white sand beaches, resorts,
and sanctuaries that is worthy to be known for not only at the national level, but also on a
global scale. Most of the municipality’s tourist spots are not just visited by local and
international tourists, but by the people of Busuanga as well. Table 29 shows the number
of tourism destinations present in Busuanga. Most of the tourist destinations present in
Busuanga are islands that can be visited through boat rentals and/or through island hopping.
Most of these islands and other tourist destinations are located in restricted use areas,
controlled use areas, and multiple use areas, validating that the establishment of these sites
are open to the public for recreation. However, some destinations are located in terrestrial
and coastal core zones, where very limited activities should be done in these areas.
Table 29. Tourist Destinations in the Municipality of Busuanga
Tourist Destinations Number of Sites
Parks and Marine Protected Area
Lakes/Bays
Islands
Hot Springs
Mountain/Jungle Trails
Falls/Rivers
Ranch
Dive Areas
Resorts
6
4
16
3
8
6
1
10
13
Source: Municipal Profile
2.12. Protective Services
Police Personnel and Types and Volumes of Crime
The Busuanga Municipal Police Station has a total of 20 police personnel and three
(3) Non Uniform Personnel. The roster is composed of one (1) police inspector (PINSP),
two (2) Senior Police Officer (SPO2), six (6 ) Police Officer 3 (PO3), three (3) Police
Officer 2 (PO2), eight (8) Police Officer 1 (PO1), and three (3) Non Uniform Personnel
(NUP). With the 2010 population of 21, 358, there is a police-population of 1:1,607. It
means that for every 1 police personnel, he/she should look after 1,607 individuals to ensure
the protection and security of the municipality. Comparing it to national standard of 1: 500
police- population ratio, it can be deduced that the municipality has to strengthen it’s
protective service.
The table below shows the type and number of crimes recorded in the municipality.
For the year 2015, there have been 134 cases of crime against persons and properties as
well cases resulting from reckless imprudence. Out of these cases, 123 or 91.79% have
already been cleared and solved.

Page | 51
Table 30. Recorded Types and Number of Crime in Busuanga, Palawan
Types of Crime Cases
Against Persons
Homicide
Physical Injury
Rape
1
34
1
Against Property
Robbery
Theft
2
2
Reckless Imprudence Resulting to (RIR)
RIR Homicide
RIR Physical Injury
2
2
Violation of Special Laws 8
Others 82
Total Crime Volume
Total Crimes Cleared/ Solved
Average Monthly Crime Rate
134
123
26.42%
Source: Busuanga Municipal Police Station
Firefighting Personnel and Facilities
The Municipal Fire Prevention Office (MFPO) is composed of one (1) Fire Officer
2, and two (2) Fire Officer 1. Each firefighting personnel has several designations and
responsibilities in the MFPO, showing that there is a need for more people to administer
and manage the office. It should be headed by a chief who shall be assisted by two deputy
chiefs, one for administration and one for operations, as stated in the Republic Act 9263 or
the Bureau of Fire Protection and Bureau of Jail Management and Penology
Professionalization Act of 2004.
The facilities of the MFPO suit the needed uniform and facilities for the personnel.
The facilities consist of a fire truck, two (2) fire coats, 5 (5) pairs of boots, three (3) mallets,
two (2) 1.5 diameter and one (1) 2.5 diameter fire hose, and three (3) fire nozzles.
3. Economic
3.1. The primary sector
The five main crop produce of the Province of Palawan are rice, corn, cashew,
coconut, and mango (PAO, 2012). Aside from food crops, oil palms and rubber plantations
started in the province in 2007 and 1990 respectively in which the areas devoted for oil
palms lies on the southern part of Palawan, while the first rubber plantation is situated in
Barangay Quezon (PCSDS, 2015). Agriculture is one of the primary sectors which provide
opportunities for employment for almost 53% of the Municipality of Busuanga (PCSDS,
2006).
Agricultural croplands

Page | 52
The Municipality of Busuanga, Palawan has devoted a large portion of their lands
for agriculture.
Table 31. A table showing the total land area and total agricultural area
of the municipality of Busuanga, Palawan
Barangay Total Land
Area (Ha.)
Total Agricultur
al Area (Ha.)
Percentage of
Agricultural
Land
Sto. Nino 3, 355.1 194.1 5.79%
Concepcion 1,377.3 13.7 0.99%
Sagrada 3,282.0 135.0 4.11%
Bogtong 2,902.3 55.3 1.91%
Salvacion 2, 947.5 115.3 3.91%
Old Busuanga 2, 265.8 193.7 8.55%
San Rafael 2, 336.9 41.2 1.76%
New Busuanga 3, 150.4 147.3 4.68%
Buluang 1, 950.0 124.2 6.37%
Quezon 1765.0 113.4 6.42%
Cheey 13, 117.1 530.0 4.04%
San isidro 427.5 1.6 0.37%
Panlaitan 220.4 0.5 0.23%
Maglalambay 409.8 0.9 0.22%
Total 42, 681.6 1, 773.3 49.35% Source: PCSD, MAO
Cheey has the largest area devoted for agricultural production measuring 530
hectares. The large area of the multiple use zone can be attributed to the lands devoted for
agricultural production. Thus, this is the reason why Cheey contributes a large portion in
the agricultural production of the municipality of Busuanga, Palawan.
Agricultural Crops
The Municipality of Busuanga, have the following crops produced: rice, corn,
mango, banana, coconut, cassava, kamote, and ube. However, though there are production
of these various crops, there are still times that the municipality resort to importation to
satisfy their demand. The major agricultural crops produced in the municipality are rice
and corn.
At the provincial level, the increase in the production of agricultural crops can be
attributed to additional areas devoted for agriculture (from 94, 749 ha in 1990 to 210, 766
ha in 2013 (PSA, 2015)).
Table 32. Rice production per barangay of the municipality of Busuanga, Palawan
Barangay Harvest Area (Ha) Production (MT)
1. Cheey 1275.75 548.68
2. Sto. Niño 52.25 153.4
3. Buluang 45.25 137.1
Source: MAO, 2011
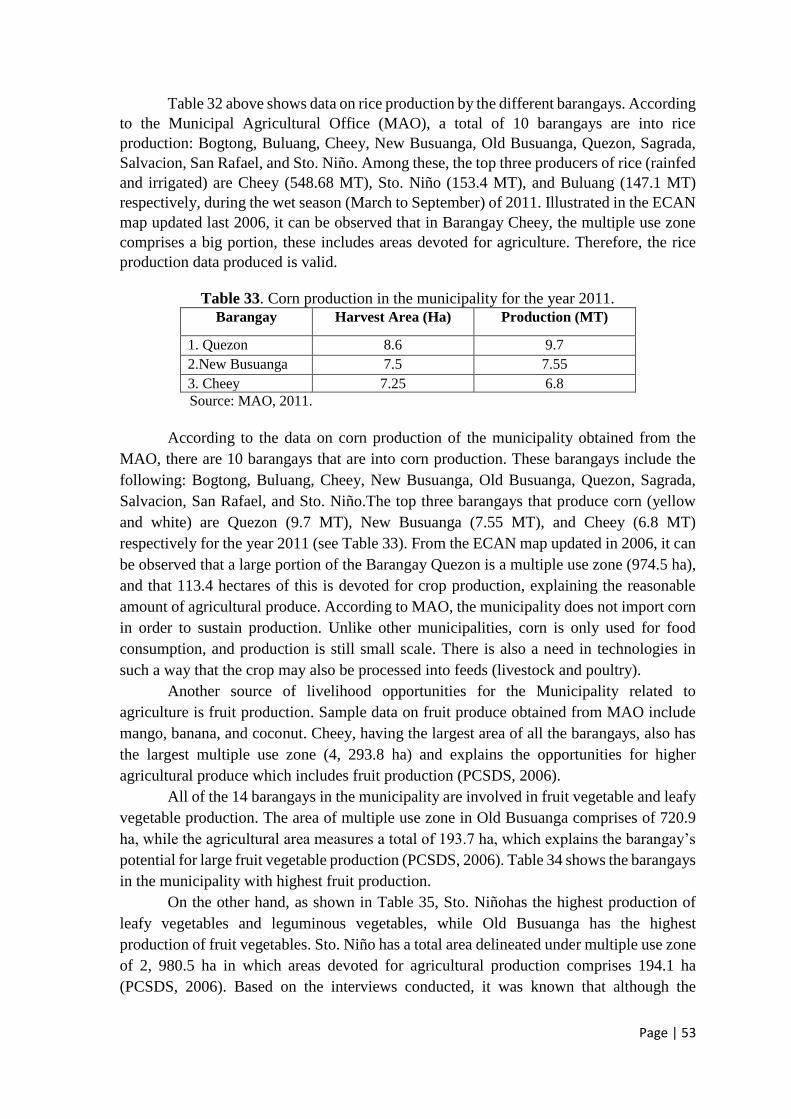
Page | 53
Table 32 above shows data on rice production by the different barangays. According
to the Municipal Agricultural Office (MAO), a total of 10 barangays are into rice
production: Bogtong, Buluang, Cheey, New Busuanga, Old Busuanga, Quezon, Sagrada,
Salvacion, San Rafael, and Sto. Niño. Among these, the top three producers of rice (rainfed
and irrigated) are Cheey (548.68 MT), Sto. Niño (153.4 MT), and Buluang (147.1 MT)
respectively, during the wet season (March to September) of 2011. Illustrated in the ECAN
map updated last 2006, it can be observed that in Barangay Cheey, the multiple use zone
comprises a big portion, these includes areas devoted for agriculture. Therefore, the rice
production data produced is valid.
Table 33. Corn production in the municipality for the year 2011.
Barangay Harvest Area (Ha) Production (MT)
1. Quezon 8.6 9.7
2.New Busuanga 7.5 7.55
3. Cheey 7.25 6.8
Source: MAO, 2011.
According to the data on corn production of the municipality obtained from the
MAO, there are 10 barangays that are into corn production. These barangays include the
following: Bogtong, Buluang, Cheey, New Busuanga, Old Busuanga, Quezon, Sagrada,
Salvacion, San Rafael, and Sto. Niño.The top three barangays that produce corn (yellow
and white) are Quezon (9.7 MT), New Busuanga (7.55 MT), and Cheey (6.8 MT)
respectively for the year 2011 (see Table 33). From the ECAN map updated in 2006, it can
be observed that a large portion of the Barangay Quezon is a multiple use zone (974.5 ha),
and that 113.4 hectares of this is devoted for crop production, explaining the reasonable
amount of agricultural produce. According to MAO, the municipality does not import corn
in order to sustain production. Unlike other municipalities, corn is only used for food
consumption, and production is still small scale. There is also a need in technologies in
such a way that the crop may also be processed into feeds (livestock and poultry).
Another source of livelihood opportunities for the Municipality related to
agriculture is fruit production. Sample data on fruit produce obtained from MAO include
mango, banana, and coconut. Cheey, having the largest area of all the barangays, also has
the largest multiple use zone (4, 293.8 ha) and explains the opportunities for higher
agricultural produce which includes fruit production (PCSDS, 2006).
All of the 14 barangays in the municipality are involved in fruit vegetable and leafy
vegetable production. The area of multiple use zone in Old Busuanga comprises of 720.9
ha, while the agricultural area measures a total of 193.7 ha, which explains the barangay’s
potential for large fruit vegetable production (PCSDS, 2006). Table 34 shows the barangays
in the municipality with highest fruit production.
On the other hand, as shown in Table 35, Sto. Niñohas the highest production of
leafy vegetables and leguminous vegetables, while Old Busuanga has the highest
production of fruit vegetables. Sto. Niño has a total area delineated under multiple use zone
of 2, 980.5 ha in which areas devoted for agricultural production comprises 194.1 ha
(PCSDS, 2006). Based on the interviews conducted, it was known that although the

Page | 54
Municipality have lands devoted for agriculture, some vegetable products are exported to
the municipality of Coron such as eggplant, squash, okra and sitaw.
Table 34. Production and top producers of mango, banana, and coconut in the
municipality for 2011.
Mango Banana Coconut
Barang
ay
Total
area
harvest
ed (Ha)
Total
producti
on (MT)
Barang
ay
Total
area
harvest
ed (Ha)
Total
producti
on (MT)
Barang
ay
Total
area
harvest
ed (Ha)
Total
producti
on (MT)
1.
Cheey
3.0 60 1.
Cheey
5.0 60 1. San
Rafael
5.0 3.5
2.
Sagrada
1.0 9.7 2. San
Rafael
2.0 25 2.
Cheey
3.0 3
3.
Salvaci
on
3.0 7.55 3.
Salvaci
on
2.0 24 3. New
Busuan
ga
2.5 3
Source: MAO, 2011
Table 35. A table showing the vegetable production of the municipality in 2011
Fruit vegetables Leafy vegetables Leguminous vegetables
Barang
ay
Total
area
harvest
ed (Ha)
Total
producti
on (MT)
Barang
ay
Total
area
harvest
ed (Ha)
Total
producti
on (MT)
Baranga
y
Total
area
harvest
ed (Ha)
Total
producti
on (MT)
1. Old
Busuan
ga
2.0 15 1. Sto.
Niño
4 20 1. Sto.
Niño
1.5 7.5
2. Sto.
Niño
2.0 15 2. Old
Busuan
ga
1 7.5 2.Bulua
ng
1 5
3. New
Busuan
ga
2.0 7.5 3.
Buluan
g
1 5.0 3. San
Rafael
0.5 3
3.
Cheey
1 7.5 3.
Sagrada
1 5.0
Source: MAO, 2011.
Table 36. A table showing the cassava production of the municipality in 2011.
Barangay Total area harvested (Ha) Total production (MT)
1.Quezon 5.6 364
2.Cheey 4.8 336
3.New Busuanga 4.25 297.5
Source: MAO, 2011.
According to the data obtained from the MAO, 11 barangays are into root crop
production where cassava as the major produced. As shown in Table 36, the top three
barangays with the highest cassava production are Quezon (364 MT), Cheey (336 MT),
and New Busuanga (297.5 MT). Other root crops produced in the municipality include
kamote and ube but there is no significant production data on these.
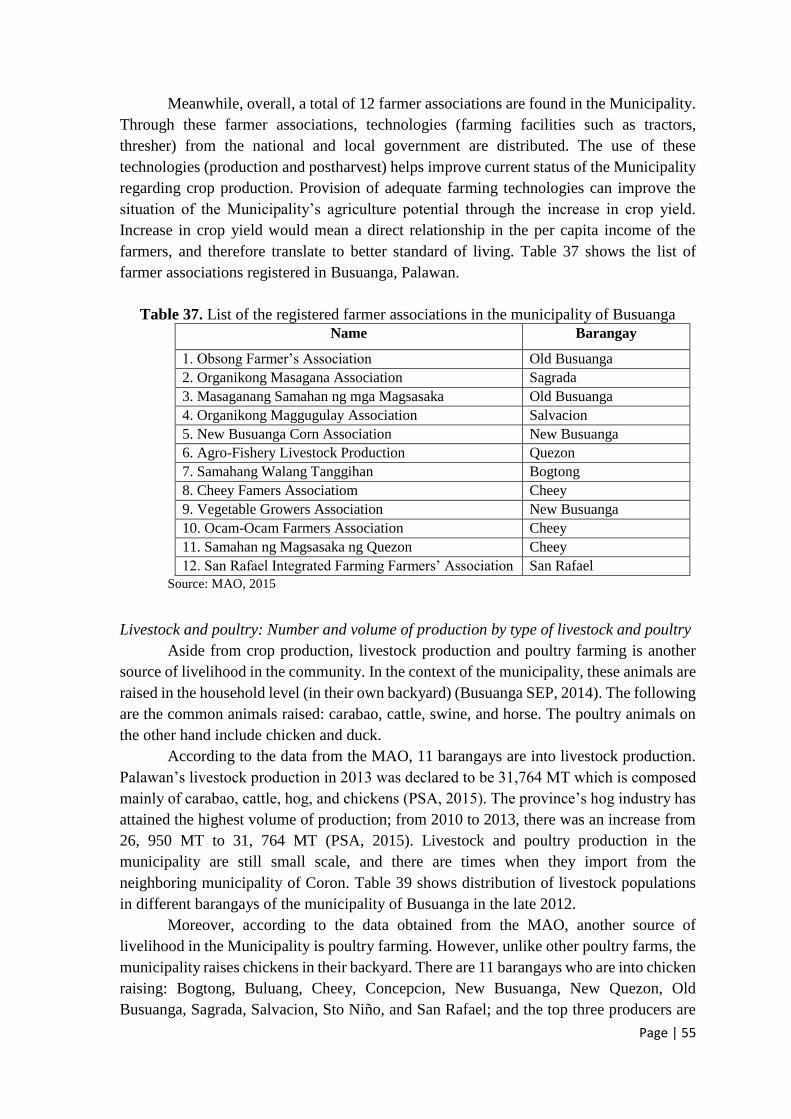
Page | 55
Meanwhile, overall, a total of 12 farmer associations are found in the Municipality.
Through these farmer associations, technologies (farming facilities such as tractors,
thresher) from the national and local government are distributed. The use of these
technologies (production and postharvest) helps improve current status of the Municipality
regarding crop production. Provision of adequate farming technologies can improve the
situation of the Municipality’s agriculture potential through the increase in crop yield.
Increase in crop yield would mean a direct relationship in the per capita income of the
farmers, and therefore translate to better standard of living. Table 37 shows the list of
farmer associations registered in Busuanga, Palawan.
Table 37. List of the registered farmer associations in the municipality of Busuanga
Name Barangay
1. Obsong Farmer’s Association Old Busuanga
2. Organikong Masagana Association Sagrada
3. Masaganang Samahan ng mga Magsasaka Old Busuanga
4. Organikong Maggugulay Association Salvacion
5. New Busuanga Corn Association New Busuanga
6. Agro-Fishery Livestock Production Quezon
7. Samahang Walang Tanggihan Bogtong
8. Cheey Famers Associatiom Cheey
9. Vegetable Growers Association New Busuanga
10. Ocam-Ocam Farmers Association Cheey
11. Samahan ng Magsasaka ng Quezon Cheey
12. San Rafael Integrated Farming Farmers’ Association San Rafael
Source: MAO, 2015
Livestock and poultry: Number and volume of production by type of livestock and poultry
Aside from crop production, livestock production and poultry farming is another
source of livelihood in the community. In the context of the municipality, these animals are
raised in the household level (in their own backyard) (Busuanga SEP, 2014). The following
are the common animals raised: carabao, cattle, swine, and horse. The poultry animals on
the other hand include chicken and duck.
According to the data from the MAO, 11 barangays are into livestock production.
Palawan’s livestock production in 2013 was declared to be 31,764 MT which is composed
mainly of carabao, cattle, hog, and chickens (PSA, 2015). The province’s hog industry has
attained the highest volume of production; from 2010 to 2013, there was an increase from
26, 950 MT to 31, 764 MT (PSA, 2015). Livestock and poultry production in the
municipality are still small scale, and there are times when they import from the
neighboring municipality of Coron. Table 39 shows distribution of livestock populations
in different barangays of the municipality of Busuanga in the late 2012.
Moreover, according to the data obtained from the MAO, another source of
livelihood in the Municipality is poultry farming. However, unlike other poultry farms, the
municipality raises chickens in their backyard. There are 11 barangays who are into chicken
raising: Bogtong, Buluang, Cheey, Concepcion, New Busuanga, New Quezon, Old
Busuanga, Sagrada, Salvacion, Sto Niño, and San Rafael; and the top three producers are

Page | 56
the following: Cheey (1600), New Busuanga (1580), and Salvacion (750). The table below
shows chicken populations in the top three barangays with highest poultry production in
2012.
Table 38. Chicken populations in the top three barangays with the highest produce in
2012.
Barangay Total (Quantity)
1. Cheey 1600
2. New Busuanga 1580
3. Salvacion 750
Source: MAO, 2012
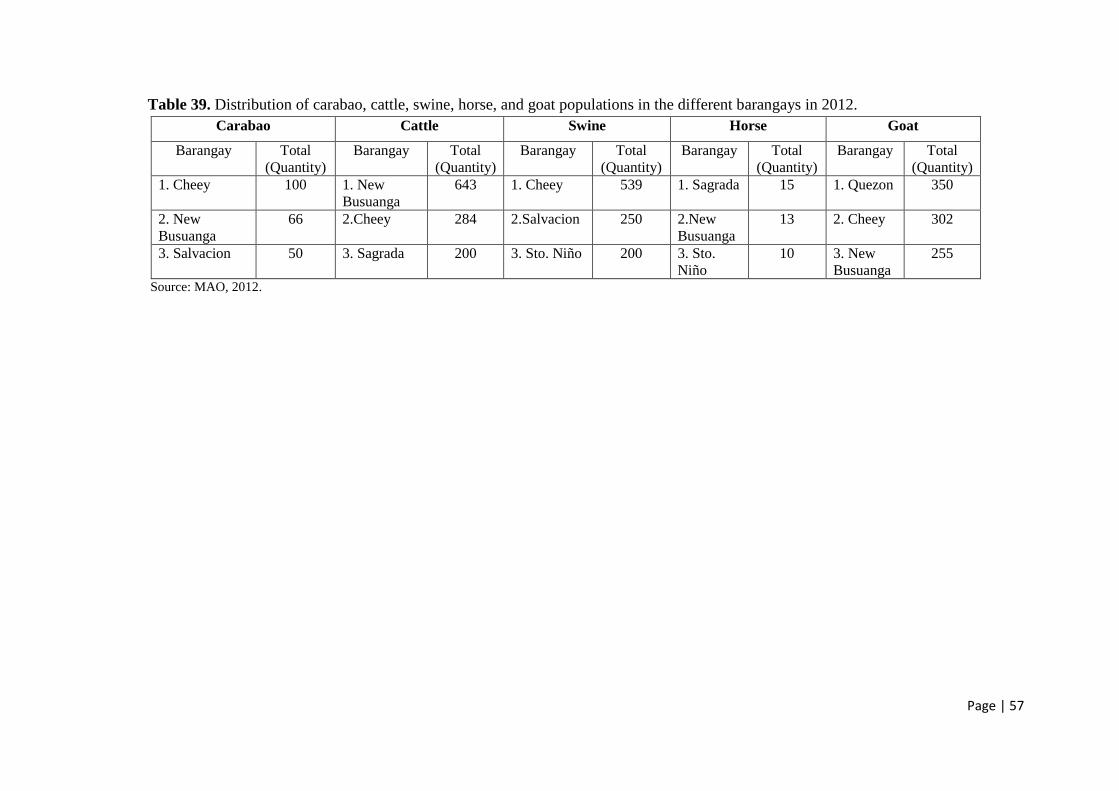
Page | 57
Table 39. Distribution of carabao, cattle, swine, horse, and goat populations in the different barangays in 2012.
Carabao Cattle Swine Horse Goat
Barangay Total
(Quantity)
Barangay Total
(Quantity)
Barangay Total
(Quantity)
Barangay Total
(Quantity)
Barangay Total
(Quantity)
1. Cheey 100 1. New
Busuanga
643 1. Cheey 539 1. Sagrada 15 1. Quezon 350
2. New
Busuanga
66 2.Cheey 284 2.Salvacion 250 2.New
Busuanga
13 2. Cheey 302
3. Salvacion 50 3. Sagrada 200 3. Sto. Niño 200 3. Sto.
Niño
10 3. New
Busuanga
255
Source: MAO, 2012.

Page | 58
Fisheries: Municipal fisheries
According to the data obtained from the MAO, all of the 14 barangays in the
municipality are engaged in fishing as one of their major source of livelihood. The top three
barangays that have the highest fisheries production are: Panlaitan (135 MT), Buluang (125
MT), and Maglalambay (123 MT).
Table 40. Fish production in the municipal waters of Busuanga, Palawan.
Barangay Total production (MT)
1. Panlaitan 135
2. Buluan 125
3. Malalambay 123
Source: MAO, 2011
One problem discovered by the team through the conduct of interviews is the
encroachment of commercial fishing vessels in Busuanga’s municipal waters. It inflicts
competition to the small fisherfolks of the community because these large vessels also make
use of large nets for catching fish. When these vessels catch fish in the mid sea, tendencies
are less volume of fish will be caught by the small fishermen because a large volume has
already been caught.
A total of 12 registered fisherfolk associations are located in the Municipality (see
Table 41). From the 14 barangays, only 10 have at least one registered fisherfolk
association.
According to the fisherfolks, one of the tasks of their associations is the protection
of the Municipality’s marine resources through the establishment of a monitoring
mechanism most commonly known as “bantay-dagat”. Members of these associations take
shift work in fulfilling the responsibility of protecting their barangay boundaries, but their
lives are often threatened by their work (monitoring violators in the Municipal waters).
Table 41. List of registered fisherfolk associations in the Municipality of Palawan.
Name Barangay
1. San Isidro Fisherfolks Association San Isidro
2. Samahan ng Kababaihan Surigao Panlaitan Association Panlaitan
3. Busuanga Flasdep Corp. Old Busuanga
4. Concepcion Fisherfolks’ Association Concepcion
5. Salvacion Small Fisherman Association New Busuanga
6. Samahan ng Mangingisda ng Bgy. Bogtong Bogtong
7. Daiat Seaweeds Farmer Association Cheey
8. Samahan ng mga Mangingisda Salvacion
9. Ocam-Ocam Agro Fisheries Association New Busuanga
10. Samahan ng mga Magsasaka, Mangingisda, Magtatambalang Buluang
11. Maglalambay Aqua culture Association Maglalambay
12. Amaha and Alito Seaweed Farmers Association Cheey
Source: MAO, 2011

Page | 59
Agricultural support facilities: Production support facilities and Post-harvest facilities
According to the primary data gathered through Key Informant Interview (KII), the
technologies available to aid the farmers in crop production and postharvest, are the
following: mini tractors (7), thresher (3), four wheel tractor, Community-based composting
facility, flatbed dryer, rice mills, communal irrigation system (3). Some of these facilities
were provided by the national government and were given to farmer associations for them
to manage.
A problem regarding the request of these farming technologies relayed to the
practicum team was that the delivery of some of these was delayed for almost a year. Delay
of these machineries could result to negative effects to the community such as decrease in
crop yield that could lead to the decrease in the farmers’ monthly income.
3.2. The Secondary sector
Mining and Quarrying
As of 2016, according to the data obtained from the Licensing Office and Key
Informant Interview (KII), there is no occurrence of mining activities in the Municipality.
However, there are quarrying activities specifically located in Cheey and Salvacion.
Permits are issued by the municipality to legally perform the quarrying activities.
Gas
When it comes to the supply of gas in the Municipality, retail stores are usually the
source of the community. These are sourced out from the neighboring Municipality within
the island of Busuanga, Coron, and from Manila.
3.3. Tertiary sector
Wholesale and retail trade
According to the data obtained from the Licensing Office, here is the list of the
following registered wholesale and retail trade in the municipality in 2015: small retail
store, dealer of dry goods, general merchandise, gasoline retail store, Yakult dealer, poultry
feeds dealer, octopus dealer, MSK closet dealer, rice retailer, fish dealer, motorcycle dealer,
hog dealer, school supplies store, dealer of nipa and sawali, charcoal dealer, gravel and
sand dealer, and dealer of sea cucumber. The following establishments are distributed
among the 14 barangays of the Municipality. The consumer goods distributed are usually
sourced out from the neighboring Municipality of Coron, or from Manila and Baguio.
Personal services
The registered services present in the Municipality of Busuanga as of 2015 obtained
from the Licensing Office are restaurants, computer shops, cable TVs, billiard table, MSK
table and videoke machines. Most of the services present in the Municipality are provided
by dealers and these products usually come from Coron or Manila. These personal services
are usually situated in the proper, Salvacion. Although a list of these services is identified,
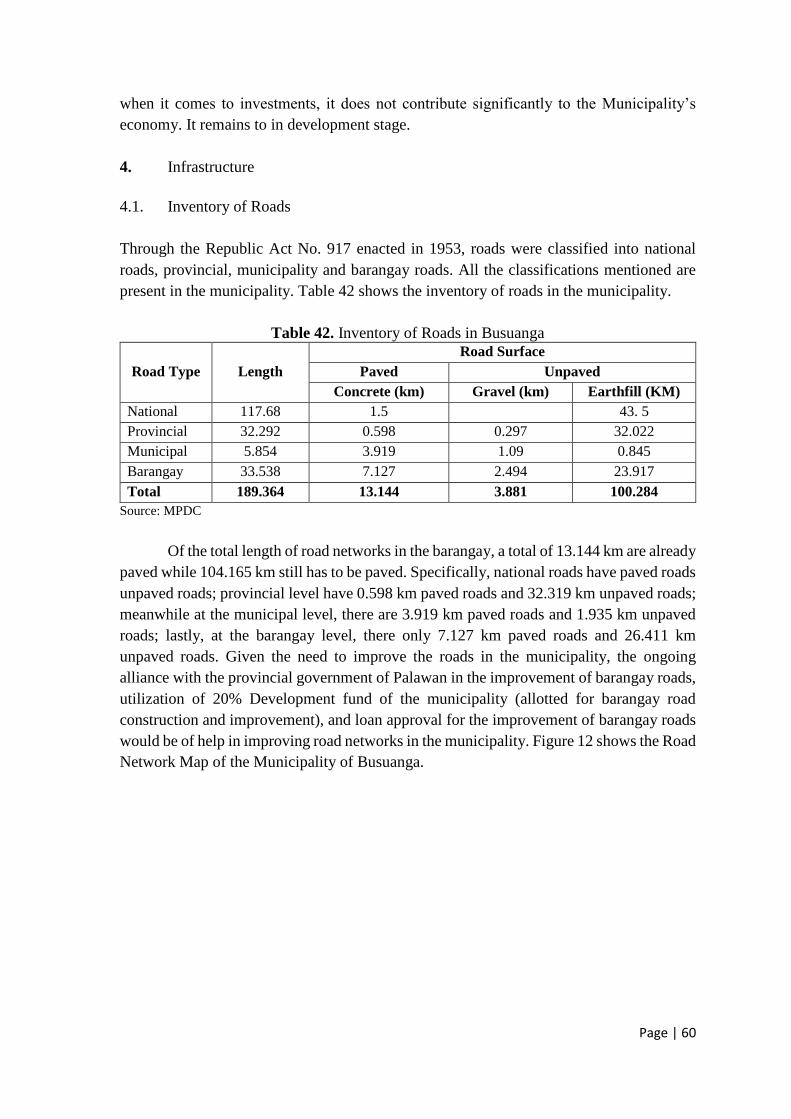
Page | 60
when it comes to investments, it does not contribute significantly to the Municipality’s
economy. It remains to in development stage.
4. Infrastructure
4.1. Inventory of Roads
Through the Republic Act No. 917 enacted in 1953, roads were classified into national
roads, provincial, municipality and barangay roads. All the classifications mentioned are
present in the municipality. Table 42 shows the inventory of roads in the municipality.
Table 42. Inventory of Roads in Busuanga
Road Type Length
Road Surface
Paved Unpaved
Concrete (km) Gravel (km) Earthfill (KM)
National 117.68 1.5 43. 5
Provincial 32.292 0.598 0.297 32.022
Municipal 5.854 3.919 1.09 0.845
Barangay 33.538 7.127 2.494 23.917
Total 189.364 13.144 3.881 100.284
Source: MPDC
Of the total length of road networks in the barangay, a total of 13.144 km are already
paved while 104.165 km still has to be paved. Specifically, national roads have paved roads
unpaved roads; provincial level have 0.598 km paved roads and 32.319 km unpaved roads;
meanwhile at the municipal level, there are 3.919 km paved roads and 1.935 km unpaved
roads; lastly, at the barangay level, there only 7.127 km paved roads and 26.411 km
unpaved roads. Given the need to improve the roads in the municipality, the ongoing
alliance with the provincial government of Palawan in the improvement of barangay roads,
utilization of 20% Development fund of the municipality (allotted for barangay road
construction and improvement), and loan approval for the improvement of barangay roads
would be of help in improving road networks in the municipality. Figure 12 shows the Road
Network Map of the Municipality of Busuanga.

Page | 61
Figure 12. Road Network Map of Busuanga Municipality

Page | 62
4.2. Inventory of Bridges
Bridges play a vital role in the transportation system since they are used as
passageway to go to places. The table below shows the inventory of bridges present in the
municipality, its length, and type of construction.
Table 43. Inventory of National Bridges by Classification, Location, Length and Type of
Construction in Busuanga, Palawan
Bridge Location Type Length (LM*)
Dipuiyai Bridge Brgy. Sto. Niño Bailey 36 LM
Mahiralan Bridge Brgy. Concepcion RCDG 18 LM
Tapiken Bridge Bgy. Sagrada RCDG 24 LM
Kiwit I Bridge -do- Timber Trestle 12 LM
Kiwit II Bridge -do- RCDG 18 LM
Domoyog Bridge Bgy. Bogtong -do- 12 LM
Bogtong Bridge -do- -do- 12 LM
Busuanga Bridge Bgy.Old Busuanga Steel 100 LM
Banaba Bridge -do- RCDG 36 LM
Concepcion Spillway -do- Concrete 12 LM
Malabnao Bridge Bgy. San Rafael Timber Trestle 12 LM
Lele Bridge Bgy. New Busuanga RCDG 24 LM
New Busuanga Bridge -do- Timber Trestle 12 LM
Buluang Bridge Bgy. Buluang -do- 18 LM
*LM= Load Models
There are a total of 18 bridges in the municipality of Busuanga. Most of the bridges
present in the municipality are classified as national bridges while 4 of which are provincial
bridges. Almost all of the barangays (8) in the municipality have a bridge in the area.
4.3. Water Supply
The water system in the municipality is being run by the Salvacion Busuanga Rural
Waterworks and Sanitation Association, Inc. It is the water district of the municipality
located at barangay Salvacion, the town proper of the municipality. Its main source of water
is the Lubao Spring. The water district is still operational in condition and the Level of the
distribution system still depends on the area. Specifically in Salvacion, the distribution
system is Level III while the other barangays have Level 1 and Level 2 water supply.
According to the MPDC (Pers. Com., 2016), the water supply of the municipality is still
underdeveloped and therefore can be further improved.
Page | 63
4.4 Electric Power Supply
San Isidro, Panlaitan, and Maglalambay, the three island barangays in the
municipality, obtain solar energy for electricity. Meanwhile, the other remaining barangays
are supplied with electricity by the Busuanga Island Electric Cooperative (BISELCO). This
semi-government company supplies electricity to both municipalities in Busuanga Island:
Coron and Busuanga. The source of the supplied electricity however is from the Calamian
Island Power Corporation (CIPC) which is privately owned. In fact, there had been
fluctuating supply of electricity in the municipality. Residents in the municipality resort
using some of the following; generator, solar panels, and rechargeable lights.
4.5 Transport Facilities
Since the Municipality of Busuanga is a third class municipality, transportation
system plays an important role in achieving its goals. There are two mode of transportation
wherein the municipality can be accessed: through land and water. The following are the
types of land transportation obtained from the Key Informant Interview (KII): FDG buses
(7) that are travelling from the municipality of Coron to the municipality of Busuanga and
vice versa; jeepney (1) that travels in Sto. Niño and Sagrada; motorcycle that are usually
privately owned and can be rented to travel to Calauit, the municipality of Coron, and to
the Francisco B. Reyes airport; and tricycles (33) which is the usual transportation service
availed by commuters in Salvacion, Bogtong, and the municipality of Coron.
On the other hand, water transportation services availed by the community is the
use of motor Bangka and Cargo Vessel. The motor Bangka is utilized to reach the island
barangays of the municipality and other beaches that serve as tourist destination.
4.6. Communication Facilities
For the services provided for communication in the municipality of Busuanga the
list are as follows: Smart cell site (1); Globe cell site (2); handheld radio that are used by
the NDRRMC; and internet services provided by Globe and Smart. Though these
communication facilities are relatively stable, these can still be further improved. When it
comes to communication providers such as Globe and Smart, an increase in the quality of
their services e.g. cellphone signal would be an advantage to further develop and promote
tourism of the municipality.
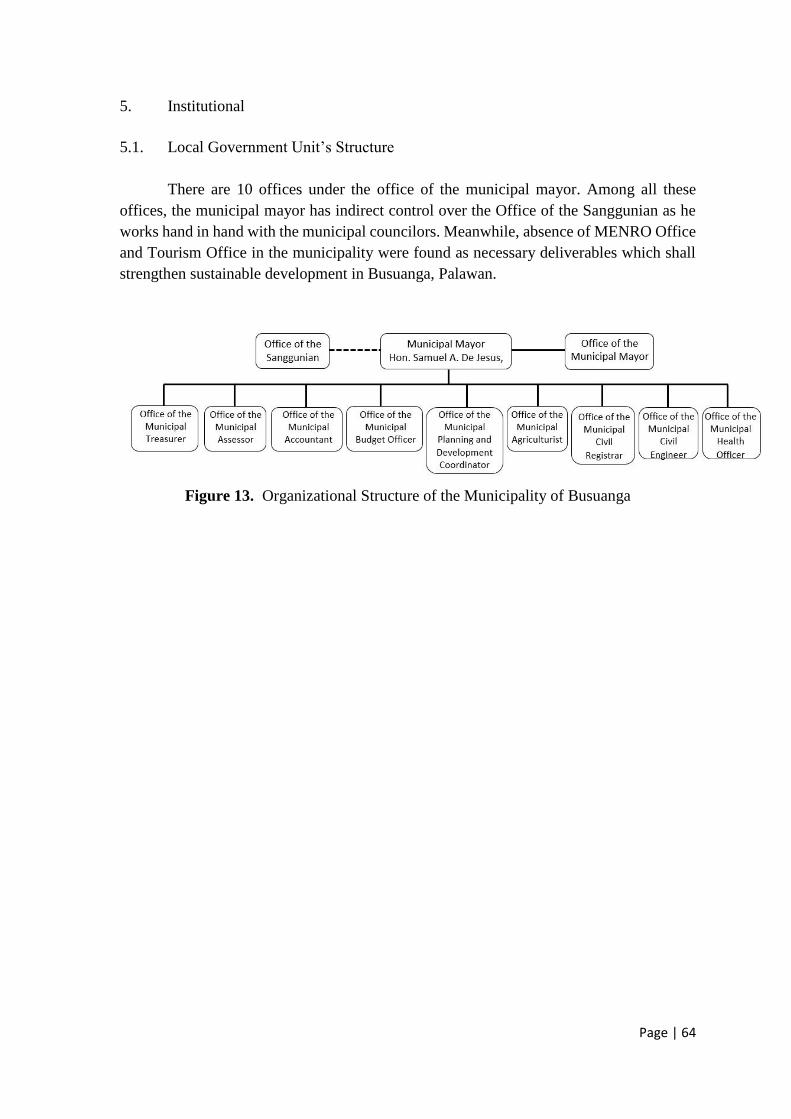
Page | 64
5. Institutional
5.1. Local Government Unit’s Structure
There are 10 offices under the office of the municipal mayor. Among all these
offices, the municipal mayor has indirect control over the Office of the Sanggunian as he
works hand in hand with the municipal councilors. Meanwhile, absence of MENRO Office
and Tourism Office in the municipality were found as necessary deliverables which shall
strengthen sustainable development in Busuanga, Palawan.
Figure 13. Organizational Structure of the Municipality of Busuanga
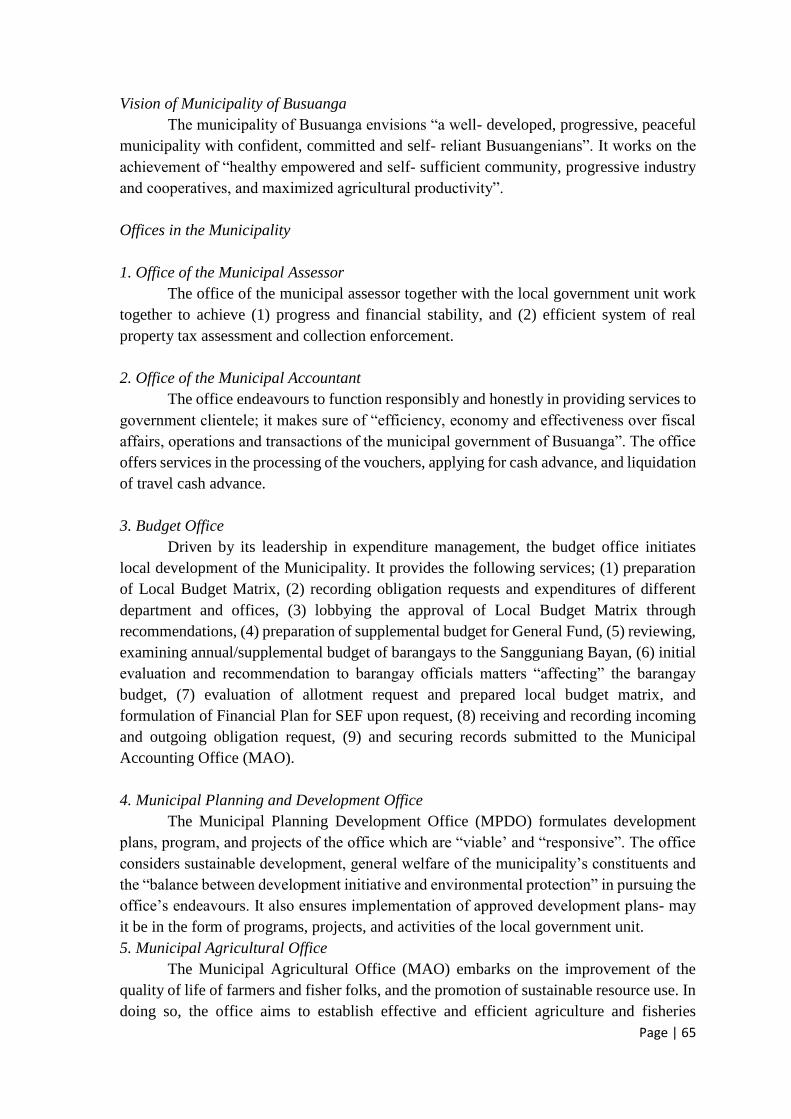
Page | 65
Vision of Municipality of Busuanga
The municipality of Busuanga envisions “a well- developed, progressive, peaceful
municipality with confident, committed and self- reliant Busuangenians”. It works on the
achievement of “healthy empowered and self- sufficient community, progressive industry
and cooperatives, and maximized agricultural productivity”.
Offices in the Municipality
1. Office of the Municipal Assessor
The office of the municipal assessor together with the local government unit work
together to achieve (1) progress and financial stability, and (2) efficient system of real
property tax assessment and collection enforcement.
2. Office of the Municipal Accountant
The office endeavours to function responsibly and honestly in providing services to
government clientele; it makes sure of “efficiency, economy and effectiveness over fiscal
affairs, operations and transactions of the municipal government of Busuanga”. The office
offers services in the processing of the vouchers, applying for cash advance, and liquidation
of travel cash advance.
3. Budget Office
Driven by its leadership in expenditure management, the budget office initiates
local development of the Municipality. It provides the following services; (1) preparation
of Local Budget Matrix, (2) recording obligation requests and expenditures of different
department and offices, (3) lobbying the approval of Local Budget Matrix through
recommendations, (4) preparation of supplemental budget for General Fund, (5) reviewing,
examining annual/supplemental budget of barangays to the Sangguniang Bayan, (6) initial
evaluation and recommendation to barangay officials matters “affecting” the barangay
budget, (7) evaluation of allotment request and prepared local budget matrix, and
formulation of Financial Plan for SEF upon request, (8) receiving and recording incoming
and outgoing obligation request, (9) and securing records submitted to the Municipal
Accounting Office (MAO).
4. Municipal Planning and Development Office
The Municipal Planning Development Office (MPDO) formulates development
plans, program, and projects of the office which are “viable’ and “responsive”. The office
considers sustainable development, general welfare of the municipality’s constituents and
the “balance between development initiative and environmental protection” in pursuing the
office’s endeavours. It also ensures implementation of approved development plans- may
it be in the form of programs, projects, and activities of the local government unit.
5. Municipal Agricultural Office
The Municipal Agricultural Office (MAO) embarks on the improvement of the
quality of life of farmers and fisher folks, and the promotion of sustainable resource use. In
doing so, the office aims to establish effective and efficient agriculture and fisheries
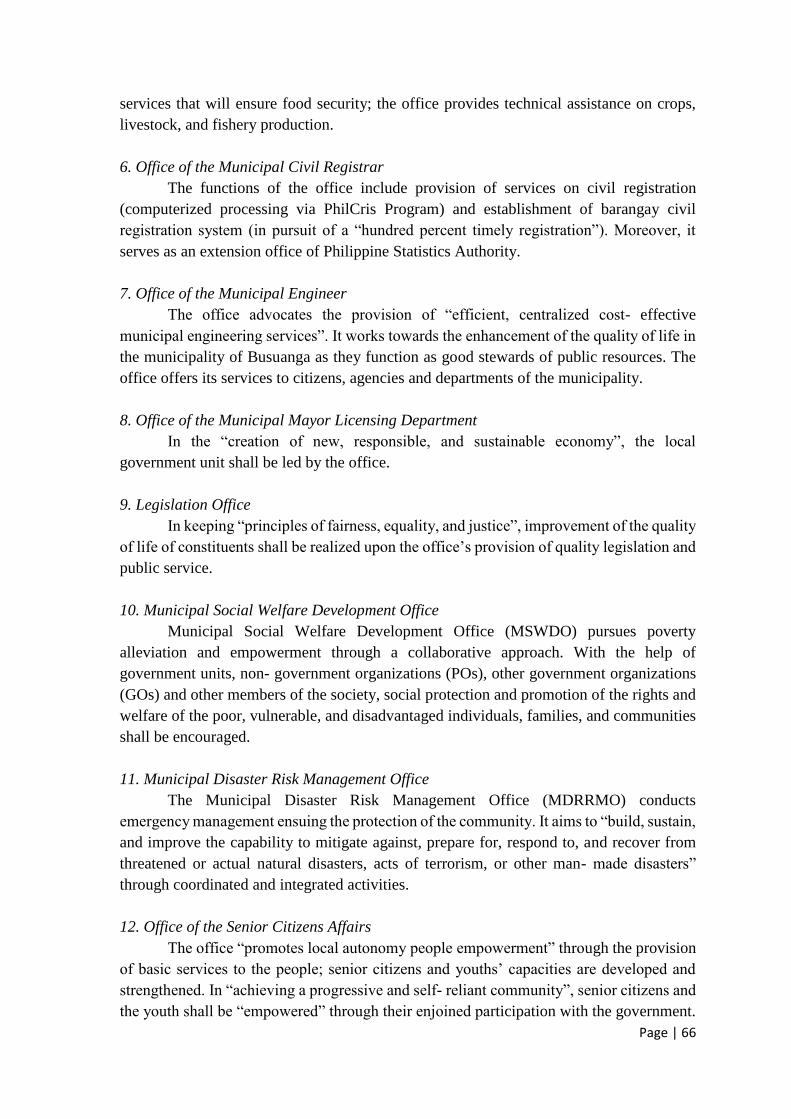
Page | 66
services that will ensure food security; the office provides technical assistance on crops,
livestock, and fishery production.
6. Office of the Municipal Civil Registrar
The functions of the office include provision of services on civil registration
(computerized processing via PhilCris Program) and establishment of barangay civil
registration system (in pursuit of a “hundred percent timely registration”). Moreover, it
serves as an extension office of Philippine Statistics Authority.
7. Office of the Municipal Engineer
The office advocates the provision of “efficient, centralized cost- effective
municipal engineering services”. It works towards the enhancement of the quality of life in
the municipality of Busuanga as they function as good stewards of public resources. The
office offers its services to citizens, agencies and departments of the municipality.
8. Office of the Municipal Mayor Licensing Department
In the “creation of new, responsible, and sustainable economy”, the local
government unit shall be led by the office.
9. Legislation Office
In keeping “principles of fairness, equality, and justice”, improvement of the quality
of life of constituents shall be realized upon the office’s provision of quality legislation and
public service.
10. Municipal Social Welfare Development Office
Municipal Social Welfare Development Office (MSWDO) pursues poverty
alleviation and empowerment through a collaborative approach. With the help of
government units, non- government organizations (POs), other government organizations
(GOs) and other members of the society, social protection and promotion of the rights and
welfare of the poor, vulnerable, and disadvantaged individuals, families, and communities
shall be encouraged.
11. Municipal Disaster Risk Management Office
The Municipal Disaster Risk Management Office (MDRRMO) conducts
emergency management ensuing the protection of the community. It aims to “build, sustain,
and improve the capability to mitigate against, prepare for, respond to, and recover from
threatened or actual natural disasters, acts of terrorism, or other man- made disasters”
through coordinated and integrated activities.
12. Office of the Senior Citizens Affairs
The office “promotes local autonomy people empowerment” through the provision
of basic services to the people; senior citizens and youths’ capacities are developed and
strengthened. In “achieving a progressive and self- reliant community”, senior citizens and
the youth shall be “empowered” through their enjoined participation with the government.

Page | 67
5.2. Local Governance
Human Resource Development Activities
In the provision of efficient and effective public services, the municipality embarks
on human resource development activities which shall “capacitate” its employees. This
shall be done through giving of incentives and rewards.
Strengthened efforts in the enactment of environmental policies and Revenue Code
With the municipality’s aim to raise revenue collection by 30%, strengthened
implementation of environmental laws and the Revenue Code were found necessary;
Information, Education and Campaign (EIC) shall be utilized by the municipality in
achieving this objective.
Maximizing Economic Benefits
1. Tourism Code
The administration is currently pursuing efforts in developing tourism in the
municipality. With the enactment of Busuanga Tourism Code of 2013, the municipality is
tasked in (1) promoting the establishment of “efficient sustainable tourism program and
industry (Section 2), and in (2) governing and regulating the “establishments and operation
of tourism- oriented and tourism- related projects, establishments and/ or enterprises and
activities” (Section 3). In this pursuit, a Municipal Tourism Operations Office (MTOO)
(Section 5), and a Municipal Tourism Council (MTC) was created. The MTOO implements
the ordinance and the Sustainable Tourism Program of Busuanga, while the MTC acts as
“policy- making body” and “steering arm” of MTOO. Recent projects adjunct with tourism
development in the municipality include Salvacion Peak View Deck Project and training
for tourist guides. Whereas, recent ordinance being implemented by the municipality
creates a funding scheme for “conservation, protection and management of the coastal and
aquatic resource, seascape, and rural environment of Busuanga, Palawan”; this pertains to
Municipal Ordinance No. 17 (Series of 2015) otherwise known as “Busuanga Eco- tourism
Development Fee Ordinance of 2015.
2. Market Code
Municipal Regulatory Ordinance No. 18 (Series 0f 2015) or “The Market Price
Control on Meat, Fish (Dried and Fresh) and Local Fruits Ordinance of 2015” was made to
regulate ceiling prices of goods and “prevent unregulated price manipulation” by any
individuals and/ or groups.
3. Creation of Municipal Comprehensive Land Use Plan
It is expected that the new Municipal Comprehensive and Land Use Plan (MCLUP)
shall include water use plan guiding development and ensuring safe water in the
municipality
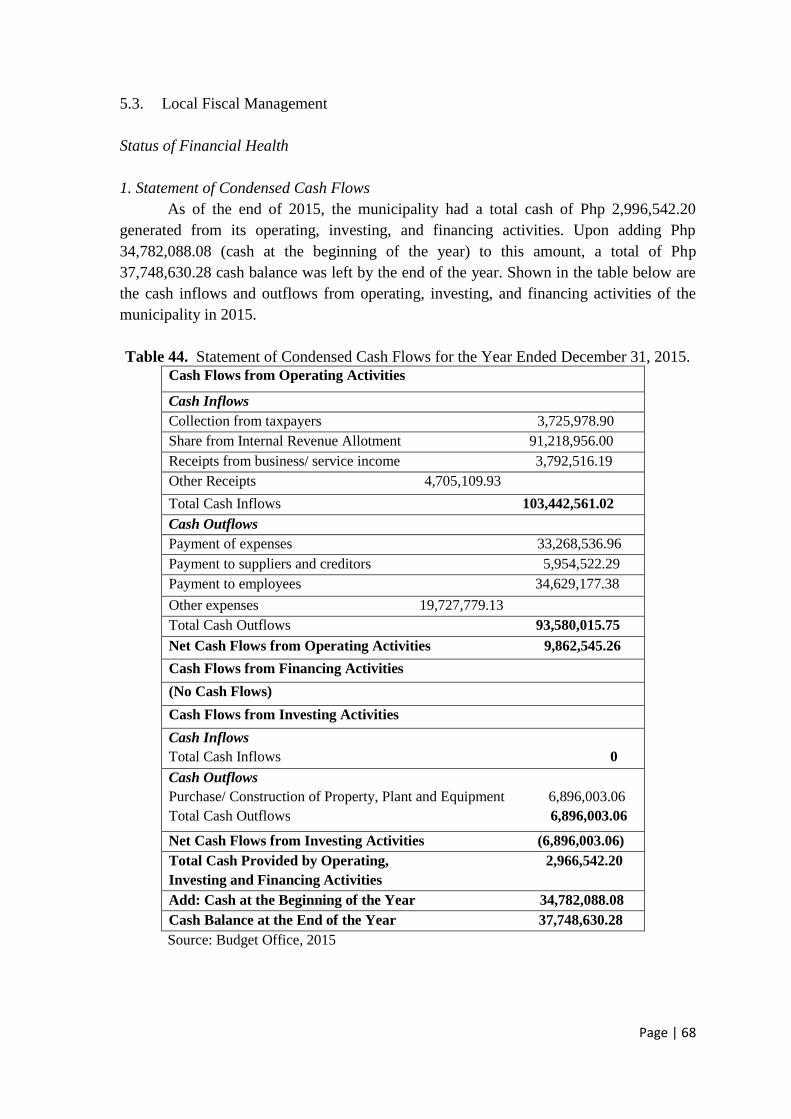
Page | 68
5.3. Local Fiscal Management
Status of Financial Health
1. Statement of Condensed Cash Flows
As of the end of 2015, the municipality had a total cash of Php 2,996,542.20
generated from its operating, investing, and financing activities. Upon adding Php
34,782,088.08 (cash at the beginning of the year) to this amount, a total of Php
37,748,630.28 cash balance was left by the end of the year. Shown in the table below are
the cash inflows and outflows from operating, investing, and financing activities of the
municipality in 2015.
Table 44. Statement of Condensed Cash Flows for the Year Ended December 31, 2015.
Cash Flows from Operating Activities
Cash Inflows
Collection from taxpayers 3,725,978.90
Share from Internal Revenue Allotment 91,218,956.00
Receipts from business/ service income 3,792,516.19
Other Receipts 4,705,109.93
Total Cash Inflows 103,442,561.02
Cash Outflows
Payment of expenses 33,268,536.96
Payment to suppliers and creditors 5,954,522.29
Payment to employees 34,629,177.38
Other expenses 19,727,779.13
Total Cash Outflows 93,580,015.75
Net Cash Flows from Operating Activities 9,862,545.26
Cash Flows from Financing Activities
(No Cash Flows)
Cash Flows from Investing Activities
Cash Inflows
Total Cash Inflows 0
Cash Outflows
Purchase/ Construction of Property, Plant and Equipment 6,896,003.06
Total Cash Outflows 6,896,003.06
Net Cash Flows from Investing Activities (6,896,003.06)
Total Cash Provided by Operating, 2,966,542.20
Investing and Financing Activities
Add: Cash at the Beginning of the Year 34,782,088.08
Cash Balance at the End of the Year 37,748,630.28
Source: Budget Office, 2015

Page | 69
Cash Flows from Operating Activities:
Given a total of cash inflow of Php 103,442,561.02 and a cash outflow of Php
93,580,015.76 from operating activities of the municipality, 90.47% of the cash available
for operating activities of the municipality was utilized; at the end of 2015, the
municipality’s net cash flow from operating activities amounted to Php 9,862,545.26. It is
also noted that the share from Internal Revenue Allotment (IRA) of Php 91,218,856.00
comprise 88.18% of the total cash inflow from operating activities of the municipality and
that payment to employees (37.00%) and payment to expenses (35.55%) have the largest
shares from cash outflows of the municipality’s operating activities. Moreover, collection
from tax payers, receipts from business and service income, and other receipts which
constitute only 3.60%, 3.67%, and 4.55%, respectively, imply the need to increase revenue
collection for the municipality to become less IRA dependent.
Cash Flows from Investing Activities
Cash Outflows from investing activities of the municipality pertain to the purchase/
construction of property/ plant/ equipment amounting to Php 6,896,003.06; meanwhile,
there are no cash inflows from investing activities of the municipality.
Cash Flows from Financing Activities:
There are no cash inflows and outflows from financing activities of the municipality.
Quarterly Report on Real Property Tax Collection
As of 2015, total collection of the municipality on Real Property Tax (RPT)
amounted to Php 4,413,752.77. Sources of this revenue comes from property
classifications, residential, agricultural, and commercial lands; Php 759,919.09 (17.22%)
comes from residential property, Php 1,644,195.24 (37.25%) from agricultural property,
while Php 2,009,636.44 (45.73%) from commercial property. Given these values, it can be
said that commercial properties generate most of the revenue of the municipality. These are
followed by agricultural and residential areas respectively. (Treasury Office, 2015)
Statement of Debt Service
According to the Statement of Debt Service as of 2016, the municipality of
Busuanga has not availed any debt service.
5.4. Actual Expenditures by General Account
Statement of Financial Performance- General Fund (GF)
The table below shows the financial performance of the municipality. Accordingly,
it indicates that the municipality is largely depending on internal revenue collections while
spending most of its general fund on the provision of personal services. Therefore,
improved revenue collection from taxes, and service and business income in Busuanga,
Palawan is necessary. In line with this, the integration of IRR (Internal Rate of Return) to
the Tourism Code of the municipality is sought to increase revenue collection and
maximize economic benefits; prioritization of this agenda is indeed significant since this
shall allow revenue collection on tourism related activities in the municipality.
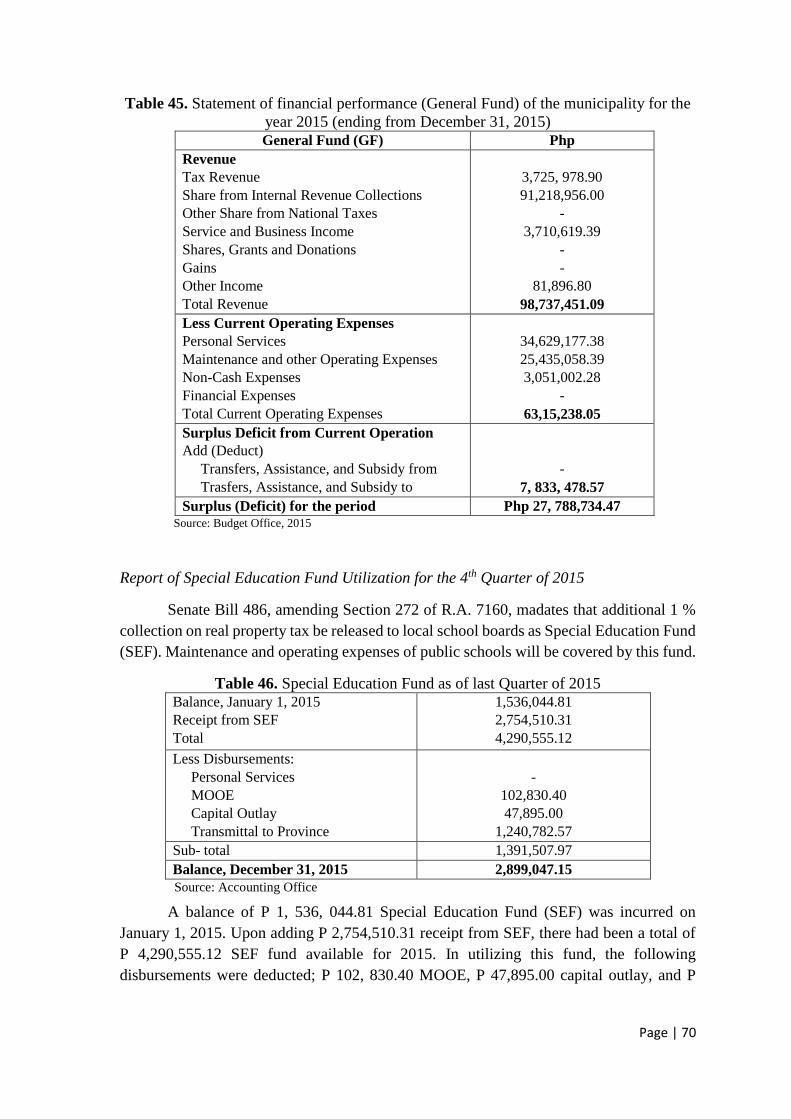
Page | 70
Table 45. Statement of financial performance (General Fund) of the municipality for the
year 2015 (ending from December 31, 2015)
General Fund (GF) Php
Revenue
Tax Revenue
Share from Internal Revenue Collections
Other Share from National Taxes
Service and Business Income
Shares, Grants and Donations
Gains
Other Income
Total Revenue
3,725, 978.90
91,218,956.00
-
3,710,619.39
-
-
81,896.80
98,737,451.09
Less Current Operating Expenses
Personal Services
Maintenance and other Operating Expenses
Non-Cash Expenses
Financial Expenses
Total Current Operating Expenses
34,629,177.38
25,435,058.39
3,051,002.28
-
63,15,238.05
Surplus Deficit from Current Operation
Add (Deduct)
Transfers, Assistance, and Subsidy from
Trasfers, Assistance, and Subsidy to
-
7, 833, 478.57
Surplus (Deficit) for the period Php 27, 788,734.47 Source: Budget Office, 2015
Report of Special Education Fund Utilization for the 4th Quarter of 2015
Senate Bill 486, amending Section 272 of R.A. 7160, madates that additional 1 %
collection on real property tax be released to local school boards as Special Education Fund
(SEF). Maintenance and operating expenses of public schools will be covered by this fund.
Table 46. Special Education Fund as of last Quarter of 2015 Balance, January 1, 2015
Receipt from SEF
Total
1,536,044.81
2,754,510.31
4,290,555.12
Less Disbursements:
Personal Services
MOOE
Capital Outlay
Transmittal to Province
-
102,830.40
47,895.00
1,240,782.57
Sub- total 1,391,507.97
Balance, December 31, 2015 2,899,047.15
Source: Accounting Office
A balance of P 1, 536, 044.81 Special Education Fund (SEF) was incurred on
January 1, 2015. Upon adding P 2,754,510.31 receipt from SEF, there had been a total of
P 4,290,555.12 SEF fund available for 2015. In utilizing this fund, the following
disbursements were deducted; P 102, 830.40 MOOE, P 47,895.00 capital outlay, and P
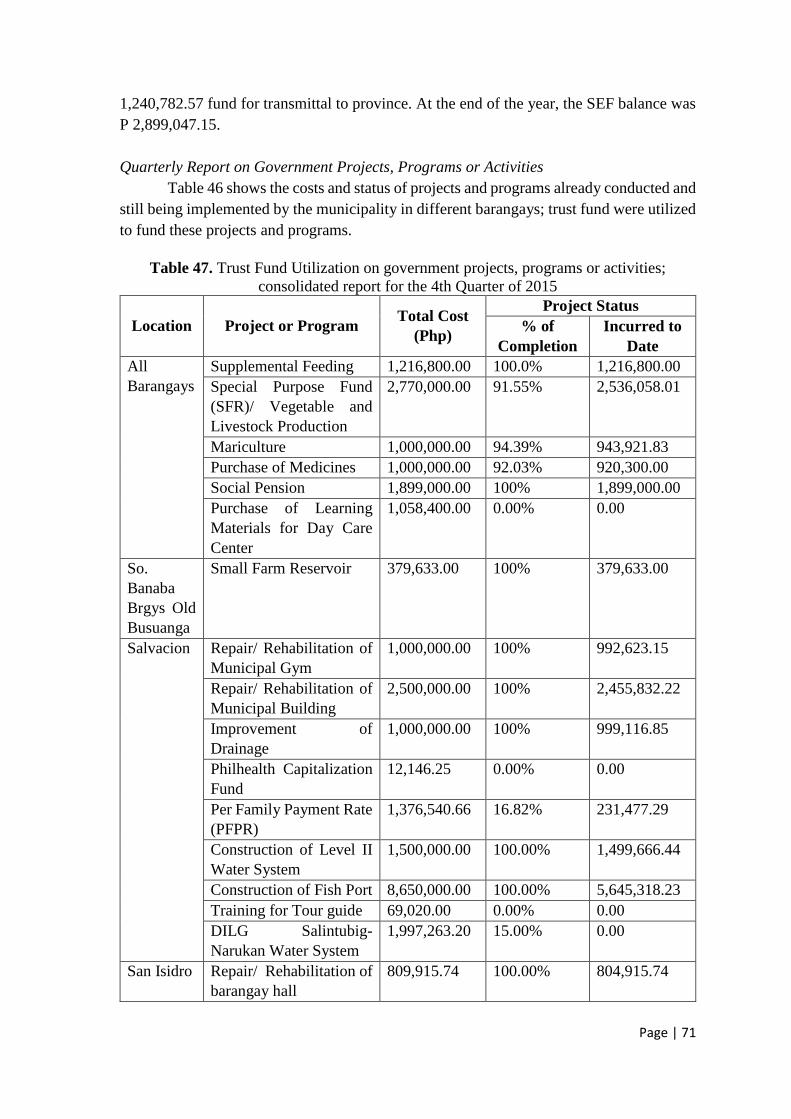
Page | 71
1,240,782.57 fund for transmittal to province. At the end of the year, the SEF balance was
P 2,899,047.15.
Quarterly Report on Government Projects, Programs or Activities
Table 46 shows the costs and status of projects and programs already conducted and
still being implemented by the municipality in different barangays; trust fund were utilized
to fund these projects and programs.
Table 47. Trust Fund Utilization on government projects, programs or activities;
consolidated report for the 4th Quarter of 2015
Location Project or Program Total Cost
(Php)
Project Status
% of
Completion
Incurred to
Date
All
Barangays
Supplemental Feeding 1,216,800.00 100.0% 1,216,800.00
Special Purpose Fund
(SFR)/ Vegetable and
Livestock Production
2,770,000.00 91.55% 2,536,058.01
Mariculture 1,000,000.00 94.39% 943,921.83
Purchase of Medicines 1,000,000.00 92.03% 920,300.00
Social Pension 1,899,000.00 100% 1,899,000.00
Purchase of Learning
Materials for Day Care
Center
1,058,400.00 0.00% 0.00
So.
Banaba
Brgys Old
Busuanga
Small Farm Reservoir 379,633.00 100% 379,633.00
Salvacion Repair/ Rehabilitation of
Municipal Gym
1,000,000.00 100% 992,623.15
Repair/ Rehabilitation of
Municipal Building
2,500,000.00 100% 2,455,832.22
Improvement of
Drainage
1,000,000.00 100% 999,116.85
Philhealth Capitalization
Fund
12,146.25 0.00% 0.00
Per Family Payment Rate
(PFPR)
1,376,540.66 16.82% 231,477.29
Construction of Level II
Water System
1,500,000.00 100.00% 1,499,666.44
Construction of Fish Port 8,650,000.00 100.00% 5,645,318.23
Training for Tour guide 69,020.00 0.00% 0.00
DILG Salintubig-
Narukan Water System
1,997,263.20 15.00% 0.00
San Isidro Repair/ Rehabilitation of
barangay hall
809,915.74 100.00% 804,915.74
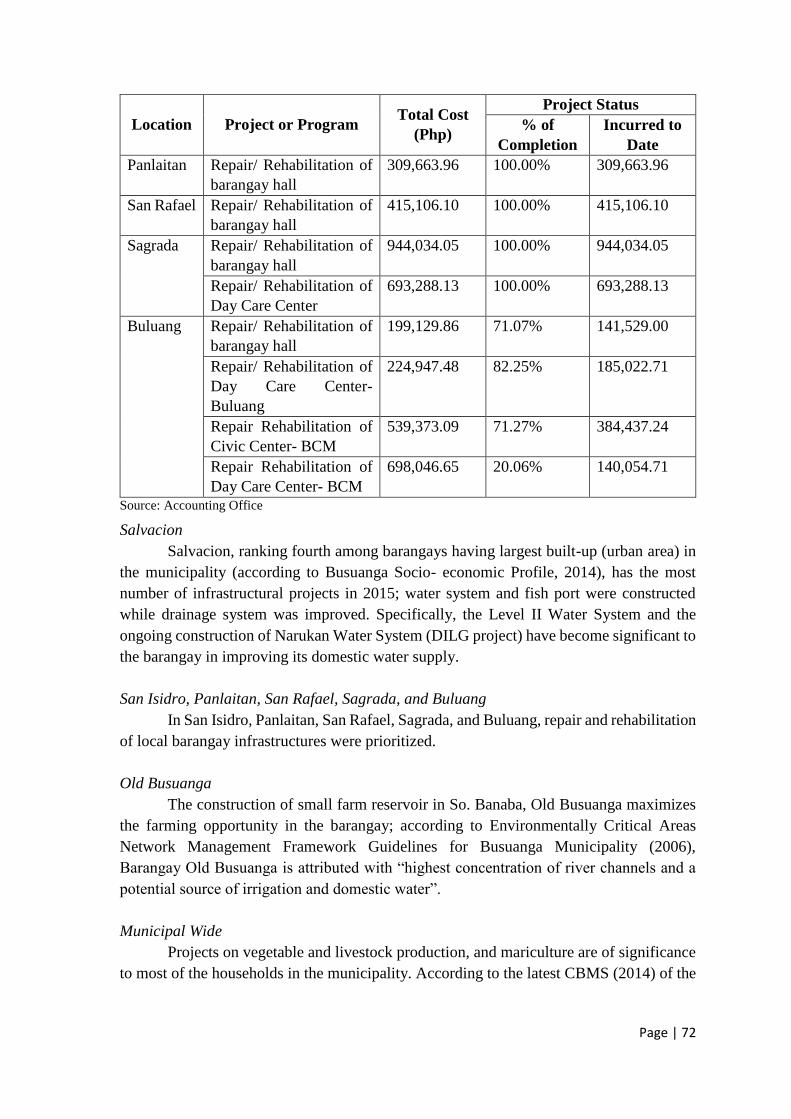
Page | 72
Location Project or Program Total Cost
(Php)
Project Status
% of
Completion
Incurred to
Date
Panlaitan Repair/ Rehabilitation of
barangay hall
309,663.96 100.00% 309,663.96
San Rafael Repair/ Rehabilitation of
barangay hall
415,106.10 100.00% 415,106.10
Sagrada Repair/ Rehabilitation of
barangay hall
944,034.05 100.00% 944,034.05
Repair/ Rehabilitation of
Day Care Center
693,288.13 100.00% 693,288.13
Buluang Repair/ Rehabilitation of
barangay hall
199,129.86 71.07% 141,529.00
Repair/ Rehabilitation of
Day Care Center-
Buluang
224,947.48 82.25% 185,022.71
Repair Rehabilitation of
Civic Center- BCM
539,373.09 71.27% 384,437.24
Repair Rehabilitation of
Day Care Center- BCM
698,046.65 20.06% 140,054.71
Source: Accounting Office
Salvacion
Salvacion, ranking fourth among barangays having largest built-up (urban area) in
the municipality (according to Busuanga Socio- economic Profile, 2014), has the most
number of infrastructural projects in 2015; water system and fish port were constructed
while drainage system was improved. Specifically, the Level II Water System and the
ongoing construction of Narukan Water System (DILG project) have become significant to
the barangay in improving its domestic water supply.
San Isidro, Panlaitan, San Rafael, Sagrada, and Buluang
In San Isidro, Panlaitan, San Rafael, Sagrada, and Buluang, repair and rehabilitation
of local barangay infrastructures were prioritized.
Old Busuanga
The construction of small farm reservoir in So. Banaba, Old Busuanga maximizes
the farming opportunity in the barangay; according to Environmentally Critical Areas
Network Management Framework Guidelines for Busuanga Municipality (2006),
Barangay Old Busuanga is attributed with “highest concentration of river channels and a
potential source of irrigation and domestic water”.
Municipal Wide
Projects on vegetable and livestock production, and mariculture are of significance
to most of the households in the municipality. According to the latest CBMS (2014) of the
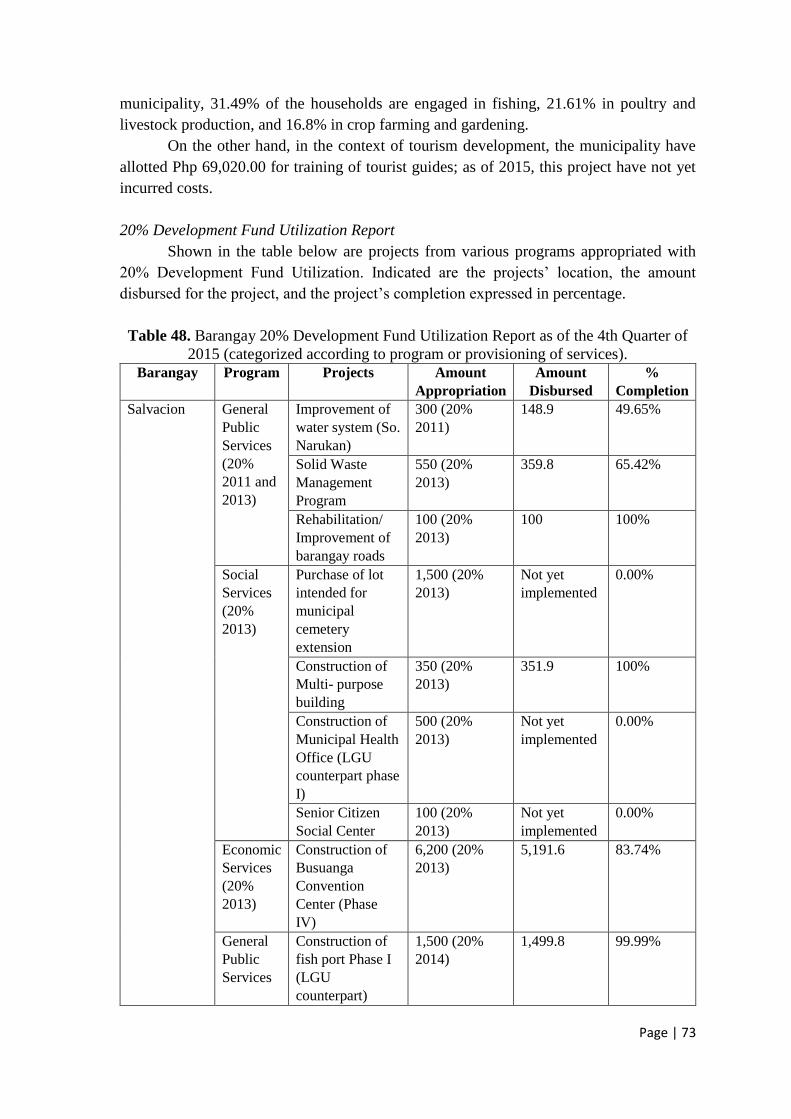
Page | 73
municipality, 31.49% of the households are engaged in fishing, 21.61% in poultry and
livestock production, and 16.8% in crop farming and gardening.
On the other hand, in the context of tourism development, the municipality have
allotted Php 69,020.00 for training of tourist guides; as of 2015, this project have not yet
incurred costs.
20% Development Fund Utilization Report
Shown in the table below are projects from various programs appropriated with
20% Development Fund Utilization. Indicated are the projects’ location, the amount
disbursed for the project, and the project’s completion expressed in percentage.
Table 48. Barangay 20% Development Fund Utilization Report as of the 4th Quarter of
2015 (categorized according to program or provisioning of services).
Barangay Program Projects Amount
Appropriation
Amount
Disbursed
%
Completion
Salvacion General
Public
Services
(20%
2011 and
2013)
Improvement of
water system (So.
Narukan)
300 (20%
2011)
148.9 49.65%
Solid Waste
Management
Program
550 (20%
2013)
359.8 65.42%
Rehabilitation/
Improvement of
barangay roads
100 (20%
2013)
100 100%
Social
Services
(20%
2013)
Purchase of lot
intended for
municipal
cemetery
extension
1,500 (20%
2013)
Not yet
implemented
0.00%
Construction of
Multi- purpose
building
350 (20%
2013)
351.9 100%
Construction of
Municipal Health
Office (LGU
counterpart phase
I)
500 (20%
2013)
Not yet
implemented
0.00%
Senior Citizen
Social Center
100 (20%
2013)
Not yet
implemented
0.00%
Economic
Services
(20%
2013)
Construction of
Busuanga
Convention
Center (Phase
IV)
6,200 (20%
2013)
5,191.6 83.74%
General
Public
Services
Construction of
fish port Phase I
(LGU
counterpart)
1,500 (20%
2014)
1,499.8 99.99%
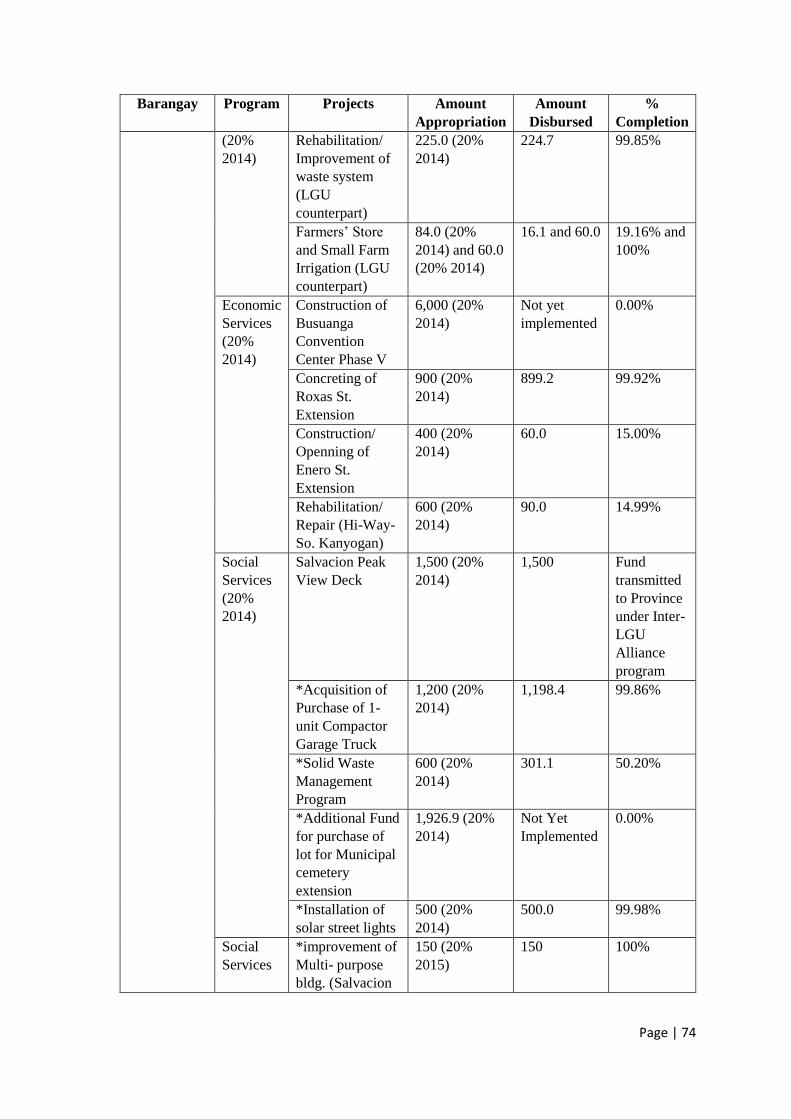
Page | 74
Barangay Program Projects Amount
Appropriation
Amount
Disbursed
%
Completion
(20%
2014)
Rehabilitation/
Improvement of
waste system
(LGU
counterpart)
225.0 (20%
2014)
224.7 99.85%
Farmers’ Store
and Small Farm
Irrigation (LGU
counterpart)
84.0 (20%
2014) and 60.0
(20% 2014)
16.1 and 60.0 19.16% and
100%
Economic
Services
(20%
2014)
Construction of
Busuanga
Convention
Center Phase V
6,000 (20%
2014)
Not yet
implemented
0.00%
Concreting of
Roxas St.
Extension
900 (20%
2014)
899.2 99.92%
Construction/
Openning of
Enero St.
Extension
400 (20%
2014)
60.0 15.00%
Rehabilitation/
Repair (Hi-Way-
So. Kanyogan)
600 (20%
2014)
90.0 14.99%
Social
Services
(20%
2014)
Salvacion Peak
View Deck
1,500 (20%
2014)
1,500 Fund
transmitted
to Province
under Inter-
LGU
Alliance
program
*Acquisition of
Purchase of 1-
unit Compactor
Garage Truck
1,200 (20%
2014)
1,198.4 99.86%
*Solid Waste
Management
Program
600 (20%
2014)
301.1 50.20%
*Additional Fund
for purchase of
lot for Municipal
cemetery
extension
1,926.9 (20%
2014)
Not Yet
Implemented
0.00%
*Installation of
solar street lights
500 (20%
2014)
500.0 99.98%
Social
Services
*improvement of
Multi- purpose
bldg. (Salvacion
150 (20%
2015)
150 100%
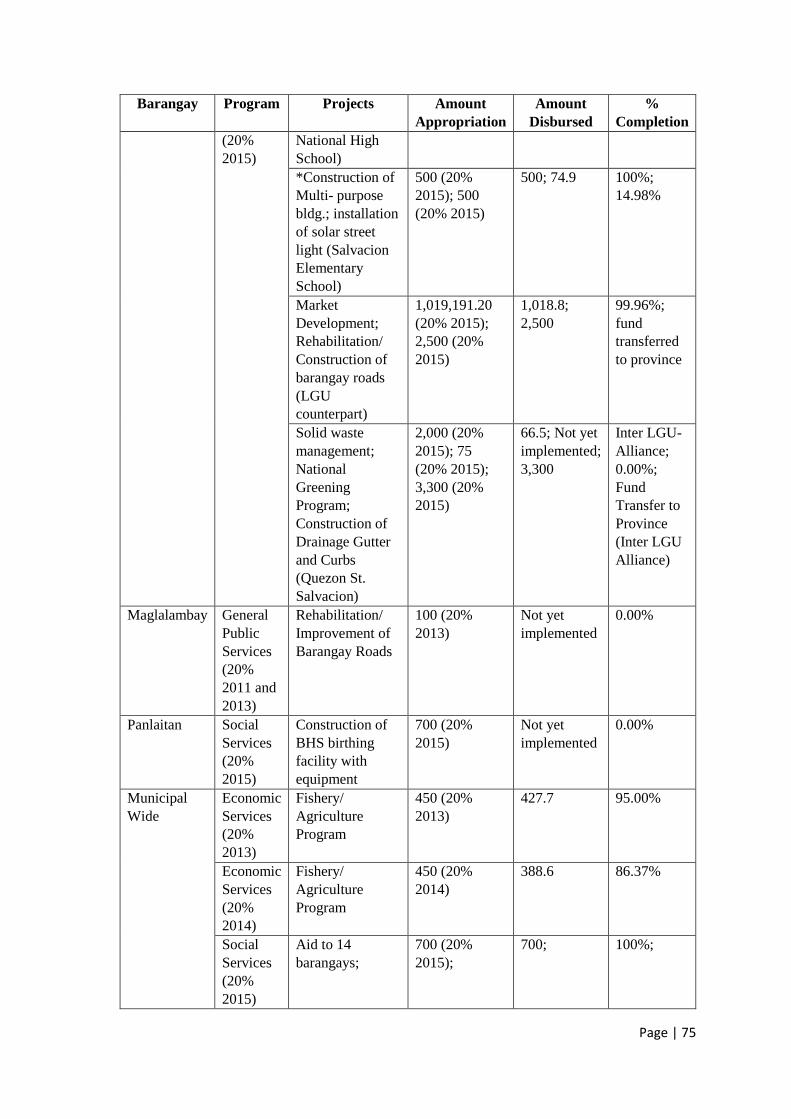
Page | 75
Barangay Program Projects Amount
Appropriation
Amount
Disbursed
%
Completion
(20%
2015)
National High
School)
*Construction of
Multi- purpose
bldg.; installation
of solar street
light (Salvacion
Elementary
School)
500 (20%
2015); 500
(20% 2015)
500; 74.9 100%;
14.98%
Market
Development;
Rehabilitation/
Construction of
barangay roads
(LGU
counterpart)
1,019,191.20
(20% 2015);
2,500 (20%
2015)
1,018.8;
2,500
99.96%;
fund
transferred
to province
Solid waste
management;
National
Greening
Program;
Construction of
Drainage Gutter
and Curbs
(Quezon St.
Salvacion)
2,000 (20%
2015); 75
(20% 2015);
3,300 (20%
2015)
66.5; Not yet
implemented;
3,300
Inter LGU-
Alliance;
0.00%;
Fund
Transfer to
Province
(Inter LGU
Alliance)
Maglalambay General
Public
Services
(20%
2011 and
2013)
Rehabilitation/
Improvement of
Barangay Roads
100 (20%
2013)
Not yet
implemented
0.00%
Panlaitan Social
Services
(20%
2015)
Construction of
BHS birthing
facility with
equipment
700 (20%
2015)
Not yet
implemented
0.00%
Municipal
Wide
Economic
Services
(20%
2013)
Fishery/
Agriculture
Program
450 (20%
2013)
427.7 95.00%
Economic
Services
(20%
2014)
Fishery/
Agriculture
Program
450 (20%
2014)
388.6 86.37%
Social
Services
(20%
2015)
Aid to 14
barangays;
700 (20%
2015);
700; 100%;
Page | 76
Source: Municipal Planning Development Office, 2015
From this report, the municipality still yet to provide the following services;
General Public Services
- Rehabilitation/ Improvement of Barangay Roads in Maglalambay
Social Services
- Purchase of lot intended for municipal cemetery extension, construction of Municipal
Health Office (LGU counterpart phase I), Senior Citizen Social Center, National
Greening Program, construction of Barangay Health Station (BHS) birthing facility with
equipment in Panlaitan
Economic Services
- Construction of Busuanga Convention Center Phase V
Remarks:
Projects strengthening the agricultural sector of the municipality include the
establishment of farmers’ store and small farm irrigation (LGU counterpart) in Barangay
Salvacion (project under municipal program providing general public services), and the
municipal wide implementation of the Fishery/ Agriculture Program (municipal program
providing economic service).
Meanwhile, social services prioritized by the administration include the provision
of financial aid to 14 barangays, development of market in the municipality realized to
supplement 8.44% of households involved in wholesaling and retailing (as identified in the
2014 CBMS), implementation of Solid Waste Management Program (transferred to
province under inter- LGU Alliance program), the installment of solar street lights in
Salvacion with 99.98% completion, rehabilitation and construction of Salvacion Peak View
Deck (transferred to province under inter- LGU Alliance program) attributed with realized
potential for tourism development, and construction of drainage gutter and curbs in Quezon
St., Salvacion (transferred to province under inter- LGU Alliance program).
In terms of general public services, construction of fish port and rehabilitation of
barangay roads in Salvacion were accomplished.
Report on Utilization of Disaster Risk Reduction and Management Fund
Sources of Disaster Risk Reduction Management Fund (DRRMF) include current
and continuing appropriations, and previous year’s appropriations transferred to Special
Trust Fund; there are no transfers or grants comprising this fund. As of 2015, total fund
available was Php 12,332,519.00. The fund came from (1) Php 11,609,136.75 Local
Disaster Risk Reduction Management Fund (LDRRMF) (30% Quick Response Fund
(QRF) and 70% Mitigation Fund), (2) Php 395,000.00 LGU fund, and (3) Php 328,382.25
coming from other sources of fund. (Accounting Office, 2015)
In the past year, Php 1,764,938.65 (20%) of the Mitigation Fund, Php 395,000
(100%) of the LGU fund, and Php 270,203.00 (82%) of other sources of fund were utilized;
over all, 20% of the available fund was used. Expenses covered purchase of Disaster Risk
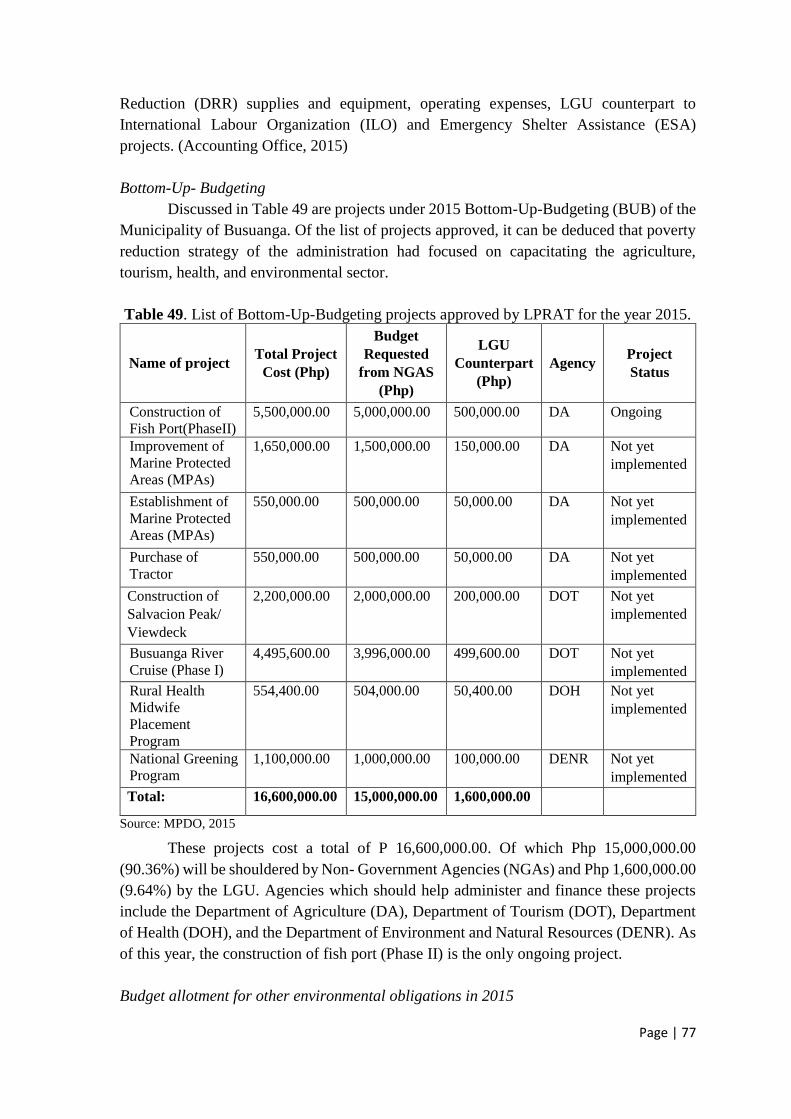
Page | 77
Reduction (DRR) supplies and equipment, operating expenses, LGU counterpart to
International Labour Organization (ILO) and Emergency Shelter Assistance (ESA)
projects. (Accounting Office, 2015)
Bottom-Up- Budgeting
Discussed in Table 49 are projects under 2015 Bottom-Up-Budgeting (BUB) of the
Municipality of Busuanga. Of the list of projects approved, it can be deduced that poverty
reduction strategy of the administration had focused on capacitating the agriculture,
tourism, health, and environmental sector.
Table 49. List of Bottom-Up-Budgeting projects approved by LPRAT for the year 2015.
Name of project Total Project
Cost (Php)
Budget
Requested
from NGAS
(Php)
LGU
Counterpart
(Php)
Agency Project
Status
1. Construction of
Fish Port(PhaseII)
5,500,000.00 5,000,000.00 500,000.00 DA Ongoing
2. Improvement of
Marine Protected
Areas (MPAs)
1,650,000.00 1,500,000.00 150,000.00 DA Not yet
implemented
3. Establishment of
Marine Protected
Areas (MPAs)
550,000.00 500,000.00 50,000.00 DA Not yet
implemented
4. Purchase of
Tractor
550,000.00 500,000.00 50,000.00 DA Not yet
implemented
Construction of
Salvacion Peak/
Viewdeck
2,200,000.00 2,000,000.00 200,000.00 DOT Not yet
implemented
5. Busuanga River
Cruise (Phase I)
4,495,600.00 3,996,000.00 499,600.00 DOT Not yet
implemented
6. Rural Health
Midwife
Placement
Program
554,400.00 504,000.00 50,400.00 DOH Not yet
implemented
7. National Greening
Program
1,100,000.00 1,000,000.00 100,000.00 DENR Not yet
implemented
Total: 16,600,000.00 15,000,000.00 1,600,000.00
Source: MPDO, 2015
These projects cost a total of P 16,600,000.00. Of which Php 15,000,000.00
(90.36%) will be shouldered by Non- Government Agencies (NGAs) and Php 1,600,000.00
(9.64%) by the LGU. Agencies which should help administer and finance these projects
include the Department of Agriculture (DA), Department of Tourism (DOT), Department
of Health (DOH), and the Department of Environment and Natural Resources (DENR). As
of this year, the construction of fish port (Phase II) is the only ongoing project.
Budget allotment for other environmental obligations in 2015
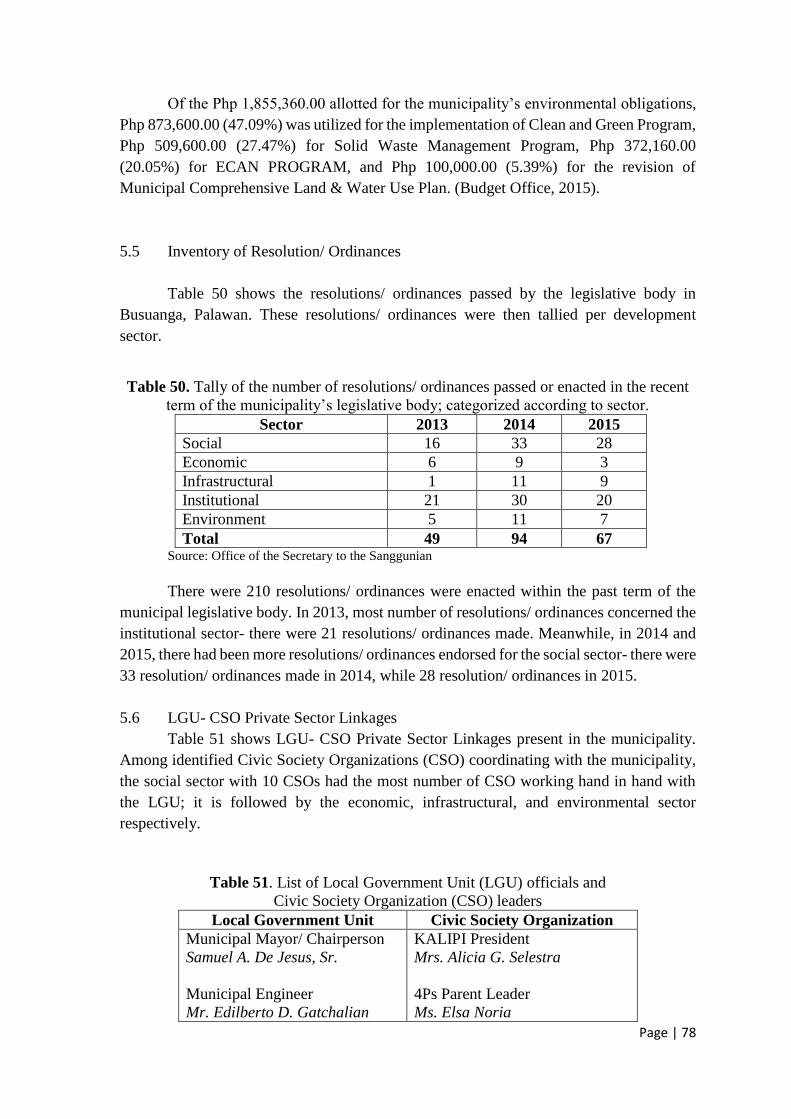
Page | 78
Of the Php 1,855,360.00 allotted for the municipality’s environmental obligations,
Php 873,600.00 (47.09%) was utilized for the implementation of Clean and Green Program,
Php 509,600.00 (27.47%) for Solid Waste Management Program, Php 372,160.00
(20.05%) for ECAN PROGRAM, and Php 100,000.00 (5.39%) for the revision of
Municipal Comprehensive Land & Water Use Plan. (Budget Office, 2015).
5.5 Inventory of Resolution/ Ordinances
Table 50 shows the resolutions/ ordinances passed by the legislative body in
Busuanga, Palawan. These resolutions/ ordinances were then tallied per development
sector.
Table 50. Tally of the number of resolutions/ ordinances passed or enacted in the recent
term of the municipality’s legislative body; categorized according to sector.
Sector 2013 2014 2015
Social 16 33 28
Economic 6 9 3
Infrastructural 1 11 9
Institutional 21 30 20
Environment 5 11 7
Total 49 94 67 Source: Office of the Secretary to the Sanggunian
There were 210 resolutions/ ordinances were enacted within the past term of the
municipal legislative body. In 2013, most number of resolutions/ ordinances concerned the
institutional sector- there were 21 resolutions/ ordinances made. Meanwhile, in 2014 and
2015, there had been more resolutions/ ordinances endorsed for the social sector- there were
33 resolution/ ordinances made in 2014, while 28 resolution/ ordinances in 2015.
5.6 LGU- CSO Private Sector Linkages
Table 51 shows LGU- CSO Private Sector Linkages present in the municipality.
Among identified Civic Society Organizations (CSO) coordinating with the municipality,
the social sector with 10 CSOs had the most number of CSO working hand in hand with
the LGU; it is followed by the economic, infrastructural, and environmental sector
respectively.
Table 51. List of Local Government Unit (LGU) officials and
Civic Society Organization (CSO) leaders
Local Government Unit Civic Society Organization
Municipal Mayor/ Chairperson
Samuel A. De Jesus, Sr.
Municipal Engineer
Mr. Edilberto D. Gatchalian
KALIPI President
Mrs. Alicia G. Selestra
4Ps Parent Leader
Ms. Elsa Noria

Page | 79
Local Government Unit Civic Society Organization
Municipal Assessor
Mr. Efren V. Ladica
MDRRM Officer
Mr. Segundo E. Aguilar
Municipal Planning
Development Coordinator
Mr. Marlo M. Dagomboy
ICO- Municipal Treasurer
Mr. Marlo B. Friolo
Municipal Link
Mr. Jeomar L. Gaddao
Ms. Helen Grace Delos Reyes
Municipal Health Officer
Dr. Lesaldeo Moses R. Princesa
MLGOO
Mr. Daniel Florida
Comm. On Appro.
Hon. Tommy C. Cruz
Municipal PESO
Ms. Elinita E. Gabarda
Municipal Budget Officer
Ms. Aida O. Dominguez
Municipal Agriculturist
Ms. Maria Theresa T. Rabe
MSWDO
Ms. Divina Garcia R. Dulce
Municipal Civil Registrar
Ms. Elsie H. Rodriguez
Municipal Accountant
Ms. Eunice G. Tibudan
Principal/ DepEd us. District
Ms. Sofia D. Villareal
ECOFISH/Area Coordinator
Ms. Vivien Facunla
BOWASA (Bogtong)
Mr. Darwin F. Macanas
BCM Chairman
Mr. Roy D. Dabuit
Ocam-ocam Farmers Association
Mr. Joemael Macmac
PAYAPACA/ So. Calauit
Buluang
Mr. Fredel Mued
UNAKA Association (Bogtong)
Mr. Randy C. Nadado
PTA/ SNHS
Mr. Maria Ana D. Mercado
Sagrada Farmer’s Association
Mr. Felimon Rodiguez
PASICMIDA/ Panlaitan
Mr. Mayolito Curba
Kapit- Bisig Farmers Association
Mr. Israel Maambong
SRWA Manager
Ms. Assuncion E. Aguilar
BUWASA (Buluang)
Mr. Ruben Factuar
KAMALAY President
Mr. Kenneth Austria
BSPMC- KALAHI CIDDS
National Community Driven
Development Program (KC-
NCDDP)
Ms. Jessamine May Catiil
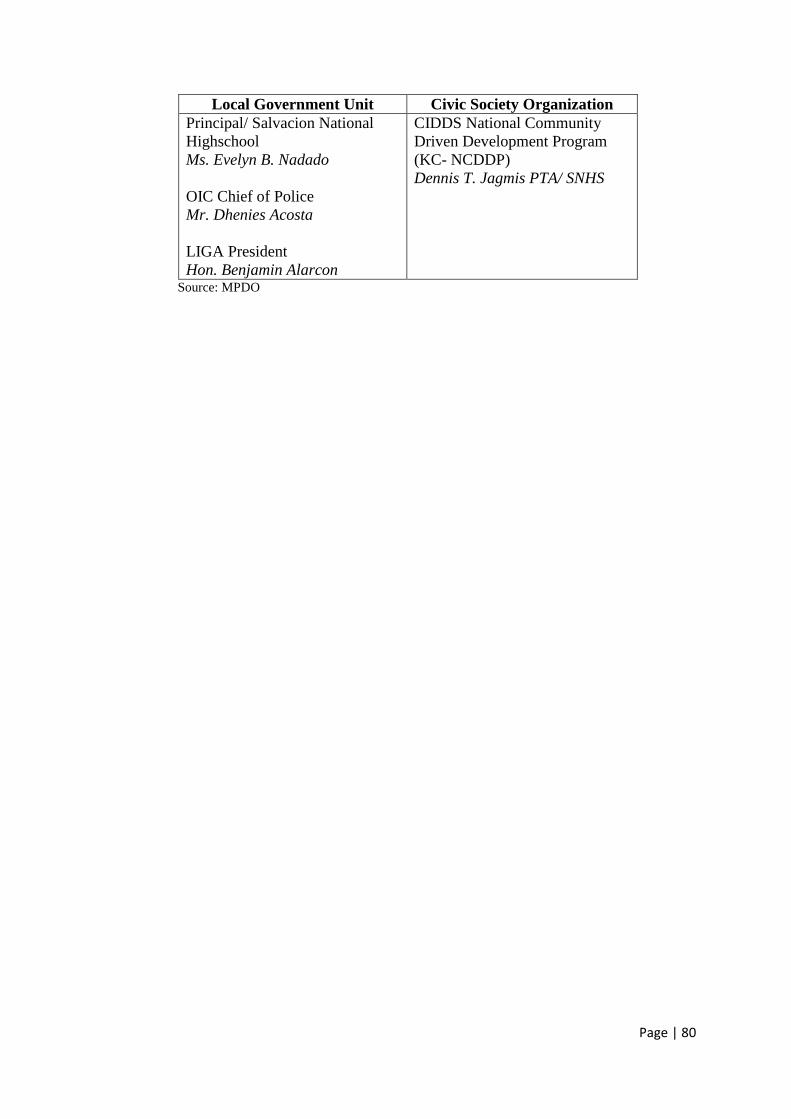
Page | 80
Local Government Unit Civic Society Organization
Principal/ Salvacion National
Highschool
Ms. Evelyn B. Nadado
OIC Chief of Police
Mr. Dhenies Acosta
LIGA President
Hon. Benjamin Alarcon
CIDDS National Community
Driven Development Program
(KC- NCDDP)
Dennis T. Jagmis PTA/ SNHS
Source: MPDO

Page | 81
6. Transect Mapping
Land Use Mountain,
Coastal Residential/ Coastal Residential (proper)
Small Residential
area/ wooden
brushland
Forest/
Agricultural
GPS Location/ elevation 12.08683
119.93444
12.08368
119.93587
12.08370 12.08612
119.93766 119.94223
12.08694 12.08662
119.94385 119.94721
12.08674
119.94892
12.08732
12.08878
119.95050
119.95104
Distance (300 steps * 0.63) 600=378 m 1200= 756 m 900=567 m 300= 189 m 300=189 m
Zones Multiple use Multiple use Multiple use Multiple use Multiple use
Vegetation/ Dominant plant
species
buho, siklat,
banana,
kamoteng kahoy, coconut,
mango, banana, doldol,
pagatpat, tandol, talaba,
danggit, samaral, tarawis,
coconut, mangoro,
pagatpat, bangkuro,
mangroves, Geteb island
(mountain), lunihan,
tursilyo
cat tail, guyabano, santol,
mango, coconut, palm, tisa,
siklat, buho, bunga, star
apple, banana, pineapple,
tamarind, narra, acacia,
hagunoy, olibak, kakwate,
duhat, papaya, anahaw,
banaba
badyang, buho,
siklat, acacia, dulo,
sahing, kasuy, narra,
Acapulco
banana, (punong
kahoy), sahing
(dagta), bunga,
acacia, badyang,
coconut, palay,
jack fruit,
pineapple, coconut,
gabi, sagulilong

Page | 82
Land Use Mountain,
Coastal Residential/ Coastal Residential (proper)
Small Residential
area/ wooden
brushland
Forest/
Agricultural
Types of Housing Pawid pawid, (including rescue
operation houses from Red
Cross), concrete (some
mixed with pawid) houses
pawid and concrete
houses (some
concrete houses are
mixed with pawid)
houses (mixed
concrete and
pawid)
Services/ Establishments Resort electricity lines, fish port,
ice plant
sari- sari stores, barangay
hall/ court, electricity lines,
church, water system,
Barangay Health Station
(BHS),
electricity lines electricity lines
Animals bee eater chicken, Barangkas/ horse
shoe crab (IUCN Red Data
List)
chicken, dog, , little egret,
crow, poultry (pig), cat,
goat
egret, chicken,
dog, tilapia
Problem/ Threats erosion (side rail) habagat, Barangkas/ horse
shoe crab (IUCN Red Data
List)
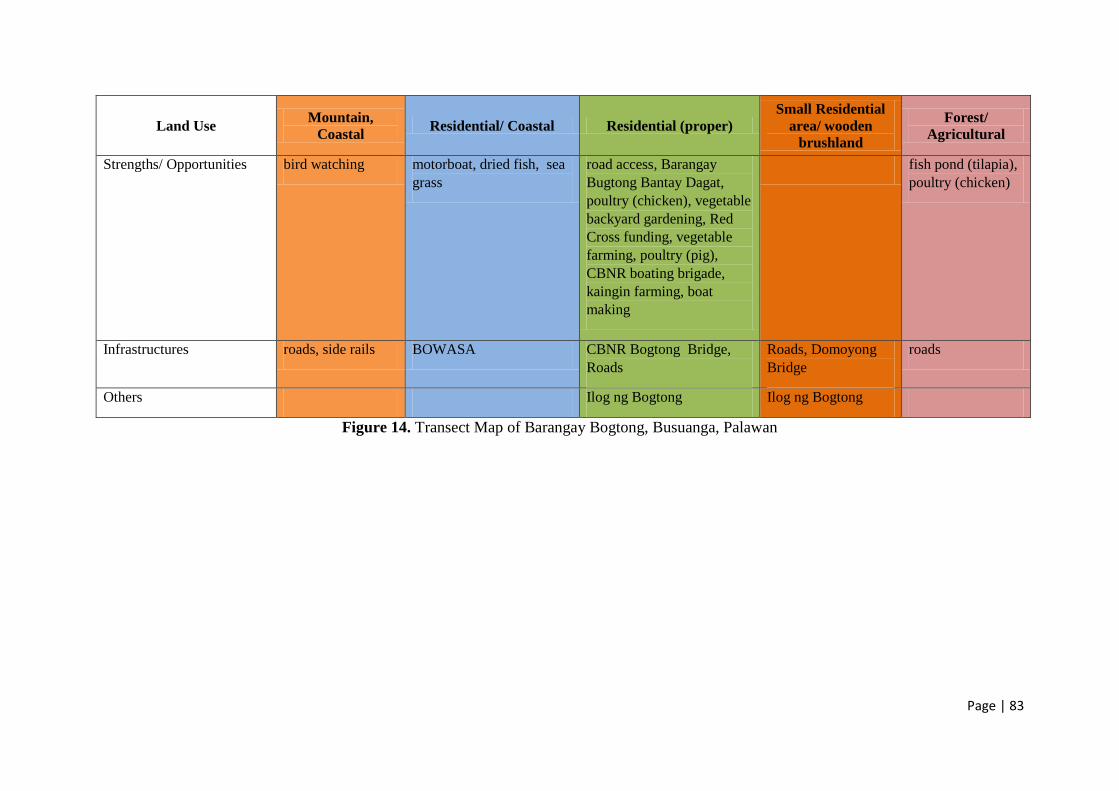
Page | 83
Land Use Mountain,
Coastal Residential/ Coastal Residential (proper)
Small Residential
area/ wooden
brushland
Forest/
Agricultural
Strengths/ Opportunities bird watching motorboat, dried fish, sea
grass
road access, Barangay
Bugtong Bantay Dagat,
poultry (chicken), vegetable
backyard gardening, Red
Cross funding, vegetable
farming, poultry (pig),
CBNR boating brigade,
kaingin farming, boat
making
fish pond (tilapia),
poultry (chicken)
Infrastructures roads, side rails BOWASA CBNR Bogtong Bridge,
Roads
Roads, Domoyong
Bridge
roads
Others Ilog ng Bogtong Ilog ng Bogtong
Figure 14. Transect Map of Barangay Bogtong, Busuanga, Palawan
Page | 84
Mountain/Coastal
The transect map took place in barangay Bogtong in which 80%-90% of the
community are engaged to fishing. The ecosystems identified in the first two points are:
mountain (left) and coastal (right) ecosystem. Dominant plant species seen as the transect
line was being traversed were buho, siklat, and banana, while bee eater was observed.
Currently, there is an on-going road construction in the mountain affecting the travel time
of vehicles (longer travel time) and causing erosion. There were no housing units in the
area, but a resort by the transect line. It also has potentials for bird watching activities.
Residential/Coastal
Dominant plant species observed on the way were kamoteng kahoy, coconut,
mango, banana, doldol, pagatpat, tandol, talaba, danggit, samara, tarawis, mangoro,
bangkuro, mangroves, lunihan, and tursilyo. Animals such as chicken, barangkas (horse
shoe crab) were present in the area. The horse shoe crab is considered as an endangered
species; it is included in the IUCN Red Data List. Traversing the transect line, waiting shed
(concrete) and houses made of pawid, and a portion of the mangrove area were observed.
Electricity lines, disks for cable television service, fish port, and an ice plant (Geteb Island)
are also found around the area. Moreover, presence of fisher folk association, motorboats,
drying of fish, and lambat making are identified opportunities in the area. Meanwhile,
livelihood of fishermen are threatened because there had been considerable decrease in fish
catch caused by habagat.
Residential (Proper)
This portion of the transect line is where most of the houses and infrastructures in
the barangay is situated. Settlements lie on both sides of the main highway. Houses in the
area are made out of concrete materials while others are mixed with pawid. These include
rescue operation houses funded by Red Cross (houses made of pawid). Vegetation which
were observed in the area include fruit trees such as guyabano, santol, mango, coconut, star
apple, banana, pineapple, tamarind, duhat, and papaya and other plants such as bamboo,
anahaw, banaba, cat tail, palm, tisa, siklat (buho),bunga, narra, acacia, hagunoy, olibak,
and kakwate. Domestic animals such as chickens, dogs, little egret, crow, pigs, cats, and
goats are also found in the area. Moreover, sari- sari stores, a barangay hall, basketball
court, electricity lines, church, water system, and a Barangay Health Station (BHS) were
traversed along the transect. Aside from the main highway, the Bogtong River traverses the
transect line, and is where the Bogtong bridge is located. Strengths or opportunities that it
offers include the following: It has access to road services; established the Barangay
Bugtong Bantay Dagat; livelihood opportunities to offer such as poultry farming (chicken)
and livestock production (pigs); backyard vegetable gardens; a CBNR boating brigade;
kaingin farming; poultry (chicken), vegetable backyard gardening; and boat making as one
of their sources of livelihood.
Small Residential Area
In the small residential area of the barangay, houses located in either side of the
road are made of materials such as pawid, and concrete; these houses are serviced with
Page | 85
electricity. Plant species such as badyang, buho, siklat, acacia, narra, dulo, sahing (dagta
used as fuel and material for rubber making), acapulco, kasuy are also present in the area.
Moreover, before the entry to the forest ecosystem, Ilog ng Bogtong and Domoyong Bridge
is found.
Forest and Agricultural Area
Beside the forest area (left side of the transect line), there are agricultural fields
(right side of the transect line) being cultivated for palay production. Residents in this area
live in houses made up of concrete and pawid; settlements in the area also avail electric
services and get domestic water supply from the barangay’s watershed (hoses are
dominantly used by the community in outsourcing water for domestic use). Animals found
in the area are egret, dog, and chicken, while dominant plant species found in the area are
banana, sahing, bunga, acacia, badyang, coconut, jack fruit, pineapple, coconut, gabi,
sagulilong, and palay. Meanwhile, opportunities in the forest area, include cultivation of
palay, tilapia raising (fish ponds), and poultry chicken.
The transect line comprised of the mountain/coastal, residential/coastal, residential
(proper), small residential area, forest/agricultural area is located in the multiple use zone
area of barangay Bogtong. It was found out that the activities in the area do not deter the
environment, since activities performed is in accordance with the delineated ECAN zone.
A multiple use zone is defined as “areas where the landscape has been modified for
different forms of land use such as intensive timber extraction, grazing and pastures,
agriculture and infrastructures development (PCSDS).” According to PCSD activities in
the area may include any of the following: “timber extraction with community-based forest
management; grazing and pastures; agriculture; infrastructure and industrial development;
recreation; education; research; and other sustainable activities.”
Page | 86
CHAPTER 3: MAJOR STEPS IN THE ECAN PLAN
PREPARATION
The ECAN Resource Management Plan (ERMP) is designed to be strategic and
practical. It is composed of programs, guidelines and strategies for each municipally-
adopted ECAN zones. Discussed below are the key parts of the plan.
A. Ecological Profiling
Ecological Profile includes both socio-economic and biophysical profiles of the
municipality; more than determining the resources available in the area, the current status
of a municipality among its development sectors are also being analyzed. In profiling, (1)
geophysical/environment, (2) population and social, (3) local economy, (4) infrastructure
and (5) institutional sectors were included.
Secondary data were used by the practicum team in order to formulate the
Ecological Profile of the Municipality. Necessary information needed for analysis and
representation of each development sector of the municipality were obtained from plans
and documents such as the Comprehensive Land Use Plan (CLUP), Comprehensive
Development Plan (CDP), Local Development Investment Plan (LDIP), Community-Based
Monitoring System (CBMS), Socio-Economic Profile (SEP), Annual Investment Plan
(AIP), Field Health Service Information System (FHSIS); MAO, MPDO, Licensing Office,
MHO, Budget Office, MDDRM Office, Engineering Office, Legislative Office, and
Tourism Office have provided these data. Moreover, using ARC Map, maps were also
generated by the practicum team using; existing thematic maps from the PCSD and LGU
were utilized.
B. Participatory Resource Mapping
The conduct of the Participatory Resource Mapping, also known as the Community-
Based Resource Mapping, was used to integrate the spatial knowledge of the residents in
the municipality. Participants of this activity were representatives from its municipal
barangays- particularly, barangay captains, secretaries, and councilors. With three clusters
of municipal barangays, four to five barangays per day have attended the three- day activity.
Besides generating maps which helped identify and locate land and coastal
resources, traditional knowledge and practices, political boundaries, proposed and
approved ancestral domains, it also became effective in documenting opportunities and
threats in the locale- to its municipally- adopted ECAN Zones. To have a deeper analysis
of the municipality’s ECAN Zones, these resource maps and the existing ECAN Zone map
of the municipality were overlayed. This have determined and assessed the existing
situation and concerns relevant to the municipality’s ECAN Zones.
C. Driver, Pressure, State, Impact, Response (DPSIR) Framework Analysis
DPSIR Framework Analysis was used to integrate results of ecological profiling,
participatory resource mapping, KII, and stocktaking interviews; more than identifying
Page | 87
existing pressures (problems) and their drivers, the current state and impact of these
pressures as well as responses and proposed actions to these pressures were identified. In
doing this analysis, threats per ECAN zone were classified, analyzed, and validated through
research, while solutions solving these problems/issues were formulated with information
gathered through interviews and research.
D. Participatory ECAN Planning Workshop
The ECAN Planning Workshop, headed by PCSD, was attended by participants
from different barangays and offices in the municipality. Besides validating primary and
secondary data used by the practicum team, participatory planning activity was done.
Through a break-out session, participants which were divided into groups have
administered formulating and prioritizing adaptable plans of action for the threats identified
in each ECAN zones; results on ecological profiling, participatory resource mapping, and
DPSIR framework analysis have guided the said activity.
Overall, results generated from ecological profiling, participatory resource
mapping, DPSIR analysis and ECAN planning workshop were collated by the practicum
team in order to formulate the ERMP.
Page | 88
CHAPTER 4: THE ECAN ZONING STATEGY
A. Components of the ECAN Zones
In order to sustainably manage land and water resources, ECAN zoning as
a strategy was employed in the province of Palawan. SEP law, in its strategy, have
identified three components with respective ECAN Zones delineating their use and function
(SEP law and PCSD Resolution 05- 250). The strategy is inclusive of the following;
1.) Terrestrial Component:
1.1 Core zone
1.2 Buffer zone (The Buffer zone is further subdivided into three sub-zones:
Restricted use area, Controlled use area, and Traditional use area)
1.3 Multiple use zone
2.) Coastal/ Marine Component
2.1 Coastal/Marine Core zone
2.2 Coastal/Marine Multiple use zone (The Coastal/ Marine use zones are further
divided into two sub-zones: Transition/Buffer zone and Sustainable/General use zone)
3.) Tribal Ancestral Land (encompassing both land and water resources and
transcending all zones)
B. Criteria and Parameters in the Delineation of the ECAN Zones
In implementing the ECAN zoning strategy, delineation of its land and water
resources are guided by various considerations. These include elevation, slope, land cover,
habitat of endangered species, critical watershed for land resources; mangrove cover, coral
cover, seagrass cover, reef fish density, sightings of dugongs and other marine mammals
for coastal resources; and cultural considerations for tribal resources. Details of these
criteria (considerations) are shown in the Tables 54 & 55.
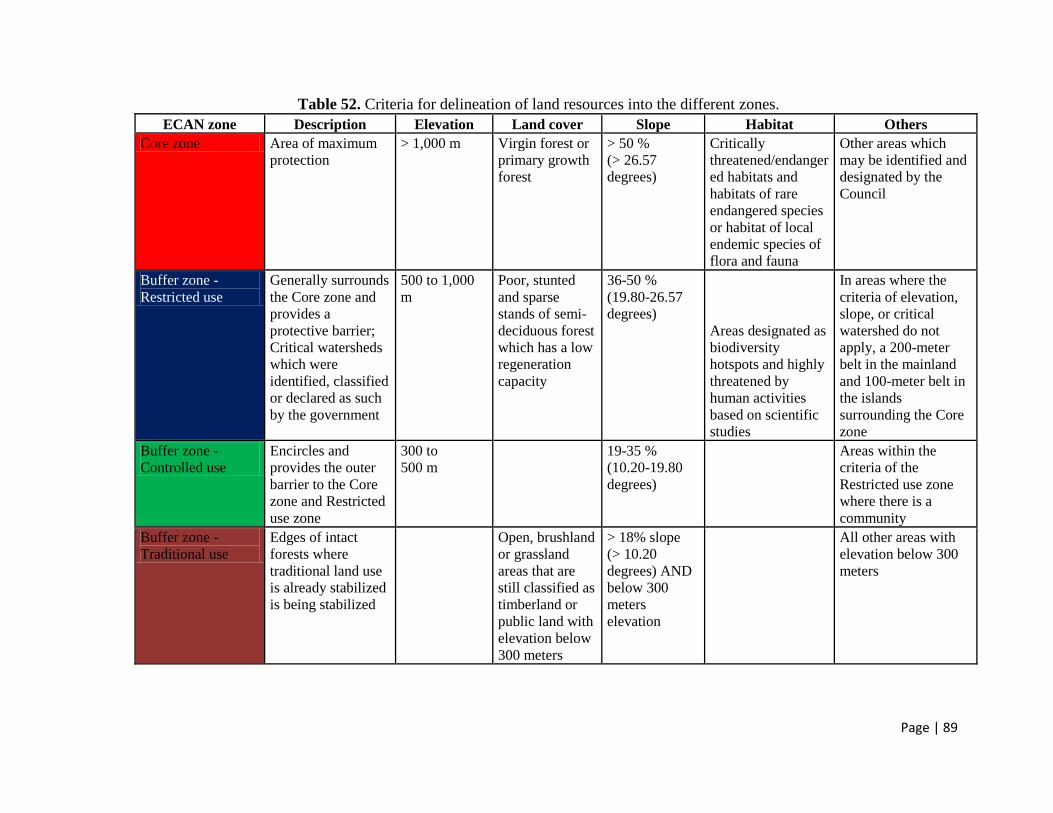
Page | 89
Table 52. Criteria for delineation of land resources into the different zones.
ECAN zone Description Elevation Land cover Slope Habitat Others
Core zone Area of maximum
protection
> 1,000 m Virgin forest or
primary growth
forest
> 50 %
(> 26.57
degrees)
Critically
threatened/endanger
ed habitats and
habitats of rare
endangered species
or habitat of local
endemic species of
flora and fauna
Other areas which
may be identified and
designated by the
Council
Buffer zone -
Restricted use
Generally surrounds
the Core zone and
provides a
protective barrier;
Critical watersheds
which were
identified, classified
or declared as such
by the government
500 to 1,000
m
Poor, stunted
and sparse
stands of semi-
deciduous forest
which has a low
regeneration
capacity
36-50 %
(19.80-26.57
degrees)
Areas designated as
biodiversity
hotspots and highly
threatened by
human activities
based on scientific
studies
In areas where the
criteria of elevation,
slope, or critical
watershed do not
apply, a 200-meter
belt in the mainland
and 100-meter belt in
the islands
surrounding the Core
zone
Buffer zone -
Controlled use
Encircles and
provides the outer
barrier to the Core
zone and Restricted
use zone
300 to
500 m
19-35 %
(10.20-19.80
degrees)
Areas within the
criteria of the
Restricted use zone
where there is a
community
Buffer zone -
Traditional use
Edges of intact
forests where
traditional land use
is already stabilized
is being stabilized
Open, brushland
or grassland
areas that are
still classified as
timberland or
public land with
elevation below
300 meters
> 18% slope
(> 10.20
degrees) AND
below 300
meters
elevation
All other areas with
elevation below 300
meters
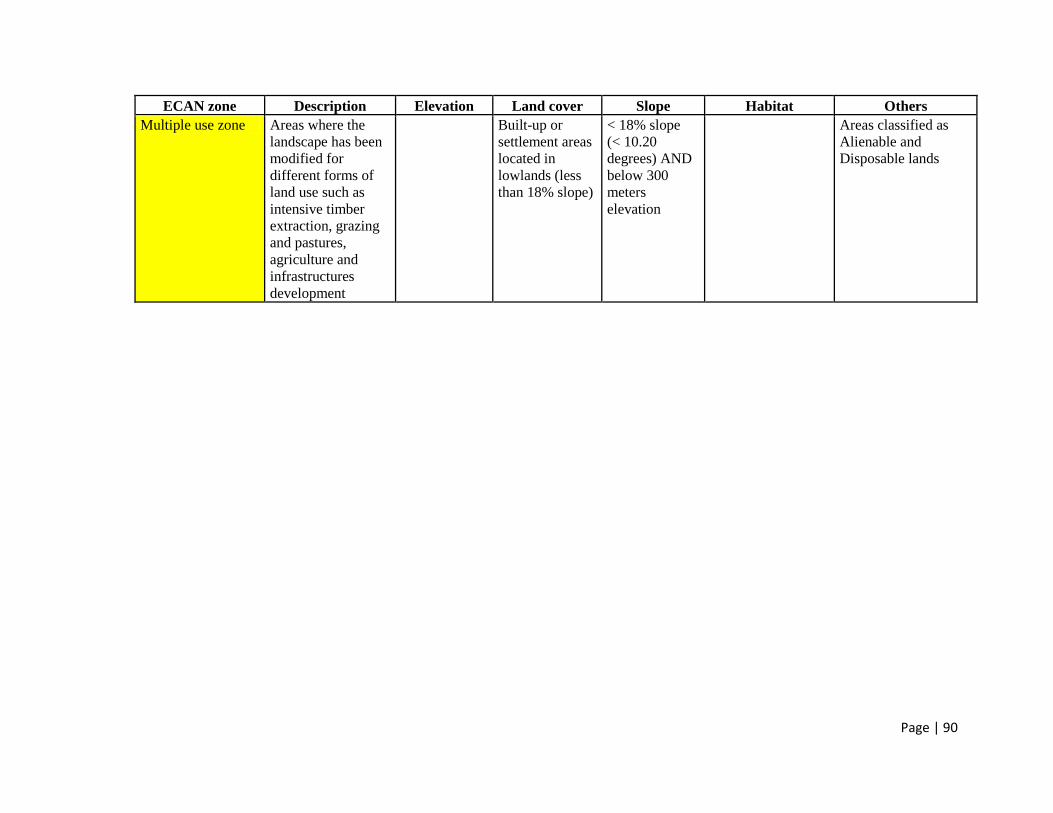
Page | 90
ECAN zone Description Elevation Land cover Slope Habitat Others
Multiple use zone Areas where the
landscape has been
modified for
different forms of
land use such as
intensive timber
extraction, grazing
and pastures,
agriculture and
infrastructures
development
Built-up or
settlement areas
located in
lowlands (less
than 18% slope)
< 18% slope
(< 10.20
degrees) AND
below 300
meters
elevation
Areas classified as
Alienable and
Disposable lands

Page | 91
Table 53 Delineation of water resources into the different zones.
ECAN zone General
description
Criteria
Coastal/Marine
core zone
This area shall be
designated free
from any human
activity. This
includes
sanctuaries for
rare and
endangered
species, selected
coral reefs,
seagrass and
mangrove
ecosystem
reserves.
1. Coral reefs with good to excellent coral
cover condition or 50%-100% coral cover
2. Coralline sites containing at least 50% of
coral genera found in the management
unit of live coral cover ranging from 25-
50%
3. Seagrass beds serving as link habitat of
the coral core zones and/or providing
habitat to rare, threatened and endangered
species
4. Seagrass beds with at least 50% cover of
more than one species of seagrass
5. Seagrass beds with sightings or feeding
tracks of Dugong dugon
6. Coastal/marine habitat of endangered
species declared by IUCN or CITES, DA
or DENR or the PCSD
7. Primary growth mangrove areas and all
areas with standing mangrove forest
cover except areas allocated for MSA,
CBMFMA, ISF and FLA
8. Fish sanctuaries, spawning areas, nursery
areas, breeding/feeding grounds, etc.,
identified/declared by PCSD, Bureau of
Fisheries and Aquatic Resources (BFAR)
or under local government zoning
ordinance
Coastal/Marine
multiple use
zone
The multiple use zones are other coastal/marine areas outside of the
core areas where compatible resource uses may be carried out. The
multiple use zone shall further be subdivided into two major sub-zones
(described below): the buffer zone and the sustainable (general) use
zone.
Coastal/Marine
multiple use zone
-
Transition/Buffer
zone
1. Uninhabited islands or undeveloped
portions thereof not subject to private
rights shall be classified as transition
zone except when identified/declared as
ancestral coastal/marine waters
2. Uninhabited islands or islets with an area
of less than 500 hectares
3. Degraded small islands with an area of
less than 500 hectares
4. Released areas for fishpond development
which were utilized and abandoned
including those not utilized for 5 years
from the date of the release
5. Degraded habitats of endangered marine
species
6. Denuded mangrove forest
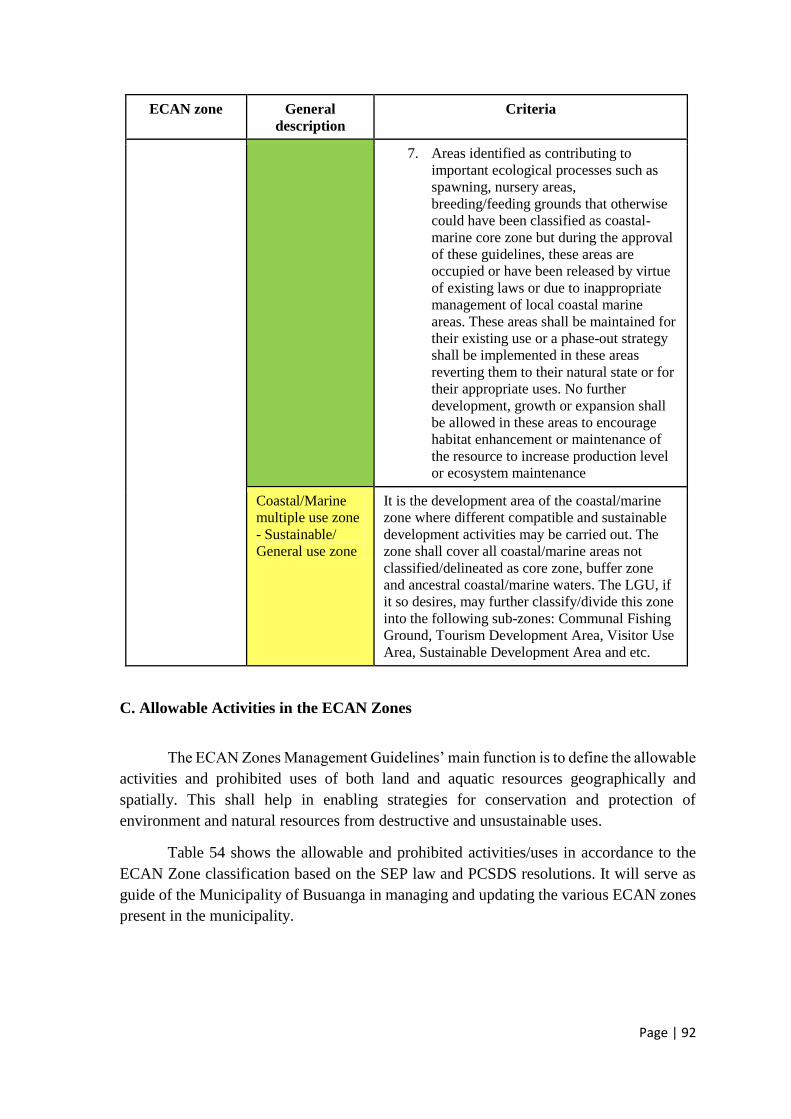
Page | 92
ECAN zone General
description
Criteria
7. Areas identified as contributing to
important ecological processes such as
spawning, nursery areas,
breeding/feeding grounds that otherwise
could have been classified as coastal-
marine core zone but during the approval
of these guidelines, these areas are
occupied or have been released by virtue
of existing laws or due to inappropriate
management of local coastal marine
areas. These areas shall be maintained for
their existing use or a phase-out strategy
shall be implemented in these areas
reverting them to their natural state or for
their appropriate uses. No further
development, growth or expansion shall
be allowed in these areas to encourage
habitat enhancement or maintenance of
the resource to increase production level
or ecosystem maintenance
Coastal/Marine
multiple use zone
- Sustainable/
General use zone
It is the development area of the coastal/marine
zone where different compatible and sustainable
development activities may be carried out. The
zone shall cover all coastal/marine areas not
classified/delineated as core zone, buffer zone
and ancestral coastal/marine waters. The LGU, if
it so desires, may further classify/divide this zone
into the following sub-zones: Communal Fishing
Ground, Tourism Development Area, Visitor Use
Area, Sustainable Development Area and etc.
C. Allowable Activities in the ECAN Zones
The ECAN Zones Management Guidelines’ main function is to define the allowable
activities and prohibited uses of both land and aquatic resources geographically and
spatially. This shall help in enabling strategies for conservation and protection of
environment and natural resources from destructive and unsustainable uses.
Table 54 shows the allowable and prohibited activities/uses in accordance to the
ECAN Zone classification based on the SEP law and PCSDS resolutions. It will serve as
guide of the Municipality of Busuanga in managing and updating the various ECAN zones
present in the municipality.

Page | 93
Table 54. Allowable Activities in the Terrestrial and Coastal ECAN Zones
Component ECAN zone Allowable activities within the management
zone
Terrestrial Core Zone None, except for:
(i) traditional uses of tribal communities for
minimal and soft impact gathering of forest
species for ceremonial and religious purposes, and
(ii) Ecotourism activities as per PCSD Resolution
06-270.
Buffer Zone-
Restricted Use
Zone
Limited and non-consumptive activities which
include: gathering of wild honey; almaciga
tapping; soft-impact recreational activities (hiking,
sight-seeing, bird watching); research; sustainable
activities of indigenous peoples; ecosystem
restoration or rehabilitation; and ecotourism
activities as per PCSD Resolution 06-270.
Buffer Zone-
Restricted Use
Zone
Strictly controlled mining; strictly controlled
logging which is not for profit (i.e., communal
forest, CBFM, etc.); almaciga tapping; tourism
development;
Research; grazing; gathering of honey, rattan, and
other minor forest products.
Buffer Zone-
Traditional Use
Zone
Upland stabilization program; Catchment
management; Hillside farming; industrial tree
plantation; reforestation; integrated social forestry;
community-based forest management.
Multiple Use
Zone
Timber extraction with community-based forest
management; grazing and pastures; agriculture;
Infrastructure and industrial development;
recreation; education; research; and other
sustainable activities.
Coastal/
Marine
Coastal/Marine
core zone
None, except for:
navigation purposes of the local fishing
communities where there are no alternative routes;
emergency situations such as navigational routes
to save life and property;
researches previously authorized by PCSD; and
ecotourism activities as per PCSD Resolution 06-
270.
Coastal/Marine
multiple use
zone –
Transition/Buffer
zone
Habitat restoration, rehabilitation and
enhancement activities;
soft-impact activities (swimming/snorkeling; non-
motored boating (row boats, kayaks, canoes, wind
surfing, etc.);
guided scuba diving;

Page | 94
Component ECAN zone Allowable activities within the management
zone
fishing using highly-selected gears (i.e., hook &
line and gill net) with specification to be
determined by studies;
pre-approved visit or educational activities;
installation of environmental information boards);
and resource enhancement activities.
Coastal/Marine
multiple use
zone –
Sustainable/
General use zone
All sustainable human activities, with certain
development endeavors subject to the EIA system
and to other policies regulating development
projects.
Tribal
ancestral
lands
Tribal ancestral
zone
Activities based on the material and cultural needs
of the indigenous peoples.
Source: PCSD Resolution No. 05-250

Page | 95
CHAPTER 5: PARTICIPATORY RESOURCE MAPPING
Participatory Resource Mapping (PRM) was an effective technique that utilized the
local knowledge of the community in mapping out their environment. It was a powerful
tool that allows every sector of the locality from every barangay to represent them spatially,
bringing their local knowledge and perspectives to the attention of the government
authorities and decision makers. It was based on the premise that the locals possessed expert
knowledge of their community. PRM was used to create maps that represent different
elements present in their community as it helps identifying and locating land and
coastal/marine resources, traditional knowledge and practices, political boundaries,
proposed and approved ancestral domains etc. This methodology has also been effective in
documenting opportunities and threats in the areas concerned.
In the subject of ECAN Resource Management Planning, resource maps were
analyzed through the process of overlaying it with the ECAN Zone Map of the
municipality. This process became significant in validating the existing ECAN Zone Map.
The goal of the PRM was to generate resource maps as is one of the expected major
inputs to an ECAN Zoning Plan through the conduct of ERMP. The generated maps are
expected to be helpful in the formulating actions and programs in the ECAN Resource
Management Planning as it provides substantial and supplemental information to the
DPSIR Analysis.
The specific objectives of PRM are the following:
1. To identify resources, threats and opportunities, present in the
Municipality
2. To locate the pressures identified in the DPSIR Analysis
3. To aid in the updating of ECAN Zones of the municipality through
validating if the resources present in the zones still comply with their
zoning classification
The conduct of participatory resource mapping was attended by representatives,
specifically Barangays Chairman, secretaries, barangay councilors, from each of the
barangays of the Busuanga municipality. For the convenience of the activity, the practicum
team clustered the barangays into three, four to five barangays per day of the activity. The
information gathered from the activity was validated on the last day of PRM and it was
attended by representatives from the LGU.
Figure 15. Methodological Framework of Participatory Resource Mapping
Conduct of Participatory
Resouce Mapping
Digitize Resource Maps
Overlay Resource Maps
and ECAN Zones Map
Analysis and Integration to DPSIR and
ERMP
Page | 96
With the base maps provided by the PCSD, the team asked the representatives to
map out the land and coastal resources available in their respective barangays They were
also asked to identify and locate the threats and opportunities in the area. The raw maps
made by the representatives were digitized into resource maps by the team through the use
of Arc GIS. The generated map of Busuanga is shown in Figure 16.
To have a deeper analysis, the resource maps and ECAN Zone map of Busuanga
municipality were overlayed as shown in Figures 17 and 18. Also this method was used to
integrate the threats and opportunities in their respective zones and to analyse whether or
not there are existing problems to the zones.
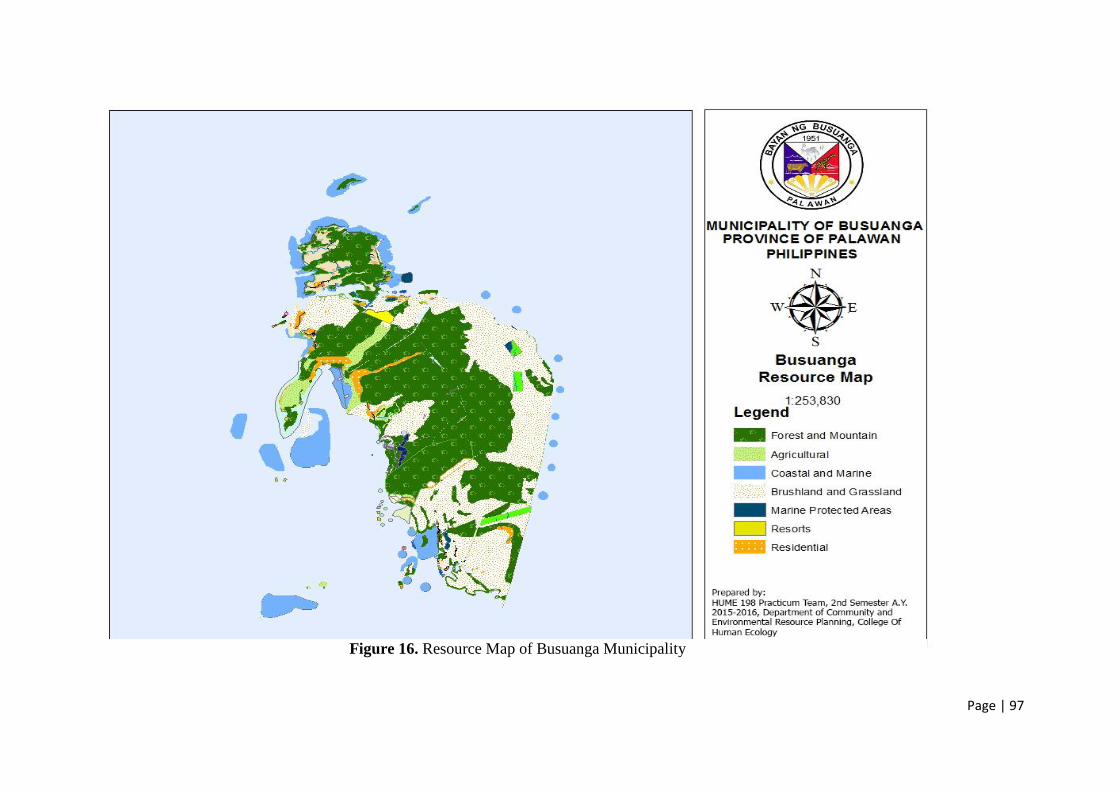
Page | 97
Figure 16. Resource Map of Busuanga Municipality

Page | 98
Figure 17. Busuanga ECAN Resource Overlay Map of Busuanga Municipality
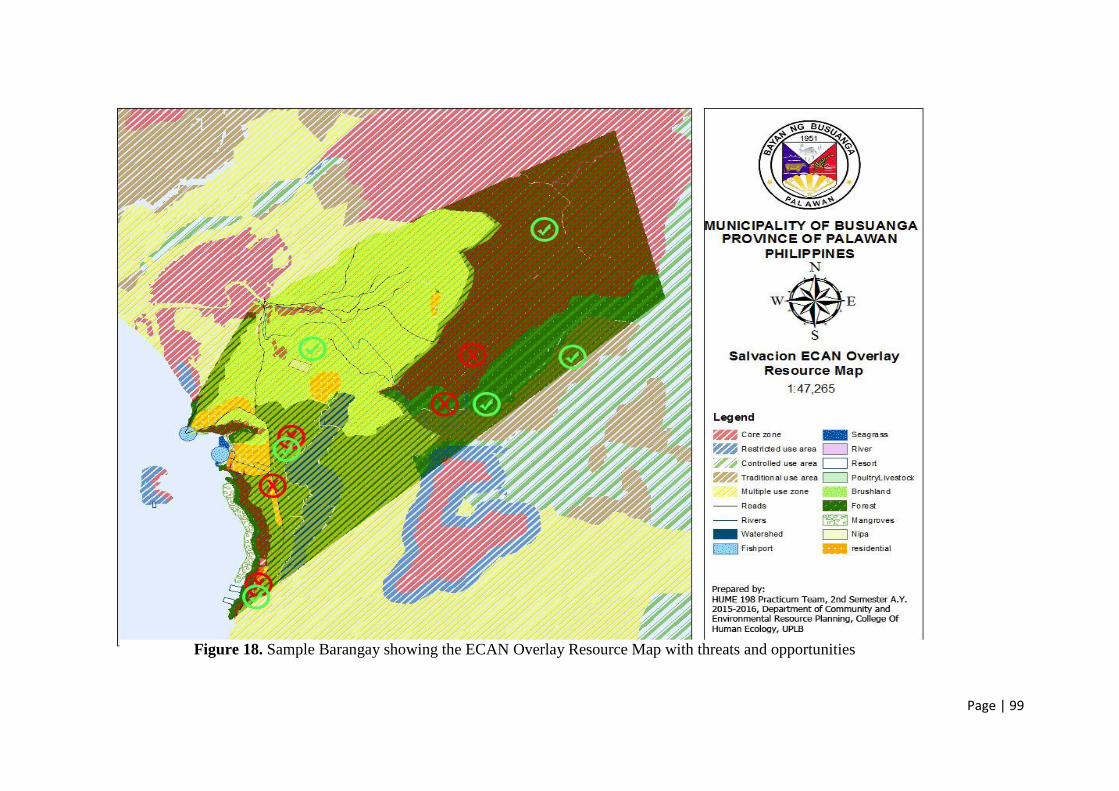
Page | 99
Figure 18. Sample Barangay showing the ECAN Overlay Resource Map with threats and opportunities
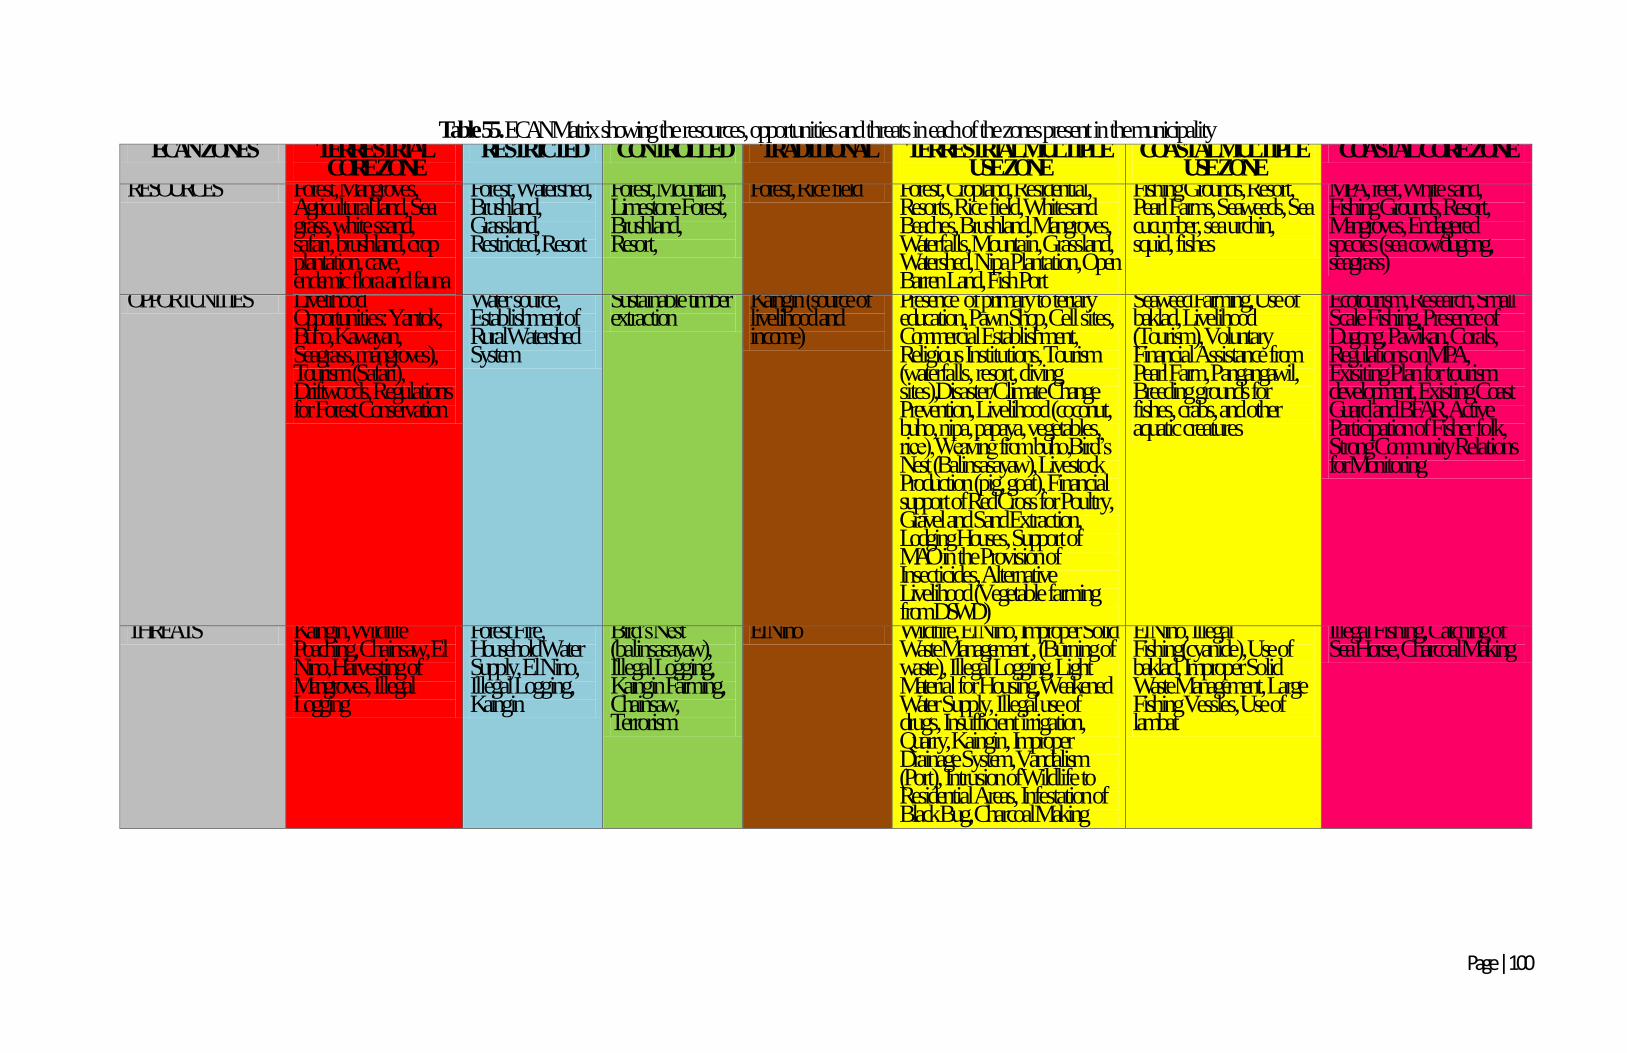
Page | 100
Table 55. ECAN Matrix showing the resources, opportunities and threats in each of the zones present in the municipality ECAN ZONES TERRESTRIAL
CORE ZONE RESTRICTED CONTROLLED TRADITIONAL TERRESTRIAL MULTIPLE
USE ZONE COASTAL MULTIPLE
USE ZONE COASTAL CORE ZONE
RESOURCES Forest, Mangroves, Agricultural land, Sea grass, white ssand, safari, brushland, crop plantation, cave, endemic flora and fauna
Forest, Watershed, Brushland, Grassland, Restricted, Resort
Forest, Mountain, Limestone Forest, Brushland, Resort,
Forest, Rice field Forest, Cropland, Residential, Resorts, Rice field, Whitesand Beaches, Brushland, Mangroves, Waterfalls, Mountain, Grassland, Watershed, Nipa Plantation, Open Barren Land, Fish Port
Fishing Grounds, Resort, Pearl Farms, Seaweeds, Sea cucumber, sea urchin, squid, fishes
MPA, reef, White sand, Fishing Grounds, Resort, Mangroves, Endagered species (sea cow/dugong, seagrass)
OPPORTUNITIES Livelihood Opportunities: Yantok, Buho, Kawayan, Seagrass, mangroves), Tourism (Safari), Driftwoods, Regulations for Forest Conservation
Water source, Establishment of Rural Watershed System
Sustainable timber extraction
Kaingin (source of livelihood and income)
Presence of primary to teriary education, Pawn Shop, Cell sites, Commercial Establishment, Religious Institutions, Tourism (waterfalls, resort, diving sites),Disaster/Climate Change Prevention, Livelihood (coconut, buho, nipa, papaya, vegetables, rice), Weaving from buho,Bird’s Nest (Balinsasayaw), Livestock Production (pig, goat), Financial support of Red Cross for Poultry, Gravel and Sand Extraction, Lodging Houses, Support of MAO in the Provision of Insecticides, Alternative Livelihood (Vegetable farming from DSWD)
Seaweed Farming, Use of baklad, Livelihood (Tourism), Voluntary Financial Assistance from Pearl Farm, Pangangawil, Breeding grounds for fishes, crabs, and other aquatic creatures
Ecotourism, Research, Small Scale Fishing, Presence of Dugong, Pawikan, Corals, Regulations on MPA, Exisiting Plan for tourism development, Existing Coast Guard and BFAR, Active Participation of Fisher folk, Strong Community Relations for Monitoring
THREATS Kaingin, Wildlife Poaching, Chainsaw, El Nino, Harvesting of Mangroves, Illegal Logging
Forest Fire, Household Water Supply, El Nino, Illegal Logging, Kaingin
Bird’s Nest (balinsasayaw), Illegal Logging, Kaingin Farming, Chainsaw, Terrorism
El Nino Wildfire, El Nino, Improper Solid Waste Management , (Burning of waste), Illegal Logging, Light Material for Housing, Weakened Water Supply, Illegal use of drugs, Insufficient irrigation, Quarry, Kaingin, Improper Drainage System, Vandalism (Port), Intrusion of Wildlife to Residential Areas, Infestation of Black Bug, Charcoal Making
El Nino, Illegal Fishing(cyanide), Use of baklad, Improper Solid Waste Management, Large Fishing Vessles, Use of lambat
Illegal Fishing, Catching of Sea Horse, Charcoal Making
Page | 101
With the process of overlaying the resource maps to the existing ECAN Zones Map,
the resources, opportunities and threats in each of the terrestrial and coastal zone were
identified. It can be seen that some of the natural resources are present in every zone but
there were some that are unique in the specific zones present in the municipality of
Busuanga. The results of the overlay also supplement the drivers and pressure from the
DPSIR Analysis. The threats identified in the DPSIR Analysis were located in the resource
maps generated.
For closer analysis of the maps and the specific resources seen in every barangay,
attached in the Annex are the resource maps and ECAN overlay maps per barangay.
A. Terrestrial Core Zone
In the terrestrial core zones, abundant number of flora and fauna were identified;
among these are species that are endemic to the municipality like the Calamian deer and
Lanete. Core zones were also identified to give the locality small scale livelihood as they
acquire raw materials like Buho and Kawayan. This can also bring potential for ecotourism
as this zone possess a wide range of natural resources and biodiversity. In the current ECAN
Zone map, a wildlife sanctuary located in Calauit Island, that is classified as core zone is
also deemed to bring tourism opportunities to the community. On the other hand, even
though core zones were classified as areas prohibited for consumption and commercial
uses, there were still threats listed such as kaingin, wildlife poaching, timber poaching and
illegal harvesting of mangroves. Also, El Nino and natural disasters were the threats that
are common in all zones.
The major forest resources that are found in most of the terrestrial zones were:
Yakal (Shorea astylosa), Ipil (Intsia bijuga), Narra (Pterocarpus indicus), Natok, Luboy,
Malulumboy, Bintang, Taluto (Pterocymbium tinctorium) , Ironwood, Amorawin, Kandis,
Kukolayan, Bunot-bunot, Kukunigan, Inaldong, Buringa, Rattan (Calameae), Banga, Saling,
Buho (Schizostachyum lumampao), bagtu, I-gid, Kalamping, Dulu, Takut, inyam, Lumboy
(Syzygium cumini), Kasoy (Anacardium occidentale), Mangga (Mangifera indica), Ilmuto,
Guyabano (Annona muricata), Balimbing (Averrhoa carambola), Sampaloc (Tamarindus
indica L.), Calamansi (Citrofortunella microcarpa), Ka-mun, Lanete (Wrightia pubescensR.
Br.). While for the fauna, existence of Calamian deer (Hyelaphus calamianensis), Giraffe
(Giraffa camelopardalis), Zebra (Equus quagga), Native wild pig, Bayawak, Snake, Pik-
uy, Parrot, Owl, Monkey, Skunk Balikon, Wild Chicken were found, specifically on core
zones.
B. Terrestrial Resticted Use Zone
Most of the forest resources are the same for most zones, presence of watersheds
that were used as water source for the community were also identified in this area. This is
in line with the allowed activities in this zone however, a few number of resorts were also
noted. This is a conflict with the ECAN Zones Map as such commercial developments are
not allowed in restricted use areas.
Page | 102
C. Terrestrial Controlled Zone
Forest and brushland resources were also the same for this zone however when the
resource maps were overlayed with the ECAN Zone Map, there were some conflicts on
zoning. Limestone forests, which are classified as primary forests must be re-classified
under core zones. In the current ECAN Maps, they were classified under controlled use
zone. Sustainable timber extraction was classified as an opportunity as this zone allows
controlled logging as long as it was not used for large commercial uses. Threats unique to
this zone were illegal harvesting of Balinsasayaw’s nest and terrorism.
D. Terrestrial Traditional Use Zone
The most common resource on traditional use zones aside from the forest were
agricultural resources such as rice fields. The practice of kaingin was identified as an
opportunity in this zone as this small scale agricultural practice was considered a traditional
activity and was mainly used for household consumption. The major threat to this zone is
El Nino for this phenomenon can pose major damage to agricultural crops as well as the
livelihood of those who practices such.
A. Terrestrial Multiple Use Zone
The resources seen in most of the terrestrial zones can also be seen in multiple use
zone, the differences is that these zones have higher concentration of residential areas,
infrastructures and commercial establishments. Most of human activities such as
agriculture, grazing and pasture, infrastructure and industrial development, recreation,
research, education and other sustainable activities are allowed in this zone making
economic, livelihood and tourism opportunities abundant in the area. Threats unique to this
zone are improper solid waste management, insufficient source of water, improper drainage
system, illegal sand and gravel quarrying, intrusion of wildlife to residential areas caused
by illegal logging and infestation of pests to agricultural products.
F. Coastal Multiple Use Zone
Coastal Multiple Use Zones were identified as areas for commercial and tourism
uses. Located in this zones are fishing grounds, resorts and pearl farms. However, a marine
protected area was also present in this zone, this is a conflict with the ECAN Zones Map
as MPA should be under coastal core zones. There are also livelihood and tourism
opportunities in this zone due to the presence of fishing grounds, seaweed farming,
mariculture, use of baklad and resorts. The use of baklad in this zone was also seen as a
threat as it traps marine species such as dugong and pawikan. Other threats to this zone
were illegal fishing such as cyanide, dynamite and presence of large fishing vessels.

Page | 103
G. Coastal Core Zone
Similar with the terrestrial core zone, thare are abundant number of flora and fauna
species among these are endangered species of turtles and dugong. This is brought by the
presence of high seagrass and coral cover in the area. The sightings of dugong and turtles
can open potentials for ecotourism and researches. Even though commercial and tourism
activities are prohibited in this zone, a number of resorts are seen located on some coastal
core zone which is in conflict with the criteria of core zones. The identified opportunities
present or done in coastal core zones are regualations on MPA, plans for tourism
development, existence of coastal guards and active participation of fisher folks for coastal
protection. Threats to coastal core zones are illegal fishing, illegal catching of marine
species such as sea horse and illegal use of mangroves for charcoal making. (Note:The
conflicts identified in specific zones were noted for future validation and updating of ECAN
Zone Map of Busuanga municipality and for program and plan formulation.)
The estimated hectares were calculated by using the geometric calculator feature of
ArcMap. It enabled the practicum team to determine the magnitude of the areas that are
needed to be delineated into their suggested ECAN Zones. It showed that the municipality
of Busuanga has land areas that do not fit into their current classified ECAN Zones,
however some data have not been calculated due to the data available, and there were no
maps available to calculate the estimated hectares of such.
The table shows the barangays in the municipality with existing areas that are not
in conformity with the current ECAN Zoning. These areas have been identified by
overlaying the ECAN map of Busuanga to the generated resource maps. It has been found
out that most conflicts concern the coastal core zone of the municipality, for this zone is
being used as fishing grounds, residential areas, as well as places for building resorts. With
such issues, it has been suggested that most of the concerned zones should be delineated
into multiple use zones.
The current core zone of the Calauit Island is also being raised because of the
existing Certificate of Ancestral Domain Title of the indigenous people residing in the
island. It is suggested that the Calauit Island shall be delineated as a tribal zone in the
municipality.
These results will be used by the Palawan Council for Sustainable Development
and the Local Government Unit of Busuanga for validating and updating the current
ECAN zones present in the municipality.

Page | 104
H. ECAN Zone Issues
Table 56. Identified issues in the ECAN Zones raised in the Participatory Resource
Mapping
Barangay
Current
ECAN
Zone
Suggested
ECAN
Zone
Conflict/ Issue
Estimated
Hectares
(Ha)
Action
Taken (Accept/
Reject/For
validation) Buluang Controlled Core Limestone forests,
which are
considered as
primary forest, are
located in
controlled use
zone
26.83 For
validation
Calauit Island Core Tribal This area has an
issued CADT
3,940.09 For
validation
Concepcion Multiple
Use
Restricted Watershed located
under Multiple
Use Zone
60.39 For
validation
Maglalambay Core and
Restricted
Multiple Presence of
residential area in
Core Zone
No
available
map
For
validation
New
Busuanga
Multiple
Use
Restricted Watershed located
under Multiple
Use Zone
No
available
map
For
validation
New
Busuanga
Coastal
Core Core
Zone
Multiple
Use Presence of fishing
grounds in Coastal
Core Zone
No
available
coastal
ECAN map
For
validation
Old
Busuanga
Core Zone Multiple
Use Presence of
residential area in
Core Zone
6.27
For
validation
Old Busuanga Coastal
Core Zone
Multiple
Use Presence of resorts
in coastal Core
Zone
No
available
map
For
validation
Quezon Multiple
Use
BPR located in
Multiple Use Zone
No
available
map
For
validation
Quezon Coastal
core zone
Multiple
Use Presence of resort
in Coastal Core
Zone
No
available
coastal
ECAN map
For
validation
Quezon Coastal
Core
MPA Plan to convert
mangrove areas
into protected area
No
available
coastal
ECAN map
For
validation
Sagrada Core Zone Multiple
Use Presence of
residential area in
Core Zone
3.2 For
validation
Salvacion
(Dimipac
Island)
Restricted Controlled
and below Criteria for
restricted zone
For
validation

Page | 105
Barangay
Current
ECAN
Zone
Suggested
ECAN
Zone
Conflict/ Issue
Estimated
Hectares
(Ha)
Action
Taken (Accept/
Reject/For
validation) doesn’t seem to fit
the current zone.
(Slope/Elevation)
Presence of resort
in the area
San Rafael Core Zone Multiple
Use Presence of
residential area in
Core Zone
No
available
map
For
validation
Sto. Nino Restricted
Use
Multiple
Use Presence of
residential area in
Restricted Zone
No
available
map
For
validation
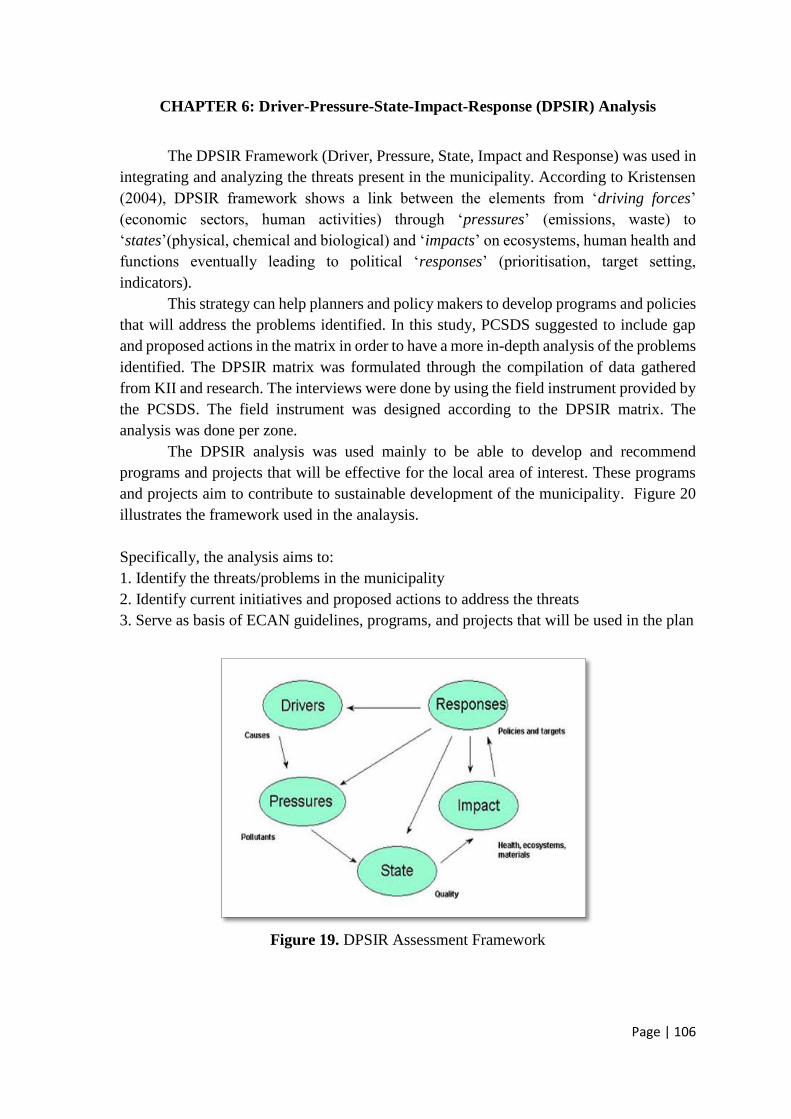
Page | 106
CHAPTER 6: Driver-Pressure-State-Impact-Response (DPSIR) Analysis
The DPSIR Framework (Driver, Pressure, State, Impact and Response) was used in
integrating and analyzing the threats present in the municipality. According to Kristensen
(2004), DPSIR framework shows a link between the elements from ‘driving forces’
(economic sectors, human activities) through ‘pressures’ (emissions, waste) to
‘states’(physical, chemical and biological) and ‘impacts’ on ecosystems, human health and
functions eventually leading to political ‘responses’ (prioritisation, target setting,
indicators).
This strategy can help planners and policy makers to develop programs and policies
that will address the problems identified. In this study, PCSDS suggested to include gap
and proposed actions in the matrix in order to have a more in-depth analysis of the problems
identified. The DPSIR matrix was formulated through the compilation of data gathered
from KII and research. The interviews were done by using the field instrument provided by
the PCSDS. The field instrument was designed according to the DPSIR matrix. The
analysis was done per zone.
The DPSIR analysis was used mainly to be able to develop and recommend
programs and projects that will be effective for the local area of interest. These programs
and projects aim to contribute to sustainable development of the municipality. Figure 20
illustrates the framework used in the analaysis.
Specifically, the analysis aims to:
1. Identify the threats/problems in the municipality
2. Identify current initiatives and proposed actions to address the threats
3. Serve as basis of ECAN guidelines, programs, and projects that will be used in the plan
Figure 19. DPSIR Assessment Framework
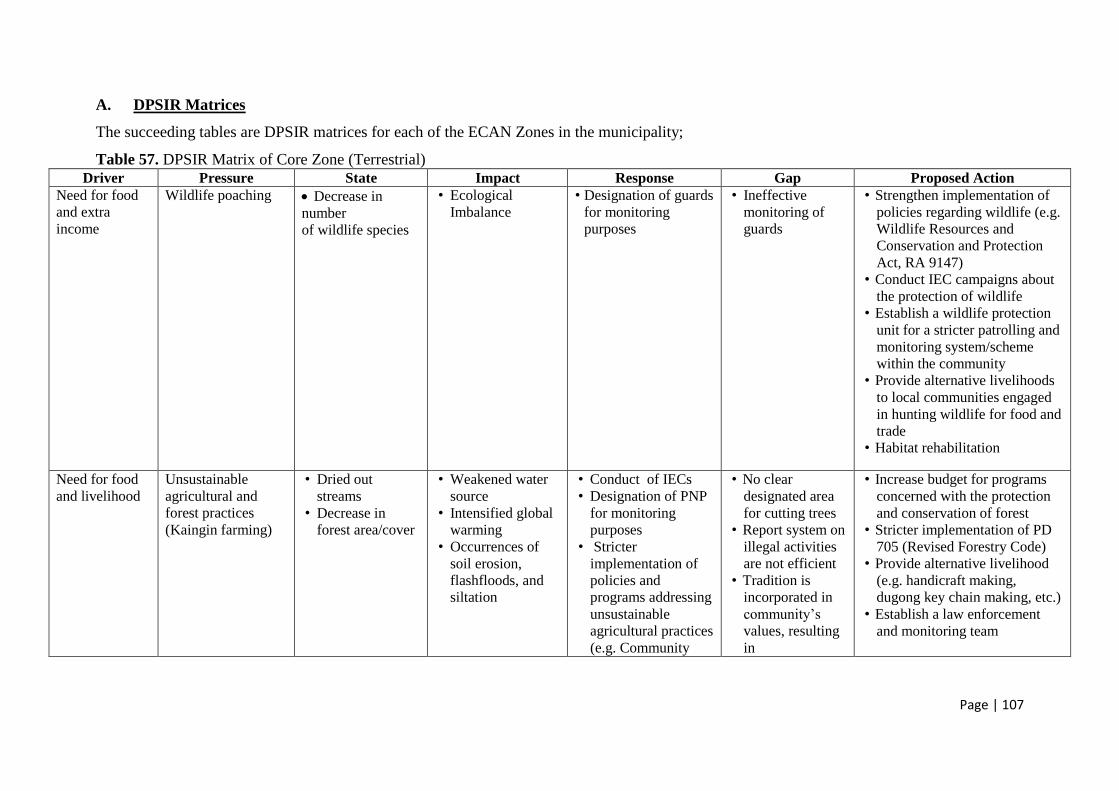
Page | 107
A. DPSIR Matrices
The succeeding tables are DPSIR matrices for each of the ECAN Zones in the municipality;
Table 57. DPSIR Matrix of Core Zone (Terrestrial)
Driver Pressure State Impact Response Gap Proposed Action
Need for food
and extra
income
Wildlife poaching
Decrease in
number
of wildlife species
• Ecological
Imbalance
• Designation of guards
for monitoring
purposes
• Ineffective
monitoring of
guards
• Strengthen implementation of
policies regarding wildlife (e.g.
Wildlife Resources and
Conservation and Protection
Act, RA 9147)
• Conduct IEC campaigns about
the protection of wildlife
• Establish a wildlife protection
unit for a stricter patrolling and
monitoring system/scheme
within the community
• Provide alternative livelihoods
to local communities engaged
in hunting wildlife for food and
trade
• Habitat rehabilitation
Need for food
and livelihood
Unsustainable
agricultural and
forest practices
(Kaingin farming)
• Dried out
streams
• Decrease in
forest area/cover
• Weakened water
source
• Intensified global
warming
• Occurrences of
soil erosion,
flashfloods, and
siltation
• Conduct of IECs
• Designation of PNP
for monitoring
purposes
• Stricter
implementation of
policies and
programs addressing
unsustainable
agricultural practices
(e.g. Community
• No clear
designated area
for cutting trees
• Report system on
illegal activities
are not efficient
• Tradition is
incorporated in
community’s
values, resulting
in
• Increase budget for programs
concerned with the protection
and conservation of forest
• Stricter implementation of PD
705 (Revised Forestry Code)
• Provide alternative livelihood
(e.g. handicraft making,
dugong key chain making, etc.)
• Establish a law enforcement
and monitoring team
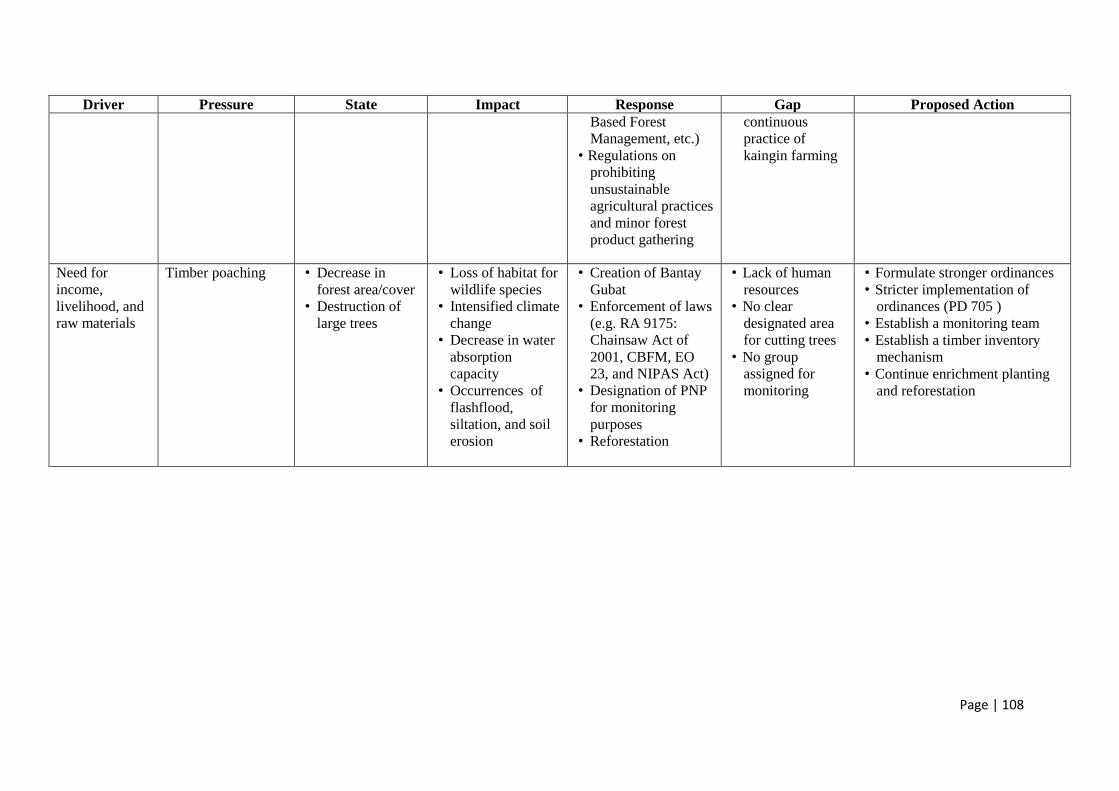
Page | 108
Driver Pressure State Impact Response Gap Proposed Action
Based Forest
Management, etc.)
• Regulations on
prohibiting
unsustainable
agricultural practices
and minor forest
product gathering
continuous
practice of
kaingin farming
Need for
income,
livelihood, and
raw materials
Timber poaching
• Decrease in
forest area/cover
• Destruction of
large trees
• Loss of habitat for
wildlife species
• Intensified climate
change
• Decrease in water
absorption
capacity
• Occurrences of
flashflood,
siltation, and soil
erosion
• Creation of Bantay
Gubat
• Enforcement of laws
(e.g. RA 9175:
Chainsaw Act of
2001, CBFM, EO
23, and NIPAS Act)
• Designation of PNP
for monitoring
purposes
• Reforestation
• Lack of human
resources
• No clear
designated area
for cutting trees
• No group
assigned for
monitoring
• Formulate stronger ordinances
• Stricter implementation of
ordinances (PD 705 )
• Establish a monitoring team
• Establish a timber inventory
mechanism
• Continue enrichment planting
and reforestation
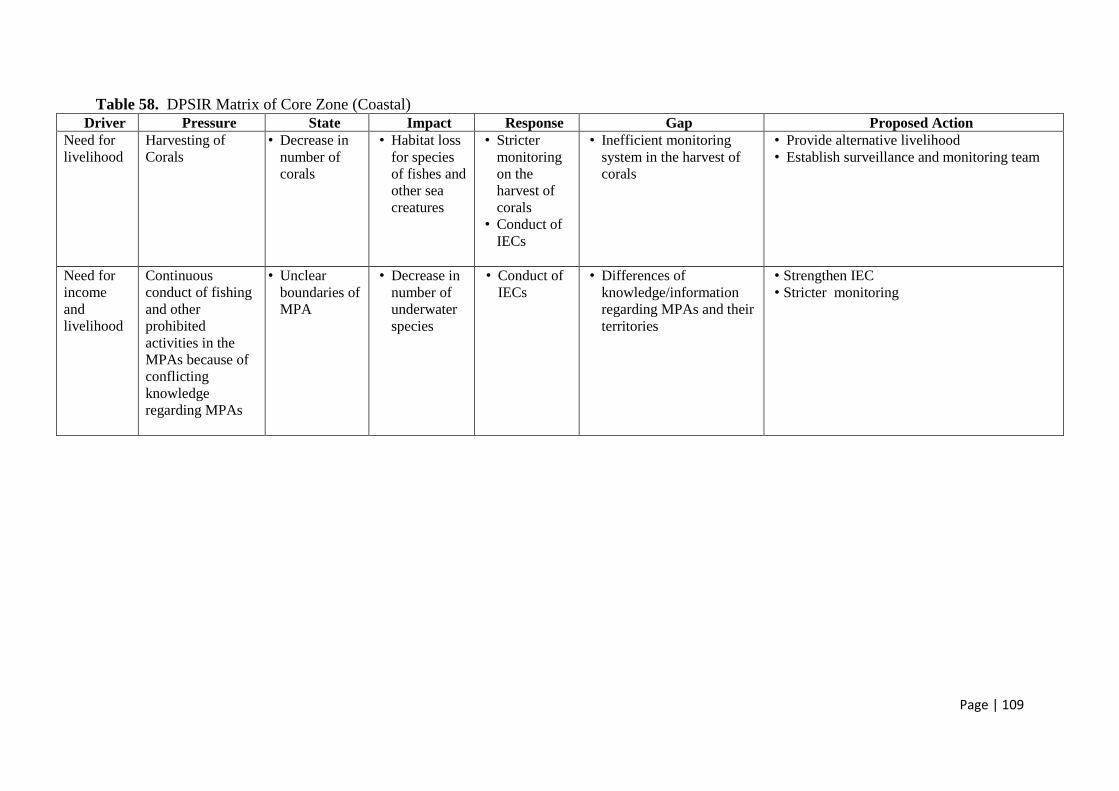
Page | 109
Table 58. DPSIR Matrix of Core Zone (Coastal)
Driver Pressure State Impact Response Gap Proposed Action
Need for
livelihood
Harvesting of
Corals
• Decrease in
number of
corals
• Habitat loss
for species
of fishes and
other sea
creatures
• Stricter
monitoring
on the
harvest of
corals
• Conduct of
IECs
• Inefficient monitoring
system in the harvest of
corals
• Provide alternative livelihood
• Establish surveillance and monitoring team
Need for
income
and
livelihood
Continuous
conduct of fishing
and other
prohibited
activities in the
MPAs because of
conflicting
knowledge
regarding MPAs
• Unclear
boundaries of
MPA
• Decrease in
number of
underwater
species
• Conduct of
IECs
• Differences of
knowledge/information
regarding MPAs and their
territories
• Strengthen IEC
• Stricter monitoring
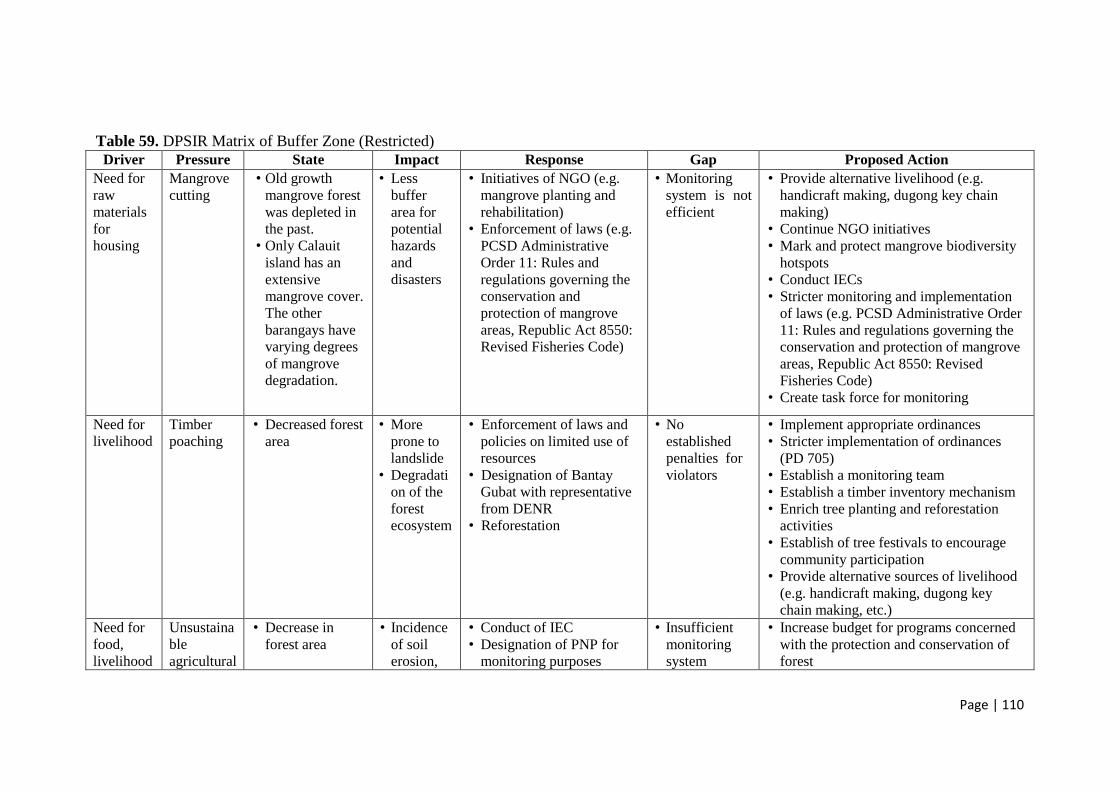
Page | 110
Table 59. DPSIR Matrix of Buffer Zone (Restricted)
Driver Pressure State Impact Response Gap Proposed Action
Need for
raw
materials
for
housing
Mangrove
cutting
• Old growth
mangrove forest
was depleted in
the past.
• Only Calauit
island has an
extensive
mangrove cover.
The other
barangays have
varying degrees
of mangrove
degradation.
• Less
buffer
area for
potential
hazards
and
disasters
• Initiatives of NGO (e.g.
mangrove planting and
rehabilitation)
• Enforcement of laws (e.g.
PCSD Administrative
Order 11: Rules and
regulations governing the
conservation and
protection of mangrove
areas, Republic Act 8550:
Revised Fisheries Code)
• Monitoring
system is not
efficient
• Provide alternative livelihood (e.g.
handicraft making, dugong key chain
making)
• Continue NGO initiatives
• Mark and protect mangrove biodiversity
hotspots
• Conduct IECs
• Stricter monitoring and implementation
of laws (e.g. PCSD Administrative Order
11: Rules and regulations governing the
conservation and protection of mangrove
areas, Republic Act 8550: Revised
Fisheries Code)
• Create task force for monitoring
Need for
livelihood
Timber
poaching
• Decreased forest
area
• More
prone to
landslide
• Degradati
on of the
forest
ecosystem
• Enforcement of laws and
policies on limited use of
resources
• Designation of Bantay
Gubat with representative
from DENR
• Reforestation
• No
established
penalties for
violators
• Implement appropriate ordinances
• Stricter implementation of ordinances
(PD 705)
• Establish a monitoring team
• Establish a timber inventory mechanism
• Enrich tree planting and reforestation
activities
• Establish of tree festivals to encourage
community participation
• Provide alternative sources of livelihood
(e.g. handicraft making, dugong key
chain making, etc.)
Need for
food,
livelihood
Unsustaina
ble
agricultural
• Decrease in
forest area
• Incidence
of soil
erosion,
• Conduct of IEC
• Designation of PNP for
monitoring purposes
• Insufficient
monitoring
system
• Increase budget for programs concerned
with the protection and conservation of
forest

Page | 111
Driver Pressure State Impact Response Gap Proposed Action
, raw
materials
and forest
practices
(Kaingin
farming)
• Decrease in the
number of trees
flashflood
, siltation
and
landslide
• Stricter implementation of
policies and programs
addressing unsustainable
agricultural practices (e.g.
Community Based Forest
Management, etc.)
• Regulations on prohibiting
unsustainable agricultural
practices and minor forest
product gathering
• Stricter implementation of PD 705
(Revised Forestry Code)
• Provide alternative livelihood
• Establish a law enforcement and
monitoring team
Table 60. DPSIR Matrix of Buffer Zone (Controlled)
Driver Pressure State Impact Response Gap Proposed Action
Need for
livelihood
and
income
Illegal
logging
• Decrease in
forest area
• Degradation
of the forest
environmen
t
• Decreased
flood
resiliency
• Creation of Bantay Gubat
• Enforcement of laws (e.g. RA
9175: Chainsaw Act of 2001,
CBFM, EO 23, NIPAS)
• Designation of PNP for
monitoring purposes
• Reforestation
• Lack of human
resources
• Lenient
implementation
of policies
• Implement appropriate ordinances
• Stricter implementation of ordinances (PD
705, )
• Establish a monitoring team
• Establish a timber inventory mechanism
• Continue enrichment planting and
reforestation
Need for
livelihood
and raw
materials
Excavating
for quarry
without
issuance of
permits
• Decreased soil
quality
• Soil Erosion • Establishment of monitoring
team
• On hand committee on
environment from ECAN
board
• Operation
without
approved
permits
• Establish/Practice proper communication
between LGU and private companies
• Review and update fees, charges, and
requirements for permit issuance
Need for
livelihood
Wildlife
poaching
• Decrease number
of wildlife
species
• Disrupted
ecological
balance
• Designation of guards for
monitoring purposes
• Ineffective
monitoring
system
• Strengthen implementation of policies
regarding wildlife (e.g. Wildlife Resources
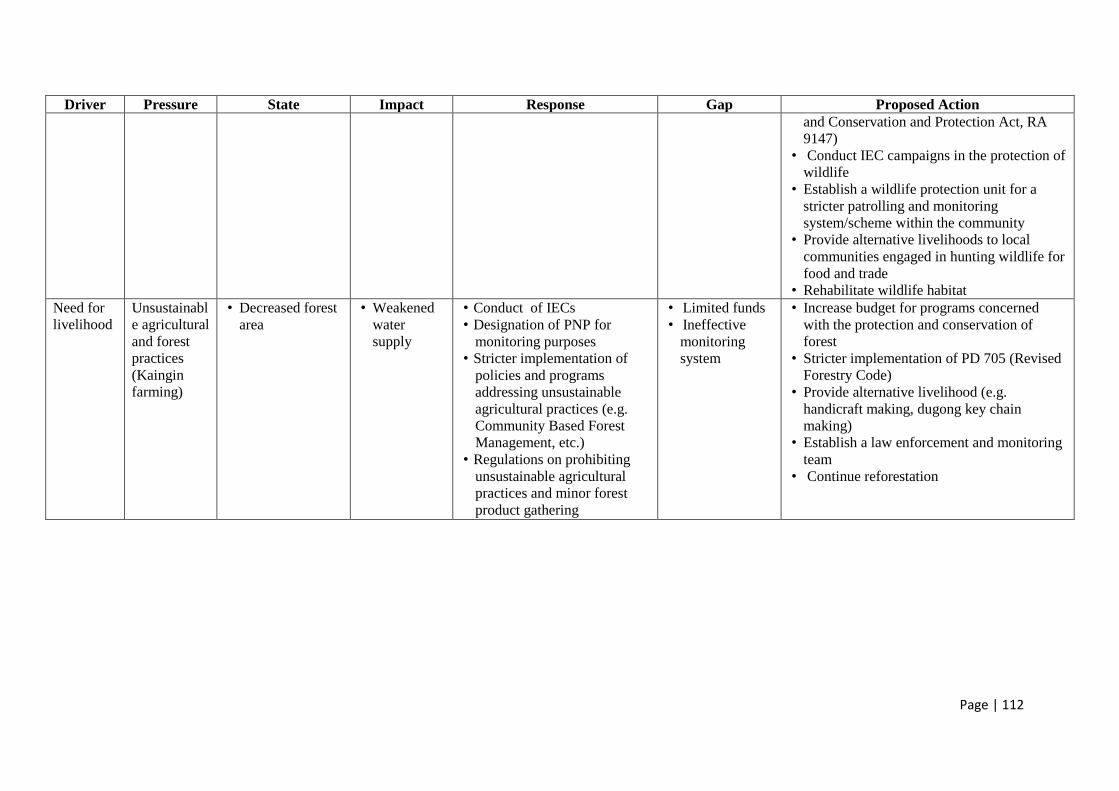
Page | 112
Driver Pressure State Impact Response Gap Proposed Action
and Conservation and Protection Act, RA
9147)
• Conduct IEC campaigns in the protection of
wildlife
• Establish a wildlife protection unit for a
stricter patrolling and monitoring
system/scheme within the community
• Provide alternative livelihoods to local
communities engaged in hunting wildlife for
food and trade
• Rehabilitate wildlife habitat
Need for
livelihood
Unsustainabl
e agricultural
and forest
practices
(Kaingin
farming)
• Decreased forest
area
• Weakened
water
supply
• Conduct of IECs
• Designation of PNP for
monitoring purposes
• Stricter implementation of
policies and programs
addressing unsustainable
agricultural practices (e.g.
Community Based Forest
Management, etc.)
• Regulations on prohibiting
unsustainable agricultural
practices and minor forest
product gathering
• Limited funds
• Ineffective
monitoring
system
• Increase budget for programs concerned
with the protection and conservation of
forest
• Stricter implementation of PD 705 (Revised
Forestry Code)
• Provide alternative livelihood (e.g.
handicraft making, dugong key chain
making)
• Establish a law enforcement and monitoring
team
• Continue reforestation
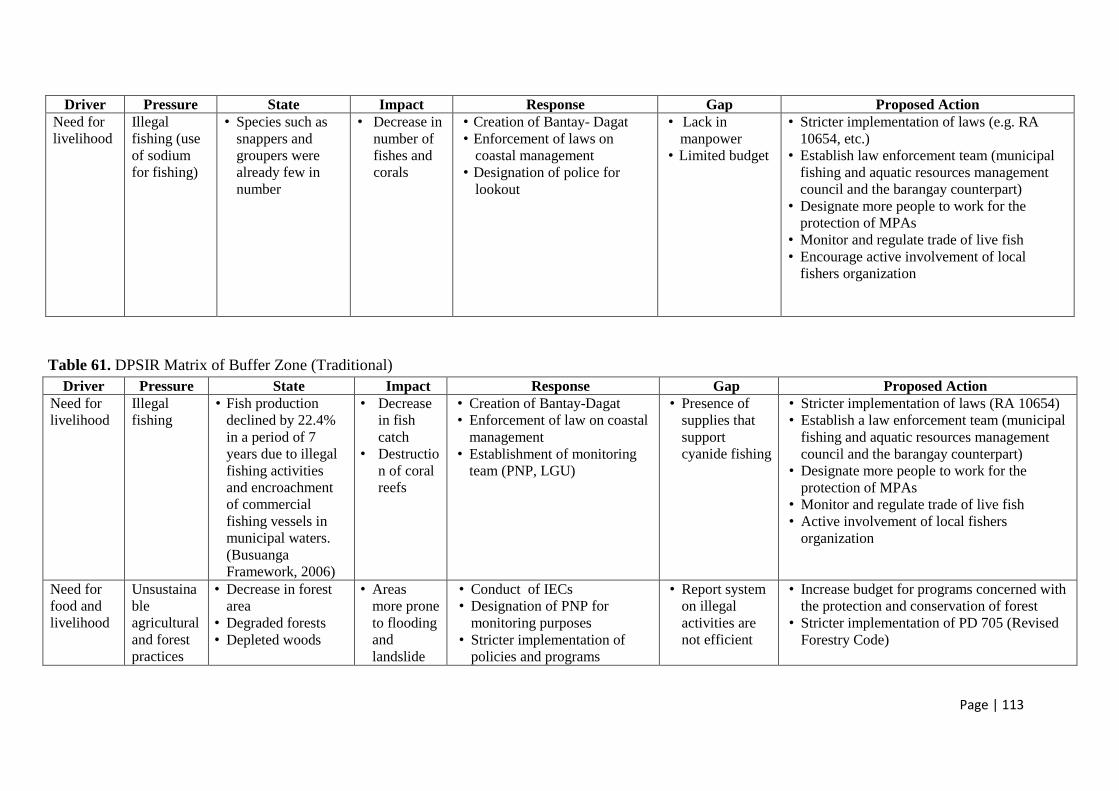
Page | 113
Driver Pressure State Impact Response Gap Proposed Action
Need for
livelihood
Illegal
fishing (use
of sodium
for fishing)
• Species such as
snappers and
groupers were
already few in
number
• Decrease in
number of
fishes and
corals
• Creation of Bantay- Dagat
• Enforcement of laws on
coastal management
• Designation of police for
lookout
• Lack in
manpower
• Limited budget
• Stricter implementation of laws (e.g. RA
10654, etc.)
• Establish law enforcement team (municipal
fishing and aquatic resources management
council and the barangay counterpart)
• Designate more people to work for the
protection of MPAs
• Monitor and regulate trade of live fish
• Encourage active involvement of local
fishers organization
Table 61. DPSIR Matrix of Buffer Zone (Traditional)
Driver Pressure State Impact Response Gap Proposed Action
Need for
livelihood
Illegal
fishing
• Fish production
declined by 22.4%
in a period of 7
years due to illegal
fishing activities
and encroachment
of commercial
fishing vessels in
municipal waters.
(Busuanga
Framework, 2006)
• Decrease
in fish
catch
• Destructio
n of coral
reefs
• Creation of Bantay-Dagat
• Enforcement of law on coastal
management
• Establishment of monitoring
team (PNP, LGU)
• Presence of
supplies that
support
cyanide fishing
• Stricter implementation of laws (RA 10654)
• Establish a law enforcement team (municipal
fishing and aquatic resources management
council and the barangay counterpart)
• Designate more people to work for the
protection of MPAs
• Monitor and regulate trade of live fish
• Active involvement of local fishers
organization
Need for
food and
livelihood
Unsustaina
ble
agricultural
and forest
practices
• Decrease in forest
area
• Degraded forests
• Depleted woods
• Areas
more prone
to flooding
and
landslide
• Conduct of IECs
• Designation of PNP for
monitoring purposes
• Stricter implementation of
policies and programs
• Report system
on illegal
activities are
not efficient
• Increase budget for programs concerned with
the protection and conservation of forest
• Stricter implementation of PD 705 (Revised
Forestry Code)
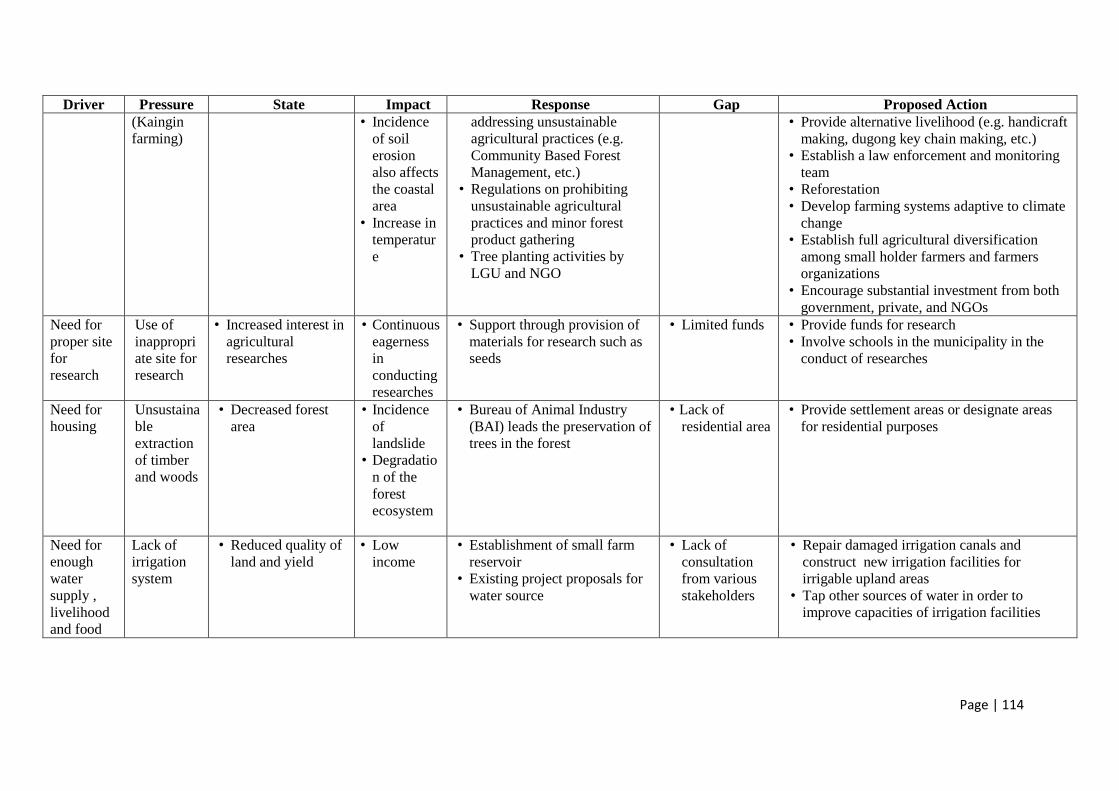
Page | 114
Driver Pressure State Impact Response Gap Proposed Action
(Kaingin
farming)
• Incidence
of soil
erosion
also affects
the coastal
area
• Increase in
temperatur
e
addressing unsustainable
agricultural practices (e.g.
Community Based Forest
Management, etc.)
• Regulations on prohibiting
unsustainable agricultural
practices and minor forest
product gathering
• Tree planting activities by
LGU and NGO
• Provide alternative livelihood (e.g. handicraft
making, dugong key chain making, etc.)
• Establish a law enforcement and monitoring
team
• Reforestation
• Develop farming systems adaptive to climate
change
• Establish full agricultural diversification
among small holder farmers and farmers
organizations
• Encourage substantial investment from both
government, private, and NGOs
Need for
proper site
for
research
Use of
inappropri
ate site for
research
• Increased interest in
agricultural
researches
• Continuous
eagerness
in
conducting
researches
• Support through provision of
materials for research such as
seeds
• Limited funds • Provide funds for research
• Involve schools in the municipality in the
conduct of researches
Need for
housing
Unsustaina
ble
extraction
of timber
and woods
• Decreased forest
area
• Incidence
of
landslide
• Degradatio
n of the
forest
ecosystem
• Bureau of Animal Industry
(BAI) leads the preservation of
trees in the forest
• Lack of
residential area
• Provide settlement areas or designate areas
for residential purposes
Need for
enough
water
supply ,
livelihood
and food
Lack of
irrigation
system
• Reduced quality of
land and yield
• Low
income
• Establishment of small farm
reservoir
• Existing project proposals for
water source
• Lack of
consultation
from various
stakeholders
• Repair damaged irrigation canals and
construct new irrigation facilities for
irrigable upland areas
• Tap other sources of water in order to
improve capacities of irrigation facilities
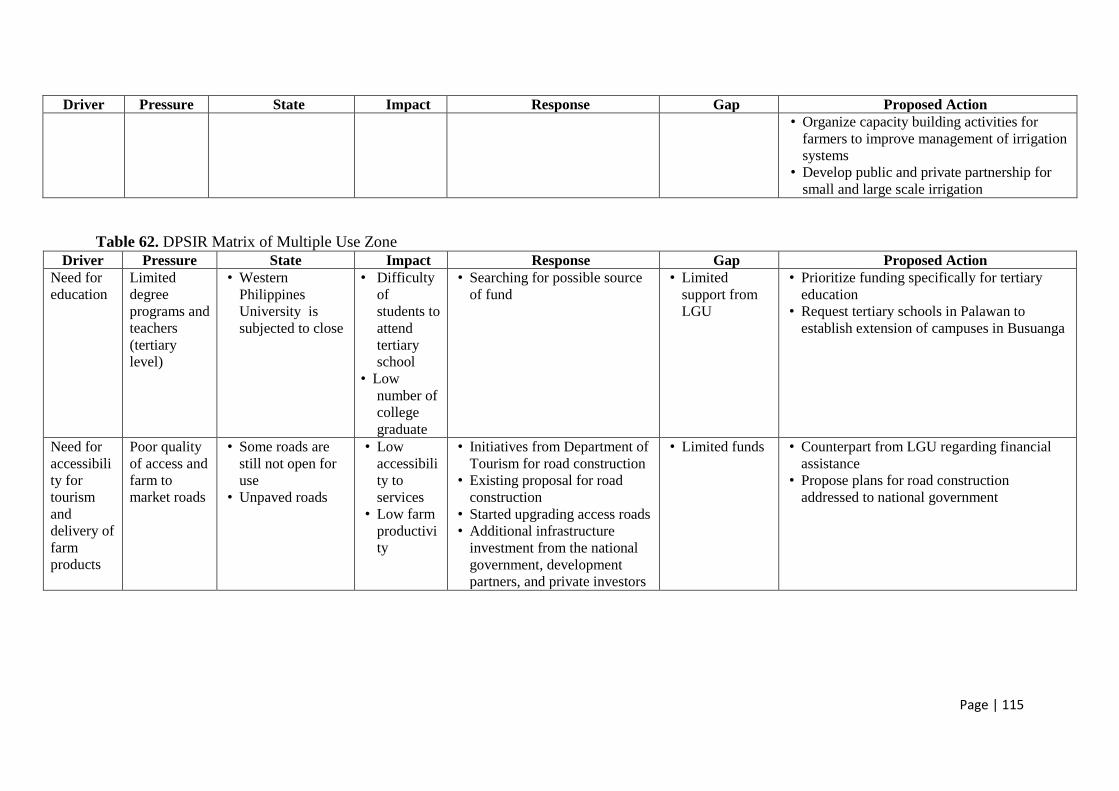
Page | 115
Driver Pressure State Impact Response Gap Proposed Action
• Organize capacity building activities for
farmers to improve management of irrigation
systems
• Develop public and private partnership for
small and large scale irrigation
Table 62. DPSIR Matrix of Multiple Use Zone
Driver Pressure State Impact Response Gap Proposed Action
Need for
education
Limited
degree
programs and
teachers
(tertiary
level)
• Western
Philippines
University is
subjected to close
• Difficulty
of
students to
attend
tertiary
school
• Low
number of
college
graduate
• Searching for possible source
of fund
• Limited
support from
LGU
• Prioritize funding specifically for tertiary
education
• Request tertiary schools in Palawan to
establish extension of campuses in Busuanga
Need for
accessibili
ty for
tourism
and
delivery of
farm
products
Poor quality
of access and
farm to
market roads
• Some roads are
still not open for
use
• Unpaved roads
• Low
accessibili
ty to
services
• Low farm
productivi
ty
• Initiatives from Department of
Tourism for road construction
• Existing proposal for road
construction
• Started upgrading access roads
• Additional infrastructure
investment from the national
government, development
partners, and private investors
• Limited funds • Counterpart from LGU regarding financial
assistance
• Propose plans for road construction
addressed to national government

Page | 116
Driver Pressure State Impact Response Gap Proposed Action
Need for
source of
water for
irrigation
Poor
irrigation
system
• Malfunctioning of
national irrigation
system in some
parts of the
municipality
• Arable
lands that
were not
reached
by the
national
irrigation
system are
not
cultivated
• Proposed irrigation projects
but some are not yet approved
• Some of the
proposed
irrigation
projects of the
municipality
are not yet
approved
• Encourage participation of community for
development/rehabilitation of irrigation
systems
• Provide more irrigation facilities
• Repair damaged irrigation canals and
construct new irrigation facilities for
irrigable upland areas
• Tap other sources of water in order to
improve capacities of irrigation facilities
• Organize capacity building for farmers to
improve management of irrigation systems
• Develop public and private partnership for
small and large scale irrigation
Need for
raw
materials
for road
constructi
on
Gravel and
sand
extraction
• Some mountains
have quarry sites
• Areas
became
prone to
landslide
• Licensing of extractors by the
PMRB
• Lack of
political will
• Review and update fees, charges, and
requirements for issuance of license and
permit
• Stricter monitoring of areas for gravel and
sand extraction
Need for
livelihood
Emergence
of migrants
and illegal
settlers
• Continuous
increase of
informal settlers
(migrants)
• About 65% of the
population added
annually is due to
in-migration.
(Busuanga
Framework,
2006)
• Increase
in crime
rate
• Apprehension of illegal
settlers
• No concrete
actions for this
matter
• Arrange agreements between LGU and
migrants/illegal settlers concerning legal
process of residing in the municipality

Page | 117
Driver Pressure State Impact Response Gap Proposed Action
Need for
commerci
al
livelihood
Encroachme
nt of illegal
commercial
fishing
vessels
Fish production
declined by 22.4%
in a period of 7
years due to illegal
fishing activities and
encroachment of
commercial fishing
vessels in municipal
waters. (Busuanga
Framework, 2006)
• Destructio
n of coral
reefs
• Apprehension of illegal
commercial fishing vessels
• Lack of
manpower for
monitoring
purposes
• Stricter coastal management law enforcement
(FARMC, PNP, fisher folk associations)
• Establish MENRO to strengthen coastal law
enforcement
Need for
livelihood
Illegal
fishing
practices
(e.g.
dynamite,
cyanide, use
of
compressor,
incompliance
to fishing
regulations)
Fish production
declined by 22.4%
in a period of 7
years due to illegal
fishing activities and
encroachment of
commercial fishing
vessels in municipal
waters.
• Decrease
in number
of fish and
corals
• Monitoring system headed by
fisher folk organizations
• Lack of
manpower for
monitoring
purposes
• Stricter implementation of laws and policies
(RA 10654, PCSD Administrative Order No.
5: Revised guidelines for the accreditation,
regulation, and monitoring of live fish
catching culture and transport and trading in
Palawan)
• Establish law enforcement team (municipal
fishing and aquatic resources management
council and the barangay counterpart)
• Designate more people to work for the
protection of areas
• Monitor and regulate trade of live fish
• Encourage active involvement of local
fishers organization
• Provide alternative livelihood opportunities,
trainings and seminars (e.g. backyard
gardening, livestock production)
• Conduct IEC campaigns, assembly meetings,
trainings by NGOs
• Allocate funding and equipment for fisher
folk
• Strengthen Bantay-Dagat

Page | 118
Driver Pressure State Impact Response Gap Proposed Action
• Review qualifications to ensure fair process
for registration
Need for
additional
income
Expansion of
pearl farms
due to
unclear
boundaries of
areas devoted
for pearl
farming
• Less fishing areas
for farmers for
fisherfolks
• Reduce in
number of
fish catch
• Approval of permits by LGU • Political
conflicts
arising
• Demarcation of areas bounded by pearl farms
• Review and updat pearl farming guidelines
Need for
raw
materials
for
housing
and need
for
livelihood
(charcoal
making)
Cutting of
mangroves
• Reduced
mangrove cover
• Reduced
buffer
areas
• Formulation of policies
prohibiting mangrove
extraction
• Arresting violators
• Mangrove rehabilitation
• Monitoring
system is
inefficient
• Provide alternative livelihood (e.g. handicraft
making, dugong key chain making, etc.)
• Continue NGO initiatives
• Mark and protect mangrove biodiversity
hotspots
• Conduct IECs
• Stricter monitoring and implementation of
laws (e.g. PCSD Administrative Order 11:
Rules and regulations governing the
conservation and protection of mangrove
areas, Republic Act 8550: Revised Fisheries
Code)
• Continue advocacy for preservation of
mangroves
• Create task force for monitoring

Page | 119
Table 63. DPSIR Matrix of Tribal Zone
Pressure State Impact Response Gap Proposed Action
Damaging,
defacing, harming,
marring of caves
Minor damage in
caves
• Lack of sense of
place/home for IPs
• Enforcement of laws
concerning ancestral
domain
• Lack of clear
communication between
LGU and IPs
• Regular meetings
between IPs and LGU
• Strict implementation
of RA 9072
Lack of centers for
IP culture
• Representation of IP in
Sangguniang Bayan
• Establish infrastructures
for IPs
Land ownership
issues (no clear
boundaries, illegal
settlers)
No clear land
boundaries
• Presence of conflict • Establishment of
partnerships with
organizations
• Conduct of meetings with
development agencies
• Addressed letter to court
for ancestral domain
claims
• Cases were brought to
court
• Limited fund
• Hold meetings
constantly with
development agencies
• Strengthen partnerships
with other
organizations
• Review and update land
use plan of LGU
Page | 120
Based from tables above, each pressure is caused by the usual drivers such as the
need for food, income and raw materials. Each pressure has effects on the current state of
the environment which were also shown in the table. The pressure also causes impacts to
the environment as well as in the socio- economic aspect. There are current actions being
done by the municipality in order to address these pressures. These are shown in the table
as the responses. Gaps in the responses were also identified in order to strengthen these
current initiatives. Proposed actions were included in the framework to further address the
problem.
From the tables above, pressures occurring in most of the zones are only the ones going to
be tackled. Table 56-58 shows that timber poaching is the pressure present in the core
zone and buffer zone. This leads to loss in the habitat of animal species, intensified
impact from climate change, decreased resiliency to floods, siltation, and soil erosion.
Actions implemented by the local government are the following: enforcement through
Bantay Gubat taskforce, PNP monitoring, reforestation activities, and enforcement of RA
9175 (Chainsaw Act of 2001), CBFM, and EO 23. Despite these solutions, suggested
actions include the following: formulate stronger ordinances, establish a specific
monitoring and evaluation team, establish a timber inventory mechanism, and continue
reforestation. Related to this is the occurring unsustainable farming practices (kaingin
farming) which specifically occurs in the core zone and buffer zone. This activity
contributed to the decrease in forest areas, which further leads to reduced resiliency to
flooding, siltation, and soil erosion. Actions in response to this problem include the
following: IEC campaigns, assignment of a monitoring team, stricter implementation of
policies, and the formulation of policies regarding unsustainable farming practices
(kaingin farming). Another pressure identified was wildlife poaching, which occurs in the
core zone and buffer zone. Impacts of this activity to the environment include disruption
in the ecological balance through the decrease in the number of animal species. Occurring
actions to stop this activity includes the assignment of group of people who are assigned
to monitor the activities involving wildlife poaching. Despite this, suggested actions to
further improve the status of wildlife poaching are the following: strengthen RA 9147,
conduct IEC campaigns, and establishment and operationalization of a wildlife protection
unit, habitat rehabilitation, and provision of alternative livelihood.
Page | 121
B. Synthesis of PRM AND DPSIR
The Ecological Profiling, Participatory Resource Mapping and DPSIR analysis were
effective tools in integrating resources, threats and opportunities present in Busuanga,
Palawan. Ecological Profiling provided baseline information of the different development
sectors of the locale, including resources, threats, and opportunities evident in the
municipality; PRM provided a spatial location of the resources, threats and opportunities
in the municipality; while, DPSIR analysis helped in understanding the current status of the
resources, threats, and opportunities identified.
In the conduct of PRM, the representatives’ local knowledge had been very useful in
identifying the resources, threats, and opportunities in their respective barangays.
Resources in different land areas such as mangroves, nipa plantations, forest area, fishing
grounds, and brush lands had been identified. Also, livelihood, ecotourism, and
maintenance of environmental integrity through regulatory measures which serve as
opportunities were located in the map. Threats had also been identified in the ECAN zones
of the barangays. It had complemented data obtained from the Ecological Profiling of the
municipality and it had been helpful in identifying where the existing pressures from the
DPSIR framework are located. The ECAN overlay resource maps helped in identifying if
the zones are still harmonized with the current zoning classification of the municipality.
Thus, the generated maps can be used in the updating of its ECAN Zones. On the other
hand, DPSIR analysis helped in understanding the current status of the zones present in the
municipality by identifying the threats, and current and proposed actions to address the
threats. Results from these methods were consolidated to provide recommendations and
strategies to draft sustainable management plan for the threats in each zones. Each method
served as a tool to validate information obtained from each method.
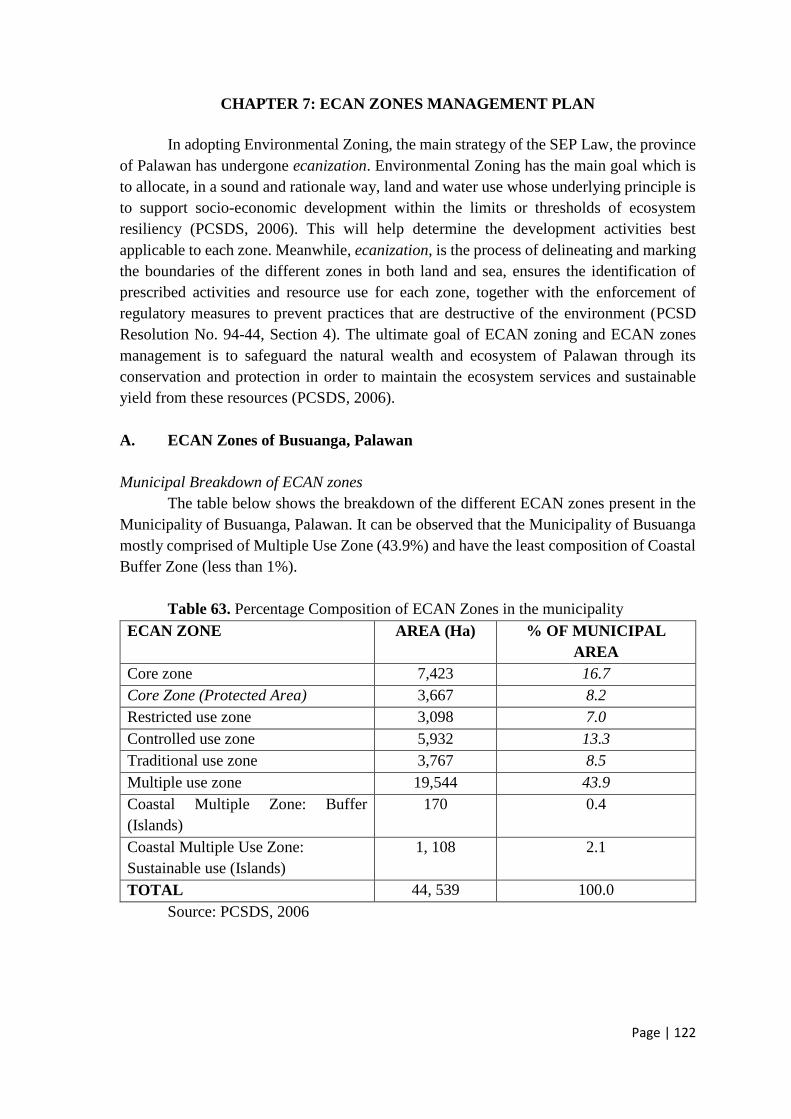
Page | 122
CHAPTER 7: ECAN ZONES MANAGEMENT PLAN
In adopting Environmental Zoning, the main strategy of the SEP Law, the province
of Palawan has undergone ecanization. Environmental Zoning has the main goal which is
to allocate, in a sound and rationale way, land and water use whose underlying principle is
to support socio-economic development within the limits or thresholds of ecosystem
resiliency (PCSDS, 2006). This will help determine the development activities best
applicable to each zone. Meanwhile, ecanization, is the process of delineating and marking
the boundaries of the different zones in both land and sea, ensures the identification of
prescribed activities and resource use for each zone, together with the enforcement of
regulatory measures to prevent practices that are destructive of the environment (PCSD
Resolution No. 94-44, Section 4). The ultimate goal of ECAN zoning and ECAN zones
management is to safeguard the natural wealth and ecosystem of Palawan through its
conservation and protection in order to maintain the ecosystem services and sustainable
yield from these resources (PCSDS, 2006).
A. ECAN Zones of Busuanga, Palawan
Municipal Breakdown of ECAN zones
The table below shows the breakdown of the different ECAN zones present in the
Municipality of Busuanga, Palawan. It can be observed that the Municipality of Busuanga
mostly comprised of Multiple Use Zone (43.9%) and have the least composition of Coastal
Buffer Zone (less than 1%).
Table 63. Percentage Composition of ECAN Zones in the municipality
ECAN ZONE AREA (Ha) % OF MUNICIPAL
AREA
Core zone 7,423 16.7
Core Zone (Protected Area) 3,667 8.2
Restricted use zone 3,098 7.0
Controlled use zone 5,932 13.3
Traditional use zone 3,767 8.5
Multiple use zone 19,544 43.9
Coastal Multiple Zone: Buffer
(Islands)
170 0.4
Coastal Multiple Use Zone:
Sustainable use (Islands)
1, 108 2.1
TOTAL 44, 539 100.0
Source: PCSDS, 2006
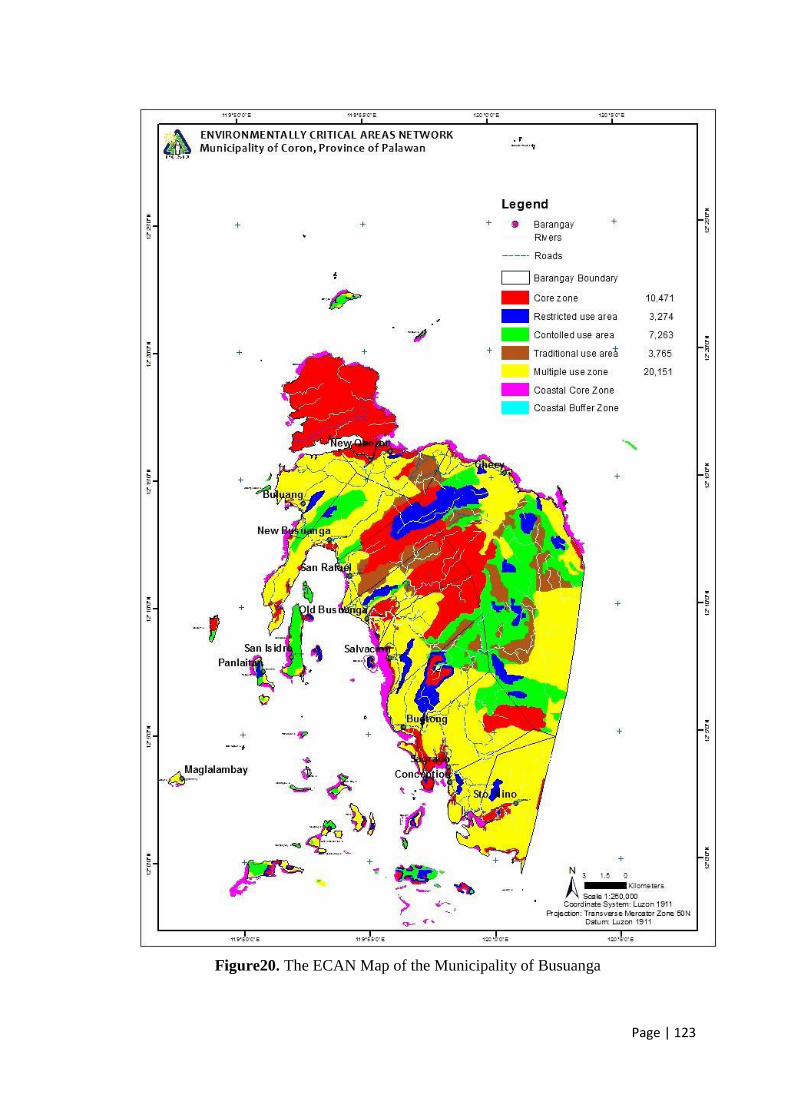
Page | 123
Figure20. The ECAN Map of the Municipality of Busuanga
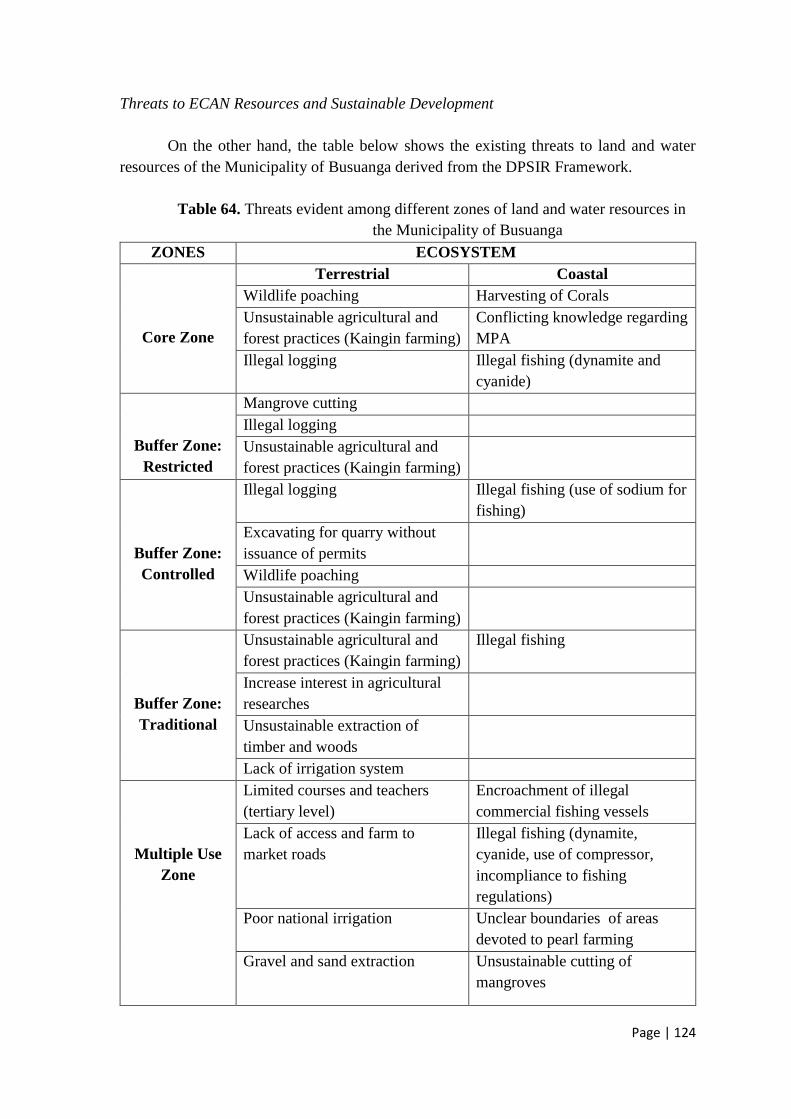
Page | 124
Threats to ECAN Resources and Sustainable Development
On the other hand, the table below shows the existing threats to land and water
resources of the Municipality of Busuanga derived from the DPSIR Framework.
Table 64. Threats evident among different zones of land and water resources in
the Municipality of Busuanga
ZONES ECOSYSTEM
Core Zone
Terrestrial Coastal
Wildlife poaching Harvesting of Corals
Unsustainable agricultural and
forest practices (Kaingin farming)
Conflicting knowledge regarding
MPA
Illegal logging Illegal fishing (dynamite and
cyanide)
Buffer Zone:
Restricted
Mangrove cutting
Illegal logging
Unsustainable agricultural and
forest practices (Kaingin farming)
Buffer Zone:
Controlled
Illegal logging Illegal fishing (use of sodium for
fishing)
Excavating for quarry without
issuance of permits
Wildlife poaching
Unsustainable agricultural and
forest practices (Kaingin farming)
Buffer Zone:
Traditional
Unsustainable agricultural and
forest practices (Kaingin farming)
Illegal fishing
Increase interest in agricultural
researches
Unsustainable extraction of
timber and woods
Lack of irrigation system
Multiple Use
Zone
Limited courses and teachers
(tertiary level)
Encroachment of illegal
commercial fishing vessels
Lack of access and farm to
market roads
Illegal fishing (dynamite,
cyanide, use of compressor,
incompliance to fishing
regulations)
Poor national irrigation Unclear boundaries of areas
devoted to pearl farming
Gravel and sand extraction Unsustainable cutting of
mangroves

Page | 125
ZONES ECOSYSTEM
Presence of migrants and illegal
settlers
Tribal Use
Zone
Cause of damage of caves
Lack of centers for IP culture
Land ownership issues (no clear
boundaries, illegal settlers)
B. ECAN Zones Management Guidelines
Objectives of zoning guidelines
The ECAN Zones Management Guidelines is anchored on attaining sustainable
environmental, socio- institutional and economic objectives. In achieving these strategies,
sustainable use of resources are expected to materialize. Specifically, the following
objectives are as follows;
Environmental Objectives:
1) Conserve natural resources and protect biodiversity rich areas, important life
support ecosystems, and environmentally-critical areas;
2) Rehabilitate natural habitats and degraded ecosystems;
3) Protect rare, threatened and endangered species of wildlife and flora; and
4) Reduce the incidence of illegal and destructive uses of environment and natural
resources
Social and Institutional Objectives:
1) Promote stakeholders participation in the enforcement of zoning regulations;
2) Strengthen the capability of ECAN boards to implement the guidelines and
enforce land/marine use regulations;
3) Improve the awareness and concerns of local communities towards
environmental protection, ECAN zones and allowable/prohibited uses of
land/marine resources, sustainable production that will cascade to advocacy
and action; and
4) Proper assistance (house lot relocation and livelihood support) to communities
which shall be affected or dislocated in the implementation of the ECAN
zoning guidelines.
Economic objectives:
1) Identify areas for sustainable production and inclusion under DENR’s
Community-Based Forest Management (CBFM), coastal area management,
and related subsidized programs of the government in order to direct
development within suitable environments;
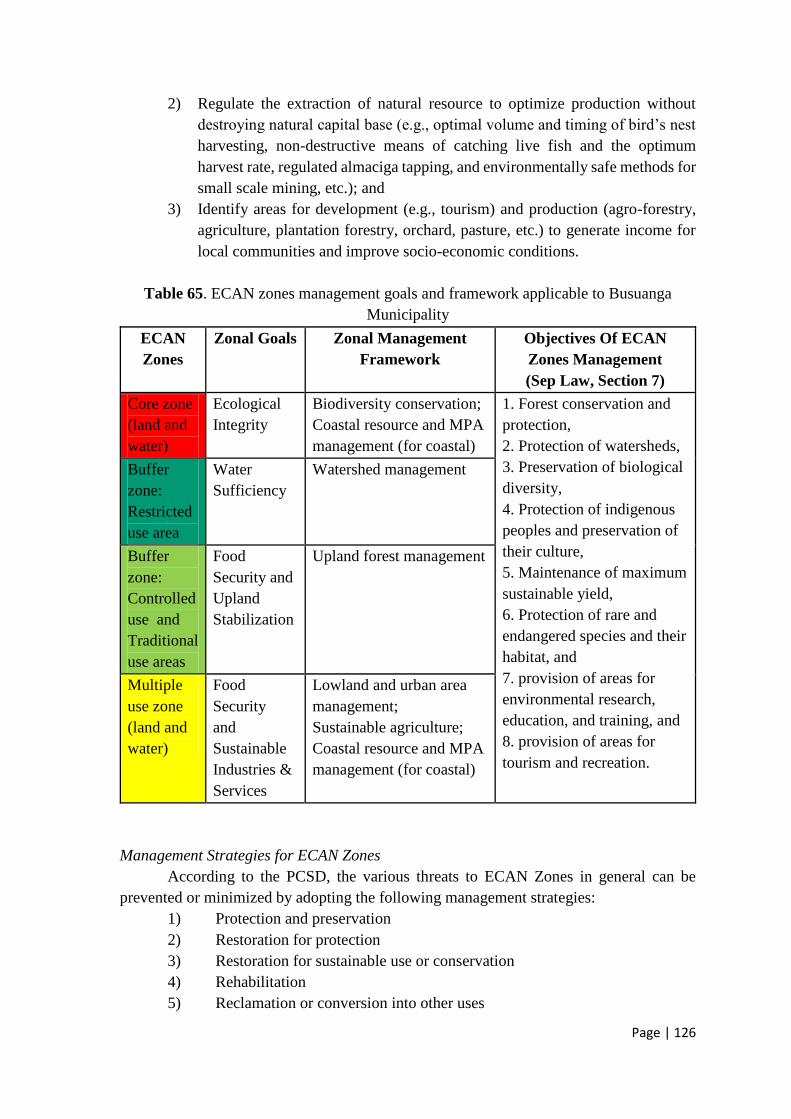
Page | 126
2) Regulate the extraction of natural resource to optimize production without
destroying natural capital base (e.g., optimal volume and timing of bird’s nest
harvesting, non-destructive means of catching live fish and the optimum
harvest rate, regulated almaciga tapping, and environmentally safe methods for
small scale mining, etc.); and
3) Identify areas for development (e.g., tourism) and production (agro-forestry,
agriculture, plantation forestry, orchard, pasture, etc.) to generate income for
local communities and improve socio-economic conditions.
Table 65. ECAN zones management goals and framework applicable to Busuanga
Municipality
ECAN
Zones
Zonal Goals Zonal Management
Framework
Objectives Of ECAN
Zones Management
(Sep Law, Section 7)
Core zone
(land and
water)
Ecological
Integrity
Biodiversity conservation;
Coastal resource and MPA
management (for coastal)
1. Forest conservation and
protection,
2. Protection of watersheds,
3. Preservation of biological
diversity,
4. Protection of indigenous
peoples and preservation of
their culture,
5. Maintenance of maximum
sustainable yield,
6. Protection of rare and
endangered species and their
habitat, and
7. provision of areas for
environmental research,
education, and training, and
8. provision of areas for
tourism and recreation.
Buffer
zone:
Restricted
use area
Water
Sufficiency
Watershed management
Buffer
zone:
Controlled
use and
Traditional
use areas
Food
Security and
Upland
Stabilization
Upland forest management
Multiple
use zone
(land and
water)
Food
Security
and
Sustainable
Industries &
Services
Lowland and urban area
management;
Sustainable agriculture;
Coastal resource and MPA
management (for coastal)
Management Strategies for ECAN Zones
According to the PCSD, the various threats to ECAN Zones in general can be
prevented or minimized by adopting the following management strategies:
1) Protection and preservation
2) Restoration for protection
3) Restoration for sustainable use or conservation
4) Rehabilitation
5) Reclamation or conversion into other uses
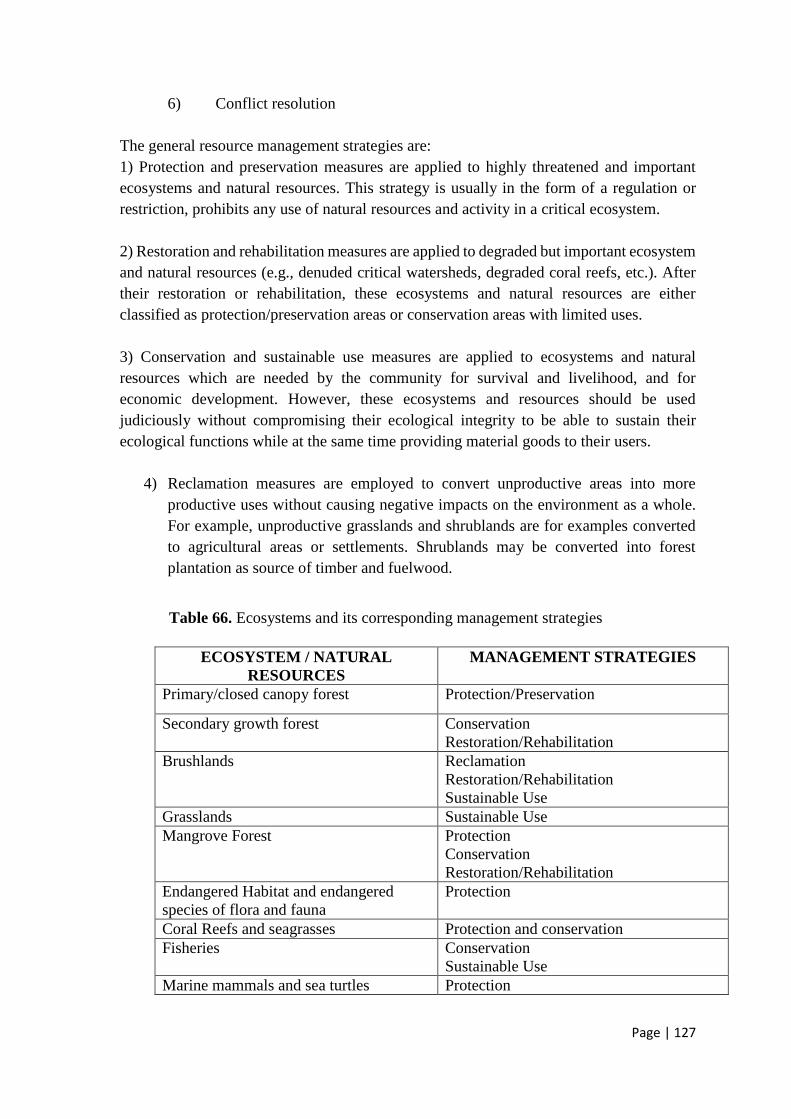
Page | 127
6) Conflict resolution
The general resource management strategies are:
1) Protection and preservation measures are applied to highly threatened and important
ecosystems and natural resources. This strategy is usually in the form of a regulation or
restriction, prohibits any use of natural resources and activity in a critical ecosystem.
2) Restoration and rehabilitation measures are applied to degraded but important ecosystem
and natural resources (e.g., denuded critical watersheds, degraded coral reefs, etc.). After
their restoration or rehabilitation, these ecosystems and natural resources are either
classified as protection/preservation areas or conservation areas with limited uses.
3) Conservation and sustainable use measures are applied to ecosystems and natural
resources which are needed by the community for survival and livelihood, and for
economic development. However, these ecosystems and resources should be used
judiciously without compromising their ecological integrity to be able to sustain their
ecological functions while at the same time providing material goods to their users.
4) Reclamation measures are employed to convert unproductive areas into more
productive uses without causing negative impacts on the environment as a whole.
For example, unproductive grasslands and shrublands are for examples converted
to agricultural areas or settlements. Shrublands may be converted into forest
plantation as source of timber and fuelwood.
ECOSYSTEM / NATURAL
RESOURCES
MANAGEMENT STRATEGIES
Primary/closed canopy forest Protection/Preservation
Secondary growth forest Conservation
Restoration/Rehabilitation
Brushlands Reclamation
Restoration/Rehabilitation
Sustainable Use
Grasslands Sustainable Use
Mangrove Forest Protection
Conservation
Restoration/Rehabilitation
Endangered Habitat and endangered
species of flora and fauna
Protection
Coral Reefs and seagrasses Protection and conservation
Fisheries Conservation
Sustainable Use
Marine mammals and sea turtles Protection
Table 66. Ecosystems and its corresponding management strategies

Page | 128
ECAN Zones for Protection and Preservation
Areas for protection and preservation are highly restricted to any human activities
defined under the ECAN Zones Management Guidelines. These include Core zone and
Strict Protection Zone such as;
a) primary/closed canopy forest
b) mangrove forest
c) limestone/karst forest
d) habitat of endangered flora and fauna
e) biodiversity hotspots (flora, fauna, coral reefs, seagrasses, reef fish, marine
mammals and sea turtles )
f) habitat of endangered marine mammals and turtles
ECAN Zones for Restoration
Areas for restoration are reverted back to core zone, strict protection zone,
controlled use zone or multiple use zone depending on the ecological features of the area
being restored. Listed below are the set of criterion (ecological features) considered:
a) areas with slope above 50% with marginal or no forest cover (restored to
core zone)
b) areas with slope of 36-50% with marginal or no forest cover (restored to
strict protection zone)
c) areas with slopes of 18-35% with marginal or no forest cover (restored to
controlled use zone or traditional use zone)
d) mangrove areas with idle and abandoned fishponds (restored to strict
protection zone)
e) degraded habitat of endangered fauna and marine mammals/sea turtles
(restored to core zone)
ECAN Zones for Rehabilitation
Areas for rehabilitation are those ecosystems which are either degraded, denuded
or polluted. Moreover, these areas require interventions such as reforestation, replanting,
and adoption of pollution control measures. Prescribed ECAN Zones are as follows;
a) denuded watersheds
b) denuded mangrove areas (sparse mangrove areas)
c) brushlands (>18% slope)
d) denuded forest lands (>18% forest land without forest cover)
e) grasslands (>18% slope)
f) denuded Seagrass beds (<31% cover or sparse Seagrass beds which are
grazing areas of dugong and other commercially important fish species)
g) degraded coral reefs (<50% live cover)
h) degraded kaingin areas or marginal upland agriculture areas (>18% slope)
i) polluted and silted coastal waters
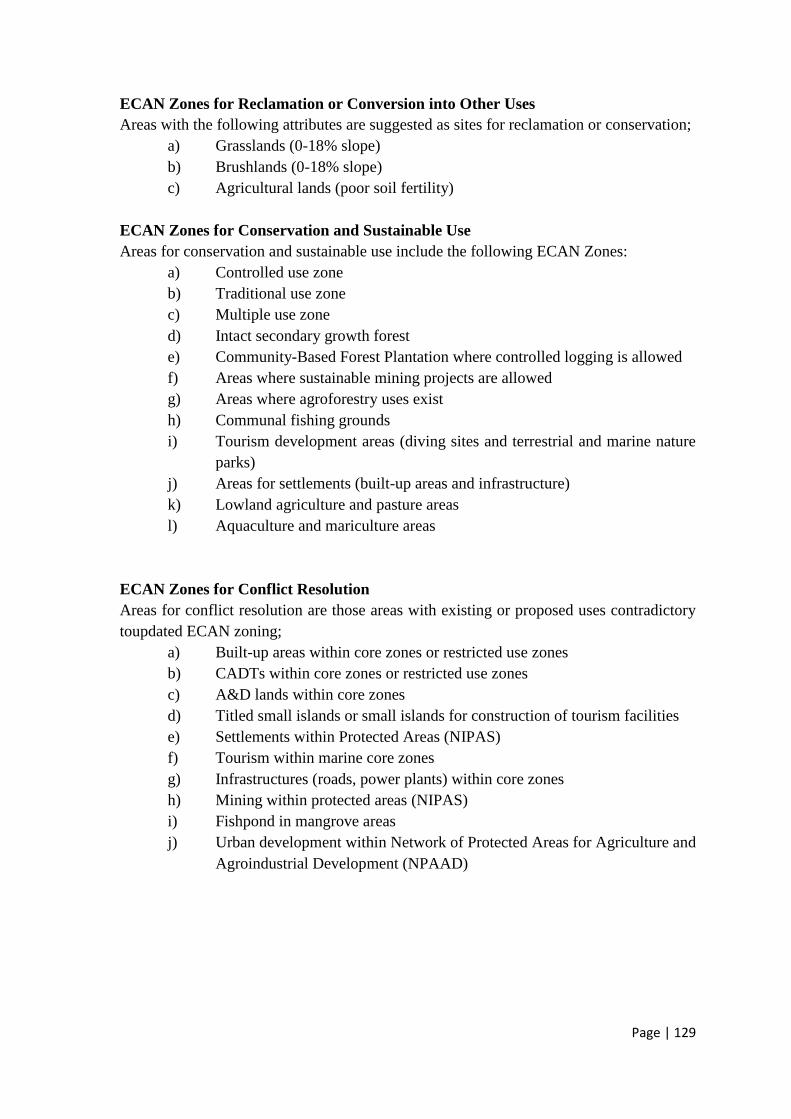
Page | 129
ECAN Zones for Reclamation or Conversion into Other Uses
Areas with the following attributes are suggested as sites for reclamation or conservation;
a) Grasslands (0-18% slope)
b) Brushlands (0-18% slope)
c) Agricultural lands (poor soil fertility)
ECAN Zones for Conservation and Sustainable Use
Areas for conservation and sustainable use include the following ECAN Zones:
a) Controlled use zone
b) Traditional use zone
c) Multiple use zone
d) Intact secondary growth forest
e) Community-Based Forest Plantation where controlled logging is allowed
f) Areas where sustainable mining projects are allowed
g) Areas where agroforestry uses exist
h) Communal fishing grounds
i) Tourism development areas (diving sites and terrestrial and marine nature
parks)
j) Areas for settlements (built-up areas and infrastructure)
k) Lowland agriculture and pasture areas
l) Aquaculture and mariculture areas
ECAN Zones for Conflict Resolution
Areas for conflict resolution are those areas with existing or proposed uses contradictory
toupdated ECAN zoning;
a) Built-up areas within core zones or restricted use zones
b) CADTs within core zones or restricted use zones
c) A&D lands within core zones
d) Titled small islands or small islands for construction of tourism facilities
e) Settlements within Protected Areas (NIPAS)
f) Tourism within marine core zones
g) Infrastructures (roads, power plants) within core zones
h) Mining within protected areas (NIPAS)
i) Fishpond in mangrove areas
j) Urban development within Network of Protected Areas for Agriculture and
Agroindustrial Development (NPAAD)

Page | 130
C. ECAN Zones Management Program Formulation
DPSIR Frameworks (Tables 56- 62) were further used to generate other tables that
served as reference for formulating plans in the ECAN planning workshop; tables used only
focused on the driver, pressure, response and proposed actions. Prioritization of pressures
in each zone was made. This was according to the participants’ preference. The participants
were grouped into three to represent the different zones. Annex E are matrices prodiuced
during the ECAN Planning workshop. These were further enhanced according to specific
stratgeies to form the ECAN Zones Management Program described in the succeeding
section.
D. Busanga ECAN Management Program
The over-arching goal of this Plan is for the municipality of Busuanga to be a 1st Class
Municiaplity with intact natural resources and competitive economy. To be able to achive
this objective of this Plan, ECAN Management Program focuses on three components: (1)
sustainable management of natural reousrces; (2) improvement of socio-econmic status;
and (3) enhancing multi-agency coordination and governance. The following sections
describes the logical framework of the ECAN Zones Management Program, zones in
ECAN where the component is to be implemented, budgetary requirements and agency
complementation.
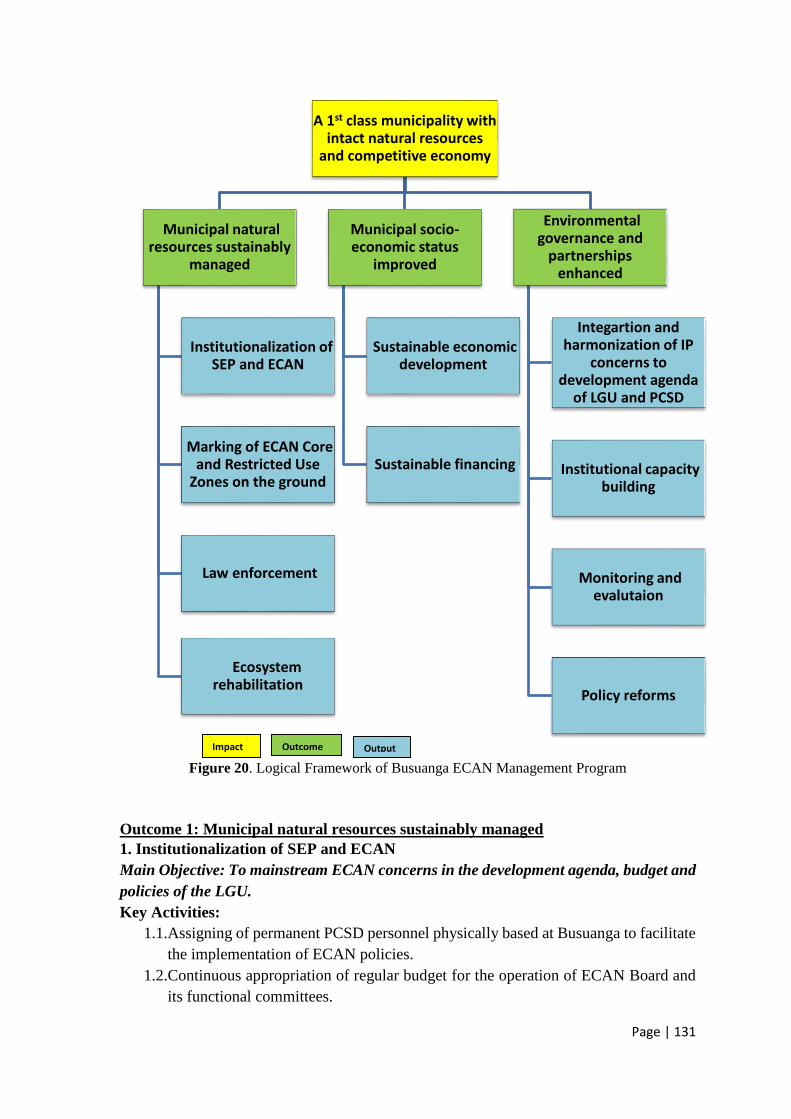
Page | 131
Figure 20. Logical Framework of Busuanga ECAN Management Program
Outcome 1: Municipal natural resources sustainably managed
1. Institutionalization of SEP and ECAN
Main Objective: To mainstream ECAN concerns in the development agenda, budget and
policies of the LGU.
Key Activities:
1.1.Assigning of permanent PCSD personnel physically based at Busuanga to facilitate
the implementation of ECAN policies.
1.2.Continuous appropriation of regular budget for the operation of ECAN Board and
its functional committees.
A 1st class municipality with intact natural resources
and competitive economy
Municipal natural resources sustainably
managed
Institutionalization of SEP and ECAN
Marking of ECAN Core and Restricted Use
Zones on the ground
Law enforcement
Ecosystem rehabilitation
Municipal socio-economic status
improved
Sustainable economic development
Sustainable financing
Environmental governance and
partnerships enhanced
Integartion and harmonization of IP
concerns to development agenda
of LGU and PCSD
Institutional capacity building
Monitoring and evalutaion
Policy reforms
Impact Outcome Output

Page | 132
1.3.Ground truthing of ECAN Zones and passage of an ordinance adopting the updated
(if necessary) ECAN Zones map, ECAN Zones Management Plan and ECAN
guidelines.
1.4.Integration and harmonization of ECAN Zones and ECAN Zones Management Plan
in the updating of CLWUP and passage of zoning ordinance incorporating ECAN
Zones and zoning strategies and guidelines.
1.5.Implementation and periodic updating of the ECAN Zones Management Plan.
Integration of ECAN zones management programs into the Annual Investment
Program (AIP) of the Comprehensive Development Plan (CDP).
2. Marking of ECAN Core and Restricted Use Zones on the ground
Main objective: To establish markers on the ground that will set the boundaries of
Core and restricted use zones for monitoring and compliance purposes
Key activities:
2.1.Conduct of maps overlay and consolidation of updated information (such as studies
on habitat of endangered species and critical watershed) to determine the core and
restricted zone areas which can use natural topographic features to set their
boundaries on the ground (e.g., ridges, rivers, seagrass meadows, etc.);
2.2.Conduct of ground surveys to verify and establish the core and restricted zone
boundaries on the ground based on the ECAN zone maps prepared by the PCSDS;
2.3.Determination and assessment of the viability (cost effectiveness, maintenance, and
practicability) of various types of markers such as physical monuments or living
markers (distinctive tree or plant markers);
2.4.Mobilization and training of barangay volunteers in the staking of markers on the
ground (concrete markers or living markers in terrestrial core zones and buoy
markers in coastal/marine core zones);
2.5.Sourcing of funds and prioritizing of areas for ground marking (Packaging of
project proposal for funding by donor institutions);
2.6.Implementation of “Ground Marking Project”
3. Law Enforcement
Main Objective: To encourage and motivate stakeholders at the municipal and barangay
levels to comply with ECAN zoning and its guidelines for the use of land and
coastal/marine resources
Key Activities:
3.1.Formation of Law Enforcement Task Force. This will be composed of PNP, Coast
Guard, NGO, DENR and PCSDS to enforce environmental laws such as but not
limited to SEP-ECAN, RA 9147, RA 9072, RA 7942, among others;
3.2.Strengthening of patrolling system for compliance to ECAN zoning and its
management guidelines (tap and deputize as fish wardens Bantay Dagat and forest
guards Bantay Gubat volunteers and mobilize other community volunteers) and
provide equipment, facilities and other logistic support needed for the conduct of
regular patrols to monitor core zones and hotspots areas;
3.3.Develop incentive mechanism for enforcers and patrollers
Page | 133
4. Ecosystem Rehabilitation
Main Objective: To improve the ecological status of environment and natural resources
through rehabilitative and restorative means
Key activities:
4.1.Mapping of areas for restoration or rehabilitation (denuded forest, silted rivers,
denuded mangrove areas, degraded coral reefs and seagrass, polluted waters with
solid and liquid wastes, etc.);
4.2.Planning, project packaging, fund sourcing and implementation of rehabilitation
programs for priority areas for reforestation, assisted natural regeneration, and
enrichment planting of denuded forest and mangroves, river bank stabilization, cave
protection and restoration;
4.3.Holding periodically of environmental festivities (reforestation, coastal clean up,
fairs, environmental fiesta with song and dance contests, poster and slogan contests)
Output 2: Municipal socio-economic status improved
5. Sustainable Economic Development
Main objective: To promote sustainable livelihood for communities engaged in illegal
activities and unsustainable resource-based livelihood
Key Activities:
5.1.Review and assess the viability of pre-selected livelihood projects in the Livelihood
Development Plan in Busuanga Municipality in 2006. Applicability must consider
updating of target beneficiaries and current institutional arrangements. Piloting of
identified livelihood programs. Livelihood projects with high potential for success
are as follows:
- seaweed farming,
- crab culture (fattening): alimango and alimasag
- ecotourism service
- handicraft making (using buho, yantok and rattan),
- vinegar making,
- cashew nut processing,
- rattan and bamboo furniture making,
- indigenous honey preparations into homegrown delicacies
- multiple cropping,
- cut flower production,
- dried fish processing,
- fish culture: kikiro/samaral; bangus; tilapia, lapulapu, danggit
- goat raising
- vegetable farming: eggplants (talong); squash (kalabasa); pechay; bitter gourd
(ampalaya); cabbage (repolyo); tomato (kamatis); potato (patatas)
- fruit farming: papaya; citrus; mango; banana; jackfruit
- shellfish culture: oysters, mussels, sea urchins
5.2.Sourcing of funds to implement selected projects in the Livelihood Development
Plan for the municipality. Identify and prioritize target barangays or localities and
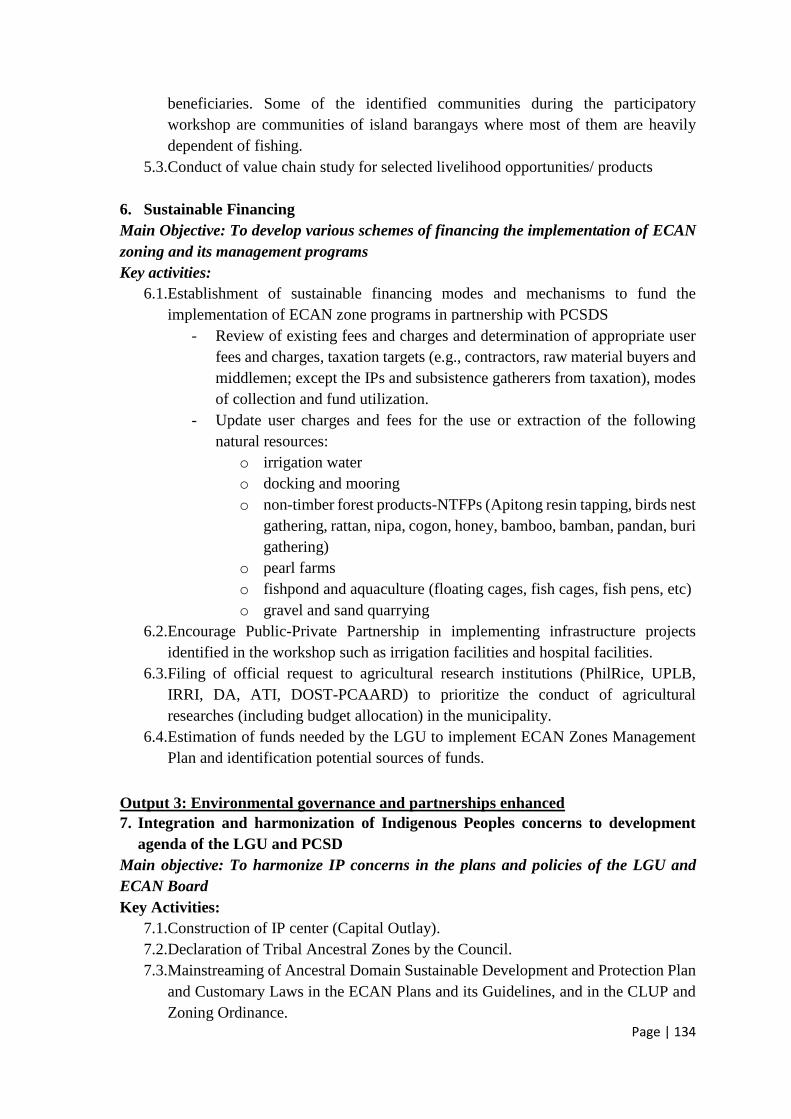
Page | 134
beneficiaries. Some of the identified communities during the participatory
workshop are communities of island barangays where most of them are heavily
dependent of fishing.
5.3.Conduct of value chain study for selected livelihood opportunities/ products
6. Sustainable Financing
Main Objective: To develop various schemes of financing the implementation of ECAN
zoning and its management programs
Key activities:
6.1.Establishment of sustainable financing modes and mechanisms to fund the
implementation of ECAN zone programs in partnership with PCSDS
- Review of existing fees and charges and determination of appropriate user
fees and charges, taxation targets (e.g., contractors, raw material buyers and
middlemen; except the IPs and subsistence gatherers from taxation), modes
of collection and fund utilization.
- Update user charges and fees for the use or extraction of the following
natural resources:
o irrigation water
o docking and mooring
o non-timber forest products-NTFPs (Apitong resin tapping, birds nest
gathering, rattan, nipa, cogon, honey, bamboo, bamban, pandan, buri
gathering)
o pearl farms
o fishpond and aquaculture (floating cages, fish cages, fish pens, etc)
o gravel and sand quarrying
6.2.Encourage Public-Private Partnership in implementing infrastructure projects
identified in the workshop such as irrigation facilities and hospital facilities.
6.3.Filing of official request to agricultural research institutions (PhilRice, UPLB,
IRRI, DA, ATI, DOST-PCAARD) to prioritize the conduct of agricultural
researches (including budget allocation) in the municipality.
6.4.Estimation of funds needed by the LGU to implement ECAN Zones Management
Plan and identification potential sources of funds.
Output 3: Environmental governance and partnerships enhanced
7. Integration and harmonization of Indigenous Peoples concerns to development
agenda of the LGU and PCSD
Main objective: To harmonize IP concerns in the plans and policies of the LGU and
ECAN Board
Key Activities:
7.1.Construction of IP center (Capital Outlay).
7.2.Declaration of Tribal Ancestral Zones by the Council.
7.3.Mainstreaming of Ancestral Domain Sustainable Development and Protection Plan
and Customary Laws in the ECAN Plans and its Guidelines, and in the CLUP and
Zoning Ordinance.
Page | 135
8. Institutional Capacity Building
Main Objective: To strengthen the capability of established organizations that will
collaboratively implement ECAN zoning and its guidelines and other environmental laws
Key Activities:
8.1.Conduct of IEC and social mobilization activities to gain stakeholders’ support to
ECAN zoning and environmental laws (RA 9147, RA 9072, RA 9175,PD 705, RA
10654, RA 8371)
- Formulation of Communication Plan involving other partner agencies with
emphasis on dugong and pawikan conservation, forest and biodiversity
management, marine protected areas management, IPRA Law, cave management
and protection, and Live Reef Fish for Food Policies
- Conduct of information campaign at the barangay level (use of multimedia
materials on understanding of the ECAN zoning and how to implement it; the duties
of the implementers and the approach in implementation)
8.2.Capacitation of Municipal ECAN Board and functional committees including
deputation of members of Enforcement Task Force (Conduct of training on the
following subjects which are needed to impart knowledge and develop the skills)
- Trainors training on environmentally friendly alternative livelihood training to be
conducted by experts for selected representatives from local community
organizations and NGOs identified to spearhead sustainable livelihood projects;
trainers from NGOs and academe will be invited; the budget will be sourced from
the LGU and other donor institutions
- Paralegal Training to be administered jointly by the PCSDS, ELAC, and MAO for
ECAN Board members, BFARMC, and selected Barangay officials; funds will be
sourced from LGU and other donor institutions
8.3.Establishment of improved coordination mechanism and harmonization of policies
and programs among PCSDS, LGU, DENR, DAR, DA and NCIP in the
implementation of ECAN zoning and its management programs
- Forging of Memorandum of Agreement between LGU, PCSD, NCIP, DA and DAR
determining and defining the coordination arrangement most appropriate in the
implementation of ECAN zoning. The ways and means of improving LGU
coordination with PCSDS, Provincial Government, DENR, DA, NCIP and other
government agencies will be examined and established.
- Co-management of ECAN zones with local community organizations, NGOs and
the private sector will be established and strengthened. The responsibilities of the
partner organizations will center but not necessarily be limited to the following:
o Local community organizations and NGO will be involved in staking the
boundaries of the core zones and in monitoring compliance of local
residents in ECAN zoning
o Private sector – tourism resort establishments and other business
establishments in the area will be involved in monitoring compliance of the

Page | 136
business community to ECAN zoning and in spearheading protection and
rehabilitation of degraded ecosystems within their area of operations
8.4.Creation of Municipal Environment and Natural Resources Office with functional
permanent staff
9. Monitoring and evaluation
Main Objective: To establish and operationalize a participatory monitoring and
evaluation system for ECAN zoning
Key activities:
9.1.Establishment and operationalization of a participatory ECAN Zones M&E at the
barangay (if possible) and municipal levels
- Identification of set of indicators to be monitored and evaluate to gauge the
implementation of the plan and its impacts to communities
- Train ECAN Board Committees in the implementation of ECAN M&E
system
9.2.Annual monitoring and evaluation of the implementation of ECAN zoning and its
guidelines at the barangay level including the changes in ECAN zones (if any) and
the guidelines for allowable uses to know how the people are using the land and
coastal/ marine resources and their compliance to zoning.
9.3.Monitoring and evaluation of the terrestrial and coastal/marine resources and
habitats every 3 years to identify environmental parameters where critical changes
are taking place so that the necessary mitigation measures are immediately
undertaken. The environment and natural resources that should be closely
monitored include forest cover (primary and secondary forest), rattan resources, and
mangrove cover, fishery resources, coral reefs, seagrass beds, breeding sites of
terrestrial wildlife and marine mammals and sea turtles, water quality, and soil
fertility.
10. Policy Reforms
Main Objective: To introduce policy reforms and regulations to improve the effectiveness
of ECAN zoning and its management programs
Key activities:
10.1. Introduction of changes in zoning guidelines periodically to adapt to new laws,
regulations and local development needs and situation.
10.2. Updating of ECAN zones maps and information to capture changes taking place
in the localities.
Table below shows the ECAN Zone location where each strategy shall be implemented.
Suprazonal strategies are those actions encompassing more than one ECAN zone. Non-
zonal strategies are those actions that do not have spatial characteristic.
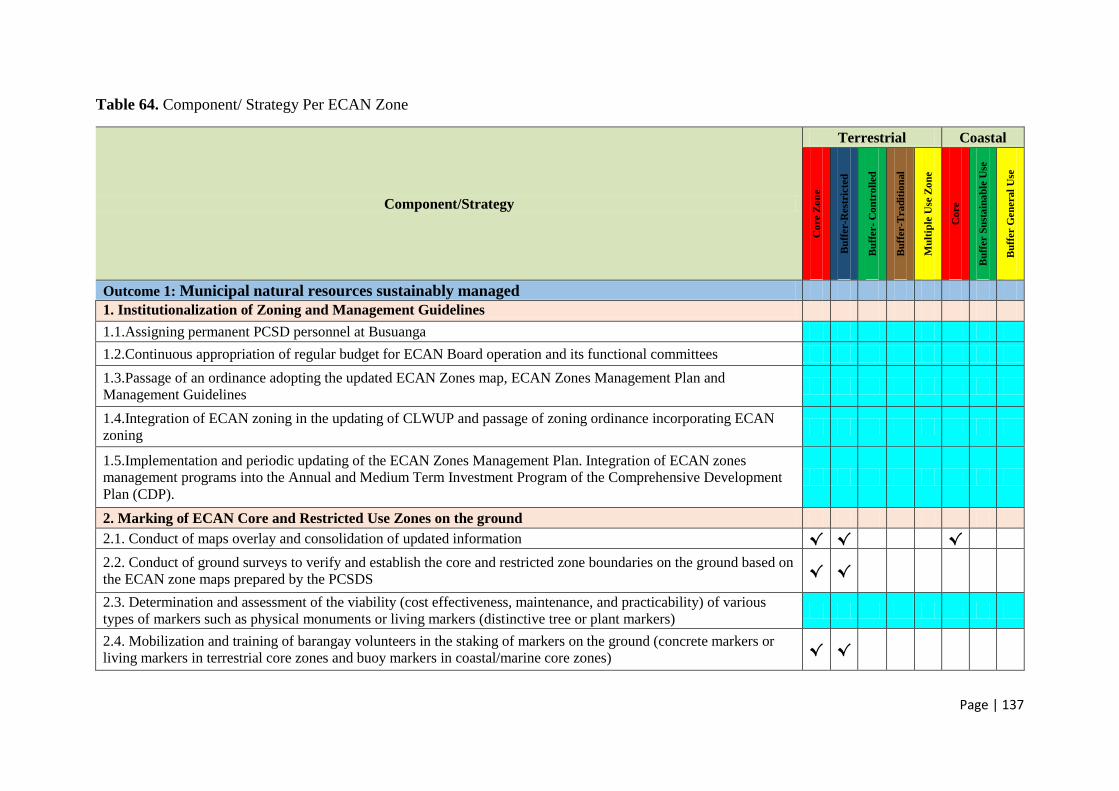
Page | 137
Table 64. Component/ Strategy Per ECAN Zone
Component/Strategy
Terrestrial Coastal
Co
re
Zo
ne
Bu
ffer-R
est
ricte
d
Bu
ffer-
Co
ntr
oll
ed
Bu
ffer-T
ra
dit
ion
al
Mu
ltip
le U
se Z
on
e
Co
re
Bu
ffer S
ust
ain
ab
le U
se
Bu
ffer G
en
era
l U
se
Outcome 1: Municipal natural resources sustainably managed
1. Institutionalization of Zoning and Management Guidelines
1.1.Assigning permanent PCSD personnel at Busuanga
1.2.Continuous appropriation of regular budget for ECAN Board operation and its functional committees
1.3.Passage of an ordinance adopting the updated ECAN Zones map, ECAN Zones Management Plan and
Management Guidelines
1.4.Integration of ECAN zoning in the updating of CLWUP and passage of zoning ordinance incorporating ECAN
zoning
1.5.Implementation and periodic updating of the ECAN Zones Management Plan. Integration of ECAN zones
management programs into the Annual and Medium Term Investment Program of the Comprehensive Development
Plan (CDP).
2. Marking of ECAN Core and Restricted Use Zones on the ground
2.1. Conduct of maps overlay and consolidation of updated information √ √ √
2.2. Conduct of ground surveys to verify and establish the core and restricted zone boundaries on the ground based on
the ECAN zone maps prepared by the PCSDS √ √
2.3. Determination and assessment of the viability (cost effectiveness, maintenance, and practicability) of various
types of markers such as physical monuments or living markers (distinctive tree or plant markers)
2.4. Mobilization and training of barangay volunteers in the staking of markers on the ground (concrete markers or
living markers in terrestrial core zones and buoy markers in coastal/marine core zones) √ √

Page | 138
Component/Strategy
Terrestrial Coastal
Co
re
Zo
ne
Bu
ffer-R
est
ricte
d
Bu
ffer-
Co
ntr
oll
ed
Bu
ffer-T
ra
dit
ion
al
Mu
ltip
le U
se Z
on
e
Co
re
Bu
ffer S
ust
ain
ab
le U
se
Bu
ffer G
en
era
l U
se
2.5. Sourcing of funds and prioritizing of areas for ground marking (Packaging of project proposal for funding by
donor institutions)
2.6. Implementation of “Ground Marking Project” √ √
3. Law Enforcement
3.1. Formation of Law Enforcement Task Force
3.2. Strengthening of patrolling system
3.3. Develop incentive mechanism for enforcers and patrollers
4. Ecosystem Rehabilitation
4.1. Mapping of areas for restoration or rehabilitation √ √ √ √
4.2. Planning, project packaging, fund sourcing and implementation of rehabilitation programs for priority areas √ √ √ √
4.3. Holding periodically of environmental festivities √ √ √ √
Outcome 2: Municipal socio-economic status improved
5. Sustainable Livelihood Development
5.1. Review and assess the viability of pre-selected livelihood projects in the Livelihood Development Plan in
Busuanga Municipality in 2006 √ √ √ √ √ √
5.2. Sourcing of funds to implement selected projects in the Livelihood Development Plan for the municipality
5.3. Conduct of value chain analysis of selected livelihood opportunities
6. Sustainable Financing
6.1. Establishment of sustainable financing modes and mechanisms √ √ √ √ √ √ 6.2. Encourage Public-Private Partnership in implementing infrastructure projects identified √ √
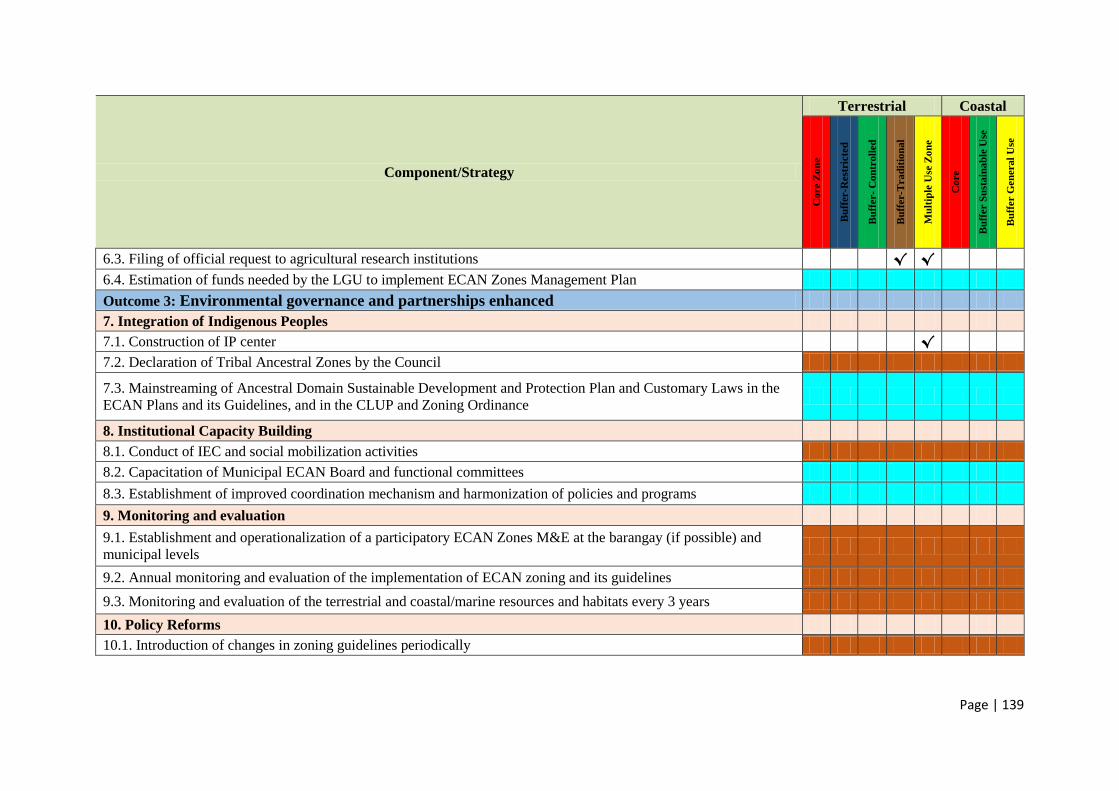
Page | 139
Component/Strategy
Terrestrial Coastal
Co
re
Zo
ne
Bu
ffer-R
est
ricte
d
Bu
ffer-
Co
ntr
oll
ed
Bu
ffer-T
ra
dit
ion
al
Mu
ltip
le U
se Z
on
e
Co
re
Bu
ffer S
ust
ain
ab
le U
se
Bu
ffer G
en
era
l U
se
6.3. Filing of official request to agricultural research institutions √ √
6.4. Estimation of funds needed by the LGU to implement ECAN Zones Management Plan
Outcome 3: Environmental governance and partnerships enhanced
7. Integration of Indigenous Peoples
7.1. Construction of IP center √
7.2. Declaration of Tribal Ancestral Zones by the Council
7.3. Mainstreaming of Ancestral Domain Sustainable Development and Protection Plan and Customary Laws in the
ECAN Plans and its Guidelines, and in the CLUP and Zoning Ordinance
8. Institutional Capacity Building
8.1. Conduct of IEC and social mobilization activities
8.2. Capacitation of Municipal ECAN Board and functional committees
8.3. Establishment of improved coordination mechanism and harmonization of policies and programs
9. Monitoring and evaluation
9.1. Establishment and operationalization of a participatory ECAN Zones M&E at the barangay (if possible) and
municipal levels
9.2. Annual monitoring and evaluation of the implementation of ECAN zoning and its guidelines
9.3. Monitoring and evaluation of the terrestrial and coastal/marine resources and habitats every 3 years
10. Policy Reforms
10.1. Introduction of changes in zoning guidelines periodically

Page | 140
Component/Strategy
Terrestrial Coastal
Co
re
Zo
ne
Bu
ffer-R
est
ricte
d
Bu
ffer-
Co
ntr
oll
ed
Bu
ffer-T
ra
dit
ion
al
Mu
ltip
le U
se Z
on
e
Co
re
Bu
ffer S
ust
ain
ab
le U
se
Bu
ffer G
en
era
l U
se
10.2. Updating of ECAN zones maps and information to capture changes taking place in the localities.
10.3. Creation of Municipal Environment and Natural Resources Office with functional permanent staff
Non-Zonal
Supra-Zonal
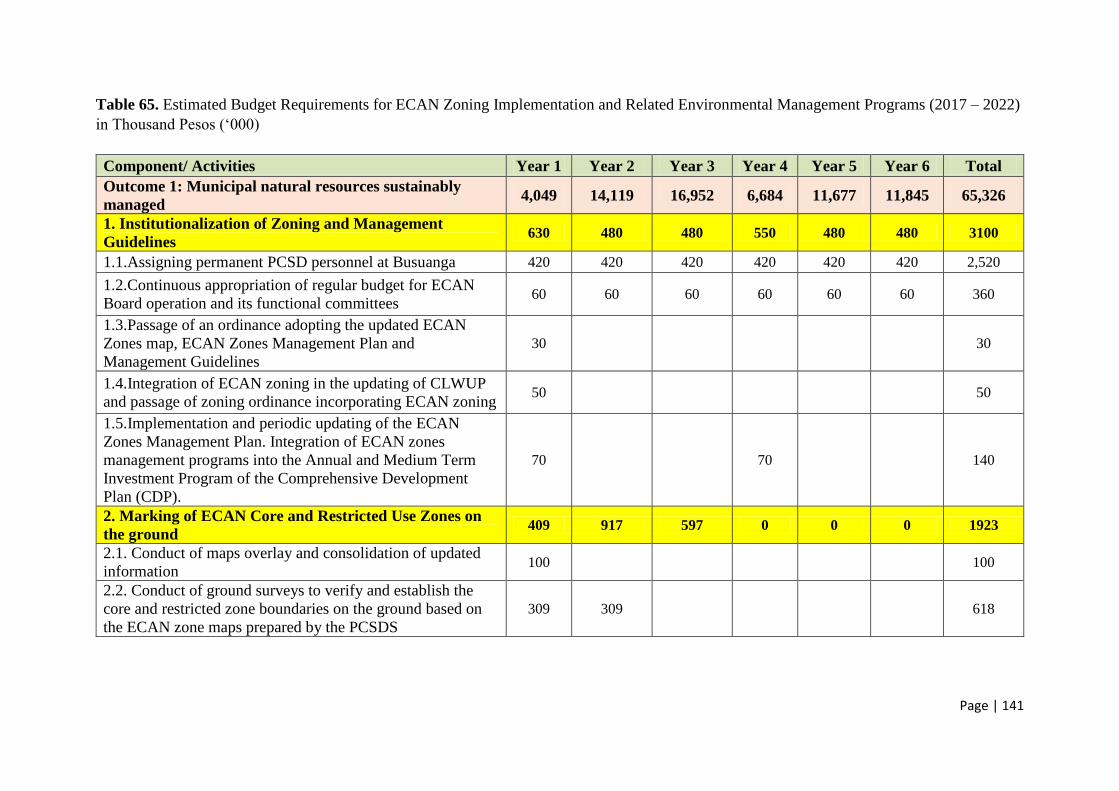
Page | 141
Table 65. Estimated Budget Requirements for ECAN Zoning Implementation and Related Environmental Management Programs (2017 – 2022)
in Thousand Pesos (‘000)
Component/ Activities Year 1 Year 2 Year 3 Year 4 Year 5 Year 6 Total
Outcome 1: Municipal natural resources sustainably
managed 4,049 14,119 16,952 6,684 11,677 11,845 65,326
1. Institutionalization of Zoning and Management
Guidelines 630 480 480 550 480 480 3100
1.1.Assigning permanent PCSD personnel at Busuanga 420 420 420 420 420 420 2,520
1.2.Continuous appropriation of regular budget for ECAN
Board operation and its functional committees 60 60 60 60 60 60 360
1.3.Passage of an ordinance adopting the updated ECAN
Zones map, ECAN Zones Management Plan and
Management Guidelines
30 30
1.4.Integration of ECAN zoning in the updating of CLWUP
and passage of zoning ordinance incorporating ECAN zoning 50 50
1.5.Implementation and periodic updating of the ECAN
Zones Management Plan. Integration of ECAN zones
management programs into the Annual and Medium Term
Investment Program of the Comprehensive Development
Plan (CDP).
70 70 140
2. Marking of ECAN Core and Restricted Use Zones on
the ground 409 917 597 0 0 0 1923
2.1. Conduct of maps overlay and consolidation of updated
information 100 100
2.2. Conduct of ground surveys to verify and establish the
core and restricted zone boundaries on the ground based on
the ECAN zone maps prepared by the PCSDS
309 309 618

Page | 142
Component/ Activities Year 1 Year 2 Year 3 Year 4 Year 5 Year 6 Total
2.3. Determination and assessment of the viability (cost
effectiveness, maintenance, and practicability) of various
types of markers such as physical monuments or living
markers (distinctive tree or plant markers)
52 52
2.4. Mobilization and training of barangay volunteers in the
staking of markers on the ground (concrete markers or living
markers in terrestrial core zones and buoy markers in
coastal/marine core zones)
515 515 1,030
2.5. Sourcing of funds and prioritizing of areas for ground
marking (Packaging of project proposal for funding by donor
institutions)
41 82 123
3. Law Enforcement 2,310 2,222 2,285 2,351 2,419 2,488 14,075
3.1. Formation of Law Enforcement Task Force 150 150
3.2. Strengthening of patrolling system 2,060 2,122 2,185 2,251 2,319 2,388 13,325
3.3. Develop incentive mechanism for enforcers and
patrollers 100 100 100 100 100 100 600
4. Ecosystem Rehabilitation 700 10,500 13,590 3,783 8,778 8,877 46,228
4.1. Mapping of areas for restoration or rehabilitation 200 100 300
4.2. Planning, project packaging, fund sourcing and
implementation of rehabilitation programs for priority areas 10,000 10,000 5,000 5,000 30,000
4.3. Holding periodically of environmental festivities 500 500 500 500 500 500 3,000
4.6. Implementation of “Ground Marking Project” 3,090 3,183 3,278 3,377 12,928
Outcome 2: Municipal socio-economic status improved 7,323 5,345 40 540 40 40 13,328
5. Sustainable Economic Development 6,724 5,305 0 500 0 0 12,529
5.1. Review and assess the viability of pre-selected livelihood
projects in the Livelihood Development Plan in Busuanga
Municipality in 2006
824 824
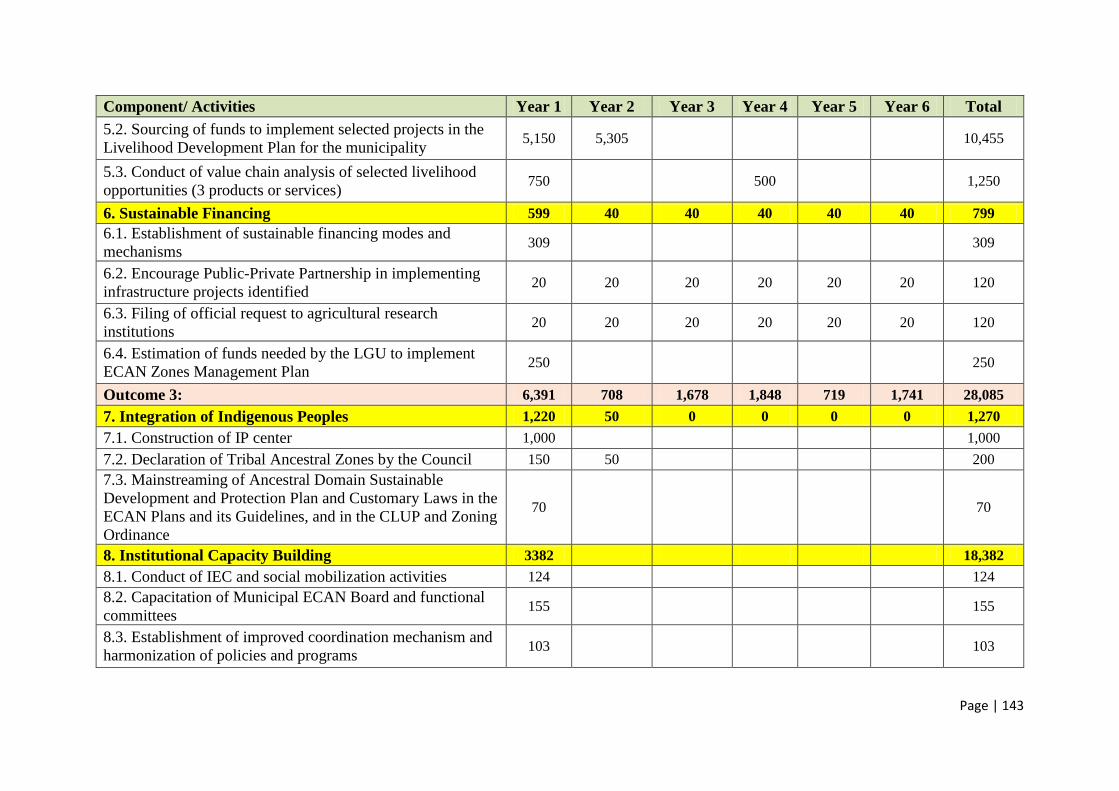
Page | 143
Component/ Activities Year 1 Year 2 Year 3 Year 4 Year 5 Year 6 Total
5.2. Sourcing of funds to implement selected projects in the
Livelihood Development Plan for the municipality 5,150 5,305 10,455
5.3. Conduct of value chain analysis of selected livelihood
opportunities (3 products or services) 750 500 1,250
6. Sustainable Financing 599 40 40 40 40 40 799
6.1. Establishment of sustainable financing modes and
mechanisms 309 309
6.2. Encourage Public-Private Partnership in implementing
infrastructure projects identified 20 20 20 20 20 20 120
6.3. Filing of official request to agricultural research
institutions 20 20 20 20 20 20 120
6.4. Estimation of funds needed by the LGU to implement
ECAN Zones Management Plan 250 250
Outcome 3: 6,391 708 1,678 1,848 719 1,741 28,085
7. Integration of Indigenous Peoples 1,220 50 0 0 0 0 1,270
7.1. Construction of IP center 1,000 1,000
7.2. Declaration of Tribal Ancestral Zones by the Council 150 50 200
7.3. Mainstreaming of Ancestral Domain Sustainable
Development and Protection Plan and Customary Laws in the
ECAN Plans and its Guidelines, and in the CLUP and Zoning
Ordinance
70 70
8. Institutional Capacity Building 3382 18,382
8.1. Conduct of IEC and social mobilization activities 124 124
8.2. Capacitation of Municipal ECAN Board and functional
committees 155 155
8.3. Establishment of improved coordination mechanism and
harmonization of policies and programs 103 103
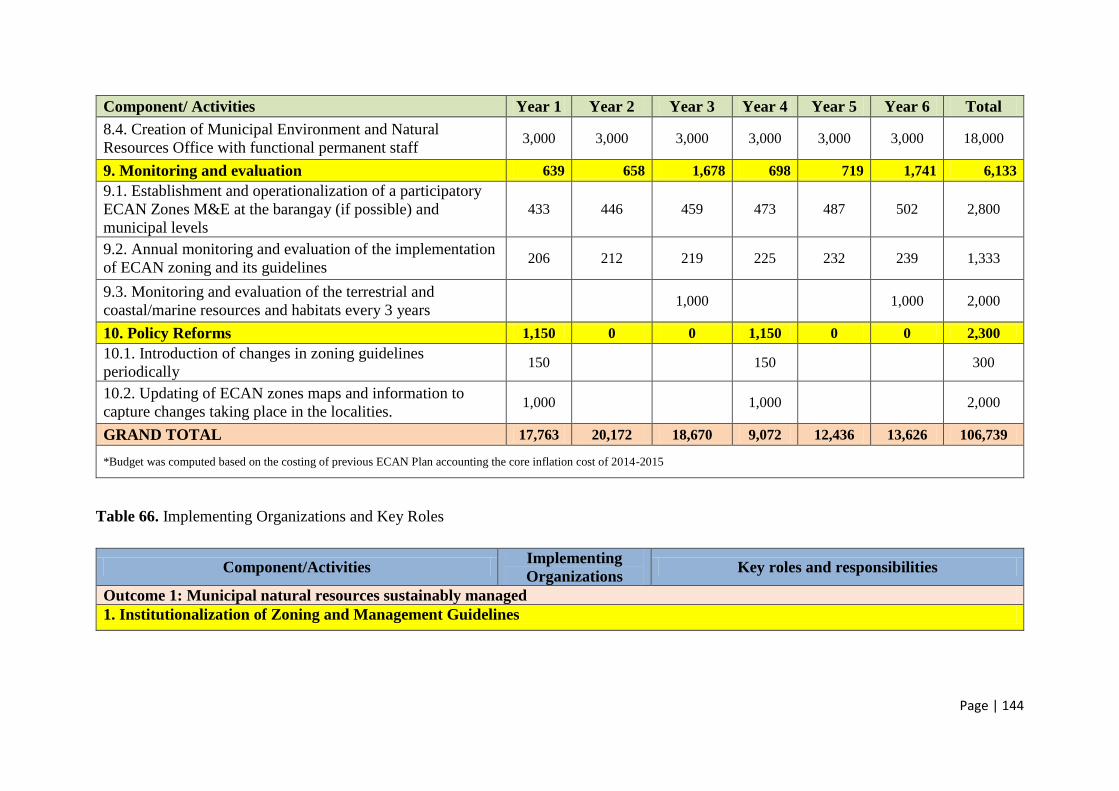
Page | 144
Component/ Activities Year 1 Year 2 Year 3 Year 4 Year 5 Year 6 Total
8.4. Creation of Municipal Environment and Natural
Resources Office with functional permanent staff 3,000 3,000 3,000 3,000 3,000 3,000 18,000
9. Monitoring and evaluation 639 658 1,678 698 719 1,741 6,133
9.1. Establishment and operationalization of a participatory
ECAN Zones M&E at the barangay (if possible) and
municipal levels
433 446 459 473 487 502 2,800
9.2. Annual monitoring and evaluation of the implementation
of ECAN zoning and its guidelines 206 212 219 225 232 239 1,333
9.3. Monitoring and evaluation of the terrestrial and
coastal/marine resources and habitats every 3 years 1,000 1,000 2,000
10. Policy Reforms 1,150 0 0 1,150 0 0 2,300
10.1. Introduction of changes in zoning guidelines
periodically 150 150 300
10.2. Updating of ECAN zones maps and information to
capture changes taking place in the localities. 1,000 1,000 2,000
GRAND TOTAL 17,763 20,172 18,670 9,072 12,436 13,626 106,739
*Budget was computed based on the costing of previous ECAN Plan accounting the core inflation cost of 2014-2015
Table 66. Implementing Organizations and Key Roles
Component/Activities Implementing
Organizations Key roles and responsibilities
Outcome 1: Municipal natural resources sustainably managed
1. Institutionalization of Zoning and Management Guidelines

Page | 145
Component/Activities Implementing
Organizations Key roles and responsibilities
1.1.Assigning permanent PCSD personnel at Busuanga LO: PCSDS
SO: LGU
PCSDS will provide staff assigned specific for the
municipality.
LGU to provide office space and fixtures.
1.2.Continuous appropriation of regular budget for ECAN
Board operation and its functional committees
LO: LGU
SO: PCSDS
LGU to appropriate funds for ECAN Board operations.
PCSDS to provide technical assistance and coordinate
appropriate trainings.
1.3.Passage of an ordinance adopting the updated ECAN
Zones map, ECAN Zones Management Plan and
Management Guidelines
LO: LGU
SO: PCSDS &
ECAN Board
LGU to adopt the Plan.
ECAN Board and PCSDS to facilitate adoption.
1.4.Integration of ECAN zoning in the updating of CLWUP
and passage of zoning ordinance incorporating ECAN
zoning
LO: LGU
SO: PCSDS &
ECAN Board
LGU to integrate the components of EZMP into
CLWUP and ZO.
ECAN Board and PCSDS to facilitate integration and
act as resource person.
1.5. Implementation and periodic updating of the ECAN
Zones Management Plan. Integration of ECAN zones
management programs into the Annual and Medium Term
Investment Program of the Comprehensive Development
Plan (CDP).
LO: LGU and ECAN
Board
SO: PCSDS
LGU and ECAN Board to ensure the implementation of
integrated programs.
PCSDS and ECAN Board to monitor the
implementation.
2. Marking of ECAN Core and Restricted Use Zones on the ground
2.1. Conduct of maps overlay and consolidation of updated
information
LO: PCSDS, ECAN
Board and LGU
PCSDS to provide technical assistance.
LGU to provide logistics for overlay and mapping
exercises.
2.2. Conduct of ground surveys to verify and establish the
core and restricted zone boundaries on the ground based on
the ECAN zone maps prepared by the PCSDS
LO: ECAN Board,
LGU, NGO
SO: PCSDS
ECAN Board, LGU. NGO to provide logistical
requirements and counterpart staff for the validation.
PCSD to provide technical staff.
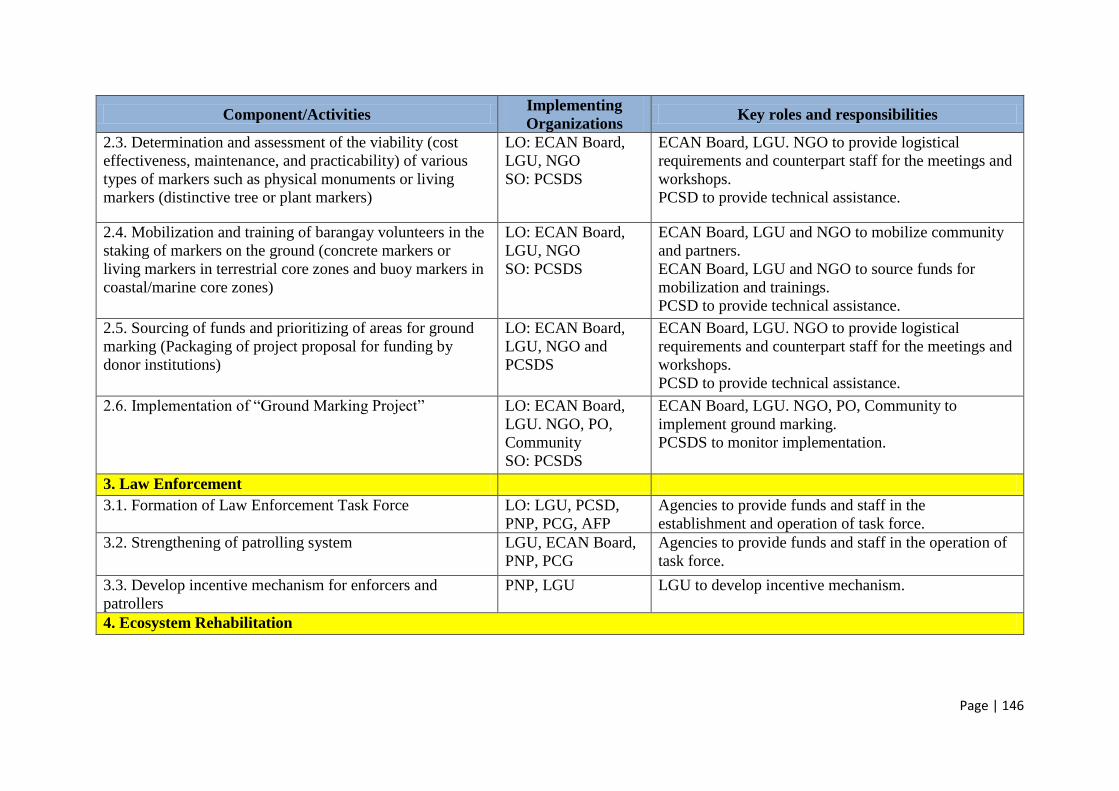
Page | 146
Component/Activities Implementing
Organizations Key roles and responsibilities
2.3. Determination and assessment of the viability (cost
effectiveness, maintenance, and practicability) of various
types of markers such as physical monuments or living
markers (distinctive tree or plant markers)
LO: ECAN Board,
LGU, NGO
SO: PCSDS
ECAN Board, LGU. NGO to provide logistical
requirements and counterpart staff for the meetings and
workshops.
PCSD to provide technical assistance.
2.4. Mobilization and training of barangay volunteers in the
staking of markers on the ground (concrete markers or
living markers in terrestrial core zones and buoy markers in
coastal/marine core zones)
LO: ECAN Board,
LGU, NGO
SO: PCSDS
ECAN Board, LGU and NGO to mobilize community
and partners.
ECAN Board, LGU and NGO to source funds for
mobilization and trainings.
PCSD to provide technical assistance.
2.5. Sourcing of funds and prioritizing of areas for ground
marking (Packaging of project proposal for funding by
donor institutions)
LO: ECAN Board,
LGU, NGO and
PCSDS
ECAN Board, LGU. NGO to provide logistical
requirements and counterpart staff for the meetings and
workshops.
PCSD to provide technical assistance.
2.6. Implementation of “Ground Marking Project” LO: ECAN Board,
LGU. NGO, PO,
Community
SO: PCSDS
ECAN Board, LGU. NGO, PO, Community to
implement ground marking.
PCSDS to monitor implementation.
3. Law Enforcement
3.1. Formation of Law Enforcement Task Force LO: LGU, PCSD,
PNP, PCG, AFP
Agencies to provide funds and staff in the
establishment and operation of task force.
3.2. Strengthening of patrolling system LGU, ECAN Board,
PNP, PCG
Agencies to provide funds and staff in the operation of
task force.
3.3. Develop incentive mechanism for enforcers and
patrollers
PNP, LGU LGU to develop incentive mechanism.
4. Ecosystem Rehabilitation
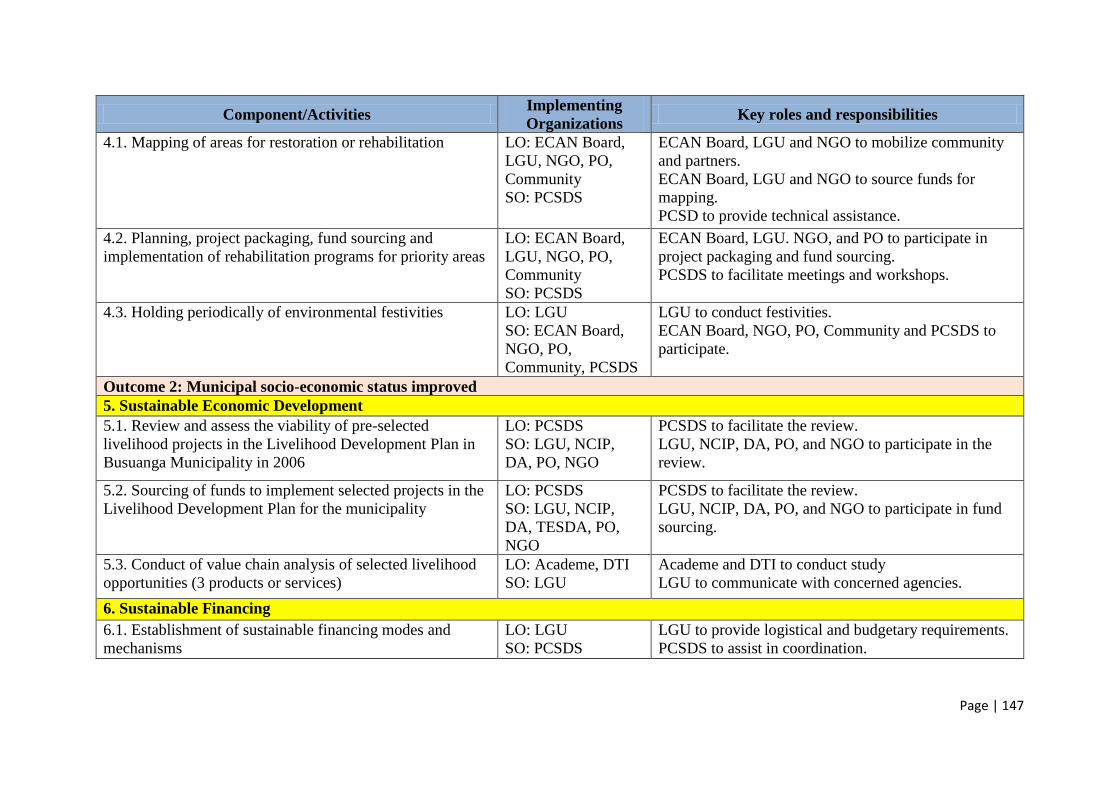
Page | 147
Component/Activities Implementing
Organizations Key roles and responsibilities
4.1. Mapping of areas for restoration or rehabilitation LO: ECAN Board,
LGU, NGO, PO,
Community
SO: PCSDS
ECAN Board, LGU and NGO to mobilize community
and partners.
ECAN Board, LGU and NGO to source funds for
mapping.
PCSD to provide technical assistance.
4.2. Planning, project packaging, fund sourcing and
implementation of rehabilitation programs for priority areas
LO: ECAN Board,
LGU, NGO, PO,
Community
SO: PCSDS
ECAN Board, LGU. NGO, and PO to participate in
project packaging and fund sourcing.
PCSDS to facilitate meetings and workshops.
4.3. Holding periodically of environmental festivities LO: LGU
SO: ECAN Board,
NGO, PO,
Community, PCSDS
LGU to conduct festivities.
ECAN Board, NGO, PO, Community and PCSDS to
participate.
Outcome 2: Municipal socio-economic status improved
5. Sustainable Economic Development
5.1. Review and assess the viability of pre-selected
livelihood projects in the Livelihood Development Plan in
Busuanga Municipality in 2006
LO: PCSDS
SO: LGU, NCIP,
DA, PO, NGO
PCSDS to facilitate the review.
LGU, NCIP, DA, PO, and NGO to participate in the
review.
5.2. Sourcing of funds to implement selected projects in the
Livelihood Development Plan for the municipality
LO: PCSDS
SO: LGU, NCIP,
DA, TESDA, PO,
NGO
PCSDS to facilitate the review.
LGU, NCIP, DA, PO, and NGO to participate in fund
sourcing.
5.3. Conduct of value chain analysis of selected livelihood
opportunities (3 products or services)
LO: Academe, DTI
SO: LGU
Academe and DTI to conduct study
LGU to communicate with concerned agencies.
6. Sustainable Financing
6.1. Establishment of sustainable financing modes and
mechanisms
LO: LGU
SO: PCSDS
LGU to provide logistical and budgetary requirements.
PCSDS to assist in coordination.

Page | 148
Component/Activities Implementing
Organizations Key roles and responsibilities
6.2. Encourage Public-Private Partnership in implementing
infrastructure projects identified
LO: LGU
SO: Private sector
LGU to communicate and forge partnerships with
private sector
6.3. Filing of official request to agricultural research
institutions
LO: LGU
SO: DOST,
Academe, DA
LGU through MAO to request for the conduct of
agricultural researches.
DOST, Academe, and DA to conduct/fund researches.
6.4. Estimation of funds needed by the LGU to implement
ECAN Zones Management Plan
LO: ECAN Board,
LGU
SO: PCSDS
ECAN Board to conduct meetings.
PCSDS to facilitate and package documentation.
Outcome 3: Environmental governance and partnerships enhanced
7. Integration of Indigenous Peoples
7.1. Construction of IP center LO: LGU, NCIP,
NGO
LGU to provide space and co-fund the construction
with NCIP and NGO.
7.2. Declaration of Tribal Ancestral Zones by the Council LO: NCIP and
PCSDS
SO: NGO, PO
PCSDS to declare TAZ.
PCSDS and NCIP to conduct evaluation of proposed
TAZ.
NGO and PO to fund field evaluation.
7.3. Mainstreaming of Ancestral Domain Sustainable
Development and Protection Plan and Customary Laws in
the ECAN Plans and its Guidelines, and in the CLUP and
Zoning Ordinance
LO: LGU, NCIP and
IP PO
SO: PCSD
LGU, PO and PCSDS to mainstream ADSDPP.
LGU, NCIP and to PO to mainstream customary laws.
8. Institutional Capacity Building
8.1. Conduct of IEC and social mobilization activities LO: ECAN Board,
LGU, NGO, Private
Individuals/
Companies
SO: PCSDS
ECAN Board, LGU, and NGO to conduct IEC.
PCSDS to provide trainings in the conduct of IEC and
social marketing.
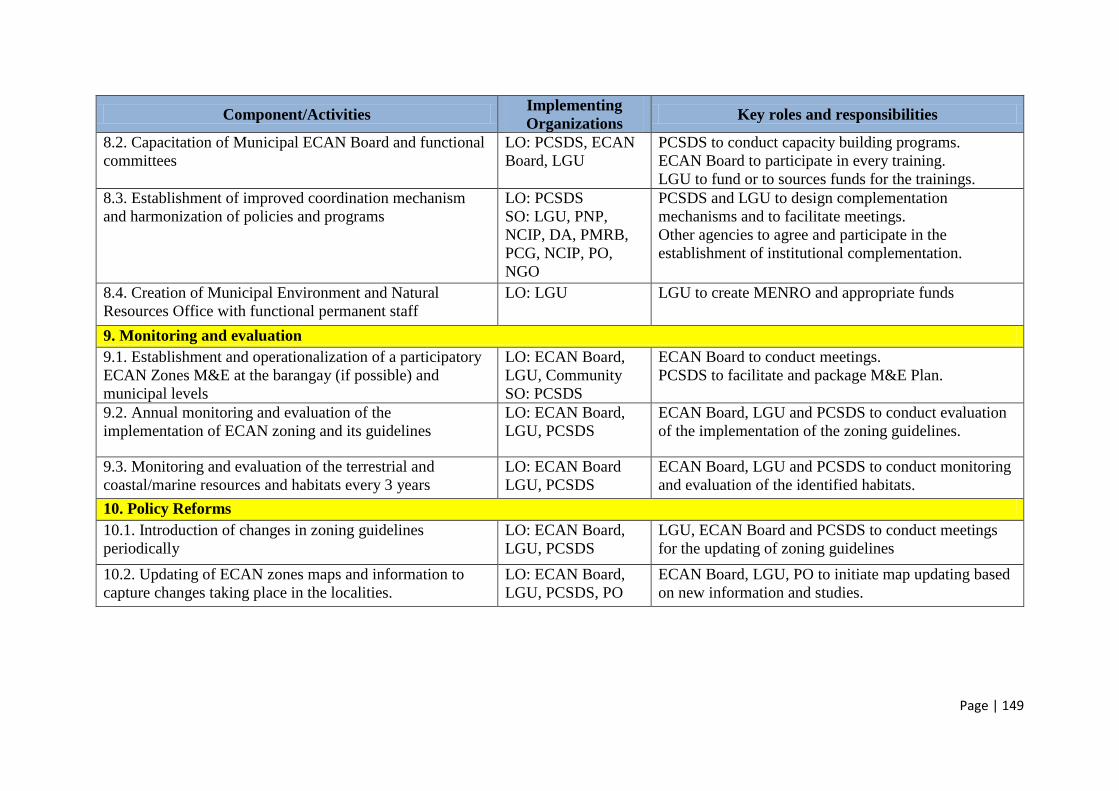
Page | 149
Component/Activities Implementing
Organizations Key roles and responsibilities
8.2. Capacitation of Municipal ECAN Board and functional
committees
LO: PCSDS, ECAN
Board, LGU
PCSDS to conduct capacity building programs.
ECAN Board to participate in every training.
LGU to fund or to sources funds for the trainings.
8.3. Establishment of improved coordination mechanism
and harmonization of policies and programs
LO: PCSDS
SO: LGU, PNP,
NCIP, DA, PMRB,
PCG, NCIP, PO,
NGO
PCSDS and LGU to design complementation
mechanisms and to facilitate meetings.
Other agencies to agree and participate in the
establishment of institutional complementation.
8.4. Creation of Municipal Environment and Natural
Resources Office with functional permanent staff
LO: LGU LGU to create MENRO and appropriate funds
9. Monitoring and evaluation
9.1. Establishment and operationalization of a participatory
ECAN Zones M&E at the barangay (if possible) and
municipal levels
LO: ECAN Board,
LGU, Community
SO: PCSDS
ECAN Board to conduct meetings.
PCSDS to facilitate and package M&E Plan.
9.2. Annual monitoring and evaluation of the
implementation of ECAN zoning and its guidelines
LO: ECAN Board,
LGU, PCSDS
ECAN Board, LGU and PCSDS to conduct evaluation
of the implementation of the zoning guidelines.
9.3. Monitoring and evaluation of the terrestrial and
coastal/marine resources and habitats every 3 years
LO: ECAN Board
LGU, PCSDS
ECAN Board, LGU and PCSDS to conduct monitoring
and evaluation of the identified habitats.
10. Policy Reforms
10.1. Introduction of changes in zoning guidelines
periodically
LO: ECAN Board,
LGU, PCSDS
LGU, ECAN Board and PCSDS to conduct meetings
for the updating of zoning guidelines
10.2. Updating of ECAN zones maps and information to
capture changes taking place in the localities.
LO: ECAN Board,
LGU, PCSDS, PO
ECAN Board, LGU, PO to initiate map updating based
on new information and studies.

Page | 150
CHAPTER 8: ADMINISTRATION OF THE ECAN ZONING PLAN
The ECAN Zoning Plan, a stand-alone document pursuant to the SEP Law and its
guidelines, aims to guide the long-term sustainable management of the locally adopted
ECAN Zones. It is prepared by the LGU through its ECAN Board and with the assistance
of the PCSDS (PCSD Resolution 2005-250, Section 25). The ECAN Board is the main
organization in charge of administering the ECAN Zoning Plan. Its implementation which
may include in policy formulation, legislation, setting up of permitting system, monitoring
and other related activities, shall be the joint responsibility of the LGU and PCSDS through
the Municipal ECAN Board (PCSD Resolution 2005-250, Section 31).
The Chairperson of the ECAN Board shall act as the ECAN Resource Management
Plan Administrator.
The Municipal Environment and Natural Resources Officer (MENRO) shall be the
Deputy Plan Administrator.
The PCSDS, through its representative to the ECAN Board, the Municipal
Planning and Development Coordinator, and the other members of the ECAN Board shall
constitute the ECAN Resource Management Plan Advisory Body. They shall assist the Plan
Administrator and Deputy Plan Administrator in the implementation of the Plan.
The latest revised ECAN guidelines (PCSD Resolution 05-250) have addressed
most of the institutional aspects on administering the plan and as stated in Section 20c of
the Local Government Code (LGC), the local government units shall continue to prepare
their comprehensive land use plans enacted through zoning ordinances which shall be the
primary and dominant bases for the future use of land resources.
In institutionalizing the ECAN Zoning Plan in the Municipality of Busuanga, the
important factors to consider are the experience and expertise of land use planners, the
political support of LGU, the continuity of the development programs, and a common grasp
of the roles of both ECAN and CLWUP in advancing the common good, maintaining the
ecological balance, and promoting sustainable development.
Schedule of ECAN plan implementation
After the formulation and approval of the plan by the ECAN Board, the following
actions are to be undertaken by the ECAN Board, with the assistance of the PCSDS.
Adoption of the ECAN Zoning Plan
This action begins with the ECAN Board’s endorsement of the plan to the
Sangguniang Bayan, followed by a public hearing at the Municipality of Busuanga. After
that, the plan should be adopted by the Sangguniang Bayan, and should be endorsed to the
Sangguniang Panlalawigan. The plan shall be finally approved by the PCSD.
Integration of the ECAN zoning plan with the municipal CLWUP
The ECAN Zoning Plan, as prepared by the ECAN Board in behalf of the LGU, shall
serve as the general physical plan of the municipality. Thus, it shall be the basis of other
Page | 151
planning activities, such as land use planning, tourism master planning and resource
management planning as a whole (PCSD Resolution 05-250, Section 30).
Adoption of the ECAN map for terrestrial, coastal/ marine and tribal component
This action may include the following steps:
a) Compilation of Generated Resource Maps from the Participatory Resource
Mapping Activity
b) Compilation of existing and proposed Marine Protected Area maps as
candidates for coastal/marine ECAN Core Zones and Multiple Use Zones.
c) Compilation of existing watershed Maps as candidates for ECAN Restricted
Use Zones
d) Compilation of existing and proposed Ancestral Domain Maps as candidates for
ECAN Tribal Zones.
e) Consultation of major stakeholders (LGU, MAO, Indigenous Groups)
Implementing organizations
Implementation of the components and activities of the ECAN Zoning Plan shall be
spearheaded by the LGU, together with the active participation of other concerned agencies
such as PCSDS, DA, DENR, DOT, PNP, DOH, DSWD, NCIP, NAMRIA, and many
others. The private sector are also expected to participate in the implementation of the plan,
for it will directly affect their economic welfare if the degradation of the environment
continues. Non-government organizations are expected to contribute as well, especially in
addressing the needs of the sectors they are currently involved in.
Possible sources of funds
The funds will not only come from the LGU. Government agencies (DENR, DA,
DSWD, DOLE, DTI, BFAR, PCCAARD-DOST, NIA, BSWM, and PCSD), institutions
(UPLB, IRRI, ATI, and PhilRice), private sector establishments (resorts, business
establishments, etc.), and NGOs (C3) will also be tapped to contribute in implementing the
ECAN Zoning Plan.
Monitoring and evaluation of the ECAN Plan
Monitoring and evaluation of the ECAN Zoning Plan, along with its programs and
projects shall be undertaken annually after its adoption by the Sangguniang Bayan.
Assisted by the PCSDS, the ECAN Board shall perform assessments to gauge the
efficiency of the administration and management of the ECAN resources as well as the
implementation of the ECAN Zoning Plan.
A Monitoring Team that would monitor and evaluate the ECAN Zoning Plan
implementation shall be constituted. They shall recommend proper management
assessment tools to the ECAN Board that will measure the effectiveness of the plan
implementation. They may also use existing evaluation tools that have already been
developed from other fields related with the management of areas. Since the province of
Palawan belongs to the network of biosphere reserves inscribed by UNESCO, the

Page | 152
assessment tools developed for island biosphere reserves can be used in assessing the
management effectiveness of the ECAN Zoning Plan of Busuanga.
The monitoring procedure shall include an assessment of the sustainability of the
programs and projects under this plan which shall cover the determination of whether the
targets have been completed. Also, assessment of the projects shall be done with the
following aspects as measures for evaluation:
a) Economic Viability
b) Ecological Viability
c) Technological Viability
d) Socio-cultural Viability
e) Political Viability
f) Institutional Viability Viability Viability Viability Viability Viability Viability
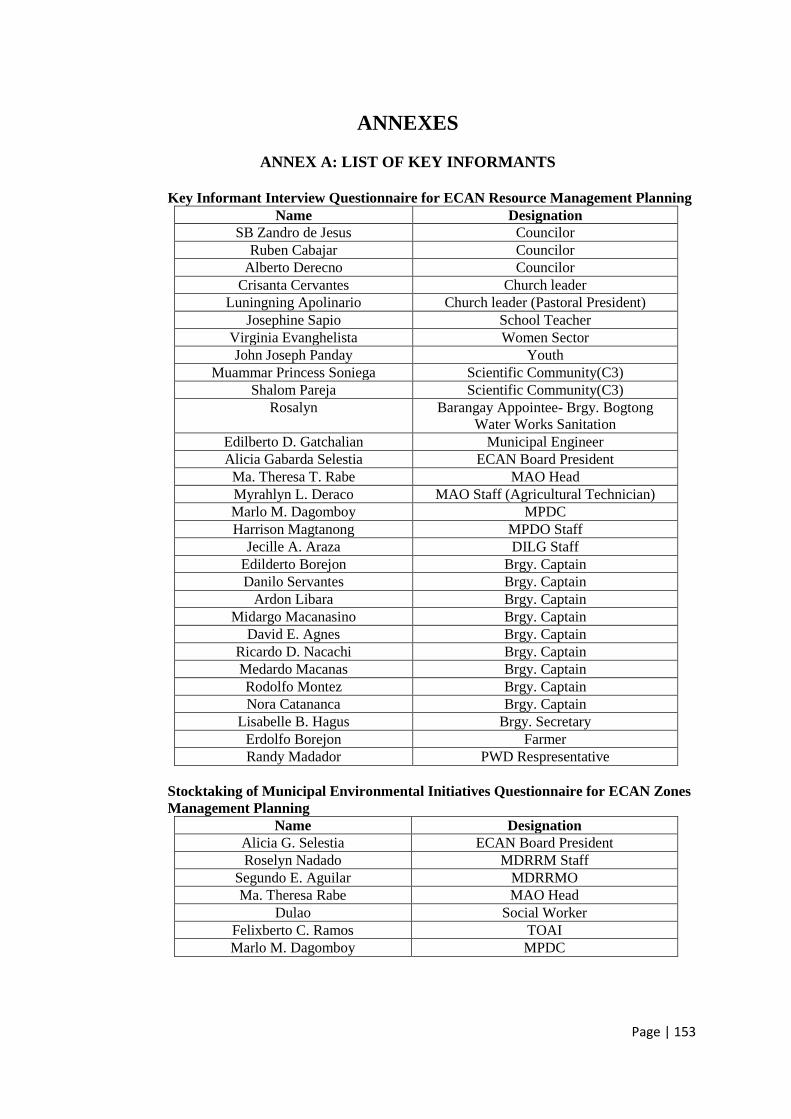
Page | 153
ANNEXES
ANNEX A: LIST OF KEY INFORMANTS
Key Informant Interview Questionnaire for ECAN Resource Management Planning
Name Designation
SB Zandro de Jesus Councilor
Ruben Cabajar Councilor
Alberto Derecno Councilor
Crisanta Cervantes Church leader
Luningning Apolinario Church leader (Pastoral President)
Josephine Sapio School Teacher
Virginia Evanghelista Women Sector
John Joseph Panday Youth
Muammar Princess Soniega Scientific Community(C3)
Shalom Pareja Scientific Community(C3)
Rosalyn Barangay Appointee- Brgy. Bogtong
Water Works Sanitation
Edilberto D. Gatchalian Municipal Engineer
Alicia Gabarda Selestia ECAN Board President
Ma. Theresa T. Rabe MAO Head
Myrahlyn L. Deraco MAO Staff (Agricultural Technician)
Marlo M. Dagomboy MPDC
Harrison Magtanong MPDO Staff
Jecille A. Araza DILG Staff
Edilderto Borejon Brgy. Captain
Danilo Servantes Brgy. Captain
Ardon Libara Brgy. Captain
Midargo Macanasino Brgy. Captain
David E. Agnes Brgy. Captain
Ricardo D. Nacachi Brgy. Captain
Medardo Macanas Brgy. Captain
Rodolfo Montez Brgy. Captain
Nora Catananca Brgy. Captain
Lisabelle B. Hagus Brgy. Secretary
Erdolfo Borejon Farmer
Randy Madador PWD Respresentative
Stocktaking of Municipal Environmental Initiatives Questionnaire for ECAN Zones
Management Planning
Name Designation
Alicia G. Selestia ECAN Board President
Roselyn Nadado MDRRM Staff
Segundo E. Aguilar MDRRMO
Ma. Theresa Rabe MAO Head
Dulao Social Worker
Felixberto C. Ramos TOAI
Marlo M. Dagomboy MPDC

Page | 154
ANNEX B: KEY INFORMANT INTERVIEW QUESTIONNAIRE ECAN
Field instrument 1: KII threats questionnaire
ECAN Resource Management Planning
Key Informant Interview Questionnaire (ECAN Needs + Projects) DPSIR Model
Questionnaire No.: _______
The needs and priorities of the municipality often depend on the kinds of problems and issues that occur in it.
Before we are able to introduce new projects, we must be able to identify first the threats and opportunities in
our area. Since the problems and issues that confront us are often complex, we must also be able to analyze
what are the causes and the impacts of our major problems. The analysis will help us prioritize our needs and
also the resources we must apply to solve our problems. For the identified needs/problems/issues/opportunities,
we will specify the solutions and actions that will address them.
Analysis will be aided by DPSIR framework2. In this framework, there is a chain of causal links starting with
‘driving forces’ (economic sectors, human activities) through ‘pressures’ (emissions, waste) to
‘states’(physical, chemical and biological) and ‘impacts’ on ecosystems, human health and functions,
eventually leading to political ‘responses’ (prioritisation, target setting, indicators).The components of the
DPSIR framework are defined in the following:
Driving force = Needs/Issues
Pressure = threats and problems
State = Current state of environment and natural resources
Impact = impact
Response = present actions taken to resolve issues and challenges
Gaps = in the actions taken
Proposed actions = measures that need to be undertaken to address gaps
Target Respondents for Municipal KII – Mayor, Municipal Councilor (committee chair on agriculture, fisheries,
environment and livelihood), MAO and staff, MPDC and staff, MENRO and staff, Tourism officer, NGO, PO
representative, Business and Industry (2), Church, school (principal or head teacher), IP leader, Women,
Children and Youth, Workers and Trade Unions (MFARMC), Scientific and Technological Communities,
Farmers and Small Forest Landowners
Note: Bring ECAN Map during the interview (ECAN Map must show boundaries, roads, built-up areas, and
other landmarks for reference)
Municipality: ________________ Barangay: _______________
Date & Time of KII:______________________Interviewer: ________________________
I. Personal details of respondent
1. Name (Pangalan): _____________________________
2. Address (Sitio, Barangay): ___________________________
3. Occupation (Trabaho): ________________________________
4. Position and Agency (Posisyon at Ahensya): _______________________________
5. Number of years in position (Bilang ng taon sa kasalukuyang posisyon): _____________
2 Based on EEA 1998: Guidelines for Data Collection and Processing - EU State of the Environment
Report. Annex 3.
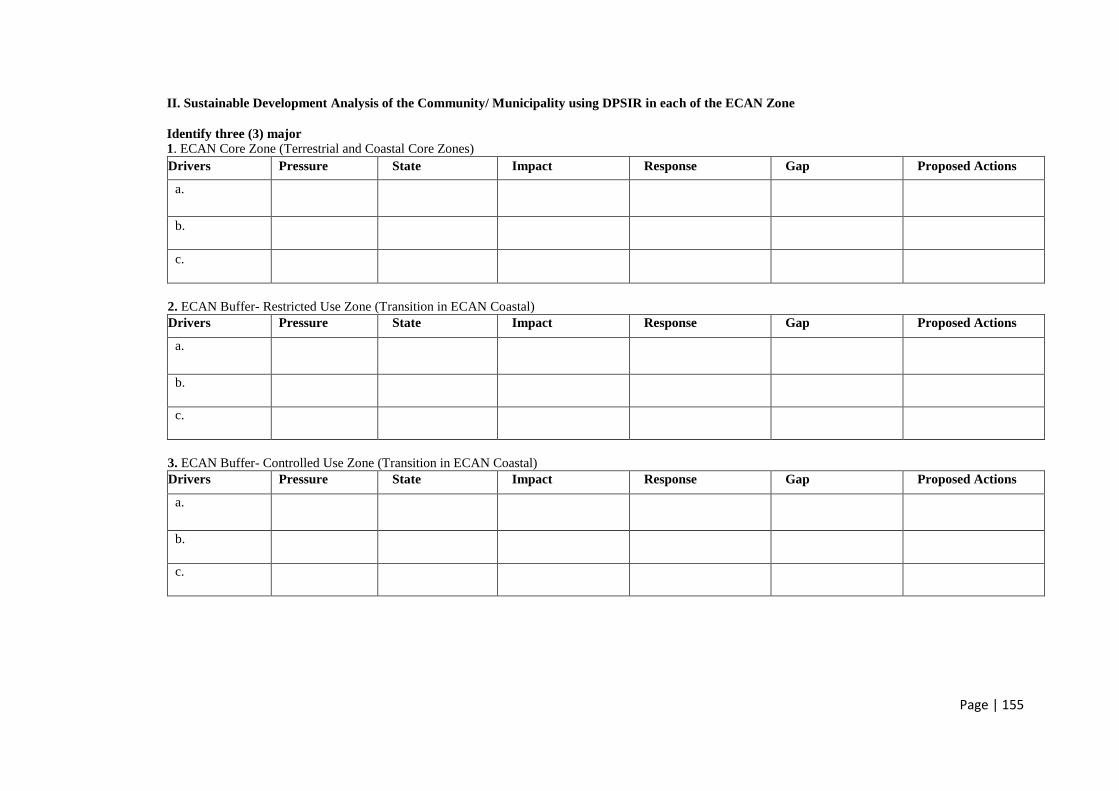
Page | 155
II. Sustainable Development Analysis of the Community/ Municipality using DPSIR in each of the ECAN Zone
Identify three (3) major
1. ECAN Core Zone (Terrestrial and Coastal Core Zones)
Drivers Pressure State Impact Response Gap Proposed Actions
a.
b.
c.
2. ECAN Buffer- Restricted Use Zone (Transition in ECAN Coastal)
Drivers Pressure State Impact Response Gap Proposed Actions
a.
b.
c.
3. ECAN Buffer- Controlled Use Zone (Transition in ECAN Coastal)
Drivers Pressure State Impact Response Gap Proposed Actions
a.
b.
c.

Page | 156
4. ECAN Buffer- Traditional Use Zone (Transition in ECAN Coastal)
Drivers Pressure State Impact Response Gap Proposed Actions
a.
b.
c.
5. ECAN Multiple Use Zone (General Use in ECAN Coastal)
Drivers Pressure State Impact Response Gap Proposed Actions
a.
b.
c.
6. Tribal Ancestral Zone (Terrestrial and Coastal)
Drivers Pressure State Impact Response Gap Proposed Actions
a.
b.
c.

Page | 157
IV. Opportunities
12. What do you think are the opportunities (or factors that have a positive effect on the community)
that can assist in the sustainable development and livelihood of your municipality once these are
developed or utilized? Categories of opportunities are as follows.
(Ano sa palagay nyo ang mga oportunidad (o mga bagay na may positibong epekto sa komunidad) na
pwedeng makatulong sa pangmatagalang kaunlaran at kabuhayan ng inyong munisipyo sakaling ito ay
ma-develop o magamit?)
13. Provide specific correspondence in each category.
12. Opportunities 13. Particulars Remarks
a. Presence of natural resources that
can be harnessed and developed
for livelihood in a sustainable
manner
b. Human resources or local
organizations that can manage and
catalyze resource conservation
and sustainable development
c. National and local policies
supportive of social, economic
and environmental development
in the barangay cluster
d. Private and Civic Society
Organization (CSO) support to the
undertakings of local development
projects
e. Accessibility to local markets and
financing institutions to support
development projects
f. Availability of conservation
technology for adoption by local
farmers and fishermen
g. Potential supply of water and
energy
h. Access to social services
i. Adequacy of support
infrastructure and facilities
j. Availability of sanitation and solid
waste disposal facilities
k. Others
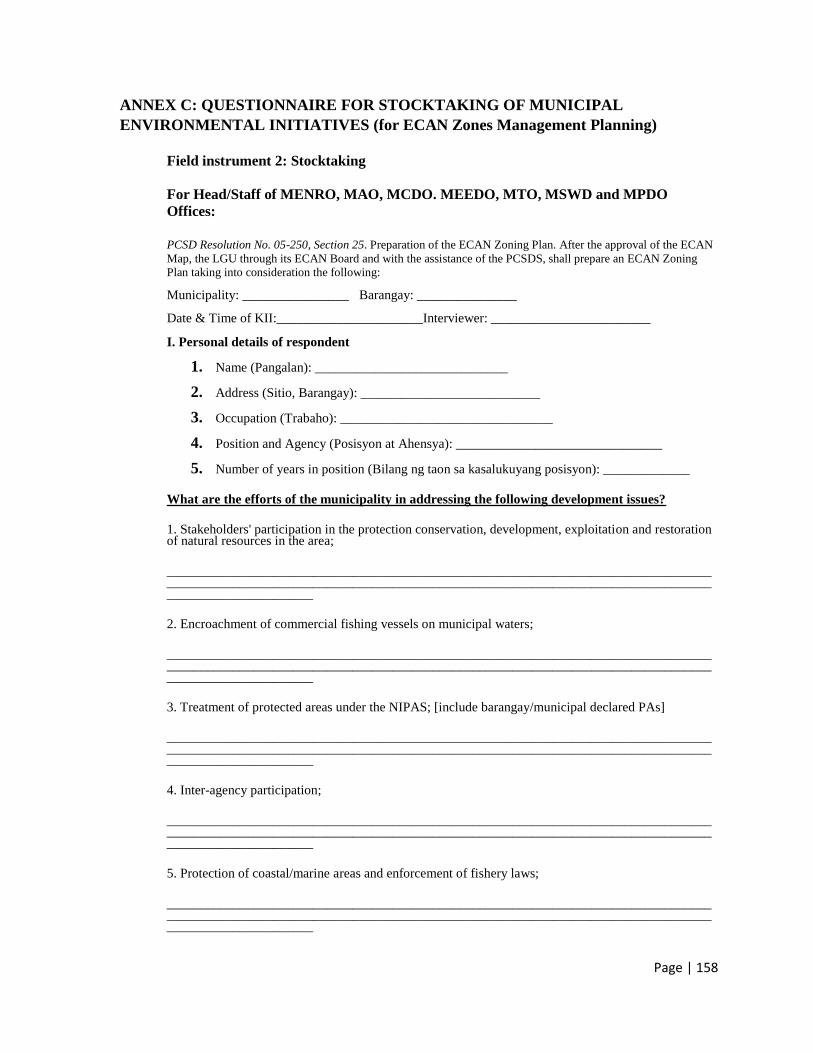
Page | 158
ANNEX C: QUESTIONNAIRE FOR STOCKTAKING OF MUNICIPAL
ENVIRONMENTAL INITIATIVES (for ECAN Zones Management Planning)
Field instrument 2: Stocktaking
For Head/Staff of MENRO, MAO, MCDO. MEEDO, MTO, MSWD and MPDO
Offices:
PCSD Resolution No. 05-250, Section 25. Preparation of the ECAN Zoning Plan. After the approval of the ECAN
Map, the LGU through its ECAN Board and with the assistance of the PCSDS, shall prepare an ECAN Zoning
Plan taking into consideration the following:
Municipality: ________________ Barangay: _______________
Date & Time of KII:______________________Interviewer: ________________________ I. Personal details of respondent
1. Name (Pangalan): _____________________________
2. Address (Sitio, Barangay): ___________________________
3. Occupation (Trabaho): ________________________________
4. Position and Agency (Posisyon at Ahensya): _______________________________
5. Number of years in position (Bilang ng taon sa kasalukuyang posisyon): _____________
What are the efforts of the municipality in addressing the following development issues?
1. Stakeholders' participation in the protection conservation, development, exploitation and restoration of natural resources in the area;
__________________________________________________________________________________________________________________________________________________________________________________________
2. Encroachment of commercial fishing vessels on municipal waters;
__________________________________________________________________________________________________________________________________________________________________________________________
3. Treatment of protected areas under the NIPAS; [include barangay/municipal declared PAs]
__________________________________________________________________________________________________________________________________________________________________________________________
4. Inter-agency participation;
__________________________________________________________________________________________________________________________________________________________________________________________
5. Protection of coastal/marine areas and enforcement of fishery laws;
__________________________________________________________________________________________________________________________________________________________________________________________
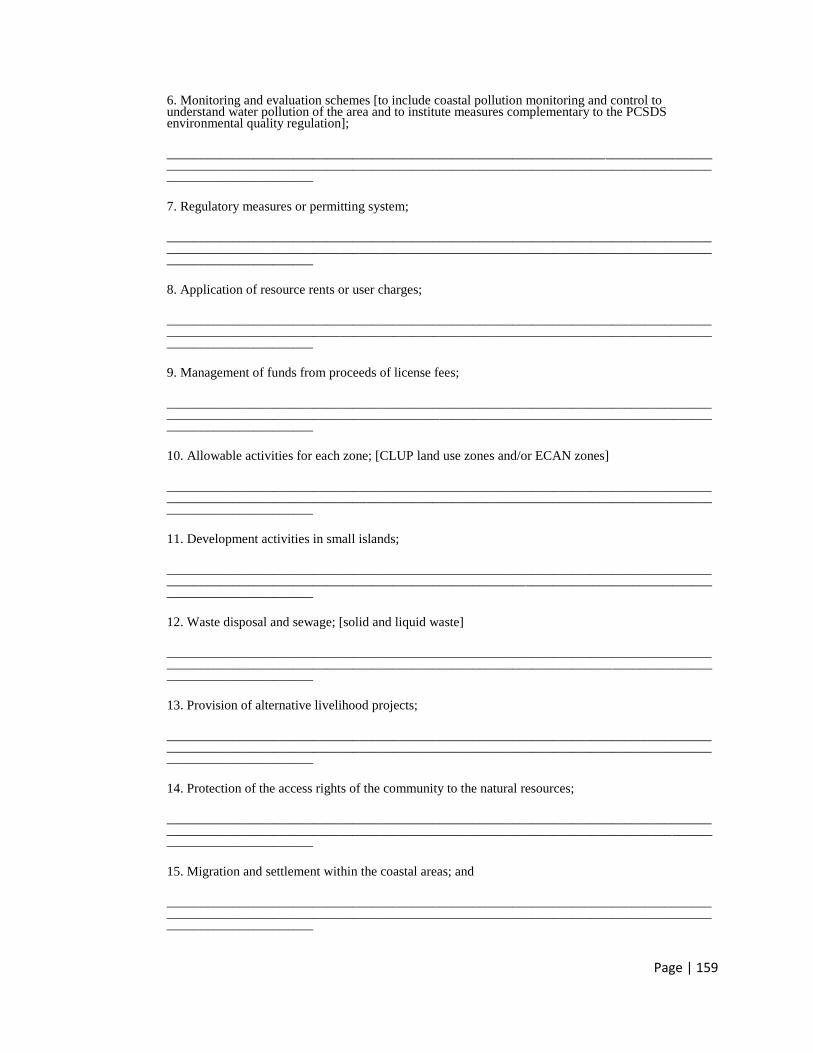
Page | 159
6. Monitoring and evaluation schemes [to include coastal pollution monitoring and control to understand water pollution of the area and to institute measures complementary to the PCSDS environmental quality regulation];
__________________________________________________________________________________________________________________________________________________________________________________________
7. Regulatory measures or permitting system;
__________________________________________________________________________________________________________________________________________________________________________________________
8. Application of resource rents or user charges;
__________________________________________________________________________________________________________________________________________________________________________________________
9. Management of funds from proceeds of license fees;
__________________________________________________________________________________________________________________________________________________________________________________________
10. Allowable activities for each zone; [CLUP land use zones and/or ECAN zones]
__________________________________________________________________________________________________________________________________________________________________________________________
11. Development activities in small islands;
__________________________________________________________________________________________________________________________________________________________________________________________
12. Waste disposal and sewage; [solid and liquid waste]
__________________________________________________________________________________________________________________________________________________________________________________________
13. Provision of alternative livelihood projects;
__________________________________________________________________________________________________________________________________________________________________________________________
14. Protection of the access rights of the community to the natural resources;
__________________________________________________________________________________________________________________________________________________________________________________________
15. Migration and settlement within the coastal areas; and
__________________________________________________________________________________________________________________________________________________________________________________________
Page | 160
16. Appropriation of funds for the implementation of the plan and the management of the ECAN zones.
__________________________________________________________________________________________________________________________________________________________________________________________
17. Others identified to be necessary and relevant
__________________________________________________________________________________________________________________________________________________________________________________________

Page | 161
ANNEX D: RESOURCE AND ECAN OVERLAY RESOURCE MAPS OF THE
BARANGAYS IN MUNICIPALITY OF BUSUANGA
Figure 21. Resource Map of Barangay Bogtong
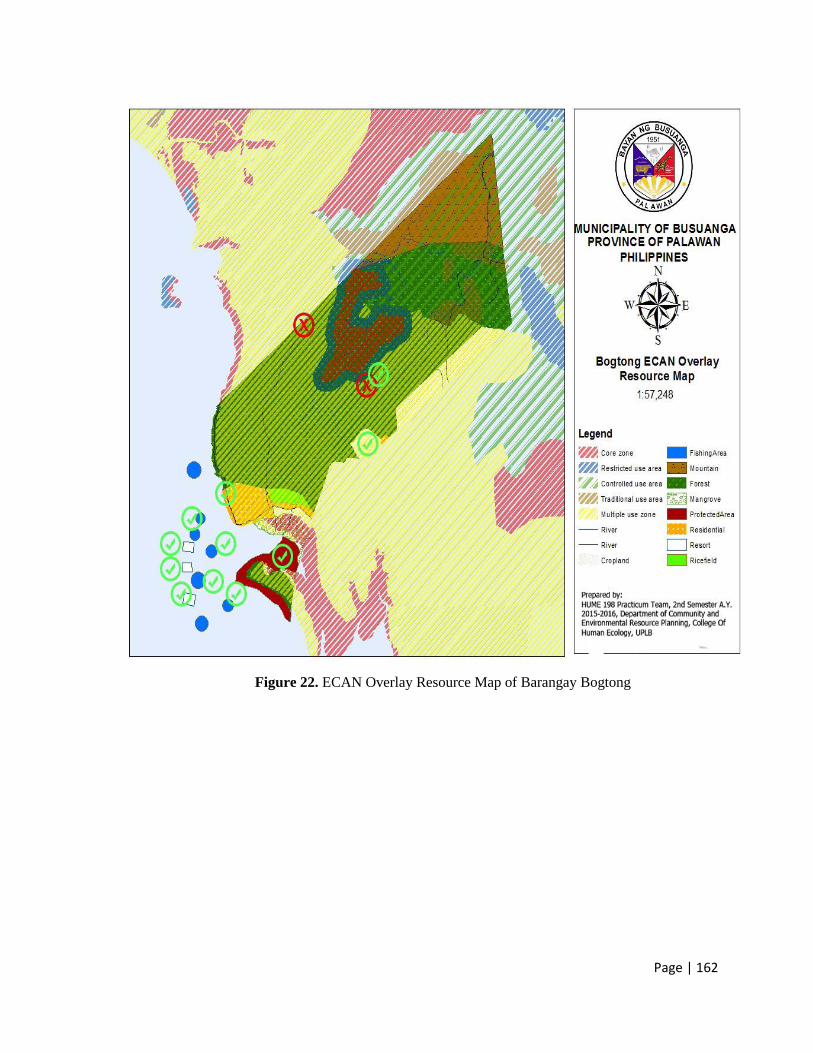
Page | 162
Figure 22. ECAN Overlay Resource Map of Barangay Bogtong
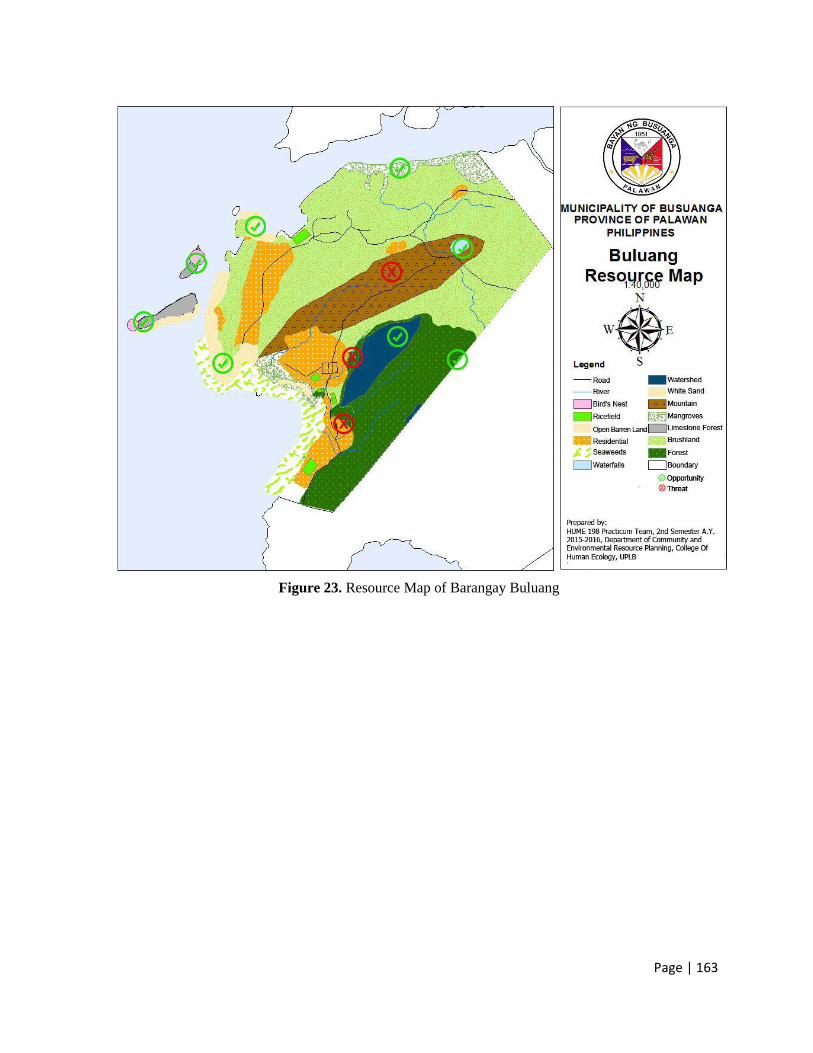
Page | 163
Figure 23. Resource Map of Barangay Buluang

Page | 164
Figure 24. ECAN Overlay Resource Map of Barangay Buluang
Bulua
ng

Page | 165
Figure 25. Resource Map of Calauit Island

Page | 166
Figure 26. ECAN Overlay Resource Map of Calauit Island
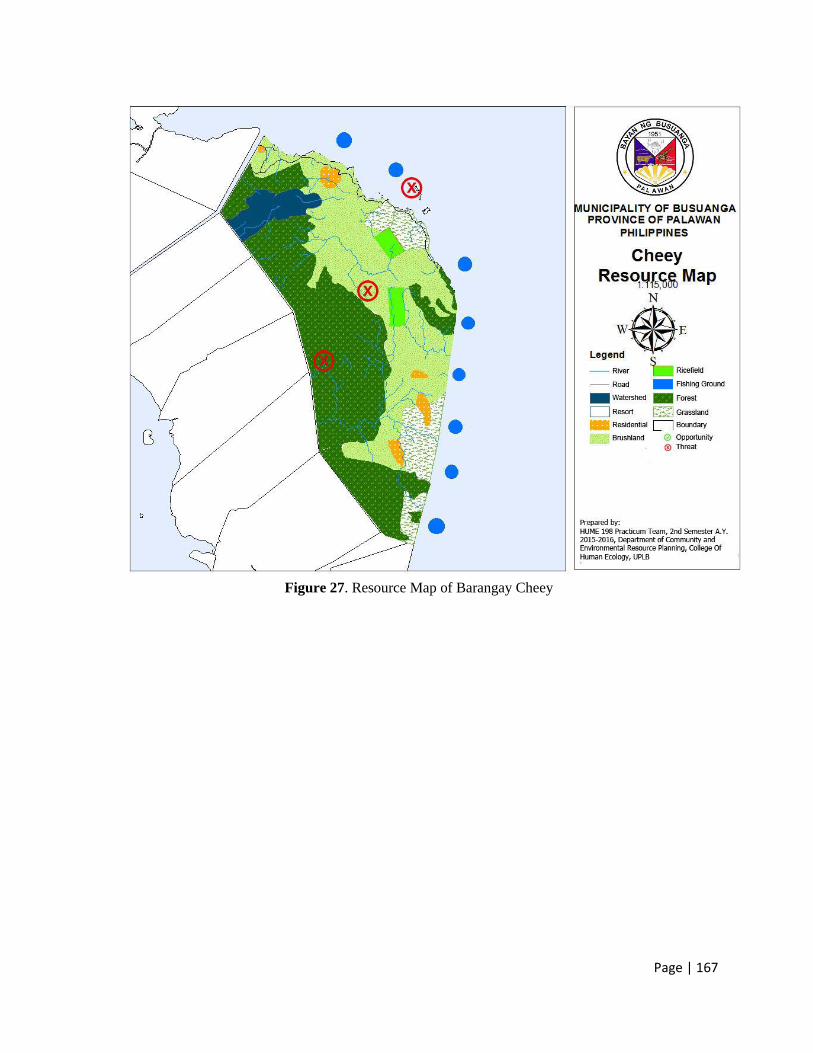
Page | 167
Figure 27. Resource Map of Barangay Cheey

Page | 168
Figure 28. ECAN Overlay Resource Map of Barangay Cheey
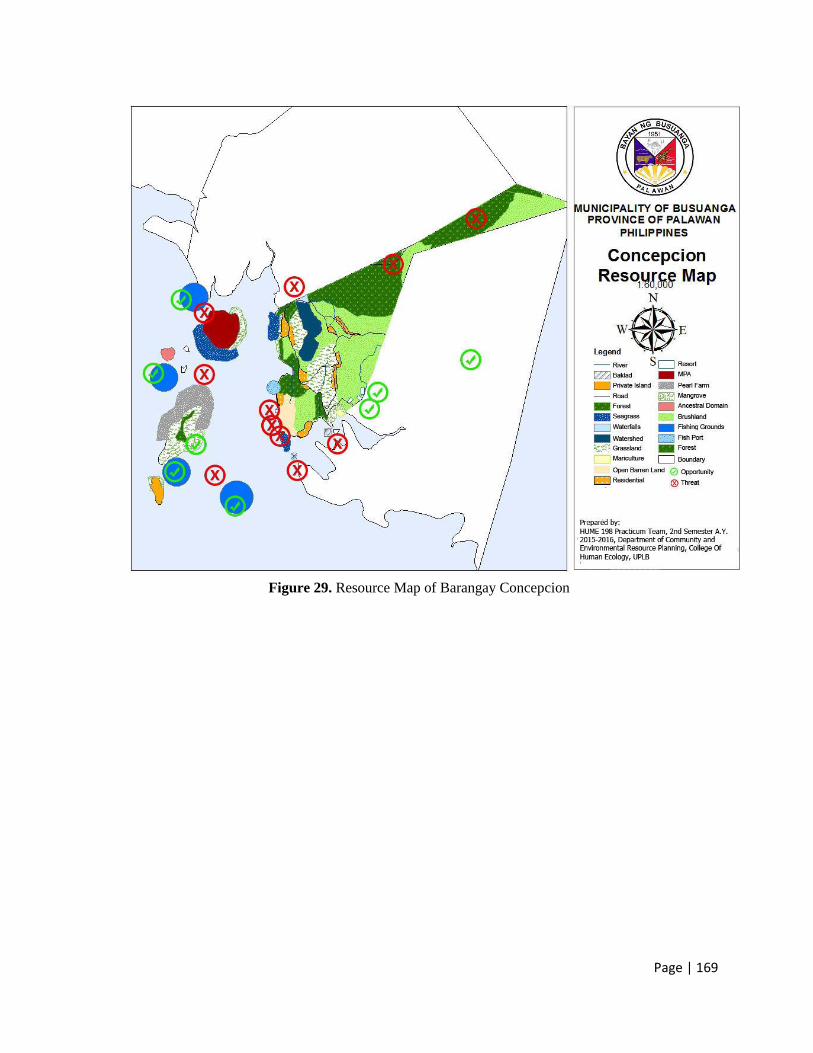
Page | 169
Figure 29. Resource Map of Barangay Concepcion
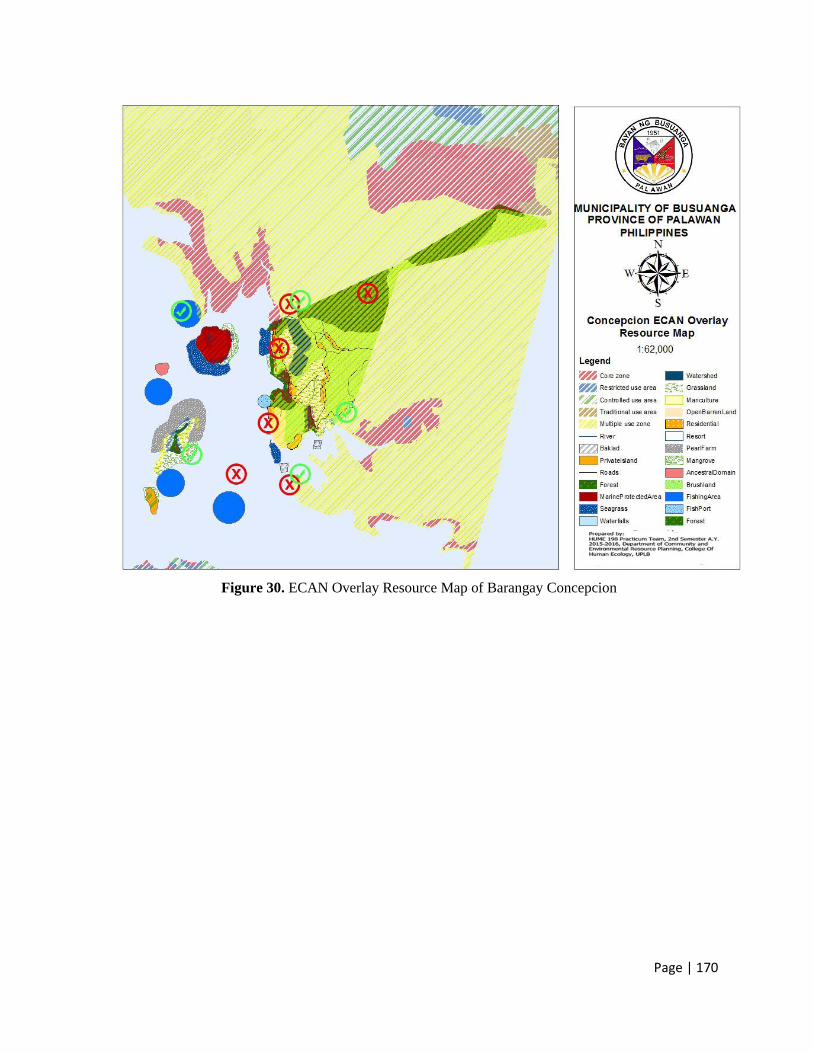
Page | 170
Figure 30. ECAN Overlay Resource Map of Barangay Concepcion

Page | 171
Figure 31. Resource Map of Barangay Maglalambay
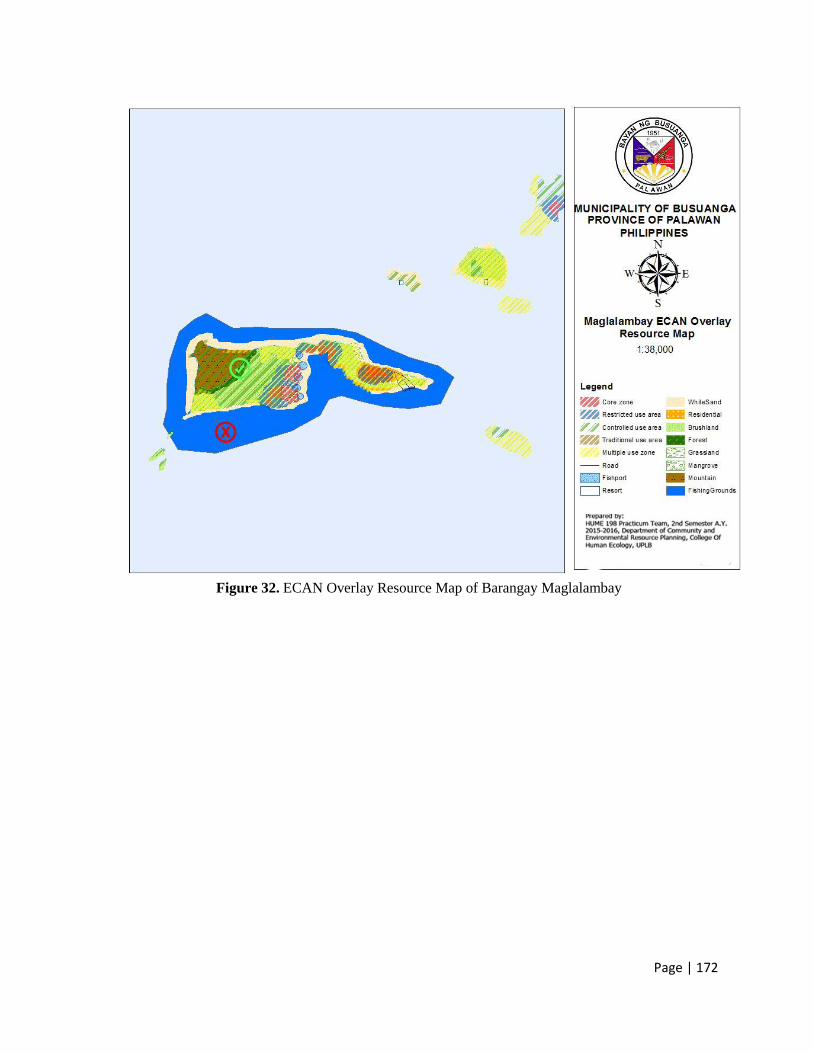
Page | 172
Figure 32. ECAN Overlay Resource Map of Barangay Maglalambay

Page | 173
Figure 33. Resource Map of Barangay New Busuanga

Page | 174
Figure 34. ECAN Overlay Resource Map of Barangay Maglalambay

Page | 175
Figure 35. Resource Map of Barangay Old Busuanga

Page | 176
Figure 36. ECAN Overlay Resource Map of Barangay Old Busuanga
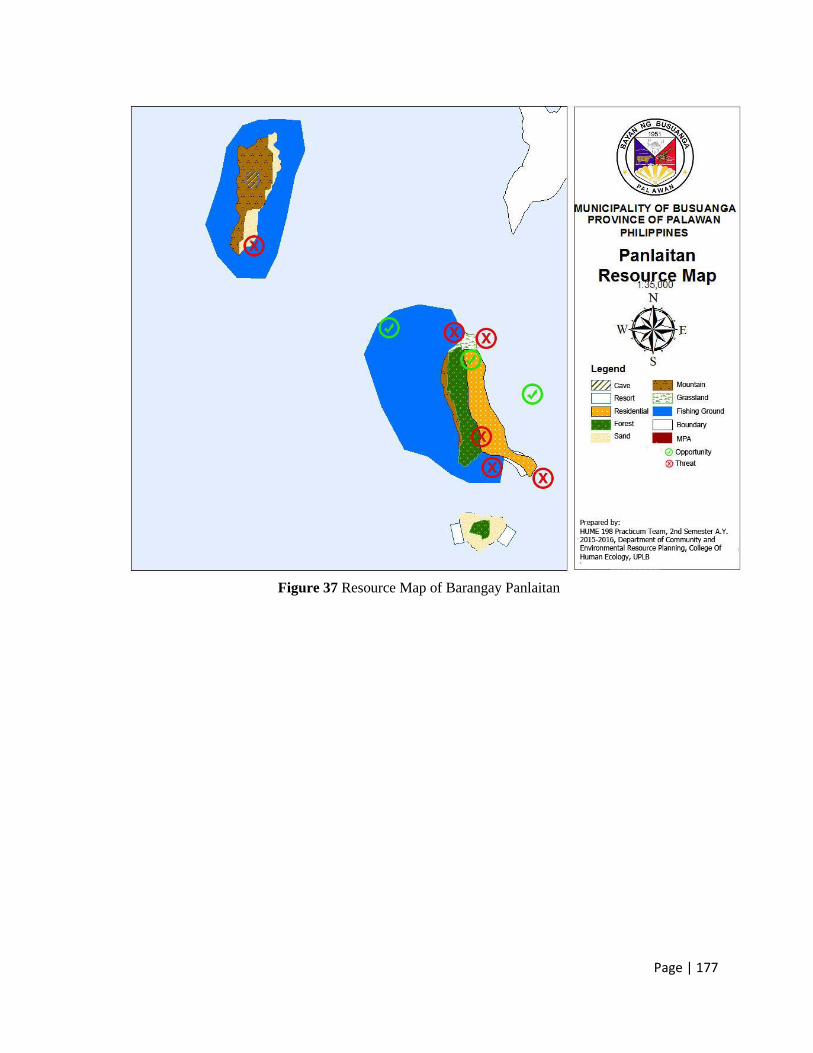
Page | 177
Figure 37 Resource Map of Barangay Panlaitan
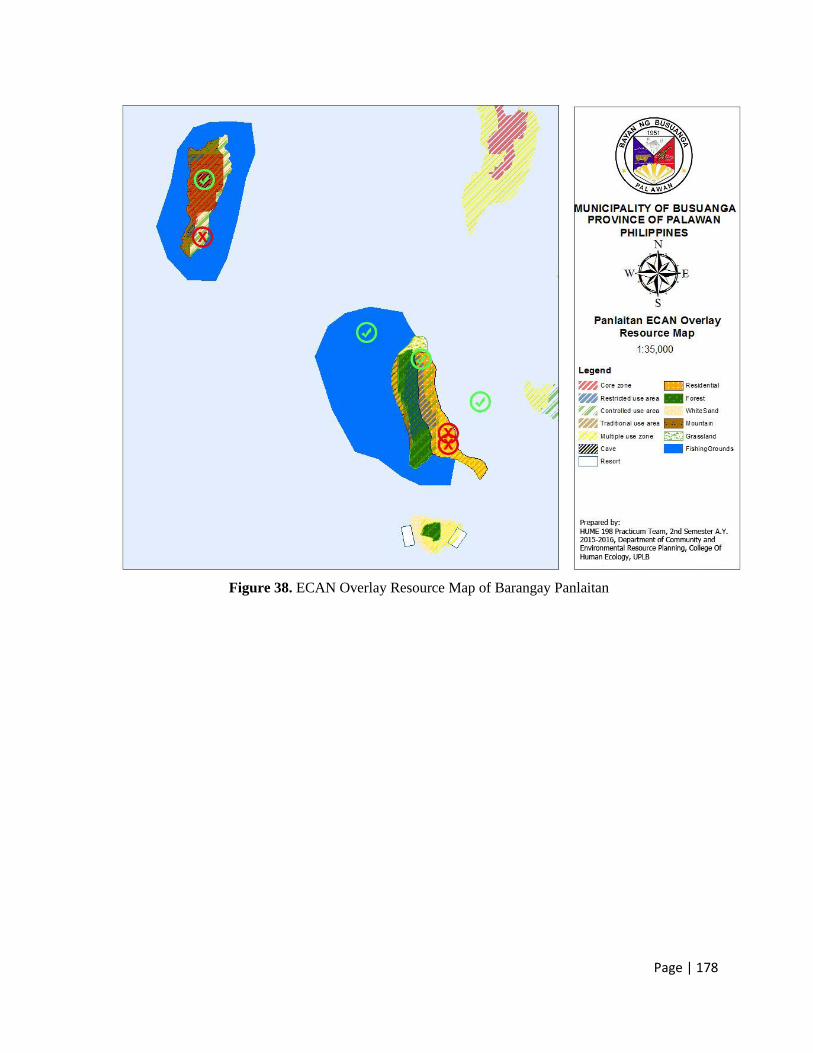
Page | 178
Figure 38. ECAN Overlay Resource Map of Barangay Panlaitan
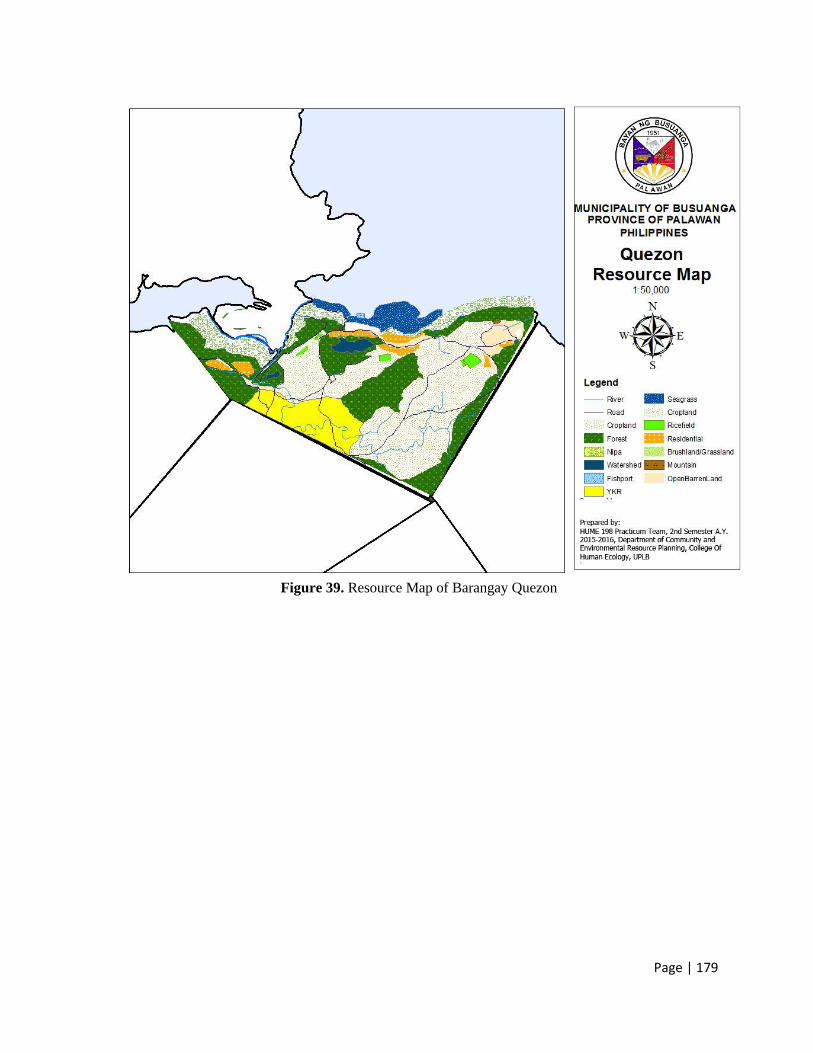
Page | 179
Figure 39. Resource Map of Barangay Quezon
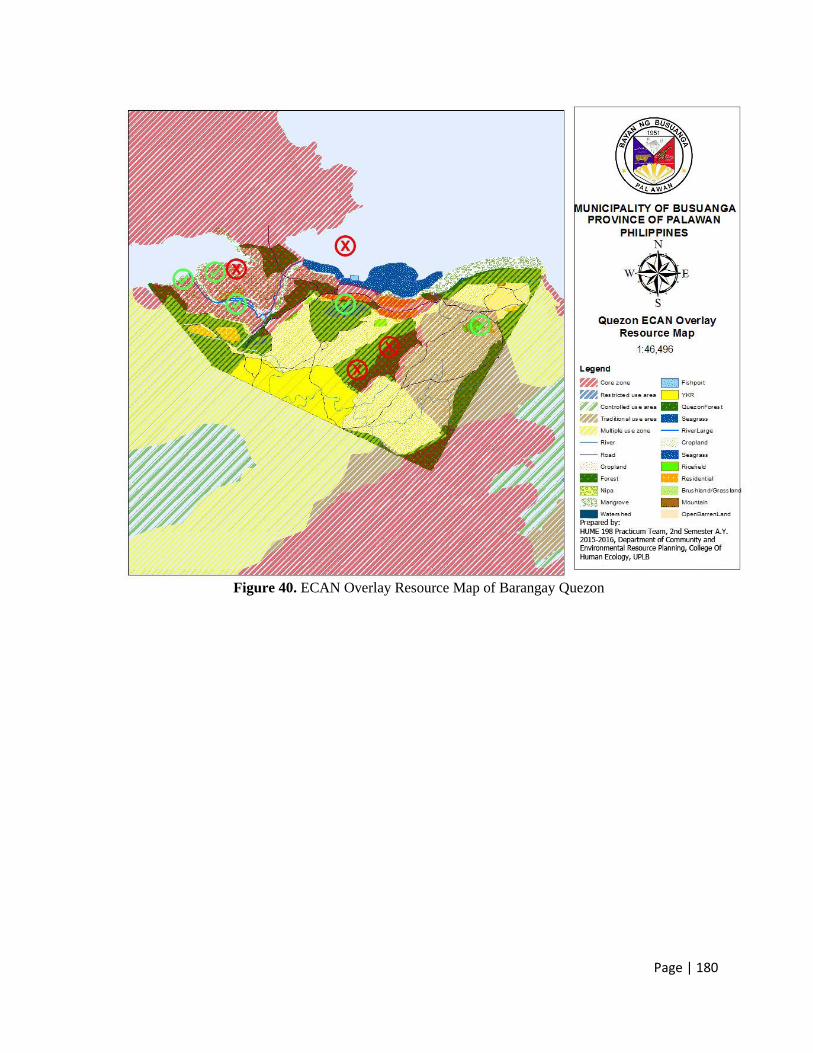
Page | 180
Figure 40. ECAN Overlay Resource Map of Barangay Quezon
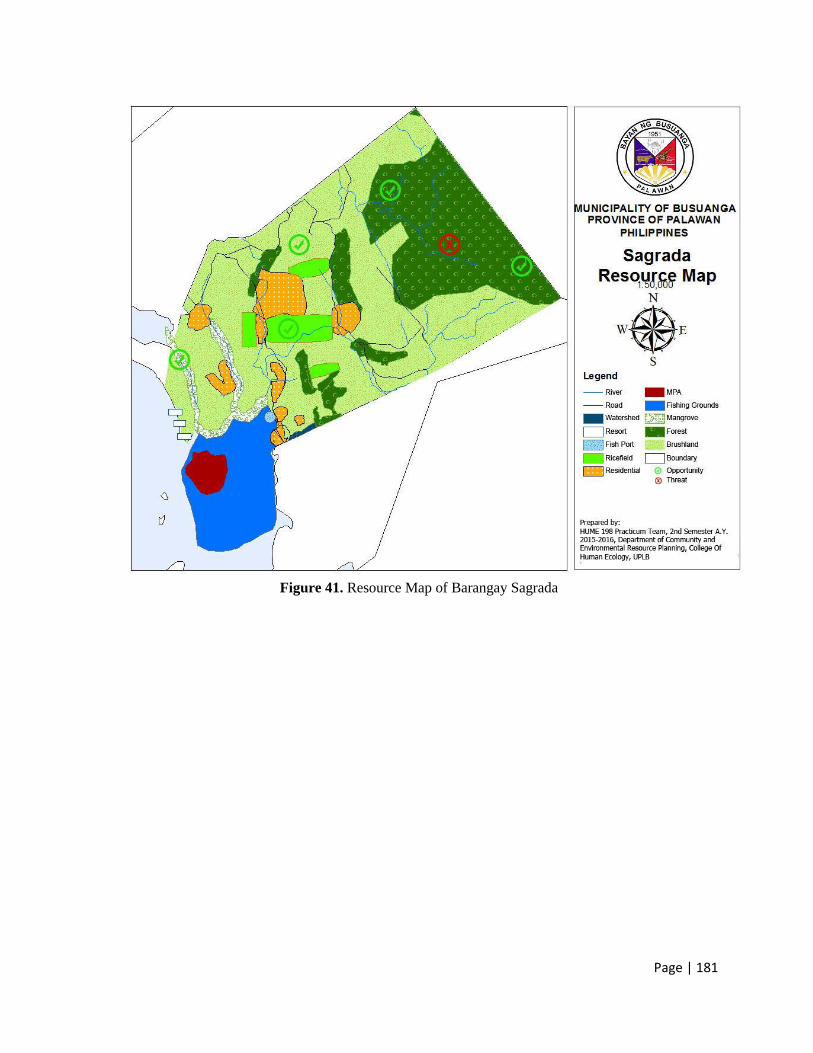
Page | 181
Figure 41. Resource Map of Barangay Sagrada

Page | 182
Figure 42. ECAN Overlay Resource Map of Barangay Sagrada
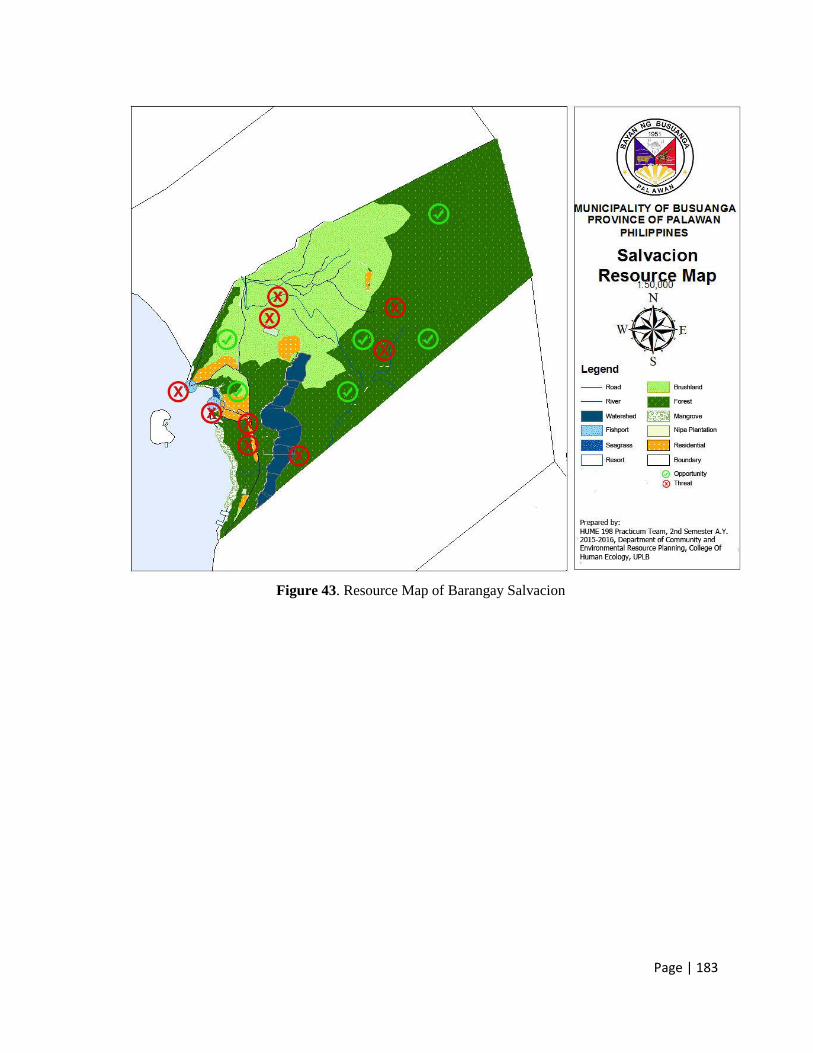
Page | 183
Figure 43. Resource Map of Barangay Salvacion
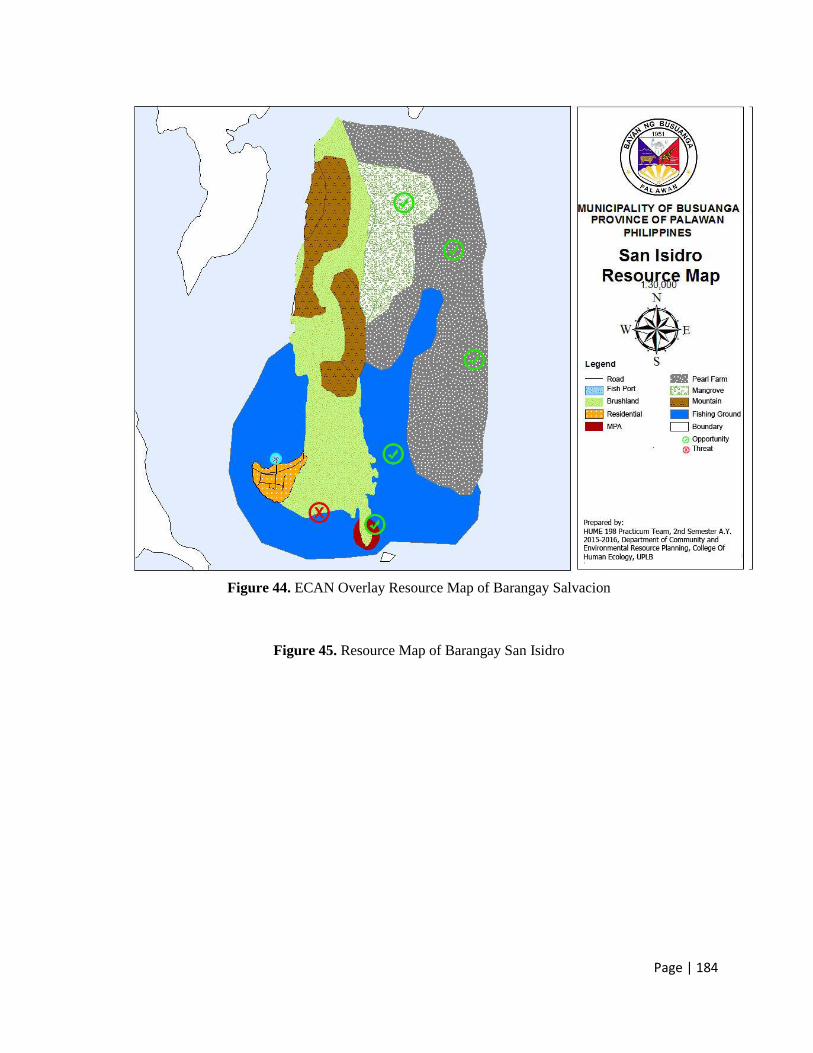
Page | 184
Figure 44. ECAN Overlay Resource Map of Barangay Salvacion
Figure 45. Resource Map of Barangay San Isidro
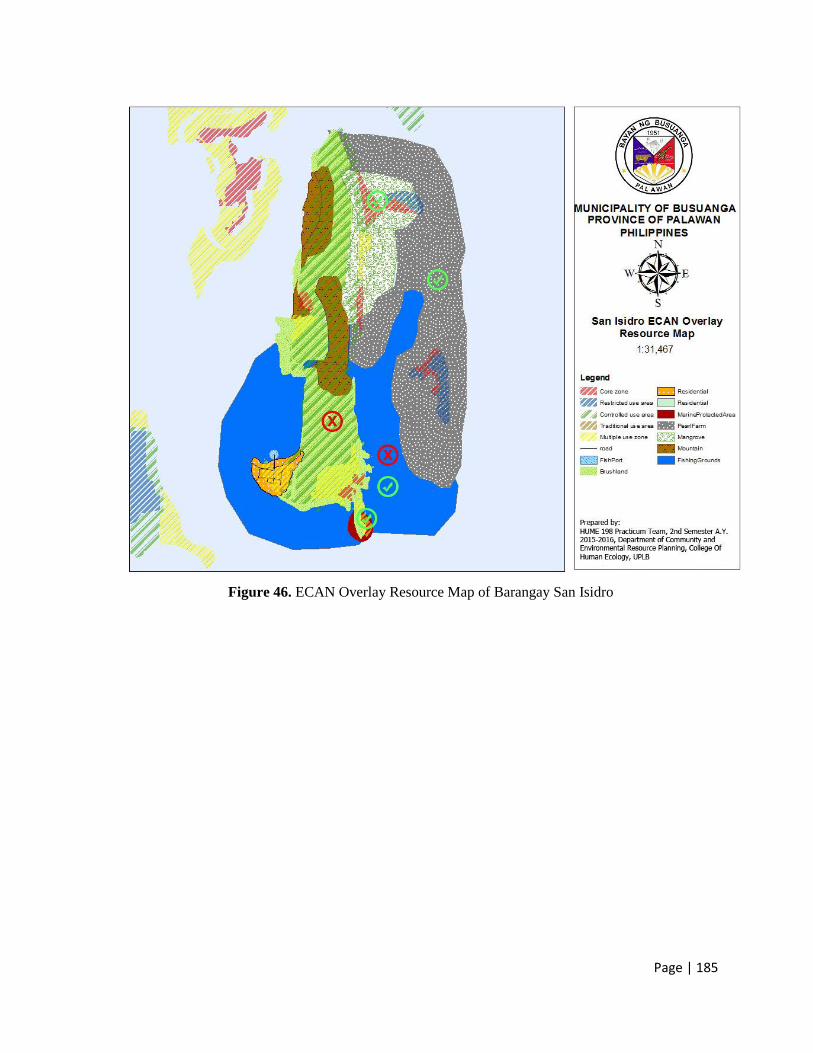
Page | 185
Figure 46. ECAN Overlay Resource Map of Barangay San Isidro

Page | 186
Figure 47. Resource Map of Barangay San Rafael

Page | 187
Figure 48. ECAN Overlay Resource Map of Barangay San Rafael
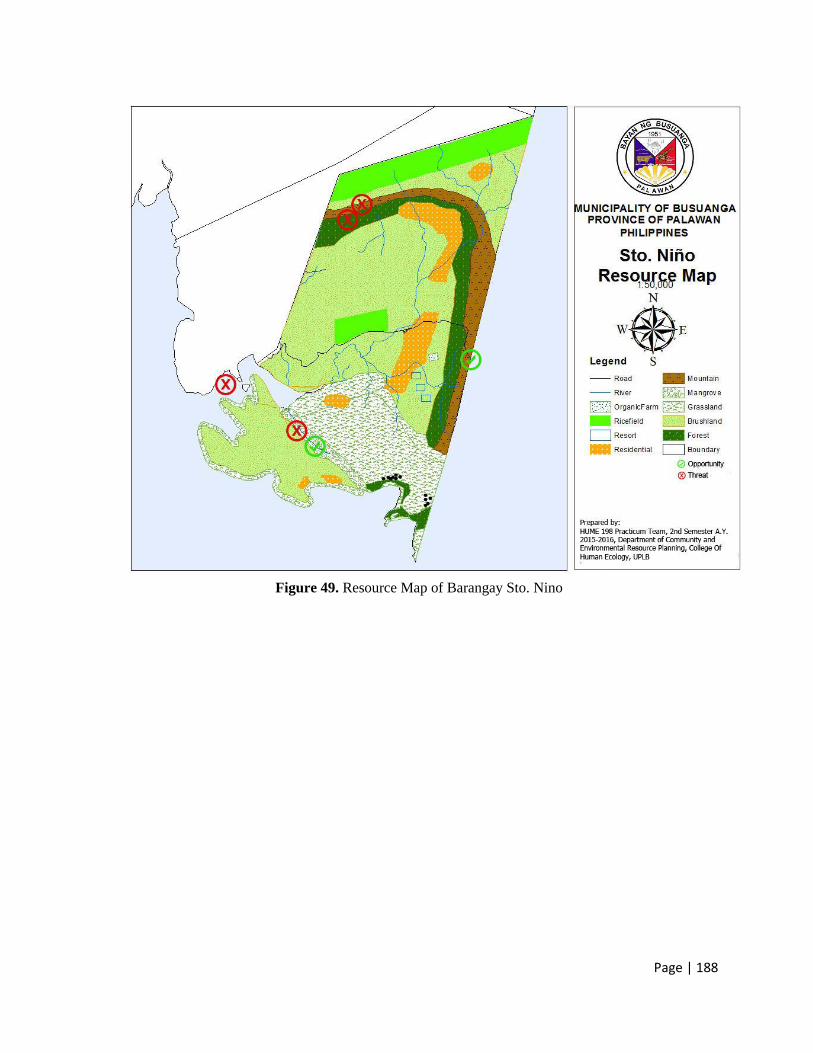
Page | 188
Figure 49. Resource Map of Barangay Sto. Nino

Page | 189
Figure 50. ECAN Overlay Resource Map of Barangay Sto. Nino
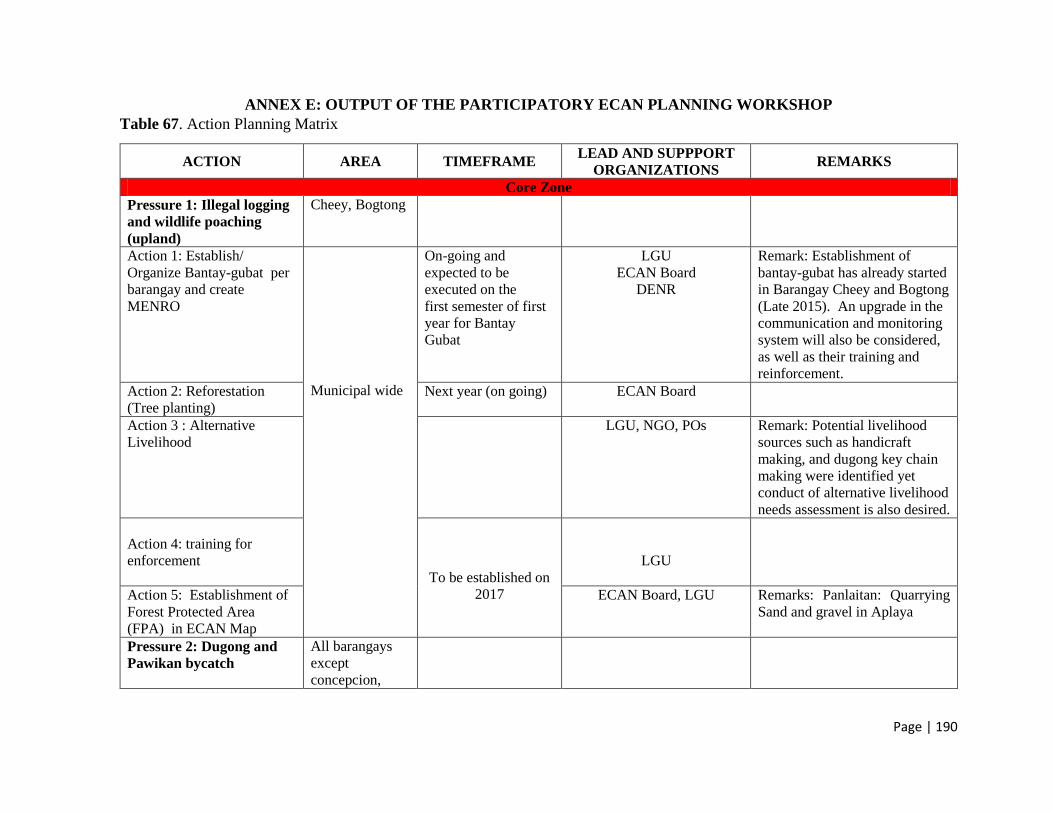
Page | 190
ANNEX E: OUTPUT OF THE PARTICIPATORY ECAN PLANNING WORKSHOP
Table 67. Action Planning Matrix
ACTION AREA TIMEFRAME LEAD AND SUPPPORT
ORGANIZATIONS REMARKS
Core Zone
Pressure 1: Illegal logging
and wildlife poaching
(upland)
Cheey, Bogtong
Action 1: Establish/
Organize Bantay-gubat per
barangay and create
MENRO
Municipal wide
On-going and
expected to be
executed on the
first semester of first
year for Bantay
Gubat
LGU
ECAN Board
DENR
Remark: Establishment of
bantay-gubat has already started
in Barangay Cheey and Bogtong
(Late 2015). An upgrade in the
communication and monitoring
system will also be considered,
as well as their training and
reinforcement.
Action 2: Reforestation
(Tree planting)
Next year (on going) ECAN Board
Action 3 : Alternative
Livelihood
LGU, NGO, POs Remark: Potential livelihood
sources such as handicraft
making, and dugong key chain
making were identified yet
conduct of alternative livelihood
needs assessment is also desired.
Action 4: training for
enforcement
To be established on
2017
LGU
Action 5: Establishment of
Forest Protected Area
(FPA) in ECAN Map
ECAN Board, LGU
Remarks: Panlaitan: Quarrying
Sand and gravel in Aplaya
Pressure 2: Dugong and
Pawikan bycatch
All barangays
except
concepcion,

Page | 191
sagrada,
bogtong,
Action1: Dugong Protected
Management Zones
Using Rapid Assessment
Score Cards
To be started by 2017
C3 This process will be done by
ranking score (activities) as
threat in the local population
Action2: IECs on dugong
conservation and nesting
site conservation
C3, NGO
Action 3:IECs on nesting
site conservation and
forging of conservation
agreements with resort
owners
LGU, NGO, C3, Resort
owners for management ( Ex:
North Cay)
Resort owners are responsible
for the management of turle
nesting sites and dugong
conservation sites
Pressure 3: Unsustainable
agricultural practices
(kaingin)
Buluang, Old
Busuanga, San
rafaael, New
Busuanga, San
Isidro
Action 1: Conduct IECs
For forest management
Municipal wide
2016 LGU, NGO, PCSD
Action 2: Alternative
livelihood
2016/2017 LGU, NGO Potential livelihood sources
such as handicraft making were
identified yet conduct of
alternative livelihood needs
assessment is also desired.
Action 3: Strict
Implementation of policies:
EO 23, PD 705
As soon as possible LGU, DENR, DAR, ECAN
Board, PNP, Barangay
Pressure 4 : Harvesting of
corals
All barangays
concerned
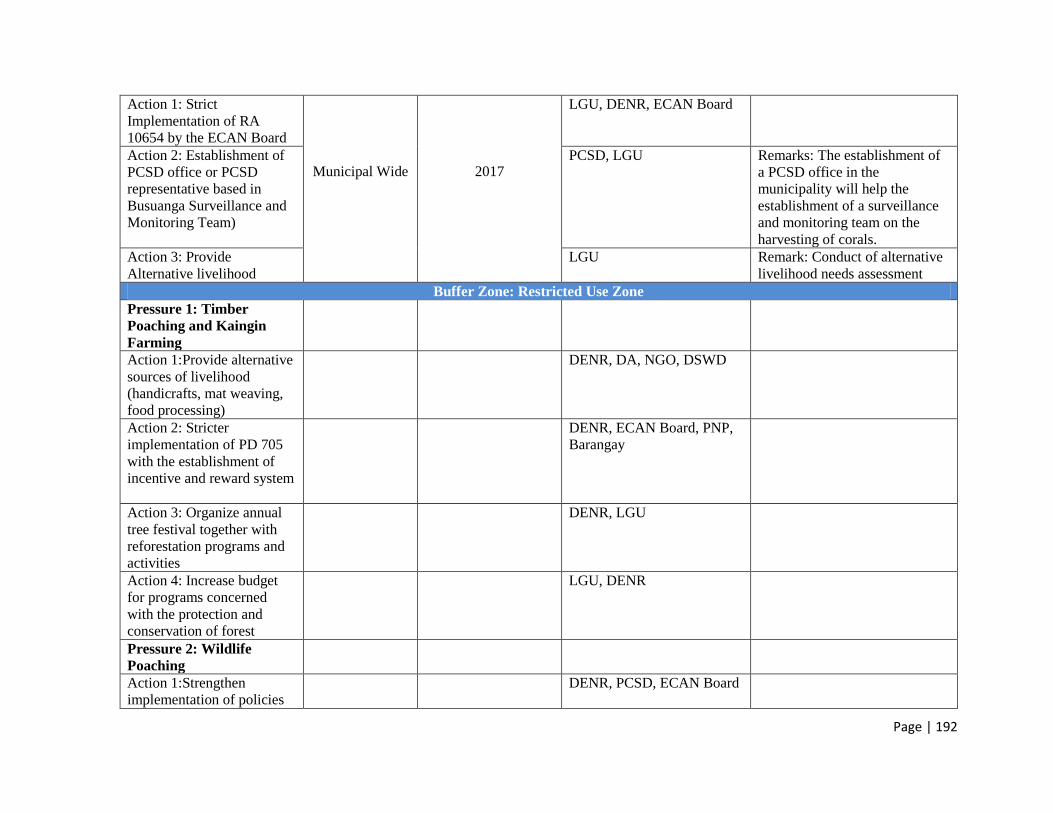
Page | 192
Action 1: Strict
Implementation of RA
10654 by the ECAN Board
Municipal Wide
2017
LGU, DENR, ECAN Board
Action 2: Establishment of
PCSD office or PCSD
representative based in
Busuanga Surveillance and
Monitoring Team)
PCSD, LGU Remarks: The establishment of
a PCSD office in the
municipality will help the
establishment of a surveillance
and monitoring team on the
harvesting of corals.
Action 3: Provide
Alternative livelihood
LGU Remark: Conduct of alternative
livelihood needs assessment
Buffer Zone: Restricted Use Zone
Pressure 1: Timber
Poaching and Kaingin
Farming
Action 1:Provide alternative
sources of livelihood
(handicrafts, mat weaving,
food processing)
DENR, DA, NGO, DSWD
Action 2: Stricter
implementation of PD 705
with the establishment of
incentive and reward system
DENR, ECAN Board, PNP,
Barangay
Action 3: Organize annual
tree festival together with
reforestation programs and
activities
DENR, LGU
Action 4: Increase budget
for programs concerned
with the protection and
conservation of forest
LGU, DENR
Pressure 2: Wildlife
Poaching
Action 1:Strengthen
implementation of policies
DENR, PCSD, ECAN Board

Page | 193
regarding wildlife (Wildlife
Resources and Conservation
and Protection Act, RA
9147)
Action 2: Conduct IEC
campaigns in the protection
of wildlife
ECAN Board, PCSD,
Barangay
Action 3: Provide
alternative livelihoods to
local communities engaged
in hunting wildlife for food
and trade
DOLE, DTI, DENR, DA,
LGU, DSWD
Action 4: Establish a
wildlife protection unit and
rescue center
PCSD, DENR, LGU
Buffer Zone: Controlled Use Zone
Pressure 1:Mountain
Quarry without permit
Pressure 1:Mountain
Quarry without permit
Action 1: Proper
communication between
LGU and private companies
regarding permitting
PCSD, LGU
Action 2: Review and
update of fees, charges, and
requirements
Pressure 2: Wildlife
Poaching
Action 1:Strengthen
implementation of policies
regarding wildlife (Wildlife
Resources and Conservation
and Protection Act, RA
9147)
DENR, PCSD, ECAN Board
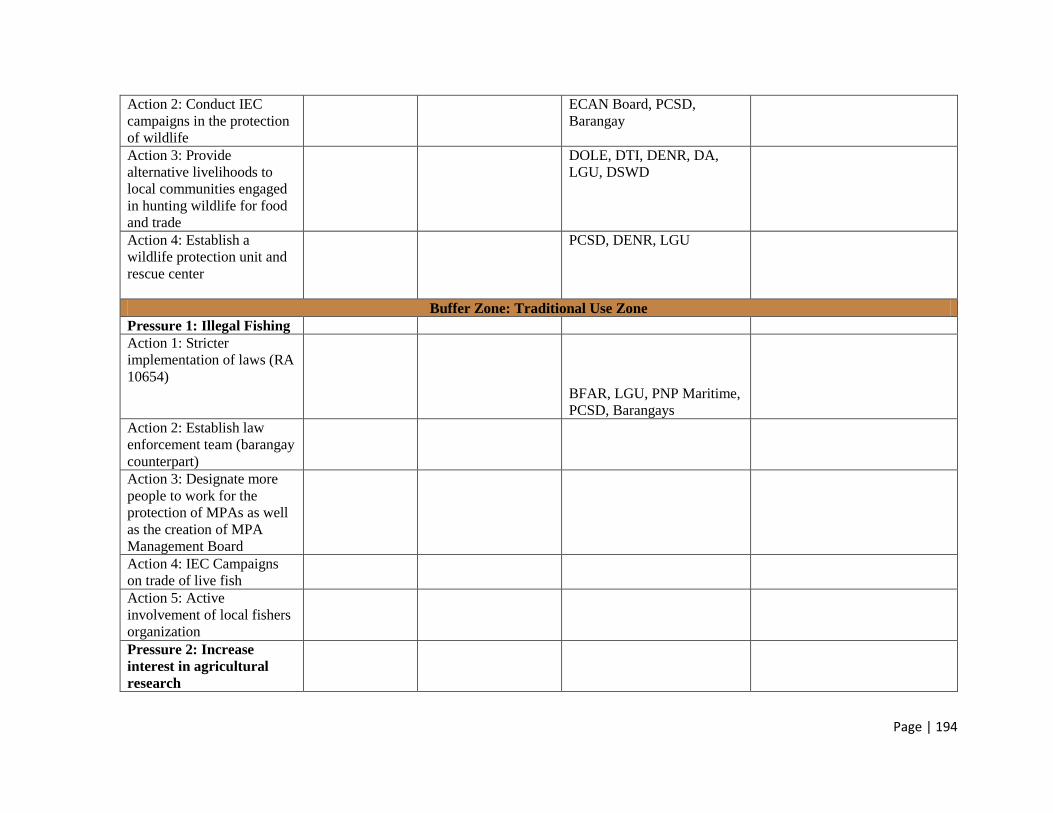
Page | 194
Action 2: Conduct IEC
campaigns in the protection
of wildlife
ECAN Board, PCSD,
Barangay
Action 3: Provide
alternative livelihoods to
local communities engaged
in hunting wildlife for food
and trade
DOLE, DTI, DENR, DA,
LGU, DSWD
Action 4: Establish a
wildlife protection unit and
rescue center
PCSD, DENR, LGU
Buffer Zone: Traditional Use Zone
Pressure 1: Illegal Fishing
Action 1: Stricter
implementation of laws (RA
10654)
BFAR, LGU, PNP Maritime,
PCSD, Barangays
Action 2: Establish law
enforcement team (barangay
counterpart)
Action 3: Designate more
people to work for the
protection of MPAs as well
as the creation of MPA
Management Board
Action 4: IEC Campaigns
on trade of live fish
Action 5: Active
involvement of local fishers
organization
Pressure 2: Increase
interest in agricultural
research

Page | 195
Action 1: Provision of
funds for research
PCCAARD-DOST
Action 2: Coordinate and
request agricultural
institutions to conduct and
provide funding for
agricultural researches in
traditional zones
PhilRice, UPLB, IRRI, DA,
ATI
Pressure 3: Lack of
Irrigation System
Action 1: Provide stable
irrigation systems
(infrastructure
development); repair
damaged irrigation canals
and construct new irrigation
facilities for irrigable upland
areas
NIA, DA, BSWM
Action 2: Tap other sources
of water (watersheds) in
order to improve capacities
of irrigation facilities
Action 3: Develop public
and private partnership for
small and large scale
irrigation
Multiple Use Zone
Pressure 1: Absence Of
Secondary Health Care
Facilities (Hospital, to
cater to municipality and
visiting tourists)
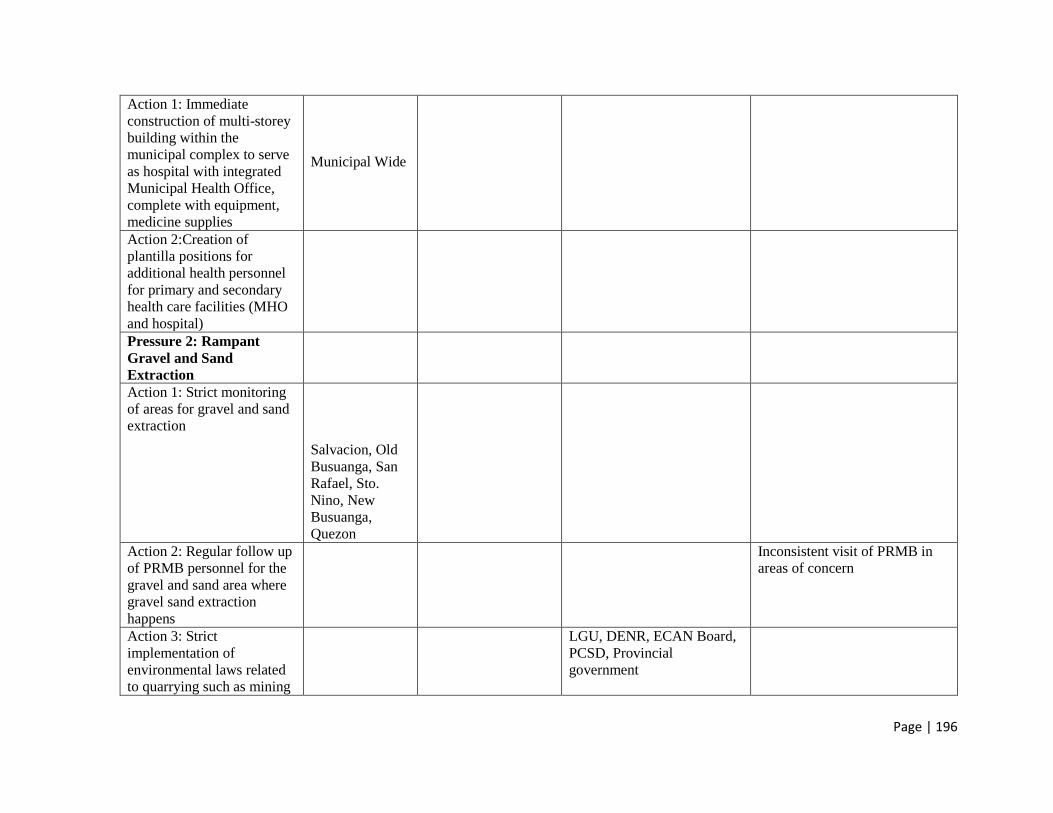
Page | 196
Action 1: Immediate
construction of multi-storey
building within the
municipal complex to serve
as hospital with integrated
Municipal Health Office,
complete with equipment,
medicine supplies
Municipal Wide
Action 2:Creation of
plantilla positions for
additional health personnel
for primary and secondary
health care facilities (MHO
and hospital)
Pressure 2: Rampant
Gravel and Sand
Extraction
Action 1: Strict monitoring
of areas for gravel and sand
extraction
Salvacion, Old
Busuanga, San
Rafael, Sto.
Nino, New
Busuanga,
Quezon
Action 2: Regular follow up
of PRMB personnel for the
gravel and sand area where
gravel sand extraction
happens
Inconsistent visit of PRMB in
areas of concern
Action 3: Strict
implementation of
environmental laws related
to quarrying such as mining
LGU, DENR, ECAN Board,
PCSD, Provincial
government
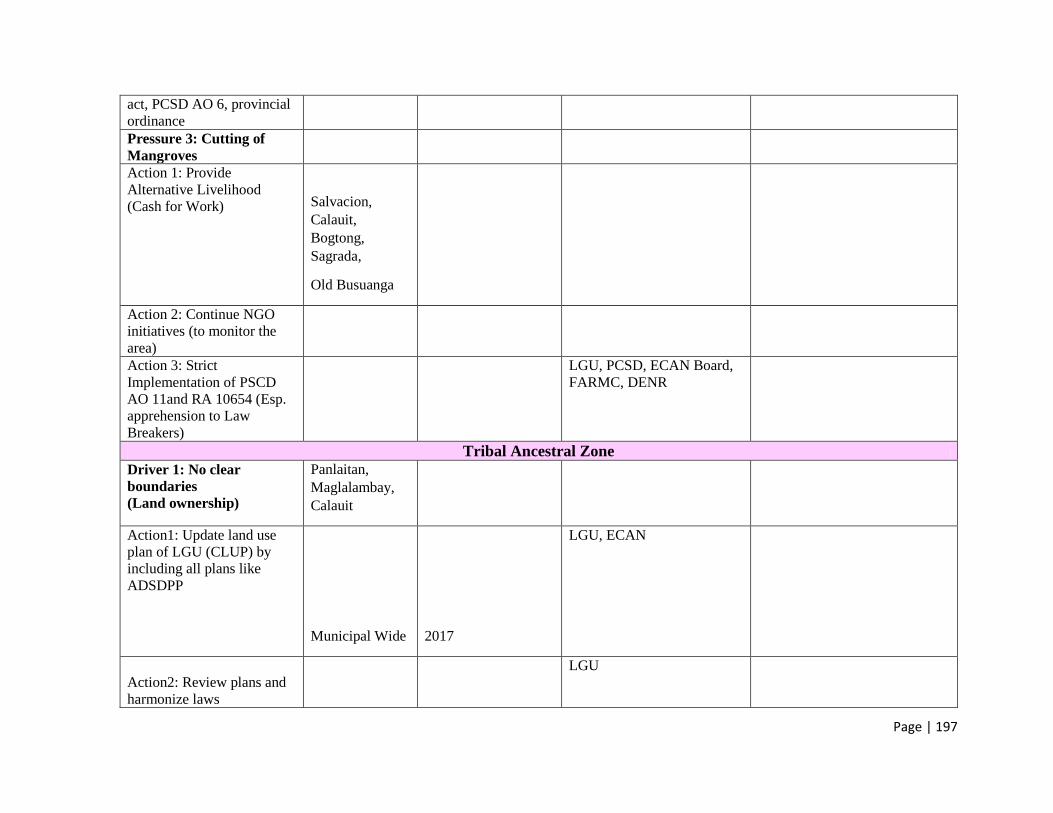
Page | 197
act, PCSD AO 6, provincial
ordinance
Pressure 3: Cutting of
Mangroves
Action 1: Provide
Alternative Livelihood
(Cash for Work)
Salvacion,
Calauit,
Bogtong,
Sagrada,
Old Busuanga
Action 2: Continue NGO
initiatives (to monitor the
area)
Action 3: Strict
Implementation of PSCD
AO 11and RA 10654 (Esp.
apprehension to Law
Breakers)
LGU, PCSD, ECAN Board,
FARMC, DENR
Tribal Ancestral Zone
Driver 1: No clear
boundaries
(Land ownership)
Panlaitan,
Maglalambay,
Calauit
Action1: Update land use
plan of LGU (CLUP) by
including all plans like
ADSDPP
Municipal Wide
2017
LGU, ECAN
Action2: Review plans and
harmonize laws
LGU
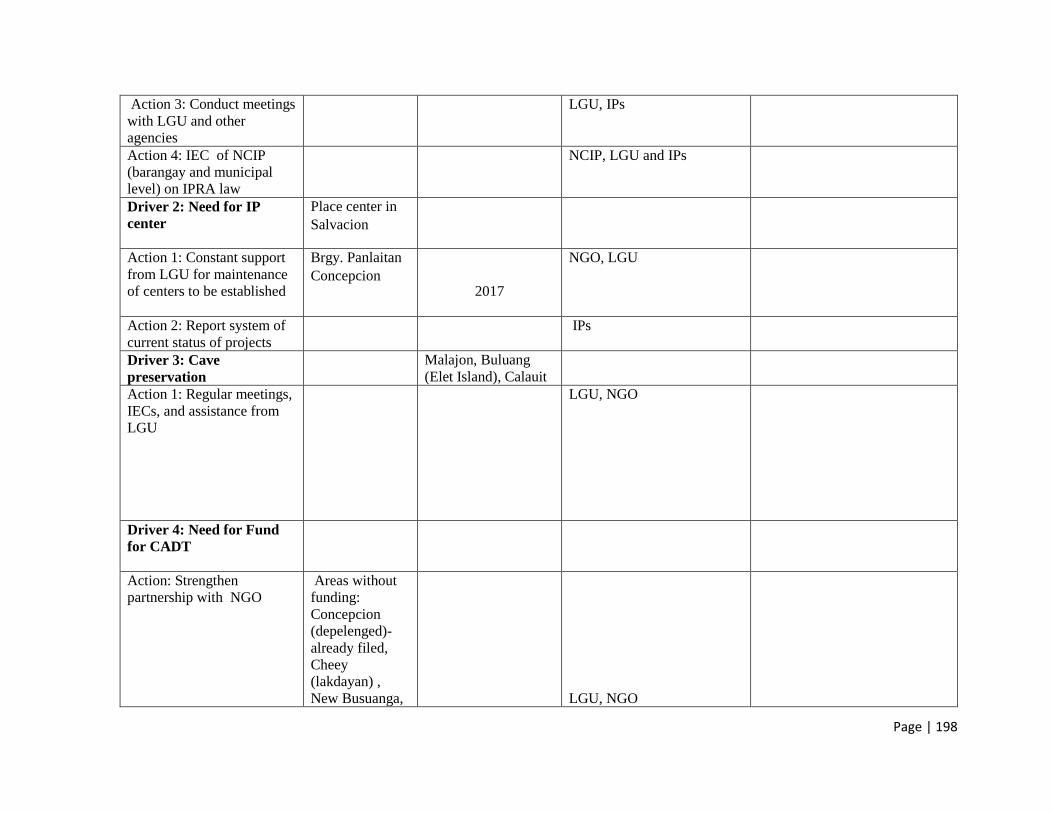
Page | 198
Action 3: Conduct meetings
with LGU and other
agencies
LGU, IPs
Action 4: IEC of NCIP
(barangay and municipal
level) on IPRA law
NCIP, LGU and IPs
Driver 2: Need for IP
center
Place center in
Salvacion
Action 1: Constant support
from LGU for maintenance
of centers to be established
Brgy. Panlaitan
Concepcion
2017
NGO, LGU
Action 2: Report system of
current status of projects
IPs
Driver 3: Cave
preservation
Malajon, Buluang
(Elet Island), Calauit
Action 1: Regular meetings,
IECs, and assistance from
LGU
LGU, NGO
Driver 4: Need for Fund
for CADT
Action: Strengthen
partnership with NGO
Areas without
funding:
Concepcion
(depelenged)-
already filed,
Cheey
(lakdayan) ,
New Busuanga,
LGU, NGO
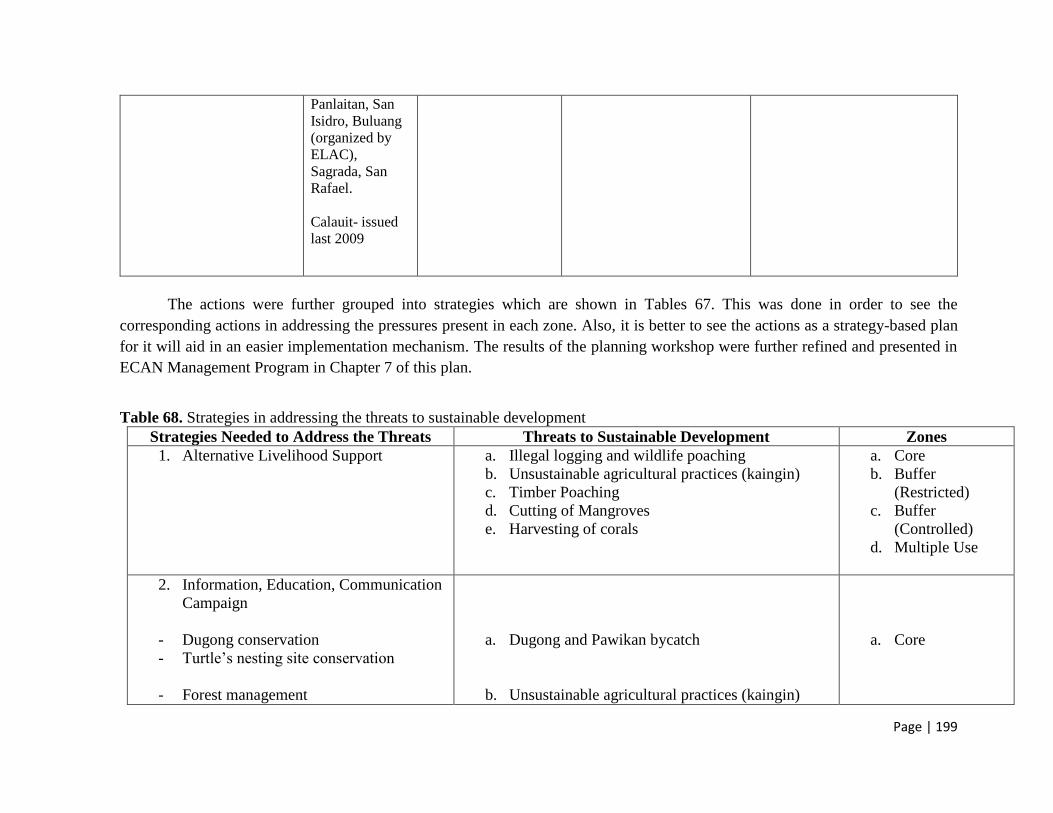
Page | 199
The actions were further grouped into strategies which are shown in Tables 67. This was done in order to see the
corresponding actions in addressing the pressures present in each zone. Also, it is better to see the actions as a strategy-based plan
for it will aid in an easier implementation mechanism. The results of the planning workshop were further refined and presented in
ECAN Management Program in Chapter 7 of this plan.
Table 68. Strategies in addressing the threats to sustainable development
Strategies Needed to Address the Threats Threats to Sustainable Development Zones
1. Alternative Livelihood Support
a. Illegal logging and wildlife poaching
b. Unsustainable agricultural practices (kaingin)
c. Timber Poaching
d. Cutting of Mangroves
e. Harvesting of corals
a. Core
b. Buffer
(Restricted)
c. Buffer
(Controlled)
d. Multiple Use
2. Information, Education, Communication
Campaign
- Dugong conservation
- Turtle’s nesting site conservation
- Forest management
a. Dugong and Pawikan bycatch
b. Unsustainable agricultural practices (kaingin)
a. Core
Panlaitan, San
Isidro, Buluang
(organized by
ELAC),
Sagrada, San
Rafael.
Calauit- issued
last 2009

Page | 200
Strategies Needed to Address the Threats Threats to Sustainable Development Zones
- Protection of wildlife
-
- Campaigns on trade of live fish
- Cave Preservation
- NCIP (barangay and municipal level) on
IPRA law
c. Illegal Fishing
d. Damaging of Caves
b. Buffer
(Restricted)
c. Buffer
(Controlled)
d. Buffer
(Traditional)
e. Tribal
3. Establishment of Organizations/Capacity
Building
a. Bantay-gubat per barangay
b. Create MENRO
c. Law enforcement team
d. Establishment of PCSD office or PCSD
representative based in Busuanga
e. Training for enforcement
f. Active involvement of local fishers
organization
g. Bantay-Dagat
a. Illegal logging and wildlife poaching (upland)
b. Wildlife Poaching
c. Illegal Fishing
d. Need for Fund for CADT
e. Absence Of Secondary Health Care Facilities
(Hospital, to cater to municipality and visiting
tourists)
a. Core
b. Buffer
(Restricted)
c. Buffer
(Controlled)
d. Buffer
(Traditional)
e. Tribal
f. Multiple Use

Page | 201
Strategies Needed to Address the Threats Threats to Sustainable Development Zones
h. Strengthen partnership with NGO
i. Creation of plantilla positions for
additional health personnel for primary
and secondary health care facilities
(MHO and hospital)
4. Strengthen implementation of laws
a. PD 705 with the establishment of
incentive and reward system
b. Wildlife Resources and Conservation
and Protection Act, RA 9147
c. RA 10654
d. Laws on Quarrying
a. Unsustainable agricultural practices (kaingin)
b. Cutting of Mangroves
c. Wildlife Poaching
d. Harvesting of corals
e. Illegal Fishing
f. Rampant Gravel and Sand Extraction
a. Core
b. Buffer
(Restricted)
c. Buffer
(Controlled)
d. Buffer
(Traditional)
e. Multiple Use
5. Preservation and Conservation
a. Reforestation
b. Establishment of Forest Protected Area
(FPA) in ECAN Map
c. Dugong Protected Management Zones
Using Rapid Assessment Score Cards
a. Illegal logging and wildlife poaching (upland)
b. Dugong and Pawikan bycatch
c. Wildlife Poaching
a. Core
b. Buffer
(Restricted)

Page | 202
Strategies Needed to Address the Threats Threats to Sustainable Development Zones
d. Establishment or Rescue Center
e. Designate more people to work for the
protection of MPAs
f. Formulation of tree festival together with
reforestation programs and activities
g. Increase budget for programs concerned
with the protection and conservation of
forest
h. Continue NGO initiatives
d. Illegal Fishing
e. Timber Poaching and Kaingin Farming
c. Buffer
(Controlled)
d. Buffer
(Traditional)
6. Monitoring and Surveillance
a. Establishment of PCSD office or PCSD
representative based in Busuanga
b. Areas for gravel and sand extraction
c. Report system of current status of
projects
d. Continue NGO initiatives
a. Harvesting of corals
b. Rampant Gravel and Sand Extraction
c. Need for IP center
a. Core
b. Multiple
c. Tribal
7. Proper Communication
a. Between LGU and private companies
b. Regular follow up of PRMB personnel
for the gravel and sand area where gravel
sand extraction happens
c. Conduct meetings with LGU and other
agencies
a. Mountain Quarry without permit
b. Rampant Gravel and Sand Extraction
c. No clear boundaries
(Land ownership)
a. Buffer(Controlle
d)
b. Multiple Use
c. Tribal

Page | 203
Strategies Needed to Address the Threats Threats to Sustainable Development Zones
d. Constant support from LGU for
maintenance of centers
d. Need for IP center
Reviewing and Updating of Plans and
Requirements for Permits
e. Fees, charges, and requirements for
quarry
f. Land use plan of LGU (CLUP) by
including all plans like ADSDPP
Mountain Quarry without permit
No clear boundaries
(Land ownership)
Buffer (Controlled) ,
Tribal
8. Prioritization and Request for
Sustainable Funding
a. Provide funds for research
b. Coordinate and request - agricultural
institutions to conduct and provide
funding for agricultural researches in
traditional zones
a. Increase interest in agricultural research
a. Buffer
(Traditional)
9. Infrastructure Development
a. Repair damaged irrigation canals and
construct new irrigation facilities for
irrigable upland areas
b. Tap other sources of water in order to
improve capacities of irrigation facilities
c. Immediate construction of multi-storey
building within the municipal complex
to serve as hospital with integrated
Municipal Health Office, complete with
equipment, medicine supplies
a. Lack of Irrigation System
b.
c. Absence Of Secondary Health Care Facilities
(Hospital, to cater to municipality and visiting
tourists)
a. Buffer
(Traditional)
b. Multiple Use
c. Multiple Use
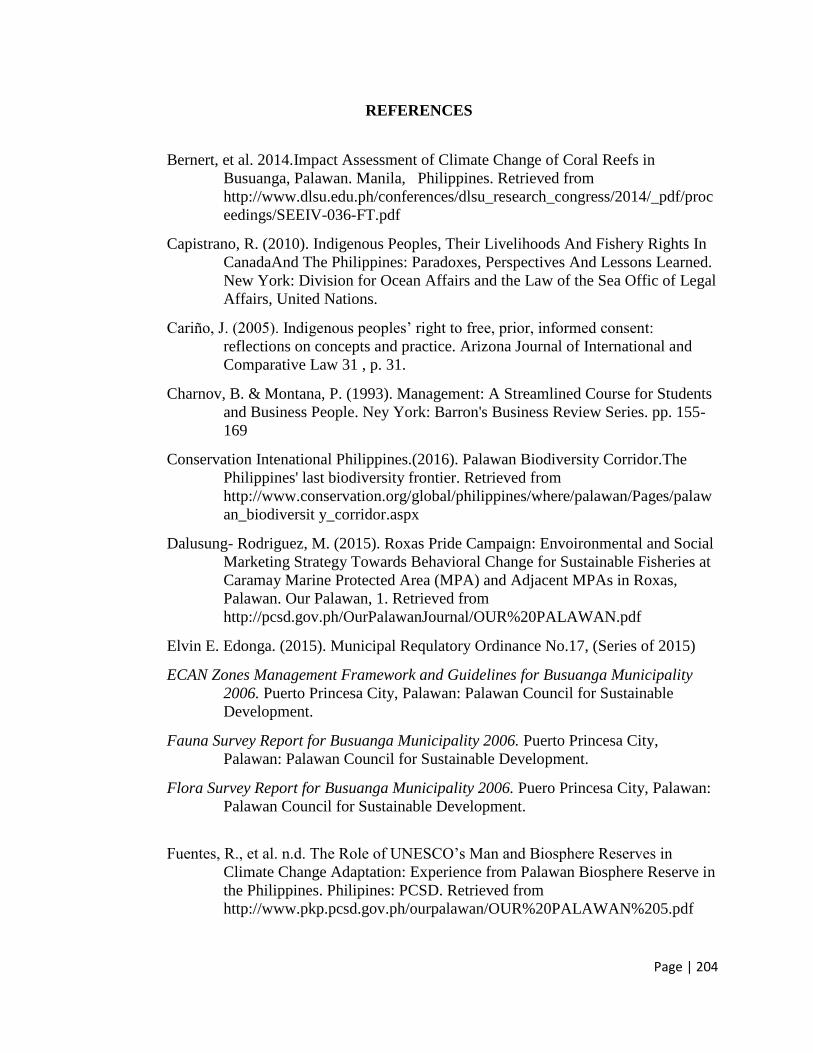
Page | 204
REFERENCES
Bernert, et al. 2014.Impact Assessment of Climate Change of Coral Reefs in
Busuanga, Palawan. Manila, Philippines. Retrieved from
http://www.dlsu.edu.ph/conferences/dlsu_research_congress/2014/_pdf/proc
eedings/SEEIV-036-FT.pdf
Capistrano, R. (2010). Indigenous Peoples, Their Livelihoods And Fishery Rights In
CanadaAnd The Philippines: Paradoxes, Perspectives And Lessons Learned.
New York: Division for Ocean Affairs and the Law of the Sea Offic of Legal
Affairs, United Nations.
Cariño, J. (2005). Indigenous peoples’ right to free, prior, informed consent:
reflections on concepts and practice. Arizona Journal of International and
Comparative Law 31 , p. 31.
Charnov, B. & Montana, P. (1993). Management: A Streamlined Course for Students
and Business People. Ney York: Barron's Business Review Series. pp. 155-
169
Conservation Intenational Philippines.(2016). Palawan Biodiversity Corridor.The
Philippines' last biodiversity frontier. Retrieved from
http://www.conservation.org/global/philippines/where/palawan/Pages/palaw
an_biodiversit y_corridor.aspx
Dalusung- Rodriguez, M. (2015). Roxas Pride Campaign: Envoironmental and Social
Marketing Strategy Towards Behavioral Change for Sustainable Fisheries at
Caramay Marine Protected Area (MPA) and Adjacent MPAs in Roxas,
Palawan. Our Palawan, 1. Retrieved from
http://pcsd.gov.ph/OurPalawanJournal/OUR%20PALAWAN.pdf
Elvin E. Edonga. (2015). Municipal Requlatory Ordinance No.17, (Series of 2015)
ECAN Zones Management Framework and Guidelines for Busuanga Municipality
2006. Puerto Princesa City, Palawan: Palawan Council for Sustainable
Development.
Fauna Survey Report for Busuanga Municipality 2006. Puerto Princesa City,
Palawan: Palawan Council for Sustainable Development.
Flora Survey Report for Busuanga Municipality 2006. Puero Princesa City, Palawan:
Palawan Council for Sustainable Development.
Fuentes, R., et al. n.d. The Role of UNESCO’s Man and Biosphere Reserves in
Climate Change Adaptation: Experience from Palawan Biosphere Reserve in
the Philippines. Philipines: PCSD. Retrieved from
http://www.pkp.pcsd.gov.ph/ourpalawan/OUR%20PALAWAN%205.pdf

Page | 205
Municipal Accountant Office.(n.d.).Consolidated Quarterly Report on Government
Projects, Programs or Activities for the 4th Quarter, CY 2015. Busuanga,
Palawan.
Municipal Accountant Office.(n.d.). Report of SEF Utilization For the Quarter Ended
December 31, 2015. Busuanga, Palawan
Municipal Accountant Office.(n.d.).Report on Utilization of Disaster Risk Reduction
and Management Fund As of the Quarter Ended December 31, 2015.
Busuanga, Palawan.
Municipal Budget Office.(n.d.).Statement of Financial Performance- GF For the
Year Ended December 31, 2015. Busuanga, Palawan.
Municipal Planning Development Office.(n.d.).Local Development Investment Plan
CY 2015-2020. Busuanga, Palawan
Municipal Planning Development Office.(2015). Local Poverty Reduction Action
Plan for FY 2015.Busuanga, Palawan
Municipal Planning Development Office.(n.d.). 20% Development Fund Utilization
Report As of Deember 31, 2015 4th Quarter 2015
Office of the Sangguniang Bayan.(2013). Busuanga Tourism Code of 2013.
Office of the Secretary to the Sanggunian.(n.d.).Resolution/ Ordinances enacted/
passed by the Sangguniang Bayan 2013 (January to December 2013).
Busuanga, Palawan
Office of the Secretary to the Sanggunian.(n.d.).Resolution/ Ordinances enacted/
passed by the Sangguniang Bayan 2014 (January to December 2014).
Busuanga, Palawan
Office of the Secretary to the Sanggunian.(n.d.).Resolution/ Ordinances enacted/
passed by the Sangguniang Bayan 2015 (January to December 2015).
Busuanga, Palawan
Lopez, D and Poonian C. 2016. Small-Scale Mariculture: A Potentially Significant
Threat to Dugongs (Dugong dugon) Through Incidental Entanglement.
Palawan, Philippines. Retrieved from
http://www.aquaticmammalsjournal.org/attachments/article/1407/AM%2042
.1%20Poonia n_Lopez%20et%20al.pdf
Municipality of Busuanga, Palawan (2014). Community Based Monitoring System.
Municipality of Busuanga, Palawan (2014).Socio-Economic Profile.
Municipality of Busuanga, Palawan (2014).Municipal Profile.
Municipal Health Office, Municipality of Busuanga Palawan (2014). Field Health
Service Iformation System.
Busuanga Municipal Police Station, Busuanga, Palawan.
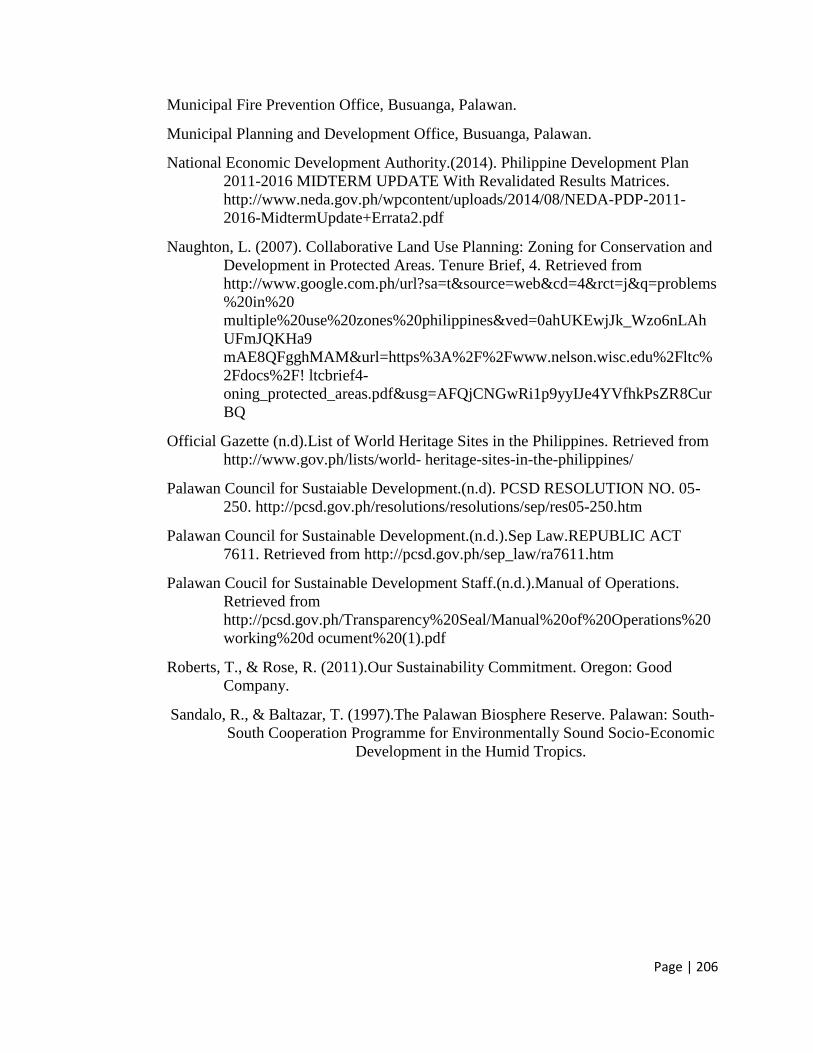
Page | 206
Municipal Fire Prevention Office, Busuanga, Palawan.
Municipal Planning and Development Office, Busuanga, Palawan.
National Economic Development Authority.(2014). Philippine Development Plan
2011-2016 MIDTERM UPDATE With Revalidated Results Matrices.
http://www.neda.gov.ph/wpcontent/uploads/2014/08/NEDA-PDP-2011-
2016-MidtermUpdate+Errata2.pdf
Naughton, L. (2007). Collaborative Land Use Planning: Zoning for Conservation and
Development in Protected Areas. Tenure Brief, 4. Retrieved from
http://www.google.com.ph/url?sa=t&source=web&cd=4&rct=j&q=problems
%20in%20
multiple%20use%20zones%20philippines&ved=0ahUKEwjJk_Wzo6nLAh
UFmJQKHa9
mAE8QFgghMAM&url=https%3A%2F%2Fwww.nelson.wisc.edu%2Fltc%
2Fdocs%2F! ltcbrief4-
oning_protected_areas.pdf&usg=AFQjCNGwRi1p9yyIJe4YVfhkPsZR8Cur
BQ
Official Gazette (n.d).List of World Heritage Sites in the Philippines. Retrieved from
http://www.gov.ph/lists/world- heritage-sites-in-the-philippines/
Palawan Council for Sustaiable Development.(n.d). PCSD RESOLUTION NO. 05-
250. http://pcsd.gov.ph/resolutions/resolutions/sep/res05-250.htm
Palawan Council for Sustainable Development.(n.d.).Sep Law.REPUBLIC ACT
7611. Retrieved from http://pcsd.gov.ph/sep_law/ra7611.htm
Palawan Coucil for Sustainable Development Staff.(n.d.).Manual of Operations.
Retrieved from
http://pcsd.gov.ph/Transparency%20Seal/Manual%20of%20Operations%20
working%20d ocument%20(1).pdf
Roberts, T., & Rose, R. (2011).Our Sustainability Commitment. Oregon: Good
Company.
Sandalo, R., & Baltazar, T. (1997).The Palawan Biosphere Reserve. Palawan: South-
South Cooperation Programme for Environmentally Sound Socio-Economic
Development in the Humid Tropics.