Embed Size (px)
Citation preview
Municipal Water Supply and Sewage Treatment:
Costs, Prices and Distortions
Steven Renzetti1, Department of Economics, Brock University St. Catharines, Ontario, CANADA, L2S 3A1
phone: (905) 688-5550, extn 3121, FAX: (905) 688-6388 e-mail: [email protected]
Municipal Water Supply and Sewage Treatment: Costs, Prices and Distortions
ABSTRACT Municipal water supply and sewage treatment utilities in Ontario, Canada, are studied in order
to establish their costs of supply and evaluate their pricing practices. Prices charged to
residential and commercial customers are found to be only a third and a sixth of the estimated
marginal cost for water supply and sewage treatment, respectively. For example, the average
price to residential customers is $0.32/m3 while the estimated marginal cost is $0.87/m3 . The
estimated cost parameters are combined with estimated residential and non-residential demands
functions in order to calculate approximate welfare losses that arise from over consumption.
JEL classification code: Q25, L32
1
1. INTRODUCTION
There is a growing concern for the operations of the municipal agencies responsible for
supplying potable water and treating sewage (Spulber and Sabbaghi, 1994; Tate and Lacelle,
1995; Burrill, 1997; World Bank, 1997; Parker and Tsur, 1997). This trend has been spurred by
a variety of factors: the difficulties of maintaining ageing capital stocks in times of tightening
fiscal constraints, the water pollution generated by these agencies, and recognition of the role
played by utilities in allocating scarce water resources. A recent report provides the following
assessment:
Canada's water and wastewater system is under pressure: the infrastructure...is severely deteriorating, primarily due to shortages of public funding. If the decline continues, the health of the country's water resources will suffer. At the same time, due to subsidized and below-cost pricing for water and wastewater services, innovative environmental technologies that conserve water resources are failing to find a market. (National Round Table on the Environment and the Economy, 1996, p. 3)
This paper examines the operations of municipal water supply and sewage treatment
facilities. While these two types of agencies are often administratively separate in municipal
governments, they are considered together here in order to examine the consequences of their
combined activities. This paper characterizes their respective production technologies, estimates
their marginal costs of supply, examines their pricing policies and computes the approximate
welfare losses arising from the instances when their prices diverge from marginal costs. This
work is based on a cross-sectional sample of municipal water supply and sewage treatment
facilities operating in Ontario, Canada, during 1991.
While a number of authors have been critical of the pricing practices of water supply and
sewage treatment facilities (Hirshleifer, DeHaven and Milliman, 1966; Pearse, Bertrand and
2
MacLaren, 1985; Tate, 1989; Postel, 1993, Winpenny, 1994; National Round Table on the
Environment and the Economy, 1996), few have quantified the magnitude of the deviations
between actual and optimal consumption levels or the welfare losses associated with these
deviations. Renzetti (1992), for example, measures the approximate welfare gain from reforming
prices for a single water utility and does not consider sewage treatment costs. The omission of
sewage treatment costs is important because the consumption of potable water and of sewage
treatment services are likely to be complements. As a result, even if the provision of potable
water were priced efficiently, underpricing sewage treatment services would induce
overconsumption of both sewage treatment and potable water.
The remainder of the paper is organized in the following fashion: section 2 presents
information regarding the operations of municipal water utilities and past economic research.
Section 3 reports the estimation of the cost functions for water supply and sewage treatment. It
also reports on the estimation of residential and non-residential water demand equations and the
aggregate demand for sewage treatment. Section 4 combines the results of the previous section
with information on water supply and sewage treatment pricing in order to generate estimates of
deviations of observed consumption levels from those predicted under marginal cost pricing and
the welfare losses associated with these deviations. Section 5 concludes the paper by
considering the reasons for these findings and their implications for government policy.
2. BACKGROUND
3
2.1. Institutions
Municipal water utilities2 withdraw water for two basic purposes. First, potable water is
provided for final use by the utility's residential, commercial and institutional customers.
Second, water provides a critical input to various public functions. The first purpose accounts
for the bulk of water supplied, while the second, notably firefighting needs, has a significant
influence on the design of water supply networks (and particularly on the pressure levels at
which water is supplied). Municipal sewage treatment plants collect water from users (and
rainwater in integrated systems) and treat it to some degree before returning it to the natural
environment.
Each province is responsible for regulating the pricing behaviour of municipal water
utilities under its jurisdiction. However, historically, scant regulatory attention has been paid to
the setting of water prices (Pearse, Bertrand and MacLaren, 1985). In most provinces,
municipalities inform the provincial government of intended changes to water rates but are not
required to go through any kind of approval process (MacLaren, 1985; Percy, 1988). In contrast,
most provinces retain and regularly exercise the authority to review and approve new issues of
debentures by water utilities. The implication of this lack of regulatory control is that water
utilities' accounting and price setting practices have come to vary significantly within and across
provinces.
Another important feature of waterworks and sewage treatment facilities has been the
level of subsidies and grants provided by all levels of government. While transfers from senior
and municipal levels of government have fallen, revenues collected directly from users still
account for only a portion of utilities' total costs. In a recent report which examines water utility
4
finances across Canada, it is estimated that the average contribution of user charges to operating
and capital costs is only 37% and 66%, respectively (National Round Table on the Environment
and the Economy, 1996). Interestingly, a review of urban water supply systems in both
developed and developing countries also found that charges to consumers typically cover only
an average of 35% of the total cost of supply (Easter et. al, 1993).
Tate and Lacelle (1995) reports on a 1991 national survey of the pricing behaviour of
municipal water supply and sewage treatment utilities. With respect to water supply, flat rates
for residential customers (which involve a connection fee but no marginal price for water
supply) are used by half of the municipalities in Canada. The use of flat rates is most common,
however, in small cities and towns; only 25% of cities with population in excess of 100,000 use
flat rates. Constant use charges (i.e. a connection fee in combination with a constant marginal
price) and declining block rate pricing structure are more common for non-residential customers
(approximately 65% of municipalities have one of these types of price structures). With respect
to charges for sewage treatment, rates are most commonly either flat (in the case where water
supply rates are flat) or defined as a constant percentage of the water supply volumetric rate
(although the percentage varies across municipalities). In a very small minority of municipalities
(26 of the approximately 960 municipalities which responded to the survey), non-residential
sewage rates are based, in part, on the chemical composition of a firm's sewage.
2.2. Past Research
One part of the water supply literature characterizes the technology of water supply and
obtains estimates of scale economies (Hayes, 1987; Kim, 1987; Boisvert and Schmit, 1997).
Most of these studies find that water utilities enjoy economies of scale or scope3 over a fairly
5
wide range of output. Kim (1987), for example, estimates a translog cost function using a cross-
sectional data set of sixty American water utilities and finds that scale economies are prevalent
but that they decline with the size of the utility.
A smaller number of studies addresses the issue of sewage treatment costs. Hanke and
Wentworth (1981) employ engineering data on construction and operating costs of
representative sewage treatment facilities. The authors regress total cost on output and output
squared and find support for the presence of scale economies. Fraas and Munley (1984) estimate
separate Cobb-Douglas regressions for capital and operating costs using data from a sample of
American sewage treatment facilities. Fraas and Munley find that increases in both flow rates
and the concentration of sewage raise costs and that the marginal cost of pollution removal
increases at an increasing rate with the percentage of pollutant removed. Neither of these studies
includes input prices as explanatory variables in their cost functions.
There are a large number of residential water demand studies. Early studies used single
equation models, aggregate data and average cost as a proxy for water's price and found
residential water demands to be price and income inelastic (see OECD, 1987 for a survey of this
literature). Since then, a number of advances have been made. These include more sophisticated
price specifications (Terza and Welch, 1982; Jones and Morris, 1984), the use of microdata sets
(Hanke and de Maré, 1982), the inclusion of other prices (such as the price of electricity) as
explanatory variables (Hansen, 1996). Residential water demands continue to display relatively
small price and income elasticities.
A smaller number of studies examine the commercial and industrial demand for water.
Early studies such as Turnovsky (1969) estimate single-equation demand models using data
6
from individual industries or municipalities. Subsequent studies extend the analysis by
estimating translog cost functions for the American manufacturing sector. Grebenstein and Field
(1979) and Babin, Willis and Allen (1982) use state-level cross-sectional observations and
include water as a productive input along with capital, labour, energy and materials. In these two
studies, water's price elasticity ranges from 0.0 to -0.801, depending on the industry. Renzetti
(1992) examines industrial water demands by considering four separate facets of water use:
intake, treatment prior to use, recirculation, and discharge. The data set consists of plant-level
observations on water use and expenditures by Canadian manufacturing firms. Intake water's
price elasticity ranges from -0.15 to -0.59.
A limited number of studies consider the demand for sewage treatment. Strudler and
Strand (1983) examine the relationship between the price of sewage treatment and the
residential demand for sewage treatment and estimate the average price elasticity of demand to
be -0.07.
Finally, a small number of studies assess the efficiency properties of municipal water
supply and sewage treatment pricing rules. Crew and Kleindorfer (1986) and Swallow and
Marin (1988) simulate the welfare gains of reforming water prices using hypothetical case
studies. Renzetti (1992) estimates the welfare gains from reforming water prices for the Greater
Vancouver Water District and estimates potential improvements to aggregate surplus to be
approximately 4%.
Recently, several papers in Hall (1996) explore the challenges associated with designing
and implementing marginal cost pricing for water utilities. Dinar and Subramanian (1997)
survey pricing practices in 22 countries. While the authors in this World Bank report are united
7
in their call for water pricing reform, none of the 22 country case studies provides an estimate of
the deviation between the marginal cost of urban water supply or sewage treatment and their
respective prices.
3. ESTIMATION MODELS
3.1. Cost and Demand Models
The estimation of the costs of water supply and sewage treatment is done separately as
the utilities are administratively, physically and technologically distinct. In both cases, the
estimation is based on the assumption that municipal utilities seek to minimize the costs of
supplying exogenously determined quantities of output. In their choices regarding input use,
water supply and sewage treatment utilities are constrained by exogenously determined market
prices, their production technologies and the characteristics of their operating environments.
These assumptions imply that the two technologies may be represented by their respective cost
functions:
Where the subscript w denotes water supply and s denotes sewage treatment. For both
water supply and sewage treatment, cost is measured as the sum of annual expenditures on
labour, energy and capital. All of the utilities in the sample are self-supplied and do not purchase
their water from a wholesaler. Under Ontario law, self-supplied utilities do not pay a fee for
) Z,...Z ,D ,Q ,p,...p ( C = C ; ) D ,Q ,Q ,p,...p ( C = C F1sN1ssNRRN1ww (1)
8
their raw water supply (Percy, 1988).
It is assumed that the price vector in both cost functions has the same three elements:
labour (PL), energy (PE) and capital (PK). In the case of water supply, output is a vector of
residential output (QR) and non-residential output (QNR). The non-residential customer class is
composed of commercial, industrial and institutional customers. Sewage treatment output (QS)
is a scalar measure of total recorded annual flow-through. In the case of sewage treatment, Z is a
vector composed of a set of dummy variables indicating the type of treatment process employed.
Finally, the variable D measures the population density of the municipality.
The data are cross sectional observations of Ontario municipal utilities operating in
1991. These observations are compiled from several sources including national surveys of water
utility operations and water utility pricing and municipal financial records that are reported to
the provincial government. The result is that there are 77 observations for water supply utilities
and sewage treatment facilities. The sample is representative of the province in terms of the
distribution of utility size although the sample is skewed slightly towards larger utilities (the
average annual output for utilities in the sample is 8.1 million cubic metres while the provincial
average is 6.9 million cubic metres). The details regarding the construction of the regression
variables are an Appendix.
The structure of each cost function is approximated by a translog functional form. In
addition, the water supply and sewage treatment cost functions are estimated separately. Each
cost function and N-1 of its share equations are estimated using an iterative, SUR procedure
with linear homogeneity in prices and symmetry imposed.
The second step in the estimation involves characterizing the demand for the services of
9
water supply and sewage treatment facilities. Annual aggregate residential water use in each
municipality is assumed to be a function of the following variables: price of water for residential
customers (PRW), price of sewage treatment for residential customers (PRS), price of electricity
for residential customers (PRE)4, average household income (I), number of households (NH) and
a vector of weather-related variables (V),
Annual aggregate non-residential water use in each municipality is assumed to be a
function of the following variables: price of water for commercial customers (PNRW), price of
sewage treatment for commercial customers (PNRS), price of electricity for commercial
customers (PNRE), value of the manufacturing sector's output (VAL) and number of
manufacturing firms (NF).
A single aggregate demand equation is estimated for sewage treatment services as these
utilities do not record residential and non-residential flows separately. Aggregate demand for
sewage treatment (QS) is assumed to be a function of the price of sewage treatment (PS), the
price of water supply (Pw), the price of electricity (PE), the average level of household incomes
(I), the number of households (NH), the number of firms (NF) and the vector of climate-related
(V) used in estimating the residential demand for water supply. For each of the three prices in
V) NH, I, ,P ,P ,P(D = Q RERSRWRR (2)
),, VALNFP ,P ,P(D = Q NRENRSNRWNRNR (3)
10
the sewage treatment demand equation, a weighted average of residential and non-residential
prices is created using recorded water supply quantities as weights. Thus, the general form of
the demand for sewage treatment equation is the following:
There are 77 observations used to estimate the three demand equations. The residential
and non-residential water demand equations and the aggregate sewage treatment demand
equation are estimated separately using OLS with all the variables expressed in natural logs. In
addition, homogeneity of degree zero in prices is imposed on the estimation coefficients and
White's correction for heteroscedastic errors is employed.
3.2. Estimation Results
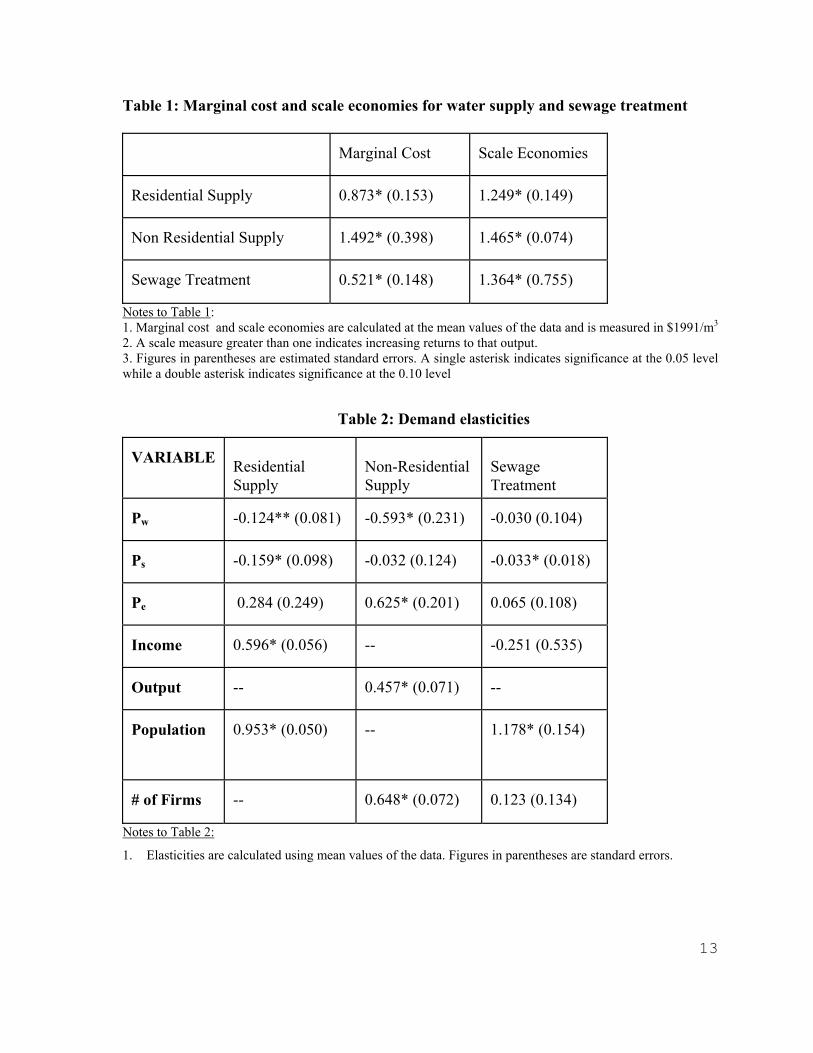
Table 1 lists the average estimated marginal costs for water supply to residential and
non-residential customers and for sewage treatment 5. It also lists the average values for scale
elasticities calculated at the mean of the respective data sets. In the case of water supply, the
product-specific scale economy measures are calculated following Kim (1987).
The estimated marginal cost (MC) reported in Table 1 is higher than the estimates
reported by other researchers. Renzetti (1992), in a case study of the Vancouver waterworks,
records MC that range from $0.53/m3 to $0.85/m3. In addition, the estimates presented here are
greater than those reported in Kim (1987) and Russell and Shin (1997) where LRMC estimates
based on U.S. data range from $0.30/m3 to $0.56/m3 (when converted to 1991 Canadian
)V NF, NH, I, ,P ,P ,P(D = Q EWSSS (4)
11
dollars). The reasons for this divergence may be the effects on construction and operating costs
of the lower average temperatures and greater temperature variability, higher labour and interest
costs and the lower population densities of Ontario municipalities compared to U.S. cities.
Table 1 also indicates that there are scale economies in the technology of water supply
and sewage treatment. This finding corresponds to similar results by other researchers. As
indicated in the previous section, for example, Kim (1987) finds that scale economies are
prevalent but that they decline with the size of the utility.
While not shown in Table 1, the cost function coefficients also provide estimates of the
elasticity of cost with respect to density. At the mean of the data set, this parameter has an
estimated value for water supply and sewage treatment, respectively, of -0.061 (0.091) and
0.056 (0.170), where standard errors are in parentheses. Water supply's elasticity of cost with
respect to density has the negative sign found in other studies (Teeples and Glyer, 1987).
However, neither estimated parameter is statistically significant, indicating that population
density is not an important factor in explaining the variation in production costs in this sample.
Table 2 reports the average values for the price and income\output elasticities. In all
three cases, increases in water supply and sewage prices result in reduced water use. With the
exception on non-residential water demands, the elasticities are all quite small. As was
suggested in the introduction, consumption of potable water and sewage treatment services are
found to be complements. The elasticity associated with the price of electricity, while positive,
is only significant in the case of non-residential demands. This may reflect substitution
possibilities involved in industrial water use (for example, use of water as a cooling agent
instead of refrigeration). This may also indicate that electricity prices are not an important
12
determinant of residential demand for potable water and sewage treatment.
The elasticities that measure the scale of economic activity (income and population for
residential demands and value of output and number of firms for non-residential demands)
indicate that increases in the level of economic activity increase the demand for both water
supply and sewage treatment. The exception is the income elasticity of sewage demand which,
while negative, is not significant.
4. EVALUATION OF PRICING POLICIES
Water supply and sewage treatment utilities are commonly criticised for their inefficient
pricing practices. Yet, there are few instances in the literature which document divergences
between prices and marginal costs of supply. The approach adopted here is to combine the
estimated cost and demand equations with data on water supply and sewage treatment utilities'
prices to determine the extent to which current consumption levels deviate from those that
would be predicted under efficient (i.e., marginal cost) pricing and to measure the approximate
welfare losses associated with these deviations.
The deviation and deadweight loss calculations are done separately for both categories of
water supply and sewage treatment and for each municipality. The difference between the
predicted consumption levels (Q0) at the observed prices and the efficient level of consumption
(Q*) at marginal cost prices is first determined. Q0 is calculated by substituting the actual water
supply and sewage treatment prices (as well as municipality-specific values of the other
explanatory variables) into the estimated demand equations. The value of Q* is calculated by
solving for the intersection of the estimated marginal cost and demand equation.
13
Table 1: Marginal cost and scale economies for water supply and sewage treatment
Marginal Cost
Scale Economies
Residential Supply
0.873* (0.153)
1.249* (0.149)
Non Residential Supply
1.492* (0.398)
1.465* (0.074)
Sewage Treatment
0.521* (0.148)
1.364* (0.755)
Notes to Table 1: 1. Marginal cost and scale economies are calculated at the mean values of the data and is measured in $1991/m3 2. A scale measure greater than one indicates increasing returns to that output. 3. Figures in parentheses are estimated standard errors. A single asterisk indicates significance at the 0.05 level while a double asterisk indicates significance at the 0.10 level
Table 2: Demand elasticities VARIABLE
Residential Supply
Non-Residential Supply
Sewage Treatment
Pw
-0.124** (0.081)
-0.593* (0.231)
-0.030 (0.104)
Ps
-0.159* (0.098)
-0.032 (0.124)
-0.033* (0.018)
Pe
0.284 (0.249)
0.625* (0.201)
0.065 (0.108)
Income
0.596* (0.056)
--
-0.251 (0.535)
Output
--
0.457* (0.071)
--
Population
0.953* (0.050)
--
1.178* (0.154)
# of Firms
--
0.648* (0.072)
0.123 (0.134)
Notes to Table 2:
1. Elasticities are calculated using mean values of the data. Figures in parentheses are standard errors.
14
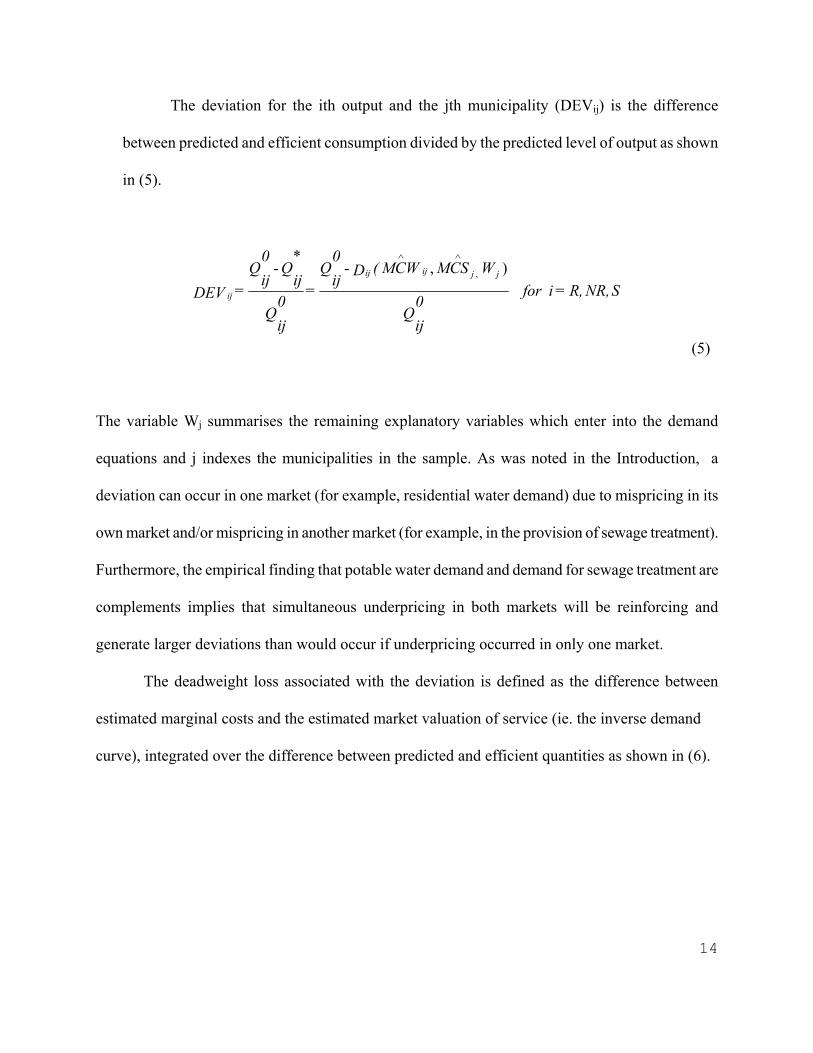
The deviation for the ith output and the jth municipality (DEVij) is the difference
between predicted and efficient consumption divided by the predicted level of output as shown
in (5).
The variable Wj summarises the remaining explanatory variables which enter into the demand
equations and j indexes the municipalities in the sample. As was noted in the Introduction, a
deviation can occur in one market (for example, residential water demand) due to mispricing in its
own market and/or mispricing in another market (for example, in the provision of sewage treatment).
Furthermore, the empirical finding that potable water demand and demand for sewage treatment are
complements implies that simultaneous underpricing in both markets will be reinforcing and
generate larger deviations than would occur if underpricing occurred in only one market.
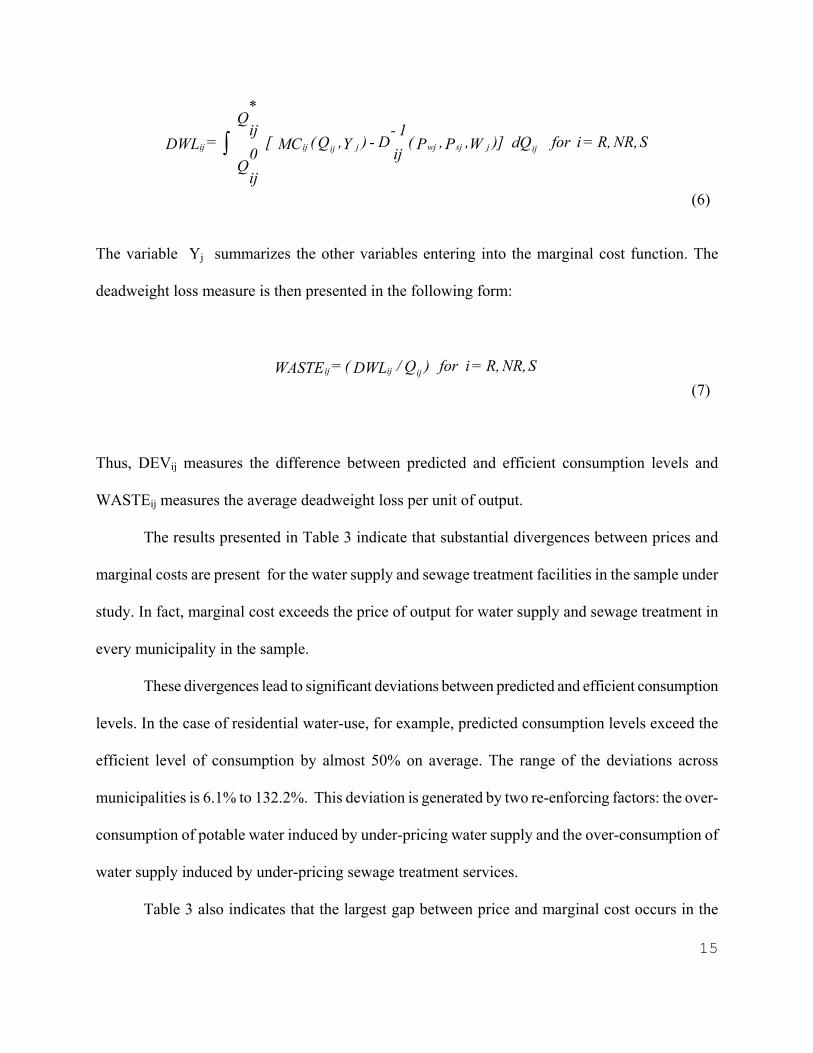
The deadweight loss associated with the deviation is defined as the difference between
estimated marginal costs and the estimated market valuation of service (ie. the inverse demand
curve), integrated over the difference between predicted and efficient quantities as shown in (6).
SNR, R, =i for
ij0
Q
WMCSMCW( D - ij0
Q =
ij0
Q
ij*
Q - ij0
Q = DEV
jjijij
ij
), ,
∧∧
(5)
15
The variable Yj summarizes the other variables entering into the marginal cost function. The
deadweight loss measure is then presented in the following form:
Thus, DEVij measures the difference between predicted and efficient consumption levels and
WASTEij measures the average deadweight loss per unit of output.
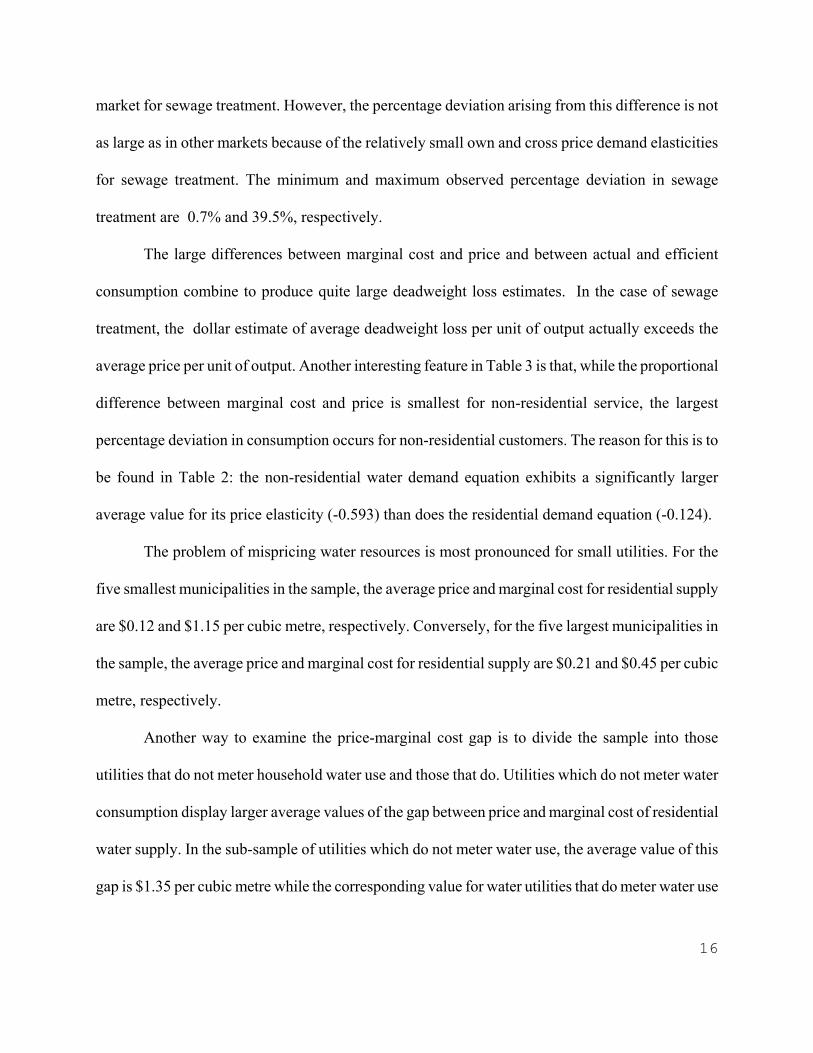
The results presented in Table 3 indicate that substantial divergences between prices and
marginal costs are present for the water supply and sewage treatment facilities in the sample under
study. In fact, marginal cost exceeds the price of output for water supply and sewage treatment in
every municipality in the sample.
These divergences lead to significant deviations between predicted and efficient consumption
levels. In the case of residential water-use, for example, predicted consumption levels exceed the
efficient level of consumption by almost 50% on average. The range of the deviations across
municipalities is 6.1% to 132.2%. This deviation is generated by two re-enforcing factors: the over-
consumption of potable water induced by under-pricing water supply and the over-consumption of
water supply induced by under-pricing sewage treatment services.
Table 3 also indicates that the largest gap between price and marginal cost occurs in the
SNR, R, =i for dQ )]W ,P ,P( ij1-
D - )Y ,Q( MC [
ij0
Q
ij*
Q = DWL ijjsjwjjijijij ∫
(6)
SNR, R, =i for )Q/ DWL( = WASTE ijijij (7)
16
market for sewage treatment. However, the percentage deviation arising from this difference is not
as large as in other markets because of the relatively small own and cross price demand elasticities
for sewage treatment. The minimum and maximum observed percentage deviation in sewage
treatment are 0.7% and 39.5%, respectively.
The large differences between marginal cost and price and between actual and efficient
consumption combine to produce quite large deadweight loss estimates. In the case of sewage
treatment, the dollar estimate of average deadweight loss per unit of output actually exceeds the
average price per unit of output. Another interesting feature in Table 3 is that, while the proportional
difference between marginal cost and price is smallest for non-residential service, the largest
percentage deviation in consumption occurs for non-residential customers. The reason for this is to
be found in Table 2: the non-residential water demand equation exhibits a significantly larger
average value for its price elasticity (-0.593) than does the residential demand equation (-0.124).
The problem of mispricing water resources is most pronounced for small utilities. For the
five smallest municipalities in the sample, the average price and marginal cost for residential supply
are $0.12 and $1.15 per cubic metre, respectively. Conversely, for the five largest municipalities in
the sample, the average price and marginal cost for residential supply are $0.21 and $0.45 per cubic
metre, respectively.
Another way to examine the price-marginal cost gap is to divide the sample into those
utilities that do not meter household water use and those that do. Utilities which do not meter water
consumption display larger average values of the gap between price and marginal cost of residential
water supply. In the sub-sample of utilities which do not meter water use, the average value of this
gap is $1.35 per cubic metre while the corresponding value for water utilities that do meter water use
17
is $0.99 per cubic metre.
A final way to consider the deadweight loss estimates is to ask how the social loss that they
imply is distributed across income groups. Not surprisingly, this is a very difficult question to
answer. Wasny (1986) indicates that expenditures on publicly-supplied water decline as a proportion
of household income as household income rises. Thus, the finding that municipal water supply is
under-priced and is an inferior good would suggest that lower income households benefit more than
do higher income households. This conclusion, however, neglects the fact that someone in Canadian
society must be paying for this under-pricing. In particular, the distribution of the tax burden
associated with the subsidies and grants from other levels of government that under-pricing makes
necessary is not known.
There are a number of reasons why water supply and sewage treatment prices are inefficient.
The most obvious reason is the lack of metering of residential water use. According to the
Environment Canada survey on municipal water pricing practices, approximately half of households
living in the municipalities included in the survey do not have their water consumption metered
(Tate and Lacelle, 1995).
The second reason relates to the rules used to set prices. Many of the Canadian municipalities
that do meter water use follow the pricing rules set out by the American Water Works Association
(AWWA, 1991). The AWWA pricing rules are directed at ensuring that sufficient revenue is
generated to maintain the financial solvency of the utility and are not designed to guarantee the
efficient allocation of water. This is because those prices have relatively little to do with the
economic costs of supplying potable water and treating waste water.
The AWWA methodology computes water prices based on the average annual recorded
18
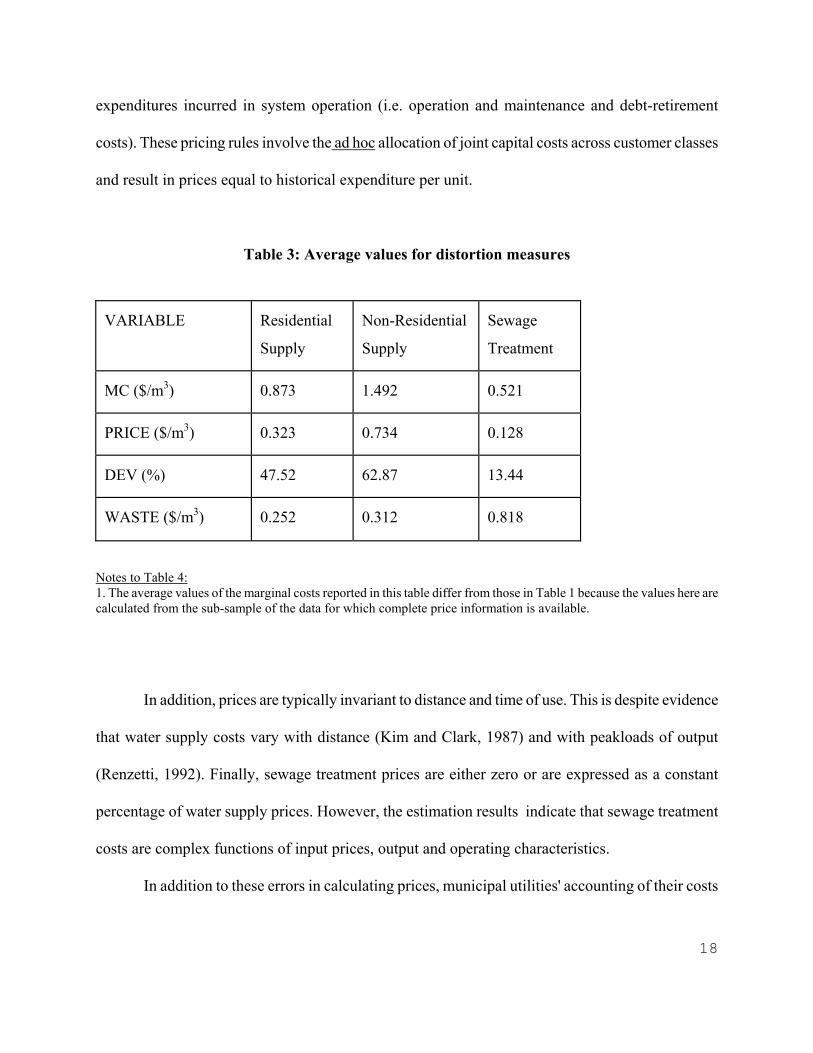
expenditures incurred in system operation (i.e. operation and maintenance and debt-retirement
costs). These pricing rules involve the ad hoc allocation of joint capital costs across customer classes
and result in prices equal to historical expenditure per unit.
Table 3: Average values for distortion measures
VARIABLE
Residential
Supply
Non-Residential
Supply
Sewage
Treatment MC ($/m3)
0.873
1.492
0.521
PRICE ($/m3)
0.323
0.734
0.128
DEV (%)
47.52
62.87
13.44
WASTE ($/m3)
0.252
0.312
0.818
Notes to Table 4: 1. The average values of the marginal costs reported in this table differ from those in Table 1 because the values here are calculated from the sub-sample of the data for which complete price information is available.
In addition, prices are typically invariant to distance and time of use. This is despite evidence
that water supply costs vary with distance (Kim and Clark, 1987) and with peakloads of output
(Renzetti, 1992). Finally, sewage treatment prices are either zero or are expressed as a constant
percentage of water supply prices. However, the estimation results indicate that sewage treatment
costs are complex functions of input prices, output and operating characteristics.
In addition to these errors in calculating prices, municipal utilities' accounting of their costs
19
is incomplete. Grants and subsidies lead to an underestimation of operating and capital costs.
Further, water supply and sewage treatment facilities understate costs in several ways: they do not
incorporate depreciation of the capital stock, they do not assign a value to the raw water input
withdrawn from the natural environment, they fail to impute the opportunity cost of their land
holdings and, finally, they fail to account for the external costs associated with the environmental
damages caused by their effluent.
These observations suggest that the deviation and deadweight loss calculations presented
here are conservative estimates because the marginal cost estimates are based on utilities' incomplete
accounting of the costs of water supply and sewage treatment 6.
5. CONCLUSIONS
Increasing incomes and growing urban populations are putting pressure on municipal water
supply and sewage treatment facilities just as provincial and municipal governments struggle to cope
with rising deficits and increasingly stringent water quality regulations.
This paper characterizes the technology of municipal water supply and sewage treatment
facilities using a cross-section data set of Ontario municipalities and derives estimates of the
marginal cost of water supply (for residential and non-residential customers) and sewage treatment.
It also estimates aggregate residential and non-residential water demand equations. Using these
estimated relationships, it then compares the estimated marginal costs to water supply and sewage
treatment prices and calculates the gap between predicted consumption levels and those that would
be predicted if utilities followed marginal cost pricing. Finally, the paper estimates the welfare costs
of these observed divergences and considers the reasons for these findings.
20
The most important finding is that prices understate the marginal costs of providing these
services by a wide margin. This situation encourages excessive consumption on the part of
households and businesses and over-expansion of water supply and sewage treatment facilities. It
also discourages technological innovation in water conservation and alternative sewage treatment
technologies (Postel, 1993; Gardner, 1997).
It is of little surprise, then, that Canada is the world's largest user of water on a per capita
basis. The perception of plentiful supplies of water has been artificially magnified by understating
the cost of using that resource. This perception, in turn, has become embedded in residential,
commercial and industrial capital stocks and technologies.
Finally, the policy implications of these findings may be considered. The results reported
here indicate that water and sewage prices are inefficient. If water utilities are concerned with
maximizing social welfare then moving to marginal cost pricing (with an appropriately calculated
annual connection fee to recoup any losses implied by marginal cost pricing under increasing returns
to scale) is necessary. Interestingly, Environment Canada has recently developed a software program
in co-operation with the Canadian Water and Wastewater Association that allows municipal water
utility managers to estimate the marginal costs of their operations and to design water rates based on
those calculations (Canadian Water and Wastewater Association, 1992).
A major constraint to moving to marginal cost pricing is the absence of meters in a large
number of municipalities. Meters should be installed where the benefits exceed the cost. In general,
this implies that meters should be installed in cities where population is growing rapidly and where
water use is close to capacity (cf. Renzetti, 1992).
In contrast to the problem of a lack of metering, there is some evidence that consumers’
21
willingness to pay for improved water and sewage facilities is not a major constraint facing utility
managers. A recent nation-wide survey found that the average household willingness to pay for
improved water system reliability was approximately $26.00/month over and above current water
supply payments (Rollins, Frehs, Tate and Zachariah, 1996). If prices were raised to capture this
expressed willingness to pay, the national water supply industry could raise revenues by in excess of
$3 billion.
The cost accounting and pricing of sewage treatment also needs to be reformed. In this
regard, it is important to note that the structure of sewage treatment costs is a complicated function
of flow rates, input prices and treatment technology, and not simply a constant proportion of water
supply costs. As a result, sewage prices should not be tied directly to water supply prices unless
metering costs are prohibitive. The estimated demand for sewage treatment and potable water supply
suggest that sewage pricing does influence behaviour but this is a particularly understudied area.
22
REFERENCES
American Water Works Association (1991) Water Rates Manual, 4th ed. (Denver: American Water
Works Association)
Babin, F., C. Willis, and P. Allen (1982) "Estimation of Substitution Possibilities Between Water
and Other Production Inputs", American Journal of Agricultural Economics 64(1), 148-151
Boisvert, R. and T. Schmit (1997) “Tradeoff Between Economies of Size in Treatment and
Diseconomies of Distribution For Rural Water Systems”, Agricultural and Resource Economics
Review 27(2), 237-247
Burrill, A. (1997) Assessing the Societal Value of Water in its Uses, (Sevilla, Spain: Joint Research
Center of the European Commission)
Canadian Water and Wastewater Association (1992) Municipal Water and Wastewater Rate Manual:
A New Approach to Rate Setting, (Ottawa: Canadian Water and Wastewater Association in co-
operation with Environment Canada and the Rawson Academy of Aquatic Science)
Crew, M. and P. Kleindorfer (1986) The Economics of Public Utilities, (Cambridge, Massachusetts:
MIT Press)

23
Dinar, A. and A. Subramanian, eds. (1997) Water Pricing Experiences: An International Perspective,
World Bank Technical Paper No. 386 (Washington, D.C.: The World Bank)
Easter, K.W, G. Feder, G. Le Moigne and A. Duda (1993) Water Resources Management,
(Washington, D.C.: The World Bank)
Environment Canada (1991) Municipal Water Use Database (MUD), (Ottawa: Environment Canada,
Water Resources Branch)
Environment Canada (1991) National Inventory of Municipal Waterworks and Wastewater Systems
(MUNDAT),. (Ottawa: Environment Canada, Water Resources Branch)
Environment Canada (1994) "Canadian Monthly Climate Data and 1961-1991 Normals", (Ottawa:
Canadian Weather Service)
Fraas, A. and V. Munley (1984) "Municipal Wastewater Treatment Cost", Journal of Environmental
Economics and Management 11(1), 28-38
Gardner, G. (1997) Recycling Organic Waste, Worldwatch Paper 135, (Washington, D.C.:
Worldwatch Institute)
Grebenstein, C. and B. Field (1979) "Substituting for Water Inputs in U.S. Manufacturing", Water
24
Resources Research 15(2), 228-232
Hall, D.C., ed. (1996) Marginal Cost Rate Design and Wholesale Water Markets, Advances in the
Economics of the Environment, Vol. 1, (London: JAI Press)
Hanke, S. and L. de Maré (1982) "Residential Water Demand: A Pooled, Time Series Cross Section
of Malmö, Sweden" Water Resources Bulletin 18, 621-625
Hanke, S. and R. Wentworth (1981) "On the Marginal Cost of Wastewater Services", Land
Economics 57(4), 558-567
Hansen, L.G. (1996) "Water and Energy Price Impacts on Residential Water Demand in
Copenhagen", Land Economics 72(1), 66-79
Hayes, K. (1987) "Cost structure of the water utility industry" Applied Economics 19, 417-425
Hirshleifer, J, J. DeHaven, and J. Milliman (1960) Water Supply: Economics, Technology and
Policy, (Chicago: University of Chicago Press)
Jones, C.V and J. Morris (1984) "Instrumental Price Estimates and Residential Water Demand",
Water Resources Research 20(2), 197-202
25
Kim, H. (1987) "Economies of Scale in Multi-Product Firms: An Empirical Analysis" Economica
54, 185-206
MacLaren, J.W. (1985) "Municipal Water Works and Wastewater Systems", Research Paper #3
(Ottawa: Inquiry on Federal Water Policy)
National Round Table on the Environment and the Economy (1996) State of the debate on the
environment and the economy: water and wastewater services in Canada, (Ottawa: Supply and
Services Canada)
Ontario Hydro (1993) Monthly Rates and Comparative Bills for Ontario Hydro and Associated
Municipal Utilities (Toronto: Ontario Hydro)
Ontario Hydro (1992) Statistical Yearbook, (Toronto: Ontario Hydro)
Organization for Economic Co-operation and Development (1987) The Pricing of Water Services,
(Paris: OECD, Environment Directorate)
Pearse, P., F. Bertrand, and J. MacLaren (1985) Currents of Change: Final Report, Inquiry on
Federal Water Policy, (Ottawa: Environment Canada)
Parker, D. and Y. Tsur, eds. (1997) Decentralization and Coordination of Water Resource
26
Management, (New York: Kluwer Academic)
Percy, D.R. (1988) The Framework of Water Rights Legislation in Canada, (Calgary: The Canadian
Institute of Resources Law)
Postel, S. (1993) "Facing Water Scarcity" in The State of the World, ed. L. Brown (New York:
W.W. Norton)
Renzetti, S. (1992) "Evaluating the Welfare Effects of Reforming Municipal Water Prices", Journal
of Environmental Economics and Management 22(2), 147-163
Renzetti, S. (1992) "Estimating the Structure of Industrial Water Demands: The Case of Canadian
Manufacturing", Land Economics 68(4), 396-404
Rollins, K., J. Frehs, D. Tate and O. Zachariah (1997) “Resource Valuation and Public Policy: The
Case of Water Pricing”, Canadian Water Resources Journal, 22(2), 185-196
Spulber, N. and A. Sabbaghi, (1994) Economics of Water Resources: From Regulation to
Privitization, (Boston: Kluwer Academic)
Strudler, M. and I. Strand (1981) "Pricing as a Policy to Reduce Sewage Costs", Water Resources
Research 19(1), 53-56
27
Swallow, S. and C. Marin (1988) "Long-Run Price Inflexibility and Efficiency Loss for Municipal
Water Supply", Journal of Environmental Economics and Management 15, 233-247
Statistics Canada (1994) 1991 Census Profiles CD-ROM, (Ottawa: Statistics Canada)
Statistics Canada (1993) Manufacturing Industries of Canada: National and Provincial Areas, 1991-
1992, Catalogue 31-203, (Ottawa: Statistics Canada)
Tate, D.M. (1991) "Infrastructure Financing: Issues of Public Policy." paper delivered at the 64th
Annual Meeting, Water Pollution Control Federation, Toronto..
Tate, D.M. and D. Lacelle (1995) "Municipal Water Rates in Canada, 1991: Current Practices and
Prices" Social Science Series 30, (Ottawa: Environment Canada, Inland Waters Directorate)
Tate, D.M. and D. Scharf (1995) "Water Use in Canadian Industry, 1991", Social Science Series 31,
(Ottawa: Environment Canada, Inland Waters Directorate)
Teeples, R. and D. Glyer, "Cost of Water Delivery Systems: Specification and Ownership Effects",
Review of Economics and Statistics 69(3), 399-408
Terza, H. and W. Welch (1982) "Estimating demand under block rates: Electricity and water", Land
28
Economics 58, 181-186
Turnovsky, S (1969) “The Demand for Water: Some Empirical Evidence on Consumers’ Response
to a Commodity Uncertain in Supply”, Water Resources Research 5(2), 350-61
Wasny, G. (1986) “Household Water Expenditures in Major Metropolitan Centres in Canada”,
Canadian Water Resources Journal 11(4), 33-45
Winpenny, J. (1994) Managing Water as an Economic Resource, (London: Routledge)
29
DATA APPENDIX
A. Water Supply and Sewage Treatment Costs
The data are cross sectional observations of Ontario municipal utilities operating in 1991.
These observations are compiled from several sources including national surveys of water utility
operations and water utility pricing and municipal financial records that are reported to the
provincial government. There are 77 observations for water supply utilities and sewage treatment
facilities. The sample is representative of the province in terms of the distribution of utility size
although the sample is skewed slightly towards larger utilities (the average annual output for utilities
in the sample is 8.1 million cubic metres while the provincial average is 6.9 million cubic metres).
The price of labour is represented by the average weekly earnings for all municipal public
utility workers as municipal records do not report the earnings of water utility workers separately
(OMMA, 1992). The price of energy is represented by the average price of electricity charged in
each municipality to industrial customers by the provincial electrical power utility, Ontario Hydro
(Ontario Hydro, 1992). In principle, the price of capital should reflect interest rates, depreciation
rates and purchase prices of capital equipment. Unfortunately, no data on the costs of capital or
depreciation rates were available on a municipality-specific basis. As a result, the price of capital is
represented by the average interest rate on each utility's outstanding debt. These data were collected
by contacting each utility directly.
Total annual cost to each utility is assumed to be the sum of expenditures on labour, capital
and energy. These data are available from the Ontario Ministry of Municipal Affairs which oversees
30
the operations of municipal governments (OMMA, 1992). Total expenditures on capital includes
expenditures on debt retirement and capital grants by municipal, Ontario, and federal governments.
Expenditures on materials were used to approximate expenditures on energy, since energy is the
major portion of materials.
Finally, data regarding annual output levels and the types of sewage treatment used by each
municipality are available from Environment Canada's Municipal Water Supply and Sewage
Treatment Facilities (MUNDAT) and Municipal Water Use (MUD) databases (Environment
Canada, 1991)
B. Water and Sewage Treatment Demands
Water supply and sewage treatment price schedules for each municipality in the sample are
available from Environment Canada's Survey of Municipal Water Rates (Tate and Lacelle, 1995).
The price for residential water supply is calculated as the marginal price at a level of 20 m3 per
month per household. Environment Canada’s Municipal Water Rates Database calculates marginal
water rates at consumption levels of 10, 20 and 30 m3/month. According to Environment Canada’s
Municipal Water-Use Database the average household in municipalities contained in the sample
used in this paper consumes approximately 22 m3 per month. As a result, marginal water supply
prices are calculated at a consumption level of 20 m3 /month.
The rate schedules for sewage treatment for residential customers are also provided by the

31
Municipal Water Rates Database. In all of the municipalities in the sample, sewage treatment prices
are either $0/ m3 (in the case of unmetered households) or a fixed percentage of the water supply
price (the actual percentage varies across municipalities).
The prices for non-residential water supply and sewage treatment are calculated as the
marginal price at a level of 100 m3 per month. In the case of the aggregate sewage treatment
demand, the prices of water supply and sewage treatment are weighted averages of the residential
and non-residential prices with the weights being the respective quantities of water consumption.
The prices of electricity for residential and non-residential customers are the average rates prevailing
in each municipality (Ontario Hydro, 1993).
Income is measured as the average household income in each municipality (Statistics
Canada, 1994). Population is the total population in the municipality served by municipal water
supply facilities (Environment Canada, 1991). Value and Number of Firms measure the value of
output and number of manufacturing firms in each municipality, respectively. These data are
available from Statistics Canada's Census of Manufactures (Statistics Canada, 1992) and
Environment Canada's Industrial Water Use Survey (Tate and Scharf, 1995).
The temperature and precipitation data are taken from Environment Canada (1994). The first
two elements of the V vector measure the number of days per year when the mean daytime
temperature exceeds 25 and 30 degrees Celsius, respectively, and the last three elements measure
the number of days per year when the recorded precipitation is between 5 and 10 mm, between 10
and 25 mm, and in excess of 25 mm, respectively.
32
C. Water Supply and Sewage Treatment Prices
These observations come from a national 1991 survey of water supply and sewage treatment
pricing practices (Tate and Lacelle, 1995). Water supply prices are $/m3 and sewage treatment costs
are calculated as a percentage of water supply price. Out of the total sample of 77 municipalities, 31
have a flat rate price structure for water supply to residential customers and 33 do the same for
sewage treatment services to residential customers. In these cases, customers pay a regular fee to
gain access to the distribution network but pay a zero marginal price for water supply or sewage
treatment. In the instances when utilities charge residential customers a non-zero price for water,
constant rates (i.e. quantity-invariant) prices are more common (30 municipalities) than declining
block prices (16 municipalities).
With respect to non-residential customers, the use of volumetric charges is more common.
Volumetric charges to non-residential consumers are equally divided between constant and declining
block structures. One municipality uses increasing block structures. Only 10 municipalities provide
flat rate price structures for water supply to non-residential customers.
33
FOOTNOTES Lead footnote. The author would like to thank Don Tate, Terry Veeman, Chuck Howe, Lena
Höglund, Diane Dupont, participants of the "Water Management" session of the 1997 European
Environmental and Resource Economics meetings and two anonymous referees for their
valuable comments. Terry Hatton, and Kari Heinrichs provided assistance with the data.
Financial support from the Social Sciences and Humanities Research Council is gratefully
acknowledged. All errors and omissions are the responsibility solely of the author.
1. There are a variety of ways in which municipal governments organize their water supply and
sewage treatment agencies. The differences in organizational structure are not addressed in this
paper as all of the utilities in the sample are organized as departments within municipal or
regional governments. In addition, there are a small number of privately owned water utilities in
Canada (in contrast to the U.S., where a significant portion of the market is controlled by
investor-owned utilities). This paper concentrates on publicly-owned utilities.
2. Scope economies refer to the cost savings associated with the joint production of several
products. In the case of water utilities, these products are the provision of potable water to
residential, commercial, institutional and industrial customers. See Kim (1987).
3. The inclusion of the price of electricity in the residential water demand equation follows
Hansen (1996). The price of electricity is also included in the aggregate demand for sewage
treatment. In both cases, the purpose for including the price of electricity is to investigate
whether it plays a significant role in determining the observed variation in the quantity
34
demanded. This could occur if the price of electricity influenced the demand for, and rate of
utilization, of water-using capital such as pumps, dishwashers, water heaters, etc.
4. The cost functions' and demand equations’ estimated coefficients are available from the author. 5. There is another, unrelated, reason why the deadweight loss estimates may be overly
conservative. According to Environment Canada’s meteorological data, in 1991, Ontario had
approximately 10-15% more rainfall than the average annual amount over the preceding 25
years. This would have lead to lower than average water demands and, as a result, lower than
average measures of the distortions (and welfare loss) associated with mis-pricing water supplies
and sewage treatment. I would like to thank one of the reviewers for raising this point.