Embed Size (px)
Citation preview

Municipal Water Quality Investigations Program Work Plan
January - December 2017
FINAL DRAFT
State of California Natural Resources Agency
DEPARTMENT OF WATER RESOURCES
January 11, 2017

Municipal Water Quality Investigations Program, January – December 2017 Work Plan
ii
This page was intentionally left blank.

Municipal Water Quality Investigations Program, January – December 2017 Work Plan
iii
Municipal Water Quality Investigations Program
Work Plan January – December 2017
January 11, 2017
MWQI Work Plan Authors
Cindy A. Garcia, Environmental Program Manager and
Rachel R.B. Pisor, Senior Environmental Scientist (Supervisor) and
Steven San Julian, Senior Environmental Scientist (Supervisor) and
Mark Bettencourt, Senior Environmental Scientist (Specialist)
Division of Environmental Services Office of Water Quality
Municipal Water Quality Investigations Program Branch West Sacramento, California
Municipal Water Quality Investigations Program, January – December 2017 Work Plan
iv
Table of Contents List of Figures and List of Tables ........................................................................................... v List of Terms and Acronyms ...................................................................................................vi 1. MISSION STATEMENT ....................................................................................................................... 1 2. INTRODUCTION ................................................................................................................................... 1
2.1. MWQI Program Background ............................................................................................................. 1 2.2. MWQI Program – Program Partners ................................................................................................. 1 2.3. MWQI Program Core Elements ......................................................................................................... 2 2.4. DWR MWQI Program Organization Chart ....................................................................................... 3
3. PROGRAM FUNDING NEEDS............................................................................................................ 4 3.1. MWQI Program and MWQI SPC Funds ........................................................................................... 4 3.2. Explanation of Program Element Costs for Work Plan Projects ....................................................... 7
4. WORKLOAD ASSESSMENT............................................................................................................... 8 5. WATER QUALITY ASSESSMENT .................................................................................................. 11
5.1. Routine Monitoring Program ........................................................................................................... 15 5.2. Short-term Monitoring ..................................................................................................................... 15
5.2.1 DSM2 Nutrient Study ................................................................................................................ 15 5.2.2 Cache Slough Baseline Monitoring and Data Analysis ............................................................. 15 5.2.3 Pathogen Special Project Monitoring ........................................................................................ 16 5.2.4 Central-South Delta Source Water Dissolved Organic Carbon Monitoring .............................. 18
6. REAL-TIME DATA AND FORECASTING COMPREHENSIVE PROGRAM .......................... 19 6.1. Real-Time Monitoring ..................................................................................................................... 19
6.1.1 MWQI Program Real Time Stations.......................................................................................... 19 6.1.2 Gianelli WQ Station................................................................................................................... 20
6.2. RTDF-CP Water Quality Forecasting .............................................................................................. 21 6.2.1. BDO Modeling ......................................................................................................................... 21 6.2.2. OCO Modeling ......................................................................................................................... 22 6.2.3. Improve Aqueduct Pump-in Dynamics in the MWQI Program Water Quality Forecasts ....... 22 6.2.4. Assessment, Collection and Archival of Aqueduct Pump-in Data ........................................... 22 6.2.5. Comparison of Water Quality Forecasts to Actual Conditions ................................................. 23 6.2.6. Improvement of the DSM2 Nutrient Model ............................................................................. 23 6.2.7. Potential Planning Studies ........................................................................................................ 23 6.2.8. Adding Additional Wastewater Treatment Plants to the Fingerprint ....................................... 23
6.2.9. Fluorescence of Dissolved Organic Matter (FDOM) Project ................................................... 24 6.3. RTDF-CP Information Management and Data Dissemination ........................................................ 25
6.3.1. RTDF Data Dissemination and Reporting ................................................................................ 25 6.3.2. Administrative and Database Activities .................................................................................... 26
7. OTHER MWQI FUNDED PROGRAM ACTIVITIES ..................................................................... 27 7.1. Administration Work ....................................................................................................................... 27 7.2. Field Support Section Office Duties ................................................................................................ 27 7.3. MWQI Program Annual Work Plan ................................................................................................ 27 7.4. DWR’s Bulletin 132, Chapter 4 - Water Quality ............................................................................. 28 7.5. Workplace Safety ............................................................................................................................. 28 7.6. Emergency Response ....................................................................................................................... 28 7.7. Miscellaneous Meetings Attended by Staff ..................................................................................... 28
8. PROGRAM MANAGEMENT - STATUS REPORTING ................................................................ 29 9. NON-MWQI FUNDED PROGRAM MANAGEMENT ................................................................... 29 10. OTHER REQUIRED PROGRAM COSTS ..................................................................................... 30

Municipal Water Quality Investigations Program, January – December 2017 Work Plan
v
List of Figures Figure 1. DWR org chart showing positions funded by MWQI Program funds .................................... 11 Figure 2. MWQI Discrete and RTDF Monitoring Locations ................................................................. 22 Figure 3. The Cache Slough Complex Station Name, Type, and Location ............................................ 25
List of Tables
Table 1. January – December 2017 Program Element Costs for MWQI Program and MWQI SPC Funds .................................................................................................................................................... 5-14 Table 2. January – December 2017 MWQI Program Contract and OE&E Costs ................................... 7 Table 3. Workload Assessment ........................................................................................................... 9-18 Table 4. MWQI Program’s Discrete and Grab Sampling Stations ........................................................ 11 Table 5. Routine and Special Project Discrete Grab Sample Deliverables and Timelines .................... 18 Table 6. MWQI Program Real-Time station locations, parameters, and equipment ............................. 20 Table 7. Real-Time Monitoring Tasks ................................................................................................... 21 Table 8. FDOM Study Deliverables and Timelines…………………………………………………...32 Table 9. Information Management and Data Dissemination Deliverables and Timelines ............... 25-34

Municipal Water Quality Investigations Program, January – December 2017 Work Plan
vi
List of Acronyms and Terms BDO Department of Water Resources Bay Delta Office
BOD Biological Oxygen Demand CBOD Chemical Biological Oxygen Demand CCWD Contra Costa Water District CDEC California Data Exchange Center CIWQS California Integrated Water Quality System
CVP Central Valley Project CY Calendar Year DBP Disinfection by-product
DES Division of Environmental Services DFW California Department of Fish and Wildlife DMC Delta-Mendota Canal DO Dissolved Oxygen DOC Dissolved Organic Carbon DOE DWR Division of Engineering
DSM2 Delta Simulation Model 2 DWR California Department of Water Resources
EC Specific Electric Conductivity EPA U.S. Environmental Protection Agency FDOM Fluorescence of Dissolved Organic Matter FRPA Fish Restoration Program Agreement FY Fiscal Year

Municipal Water Quality Investigations Program, January – December 2017 Work Plan
vii
HAAFP Haloacetic Acid Formation Potential IC Ion Chromatography IEP Interagency Ecological Program IO Internal Order number
MEO Mobile Equipment Operations MWDSC Metropolitan Water District of Southern California
MWQI Municipal Water Quality Investigations MWQI SPC Municipal Water Quality Investigations Specific Projects Committee Na Sodium
NCRO North Central Regional Office NEMDC Natomas East Main Drainage Canal
O&M DWR Division of Operations and Maintenance O&M WQ Division of Operations and Maintenance Water Quality Section OC Organic Carbon OCO Operation Controls Office (DWR O&M) OEE Operating Expenses and Equipment P/G Pumping/Generation
PY Position Year
QA/QC Quality Assurance/Quality Control QC Quality Control RA Resource Agreement RTD Real-time Data RTDF Real-time Data and Forecasting Program

Municipal Water Quality Investigations Program, January – December 2017 Work Plan
viii
RTDF-CP Real-time Data and Forecasting – Comprehensive Program RTM Real Time Monitoring SBA South Bay Aqueduct SCWA Solano County Water Agency
SLDMWA San Luis and Delta-Mendota Water Authority SOP Standard Operating Procedure SPC Specific Project Committee
SWC State Water Contractors SWP State Water Project SWPCA State Water Project Contractors Authority
TAC Technical Advisory Committee TBD To Be Determined TDS Total Dissolved Solids
THMFP Trihalomethane formation potential TKN Total Kjeldahl Nitrogen
TOC Total (dissolved and suspended particulate) Organic Carbon
USBR U.S. Bureau of Reclamation USGS United States Geological Survey UVA n Ultraviolet absorbance at wavelength n
WARMF Watershed Analysis Risk Management Framework WDL California Water Data Library WWTP Waste Water Treatment Plants

1
1. MISSION STATEMENT The mission of the Municipal Water Quality Investigations (MWQI) Program is to:
a) Support the effective and efficient use of the State Water Project (SWP) as a source water supply for municipal purposes through monitoring, forecasting, and reporting of the Sacra-mento San Joaquin Delta and the SWP water quality;
b) Provide early warning of changing conditions in source water quality used for municipal pur-poses;
c) Provide data and knowledge-based support for operational decision-making on the SWP; and d) Provide scientific support to the Department of Water Resources (DWR), the State Water
Project Contractors Authority (SWPCA) MWQI Specific Project Committee (MWQI SPC), participating SWP Contractors, and other governmental entities.
2. INTRODUCTION 2.1. MWQI Program Background The MWQI Program continues to study and monitor water quality in the Sacramento-San Joaquin Delta (Delta). Information produced by the program is incorporated with other data sources to produce a comprehensive information base that provides State Water Contractors and other interested parties with details related to source water conditions as water makes its way to their facilities through the SWP. The information is disseminated via daily and weekly reports, and the Real-Time Data and Forecasting – Comprehensive Program (RTDF-CP) web site located at:
http://www.water.ca.gov/waterquality/drinkingwater/rtdf_rprt.cfm MWQI managers, supervisors and staff participate in various activities external to the Program. Examples include, involvement with regulatory activities that occur in the Delta through the SWRCB, and/or the Central Valley Regional Water Quality Control Board (CVRWQCB), participation in the CVRWQCB’s Nutrient Stakeholder and Technical Advisory Group (STAG) which is determining whether nutrient objectives are needed for the Delta, and assisting with pathogen and nutrient monitoring under the Delta Regional Monitoring Program (RMP). MWQI staff assisted with the turbidity transect study and may help support new drought related monitoring station operation and maintenance--how much support has yet to be determined. Finally, MWQI staff support database infrastructure management, the administration of essential program management activities mandated by DWR’s policies and procedures including implementing quality control measures, and efforts to ensure the health and safety of workplace staff. 2.2. MWQI Program – Program Partners The MWQI Program has several Program Partners who work in other DWR Divisions (see the organiza-tion chart below) including O&M’s Environmental Assessment Branch (EAB), the Operations Control Office (OCO), the Bay-Delta Office (BDO), North Central Regional Office (NCRO), and Quality Assur-ance Quality Control (QA/QC) Support Services. MWQI Program and its Program Partners use Re-sources Agreements to manage workloads, staff resources, and budgets across DWR Divisions. Each Re-sources Agreement (RA) is prepared, reviewed, approved, and kept on-file by program managers in-volved in the agreement. Typically, the duration of a RA is one to three years and agreements are renewed

Municipal Water Quality Investigations Program, January – December 2017 Work Plan
2
when workloads change. For this work plan cycle, MWQI Program has developed 3-year draft agree-ments for the following Program Partners:
1. O&M - Environmental Assessment Branch 2. OCO - Regulatory Compliance & Reporting 3. BDO - Delta Modeling Section 4. NCRO - Water Quality Evaluation Section
2.3. MWQI Program Core Elements Although MWQI Program core elements will receive priority, staff time may shift occasionally from work described in this work plan. Examples include work on drought activities, TUCP’s, CA WaterFix, or EcoRestore. If it becomes apparent that core elements will be affected, adjustments will be made to keep the program moving forward. Core elements are listed in priority of importance to the MWQI SPC:
1. Water quality monitoring (both real-time and discrete) at existing stations and sites 2. Modeling duties associated with real-time forecasting used in the RTDF daily and weekly reports 3. Production and dissemination of daily and weekly RTDF reports 4. Data management activities pertaining to database infrastructure enhancement and development
in order to improve long-term storage and retrieval of RTDF data 5. Program management activities listed in the MWQI funding agreement and those mandated by
DWR health and safety. This includes monthly RTDF Steering Committee meetings, budget up-dates, Bulletin 132 updates, and support to department emergency, drought, and O&M programs.
6. Other required Program activities mandated by DWR or essential to the MWQI Program (i.e. pur-chasing, contracts, budgeting, 2017 DWR Environmental Scientist Workshop, safety and policy training, specific meetings and conferences).

Municipal Water Quality Investigations Program, January – December 2017 Work Plan
3
2.4. DWR MWQI Program Organization Chart Figure 1. DWR org chart showing positions funded by MWQI Program funds.
Wiliam Croyle, Acting DirectorCindy Messer, Chief Deputy Director
State Water ProjectMark E. Andersen, Acting Deputy Director
Division of Operations & MaintenanceDave Duval, CEABay-Delta Office
Francis Chung, CEADivision of Environmental Services
Dean F. Messer, CEA
Office of Water QualityStephani Spaar, EPM II
Municipal Water Quality Program BranchVacant, EPM I
Field Support Section* 4 PY
Steven San Julian, Sr. ES (Sup.)Arin Conner, ES
Travis Brown, ESJeremy Del Cid, ES
Water Quality Special Studies Section* 1 PY
Mark Bettencourt, Sr. ES (Spec.)
Modeling Support BranchTara Smith, Principal Engineer, WR
Delta Modeling Section, Bay-Delta OfficeVacant, Sup. Engineer, WR
*1 PY spread among staff
Historical & Real-Time AnalysisBob Suits, Sr. Engineer
Water Quality & EcosystemHari Rajbhandari, Sr. Engineer
SWP Operations Support OfficeDavid Samson, Principal Engineer, WR
Environmental Assessment BranchAnthony Chu, PM II
Water Quality Section* 0.6 PY
Leah McNearney, PM IDaniel Wisheropp, ES
SWP Operations Control OfficeDavid Roose, Chief of Utl. OPS, WR
Operations Planning OfficeJohn Leahigh, Principal Engineer, WR
Regulatory Compliance & Reporting BranchTracy Hinojosa, Sup. Engineer, WR
Delta Compliance & Modeling SectionDan Yamanaka, Sr. Engineer, WR
*1 PY shared between:James Edwards, Engineer
Reza Shahcheraghi, EngineerSiqing Liu, Engineer, WR
JOB TITLE ABBREVIATIONS CEA: Career Executive Appointment ES: Environmental Scientist WR: Water Resource EPM: Environmental Program Manager PM: Program Manager
*Indicates position(s) funded by the MWQI Program.

Municipal Water Quality Investigations Program, January – December 2017 Work Plan
4
3. PROGRAM FUNDING NEEDS 3.1. MWQI Program and MWQI SPC Funds The three-year MWQI Funding Agreement (FA) between the MWQI Program, SWPCA, and 16 SWP Contractors who receive municipal and industrial (M&I) water from the SWP, remains in effect until December 31, 2019 which covers the timeframe of this calendar year (CY) based annual work plan. At the writing of this work plan, the CY 2017 budget total is $3.1 million with $2,620,443 for the DWR MWQI Program, and the remaining portion for the MWQI SPC fund. SWPCA will continue to budget on a FY basis. The DWR MWQI Program budget is funded by the SWPCA MWQI SPC through the Statement of Charges. The MWQI Program portion of the budget will fund staff salaries including benefits, assessments, operating expenses, the RTDF Steering Committee, funding for the DWR modelers that support the MWQI Program. The MWQI SPC provides funds to retain consultants, and purchase certain goods and services deemed necessary and desirable for station operation and research by both the MWQI RTDF Steering Committee and the MWQI SPC. The Contra Costa Water District also provides funding to the MWQI SPC to help with the expenses involved with the Water Quality Assessment efforts. The estimated budget expenses for this work plan CY are shown in Table 1. This work plan covers January to December 2017, a 12-month budget is presented in Table 1 below, and followed by an updated explanation of MWQI Program expenditures in Table 2. Partner staffing in this budget reflects 1 Position Year (1 PY = 1778 hours/year = 221 working days) each for the BDO and OCO, 0.6 PY for the Division of O&M EAB, and approximately 12 hours per month (144 hours total for 2017, or about 8% of full time) for NCRO. NOTE - For budgeting purposes, Table 1 labor hours are displayed as 85% of 2080 hours. 85% is used because on average, 15% of the year staff are out of the office and thus not working. For example, sick leave, vacation, holidays, etc.

Municipal Water Quality Investigations Program, January – December 2017 Work Plan
5
Table 1. January – December 2017 Program Element Costs for MWQI Program and MWQI SPC Funds Work Plan Element Program Element 2017 IO#
Labor Hours
Labor Cost
Contract costs OE&E Total Cost
5 Water Quality Assessment 5.1 Routine Monitoring Program VWQASSMENT13 2488 $388,128 $33,750 $421,878 5.2 Short-term Monitoring (included with 5.1) VWQASSMENT13 $69,587 $69,587 5.2.1 DSM2 Nutrient Study VWQASSMENT13 $0 5.2.2 Cache Slough Baseline Monitoring VWQASSMENT13 $0 5.2.3 Pathogen Special Project Monitoring VWQASSMENT13 $0
5.2.4 Central-South Delta Source Water Dissolved Organic Carbon Monitoring VWQASSMENT13 144 $14,000 $4,462 $18,462
6 RTDF-Comprehensive Program 6.1 RTDF-CP Real Time Monitoring $0 6.1.1 MWQI Real Time Stations VRTMONITOR13 2661 $415,116 $30,536 $61,800 $507,452 6.1.2 Gianelli WQ Station VGIANNELLI13 903 $111,972 $7,307 $15,450 $134,729 6.2 RTDF-CP Water Quality Forecasting $0 6.2.1 BDO- Bay Delta Office Modeling VRTBDOMODL13 1778 $284,480 $284,480 6.2.2 OCO- Operations Control Office Modeling VRTOCOMODL13 1778 $284,480 $284,480 6.2.3 Improve Aqueduct Pump-in Dynamics VPUMPINDYN15 $0
6.2.4 Assessment, Collection & Archival of Aque-duct Pump-in Data VMANPUMPIN15 $0
6.2.5 Comparison of Water Quality Forecasts to Actual Conditions VCOMPAREWQ15 $0
6.2.6 Improvement of the DSM2 Nutrient Model VIMDSM2NUT15 $0 6.2.7 Potential Planning Studies VPOTPLANST15 $0
6.2.8 Adding Additional WWT Plant to the Finger-print VWWTPFNGPT15 $0
6.2.9. FDOM Project VFDOMPOCS013 100 $16,000 $16,000
6.3 RTDF-CP Information Management and Data Dis-semination $0
6.3.1 RTDF Data Dissemination & Reporting VRTDDISRPT13 1031 $148,320 $148,320

Municipal Water Quality Investigations Program, January – December 2017 Work Plan
6
Table 1 (cont’d.) January – December 2017 Program Element Costs for MWQI Program and MWQI SPC Funds Work Plan Element Program Element 2017 IO#
Labor Hours
Labor Cost
Contract costs OE&E Total Cost
7 Other MWQI Funded Program Activities 7.1 Administration Work VDWRRQDDPC13 584 $91,104 $12,240 $103,344 7.2 Field Unit Office Duties VFUOFCWORK13 1134 $176,904 $10,000 $186,904 7.3 MWQI Annual Work Plan VWORPLAN013 4 $800 $800 7.4 DWR Bulletin 132 VBULL132WQ13 9 $1,800 $1,800 7.5 Workplace Safety VSAFTYDOCS13 $3,775 $3,775 7.6 Emergency Response V911RESPNS13 $0 7.7 Miscellaneous meetings attended by staff VOTHEWQPA13 28 $4,368 $4,368 8 Program Management-Status Reporting VPROMMGMT13 1004 $200,800 $200,800 9 Non-MWQI Funded Program Management
10 Other Required Program Costs 10.1 MEO Insurance & Fuel & Maintenance $39,140 $39,140 Total 13,646 $2,138,272 $37,843 $250,204 $2,426,319
* DWR assessments are equally charged to programs to cover costs of Departmental overhead expenses. For example, ad-ministration, legal, and executive offices. ** The MWQI Program includes 5 PY for staff and 5 PY's (3 are reduced %'s of full time) for program partners in OCO, BDO, O&M, and NCRO.
Labor rates are estimated at: ES - $124/hour, SrESSpec - $144/hour, SrESup - $200/hour, and Engineer Staff time at $160/hour.

Municipal Water Quality Investigations Program, January – December 2017 Work Plan
7
3.2. Explanation of Program Element Costs for Work Plan Projects Table 2. January – December 2017 MWQI Program Contract and Operating Expenses & Equipment (OE&E) Costs
OEE for the 2017 WP Program element: OEE for the WP Escalation Cost 12 months
5.1 WQ Assessment Routine Monitoring Program 103% $21,000 $21,630 5.1 WQ Assessment 4 new PC's (no monitors, keyboards, or mice) $6,120 $6,120 5.2 WQ Assessment Short-Term Monitoring - contract lab costs 103% $67,560 $69,587 5.2 WQ Assessment NCRO RA for Central-Southern Delta fDOM Project $4,462 $4,462
6.1.1 RTDF MWQI Real Time Stations - equipment & filter replacement 103% $60,000 $61,800 6.1.1 RTDF All Cal Services - portable toilet at Hood real time station $1,020 $1,020 6.1.1 RTDF Thermo-Fisher service contract for 3 Dionex IC analyzers (Banks, Vernalis, Jones) $11,916 $11,916
6.1.1 RTDF GE/Sievers - service contract for 4 organic carbon analyzers (Hood, Banks, Jones, Vernalis) $17,600 $17,600
6.1.2 Gianelli WQ Station Thermo-Fisher service contract for 1 Dionex IC analyzers (Gianelli) $2,907 $2,907 6.1.2 Gianelli WQ Station GE/Sievers - service contract for 1 organic carbon analyzers (Gianelli) $4,400 $4,400 6.1.2 Gianelli WQ Station Equipment repairs and replacement, filters, reagents, etc. 103% $15,000 $15,450 7.1 Administration Work Meetings, conferences, training for MWQI staff $12,240 $12,240 7.2 Field Unit Office Duties Maintenance of field section offices and needed office equipment $10,000 $10,000 7.5 Workplace Safety Safety Supplies & Equipment 103% $2,500 $2,575 7.5 Workplace Safety Mandatory safety footwear - $200 max/ person for every other year per MOU $1,200 $1,200
10.1 Mobile Equipment Office Vehicle maintenance, fuel, and insurance 103% $38,000 $39,140 TOTAL OEE COSTS: $282,047

Municipal Water Quality Investigations Program, January – December 2017 Work Plan
8
4. WORKLOAD ASSESSMENT For this work plan cycle, January 1-December 31, 2017, the MWQI Program management staff con-ducted a workload assessment to assess whether their staff had work that would occupy 100% of their staff’s work time. This assessment is based on 10 staff members which includes MWQI Program staff and our MWQI Program funded partner staff in OCO, BDO, O&M, and NCRO. The assessment is also based on Position Year (1 PY) hours, or 1778 committed staff hours per work year which is equal to 221 days. The assessment does not use the total hours in a year (2080) because total hours includes vacation, holi-days, sick, etc. where staff do not produce work. The workload assessment has proved to be a vital tool in managing staff workloads, shifts in workloads, and impacts to the MWQI budget. Table 3 lists the current workload assessment.

Municipal Water Quality Investigations Program, January – December 2017 Work Plan
9
Table 3. Workload Assessment
Draft - MWQP Branch Staff Hours allocated to the CY2017
MWQI Work Plan-- Labor Breakdown
Rout
ine
Mon
itorin
g Pr
ogra
m
(VW
QAS
SMEN
T13)
Shor
t-te
rm M
onito
ring
(VW
QAS
SMEN
T13)
MW
QI R
eal T
ime
Stat
ions
(V
RTM
ON
ITO
R13)
Gian
elli
WQ
Sta
tion
(VGI
ANN
ELLI
13)
BDO
- Bay
Del
ta O
ffice
Mod
elin
g (V
RTBD
OM
ODL
13)
OCO
- Ope
ratio
ns C
ontr
ol O
ffice
Mod
elin
g (V
RTO
COM
ODL
13)
Impr
ove
Aque
duct
Pum
p-in
Dyn
amic
s (V
PUM
PIND
YN15
)
Asse
ssm
ent,
Colle
ctio
n an
d Ar
chiv
al o
f Aq
uedu
ct P
ump-
in D
ata
(VM
ANPU
MPI
N15
)
Com
pare
WQ
For
ecas
ts to
Act
uals
(VCO
MPA
REW
Q15
)
Impr
ovem
ent D
SM2
Nut
rient
Mod
el
(VIM
DSM
2NUT
15)
Pote
ntia
l Pla
nnin
g St
udie
s (V
POTP
LAN
ST15
)
Addi
ng A
dditi
onal
Was
tew
ater
Tre
atm
ent
Plan
ts to
Fin
ger-
prin
t (V
WW
TPFN
GPT1
5)
Fluo
resc
ence
of D
issol
ved
Org
anic
Mat
ter
(FDO
M) (
VFDO
MPO
CS01
3)
Work Plan Element 5.1 5.2 6.1.1 6.1.2 6.2.1 6.2.2 6.2.3 6.2.4 6.2.5 6.2.6 6.2.7 6.2.8 6.2.9 MWQI Field Section combined
Arin Conner 670 690 0 0 0 0 0 0 0 0 0 0 Travis Brown 670 690 0 0 0 0 0 0 0 0 0 0
Jeremy Del Cid 570 690 0 0 0 0 0 0 0 0 0 100 Steven San Julian 310 0 0 0 0 0 0 0 0 0 0 0
RTDF-CP & Data Dissemination Mark Bettencourt 96 591 15 0 0 0 0 0 0 0 0 0
Non-MWQP Staff O&M - Daniel Wisheropp 72 0 888 0 0 0 0 0 0 0 0 0
OCO - James Edwards 0 0 0 0 1778 0 0 0 0 0 0 0 BDO - Wenli Yin 0 0 0 1778 0 0 0 0 0 0 0 0
NCRO - Tylor Salman 144 0 0 0 0 0 0 0 0 0 0 0
Total Hours 2388 2661 903 1778 1778 0 0 0 0 0 0 0 PYs 1.343 1.497 0.508 1.000 1.000 0.000 0.000 0.000 0.000 0.000 0.000 0.056

Municipal Water Quality Investigations Program, January – December 2017 Work Plan
10
Table 3. Workload Assessment (cont’d)
Draft - MWQP Branch Staff Hours allocated to the CY2017
MWQI Work Plan-- Labor Breakdown
RTDF
Dat
a Di
ssem
inat
ion
and
Repo
rtin
g (V
RTDD
ISRP
T13)
Adm
inist
ratio
n w
ork/
trai
ning
/RTD
F/M
odel
-in
g m
eetin
gs
(VDW
RRQ
DDPC
13)
Fiel
d Su
ppor
t Sec
tion
Offi
ce D
utie
s (V
FUO
FCW
ORK
13)
MW
QI A
nnua
l Wor
k Pl
an e
ffort
s (V
WO
RKPL
AN01
3)
Bulle
tin 1
32 e
ffort
s (V
BULL
132W
Q13
)
Wor
kpla
ce S
afet
y ef
fort
s (V
SAFT
YDO
CS13
)
Emer
genc
y Re
spon
se
(V91
1RES
PNS1
3)
Misc
. Mee
tings
(V
OTH
ERW
QPA
13)
Prog
ram
Man
agem
ent/
Stat
us R
epor
t (V
PRO
GMM
GMT1
3)
Non
-MW
QI F
unde
d Pr
ogra
m S
uppo
rt,
(Dro
ught
, Bar
riers
, MeH
g, W
ater
PIE
, etc
.)
Staf
f Hou
rs C
omm
itted
(177
8 w
ork
hour
s/ye
ar =
221
day
s. 2
080
hour
s /ye
ar
incl
udes
vac
atio
n, h
olid
ays,
sick,
etc
.)
Staf
f Hou
rs A
vaila
ble
(1PY
= 1
778
hr/y
r)
perc
ent a
lloca
ted
Work Plan Element 6.3.1 7.1 7.2 7.3 7.4 7.5 7.6 7.7 8 9 Total Total MWQI Field Section
Arin Conner 0 140 278 0 0 0 0 0 0 0 1778 0 100% Travis Brown 0 140 278 0 0 0 0 0 0 0 1778 0 100%
Jeremy Del Cid 0 140 278 0 0 0 0 0 0 0 1778 0 100% Steven San Julian 0 140 300 0 8 0 0 16 1000 0 1774 4 100%
RTDF-CP & Data Dissemination Mark Bettencourt 1031 24 0 4 1 0 0 12 4 0 1778 0 100%
Non-MWQP Staff O&M - Daniel Wisheropp 0 0 0 0 0 0 0 0 0 0 960 818 54%
OCO - James Edwards 0 0 0 0 0 0 0 0 0 0 1778 0 100% BDO - Wenli Yin 0 0 0 0 0 0 0 0 0 0 1778 0 100%
NCRO - Tylor Salman 0 0 0 0 0 0 0 0 0 0 144 1634 8%
Total Hours 1031 584 1134 4 9 0 0 28 1004 0 13402 2456 PYs 0.580 0.328 0.638 0.002 0.005 0.000 0.000 0.016 0.565 0.000 7.538 1.381

Municipal Water Quality Investigations Program, January – December 2017 Work Plan
11
5. WATER QUALITY ASSESSMENT Water quality assessment has been a key feature of the MWQI Program since its inception in 1983. MWQI’s monitoring data are used by many groups including DWR and other agencies, the MWQI SPC, non-governmental organizations, and by the public. MWQI monitoring data are used in drinking water supply studies, to identify long-term trends in drinking water quality, and to help DWR and other agencies research and mitigate drinking water issues in Delta waters and the SWP. Additionally, in collaboration with the BDO, O&M EAB, and OCO, monitoring data are used to further develop the “early warning” system that provides advance notice to Delta water users of possible drinking water quality problems. Monitoring data are collected by two different monitoring strategies; 1) discrete grab samples, and 2) continuous real-time monitoring via remotely located instrumentation. This section focuses on discrete or ‘grab sample’ monitoring for January-December 2017. Section 6.1 focuses on continuous, remote real-time monitoring. Discrete monitoring in this work plan remains unchanged from the previous work plan. Twelve of the existing MWQI monitoring locations are part of the MWQI’s long-term, routine monitoring program (Section 5.1). The other 16 monitoring sites are associated with short-term modeling support and other approved special studies. Table 4 lists all 28 monitoring locations with associated analytes, Figure 2 is a map of the discrete and real-time sampling sites, and Table 5 lists the routine and special project discrete grab sample deliverables and timelines. The MWQI program historically borrowed boats to complete its discrete monitoring work. In 2016 and free of charge to the program, the MWQI Program took ownership of a 16 foot Klamath boat, motor, and trailer, in working order from DWR’s Oroville Field Division. The field division had not used the boat in some time and no longer had a use for it. MEO assisted MWQI staff in negotiating the transfer, and will assist with maintenance of the boat when needed. The boat can be used on the existing Cache Slough Complex monitoring work, but is too small to do so comfortably. Therefore, MWQI management staff have made plans for an upgrade by swapping boats with NCRO. Once the swap is complete, MWQI will own a 2008 17 foot Klamath Alaskan V-hull boat with a trailer, and a 2014 60-hp outboard motor that seats 4 people. Currently, MWQI uses a larger boat rather than the 16 foot Klamath, if available. Table 4. MWQI Program’s Discrete and Grab Sampling Stations
# Stations WDL Stations (ID) Analytes Collected Frequency Study
1
Natomas East Main Drainage Ca-nal
NATOMAS EMDC at EL CAMINO RD (A0V83671280)
Std. Mineral, nutrients, TOC, DOC, UVA, turbidity, bromide, metals, pathogens
Monthly Routine, Pathogens
2
American River at E.A. Fairbairn WTP Intake
American River at W.T.P. (A0714010)
Std. Mineral, nutrients, TOC, DOC, UVA, turbidity, bromide
Monthly Routine
3
Sacramento River at West Sacra-mento WTP Intake
Sacramento River at W. Sac Intake Structure (A0210451)
Std. Mineral, nutrients, TOC, DOC, UVA, turbidity, and bro-mide, metals
Monthly Routine
4
Sacramento River at Hood
Sacramento R A Hood (B9D82211312)
Std. Mineral, nutrients, TOC, DOC, UVA, turbidity, bromide, Mn, pathogens
Twice per month Routine, RTDF, Pathogens
5
Sacramento River at Mallard Island1
Sacramento River at Mallard Island (E0B80261551)
Std. Mineral, nutrients, TOC, DOC, UVA, turbidity, bromide, CBOD, BOD
Twice per month1 Routine, DSM2 Nu-trient

Municipal Water Quality Investigations Program, January – December 2017 Work Plan
12
# Stations WDL Stations (ID) Analytes Collected Frequency Study
6
San Joaquin River near Vernalis
San Joaquin R. nr. Vernalis
(B0702000)
Std. Mineral, nutrients, TOC, DOC, UVA, turbidity, bromide, Mn, CBOD, BOD, pathogens
Twice per month Routine, RTDF, DSM2 Nutrient,
Pathogens
7
Old River at Bacon Island
Old River at Bacon Island (B9D75811344)
Std. Mineral, nutrients, TOC, DOC, UVA, turbidity, bromide, pathogens
Monthly Routine, Pathogens
8
Old River at Sta-tion 9
Old R. nr. Bryon (St 9) (NEAR HWY 4 BRIDGE)
(B9D75351342)
Std. Mineral, nutrients, TOC, DOC, UVA, turbidity, bromide, Mn
Monthly Routine
9
Banks Pumping Plant at Head-works
Delta P.P. Headworks at H.O. Banks PP
(KA000331)
Anions, TOC, DOC , pathogens (MWQI);
Std. Mineral, turbidity, UVA, TOC, DOC, bromide, total phosphorous, total suspended solids, phyto-plankton, purgeable organics, taste and odor (MIB & geosim), asbestos, and radiological, pesti-cides and herbicides (O&M)
Depending on ana-lyte: Twice per month (MWQI),
Monthly (O&M), or Quarterly (O&M)
Routine, RTDF, Pathogens
10
Contra Costa Ca-nal @ Rock Slough
Contra Cost Canal at Rock Slough Fish Screen
(B9C75861385)
Std. Mineral, nutrients, TOC, DOC, UVA, turbidity, and bro-mide, pathogens
Monthly Routine, Pathogens
11
Middle River @ Union Point
Middle River A Union Point
(B9D75351292)
Std. Mineral, Turbidity, UVA, TOC, DOC, Bromide, nutrients, Mn
Monthly Routine
12 Jones Pumping Plant at DMC
Eastside Delta Mendota Ca-nal intake at Jones PP
(B9C74781351)
Anions, TOC, DOC, pathogens
Twice per month RTDF, Pathogens
13
Gianelli Pump-ing/Generating Plant
Gianelli WQ Station near Pumping Plant
(ON003050)
Anions, TOC, DOC Twice per month RTDF
14
Colusa Ag Drain near. Sacramento River
Ag Drain on Colusa Basin Main Drain
(A0294500)
Std. Mineral, nutrients, TOC, DOC, UVA, turbidity, bromide, Suspended Solids, pathogens
Monthly Routine, Pathogens
15
Shag Sl. @ Liberty Island
(Yolo Bypass West Toe Drain)
ShagSl@LibIslBr
(B9S81841416)
Std. Mineral and nutrients, TOC, DOC, UVA, suspended solids, chlorophyll, CBOD, BOD, THMFP, HAAFP
Twice per month Cache Slough Com-plex; DSM2 Nutrient
16
Mokelumne River @ Benson’s Ferry
Benson’s Ferry
(B9D81371295)
Std. Mineral, nutrients, TOC, DOC, UVA, turbidity, bromide, suspended solids, chlorophyll, CBOD, BOD, pathogens
Twice per month DSM2 Nutrient, Path-ogens
17 Calaveras River @ UOP Footbridge
Calaveras R @ UOP
(B9D75851208)
Std. Mineral and nutrients, TOC, DOC, UVA, suspended solids, chlorophyll, CBOD, BOD, patho-gens
Twice per month DSM2 Nutrient, Path-ogens
18 Sacramento River @ Westin Boat Dock
SacR. @ Westin BtDoc
(B9D83221310)
(changed from B9D832212010)
Std. Mineral and nutrients, TOC, DOC, UVA, suspended solids, chlorophyll, CBOD, BOD, patho-gens
Twice per month DSM2 Nutrient, Path-ogens

Municipal Water Quality Investigations Program, January – December 2017 Work Plan
13
# Stations WDL Stations (ID) Analytes Collected Frequency Study
19 Southern tip of Lib-erty Island
S. Liberty Is.
(B9D81461410)
Std. Mineral and nutrients, TOC, DOC, UVA, suspended solids, chlorophyll, THMFP, HAAFP
Twice per month Cache Slough Com-plex
20 Cache Slough nr Ryer Island
(Lower Cache Slough)
Cache Sl nr. Ryer Is
(B9D81281401)
Std. Mineral and nutrients, TOC, DOC, UVA, suspended solids, chlorophyll, THMFP, HAAFP, pathogens
Twice per month Cache Slough Com-plex, Pathogens
21 Miner Slough above Prospect
Miner Sl @ Hwy84 Br
(B9D81751379)
Std. Mineral and nutrients, TOC, DOC, UVA, suspended solids, chlorophyll, THMFP, HAAFP
Twice per month Cache Slough Com-plex
22 Miner Slough be-low Prospect (but above with Cache Slough)
Miner Sl below P
(B9D81410400)
(changed from B9D814103910)
Std. Mineral and nutrients, TOC, DOC, UVA, suspended solids, chlorophyll, THMFP, HAAFP
Twice per month Cache Slough Com-plex
23 Lisbon Weir (Yolo Bypass East Toe Drain)
YOLOBYLISBON
(B9D82851352)
Std. Mineral and nutrients, TOC, DOC, UVA, suspended solids, chlorophyll, THMFP, HAAFP
Twice per month Cache Slough Com-plex
24 Sacramento Ship-ping Channel above Prospect Is-land
SDWC
(B9D81621397)
Std. Mineral and nutrients, TOC, DOC, UVA, suspended solids, chlorophyll, THMFP, HAAFP
Twice per month Cache Slough Com-plex
25 Upper Cache Slough (below Ula-tis Creek)
Upper Cache Sl
(B9S81841416)
Std. Mineral and nutrients, TOC, DOC, UVA, suspended solids, chlorophyll, THMFP, HAAFP
Twice per month Cache Slough Com-plex
26 Lindsey Slough at Hastings Island Bridge
Lindsey Sl. at Bridge
(B9D81481421)
Std. Mineral and nutrients, TOC, DOC, UVA, suspended solids, chlorophyll, THMFP, HAAFP
Twice per month Cache Slough Com-plex
27 Wildlands Restora-tion outfall at Stair-step
Wildlands
B9D82011403
Std. Mineral and nutrients, TOC, DOC, UVA, suspended solids, chlorophyll, THMFP, HAAFP
Twice per month Cache Slough Com-plex
28 Liberty Cut at Stair-step
LibertyCut at StairStep
B9D82011400
Std. Mineral and nutrients, TOC, DOC, UVA, suspended solids, chlorophyll, THMFP, HAAFP
Twice per month Cache Slough Com-plex
• 1 Mallard Island is a monthly routine monitoring location, but for the DSM2 Nutrient study samples are collected every two weeks.
• Physical Parameters collected at all sites: Temperature, pH, Turbidity, Dissolved Oxygen, and Specific Conductance • Standard Mineral analysis includes: Ca, Mg, Na, K, B, Alkalinity, Chloride, Bromide, Nitrate, Sulfate, Dissolved Sol-
ids, Specific Conductance, Standard Nutrient analysis includes: Nitrate + Nitrite, Ammonia, Organic Nitrogen and Ammonia, Total Phosphorus (unfiltered), and Orthophosphorus

Municipal Water Quality Investigations Program, January – December 2017 Work Plan
14
Figure 2. MWQI Program’s Discrete and RTDF Monitoring Locations

Municipal Water Quality Investigations Program, January – December 2017 Work Plan
15
5.1. Routine Monitoring Program Collection at long-term monitoring locations remains unchanged from the previous work plan. As part of real-time instrument quality control, discrete samples are collected twice per month at the Banks Pumping Plant, Jones Pumping Plant, Gianelli Pumping Plant, and Hood and Vernalis river stations. These river and canal samples are collected to examine instrument performance, but can also be used as discrete data representative of the sample location. Discrete sample data are available through DWR’s Water Data Library (WDL). Deliverables and timelines associated with discrete sample collection are shown in Table 5. 5.2. Short-term Monitoring Aside from MWQI’s routine monitoring, other samples are collected for short-term monitoring projects. Current short term projects are described below. 5.2.1 DSM2 Nutrient Study Principle Investigator – Steven San Julian Project Partners – Elaine Archibald
The Delta Simulation Model 2 (DSM2) nutrient monitoring study was originally included in MWQI’s FY 13-14 work plan. The goal of this monitoring is to define water quality conditions at seven DSM2 nodes located at the boundaries of the Sacramento-San Joaquin Delta, so that the DSM2 nutrient model can be improved. BDO modelers and consultants identified key constituents to be monitored. MWQI Program staff have sampled the DSM2 locations (nodes) twice per month since September 2013. The key constituents include physical parameters, nutrients, biological oxygen demand (BOD), carbonaceous biological oxygen demand (CBOD), chlorophyll, and pheophytin. In some cases, a new monitoring location was added to the MWQI Program because monitoring had not previously been conducted at the node. In other cases, DSM2 constituents were simply added to existing node monitoring activities.
In this new work plan, field monitoring activities will continue. Additionally, the report written by Ted Swift during late 2016 will be presented to the BDO modelers to determine if monitoring is still needed. Based on those discussions, monitoring may be continued as is, cancelled completely, or altered to better suit current model needs. The DSM2 Nutrient Study project deliverables and timelines for the memorandum report are shown in Table 5. 5.2.2 Cache Slough Baseline Monitoring and Data Analysis Principle Investigator –Steven San Julian Project Partners – Alex Rabidoux and Elaine Archibald
In the coming years, numerous ecologically driven restoration projects are planned to be constructed in the Cache Slough Complex. The Cache Slough Complex drains into the Sacramento River near Rio Vista, and includes the Yolo Bypass, Liberty Island, Sacramento Deep Water Ship Channel and other north-west Delta tributaries (see Figure 3). Planned restoration projects are of varying sizes but cumula-tively could total over 8000 acres. These planned habitat restoration activities will have unknown impacts to in-stream drinking water quality; and therefore, may result in additional costs to drinking water munici-palities treating thru-Delta water. The Fish Restoration Program Agreement (FRPA) is an agreement be-tween DWR and the Department of Fish and Wildlife to implement habitat restoration actions for listed fish species under the Biological Opinions and Incidental Take Permit for SWP operations in the Delta. The proposed FRPA monitoring program is still being developed and it is unclear if drinking water qual-ity concerns will be covered by the FRPA monitoring plan and when monitoring might commence.

Municipal Water Quality Investigations Program, January – December 2017 Work Plan
16
Due to the uncertainty regarding FRPA monitoring, and with the backing of the MWQI SPC, MWQI Pro-gram staff will conduct a two-phased approach to help define baseline, pre-restoration water quality in the Cache Slough Complex. Phase 1 involves working with FRPA to make sure that drinking water quality monitoring concerns are addressed in future FRPA monitoring. If this is successful, the MWQI Program may be able to step-back from its monitoring responsibilities tied to Phase 2 of this study. Phase 2 is the MWQI Program led field monitoring of key locations in the Cache Slough Complex. Both phases will run concurrently.
The Cache Slough monitoring described above will continue indefinitely, but during the last work plan cycle some work was done to determine if collected data was meeting the study needs. Analysis showed that current monitoring should continue with the goal of describing water year variation (wet vs. dry) that has yet to be captured in monitoring. The whole data set will be analyzed prior to January 2018 so that monitoring adjustments can be made in 2018, if necessary.
The Cache Slough Complex Study deliverables and timelines are shown in Table 5. 5.2.3 Pathogen Special Project Monitoring Drinking water municipalities have been tasked with conducting monitoring to comply with the Long-Term 2 Enhanced Surface Water Treatment Rule (LT2ESWTR), which was adopted by the State of California on July 1, 2013. This study, looking at pathogen levels at drinking water treatment facilities and key surface water locations, is being performed as a joint collaboration between the MWQI Program, the Central Valley Drinking Water Policy Workgroup, and the Delta RMP. The RMP approved the monitoring plan, and MWQI’s role is solely to collect the pathogen samples and deliver them to the laboratory for analysis. Monitoring began in April 2015 and will end in March 2017. MWQI Program staff will collect samples at 12 locations monthly and deliver these samples to the contract laboratories. All 12 sites are already monitored by MWQI Program staff so the time commitment associated with this study is minimal.
Samples are collected following the general field procedures described in MWQI’s Field Manual. Specific sampling protocols are also used for Cryptosporidium and Giardia per EPA Method 1623. Pathogen monitoring sites can be found in Table 5.

Municipal Water Quality Investigations Program, January – December 2017 Work Plan
17
Figure 3. The Cache Slough Complex Station Name, Type, and Location.

Municipal Water Quality Investigations Program, January – December 2017 Work Plan
18
Table 5. Routine and Special Project Discrete Sample Deliverables and Timelines Deliverable Participants Start Date Estimated Completion Date
Records of monthly and bi-weekly monitoring data.
MWQI N/A Currently available upon request
Records of periodic calibration of field monitoring equipment
MWQI N/A Currently available upon request
Records demonstrating consistent and timely application of QA/QC procedures
MWQI N/A Currently available upon request
Timely analysis and posting of re-sults to the WDL
MWQI N/A Monthly Available on-line
DSM2 Nutrient Monitoring MWQI Sep 2013 Reassess Dec 2017
Cache Slough Complex, Fish Res-toration Passage Act (FRPA) En-gagement
MWQI Jun 2013 Reassess Dec 2017
Cache Slough Complex Monitoring MWQI Sep 2013 Reassess Dec 2017
Central-South Delta fDOM Project Monitoring
MWQI, NCRO
Jun 2016 Reassess Dec 2017
N/A = not applicable or available 5.2.4 Central-South Delta Source Water Dissolved Organic Carbon Monitoring The Stockton deep water ship channel has long been suspected of chronically contributing Dissolved Organic Carbon (DOC) into the Central and South Delta. DOC is a constituent of concern for drinking water treatment plants because carbon has the ability to react with disinfectants, such as chlorine during the treatment process. These reactions can lead to the formation of disinfection by-products (DBPs) which pose a human health concern because they are potentially carcinogenic.
Prior studies have shown that measuring fluorescence can be used as a proxy for measuring DOC directly (Coble 2007, Cumberland and Baker 2007, Kraus et al. 2010). Also, the United States Geological Survey (USGS) has been using high-frequency in-situ fluorometers as a proxy for DOC in fresh waters of California and has demonstrated strong relationships between FDOM and DOC (Downing et al. 2008). USGS reported a regression between DOC and FDOM with an R-squared value of 0.98, while Saraceno et al. reported an R-squared value of 0.97. With such significant relationships correlating DOC with FDOM, this three year study will deploy a fluorometer at each of three key locations in the Delta: Frank’s Tract, south of Holland Tract near Rock Slough, and on Victoria Canal near Middle River.
This study will be developed throughout 2017 and conducted as a joint collaboration between the MWQI Program Field Support Section staff and MWQI Program Partner staff from NCRO to investigate and report on the DOC contributions to the Delta from the Stockton deep water ship channel. All three sites are already monitored by MWQI Program Partner’s staff so the cost and time commitment associated with this study is minimal.

Municipal Water Quality Investigations Program, January – December 2017 Work Plan
19
6. REAL-TIME DATA AND FORECASTING COMPREHENSIVE PROGRAM
The RTDF-CP focuses on providing real-time water quality data and related information gathered from multiple sources. This enables water managers to make operational decisions based on observed and forecasted changes in water quality. The RTDF-CP includes a network of real-time water quality monitoring stations that provide current water quality conditions, and a modeling component that provides both historical and predictive water quality characterizations. Monitoring performed by the RTDF-CP encompasses the Delta, watersheds of the Delta, the SWP, and portions of the federal Central Valley Project (CVP). In addition, funded positions within the MWQI Program are also found within DWR’s BDO, OCO, and O&M Environmental Assessment Branch. The RTDF-CP Consists of Three Principle Activities:
1. Remote instrumentation that provides real-time water quality data 2. Modeling that provides historical water quality fingerprints and water quality forecasting 3. Information management and data dissemination
Real-time monitoring, forecasting and data dissemination activities are guided by the RTDF Steering Committee, a group of technical experts composed of MWQI Program staff, CCWD staff and participating MWQI SPC agencies. 6.1. Real-Time Monitoring The real-time monitoring section of the RTDF-CP produces water quality data that supports the development of water quality forecasting tools, provides current and advanced notice of water quality conditions, provides information for water quality and water supply planning studies, and can be used by drinking water treatment plant operators to make informed operational decisions. This program element is comprised of:
1. Instrumentation installed at key remote locations in and around the Delta. 2. Field operations that provide timely repair and maintenance of all station equipment. 3. Timely dissemination of real-time data. 4. Standard Operating Procedure documentation and instrument QA/QC documentation. 5. Implementation and documentation of data QA/QC.
6.1.1 MWQI Program Real Time Stations The RTDF-CP continues to operate five remote real-time monitoring stations; four located in the Delta and one south of the Delta (Table 6). The Delta stations include Hood, located on the Sacramento River near the town of Hood, Banks Pumping Plant, located at the head of the SWP, Jones Pumping Plant, located at the head of the Delta-Mendota Canal (part of the CVP) and Vernalis, located on the San Joaquin River near the town of Vernalis. The southern station, at Gianelli Pumping Plant, is located within O&M’s San Luis Field Division on O’Neill Forebay below San Luis Reservoir. Table 7 summarizes the tasks associated with these real-time monitoring stations. Table 6 summarizes station locations, MWQI Program and non-MWQI Program water quality parameters, and the automated analyzers used by the MWQI Program RTM element. Figure 2 shows the location of the RTM stations.
Field office labor associated with real-time monitoring (RTM) includes:
1) Ordering RTM supplies, phone consultation with instrument manufacturers

Municipal Water Quality Investigations Program, January – December 2017 Work Plan
20
2) Creation of RTM Quality Control (QC) sampling runs 3) Creation of instrument-specific chemical standards, solutions and reagents 4) Repairs to station peripheral components 5) Maintenance of equipment used on RTM field runs 6) Analysis of all RTM data 7) Remote operation of instruments.
Table 6. MWQI Program Real-Time station locations, parameters, and equipment
MWQI Program Station/CDEC Station
MWQI Program Parameters & Instruments
Non-MWQI Program Parameters
Sacramento River at Hood (CDEC = SRH)
TOC, DOC (Sievers 900-oxida-tion)
Water: chlorophyll, EC, DO, pH, temperature and turbidity. Atmospheric: solar radiation, temperature, wind speed and
direction. San Joaquin River near Ver-
nalis (CDEC = SJR) TOC, DOC ( Sievers 5310-oxi-dation) bromide, chloride, ni-trate, sulfate, (Thermo-Fisher
Dionex ICS-2100)
Water: chlorophyll, DO, EC, pH, river flow and stage, tem-
perature and turbidity.
Banks Pumping Plant - Delta Headworks
(CDEC = HRO)
TOC, DOC ( Sievers 5310-oxi-dation), bromide, chloride, ni-trate, sulfate, (Thermo-Fisher
Dionex ICS-2100)
Water: EC, fluorescence, pH, pump discharge, temperature,
turbidity, UVA 254. Atmospheric: temperature, wind speed and direction.
Jones Pumping Plan (CDEC = TRP)
TOC, DOC, ( Sievers 5310-oxi-dation), bromide, chloride, ni-trate, sulfate, (Thermo-Fisher
Dionex ICS-2100)
Water: EC, pump discharge, temperature.
Gianelli P/G Plant (CDEC = ONG)
TOC, DOC (Sievers 5310), EC, temp, turbidity, DO, pH (YSI 6600) bromide, chloride, ni-trate, sulfate (Thermo-Fisher
Dionex ICS-2100)
N/A
N/A = not applicable or available 6.1.2 Gianelli WQ Station In order to track time and expenditures related to the Gianelli water quality station, a separate IO was created (VGIANNELLI13). Most of the funding for this station goes toward the salary of an Environmental Scientist position held within the O&M EAB (Environmental Assessment Branch). Responsibilities for this position are similar to those at the MWQI stations.

Municipal Water Quality Investigations Program, January – December 2017 Work Plan
21
Table 7. Real-Time Monitoring Tasks Deliverable Participants Estimated Start
Date Estimated Comple-
tion Date Continue operation of auto-
mated stations at Hood, Banks, Jones, Vernalis, and Gianelli
MWQI Program, O&M Water
Quality Ongoing Ongoing
A) Update SOPs: documenting maintenance, operation and
QA/QC of all in-situ equipment.
B) Continue to work towards standardizing, streamlining, and consolidating DWR’s in-situ equipment, data quality control, and data dissemina-
tion.
MWQI Program, O&M Water
Quality
MWQI Program, O&M Water
Quality, North Central
Regional Office, IEP
N/A
N/A
A) Ongoing
B) Ongoing
Evaluate the need, and plan-ning for, other installations per the RTDF-CP (together with RTDF Steering Committee).
RTDF SC MWQI TAC
Jul 2008 Ongoing
6.2. RTDF-CP Water Quality Forecasting The modeling/forecasting component of the RTDF-CP continues to update and improve existing models to further develop their capabilities; these include the Watershed Analysis Risk Management Framework (WARMF) tributary watershed models, the DSM2 Delta and DSM2 Aqueduct Extension models. The objective of this effort is to better incorporate modeling insight with water quality monitoring to maximize the use of modeling results by water quality managers. The modeling effort continues to focus on Historical representations (fingerprints), Short-Term Forecasts and on tasks associated with Seasonal Forecasts. These efforts are scheduled to continue through this work plan cycle. For CY 2017, the modeling sub-group of the RTDF Steering Committee suggested seven new areas of model development which would/could provide beneficial information to interested parties and improve modeling capabilities. Modeling oversight will be documented through a new one year PPA. These agreements will be developed by program staff and reviewed by the RTDF Steering Committee. Descriptions of projects that are underway or that have yet to begin are listed below. In some cases, the PI identified is a “placeholder” until vacancies are filled or staff are assigned to the project(s). The modeling sub-group of the RTDF Steering Committee will continue to work on implementing these ideas and will review the new tasks at monthly RTDF Steering Committee meetings or at future modeling sub-group meetings as needed. 6.2.1. BDO Modeling Principal Investigator – TBD Project Partner –Tony Liudzius
Models used in the RTDF-CP are routinely updated by BDO staff. Examples include, the ArcMap application which allows modelers to develop and add stage animation features in DSM2 and a

Municipal Water Quality Investigations Program, January – December 2017 Work Plan
22
comparison of water quality monitoring data and data produced by the Sacramento watershed WARMF model which shows that upstream data sources are a limiting factor. In addition, work is needed to support short-term modeling in the Delta and to provide timely updates on drought related EC effects. Throughout this work plan cycle the modeling sub-group will meet periodically to develop this work.
6.2.2. OCO Modeling Principal Investigator – TBD (BDO) and Dan Yamanaka’s (OCO) Staff Member is TBD Project Partner –Tony Liudzius
The models are continuously updated and refined by DWR OCO modelers. Within this section, a potential new project was identified that would/could improve the forecasting capability of Delta consumptive use. Improve the forecasting capability of DSM2 by working with IRWM to have flow gauges installed at key Delta locations to more accurately predict the Delta consumptive use component of the model’s input data. Improvements include preparing up-to-date annual Delta land use surveys, installing flow gauges at key Delta locations and improving the collection of Delta precipitation data by adding new monitoring sites. Further review is needed.
6.2.3. Improve Aqueduct Pump-in Dynamics in the MWQI Program Water Quality Forecasts Principal Investigator – Dan Yamanaka’s (OCO) Staff Member is TBD and MWQI Program Staff is TBD Project Partner –Tony Liudzius
Short-Term Forecasts Interested SWP contractors and MWQI Program staff will investigate whether scheduled near-term aqueduct pump-in (defined here as less than 2 months) data is available and whether obtaining this information on an ongoing basis is feasible. If this information is available, the effort will include establishing procedures for acquiring the information and determining if any support tools are needed to help automate and process the data. The goal would be to include accurate, up-to-date pump-in information in the MWQI Program short-term water quality forecasts.
Seasonal Forecasts This task is the same as described above except that the desired pump-in information will be for the current year (or slightly longer) in order to conform to the timeframe used in the seasonal water quality forecasts.
6.2.4. Assessment, Collection and Archival of Aqueduct Pump-in Data Principal Investigator – MWQI Program Staff is TBD Project Partner – Tony Liudzius
This project consists of identifying and cataloging all known sources of aqueduct pump-in data (both flows and water quality). If this information proves useful to the MWQI Program or in producing water quality forecasts, the task will include data gathering/input into an appropriate database or archive which will be made available to interested parties. Data gathered in this task could/would be used to improve model output by more effectively assessing water quality due to pump-ins.

Municipal Water Quality Investigations Program, January – December 2017 Work Plan
23
6.2.5. Comparison of Water Quality Forecasts to Actual Conditions Principal Investigator – Dan Yamanaka’s (OCO) Staff Member is TBD and Mark Bettencourt Project Partner – Tony Liudzius
Once forecasts are prepared, this project would compare short-term and long-term model output with actual water quality conditions over a specified time period to gain a better understanding of model efficiency. The structure, goals and deliverables of this study and the specific time period to be examined will be established by the study work group. One possibility is to examine the first three to four months of 2014 when water quality conditions declined due to drought conditions. Eventual forecast comparisons may lead to model improvements due to adjustments that could more effectively assess water quality.
6.2.6. Improvement of the DSM2 Nutrient Model Principal Investigator – Hari Rajbhandari Project Partner – Elaine Archibald
In 1995, BDO modelers developed the capability of simulating nutrient dynamics and primary production using DSM2 QUAL, and in 2009, under contract to MWDSC, RMA refined the model. Since that time, additional data have been collected by MWQI Program staff and others which could be used for further refinement. To continue model improvement, four areas need investigation:
1. Determine the questions that need to be answered 2. Gain a better understanding of nutrient dynamics in the Delta 3. Determine which models can answer the questions 4. What data are needed to refine or calibrate the models
(It may be that the DSM2 Nutrient Model is sufficient to answer some questions; however, a more sophis-ticated nutrient model may be needed to answer other questions.)
6.2.7. Potential Planning Studies Principal Investigator – TBD Project Partner – Tony Liudzius
The RTDF Steering Committee will investigate the need to conduct planning studies based on project operations under assumed hydrology, water demands, institutional constraints and project operation goals. Using different scenarios, planning studies could be used to determine potential drought related issues. For example, the CalSIM model can be utilized in drought planning by examining possible dry condition hydrologies in the fall of 2015.
6.2.8. Adding Additional Wastewater Treatment Plants to the Fingerprint Lead Investigator – TBD Project Partner – Elaine Archibald
Staff in the BDO developed a fingerprint model that displays percent treated wastewater at various loca-tions in the Delta and the contributions of EC and DOC from these plants. The fingerprint includes input from Sacramento Regional Wastewater Treatment Plant, Stockton Regional Wastewater Control Facility and the Manteca-Lathrop Wastewater Control Facility. There are however, nine other wastewater treat-ment plants that discharge into the Delta making the addition of data from these sites beneficial to the model. (Effluent data will be obtained from the CIWQS database and Central Valley Regional Water Board files.)

Municipal Water Quality Investigations Program, January – December 2017 Work Plan
24
6.2.9 Fluorescence of Dissolved Organic Matter (FDOM) Project Principal Investigator – Jeremy Del Cid with assistance from Steven San Julian Project Partner – Alex Rabidoux
The purpose of this project is to investigate the use of FDOM as a proxy for OC measure-ments. Literature reviews have shown significant relationships between FDOM and DOC and it may be possible to use FDOM as a proxy for DOC measurements. For this project, a fluorometer (Turner Designs Cyclops 7) was installed on the SWP at the Banks Pumping Plant (Banks).
In Early 2016, the two FDOM studies were reorganized into a single study. Phase 1 of the FDOM study, was renamed the FDOM Interim Report, and Phase 2 was renamed the FDOM Fi-nal Report. The FDOM Interim Report covered data collected between July 2013 and July 2014 and was completed July 2016. This report investigated the relationships between FDOM and DOC, and FDOM and UVA254.
The FDOM Final Report, expands on the relationships investigated in the interim report and en-compasses the full set of data collected between July 2013 and September 2015. The final report will expand on the correlation between FDOM and DOC by including unfiltered and 100 micron filtered water along with the 0.45 filtered samples collected during the initial study phase. Final report completion date has been pushed back to May 2017 to allow the study lead time to com-plete analysis.
FDOM Study deliverables and timelines are shown in Table 8. Table 8. FDOM Study Deliverables and Timelines
Deliverables Participants Estimated Start Date
Estimated Comple-tion Date
Collect data MWQI Program Jul 2013 Sep 2015
Complete Interim Report MWQI Program --- July 2016
Analyze data for final report and provide final report to DWR Management and MWQI SPC for review
MWQI Program Jan 2016 Oct 2016
Respond to comments and provide final report to DWR Ed-itors for review
MWQI Program Mar 2017 Mar 2017
Respond to comments and provide final report to DWR Management for review
MWQI Program Apr 2017 Apr 2017
Respond to comments and ap-proval to print MWQI Program May 2017 May 2017
Municipal Water Quality Investigations Program, January – December 2017 Work Plan
25
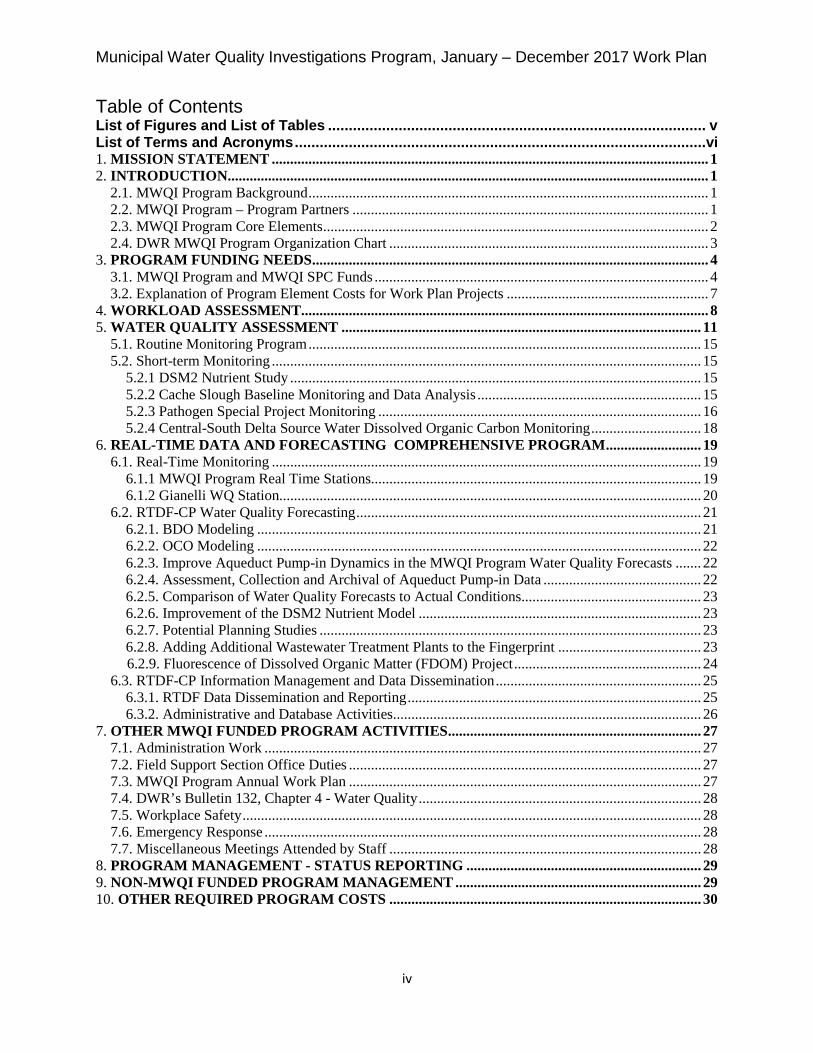
6.3. RTDF-CP Information Management and Data Dissemination This program element includes data dissemination and information management tasks associated with the synthesis of real-time data and related information that is derived from the RTDF-CP and a variety of federal and state water quality monitoring programs. The element produces, gathers, organizes and disseminates this information via the WDL (http://wdl.water.ca.gov/), the California Data Exchange Center (CDEC) (http://cdec.water.ca.gov/) and the RTDF-CP web page (http://water.ca.gov/waterquality/drinkingwater/rtdf_rprt.cfm). In addition, daily and weekly summary emails containing a subset of information including real time data, Delta commentary, weather updates and hydrological conditions are sent to interested parties. (This information is also posted on the RTDF-CP web site.) Information provided on the RTDF-CP web page gives users a single location to search for related water quality information. 6.3.1. RTDF Data Dissemination and Reporting Information management and data dissemination tasks include:
1. Continued refinement of the WDL data set 2. Continued refinement of the MWQI Program database 3. Continued development and enhancement of online tools for editing, evaluating, and interpreting
MWQI Program water quality data (QA/QC and data visualization). 4. Improve means to distribute daily and weekly water quality reports via the internet 5. Improve database functionality Tasks for the data dissemination portion of the RTDF program are shown below in Table 9.
Table 9. Information Management and Data Dissemination Deliverables and Timelines (Lead organization(s) is (are) shown in bold)
Task Participants Start Date Ongoing Improve/Upgrade database in-frastructure A) Continue to implement up-dates and patches as appropri-ate. B) Continued enhancement of manual and automated QA/QC processes C) Continue to develop the station journal database and applications. D) Continue to develop desk-top data management tools, enhance plotting capabilities, link time series and QA/QC.
MWQI Program
N/A A) Began Jan 2009 B) Began Jan 2009 C) Began Jan 2010 D) Began Jan 2010
Ongoing A) Ongoing B) Ongoing C) Ongoing D) Ongoing

Municipal Water Quality Investigations Program, January – December 2017 Work Plan
26
Task Participants Start Date Ongoing E) Continue to document and maintain infrastructure. F) Add new sensors to the da-tabase as needed
E) Began Jul 2009 F) Began Jan 2010
E) Ongoing F) Ongoing
Improve Field Data Communi-cations A) Continue to develop, test and enhance intranet/ internet components. B) Develop and implement as feasible procedures, practices and standards for supporting the reliability of field data sys-tems.
MWQI Program
A) Began Jan 2011 B) Began Jul 2011
A) Ongoing B) Ongoing
Development and enhance-ment of RTDF data dissemina-tion products A) As needed, add new sta-tions & sensors to the website or daily summary table. B) As needed, enhance the website presentation. C) Enhance procedures for emailing the daily summary re-port.
MWQI Program
A) N/A B) N/A C) N/A
A) Ongoing as needed B) Ongoing as needed C) Ongoing as needed
N/A = not applicable or available
6.3.2. Administrative and Database Activities Information management and data dissemination tasks conducted by the Technical Consultant, Dennis Huff include:
1. Continued refinement of the WDL data set. 2. Continued refinement of the MWQI Program database. 3. Continued development and enhancement of online tools for editing, evaluating, and inter-
preting MWQI Program water quality data (QA/QC and data visualization). 4. Improving means to distribute daily and weekly water quality reports via the internet. 5. Improving database functionality.
I

Municipal Water Quality Investigations Program, January – December 2017 Work Plan
27
7. OTHER MWQI FUNDED PROGRAM ACTIVITIES
MWQI staff work on some tasks that seem peripheral to approved work plan projects, but these tasks are actually an inescapable part of the job. For this reason, the following descriptions are intended to explain these types of tasks and help define the associated time requirements. In this section administrative activities, employee safety, and other overhead type tasks are discussed. In addition to these, MWQI staff are occasionally requested to support other DWR activities. For example, MWQI staff may be asked to provide technical assistance, review and revise plans, or provide support that improves workplace safety practices. Such assistance by the MWQI staff may directly or indirectly benefit the MWQI Program stakeholders and the MWQI SPC, and therefore is funded by the MWQI budget. MWQI Program staff will continue to inform the TAC and MWQI SPC about work related to these tasks. MWQI will achieve this through updates during the monthly TAC meetings, by providing details in this and future work plans, and through expenditure reports presented monthly at TAC meetings. 7.1. Administration Work In general, the Administrative Work covers meetings, conferences, training, and certain office duties of all MWQI staff. MWQI Program staff attend training classes focused on drinking water quality, but also attend classes outside of water quality to develop their skills and prepare for career advancement. Another form of training is workshop and conference attendance, such as the annual Environmental Scientist Workshop; the IEP Workshop, CWEMF Annual Meeting, Bay Delta Science Conference, etc. Other activities include office duties such as preparing training and travel expense claim forms; general email activities; preparing MWQI Program meeting agendas, handouts, and meeting minutes; and preparing equipment maintenance contracts. Also, most in-house meetings attended by staff are charged to this IO, including the TAC and Branch meetings. Preparing for and attending the MWQI Annual Meeting also fall under administrative work. 7.2. Field Support Section Office Duties The Field Support Office Duties IO number tracks the cost of the Field Section by tracking time and expenses charged for attending section and Branch meetings, maintaining the Bryte Trailer offices, and other general office activities. This IO information will be a valuable planning tool for the senior staff member leading the Field Section, which will allow for the budgeting of facility repairs, as needed. 7.3. MWQI Program Annual Work Plan The timing of the work plan cycle is changing from a fiscal year to a calendar year (CY - January 1 to December 31) basis staring January 1, 2017. This change to CY aligns with the MWQI Program: Funding Agreement; program partner RA’s; and budget planning and reporting. The new CY 2017 work plan will be developed by MWQP management staff and MWQI SPC, and will include all work plan development activities such as work plan meetings, work plan text and workload assessment development, and budget and timeline development. The MWQI staff will charge their work time to the MWQI work plan charge number.

Municipal Water Quality Investigations Program, January – December 2017 Work Plan
28
7.4. DWR’s Bulletin 132, Chapter 4 - Water Quality The MWQI Program staff will actively participate in writing the appropriate portions of the DWR Bulletin 132, Chapter 4 - Water Quality for version 132-17 (Calendar Year 2016). Bulletin 132, Management of the SWP, is a series of annual reports that describe the status of SWP operations and water deliveries. Each annual report updates information regarding project costs and financing, water supply planning, power operations, and significant events that affect the management of the SWP. Each report also presents hydrologic information for the water year, capital construction information for the fiscal year, and water delivery, operations, maintenance, and other activities for the calendar year. The cost of staff time spent revising and reviewing specific sections within chapter 4-water quality that pertain to the MWQI Program will be tracked so that management staff and the MWQI SPC can gain an understanding of the time and cost involved in producing our contributions to this document that is required by DWR to be provided annually to the SWP Contractors. This information will provide a valuable management tool for planning, organizing, managing, and controlling staff’s work time on the production of future bulletins. 7.5. Workplace Safety The DWR Safety Officer is responsible for leading DWR’s workplace safety program. The workplace safety program is beginning to provide uniformity and consistency across DWR, and involves every staff member contributing to a safer workplace. DES is committed to supporting DWR’s commitment to the health and safety of its employees, partners and visitors; and values workplace safety through leadership, recognition, and education. MWQI staff will contribute to this broader workplace safety program effort by contributing staff time in the division level efforts. On the project/study level, MWQI staff will ensure that safety equipment, safety protocols and documentation, and required training are part of every project. All of the work on safety program development, safety meeting attendance, and project specific safety activities and equipment will be charged to the Workplace Safety IO number. 7.6. Emergency Response Any staff involvement with emergency response (ER) during this work plan cycle will include: attending ER meetings, restocking of drinking water quality ER kits, providing emergency assistance for drinking water quality monitoring as requested by emergency responders and assisting the DWR’s Emergency Management Committee (EMC) as needed in the development of a DWR Drinking Water Quality ER Plan. 7.7. Miscellaneous Meetings Attended by Staff The MWQI Program staff will continue to provide support as needed to numerous DWR support activities that pertain to the MWQI Program. The cost of staff time spent on these support activities will be tracked so that management and the MWQI SPC will gain an understanding of the time and cost involved. This information will provide a valuable management tool for planning, organizing, managing, and controlling staff’s workloads, project time allocations, and overall costs to the MWQI Program.

Municipal Water Quality Investigations Program, January – December 2017 Work Plan
29
8. PROGRAM MANAGEMENT - STATUS REPORTING The MWQI Program Senior Environmental Scientist Supervisor is responsible for the following specific management tasks:
• Supervise and direct the work of the MWQI Environmental Scientists and other technical staff assisting with MWQI projects.
• Assign and distribute staff work, then monitor staffing levels, project schedules, monitor and evaluate work performance, and conduct staff workload assessments to improve efficiency, save time, resources and money.
• Conduct routine staff meetings, prepare staff’s annual appraisal and development (A&D) reports, determine staff training needs, approve staff’s training and time-off requests, and verify and ap-prove staff attendance.
• Coordinate the preparation, or prepare and provide the appropriate MWQI Program meeting agendas, monthly status report, budget expenditure reports, and meeting minutes.
• Coordinate the MWQI Annual Meeting. • Ensure MWQI TAC members continue to receive all draft materials, and that committee mem-
bers continue to have the opportunity to participate in technical meetings of interest. • Monitor progress on MWQI Program elements outlined in work plan. • Address personnel, contracted services, and equipment related issues for the MWQI Program. • Conduct interviews and hire qualified staff to backfill vacancies. • Provide technical support to management for meetings, conference and workshops related to
drinking water quality issues. • Prepare correspondence as needed to provide information to the MWQI SPC.
All time spent on these tasks is charged to the Program Management IO number. Only Senior Environmental Scientists in the MWQI branch charge to Program Management.
9. NON-MWQI FUNDED PROGRAM MANAGEMENT Since DWR is a matrix management organization, staff may be requested to assist with supporting various DWR activities by providing technical support, data analysis, timely document and plan reviews, and may occasionally attend meetings. Some of these support activities are not funded by the MWQI Program budget. For example, the MWQI Program staff who assist with the turbidity transects will charge their work time to the respective program’s budget. The amount of work time that staff spends on these types of non-MWQI funded activities is infrequent, and rarely impacts their normal workloads. MWQI Program staff members serve as DWR’s technical drinking water quality experts. Work done on non-MWQI projects is beneficial to DWR and is indirectly beneficial to the MWQI stakeholders.

Municipal Water Quality Investigations Program, January – December 2017 Work Plan
30
10. OTHER REQUIRED PROGRAM COSTS DWR’s Mobile Equipment Operation’s (MEO) provides insurance and fuel to support the vehicles used by the Field Support Section staff for their routine water quality assessment efforts. The MEO office staff will continue to support the MWQI Program by providing customer support through cost effective fleet management and maintenance of mobile equipment owned by DWR. In addition to fuel & insurance, this cost allocation allows for the recommended annual services on each vehicle at 6K and 12K, for miscellaneous incidental costs (such as towing, flat repair, etc.), and includes an amount for catastrophic repairs that the older vehicles may require. MEO expenditures are not assigned to any specific program element but are tracked and reported as MEO, line item 11.1, is in the column entitled "Operating Equipment and Expenses" in Table 1, and on the monthly expenditure reports. These monthly expenditure report will be provided as handouts prior to the monthly RTDF Steering Committee meetings.