Embed Size (px)
Citation preview

1
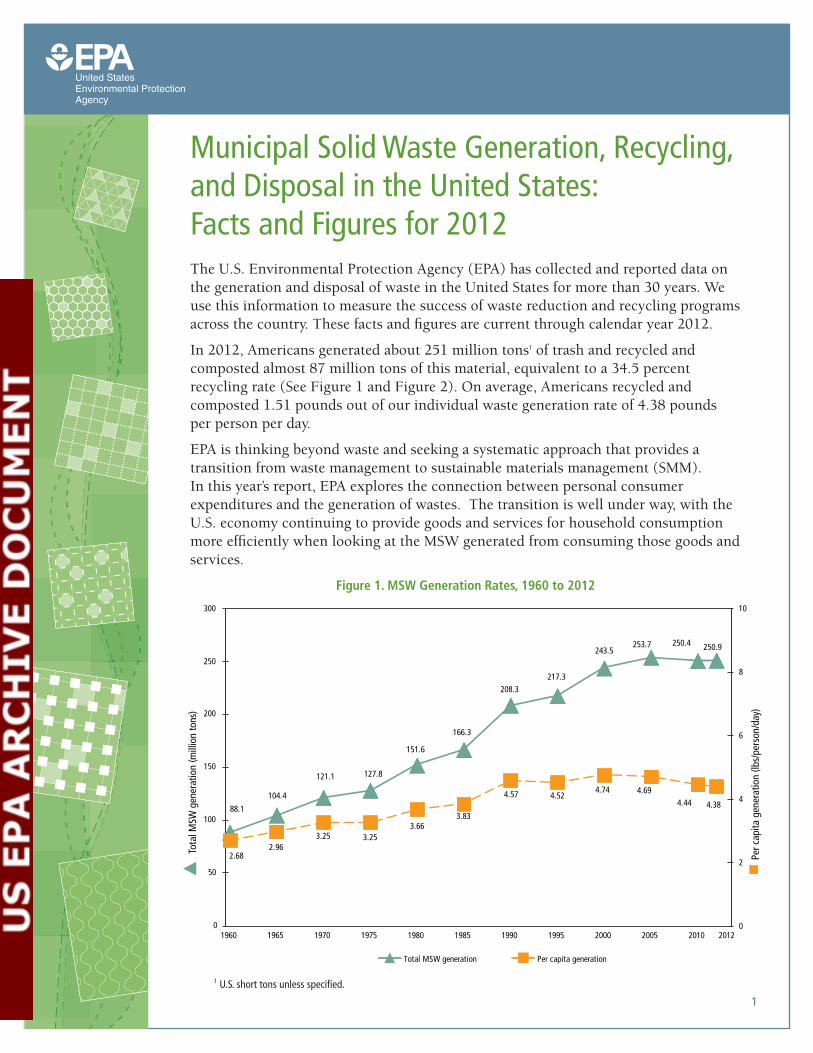
Municipal Solid Waste Generation, Recycling, and Disposal in the United States: Facts and Figures for 2012The U.S. Environmental Protection Agency (EPA) has collected and reported data on the generation and disposal of waste in the United States for more than 30 years. We use this information to measure the success of waste reduction and recycling programs across the country. These facts and figures are current through calendar year 2012.
In 2012, Americans generated about 251 million tons1 of trash and recycled and composted almost 87 million tons of this material, equivalent to a 34.5 percent recycling rate (See Figure 1 and Figure 2). On average, Americans recycled and composted 1.51 pounds out of our individual waste generation rate of 4.38 pounds per person per day.
EPA is thinking beyond waste and seeking a systematic approach that provides a transition from waste management to sustainable materials management (SMM). In this year’s report, EPA explores the connection between personal consumer expenditures and the generation of wastes. The transition is well under way, with the U.S. economy continuing to provide goods and services for household consumption more efficiently when looking at the MSW generated from consuming those goods and services.
1 U.S. short tons unless specified.
0
2
4
6
8
10
0
50
100
150
200
250
300
Per c
apita
gen
erat
ion
(lbs/
pers
on/d
ay)
Tota
l MSW
gen
erat
ion
(mill
ion
tons
)
Total MSW generation Per capita generation
88.1
104.4
121.1 127.8
151.6
166.3
208.3217.3
243.5253.7 250.4 250.9
2.682.96
3.25 3.253.66
3.83
4.57 4.524.74 4.69
4.44 4.38
1960 1965 1970 1975 1980 1985 1990 1995 2000 2005 2010 2012
Figure 1. MSW Generation Rates, 1960 to 2012
2
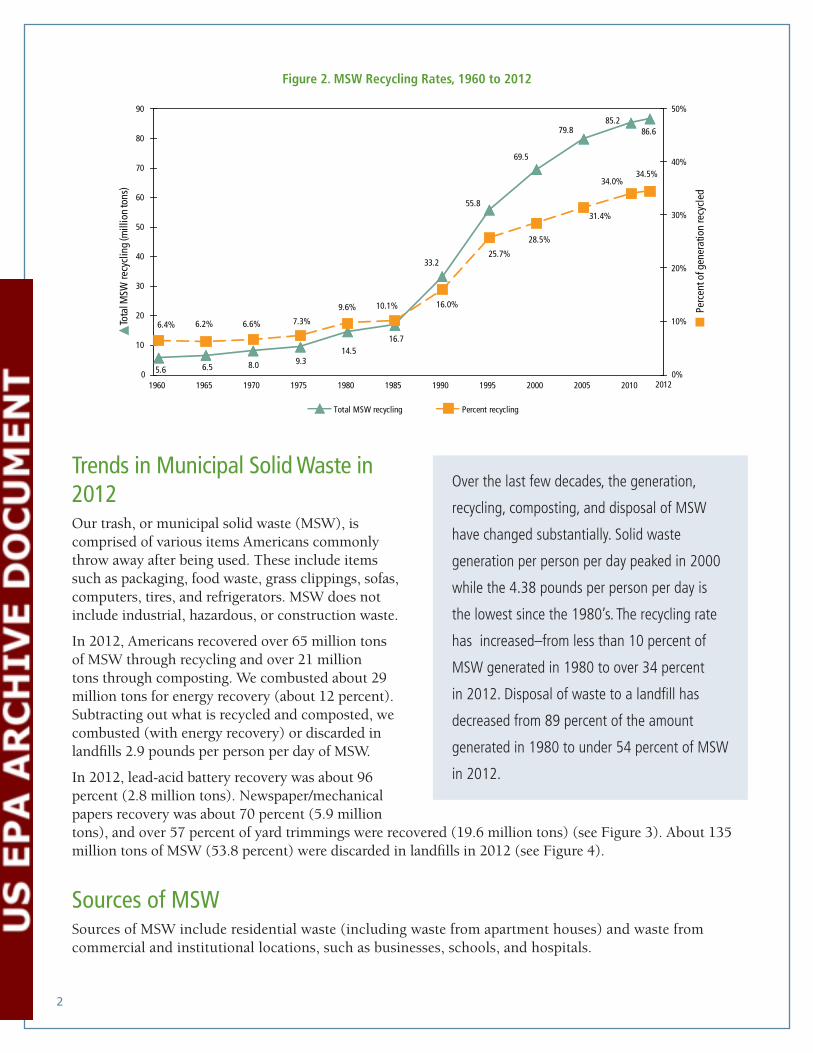
Over the last few decades, the generation,
recycling, composting, and disposal of MSW
have changed substantially. Solid waste
generation per person per day peaked in 2000
while the 4.38 pounds per person per day is
the lowest since the 1980’s. The recycling rate
has increased–from less than 10 percent of
MSW generated in 1980 to over 34 percent
in 2012. Disposal of waste to a landfill has
decreased from 89 percent of the amount
generated in 1980 to under 54 percent of MSW
in 2012.
Figure 2. MSW Recycling Rates, 1960 to 2012
Perc
ent o
f gen
erat
ion
recy
cled
Tota
l MSW
recy
clin
g (m
illio
n to
ns)
Total MSW recycling Percent recycling
5.6 6.5 8.0 9.314.5
16.7
33.2
55.8
69.5
79.885.2
86.6
6.4% 6.2% 6.6% 7.3%
9.6% 10.1% 16.0%
25.7%
28.5%
31.4%
34.0%34.5%
0%
10%
20%
30%
40%
50%
0
10
20
30
40
50
60
70
80
90
1960 1965 1970 1975 1980 1985 1990 1995 2000 2005 2010 2012
Trends in Municipal Solid Waste in 2012 Our trash, or municipal solid waste (MSW), is comprised of various items Americans commonly throw away after being used. These include items such as packaging, food waste, grass clippings, sofas, computers, tires, and refrigerators. MSW does not include industrial, hazardous, or construction waste.
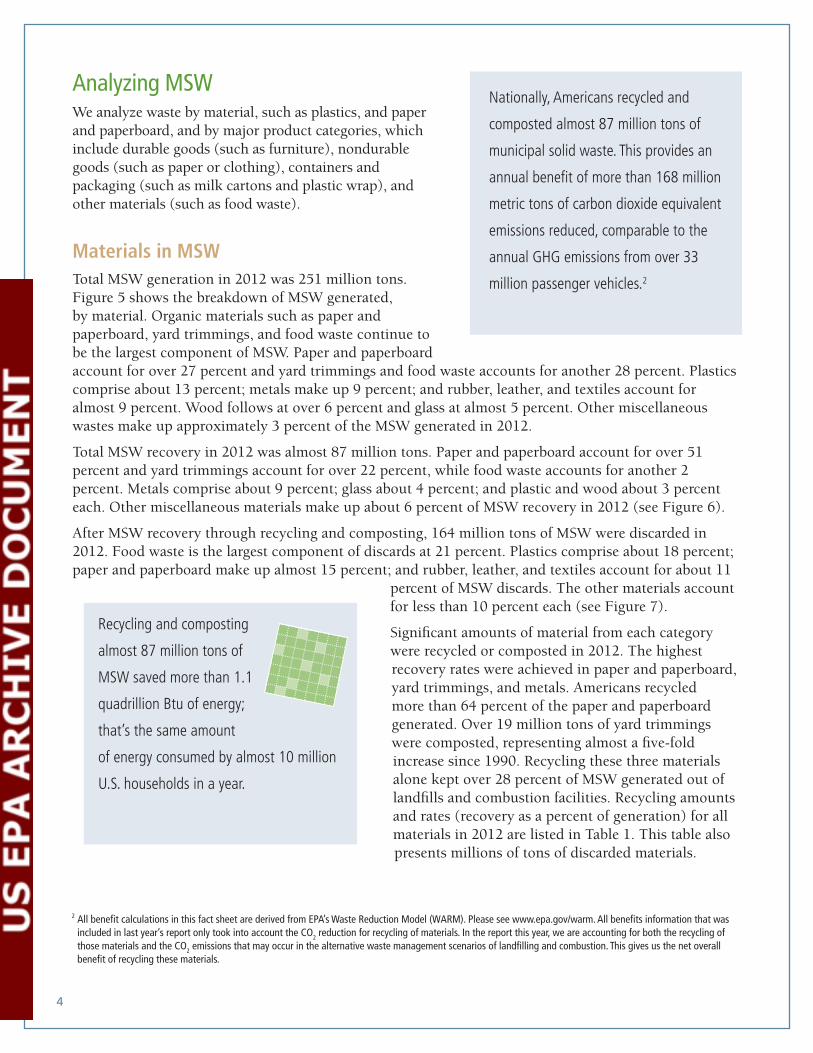
In 2012, Americans recovered over 65 million tons of MSW through recycling and over 21 million tons through composting. We combusted about 29 million tons for energy recovery (about 12 percent). Subtracting out what is recycled and composted, we combusted (with energy recovery) or discarded in landfills 2.9 pounds per person per day of MSW.
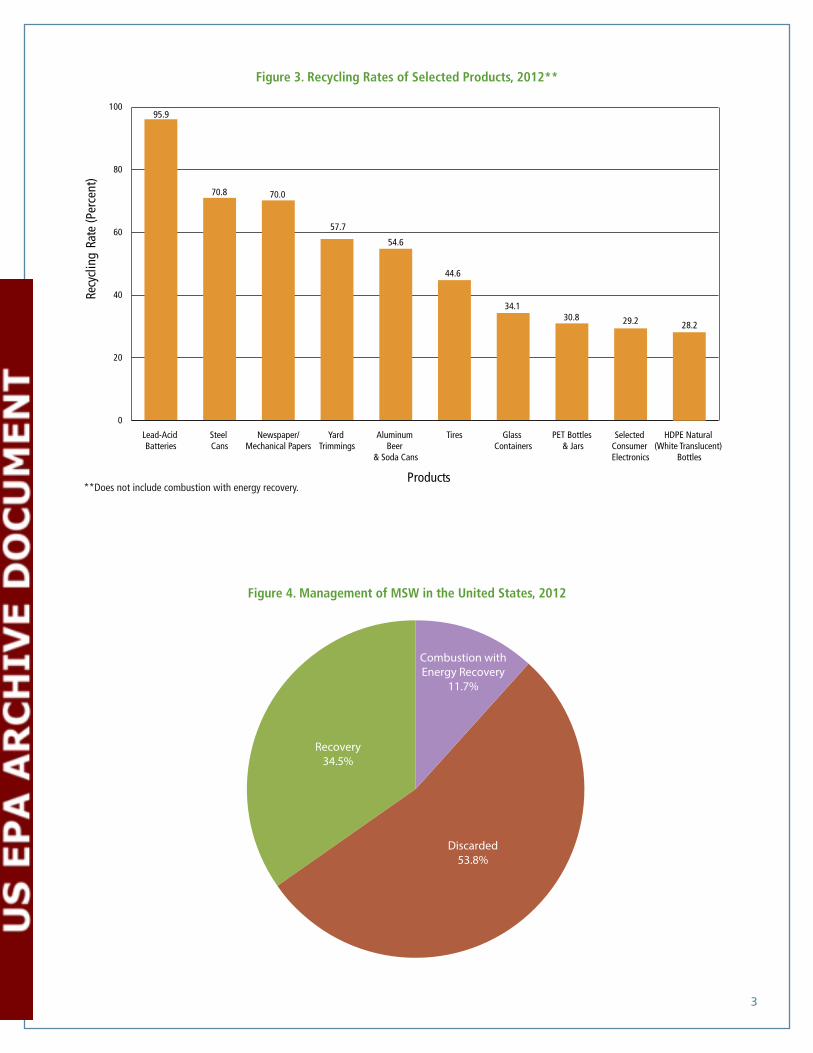
In 2012, lead-acid battery recovery was about 96 percent (2.8 million tons). Newspaper/mechanical papers recovery was about 70 percent (5.9 million tons), and over 57 percent of yard trimmings were recovered (19.6 million tons) (see Figure 3). About 135 million tons of MSW (53.8 percent) were discarded in landfills in 2012 (see Figure 4).
Sources of MSWSources of MSW include residential waste (including waste from apartment houses) and waste from commercial and institutional locations, such as businesses, schools, and hospitals.
3
Figure 3. Recycling Rates of Selected Products, 2012**
0
20
40
60
80
100
HDPE Natural (White Translucent)
Bottles
Selected Consumer Electronics
PET Bottles & Jars
Glass Containers
TiresAluminum Beer
& Soda Cans
Yard Trimmings
Newspaper/Mechanical Papers
Steel Cans
Lead-Acid Batteries
95.9
70.8 70.0
57.7
54.6
34.1
28.230.8
Recy
clin
g Ra
te (P
erce
nt)
Products
29.2
44.6
Figure 4. Management of MSW in the United States, 2012
Figure 4: Management of MSW in the United States, 2011
Recovery34.5%
Discarded53.8%
Combustion withEnergy Recovery
11.7%
**Does not include combustion with energy recovery.
4
Nationally, Americans recycled and
composted almost 87 million tons of
municipal solid waste. This provides an
annual benefit of more than 168 million
metric tons of carbon dioxide equivalent
emissions reduced, comparable to the
annual GHG emissions from over 33
million passenger vehicles.2
Analyzing MSWWe analyze waste by material, such as plastics, and paper and paperboard, and by major product categories, which include durable goods (such as furniture), nondurable goods (such as paper or clothing), containers and packaging (such as milk cartons and plastic wrap), and other materials (such as food waste).
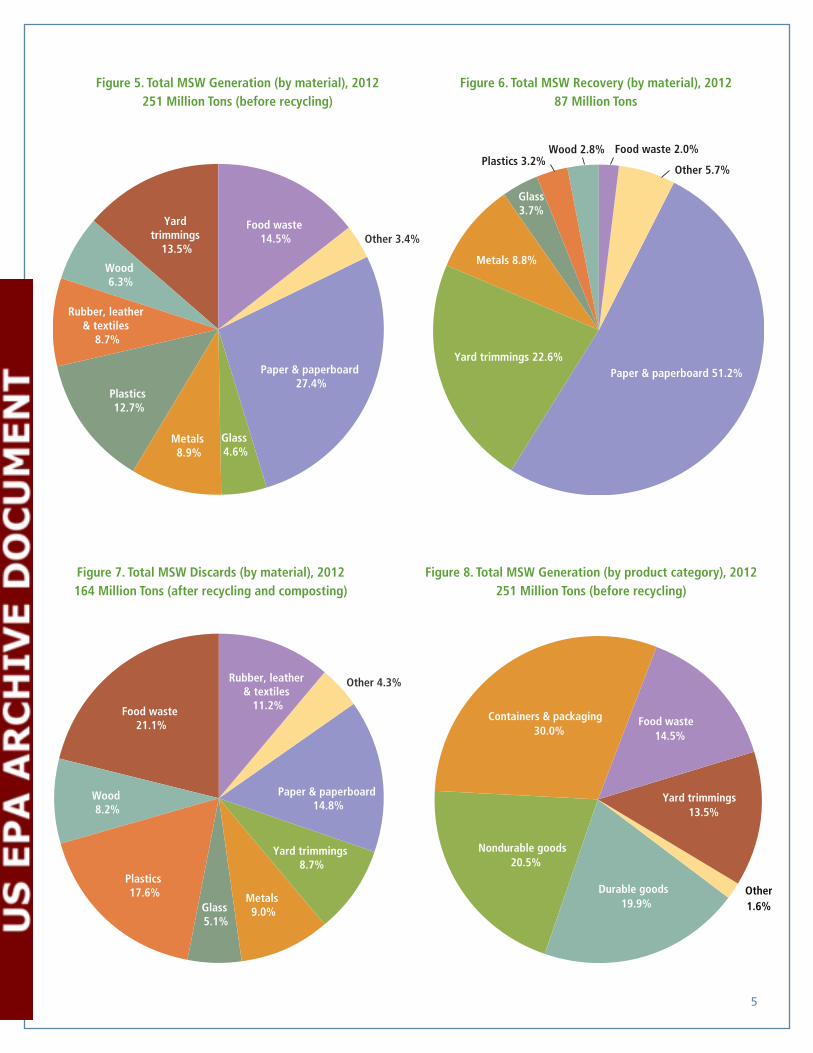
Materials in MSWTotal MSW generation in 2012 was 251 million tons. Figure 5 shows the breakdown of MSW generated, by material. Organic materials such as paper and paperboard, yard trimmings, and food waste continue to be the largest component of MSW. Paper and paperboard account for over 27 percent and yard trimmings and food waste accounts for another 28 percent. Plastics comprise about 13 percent; metals make up 9 percent; and rubber, leather, and textiles account for almost 9 percent. Wood follows at over 6 percent and glass at almost 5 percent. Other miscellaneous wastes make up approximately 3 percent of the MSW generated in 2012.
Total MSW recovery in 2012 was almost 87 million tons. Paper and paperboard account for over 51 percent and yard trimmings account for over 22 percent, while food waste accounts for another 2 percent. Metals comprise about 9 percent; glass about 4 percent; and plastic and wood about 3 percent each. Other miscellaneous materials make up about 6 percent of MSW recovery in 2012 (see Figure 6).
After MSW recovery through recycling and composting, 164 million tons of MSW were discarded in 2012. Food waste is the largest component of discards at 21 percent. Plastics comprise about 18 percent; paper and paperboard make up almost 15 percent; and rubber, leather, and textiles account for about 11
percent of MSW discards. The other materials account for less than 10 percent each (see Figure 7).
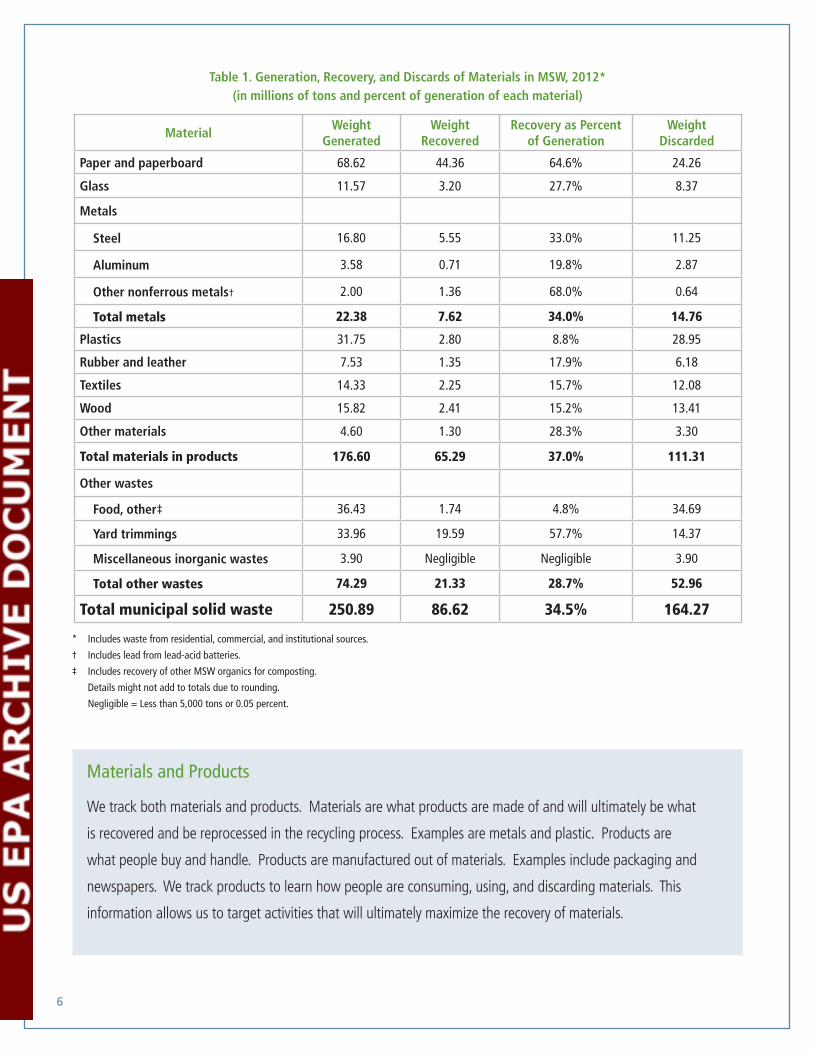
Significant amounts of material from each category were recycled or composted in 2012. The highest recovery rates were achieved in paper and paperboard, yard trimmings, and metals. Americans recycled more than 64 percent of the paper and paperboard generated. Over 19 million tons of yard trimmings were composted, representing almost a five-fold increase since 1990. Recycling these three materials alone kept over 28 percent of MSW generated out of landfills and combustion facilities. Recycling amounts and rates (recovery as a percent of generation) for all materials in 2012 are listed in Table 1. This table also presents millions of tons of discarded materials.
Recycling and composting
almost 87 million tons of
MSW saved more than 1.1
quadrillion Btu of energy;
that’s the same amount
of energy consumed by almost 10 million
U.S. households in a year.
Figure 7. Total MSW Discards (by material), 2012 164 Million Tons (after recycling and composting)
2 All benefit calculations in this fact sheet are derived from EPA’s Waste Reduction Model (WARM). Please see www.epa.gov/warm. All benefits information that was included in last year’s report only took into account the CO2 reduction for recycling of materials. In the report this year, we are accounting for both the recycling of those materials and the CO2 emissions that may occur in the alternative waste management scenarios of landfilling and combustion. This gives us the net overall benefit of recycling these materials.
5
Figure 5. Total MSW Generation (by material), 2012 251 Million Tons (before recycling)
Figure 5. Total MSW Generation (by material), 2012250 Million Tons (before recycling)
Yard trimmings
13.5%
Wood 6.3%
Rubber, leather & textiles
8.7%
Plastics 12.7%
Metals 8.9%
Glass 4.6%
Paper & paperboard 27.4%
Other 3.4%Food waste
14.5%
Figure 6. Total MSW Recovery (by material), 2012 87 Million Tons
Figure 6. Total MSW Recovery (by material), 2012
Wood 2.8%Plastics 3.2%
Glass3.7%
Metals 8.8%
Yard trimmings 22.6%Paper & paperboard 51.2%
Other 5.7%
Food waste 2.0%
Figure 7. Total MSW Discards (by material), 2012 164 Million Tons (after recycling and composting)
Figure 7. Total MSW Discards (by material), 2012
Food waste 21.1%
Wood 8.2%
Plastics 17.6%
Glass 5.1%
Metals 9.0%
Yard trimmings 8.7%
Paper & paperboard 14.8%
Other 4.3%Rubber, leather & textiles
11.2%
Figure 8. Total MSW Generation (by product category), 2012 251 Million Tons (before recycling)
Figure 8: Total MSW Generation (by category), 2012249.6 Million tons (before recycling)
Other1.6%
Containers & packaging 30.0%
Nondurable goods 20.5%
Food waste 14.5%
Yard trimmings 13.5%
Durable goods 19.9%
6
MaterialWeight
GeneratedWeight
RecoveredRecovery as Percent
of GenerationWeight
Discarded
Paper and paperboard 68.62 44.36 64.6% 24.26
Glass 11.57 3.20 27.7% 8.37
Metals
Steel 16.80 5.55 33.0% 11.25
Aluminum 3.58 0.71 19.8% 2.87
Other nonferrous metals† 2.00 1.36 68.0% 0.64
Total metals 22.38 7.62 34.0% 14.76
Plastics 31.75 2.80 8.8% 28.95
Rubber and leather 7.53 1.35 17.9% 6.18
Textiles 14.33 2.25 15.7% 12.08
Wood 15.82 2.41 15.2% 13.41
Other materials 4.60 1.30 28.3% 3.30
Total materials in products 176.60 65.29 37.0% 111.31
Other wastes
Food, other‡ 36.43 1.74 4.8% 34.69
Yard trimmings 33.96 19.59 57.7% 14.37
Miscellaneous inorganic wastes 3.90 Negligible Negligible 3.90
Total other wastes 74.29 21.33 28.7% 52.96
Total municipal solid waste 250.89 86.62 34.5% 164.27
Table 1. Generation, Recovery, and Discards of Materials in MSW, 2012* (in millions of tons and percent of generation of each material)
* Includes waste from residential, commercial, and institutional sources.
† Includes lead from lead-acid batteries.
‡ Includes recovery of other MSW organics for composting.
Details might not add to totals due to rounding.
Negligible = Less than 5,000 tons or 0.05 percent.
Materials and Products
We track both materials and products. Materials are what products are made of and will ultimately be what
is recovered and be reprocessed in the recycling process. Examples are metals and plastic. Products are
what people buy and handle. Products are manufactured out of materials. Examples include packaging and
newspapers. We track products to learn how people are consuming, using, and discarding materials. This
information allows us to target activities that will ultimately maximize the recovery of materials.
7
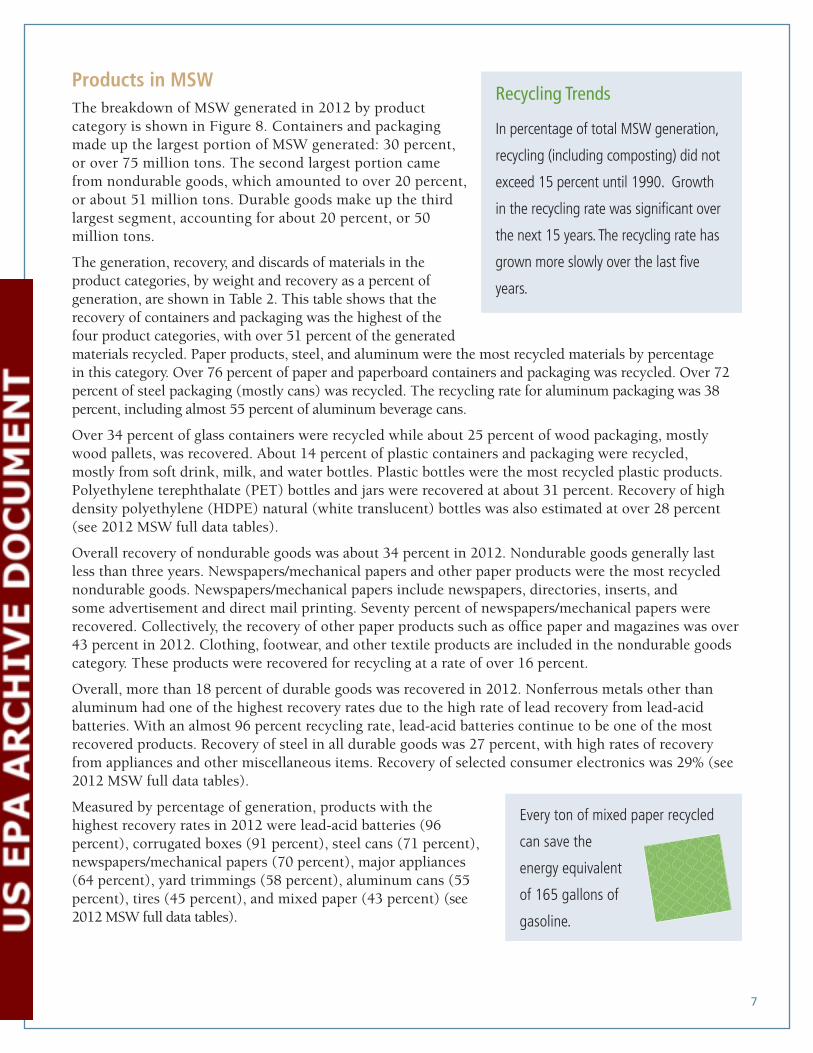
Recycling Trends
In percentage of total MSW generation,
recycling (including composting) did not
exceed 15 percent until 1990. Growth
in the recycling rate was significant over
the next 15 years. The recycling rate has
grown more slowly over the last five
years.
Products in MSWThe breakdown of MSW generated in 2012 by product category is shown in Figure 8. Containers and packaging made up the largest portion of MSW generated: 30 percent, or over 75 million tons. The second largest portion came from nondurable goods, which amounted to over 20 percent, or about 51 million tons. Durable goods make up the third largest segment, accounting for about 20 percent, or 50 million tons.
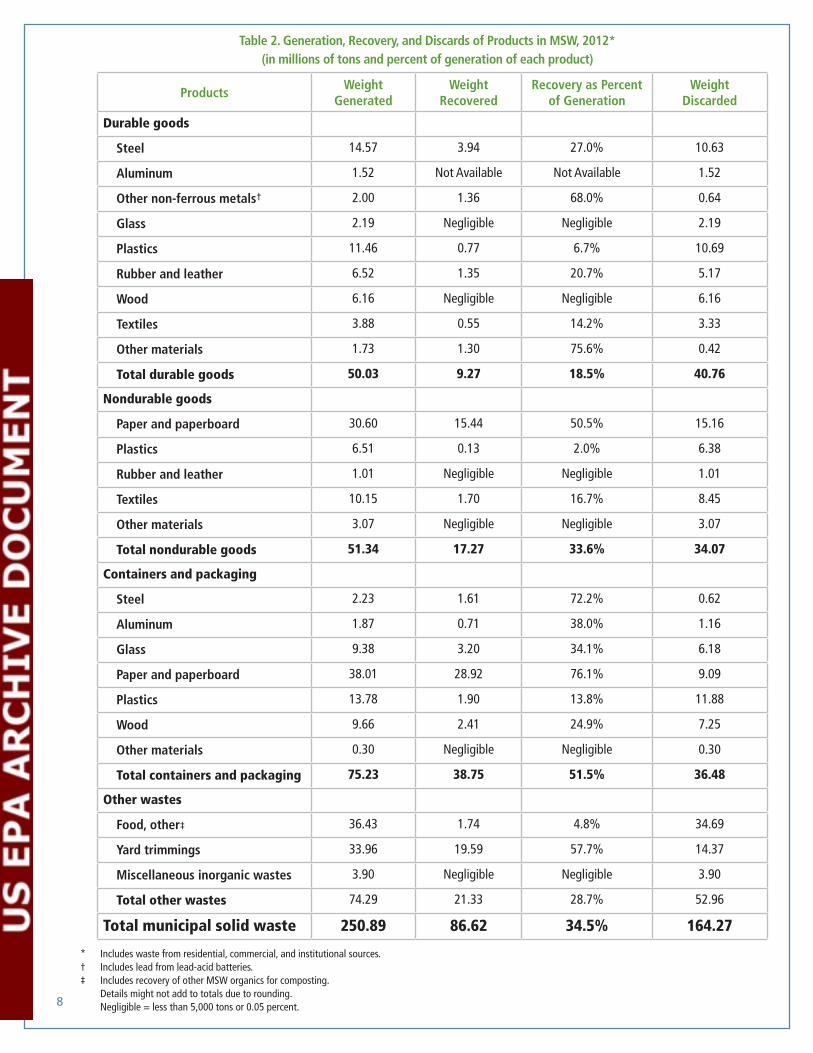
The generation, recovery, and discards of materials in the product categories, by weight and recovery as a percent of generation, are shown in Table 2. This table shows that the recovery of containers and packaging was the highest of the four product categories, with over 51 percent of the generated materials recycled. Paper products, steel, and aluminum were the most recycled materials by percentage in this category. Over 76 percent of paper and paperboard containers and packaging was recycled. Over 72 percent of steel packaging (mostly cans) was recycled. The recycling rate for aluminum packaging was 38 percent, including almost 55 percent of aluminum beverage cans.
Over 34 percent of glass containers were recycled while about 25 percent of wood packaging, mostly wood pallets, was recovered. About 14 percent of plastic containers and packaging were recycled, mostly from soft drink, milk, and water bottles. Plastic bottles were the most recycled plastic products. Polyethylene terephthalate (PET) bottles and jars were recovered at about 31 percent. Recovery of high density polyethylene (HDPE) natural (white translucent) bottles was also estimated at over 28 percent (see 2012 MSW full data tables).
Overall recovery of nondurable goods was about 34 percent in 2012. Nondurable goods generally last less than three years. Newspapers/mechanical papers and other paper products were the most recycled nondurable goods. Newspapers/mechanical papers include newspapers, directories, inserts, and some advertisement and direct mail printing. Seventy percent of newspapers/mechanical papers were recovered. Collectively, the recovery of other paper products such as office paper and magazines was over 43 percent in 2012. Clothing, footwear, and other textile products are included in the nondurable goods category. These products were recovered for recycling at a rate of over 16 percent.
Overall, more than 18 percent of durable goods was recovered in 2012. Nonferrous metals other than aluminum had one of the highest recovery rates due to the high rate of lead recov ery from lead-acid batteries. With an almost 96 percent recycling rate, lead-acid batteries continue to be one of the most recovered products. Recovery of steel in all durable goods was 27 percent, with high rates of recovery from appliances and other miscellaneous items. Recovery of selected consumer electronics was 29% (see 2012 MSW full data tables).
Measured by percentage of generation, products with the highest recovery rates in 2012 were lead-acid batteries (96 percent), corrugated boxes (91 percent), steel cans (71 percent), newspapers/mechanical papers (70 percent), major appliances (64 percent), yard trimmings (58 percent), aluminum cans (55 percent), tires (45 percent), and mixed paper (43 percent) (see 2012 MSW full data tables).
Every ton of mixed paper recycled
can save the
energy equivalent
of 165 gallons of
gasoline.
8
ProductsWeight
GeneratedWeight
RecoveredRecovery as Percent
of GenerationWeight
Discarded
Durable goods
Steel 14.57 3.94 27.0% 10.63
Aluminum 1.52 Not Available Not Available 1.52
Other non-ferrous metals† 2.00 1.36 68.0% 0.64
Glass 2.19 Negligible Negligible 2.19
Plastics 11.46 0.77 6.7% 10.69
Rubber and leather 6.52 1.35 20.7% 5.17
Wood 6.16 Negligible Negligible 6.16
Textiles 3.88 0.55 14.2% 3.33
Other materials 1.73 1.30 75.6% 0.42
Total durable goods 50.03 9.27 18.5% 40.76
Nondurable goods
Paper and paperboard 30.60 15.44 50.5% 15.16
Plastics 6.51 0.13 2.0% 6.38
Rubber and leather 1.01 Negligible Negligible 1.01
Textiles 10.15 1.70 16.7% 8.45
Other materials 3.07 Negligible Negligible 3.07
Total nondurable goods 51.34 17.27 33.6% 34.07
Containers and packaging
Steel 2.23 1.61 72.2% 0.62
Aluminum 1.87 0.71 38.0% 1.16
Glass 9.38 3.20 34.1% 6.18
Paper and paperboard 38.01 28.92 76.1% 9.09
Plastics 13.78 1.90 13.8% 11.88
Wood 9.66 2.41 24.9% 7.25
Other materials 0.30 Negligible Negligible 0.30
Total containers and packaging 75.23 38.75 51.5% 36.48
Other wastes
Food, other‡ 36.43 1.74 4.8% 34.69
Yard trimmings 33.96 19.59 57.7% 14.37
Miscellaneous inorganic wastes 3.90 Negligible Negligible 3.90
Total other wastes 74.29 21.33 28.7% 52.96
Total municipal solid waste 250.89 86.62 34.5% 164.27
Table 2. Generation, Recovery, and Discards of Products in MSW, 2012* (in millions of tons and percent of generation of each product)
* Includes waste from residential, commercial, and institutional sources.† Includes lead from lead-acid batteries.‡ Includes recovery of other MSW organics for composting. Details might not add to totals due to rounding. Negligible = less than 5,000 tons or 0.05 percent.
9
Activity 1960 1970 1980 1990 2000 2005 2008 2010 2011 2012
Generation 88.1 121.1 151.6 208.3 243.5 253.7 252.5 250.4 250.4 250.9
Recovery for recycling
5.6 8.0 14.5 29.0 53.0 59.2 61.9 65.0 66.3 65.3
Recovery for composting*
Negligible Negligible Negligible 4.2 16.5 20.6 22.1 20.2 20.6 21.3
Total materials recovery
5.6 8.0 14.5 33.2 69.5 79.8 84.0 85.2 86.9 86.6
Discards after recovery
82.5 113.0 137.1 175.0 174.0 173.9 168.5 165.3 163.5 164.3
Combustion with energy recovery†
0.0 0.4 2.7 29.7 33.7 31.6 31.6 29.3 29.3 29.3
Discards to landfill, other disposal‡
82.5 112.6 134.4 145.3 140.3 142.3 136.9 136.0 134.2 135.0
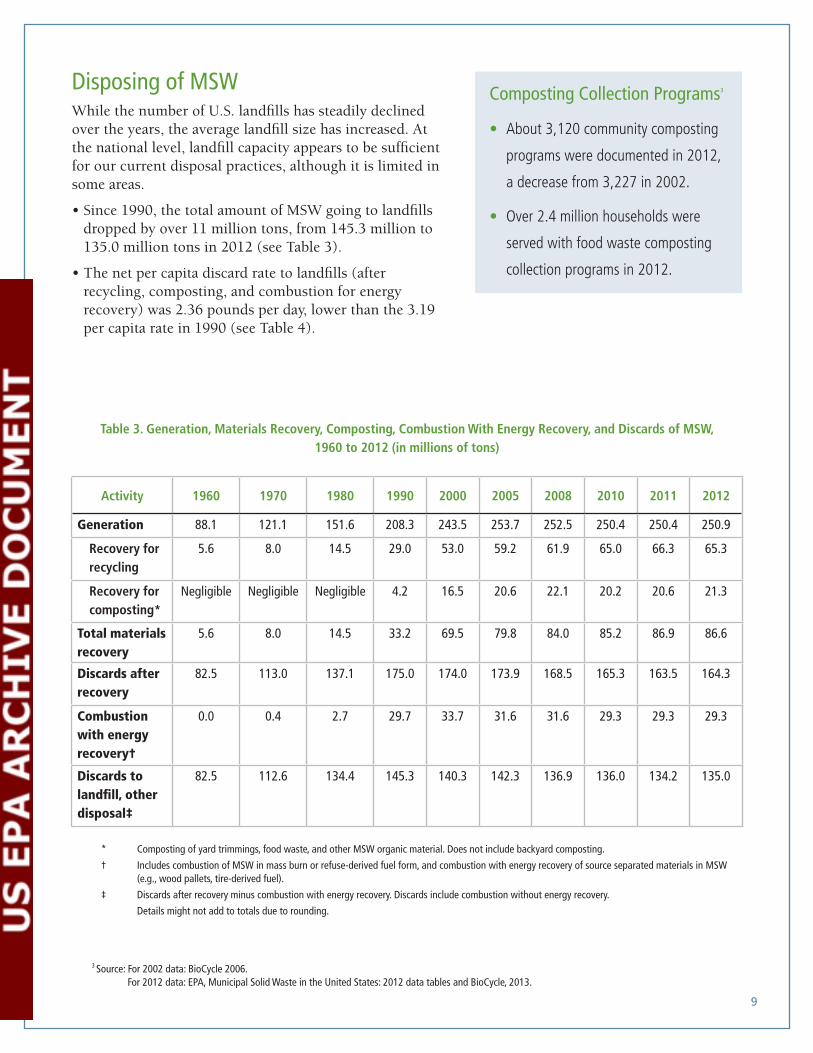
Table 3. Generation, Materials Recovery, Composting, Combustion With Energy Recovery, and Discards of MSW, 1960 to 2012 (in millions of tons)
* Composting of yard trimmings, food waste, and other MSW organic material. Does not include backyard composting.
† Includes combustion of MSW in mass burn or refuse-derived fuel form, and combustion with energy recovery of source separated materials in MSW (e.g., wood pallets, tire-derived fuel).
‡ Discards after recovery minus combustion with energy recovery. Discards include combustion without energy recovery.
Details might not add to totals due to rounding.
Disposing of MSWWhile the number of U.S. landfills has steadily declined over the years, the average landfill size has increased. At the national level, landfill capacity appears to be sufficient for our current disposal practices, although it is limited in some areas.
• Since 1990, the total amount of MSW going to landfills dropped by over 11 million tons, from 145.3 mil lion to 135.0 million tons in 2012 (see Table 3).
• The net per capita discard rate to landfills (after recycling, composting, and combustion for energy recovery) was 2.36 pounds per day, lower than the 3.19 per capita rate in 1990 (see Table 4).
3 Source: For 2002 data: BioCycle 2006. For 2012 data: EPA, Municipal Solid Waste in the United States: 2012 data tables and BioCycle, 2013.
Composting Collection Programs3
• About 3,120 community composting
programs were documented in 2012,
a decrease from 3,227 in 2002.
• Over 2.4 million households were
served with food waste composting
collection programs in 2012.
10
Activity 1960 1970 1980 1990 2000 2005 2008 2010 2011 2012
Generation 2.68 3.25 3.66 4.57 4.74 4.69 4.55 4.44 4.40 4.38
Recovery for recycling
0.17 0.22 0.35 0.64 1.03 1.10 1.12 1.15 1.17 1.14
Recovery for composting*
Negligible Negligible Negligible 0.09 0.32 0.38 0.40 0.36 0.36 0.37
Total Materials Recovery
0.17 0.22 0.35 0.73 1.35 1.48 1.52 1.51 1.53 1.51
Discards after recovery
2.51 3.03 3.31 3.84 3.39 3.21 3.03 2.93 2.87 2.87
Combustion with energy recovery†
0.00 0.01 0.07 0.65 0.66 0.58 0.57 0.52 0.51 0.51
Discards to landfill, other disposal‡
2.51 3.02 3.24 3.19 2.73 2.63 2.46 2.41 2.36 2.36
Population (millions)
179.979 203.984 227.255 249.907 281.422 296.410 304.060 309.051 311.592 313.914
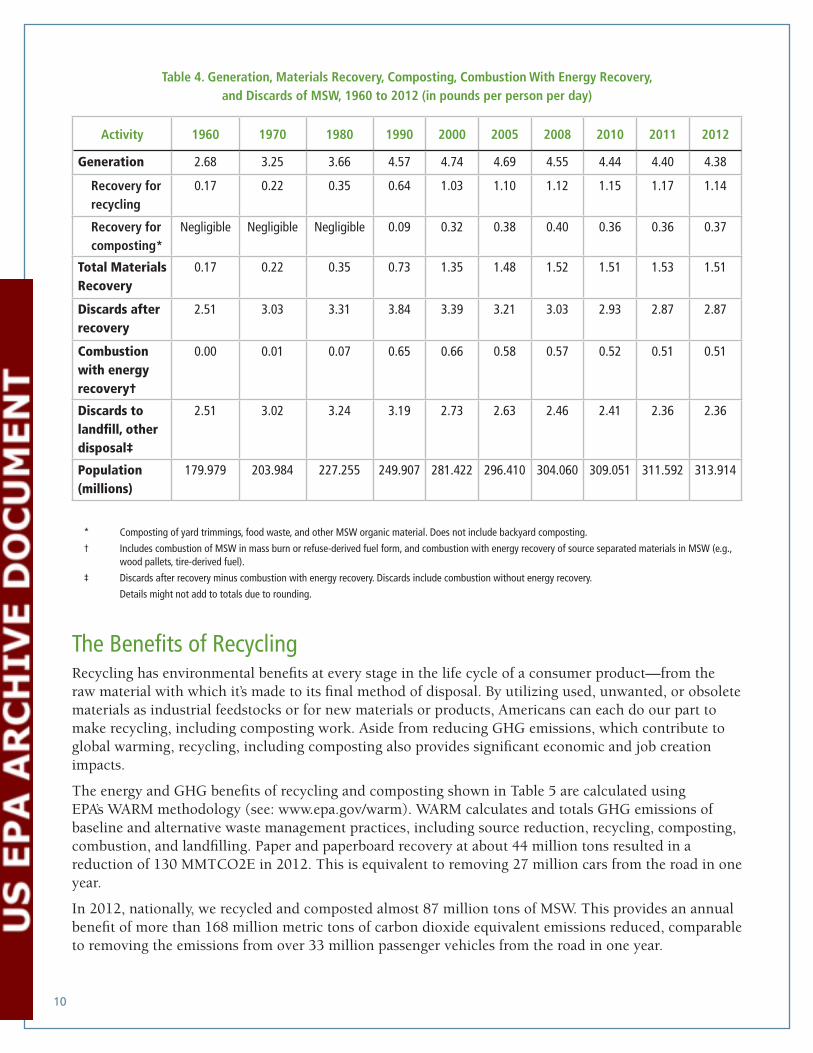
Table 4. Generation, Materials Recovery, Composting, Combustion With Energy Recovery, and Discards of MSW, 1960 to 2012 (in pounds per person per day)
* Composting of yard trimmings, food waste, and other MSW organic material. Does not include backyard composting.
† Includes combustion of MSW in mass burn or refuse-derived fuel form, and combustion with energy recovery of source separated materials in MSW (e.g., wood pallets, tire-derived fuel).
‡ Discards after recovery minus combustion with energy recovery. Discards include combustion without energy recovery.
Details might not add to totals due to rounding.
The Benefits of RecyclingRecycling has environmental benefits at every stage in the life cycle of a consumer product—from the raw material with which it’s made to its final method of disposal. By utilizing used, unwanted, or obsolete materials as industrial feedstocks or for new materials or products, Americans can each do our part to make recycling, including composting work. Aside from reducing GHG emissions, which contribute to global warming, recycling, including composting also provides significant economic and job creation impacts.
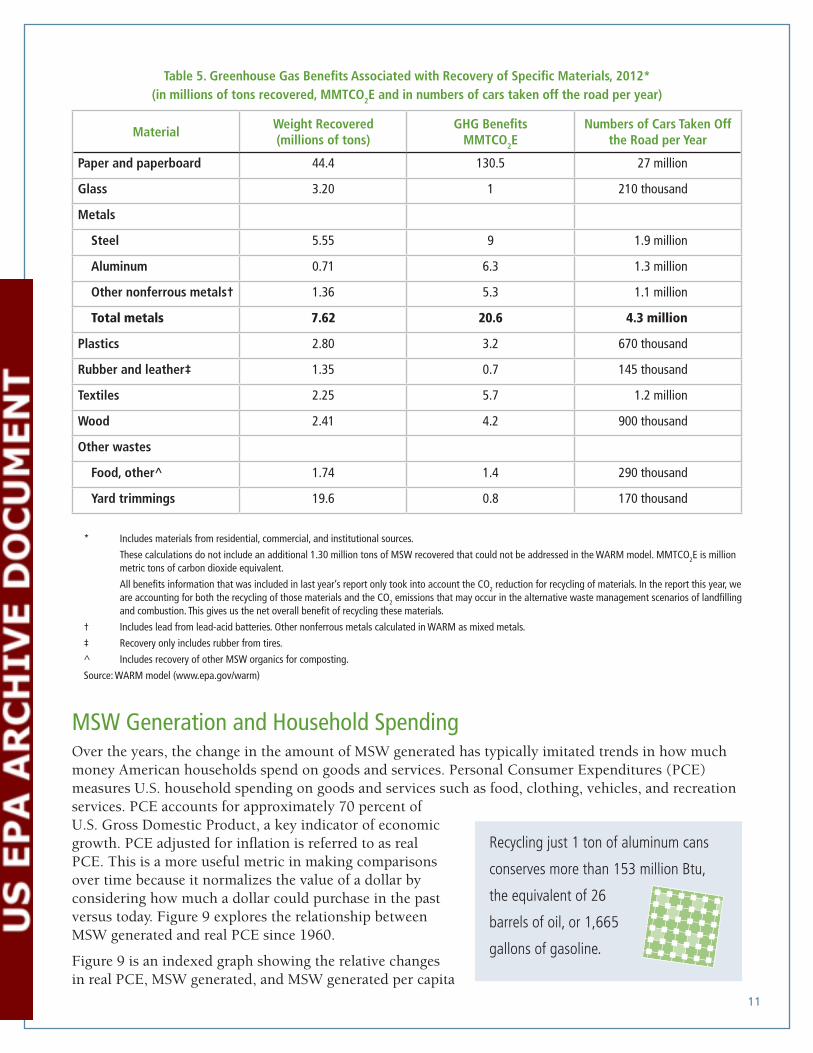
The energy and GHG benefits of recycling and composting shown in Table 5 are calculated using EPA’s WARM methodology (see: www.epa.gov/warm). WARM calculates and totals GHG emissions of baseline and alternative waste management practices, including source reduction, recycling, composting, combustion, and landfilling. Paper and paperboard recovery at about 44 million tons resulted in a reduction of 130 MMTCO2E in 2012. This is equivalent to removing 27 million cars from the road in one year.
In 2012, nationally, we recycled and composted almost 87 million tons of MSW. This provides an annual benefit of more than 168 million metric tons of carbon dioxide equivalent emissions reduced, comparable to removing the emissions from over 33 million passenger vehicles from the road in one year.
11
MaterialWeight Recovered (millions of tons)
GHG Benefits MMTCO2E
Numbers of Cars Taken Off the Road per Year
Paper and paperboard 44.4 130.5 27 million
Glass 3.20 1 210 thousand
Metals
Steel 5.55 9 1.9 million
Aluminum 0.71 6.3 1.3 million
Other nonferrous metals† 1.36 5.3 1.1 million
Total metals 7.62 20.6 4.3 million
Plastics 2.80 3.2 670 thousand
Rubber and leather‡ 1.35 0.7 145 thousand
Textiles 2.25 5.7 1.2 million
Wood 2.41 4.2 900 thousand
Other wastes
Food, other^ 1.74 1.4 290 thousand
Yard trimmings 19.6 0.8 170 thousand
Table 5. Greenhouse Gas Benefits Associated with Recovery of Specific Materials, 2012* (in millions of tons recovered, MMTCO2E and in numbers of cars taken off the road per year)
* Includes materials from residential, commercial, and institutional sources.
These calculations do not include an additional 1.30 million tons of MSW recovered that could not be addressed in the WARM model. MMTCO2E is million metric tons of carbon dioxide equivalent.
All benefits information that was included in last year’s report only took into account the CO2 reduction for recycling of materials. In the report this year, we are accounting for both the recycling of those materials and the CO2 emissions that may occur in the alternative waste management scenarios of landfilling and combustion. This gives us the net overall benefit of recycling these materials.
† Includes lead from lead-acid batteries. Other nonferrous metals calculated in WARM as mixed metals.
‡ Recovery only includes rubber from tires.
^ Includes recovery of other MSW organics for composting.
Source: WARM model (www.epa.gov/warm)
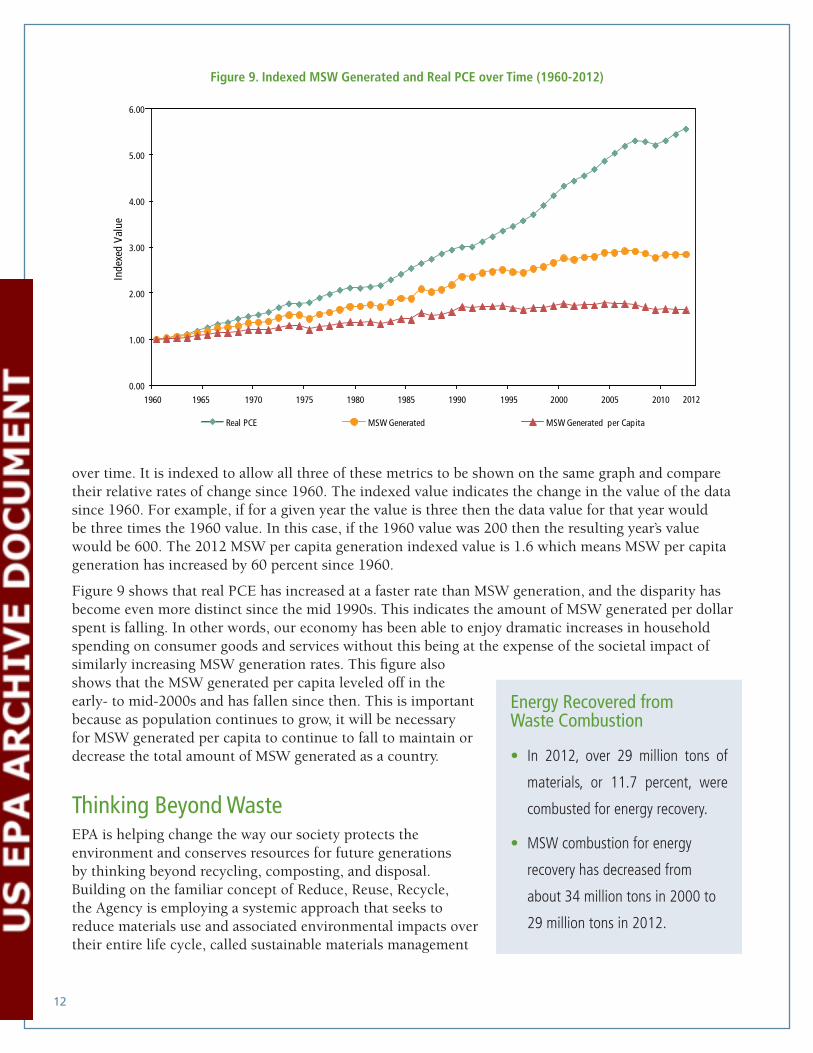
MSW Generation and Household SpendingOver the years, the change in the amount of MSW generated has typically imitated trends in how much money American households spend on goods and services. Personal Consumer Expenditures (PCE) measures U.S. household spending on goods and services such as food, clothing, vehicles, and recreation services. PCE accounts for approximately 70 percent of U.S. Gross Domestic Product, a key indicator of economic growth. PCE adjusted for inflation is referred to as real PCE. This is a more useful metric in making comparisons over time because it normalizes the value of a dollar by considering how much a dollar could purchase in the past versus today. Figure 9 explores the relationship between MSW generated and real PCE since 1960.
Figure 9 is an indexed graph showing the relative changes in real PCE, MSW generated, and MSW generated per capita
Recycling just 1 ton of aluminum cans
conserves more than 153 million Btu,
the equivalent of 26
barrels of oil, or 1,665
gallons of gasoline.
12
Energy Recovered from Waste Combustion
• In 2012, over 29 million tons of
materials, or 11.7 percent, were
combusted for energy recovery.
• MSW combustion for energy
recovery has decreased from
about 34 million tons in 2000 to
29 million tons in 2012.
Figure 9. Indexed MSW Generated and Real PCE over Time (1960-2012)
Inde
xed
Valu
e
Real PCE MSW Generated MSW Generated per Capita
0.00
1.00
2.00
3.00
4.00
5.00
6.00
1960 1965 1970 1975 1980 1985 1990 1995 2000 2005 2010
Figure 9. Indexed MSW Generated and Real PCE over Time (1960-2012)
2012
over time. It is indexed to allow all three of these metrics to be shown on the same graph and compare their relative rates of change since 1960. The indexed value indicates the change in the value of the data since 1960. For example, if for a given year the value is three then the data value for that year would be three times the 1960 value. In this case, if the 1960 value was 200 then the resulting year’s value would be 600. The 2012 MSW per capita generation indexed value is 1.6 which means MSW per capita generation has increased by 60 percent since 1960.
Figure 9 shows that real PCE has increased at a faster rate than MSW generation, and the disparity has become even more distinct since the mid 1990s. This indicates the amount of MSW generated per dollar spent is falling. In other words, our economy has been able to enjoy dramatic increases in household spending on consumer goods and services without this being at the expense of the societal impact of similarly increasing MSW generation rates. This figure also shows that the MSW generated per capita leveled off in the early- to mid-2000s and has fallen since then. This is important because as population continues to grow, it will be necessary for MSW generated per capita to continue to fall to maintain or decrease the total amount of MSW generated as a country.
Thinking Beyond WasteEPA is helping change the way our society protects the environment and conserves resources for future generations by thinking beyond recycling, composting, and disposal. Building on the familiar concept of Reduce, Reuse, Recycle, the Agency is employing a systemic approach that seeks to reduce materials use and associated environmental impacts over their entire life cycle, called sustainable materials management
13
(SMM). This starts with extraction of natural resources and material processing through product design and manufacturing then the product use stage followed by collection/processing and final end of life (disposal). By examining how materials are used throughout their life cycle, an SMM approach seeks to use materials in the most productive way with an emphasis on using less; reducing toxic chemicals and environmental impacts throughout the material’s life cycle; and assuring we have sufficient resources to meet today’s needs and those of the future. Data on municipal solid waste generation, recycling and disposal is an important starting point for the full SMM approach.
ResourcesThe data summarized in this fact sheet characterizes the MSW stream as a whole by using a materials flow methodology that relies on a mass balance approach. For example, to determine the amounts of paper recycled, information is gathered on the amounts processed by paper mills and made into new paper on a national basis plus recycled paper exported, instead of counting paper collected for recycling on a state-by-state basis. Using data gathered from industry associations, businesses, and government sources, such as the U.S. Department of Commerce and the U.S. Census Bureau, we estimate tons of materials and products gener ated, recycled, and discarded. Other sources of data, such as waste characterizations and research reports performed by governments, industry, or the press, supplement these data.
The benefits of recycling and composting, such as elimination of GHG emissions, are calculated using EPA’s WARM methodology. WARM calculates and totals GHG emissions of baseline and alternative waste management practices including source reduction, recycling, composting, combustion, and landfilling. The model calculates emissions in metric tons of carbon equivalent (MTCE), metric tons of carbon dioxide equivalent (MTCO
2E), and energy units (million Btu) across a wide range of material
types commonly found in MSW. EPA developed GHG emissions reduction factors through a life-cycle assessment methodology. Please see: www.epa.gov/warm.
Full data tables on MSW characterization that support this Report and Summaries of the MSW characterization methodology and WARM are available on the EPA website along with information about waste reduction and recycling. Please see:
www.epa.gov/epawaste/nonhaz/municipal/msw99.htm
www.epa.gov/recycle
United States Environmental Protection AgencySolid Waste and Emergency Response (5306P)Washington, DC 20460
Official BusinessPenalty for Private Use $300
EPA-530-F-14-001February 2014www.epa.gov/wastes