Embed Size (px)
Citation preview
Municipal Secondary Market Disclosure Information Cover Sheet This cover sheet should be sent with all submissions made to the Municipal Securities Rulemaking Board, Nationally Recognized Municipal Securities Information Repositories, and any applicable State Information Depository, whether the filing is voluntary or made pursuant to Securities and Exchange Commission rule 15c2-12 or any analogous state statute.
See www.sec.gov/info/municipal/nrmsir.htm for list of current NRMSIRs and SIDs
IF THIS FILING RELATES TO ALL SECURITIES ISSUED BY THE ISSUER OR ALL SECURITIES OF A SPECIFIC CREDIT OR ISSUED UNDER A SINGLE INDENTURE:
Issuer’s Name (please include name of state where Issuer is located): COMMUNITY FACILITIES DISTRICT NO. 1 (MIRAMAR RANCH NORTH) (STATE: CALIFORNIA) COMMUNITY FACILITIES DISTRICT NO. 1 (MIRAMAR RANCH NORTH) OF THE CITY OF SAN DIEGO SPECIAL TAX REFUNDING BONDS, SERIES 1998
Other Obligated Person’s Name (if any): ______________________________________________________________________ (Exactly as it appears on the Official Statement Cover)
Provide six-digit CUSIP* number(s), if available, of Issuer:
Community Facilities District No. 1 of the City of San Diego CUSIP: 797316 *(Contact CUSIP’s Municipal Disclosure Assistance Line at 212.438.6518 for assistance with obtaining the proper CUSIP numbers.)
Issuer’s Name (please include name of state where Issuer is located):
COMMUNITY FACILITIES DISTRICT NO. 2 (SANTALUZ) (STATE: CALIFORNIA) COMMUNITY FACILITIES DISTRICT NO. 2 (SANTALUZ) IMPROVEMENT AREA NO. 1 SPECIAL TAX BONDS SERIES A OF 2000
COMMUNITY FACILITIES DISTRICT NO. 2 (SANTALUZ) IMPROVEMENT AREA NO. 1 SPECIAL TAX BONDS SERIES A OF 2004
Other Obligated Person’s Name (if any): ______________________________________________________________________ (Exactly as it appears on the Official Statement Cover)
Provide six-digit CUSIP* number(s), if available, of Issuer:
Community Facilities District No. 2 CUSIP: 802808 *(Contact CUSIP’s Municipal Disclosure Assistance Line at 212.438.6518 for assistance with obtaining the proper CUSIP numbers.)
Issuer’s Name (please include name of state where Issuer is located):
COMMUNITY FACILITIES DISTRICT NO. 2 (SANTALUZ) (STATE: CALIFORNIA) COMMUNITY FACILITIES DISTRICT NO. 2 (SANTALUZ) IMPROVEMENT AREA NO. 3 SPECIAL TAX BONDS SERIES B OF 2000
Other Obligated Person’s Name (if any): ______________________________________________________________________ (Exactly as it appears on the Official Statement Cover)
Provide six-digit CUSIP* number(s), if available, of Issuer:
Community Facilities District No. 2 CUSIP: 802808
*(Contact CUSIP’s Municipal Disclosure Assistance Line at 212.438.6518 for assistance with obtaining the proper CUSIP numbers.)
Issuer’s Name (please include name of state where Issuer is located):
COMMUNITY FACILITIES DISTRICT NO. 2 (SANTALUZ) (STATE: CALIFORNIA) COMMUNITY FACILITIES DISTRICT NO. 2 (SANTALUZ) IMPROVEMENT AREA NO. 4 SPECIAL TAX BONDS SERIES A OF 2004
Other Obligated Person’s Name (if any): ______________________________________________________________________ (Exactly as it appears on the Official Statement Cover)
Provide six-digit CUSIP* number(s), if available, of Issuer:
Community Facilities District No. 2 CUSIP: 802808 *(Contact CUSIP’s Municipal Disclosure Assistance Line at 212.438.6518 for assistance with obtaining the proper CUSIP numbers.)
Issuer’s Name (please include name of state where Issuer is located):
CITY OF SAN DIEGO (CALIFORNIA) ASSESSMENT DISTRICT No. 4096 (PIPER RANCH)
LIMITED OBLIGATION IMPROVEMENT BONDS
Provide nine-digit CUSIP* numbers if available, to which the information relates:
Assessment District No. 4096 CUSIP: 797283 *(Contact CUSIP’s Municipal Disclosure Assistance Line at 212.438.6518 for assistance with obtaining the proper CUSIP numbers.)
Issuer’s Name (please include name of state where Issuer is located): CITY OF SAN DIEGO (STATE: CALIFORNIA) CITY OF SAN DIEGO REASSESSMENT DISTRICT NO. 2003-1 LIMITED OBLIGATION REFUNDING BONDS
Other Obligated Person’s Name (if any): ______________________________________________________________________ (Exactly as it appears on the Official Statement Cover)
Provide six-digit CUSIP* number(s), if available, of Issuer: 797283
*
(Contact CUSIP’s Municipal Disclosure Assistance Line at 212.438.6518 for assistance with obtaining the proper CUSIP numbers.)
Issuer’s Name (please include name of state where Issuer is located):
PUBLIC FACILITIES FINANCING AUTHORITY OF THE CITY OF SAN DIEGO, CALIFORNIA
(STATE: CALIFORNIA)
REFUNDING REVENUE BONDS (REASSESSMENT DISTRICT NO. 1999-1) SERIES 1999-A SENIOR LIEN BONDS REFUNDING REVENUE BONDS (REASSESSMENT DISTRICT NO. 1999-1) SERIES 1999-B SUBORDINATE LIEN BONDS
Other Obligated Person’s Name (if any): ______________________________________________________________________ (Exactly as it appears on the Official Statement Cover)
Provide six-digit CUSIP* number(s), if available, of Issuer: 79729P *(Contact CUSIP’s Municipal Disclosure Assistance Line at 212.438.6518 for assistance with obtaining the proper CUSIP numbers.)
TYPE OF FILING:
X Electronic Paper (no. of pages attached) If information is also available on the Internet, give URL: NOT AVAILABLE _____________________________
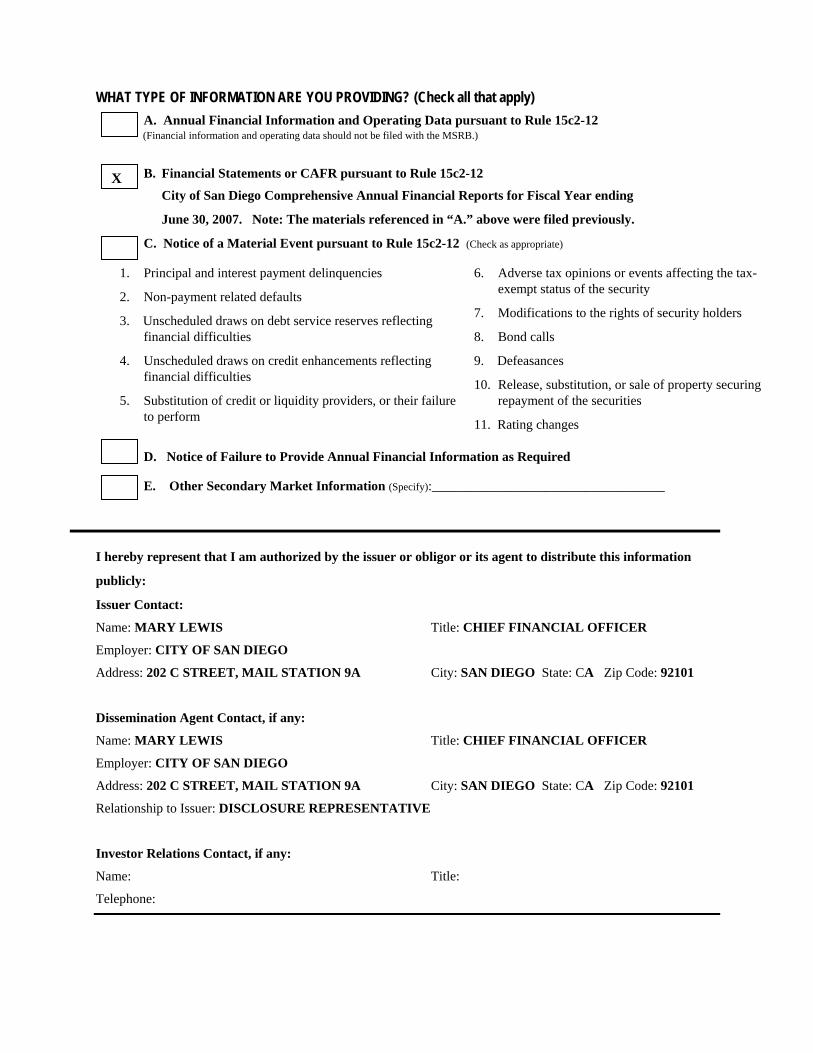
WHAT TYPE OF INFORMATION ARE YOU PROVIDING? (Check all that apply) A. Annual Financial Information and Operating Data pursuant to Rule 15c2-12
(Financial information and operating data should not be filed with the MSRB.)
B. Financial Statements or CAFR pursuant to Rule 15c2-12
City of San Diego Comprehensive Annual Financial Reports for Fiscal Year ending
June 30, 2007. Note: The materials referenced in “A.” above were filed previously.
C. Notice of a Material Event pursuant to Rule 15c2-12 (Check as appropriate)
D. Notice of Failure to Provide Annual Financial Information as Required
E. Other Secondary Market Information (Specify):___________________________________
1. Principal and interest payment delinquencies
2. Non-payment related defaults
3. Unscheduled draws on debt service reserves reflecting financial difficulties
4. Unscheduled draws on credit enhancements reflecting financial difficulties
5. Substitution of credit or liquidity providers, or their failure to perform
6. Adverse tax opinions or events affecting the tax-exempt status of the security
7. Modifications to the rights of security holders
8. Bond calls
9. Defeasances
10. Release, substitution, or sale of property securing repayment of the securities
11. Rating changes
X
I hereby represent that I am authorized by the issuer or obligor or its agent to distribute this information
publicly:
Issuer Contact:
Name: MARY LEWIS Title: CHIEF FINANCIAL OFFICER
Employer: CITY OF SAN DIEGO
Address: 202 C STREET, MAIL STATION 9A City: SAN DIEGO State: CA Zip Code: 92101
Dissemination Agent Contact, if any:
Name: MARY LEWIS Title: CHIEF FINANCIAL OFFICER
Employer: CITY OF SAN DIEGO
Address: 202 C STREET, MAIL STATION 9A City: SAN DIEGO State: CA Zip Code: 92101
Relationship to Issuer: DISCLOSURE REPRESENTATIVE
Investor Relations Contact, if any:
Name: Title:
Telephone:
Fiscal Year Ended June 30, 2007
Comprehensive Annual Financial Report
City of San DiegoState of California

This Page Left Intentionally Blank
2
CITY OF SAN DIEGO STATE OF CALIFORNIA
COMPREHENSIVE ANNUAL FINANCIAL REPORT
FOR THE FISCAL YEAR ENDED JUNE 30, 2007
Prepared Under the Supervision of Gregory Levin, CPA
Comptroller
�
City of San Diego ComprehenSive annual finanCial report
Table of Contents
Introductory SectIon
Letter of Transmittal .......................................................................................................................................................................... 9
Purpose, Background, and Scope of this Report .................................................................................................... 21
Profile of the City of San Diego ............................................................................................................................... 22
City of San Diego Current Officials ......................................................................................................................... 24
City of San Diego Organization Chart ..................................................................................................................... 25
FInancIal SectIon
Independent Auditor’s Report ......................................................................................................................................................... 31
Management’s Discussion and Analysis (Required Supplementary Information) .......................................................................... 33
Basic Financial Statements ............................................................................................................................................................ 49
Government-Wide Financial Statements
Statement of Net Assets ......................................................................................................................................... 52
Statement of Activities ............................................................................................................................................ 54
Governmental Funds Financial Statements
Balance Sheet ........................................................................................................................................................ 56
Statement of Revenues, Expenditures, and Changes in Fund Balances ............................................................... 58
Reconciliation of the Statement of Revenues, Expenditures, and Changes in Fund Balances of Governmental Funds to the Statement of Activities ....................................................................................................................... 59
Proprietary Funds Financial Statements
Statement of Net Assets ......................................................................................................................................... 60
Statement of Revenues, Expenses, and Changes in Fund Net Assets .................................................................. 61
Statement of Cash Flows ........................................................................................................................................ 62
Fiduciary Funds Financial Statements
Statement of Fiduciary Net Assets .......................................................................................................................... 63
Statement of Changes in Fiduciary Net Assets ...................................................................................................... 64
Notes to the Financial Statements
1. Summary of Significant Accounting Policies ...................................................................................................... 65
Table of ContentsFor The Fiscal Year Ended June 30, 2007
�
City of San Diego ComprehenSive annual finanCial report
2. Reconciliation of Government-Wide and Fund Financial Statements................................................................ 78
3. Cash and Investments ....................................................................................................................................... 81
4. Capital Assets .................................................................................................................................................. 103
5. Governmental Activities Long-Term Liabilities ................................................................................................. 106
6. Business-Type Activities Long-Term Liabilities .................................................................................................114
7. Discretely Presented Component Units Long-Term Liabilities ..........................................................................117
8. Short-Term Notes Payable ................................................................................................................................119
9. Joint Venture and Jointly Governed Organizations ...........................................................................................119
10. Lease Commitments ...................................................................................................................................... 121
11. Deferred Compensation Plan ......................................................................................................................... 123
12. Pension Plans ................................................................................................................................................ 124
13. Other Post Employment Benefits ................................................................................................................... 136
14. Interfund Receivables, Payables, and Transfers ........................................................................................... 137
15. Risk Management .......................................................................................................................................... 139
16. Fund Balance/Net Assets (Deficit) ................................................................................................................. 141
17. Commitments ................................................................................................................................................. 142
18. Contingencies ................................................................................................................................................ 145
19. Third Party Debt ............................................................................................................................................. 153
20. Closure and Post Closure Care Cost ............................................................................................................. 154
21. Operating Agreements ................................................................................................................................... 155
22. Subsequent Events ........................................................................................................................................ 156
Required Supplementary Information
Pension Trust Funds Analysis of Funding Progress ............................................................................................. 159
General Fund Budgetary Information ................................................................................................................... 161
Note to Required Supplementary Information ...................................................................................................... 165
Supplementary Information
Supplementary Information - General Fund ......................................................................................................... 167
Table of ContentsFor the Fiscal Year Ended June 30, 2007
�
City of San Diego ComprehenSive annual finanCial report
Non-Major Governmental Funds .......................................................................................................................... 191
Special Revenue .............................................................................................................................................. 195
Debt Service .................................................................................................................................................... 223
Capital Projects ................................................................................................................................................ 235
Permanent ....................................................................................................................................................... 249
Non-Major Business-Type Funds - Enterprise ...................................................................................................... 257
Internal Service Funds .......................................................................................................................................... 267
Fiduciary Funds .................................................................................................................................................... 277
StatIStIcal SectIon
Table 1: Net Assets by Category .................................................................................................................................................. 285
Table 2: Changes in Net Assets .................................................................................................................................................... 286
Table 3: Fund Balances of Governmental Funds ......................................................................................................................... 288
Table 4: Changes in Fund Balances of Governmental Funds ...................................................................................................... 290
Table 5: Assessed Value and Estimated Actual Value of Taxable Property .................................................................................. 292
Table 6: Direct and Overlapping Property Tax Rates .................................................................................................................... 294
Table 7: Principal Property Tax Payers ......................................................................................................................................... 295
Table 8: Property Tax Levies and Collections ............................................................................................................................... 296
Table 9: Ratios of Outstanding Debt by Type ............................................................................................................................... 298
Table 10: Ratios of General Bonded Debt Outstanding ................................................................................................................ 300
Table 11: Direct and Overlapping Debt ......................................................................................................................................... 302
Table 12: Legal Debt Margin Schedule ......................................................................................................................................... 304
Table 13-1: Pledged-Revenue Coverage - Water Bonds.............................................................................................................. 306
Table 13-2: Pledged-Revenue Coverage - Sewer Bonds ............................................................................................................. 308
Table 14: Demographic and Economic Statistics ......................................................................................................................... 309
Table 15: Principal Employers ...................................................................................................................................................... 310
Table 16: Full-time and Part-time City Employees by Function .....................................................................................................311
Table 17: Operating Indicators by Function .................................................................................................................................. 312
Table 18: Capital Asset Statistics by Function .............................................................................................................................. 314
Table of ContentsFor the Fiscal Year Ended June 30, 2007

Introductory SectIon
introDuCtory SeCtion

This Page Left Intentionally Blank - Back of Divider Page
�
City of San Diego ComprehenSive annual finanCial report
Letter of Transmittal
October 17, 2008
Citizens and Interested Parties,
The City of San Diego has faced significant financial challenges over the last several years and has made a determined effort to improve its overall financial condition, as well as the quality of its financial disclosures, including its financial statements, its internal controls and its disclosure controls and procedures. The City continues to operate under a cease and desist order (“Order”) with the Securities and Exchange Commission as a result of the Commission finding in 2006 that the City had misstated or omitted material information in connection with five bond offerings in 2002 and 2003, and contemporaneous continuing disclosure filings and rating agency presentations, all related to the pension system and retiree health care. City financial disclosures have been improved through the work of the Disclosure Practices Working Group and improvements to the financial reporting processes employed by City financial management.
A few of the City’s achievements since the Order include (1) the release within the last eighteen months of audited financial statements for fiscal years 2003-2007; (2) the implementation of an annual five-year financial outlook as a prudent planning tool; (3) the strengthening of the City’s General Fund reserves; (4) increased funding of the City’s pension system; (5) renegotiating a new pension plan for non-public safety employees hired on or after July 1, 2009; (6) participation in a California Public Employees’ Retirement System (CALPERs) trust for pre-funding of post-retirement healthcare benefits for retired City employees and (7) rating upgrades from the national rating agencies, including, in the case of one agency, the reinstatement of the City’s credit rating.
The City continues to work through the consequences of many years of financial mismanagement. The City’s pension deficit, while significantly smaller than it was just three years ago, is still sizeable at approximately $1.184 billion (as of June 30, 2007). This deficit is the product of a number of factors, including improvements in benefits to members without corresponding funding, and previously selling service credits at less than the cost to the pension system. In addition, the City has a postemployment healthcare actuarial accrued liability of approximately $1.028 billion (as of June 30, 2007).
City management and the City’s Independent Budget Analyst have identified structural budget deficits for the foreseeable future. These deficits, coupled with the deteriorating national economy, have affected the City’s revenues, placing strain on the City’s ability to fund all of its spending priorities. Areas of funding priorities include deferred maintenance, retiree healthcare costs, self insurance claims, and various state and federal regulatory requirements.
At the present time, the City is experiencing, as are other state and local governments across the country, extraordinary conditions in both the equity and debt markets and revised negative economic forecasts for the local, national and world economies. The City is
10
City of San Diego ComprehenSive annual finanCial report
responding to a possible prolonged economic downturn by revising downward its General Fund revenue projections that were utilized in developing the fiscal year 2009 budget. The City is reviewing preliminary first quarter data and is forecasting a General Fund budget deficit of approximately $43 million for fiscal year 2009. This deficit is primarily the result of reduced revenues in the areas of sales tax, property tax, transient occupancy tax, franchise fees, and interest earnings, as well as higher expenditures in booking fees and property tax administrative fees paid to the County. It also reflects approximately $8 million of projected expenditures in excess of the adopted budget. The $43 million represents roughly 3% of the General Fund. Management intends to propose a revised fiscal year 2009 budget to City Council in November that will present reductions in discretionary spending to offset the expected decline in revenues and maintain a balanced budget in fiscal year 2009.
Unlike many municipal and state issuers, San Diego has no variable rate or auction rate debt outstanding. The City does not foresee the need to issue additional debt or revenue anticipation notes to meet any General Fund liquidity needs in fiscal year 2009. The City treasury holds approximately $2 billion that is invested primarily in US Treasuries and agencies, and consistent with the City’s investment policy, has sufficient liquidity to meet all currently foreseeable cash demands. The General Fund reserves are approximately $75 million, which includes $55 million set aside in an Emergency Reserve Fund that can be accessed by a majority vote of City Council.
Readers of these financial statements should pay particular attention to Notes 12, 13, 18, and 22, concerning Pension Plans, Other Post Employment Benefits, Contingencies, and Subsequent Events, respectively. These notes address certain issues underlying the City’s ongoing financial difficulties, including the under funding of the City’s pension system and the November 2006 settlement with the Securities and Exchange Commission for violations of federal securities laws that stemmed from inadequate disclosures of pension liabilities, as well as various investigative reports regarding those matters. The notes, along with the other financial and operational data included in the City’s CAFR, must be read in their entirety to obtain a complete understanding of the City’s financial position as of June 30, 2007.
Our Underlying Fundamentals
The City has a diversified economy, with the principal employers being government, high-tech industries, particularly biotech and telecommunications, and the tourism industry. The City’s economic base is also anchored by higher education and major scientific research institutions, including the University of California, San Diego, San Diego State University, Scripps Research Institute, the Salk Institute for Biological Studies, and the San Diego Computer Center.
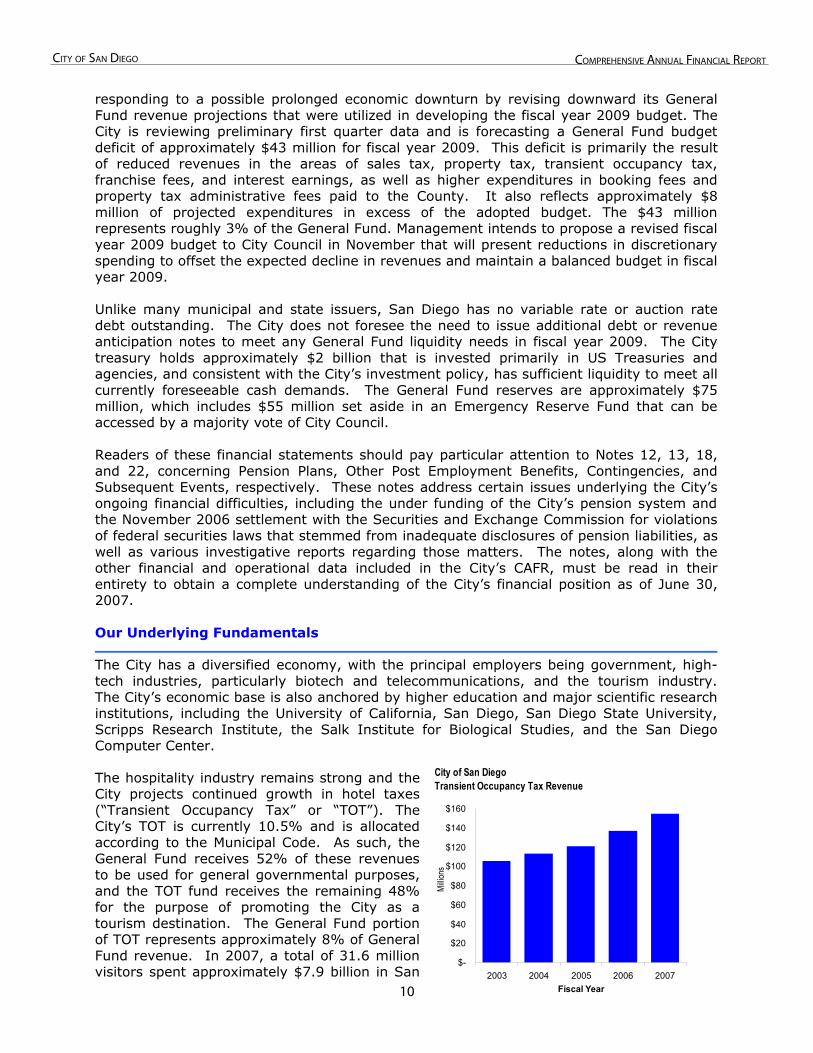
City of San Diego Transient Occupancy Tax Revenue
$-
$20
$40
$60
$80
$100
$120
$140
$160
2003 2004 2005 2006 2007
Millio
ns
Fiscal Year
The hospitality industry remains strong and the City projects continued growth in hotel taxes (“Transient Occupancy Tax” or “TOT”). The City’s TOT is currently 10.5% and is allocated according to the Municipal Code. As such, the General Fund receives 52% of these revenues to be used for general governmental purposes, and the TOT fund receives the remaining 48% for the purpose of promoting the City as a tourism destination. The General Fund portion of TOT represents approximately 8% of General Fund revenue. In 2007, a total of 31.6 million visitors spent approximately $7.9 billion in San
11
City of San Diego ComprehenSive annual finanCial report
Diego, resulting in a 10.7% increase in transient occupancy tax revenue over calendar year 2006. The fiscal year 2009 TOT budget is $173 million, which represents an approximate 6% growth rate over the fiscal year 2008 budget of $162.6 million.
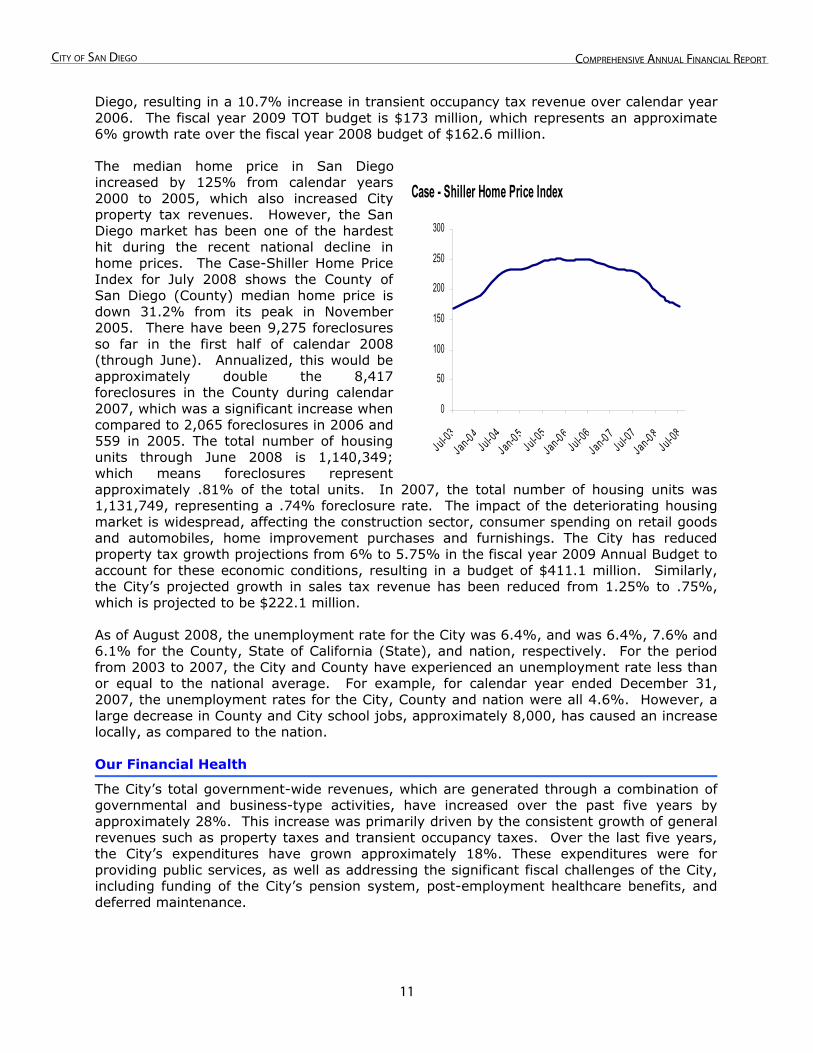
The median home price in San Diego increased by 125% from calendar years 2000 to 2005, which also increased City property tax revenues. However, the San Diego market has been one of the hardest hit during the recent national decline in home prices. The Case-Shiller Home Price Index for July 2008 shows the County of San Diego (County) median home price is down 31.2% from its peak in November 2005. There have been 9,275 foreclosures so far in the first half of calendar 2008 (through June). Annualized, this would be approximately double the 8,417 foreclosures in the County during calendar 2007, which was a significant increase when compared to 2,065 foreclosures in 2006 and 559 in 2005. The total number of housing units through June 2008 is 1,140,349; which means foreclosures represent approximately .81% of the total units. In 2007, the total number of housing units was 1,131,749, representing a .74% foreclosure rate. The impact of the deteriorating housing market is widespread, affecting the construction sector, consumer spending on retail goods and automobiles, home improvement purchases and furnishings. The City has reduced property tax growth projections from 6% to 5.75% in the fiscal year 2009 Annual Budget to account for these economic conditions, resulting in a budget of $411.1 million. Similarly, the City’s projected growth in sales tax revenue has been reduced from 1.25% to .75%, which is projected to be $222.1 million.
Case - Shiller Home Price Index
0
50
100
150
200
250
300
Jul-03Jan-0 4
Jul-04Jan-0 5
Jul-05Jan-0 6
Jul-06Jan-0 7
Jul-07Jan-0 8
Jul-08
As of August 2008, the unemployment rate for the City was 6.4%, and was 6.4%, 7.6% and 6.1% for the County, State of California (State), and nation, respectively. For the period from 2003 to 2007, the City and County have experienced an unemployment rate less than or equal to the national average. For example, for calendar year ended December 31, 2007, the unemployment rates for the City, County and nation were all 4.6%. However, a large decrease in County and City school jobs, approximately 8,000, has caused an increase locally, as compared to the nation.
Our Financial Health
The City’s total government-wide revenues, which are generated through a combination of governmental and business-type activities, have increased over the past five years by approximately 28%. This increase was primarily driven by the consistent growth of general revenues such as property taxes and transient occupancy taxes. Over the last five years, the City’s expenditures have grown approximately 18%. These expenditures were for providing public services, as well as addressing the significant fiscal challenges of the City, including funding of the City’s pension system, post-employment healthcare benefits, and deferred maintenance.
12
City of San Diego ComprehenSive annual finanCial report
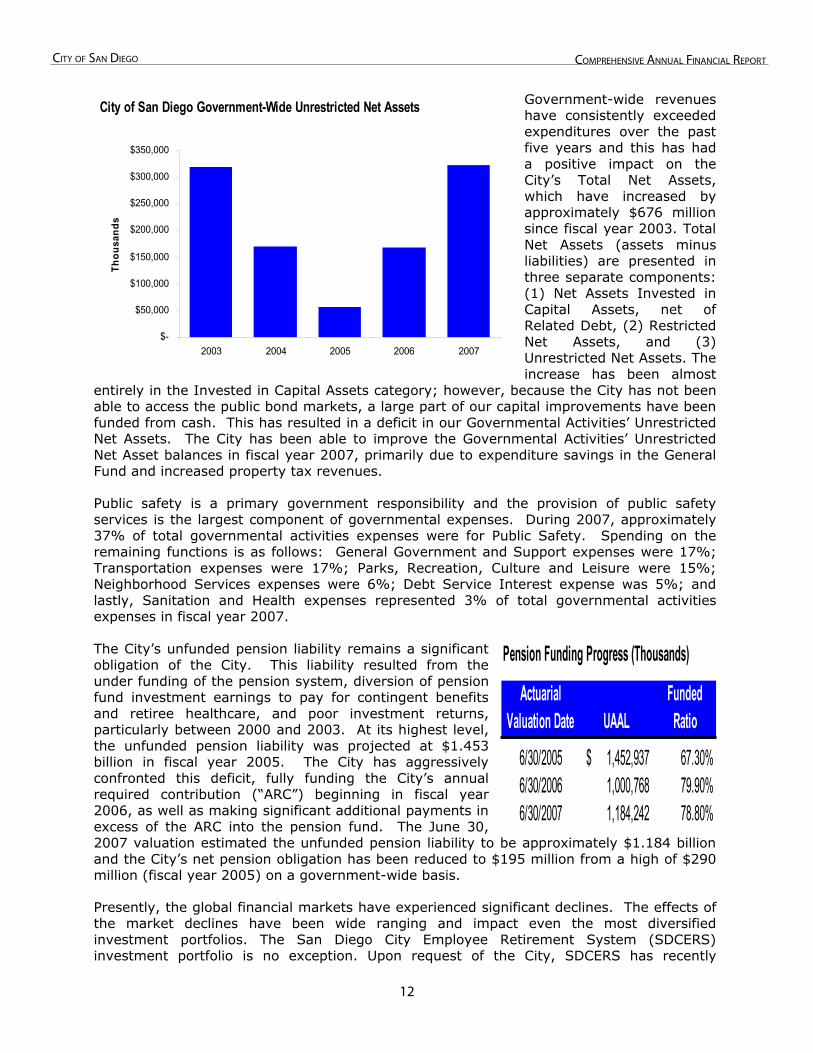
Government-wide revenues have consistently exceeded expenditures over the past five years and this has had a positive impact on the City’s Total Net Assets, which have increased by approximately $676 million since fiscal year 2003. Total Net Assets (assets minus liabilities) are presented in three separate components: (1) Net Assets Invested in Capital Assets, net of Related Debt, (2) Restricted Net Assets, and (3) Unrestricted Net Assets. The increase has been almost
entirely in the Invested in Capital Assets category; however, because the City has not been able to access the public bond markets, a large part of our capital improvements have been funded from cash. This has resulted in a deficit in our Governmental Activities’ Unrestricted Net Assets. The City has been able to improve the Governmental Activities’ Unrestricted Net Asset balances in fiscal year 2007, primarily due to expenditure savings in the General Fund and increased property tax revenues.
City of San Diego Government-Wide Unrestricted Net Assets
$-
$50,000
$100,000
$150,000
$200,000
$250,000
$300,000
$350,000
2003 2004 2005 2006 2007
Thou
sand
s
Public safety is a primary government responsibility and the provision of public safety services is the largest component of governmental expenses. During 2007, approximately 37% of total governmental activities expenses were for Public Safety. Spending on the remaining functions is as follows: General Government and Support expenses were 17%; Transportation expenses were 17%; Parks, Recreation, Culture and Leisure were 15%; Neighborhood Services expenses were 6%; Debt Service Interest expense was 5%; and lastly, Sanitation and Health expenses represented 3% of total governmental activities expenses in fiscal year 2007.
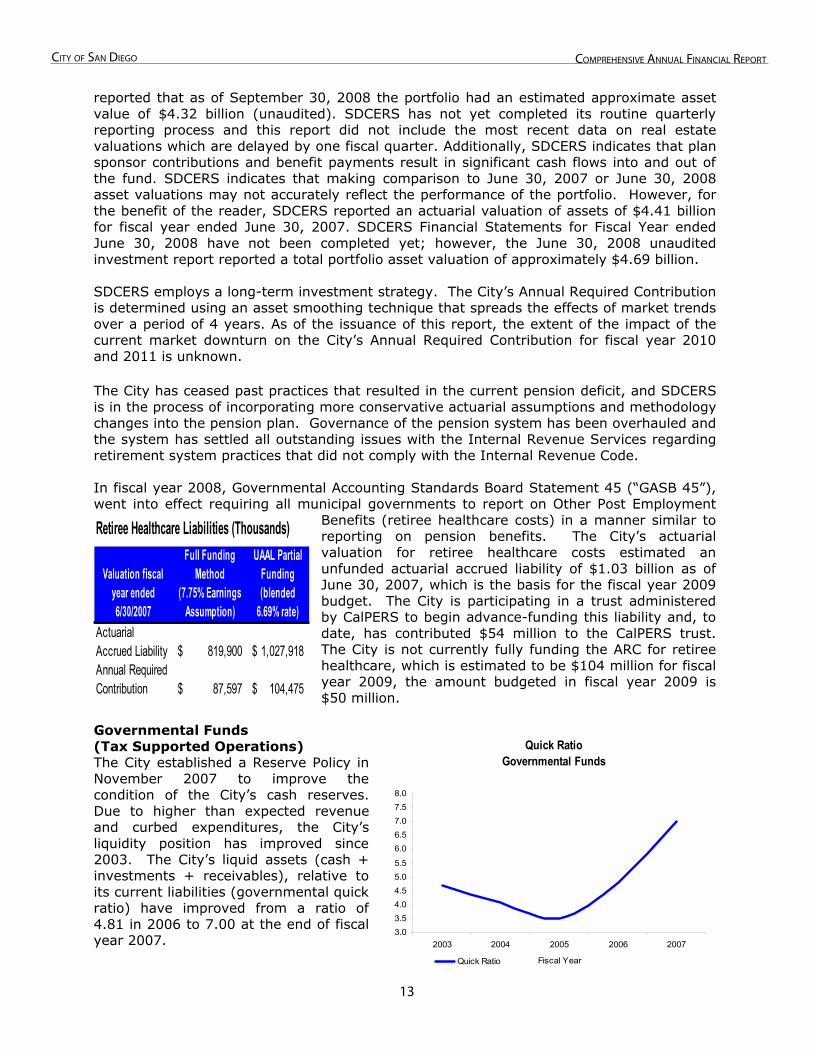
The City’s unfunded pension liability remains a significant obligation of the City. This liability resulted from the under funding of the pension system, diversion of pension fund investment earnings to pay for contingent benefits and retiree healthcare, and poor investment returns, particularly between 2000 and 2003. At its highest level, the unfunded pension liability was projected at $1.453 billion in fiscal year 2005. The City has aggressively confronted this deficit, fully funding the City’s annual required contribution (“ARC”) beginning in fiscal year 2006, as well as making significant additional payments in excess of the ARC into the pension fund. The June 30, 2007 valuation estimated the unfunded pension liability to be approximately $1.184 billion and the City’s net pension obligation has been reduced to $195 million from a high of $290 million (fiscal year 2005) on a government-wide basis.
Actuarial Valuation Date UAAL
Funded Ratio
6/30/2005 1,452,937$ 67.30%6/30/2006 1,000,768 79.90%6/30/2007 1,184,242 78.80%
Pension Funding Progress (Thousands)
Presently, the global financial markets have experienced significant declines. The effects of the market declines have been wide ranging and impact even the most diversified investment portfolios. The San Diego City Employee Retirement System (SDCERS) investment portfolio is no exception. Upon request of the City, SDCERS has recently
13
City of San Diego ComprehenSive annual finanCial report
reported that as of September 30, 2008 the portfolio had an estimated approximate asset value of $4.32 billion (unaudited). SDCERS has not yet completed its routine quarterly reporting process and this report did not include the most recent data on real estate valuations which are delayed by one fiscal quarter. Additionally, SDCERS indicates that plan sponsor contributions and benefit payments result in significant cash flows into and out of the fund. SDCERS indicates that making comparison to June 30, 2007 or June 30, 2008 asset valuations may not accurately reflect the performance of the portfolio. However, for the benefit of the reader, SDCERS reported an actuarial valuation of assets of $4.41 billion for fiscal year ended June 30, 2007. SDCERS Financial Statements for Fiscal Year ended June 30, 2008 have not been completed yet; however, the June 30, 2008 unaudited investment report reported a total portfolio asset valuation of approximately $4.69 billion.
SDCERS employs a long-term investment strategy. The City’s Annual Required Contribution is determined using an asset smoothing technique that spreads the effects of market trends over a period of 4 years. As of the issuance of this report, the extent of the impact of the current market downturn on the City’s Annual Required Contribution for fiscal year 2010 and 2011 is unknown.
The City has ceased past practices that resulted in the current pension deficit, and SDCERS is in the process of incorporating more conservative actuarial assumptions and methodology changes into the pension plan. Governance of the pension system has been overhauled and the system has settled all outstanding issues with the Internal Revenue Services regarding retirement system practices that did not comply with the Internal Revenue Code.
2009 is $50 million.
to 7.00 at the end of fiscal ear 2007.
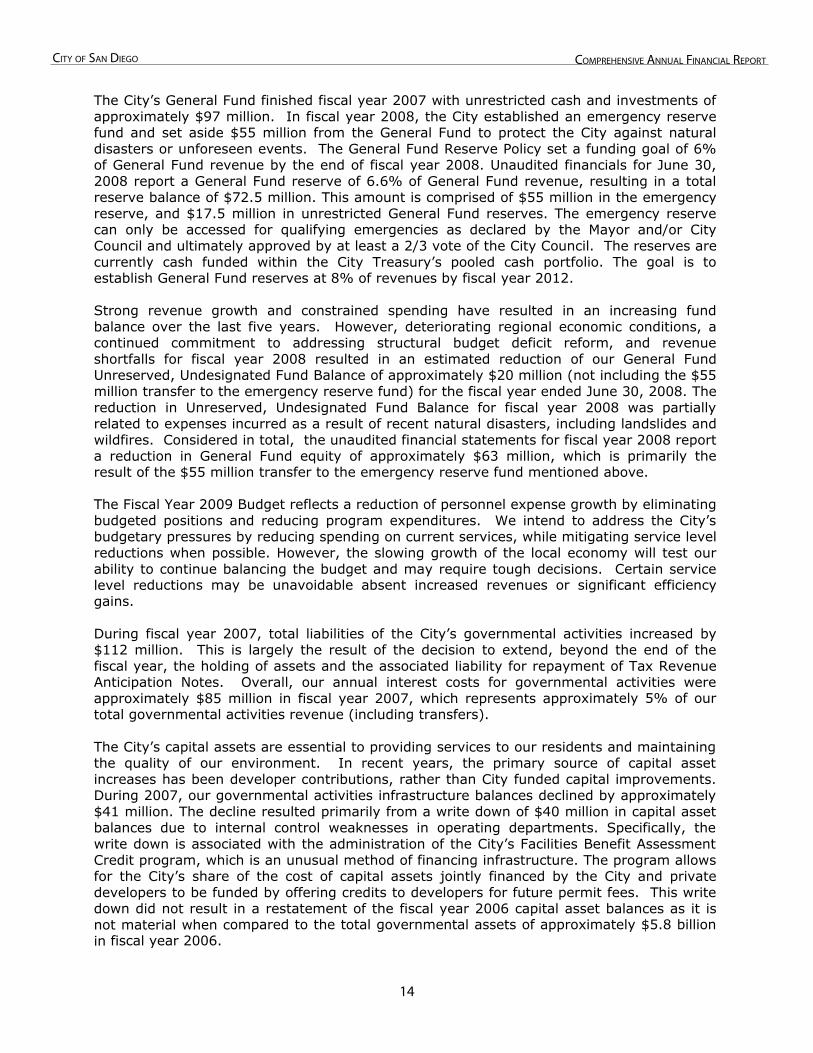
In fiscal year 2008, Governmental Accounting Standards Board Statement 45 (“GASB 45”), went into effect requiring all municipal governments to report on Other Post Employment
Benefits (retiree healthcare costs) in a manner similar to reporting on pension benefits. The City’s actuarial valuation for retiree healthcare costs estimated an unfunded actuarial accrued liability of $1.03 billion as of June 30, 2007, which is the basis for the fiscal year 2009 budget. The City is participating in a trust administered by CalPERS to begin advance-funding this liability and, to date, has contributed $54 million to the CalPERS trust. The City is not currently fully funding the ARC for retiree healthcare, which is estimated to be $104 million for fiscal year 2009, the amount budgeted in fiscal year
Valuation fiscal year ended 6/30/2007
Full Funding Method
(7.75% Earnings Assumption)
UAAL Partial Funding (blended
6.69% rate)Actuarial Accrued Liability 819,900$ 1,027,918$Annual Required Contribution 87,597$ 104,475$
Retiree Healthcare Liabilities (Thousands)
Governmental Funds (Tax Supported Operations) The City established a Reserve Policy in November 2007 to improve the condition of the City’s cash reserves. Due to higher than expected revenue and curbed expenditures, the City’s liquidity position has improved since 2003. The City’s liquid assets (cash + investments + receivables), relative to its current liabilities (governmental quick ratio) have improved from a ratio of 4.81 in 2006
Quick Ratio Governmental Funds
3.03.54.04.55.05.5
6.06.57.07.58.0
2003 2004 2005 2006 2007
Fiscal YearQuick Ratio
y
1�
City of San Diego ComprehenSive annual finanCial report
lio. The goal is to stablish General Fund reserves at 8% of revenues by fiscal year 2012.
arily the result of the $55 million transfer to the emergency reserve fund mentioned above.
ductions may be unavoidable absent increased revenues or significant efficiency ains.
roximately 5% of our tal governmental activities revenue (including transfers).
ompared to the total governmental assets of approximately $5.8 billion fiscal year 2006.
The City’s General Fund finished fiscal year 2007 with unrestricted cash and investments of approximately $97 million. In fiscal year 2008, the City established an emergency reserve fund and set aside $55 million from the General Fund to protect the City against natural disasters or unforeseen events. The General Fund Reserve Policy set a funding goal of 6% of General Fund revenue by the end of fiscal year 2008. Unaudited financials for June 30, 2008 report a General Fund reserve of 6.6% of General Fund revenue, resulting in a total reserve balance of $72.5 million. This amount is comprised of $55 million in the emergency reserve, and $17.5 million in unrestricted General Fund reserves. The emergency reserve can only be accessed for qualifying emergencies as declared by the Mayor and/or City Council and ultimately approved by at least a 2/3 vote of the City Council. The reserves are currently cash funded within the City Treasury’s pooled cash portfoe
Strong revenue growth and constrained spending have resulted in an increasing fund balance over the last five years. However, deteriorating regional economic conditions, a continued commitment to addressing structural budget deficit reform, and revenue shortfalls for fiscal year 2008 resulted in an estimated reduction of our General Fund Unreserved, Undesignated Fund Balance of approximately $20 million (not including the $55 million transfer to the emergency reserve fund) for the fiscal year ended June 30, 2008. The reduction in Unreserved, Undesignated Fund Balance for fiscal year 2008 was partially related to expenses incurred as a result of recent natural disasters, including landslides and wildfires. Considered in total, the unaudited financial statements for fiscal year 2008 report a reduction in General Fund equity of approximately $63 million, which is prim
The Fiscal Year 2009 Budget reflects a reduction of personnel expense growth by eliminating budgeted positions and reducing program expenditures. We intend to address the City’s budgetary pressures by reducing spending on current services, while mitigating service level reductions when possible. However, the slowing growth of the local economy will test our ability to continue balancing the budget and may require tough decisions. Certain service level reg
During fiscal year 2007, total liabilities of the City’s governmental activities increased by $112 million. This is largely the result of the decision to extend, beyond the end of the fiscal year, the holding of assets and the associated liability for repayment of Tax Revenue Anticipation Notes. Overall, our annual interest costs for governmental activities were approximately $85 million in fiscal year 2007, which represents appto
The City’s capital assets are essential to providing services to our residents and maintaining the quality of our environment. In recent years, the primary source of capital asset increases has been developer contributions, rather than City funded capital improvements. During 2007, our governmental activities infrastructure balances declined by approximately $41 million. The decline resulted primarily from a write down of $40 million in capital asset balances due to internal control weaknesses in operating departments. Specifically, the write down is associated with the administration of the City’s Facilities Benefit Assessment Credit program, which is an unusual method of financing infrastructure. The program allows for the City’s share of the cost of capital assets jointly financed by the City and private developers to be funded by offering credits to developers for future permit fees. This write down did not result in a restatement of the fiscal year 2006 capital asset balances as it is not material when cin
1�
City of San Diego ComprehenSive annual finanCial report
increase this estimate. That assessment is scheduled to e completed by December 2008.
d by no later than fiscal year 2014.
The City’s deferred maintenance backlog is estimated to be approximately $800 to $900 million, according to the most recent Five Year Financial Outlook. This includes the cost of repairs of City streets, sidewalks, and facilities that have been deferred because the City does not have necessary funding resources. An assessment of facilities maintenance needs is still ongoing and the results mayb
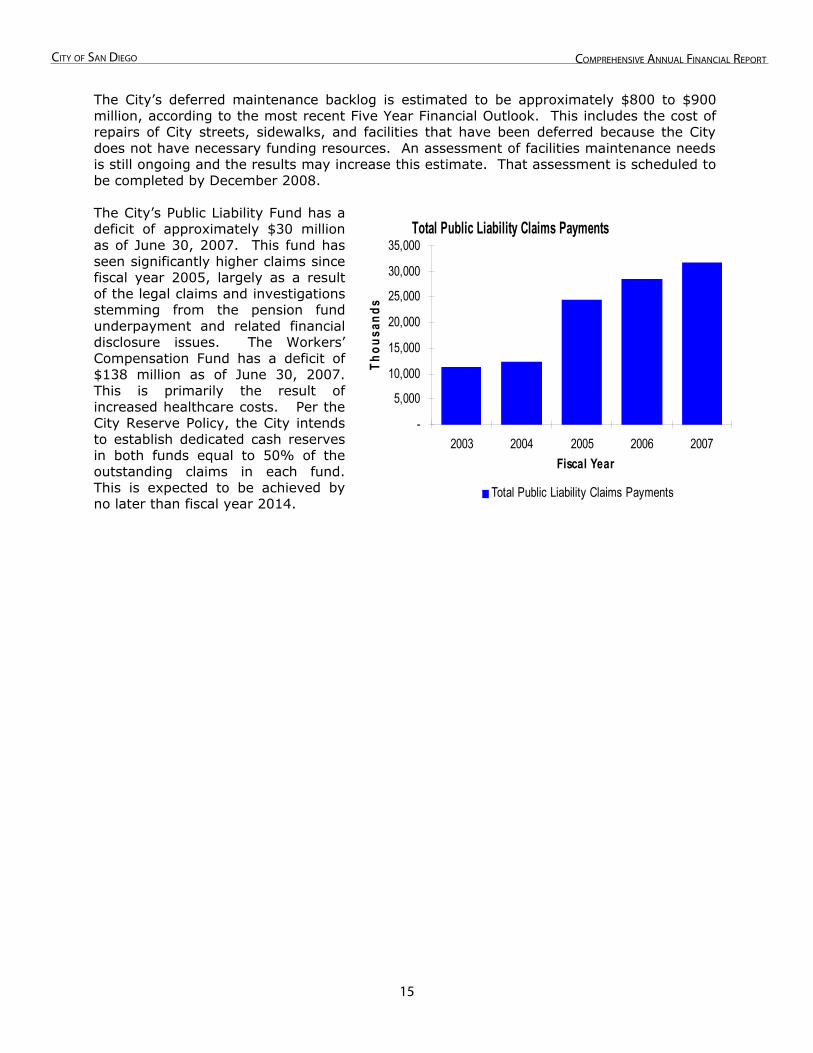
The City’s Public Liability Fund has a deficit of approximately $30 million as of June 30, 2007. This fund has seen significantly higher claims since fiscal year 2005, largely as a result of the legal claims and investigations stemming from the pension fund underpayment and related financial disclosure issues. The Workers’ Compensation Fund has a deficit of $138 million as of June 30, 2007. This is primarily the result of increased healthcare costs. Per the City Reserve Policy, the City intends to establish dedicated cash reserves in both funds equal to 50% of the outstanding claims in each fund. This is expected to be achieve
Total Public Liability Claims Payments
-
5,000
10,000
15,000
20,000
25,000
30,000
35,000
2003 2004 2005 2006 2007Fiscal Year
Thou
sand
s
Total Public Liability Claims Payments
1�
City of San Diego ComprehenSive annual finanCial report
Governmental Activities Key Indicators
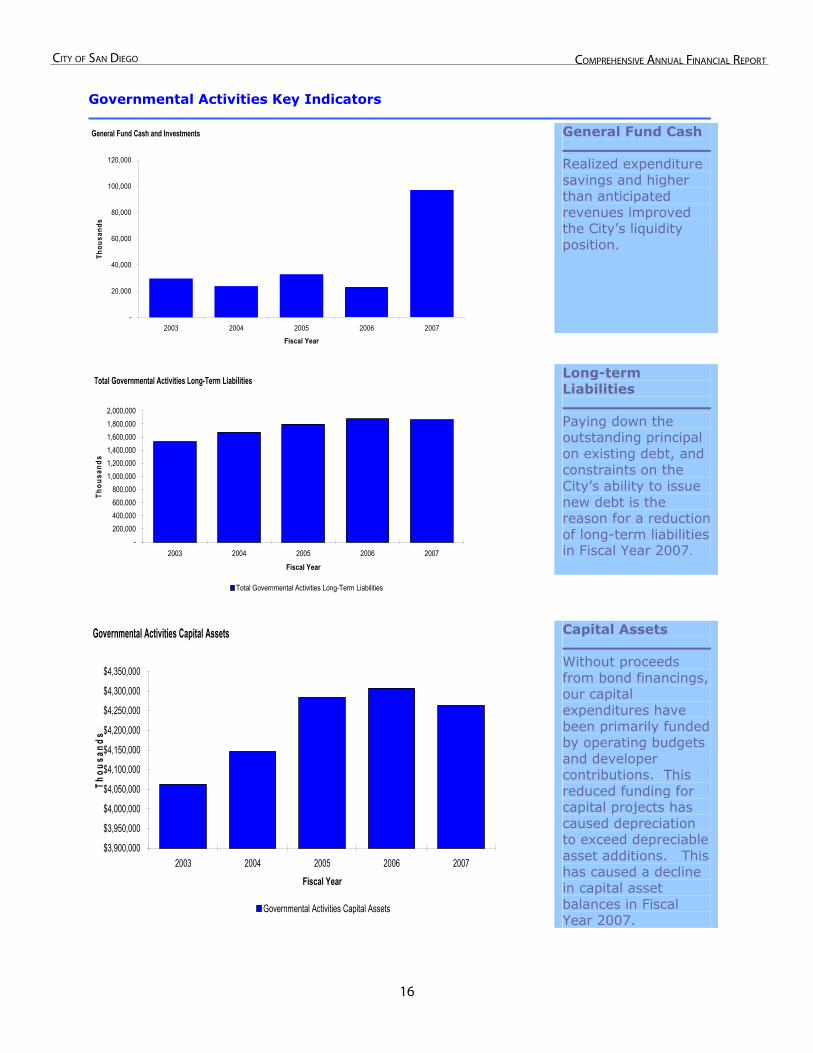
General Fund Cash
Realized expenditure savings and higher than anticipated revenues improved the City’s liquidity position.
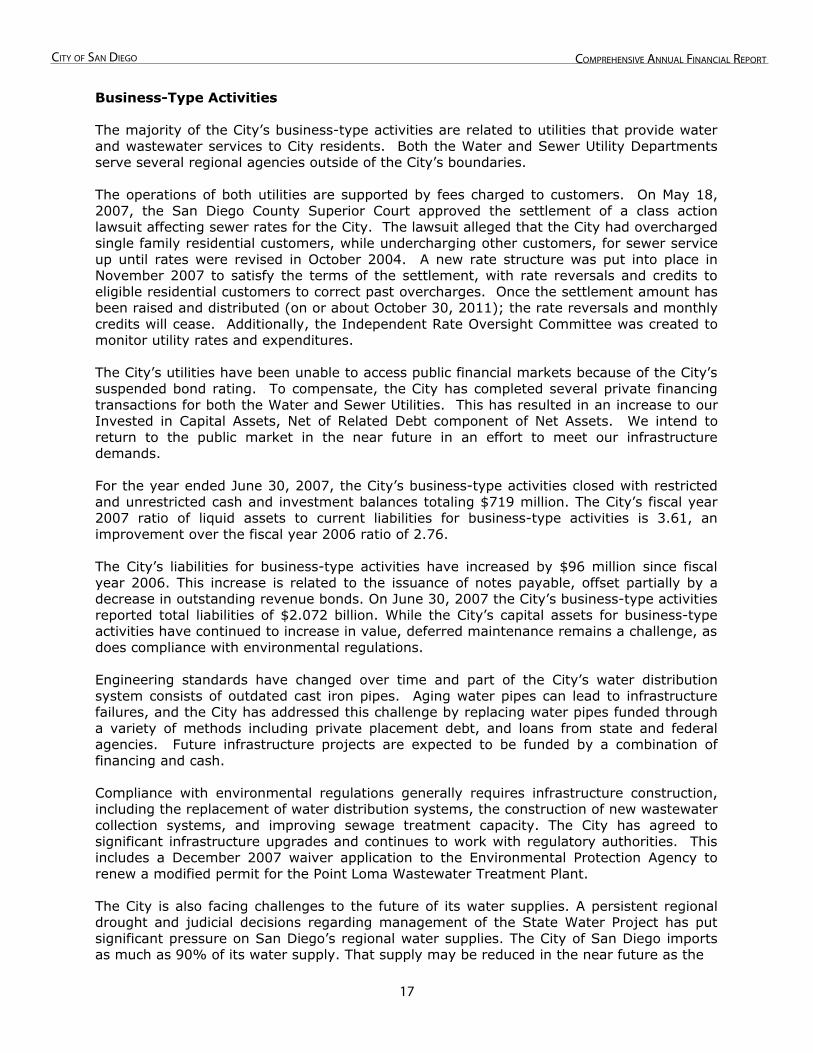
Long-termLiabilities
Paying down the outstanding principal on existing debt, and constraints on the City’s ability to issue new debt is the reason for a reduction of long-term liabilities in Fiscal Year 2007.
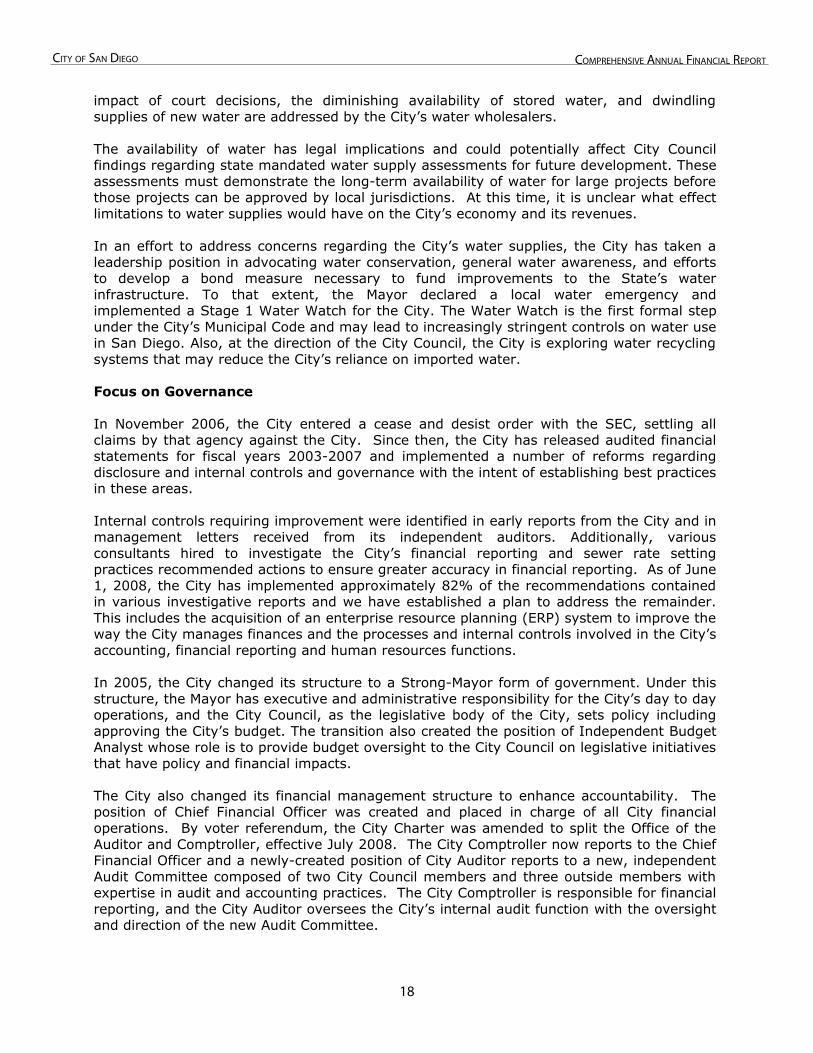
Capital Assets
Without proceeds from bond financings, our capital expenditures have been primarily funded by operating budgets and developer contributions. This reduced funding for capital projects has caused depreciation to exceed depreciable asset additions. This has caused a decline in capital asset balances in Fiscal Year 2007.
General Fund Cash and Investments
-
20,000
40,000
60,000
80,000
100,000
120,000
2003 2004 2005 2006 2007
Fiscal Year
Thou
sand
s
Total Governmental Activities Long-Term Liabilities
-200,000400,000600,000800,000
1,000,0001,200,0001,400,0001,600,0001,800,0002,000,000
2003 2004 2005 2006 2007
Fiscal Year
Thou
sand
s
Total Governmental Activities Long-Term Liabilities
Governmental Activities Capital Assets
$3,900,000
$3,950,000
$4,000,000
$4,050,000
$4,100,000
$4,150,000
$4,200,000
$4,250,000
$4,300,000
$4,350,000
2003 2004 2005 2006 2007
Fiscal Year
Thou
sand
s
Governmental Activities Capital Assets
17
City of San Diego ComprehenSive annual finanCial report
Business-Type Activities
The majority of the City’s business-type activities are related to utilities that provide water and wastewater services to City residents. Both the Water and Sewer Utility Departments serve several regional agencies outside of the City’s boundaries.
The operations of both utilities are supported by fees charged to customers. On May 18, 2007, the San Diego County Superior Court approved the settlement of a class action lawsuit affecting sewer rates for the City. The lawsuit alleged that the City had overcharged single family residential customers, while undercharging other customers, for sewer service up until rates were revised in October 2004. A new rate structure was put into place in November 2007 to satisfy the terms of the settlement, with rate reversals and credits to eligible residential customers to correct past overcharges. Once the settlement amount has been raised and distributed (on or about October 30, 2011); the rate reversals and monthly credits will cease. Additionally, the Independent Rate Oversight Committee was created to monitor utility rates and expenditures.
The City’s utilities have been unable to access public financial markets because of the City’s suspended bond rating. To compensate, the City has completed several private financing transactions for both the Water and Sewer Utilities. This has resulted in an increase to our Invested in Capital Assets, Net of Related Debt component of Net Assets. We intend to return to the public market in the near future in an effort to meet our infrastructure demands.
For the year ended June 30, 2007, the City’s business-type activities closed with restricted and unrestricted cash and investment balances totaling $719 million. The City’s fiscal year 2007 ratio of liquid assets to current liabilities for business-type activities is 3.61, an improvement over the fiscal year 2006 ratio of 2.76.
The City’s liabilities for business-type activities have increased by $96 million since fiscal year 2006. This increase is related to the issuance of notes payable, offset partially by a decrease in outstanding revenue bonds. On June 30, 2007 the City’s business-type activities reported total liabilities of $2.072 billion. While the City’s capital assets for business-type activities have continued to increase in value, deferred maintenance remains a challenge, as does compliance with environmental regulations.
Engineering standards have changed over time and part of the City’s water distribution system consists of outdated cast iron pipes. Aging water pipes can lead to infrastructure failures, and the City has addressed this challenge by replacing water pipes funded through a variety of methods including private placement debt, and loans from state and federal agencies. Future infrastructure projects are expected to be funded by a combination of financing and cash.
Compliance with environmental regulations generally requires infrastructure construction, including the replacement of water distribution systems, the construction of new wastewater collection systems, and improving sewage treatment capacity. The City has agreed to significant infrastructure upgrades and continues to work with regulatory authorities. This includes a December 2007 waiver application to the Environmental Protection Agency to renew a modified permit for the Point Loma Wastewater Treatment Plant.
The City is also facing challenges to the future of its water supplies. A persistent regional drought and judicial decisions regarding management of the State Water Project has put significant pressure on San Diego’s regional water supplies. The City of San Diego imports as much as 90% of its water supply. That supply may be reduced in the near future as the
18
City of San Diego ComprehenSive annual finanCial report
impact of court decisions, the diminishing availability of stored water, and dwindling supplies of new water are addressed by the City’s water wholesalers.
The availability of water has legal implications and could potentially affect City Council findings regarding state mandated water supply assessments for future development. These assessments must demonstrate the long-term availability of water for large projects before those projects can be approved by local jurisdictions. At this time, it is unclear what effect limitations to water supplies would have on the City’s economy and its revenues.
In an effort to address concerns regarding the City’s water supplies, the City has taken a leadership position in advocating water conservation, general water awareness, and efforts to develop a bond measure necessary to fund improvements to the State’s water infrastructure. To that extent, the Mayor declared a local water emergency and implemented a Stage 1 Water Watch for the City. The Water Watch is the first formal step under the City’s Municipal Code and may lead to increasingly stringent controls on water use in San Diego. Also, at the direction of the City Council, the City is exploring water recycling systems that may reduce the City’s reliance on imported water.
Focus on Governance
In November 2006, the City entered a cease and desist order with the SEC, settling all claims by that agency against the City. Since then, the City has released audited financial statements for fiscal years 2003-2007 and implemented a number of reforms regarding disclosure and internal controls and governance with the intent of establishing best practices in these areas.
Internal controls requiring improvement were identified in early reports from the City and in management letters received from its independent auditors. Additionally, various consultants hired to investigate the City’s financial reporting and sewer rate setting practices recommended actions to ensure greater accuracy in financial reporting. As of June 1, 2008, the City has implemented approximately 82% of the recommendations contained in various investigative reports and we have established a plan to address the remainder. This includes the acquisition of an enterprise resource planning (ERP) system to improve the way the City manages finances and the processes and internal controls involved in the City’s accounting, financial reporting and human resources functions.
In 2005, the City changed its structure to a Strong-Mayor form of government. Under this structure, the Mayor has executive and administrative responsibility for the City’s day to day operations, and the City Council, as the legislative body of the City, sets policy including approving the City’s budget. The transition also created the position of Independent Budget Analyst whose role is to provide budget oversight to the City Council on legislative initiatives that have policy and financial impacts.
The City also changed its financial management structure to enhance accountability. The position of Chief Financial Officer was created and placed in charge of all City financial operations. By voter referendum, the City Charter was amended to split the Office of the Auditor and Comptroller, effective July 2008. The City Comptroller now reports to the Chief Financial Officer and a newly-created position of City Auditor reports to a new, independent Audit Committee composed of two City Council members and three outside members with expertise in audit and accounting practices. The City Comptroller is responsible for financial reporting, and the City Auditor oversees the City’s internal audit function with the oversight and direction of the new Audit Committee.
1�
City of San Diego ComprehenSive annual finanCial report
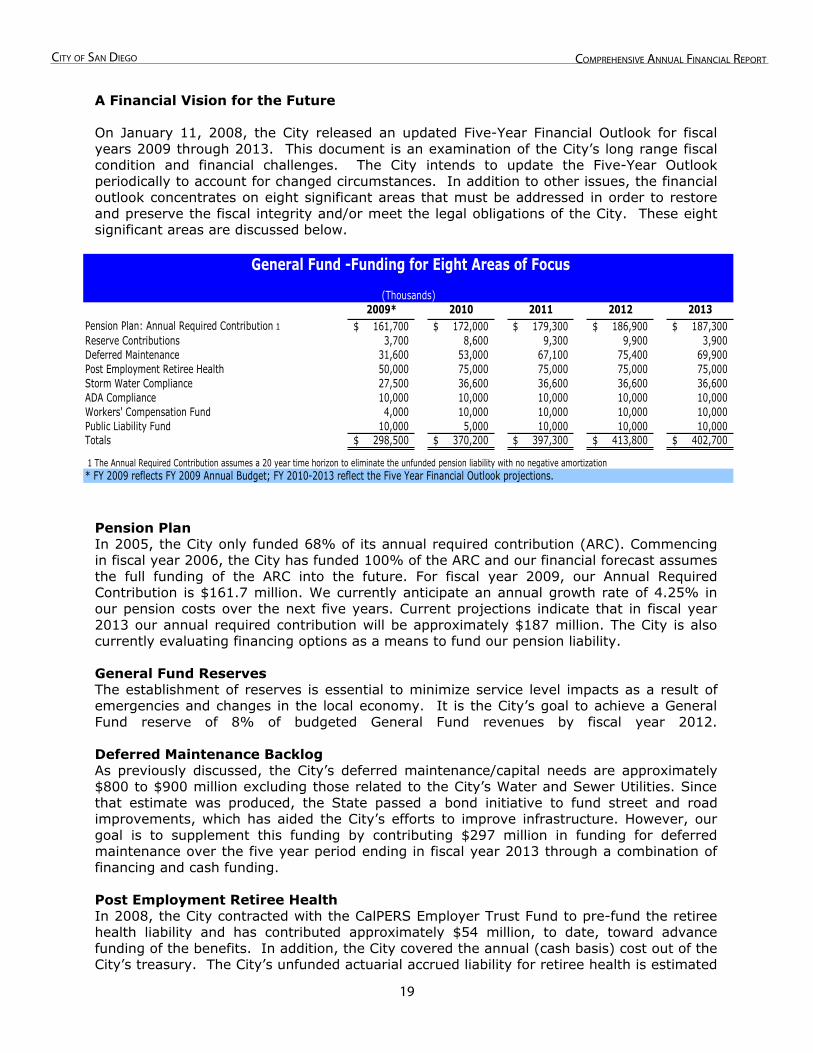
A Financial Vision for the Future
On January 11, 2008, the City released an updated Five-Year Financial Outlook for fiscal years 2009 through 2013. This document is an examination of the City’s long range fiscal condition and financial challenges. The City intends to update the Five-Year Outlook periodically to account for changed circumstances. In addition to other issues, the financial outlook concentrates on eight significant areas that must be addressed in order to restore and preserve the fiscal integrity and/or meet the legal obligations of the City. These eight significant areas are discussed below.
General Fund -Funding for Eight Areas of Focus
(Thousands)2009* 2010 2011 2012 2013
Pension Plan: Annual Required Contribution 1 161,700$ 172,000$ 179,300$ 186,900$ 187,300$ Reserve Contributions 3,700 8,600 9,300 9,900 3,900 Deferred Maintenance 31,600 53,000 67,100 75,400 69,900 Post Employment Retiree Health 50,000 75,000 75,000 75,000 75,000 Storm Water Compliance 27,500 36,600 36,600 36,600 36,600 ADA Compliance 10,000 10,000 10,000 10,000 10,000 Workers' Compensation Fund 4,000 10,000 10,000 10,000 10,000 Public Liability Fund 10,000 5,000 10,000 10,000 10,000 Totals 298,500$ 370,200$ 397,300$ 413,800$ 402,700$
1 The Annual Required Contribution assumes a 20 year time horizon to eliminate the unfunded pension liability with no negative amortization* FY 2009 reflects FY 2009 Annual Budget; FY 2010-2013 reflect the Five Year Financial Outlook projections.
Pension Plan In 2005, the City only funded 68% of its annual required contribution (ARC). Commencing in fiscal year 2006, the City has funded 100% of the ARC and our financial forecast assumes the full funding of the ARC into the future. For fiscal year 2009, our Annual Required Contribution is $161.7 million. We currently anticipate an annual growth rate of 4.25% in our pension costs over the next five years. Current projections indicate that in fiscal year 2013 our annual required contribution will be approximately $187 million. The City is also currently evaluating financing options as a means to fund our pension liability.
General Fund Reserves The establishment of reserves is essential to minimize service level impacts as a result of emergencies and changes in the local economy. It is the City’s goal to achieve a General Fund reserve of 8% of budgeted General Fund revenues by fiscal year 2012.
Deferred Maintenance Backlog As previously discussed, the City’s deferred maintenance/capital needs are approximately $800 to $900 million excluding those related to the City’s Water and Sewer Utilities. Since that estimate was produced, the State passed a bond initiative to fund street and road improvements, which has aided the City’s efforts to improve infrastructure. However, our goal is to supplement this funding by contributing $297 million in funding for deferred maintenance over the five year period ending in fiscal year 2013 through a combination of financing and cash funding.
Post Employment Retiree Health In 2008, the City contracted with the CalPERS Employer Trust Fund to pre-fund the retiree health liability and has contributed approximately $54 million, to date, toward advance funding of the benefits. In addition, the City covered the annual (cash basis) cost out of the City’s treasury. The City’s unfunded actuarial accrued liability for retiree health is estimated
20
City of San Diego ComprehenSive annual finanCial report
to be $1.03 billion in fiscal year 2009. The City’s intent is to pay approximately 50% of the ARC over the next 5 years and to fully fund the ARC thereafter. The June 30, 2007 valuation estimates the ARC to be $104 million for fiscal year ending June 30, 2009.
Obligations Related to Storm Water Runoff Permits Efforts to comply with storm water runoff regulations, including public education, maintenance, and monitoring, has had a significant impact on the City’s budget. In fiscal year 2008, $18 million was budgeted. The 2009-2013 Outlook includes $27.5 million for fiscal year 2009 and $36.6 million annually for fiscal years 2010-2013 for street sweeping, public education, and monitoring requirements.
Americans with Disabilities Act (ADA) Obligations The Americans with Disabilities Act (ADA) requires public agencies and private companies to make facilities and infrastructure accessible. In fiscal year 2008, a total of $2.3 million in Community Development Block Grant (CDBG) funds were allocated for ADA improvements and the total citywide allocation for ADA-related purposes was $12.3 million. The Five-Year Financial Outlook includes $10 million dollars in ADA improvements annually.
Workers’ Compensation Fund The City had approximately $161 million in outstanding workers’ compensation claims, and $24 million in cash reserves at June 30, 2007. The City’s Reserve Policy targets a reserve that is 50% of the value of outstanding claims by fiscal year 2014. While the fiscal year 2008 Annual Budget included $26.1 million to cover the regular projected annual cash payments, we have allocated an additional $4 million in the fiscal year 2009 budget. In order to build reserves, we plan on contributing $10 million for each year thereafter, in addition to the expected annual cash payments.
Public Liability FundThe City has approximately $38 million in outstanding public liability claims and $9 million in reserves. Similar to the Workers’ Compensation Fund reserve, the City’s new Reserve Policy targets a reserve equivalent to 50% of the value of outstanding claims by fiscal year 2014. $10 million has been allocated to this reserve in fiscal year 2009 and an additional $5 million will be allocated in 2010. Beginning in fiscal year 2011, our plan is to increase annual allocations to $10 million per year. All amounts referenced are in addition to the annual budgeted amount to cover the projected annual claims.
Future Challenges
These are difficult economic times, and we have set challenging goals for the City’s future. We believe these goals are achievable with continued fiscal discipline and greater government efficiency. San Diego has relatively low taxes and fees compared to most other large municipalities in the United States. The necessity of correcting past decisions and creating a more fiscally sound city may require tradeoffs. We expect the cumulative annual cost of our future goals to be $210 million by fiscal year 2010 and rise to $227 million by fiscal year 2013. When balanced against our expectations of future revenues and expenses, the Outlook currently projects annual budget deficits that range from $50 million to $85 million over the next five years, and accordingly, the Mayor and City Council will need to work together to balance the budget of each year.
21
City of San Diego ComprehenSive annual finanCial report
Purpose, Background, and Scope of this Report
Purpose, Background, and Scope of this Report
San Diego City Charter § 111 requires the City to submit an annual report, including a Statement of Net Assets, and requires that all accounts of the City be audited by an independent auditor. Pursuant to this requirement, the Comprehensive Annual Financial Report (“CAFR”) of the City of San Diego (“City”) for the fiscal year ended June 30, 2007, is hereby submitted. The audit firm of Macias Gini & O’Connell LLP has issued an unqualified opinion on the City of San Diego’s financial statements. The independent auditor’s report is located at the front of the financial section of this report.
The CAFR has been prepared in conformance with the principles and standards for reporting as set forth by the Governmental Accounting Standards Board (GASB). Responsibility for both the accuracy of the data and the completeness and fairness of the presentation, including all disclosures, rests with the management of the City and its related agencies. Our objective is to provide you with reasonable, rather than absolute, assurance that the financial statements are free of any material misstatements. Additionally, the City continues to construct and improve a comprehensive internal control framework in order to ensure acceptable management of taxpayer funds.
To the best of our knowledge and belief, the data as presented, is accurate in all material respects; it is presented in a manner designed to present fairly the financial position and results of operations of the governmental activities, business-type activities, the aggregate discretely presented component units, each major fund, and the aggregate remaining funds of the City and its related agencies; and all disclosures necessary to enable the reader to gain an understanding of the City's, as well as its related agencies’, financial activities have been included.
A narrative introduction, overview, and analysis of the financial statements can be found in Management’s Discussion and Analysis (MD&A) which immediately follows the independent auditor’s report. The MD&A complements this letter of transmittal and should be read in conjunction with it. The CAFR is organized into three sections:
The introductory section includes information about the organizational structure of the City, the City’s economy, and selected other financial information.
The financial section is prepared in accordance with governmental accounting standards. It includes the MD&A (unaudited), the independent auditor’s report, the audited basic financial statements, notes to the basic financial statements, required supplementary information, and supporting statements and schedules.
The statistical section contains historical statistical data on the City’s financial data and debt statistics, as well as miscellaneous physical, demographic, economic, and social data of the City. This section of the CAFR is unaudited.
22
City of San Diego ComprehenSive annual finanCial report
Profile of the City of San Diego
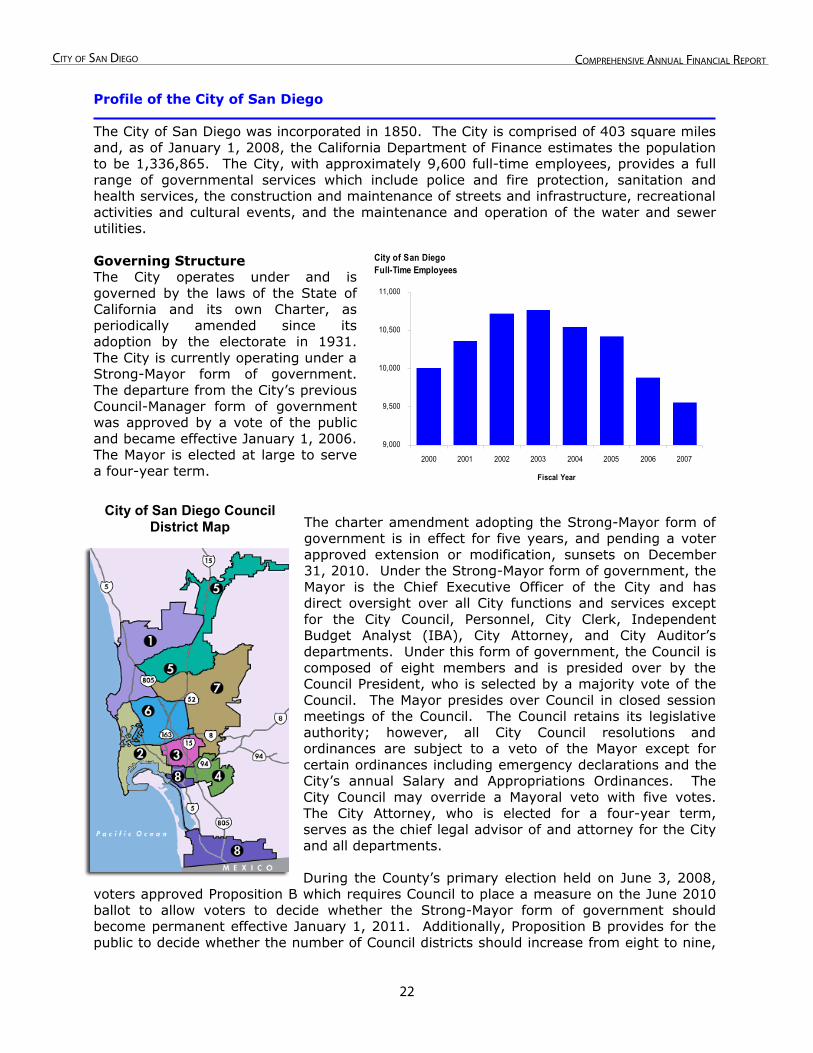
The City of San Diego was incorporated in 1850. The City is comprised of 403 square miles and, as of January 1, 2008, the California Department of Finance estimates the population to be 1,336,865. The City, with approximately 9,600 full-time employees, provides a full range of governmental services which include police and fire protection, sanitation and health services, the construction and maintenance of streets and infrastructure, recreational activities and cultural events, and the maintenance and operation of the water and sewer utilities.
Governing Structure The City operates under and is governed by the laws of the State of California and its own Charter, as periodically amended since its adoption by the electorate in 1931. The City is currently operating under a Strong-Mayor form of government. The departure from the City’s previous Council-Manager form of government was approved by a vote of the public and became effective January 1, 2006. The Mayor is elected at large to serve a four-year term.
City of San DiegoFull-Time Employees
9,000
9,500
10,000
10,500
11,000
2000 2001 2002 2003 2004 2005 2006 2007
Fiscal Year
City of San Diego Council District Map The charter amendment adopting the Strong-Mayor form of
government is in effect for five years, and pending a voter approved extension or modification, sunsets on December 31, 2010. Under the Strong-Mayor form of government, the Mayor is the Chief Executive Officer of the City and has direct oversight over all City functions and services except for the City Council, Personnel, City Clerk, Independent Budget Analyst (IBA), City Attorney, and City Auditor’s departments. Under this form of government, the Council is composed of eight members and is presided over by the Council President, who is selected by a majority vote of the Council. The Mayor presides over Council in closed session meetings of the Council. The Council retains its legislative authority; however, all City Council resolutions and ordinances are subject to a veto of the Mayor except for certain ordinances including emergency declarations and the City’s annual Salary and Appropriations Ordinances. The City Council may override a Mayoral veto with five votes. The City Attorney, who is elected for a four-year term, serves as the chief legal advisor of and attorney for the City and all departments.
During the County’s primary election held on June 3, 2008, voters approved Proposition B which requires Council to place a measure on the June 2010 ballot to allow voters to decide whether the Strong-Mayor form of government should become permanent effective January 1, 2011. Additionally, Proposition B provides for the public to decide whether the number of Council districts should increase from eight to nine,
Profile of the City of San Diego
23
City of San Diego ComprehenSive annual finanCial report
and therefore, a corresponding increase of Council votes required to override the Mayor’s veto from five to six. Additionally, voters approved Proposition C which separated the City Auditor’s Office from the Comptroller’s Office and made the Office of the IBA permanent. Under this amendment, the City Auditor serves a 10 year term and is supervised by an Audit Committee consisting of two Councilmembers and three members of the public, with auditing expertise who are appointed by the City Council. This amendment also provides that the Mayor will appoint, with Council confirmation, the Chief Financial Officer. In addition, the Mayor’s appointment of the City Treasurer no longer requires Council confirmation.
2�
City of San Diego ComprehenSive annual finanCial report
Current Elected Officials (As of the issuance of this report)
Mayor Jerry Sanders
District 1Council President Scott Peters
District 5 Councilmember Brian Maienschein
District 2Councilmember Kevin Faulconer
District 6Councilmember Donna Frye
District 3Councilmember Toni Atkins
District 7 Councilmember Jim Madaffer
District 4Council President Pro Tem
Tony Young
District 8 Councilmember Ben Hueso
City Attorney Michael Aguirre
Other City Officials
Jay M. Goldstone, Chief Operating Officer
Mary Lewis, Chief Financial Officer
Greg Levin, Comptroller
Gail Granewich, City Treasurer
Elizabeth Maland, City Clerk
Andrea Tevlin, Independent Budget Analyst
Eduardo Luna, Internal Auditor
City of San Diego Current Officials
2�
City of San Diego ComprehenSive annual finanCial report
DISABILITY SERVICES
COMMUNITY & LEGISLATIVE SERVICES
Kris Michell
INTERNAL AUDITOR *
CITIZENS OF SAN DIEGO
MAYOR/CEO Jerry Sanders
CHIEF OPERATING OFFICERJay Goldstone
CITY COUNCIL CITY ATTORNEYMichael Aguirre
CITY CLERKElizabeth Maland
INDEPENDENT BUDGET ANALYST
Andrea Tevlin
CHIEF FINANCIAL
OFFICERMary Lewis
PUBLIC SAFETY &
HOMELAND SECURITY
Jill Olen
PUBLIC WORKSDave Jarrell
CITY PLANNING &
DEVELOPMENTWilliam Anderson
CITY COMPTROLLER
DEBTMANAGEMENT
FINANCIAL MANAGEMENT
PURCHASING & CONTRACTS
FAMILY JUSTICE CENTER
FIRE-RESCUE
POLICE
RISK MANAGEMENT
AIRPORTS
HOMELAND SECURITY
ENGINEERING & CAPITAL
PROJECTS
EMERGENCY MEDICAL SERVICES
DEVELOPMENT SERVICES
PLANNING & COMMUNITY
INVESTMENTS
REAL ESTATE ASSETS
CUSTOMER SERVICES
ENVIRONMENTAL SERVICES
LIBRARY
ADMINISTRATION
BUSINESS OFFICE
OFFICE OF THE CIO
TREASURER
CIVIL SERVICE COMMISSION
PERSONNEL LABOR RELATIONS
ETHICS & INTEGRITY
Jo Anne SawyerKnoll
COMMUNITY SERVICESElmer Heap
PARK & RECREATION
PUBLIC UTILITIESJim Barrett
METROPOLITAN WASTEWATER
WATER
AUDIT COMMITTEE
GENERAL SERVICES
STORM WATER
DIVERSITY COMMITMENT
ETHICS & INTEGRITY
HUMANRELATIONS
CITIZENS’ REVIEW BOARD
COMMISSION FOR ARTS & CULTURE
COMMUNITY & LEGISLATIVE
SERVICES
SPECIAL EVENTS
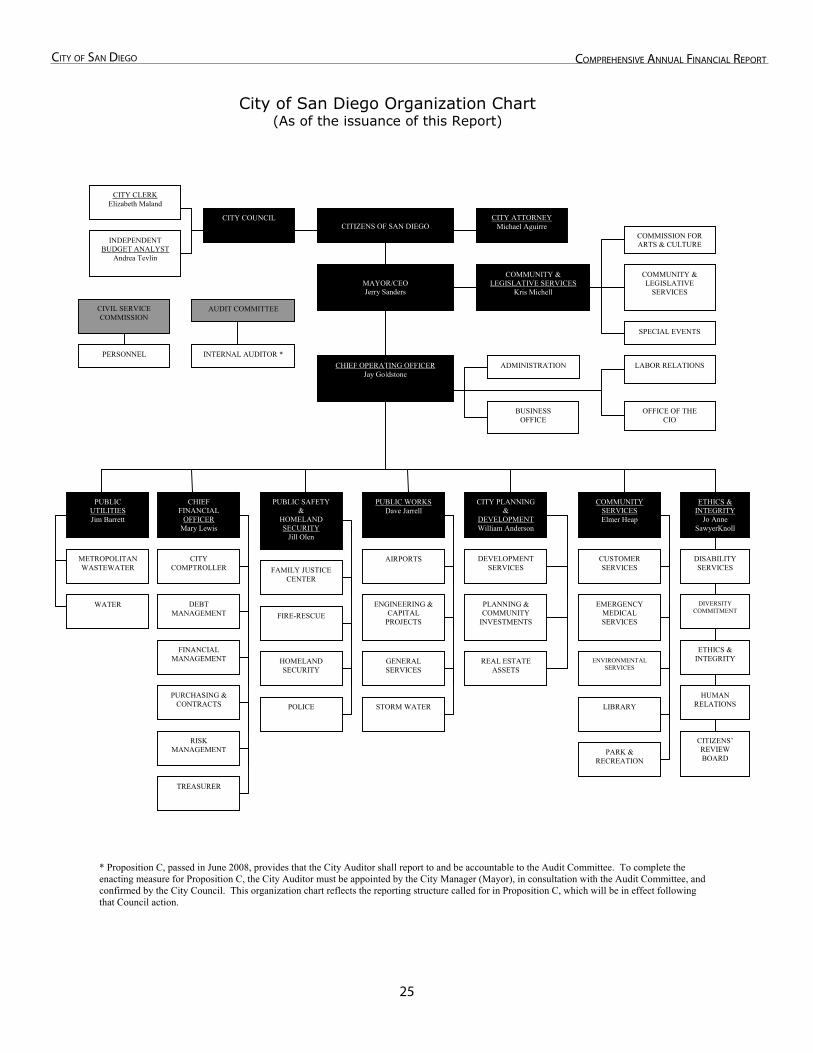
* Proposition C, passed in June 2008, provides that the City Auditor shall report to and be accountable to the Audit Committee. To complete the enacting measure for Proposition C, the City Auditor must be appointed by the City Manager (Mayor), in consultation with the Audit Committee, and confirmed by the City Council. This organization chart reflects the reporting structure called for in Proposition C, which will be in effect following that Council action.
City of San Diego Organization Chart
City of San Diego Organization Chart (As of the issuance of this Report)

2�
City of San Diego ComprehenSive annual finanCial report
Financial Reporting Entity
In accordance with Governmental Accounting Standards Board Statement 14, the following component units are incorporated into the accompanying financial statements:
Centre City Development Corporation (CCDC)
Convention Center Expansion Financing Authority (CCEFA)
City of San Diego Metropolitan Transit Development Board Authority (MTDB)
San Diego City Employees’ Retirement System (SDCERS) Public Facilities Financing Authority (PFFA)
Redevelopment Agency of the City of San Diego (RDA)
San Diego Convention Center Corporation (SDCCC)
San Diego Data Processing Corporation (SDDPC)
San Diego Facilities and Equipment Leasing Corporation (SDFELC)
San Diego Housing Commission (SDHC) San Diego Industrial Development Authority (SDIDA)
San Diego Open Space Park Facilities District #1Community Facility and Other Special Assessment Districts
Southeastern Economic Development Corporation (SEDC) Tobacco Settlement Revenue Funding Corporation (TSRFC)
Additionally, the City participates in a joint venture operation with a private company to provide for emergency medical and medical transportation services. This joint venture is a limited liability company named San Diego Medical Services Enterprise, LLC. The financial impact of the joint venture is displayed in the governmental funds statement of revenues, expenditures and changes in fund balance and in the government-wide statement of activities.
Budgetary Process
Pursuant to the City Charter, an annual budget is presented by the Mayor to the City Council for consideration. Set forth in this budget are the anticipated revenues and expenditures of the General Fund, certain special revenue funds, enterprise funds, and certain debt service funds for the ensuing fiscal year. Additionally, project-length financial plans are presented to and adopted by council for the capital projects funds. The level of budgetary control (the level at which expenditures cannot legally exceed the appropriated amount) is maintained at the fund, department, and object class level. Object classes are defined as salaries and non–personnel expense (including employee benefits). Copies of the City’s Budgets are available at the Financial Management Office located at 202 C Street, MS8A, San Diego, CA 92101.
The City also maintains an encumbrance accounting system as one technique of accomplishing budgetary control. Encumbered amounts are reported as reservations of fund balances since the commitments are expected to be honored in subsequent periods.
27
City of San Diego ComprehenSive annual finanCial report
We continue to look for ways to improve the effectiveness and efficiency of our operations. Our focus now is on crafting policy that will ensure a continued commitment to strong financial stewardship.
Sincerely,
_____________________ _______________________ Jerry Sanders Jay M. Goldstone Mayor Chief Operating Officer
_____________________ _______________________ Mary Lewis Greg Levin, CPA Chief Financial Officer Comptroller

This Page Left Intentionally Blank
28

finanCial SeCtion
FInancIal SectIon

This Page Left Intentionally Blank - Back of Divider Page
31
Independent Auditor’s Report
Independent Auditor’s Report
To the Honorable Mayor and Members of the City Council of the City of San Diego, California
We have audited the accompanying financial statements of the governmental activities, the business-type activities, the aggregate discretely presented component units, each major fund, and the aggregate remaining fund information of the City of San Diego, California (City), as of and for the year ended June 30, 2007, which collectively comprise the City’s basic financial statements as listed in the table of contents. These financial statements are the responsibility of the City’s management. Our responsibility is to express opinions on these financial statements based on our audit. We did not audit the financial statements of the San Diego Housing Commission, a discretely presented component unit, which statements reflect 90%, 94% and 83% of total assets, total net assets and total revenues, respectively, of the aggregate discretely presented component unit totals. Those financial statements were audited by other auditors whose report thereon has been furnished to us, and our opinion, insofar as it relates to the amounts included for the San Diego Housing Commission, is based solely on the report of the other auditors.
We conducted our audit in accordance with auditing standards generally accepted in the United States of America and the standards applicable to financial audits contained in Government Auditing Standards, issued by the Comptroller General of the United States. Those standards require that we plan and perform the audit to obtain reasonable assurance about whether the financial statements are free of material misstatement. The financial statements of the San Diego Convention Center Corporation were not audited in accordance with Government Auditing Standards. An audit includes consideration of internal control over financial reporting as a basis for designing audit procedures that are appropriate in the circumstances, but not for the purpose of expressing an opinion on the effectiveness of the City’s internal control over financial reporting. Accordingly, we express no such opinion. An audit also includes examining, on a test basis, evidence supporting the amounts and disclosures in the financial statements. An audit also includes assessing the accounting principles used and the significant estimates made by management, as well as evaluating the overall financial statement presentation. We believe that our audit and the report of other auditors provide a reasonable basis for our opinions.
In our opinion, based on our audit and the report of other auditors, the financial statements referred to above present fairly, in all material respects, the respective financial position of the governmental activities, the business-type activities, the aggregate discretely presented component units, each major fund, and the aggregate remaining fund information of the City as of June 30, 2007, and the respective changes in financial position, and, where applicable, cash flows thereof for the year then ended in conformity with accounting principles generally accepted in the United States of America.
32
In accordance with Government Auditing Standards, we have also issued our report dated October 17, 2008 on our consideration of the City’s internal control over financial reporting and on our tests of its compliance with certain provisions of laws, regulations, contracts, and grant agreements and other matters. The purpose of that report is to describe the scope of our testing of internal control over financial reporting and compliance and the results of that testing, and not to provide an opinion on the internal control over financial reporting or on compliance. That report is an integral part of an audit performed in accordance with Government Auditing Standards, and should be considered in assessing the results of our audit.
The management’s discussion and analysis, analysis of funding progress and general fund budgetary information on pages 31 through 45, 157 and 161 through 164, respectively, are not a required part of the basic financial statements but are supplementary information required by accounting principles generally accepted in the United States of America. We have applied certain limited procedures, which consisted principally of inquiries of management regarding the methods of measurement and presentation of the required supplementary information. However, we did not audit the information and express no opinion on it.
Our audit was conducted for the purpose of forming opinions on the financial statements that collectively comprise the City’s basic financial statements. The introductory section, supplementary information, and statistical section are presented for purposes of additional analysis and are not a required part of the basic financial statements. The supplementary information, except for the budgetary schedules on pages 208 through 215, 218 through 219, 228 through 229 and 231, have been subjected to the auditing procedures applied in the audit of the basic financial statements and, in our opinion, is fairly stated in all material respects in relation to the basic financial statements taken as a whole. The introductory section and statistical section have not been subjected to the auditing procedures applied by us in the audit of the basic financial statements and, accordingly, we express no opinion on them.
Certified Public Accountants
Los Angeles, California October 17, 2008
2
33
City of San Diego ComprehenSive annual finanCial report
Management’s Discussion and Analysis (Required Supplementary Information)
MANAGEMENT’S DISCUSSION AND ANALYSIS (Unaudited)
(In Thousands) June 30, 2007
As management of the City of San Diego (City), we offer readers of the City financial statements this narrative overview and analysis of the financial activities of the City for the fiscal year ended June 30, 2007.
OVERVIEW OF THE FINANCIAL STATEMENTS
This discussion and analysis is intended to serve as an introduction to the City’s basic financial statements. The City’s basicfinancial statements are comprised of three components: (1) government-wide financial statements; (2) fund financial statements; and (3) notes to the financial statements. This report also contains other supplementary information in addition tothe basic financial statements.
GOVERNMENT-WIDE FINANCIAL STATEMENTS
The focus of the government-wide financial statements is on reporting on the operating results and financial position of the government as an economic entity. These statements are intended to report the entity’s operational accountability to its readers, giving information about the probable medium and long-term effects of past decisions on the government’s financial position.
The statement of net assets presents information on all of the City’s assets and liabilities, with the difference between the tworeported as net assets. Over time, increases or decreases in net assets may serve as a useful indicator of whether the financialposition of the City is improving or deteriorating.
The statement of activities presents information showing changes in the City’s net assets during the fiscal year 2007. All changes in net assets are reported when the underlying event giving rise to the change occurs, regardless of the timing of related cash flows. The focus is on both gross and net costs of City functions, which are supported by general revenues. ThisStatement also distinguishes functions of the City that are principally supported by taxes and intergovernmental revenues (governmental activities) from other functions that are intended to recover all or a significant portion of their costs through user fees and charges (business-type activities). The governmental activities of the City include: General Government and Support; Public Safety - Police; Public Safety - Fire and Life Safety; Parks, Recreation, Culture and Leisure; Transportation; Sanitationand Health; and Neighborhood Services. The business-type activities of the City include: Airports; City Store; Development Services; Environmental Services; Golf Course; Recycling; Sewer Utility; and Water Utility.
The government-wide financial statements include the City (known as the primary government) and the following legally separate, discretely presented component units: San Diego Convention Center Corporation (SDCCC); and San Diego Housing Commission (SDHC). Financial information for these component units is reported separately from the financial information presented for the primary government. Blended component units, also legally separate entities, are a part of the government’s operations and are combined with the primary government.
Included within the primary government as blended component units:
Centre City Development Corporation (CCDC)
City of San Diego Metropolitan Transit Development Board Authority (MTDB Authority)
City of San Diego Tobacco Settlement Revenue Funding Corporation (TSRFC)
Community Facility and Other Special Assessment Districts
Convention Center Expansion Financing Authority (CCEFA)
Public Facilities Financing Authority (PFFA)
Redevelopment Agency of the City of San Diego (RDA)
San Diego City Employees’ Retirement System (SDCERS)
San Diego Data Processing Corporation (SDDPC)
3�
City of San Diego ComprehenSive annual finanCial report
San Diego Facilities and Equipment Leasing Corporation (SDFELC)
San Diego Industrial Development Authority (SDIDA)
San Diego Open Space Park Facilities District #1
Southeastern Economic Development Corporation (SEDC)
The government-wide financial statements can be found beginning on page 52 of this report.
FUND FINANCIAL STATEMENTSA fund is a grouping of related accounts that is used to maintain control over resources that have been segregated for specificactivities or objectives. The City, like other state and local governments, uses fund accounting to ensure and demonstrate compliance with finance-related legal requirements. All funds of the City can be divided into three categories: governmental funds, proprietary funds, and fiduciary funds.
GOVERNMENTAL FUNDS
Governmental funds are used to account for essentially the same functions reported as governmental activities in the government-wide financial statements. However, unlike the government-wide financial statements, governmental fund financial statements focus on near-term inflows and outflows of spendable resources, as well as balances of spendable resources available at the end of the fiscal year. Such information may be useful in evaluating a government’s near-term financing requirements.
Because the focus of governmental funds is narrower than that of the government-wide financial statements, it is useful to compare the information presented for governmental funds with similar information presented for governmental activities in the government-wide financial statements. By doing so, readers may better understand the long-term impact of the government’s near-term financing decisions. Both the governmental funds balance sheet and the governmental funds statement of revenues, expenditures, and changes in fund balances provide a reconciliation to facilitate this comparison between governmental funds and governmental activities.
The City maintains individual governmental funds. Information is presented separately in the governmental funds balance sheet and in the governmental funds statement of revenues, expenditures, and changes in fund balances for the general fund, which is a major fund. Data from the other governmental funds are combined into a single, aggregated presentation. Individual fund datafor each of these nonmajor governmental funds is provided in the Supplementary Information section of this report.
The City adopts an annual appropriated budget for its general fund. A budgetary comparison statement has been provided for the General Fund to demonstrate compliance with this budget and is presented as required supplementary information.
The basic governmental funds financial statements can be found beginning on page 56 of this report.
PROPRIETARY FUNDS
The City maintains two different types of proprietary funds, enterprise funds and internal service funds. Enterprise funds areused to report the same functions presented as business-type activities in the government-wide financial statements. The City uses Enterprise Funds to account for its various business-type activities. Internal Service funds, such as Central Garage and Machine Shop, Central Stores, Publishing Services, and Self Insurance, are used to report activities that provide centralized supplies and/or services to the City. All internal service funds, except for the Special Engineering Fund, have been included within governmental activities in the government-wide financial statements since they predominantly benefit governmental functions. The Special Engineering Fund, which services exclusively Water and Sewer activities, has been included within business-type activities in the government-wide financial statements.
Proprietary fund statements provide the same type of information as the government-wide financial statements, only in more detail. The proprietary funds financial statements provide separate information for the Water and Sewer funds, which are considered to be major funds of the City. Data for the nonmajor proprietary funds are combined into a single, aggregated presentation, and the internal service funds are combined into a single, aggregated presentation as well. Included in the Supplementary Information section of this report are individual fund data for the nonmajor proprietary funds and the internal service funds. The basic proprietary funds financial statements can be found beginning on page 60 of this report.
3�
City of San Diego ComprehenSive annual finanCial report
FIDUCIARY FUNDS
Fiduciary funds are used to account for resources held for the benefit of parties outside the government. Fiduciary funds are notreflected in the government-wide financial statements because the resources of those funds are not available to support the City’s operations. The accounting used for fiduciary funds is much like that used for proprietary funds.
The basic fiduciary funds financial statements can be found beginning on page 63 of this report.
NOTES TO THE FINANCIAL STATEMENTS
The notes provide additional information that is essential to a full understanding of the data provided in the government-wide and fund financial statements. The notes to the financial statements can be found beginning on page 65 of this report.
OTHER INFORMATION
In addition to the basic financial statements and accompanying notes, this report also presents certain required supplementary information concerning the City’s progress in funding its obligation to provide pension benefits to its employees. Required supplementary information can be found beginning on page 159 of this report.
The individual fund data referred to earlier in connection with nonmajor governmental funds, nonmajor proprietary funds, internalservice funds, and fiduciary funds are presented immediately following the required supplementary information on pensions and the General Fund budgetary comparison statement, beginning on page 191 of this report.
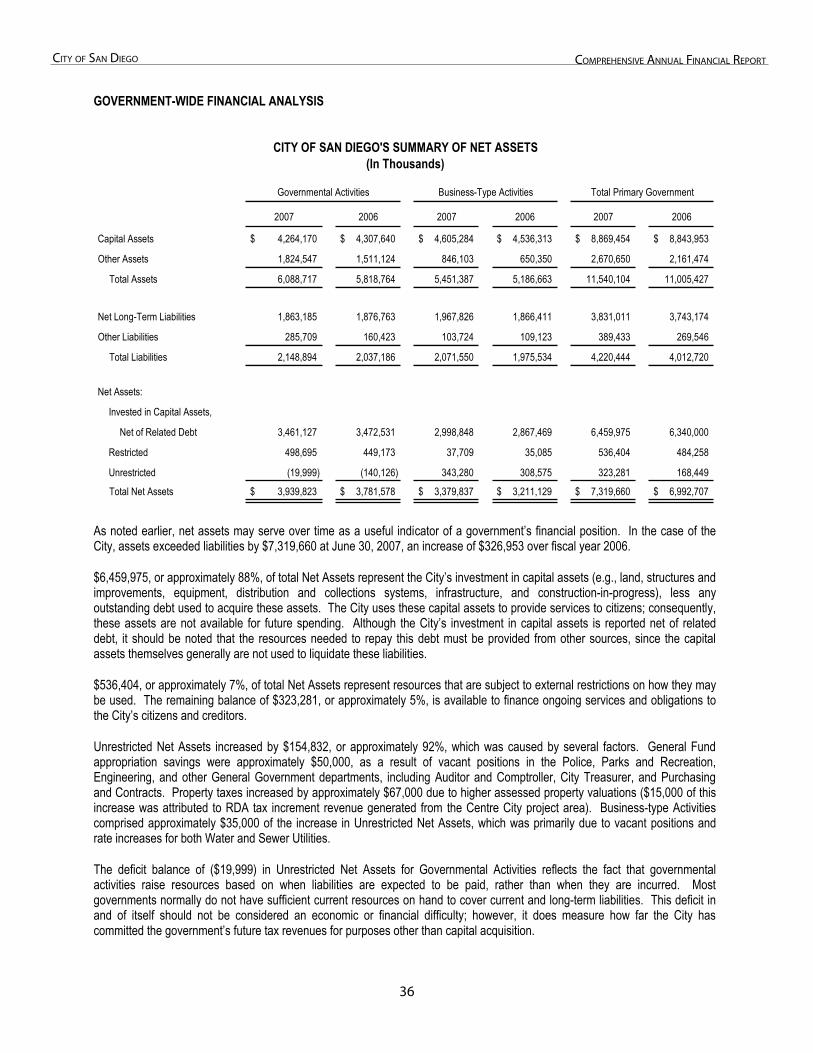
3�
City of San Diego ComprehenSive annual finanCial report
GOVERNMENT-WIDE FINANCIAL ANALYSIS
CITY OF SAN DIEGO'S SUMMARY OF NET ASSETS(In Thousands)
2007 2006 2007 2006 2007 2006
Capital Assets 4,264,170$ 4,307,640$ 4,605,284$ 4,536,313$ 8,869,454$ 8,843,953$
Other Assets 1,824,547 1,511,124 846,103 650,350 2,670,650 2,161,474
Total Assets 6,088,717 5,818,764 5,451,387 5,186,663 11,540,104 11,005,427
Net Long-Term Liabilities 1,863,185 1,876,763 1,967,826 1,866,411 3,831,011 3,743,174
Other Liabilities 285,709 160,423 103,724 109,123 389,433 269,546
Total Liabilities 2,148,894 2,037,186 2,071,550 1,975,534 4,220,444 4,012,720
Net Assets:
Invested in Capital Assets,
Net of Related Debt 3,461,127 3,472,531 2,998,848 2,867,469 6,459,975 6,340,000
Restricted 498,695 449,173 37,709 35,085 536,404 484,258
Unrestricted (19,999) (140,126) 343,280 308,575 323,281 168,449
Total Net Assets 3,939,823$ 3,781,578$ 3,379,837$ 3,211,129$ 7,319,660$ 6,992,707$
Governmental Activities Business-Type Activities Total Primary Government
As noted earlier, net assets may serve over time as a useful indicator of a government’s financial position. In the case of theCity, assets exceeded liabilities by $7,319,660 at June 30, 2007, an increase of $326,953 over fiscal year 2006.
$6,459,975, or approximately 88%, of total Net Assets represent the City’s investment in capital assets (e.g., land, structures and improvements, equipment, distribution and collections systems, infrastructure, and construction-in-progress), less any outstanding debt used to acquire these assets. The City uses these capital assets to provide services to citizens; consequently,these assets are not available for future spending. Although the City’s investment in capital assets is reported net of relateddebt, it should be noted that the resources needed to repay this debt must be provided from other sources, since the capital assets themselves generally are not used to liquidate these liabilities.
$536,404, or approximately 7%, of total Net Assets represent resources that are subject to external restrictions on how they maybe used. The remaining balance of $323,281, or approximately 5%, is available to finance ongoing services and obligations to the City’s citizens and creditors.
Unrestricted Net Assets increased by $154,832, or approximately 92%, which was caused by several factors. General Fund appropriation savings were approximately $50,000, as a result of vacant positions in the Police, Parks and Recreation, Engineering, and other General Government departments, including Auditor and Comptroller, City Treasurer, and Purchasing and Contracts. Property taxes increased by approximately $67,000 due to higher assessed property valuations ($15,000 of this increase was attributed to RDA tax increment revenue generated from the Centre City project area). Business-type Activities comprised approximately $35,000 of the increase in Unrestricted Net Assets, which was primarily due to vacant positions and rate increases for both Water and Sewer Utilities.
The deficit balance of ($19,999) in Unrestricted Net Assets for Governmental Activities reflects the fact that governmental activities raise resources based on when liabilities are expected to be paid, rather than when they are incurred. Most governments normally do not have sufficient current resources on hand to cover current and long-term liabilities. This deficit in and of itself should not be considered an economic or financial difficulty; however, it does measure how far the City has committed the government’s future tax revenues for purposes other than capital acquisition.
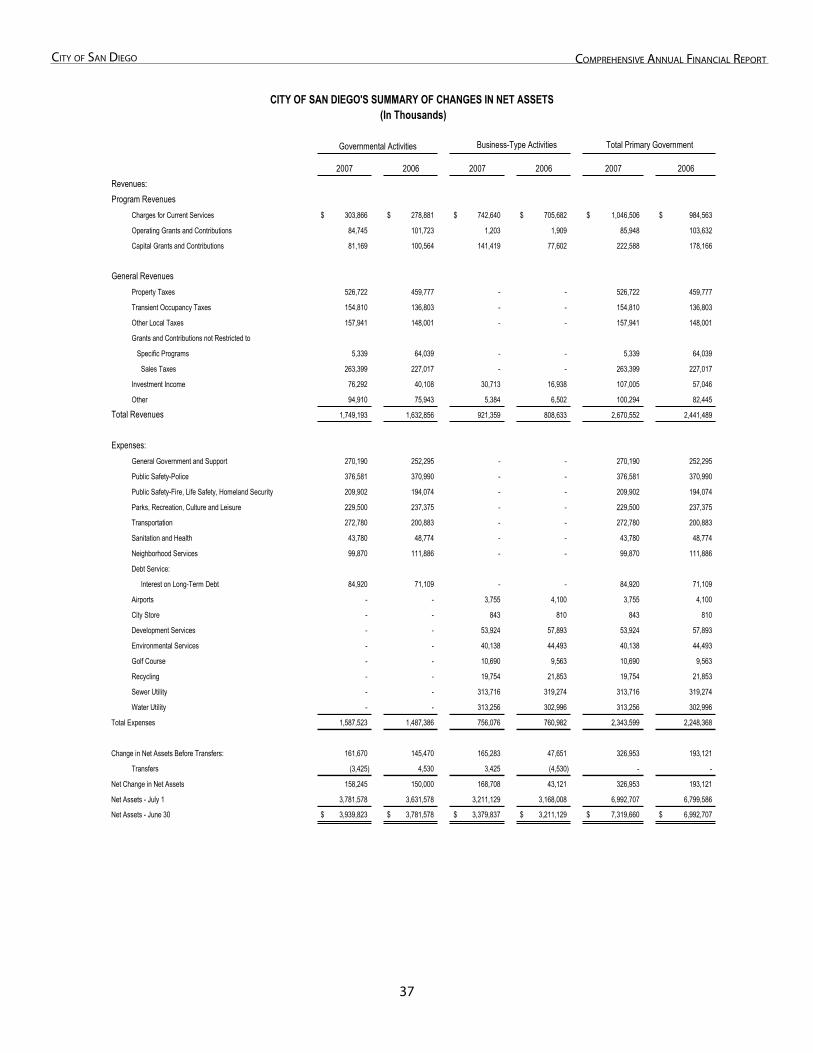
37
City of San Diego ComprehenSive annual finanCial report
CITY OF SAN DIEGO'S SUMMARY OF CHANGES IN NET ASSETS (In Thousands)
Governmental Activities Business-Type Activities Total Primary Government
2007 2006 2007 2006 2007 2006Revenues:Program Revenues
Charges for Current Services 303,866$ 278,881$ 742,640$ 705,682$ 1,046,506$ 984,563$
Operating Grants and Contributions 84,745 101,723 1,203 1,909 85,948 103,632
Capital Grants and Contributions 81,169 100,564 141,419 77,602 222,588 178,166
General RevenuesProperty Taxes 526,722 459,777 - - 526,722 459,777
Transient Occupancy Taxes 154,810 136,803 - - 154,810 136,803
Other Local Taxes 157,941 148,001 - - 157,941 148,001
Grants and Contributions not Restricted to
Specific Programs 5,339 64,039 - - 5,339 64,039
Sales Taxes 263,399 227,017 - - 263,399 227,017
Investment Income 76,292 40,108 30,713 16,938 107,005 57,046
Other 94,910 75,943 5,384 6,502 100,294 82,445
Total Revenues 1,749,193 1,632,856 921,359 808,633 2,670,552 2,441,489
Expenses:General Government and Support 270,190 252,295 - - 270,190 252,295
Public Safety-Police 376,581 370,990 - - 376,581 370,990
Public Safety-Fire, Life Safety, Homeland Security 209,902 194,074 - - 209,902 194,074
Parks, Recreation, Culture and Leisure 229,500 237,375 - - 229,500 237,375
Transportation 272,780 200,883 - - 272,780 200,883
Sanitation and Health 43,780 48,774 - - 43,780 48,774
Neighborhood Services 99,870 111,886 - - 99,870 111,886
Debt Service:
Interest on Long-Term Debt 84,920 71,109 - - 84,920 71,109
Airports - - 3,755 4,100 3,755 4,100
City Store - - 843 810 843 810
Development Services - - 53,924 57,893 53,924 57,893
Environmental Services - - 40,138 44,493 40,138 44,493
Golf Course - - 10,690 9,563 10,690 9,563
Recycling - - 19,754 21,853 19,754 21,853
Sewer Utility - - 313,716 319,274 313,716 319,274
Water Utility - - 313,256 302,996 313,256 302,996
Total Expenses 1,587,523 1,487,386 756,076 760,982 2,343,599 2,248,368
Change in Net Assets Before Transfers: 161,670 145,470 165,283 47,651 326,953 193,121
Transfers (3,425) 4,530 3,425 (4,530) - -
Net Change in Net Assets 158,245 150,000 168,708 43,121 326,953 193,121
Net Assets - July 1 3,781,578 3,631,578 3,211,129 3,168,008 6,992,707 6,799,586
Net Assets - June 30 3,939,823$ 3,781,578$ 3,379,837$ 3,211,129$ 7,319,660$ 6,992,707$
38
City of San Diego ComprehenSive annual finanCial report
GOVERNMENTAL ACTIVITIES
Governmental activities increased the City’s net assets by $158,245 during fiscal year 2007. Variances from fiscal year 2006 ofmore than 10% are discussed below.
Operating Grants and Contributions decreased by $16,978, or approximately 17%. The administration of the “6 to 6” Extended School Day program was transferred to the San Diego Unified School District as of January 1, 2007, which resulted in a decrease of approximately $9,000. Special Assessments revenues for the Maintenance Assessment Districts (MAD’s) were reclassified from “Operating Grants and Contributions” to “Charges for Services,” which caused a decrease of approximately $13,000, and a similar reclassification of CCDC’s services to RDA from “Operating Grants and Contributions” to “Charges for Services” resulted in a decrease of approximately $7,000. These decreases were partially offset by an increase in tobacco revenues of approximately $10,000. Effective in fiscal year 2007, all tobacco revenues due to the City were paid directly to the TSRFC, in order to make debt service payments on the outstanding tobacco settlement bonds.
Capital Grants and Contributions decreased by $19,395, or approximately 19%. The San Diego Padres advanced money to RDA in prior years, for the purpose of acquiring land surrounding Petco Park. The City recorded these advances as land acquisition credits to be used by the developer against the sales price of the land. In fiscal year 2006, the conveyance of these parcels was substantially completed, which resulted in the recognition of approximately $35,000 in Capital Grants and Contributions revenue. In fiscal year 2007, the last remaining credits were used, for which only $1,000 in revenue was recognized, resulting in a revenue decrease of approximately $34,000. Offsetting this large decrease was approximately $18,000 due to increases in developer contributed assets in several communities, including Otay Mesa, San Ysidro, Black Mountain Ranch, and Carmel Valley.
Property Tax revenue increased by $66,945, or approximately 15%, primarily due to increases in assessed property values, both in the City and Redevelopment project areas, including approximately $15,000 attributable to the Centre City redevelopment project area.
Transient Occupancy Tax revenues increased by $18,007, or approximately 13%, primarily due to continued growth in San Diego’s tourism industry. According to data from the San Diego Convention & Visitors Bureau, average occupancy rates remained unchanged at approximately 73%, however, average daily room rates increased by approximately 7.9% over fiscal year 2006.
Grants and Contributions not Restricted to Specific Programs decreased by $58,700, or approximately 92%, primarily due to the current year reclassification of In-Lieu Sales Tax, from Grants and Contributions not Restricted, to Sales Taxes.
Sales Taxes increased by $36,382, or approximately 16%, primarily due to the reclassification of In-Lieu Sales Tax mentioned above.
Investment Income increased by $36,184, or approximately 90%, primarily due to changes in market values of all investments. This was primarily attributed to increases in the City’s investment pool, due to higher market values and an increase in the overall size of the investment pool from fiscal year 2006 to 2007.
Other Revenue increased by $18,967, or approximately 25%. Approximately $15,000 of the increase resulted from the government-wide adjustment reclassifying current year Facilities Benefit Assessment (FBA) credit additions as Developer Contributions revenue, rather than a reduction of expenses as was recorded in previous years. This was partially offset by a net decrease in Developer Contributions revenue at the fund level of approximately $5,800, which included a $6,000 increase related to the Torrey Hills Developer Agreement for the Carmel Mountain Road I-5 Interchange project and a $13,000 decrease caused by declining development within the North University City and Torrey Highlands communities.
A gain of approximately $5,600 resulted from the sale of several parcels of land. As part of an overall portfolio management plan for the City, the Real Estate Assets department is continuing to review the City’s property inventory to determine which properties are no longer needed and may be designated for disposition. In addition, approximately $6,400 of the increase was attributed to RDA’s sale of land held for resale.
3�
City of San Diego ComprehenSive annual finanCial report
Transportation expense increased by $71,897, or approximately 36%, primarily due to adjustments for donated capital assets related to FBA credit projects. FBA credit projects are not capitalized until final inspections have taken place, whichoften occurs after substantial completion. During fiscal year 2007 the adjustment for completed projects funded by FBA credits in prior years resulted in an increase of approximately $41,000 in transportation expenses. There was also a write off of capital improvement project costs related to the State Route 905 project. The State Route 905 project was originally anticipated to be a City project but was later turned over to the State. When turned over, the write-off of previously capitalized costs resulted in an expense of almost $5,000. There was an additional increase of approximately $15,000 as a result of current year FBA additions being reclassified as Developer Contributions revenue, rather than a reduction of expenses as was recorded in previous years.
Sanitation and Health expense decreased by $4,994, or approximately 10%, due to the reclassification of the City’s Animal Regulation program. Effective in fiscal year 2007, the Animal Regulation Program was taken over by the Police Department. It had previously been included with Citywide Programs and reported as Sanitation and Health.
Neighborhood Services expense decreased by $12,016, or approximately 11%, partially due to write-downs in the value of property held for resale in redevelopment project areas of approximately $8,000 during fiscal year 2006. The amount of write-downs varies from year to year depending on real estate market conditions and disposition and development agreements entered into during the fiscal year. RDA expenses decreased by an additional $5,300 as a result of a fiscal year 2006 expense for the construction of low and moderate income residential units in the Crossroads project area. The administration of the “6 to 6” Extended School Day program was transferred to the San Diego Unified School District as of January 1, 2007, which resulted in a $6,500 decrease in expenditures for the City’s Grants Funds. These decreases were offset by a $12,990 liability accrued to reflect the potential reimbursement of federal funds related to ongoing audits.
Interest expense increased by $13,811, or approximately 19%, due to Centre City Redevelopment Project Tax Allocation Bonds, Series 2006 A and B, and Tobacco Settlement Asset-Backed Bonds, Series 2006, which were issued in fiscal year 2006 and began paying debt service in fiscal year 2007. There was also an additional TRANs interest payment made in fiscal year 2007.
BUSINESS-TYPE ACTIVITIES
Business-type activities increased the City’s net assets by $168,708 during fiscal year 2007. Variances from fiscal year 2006 ofmore than 10% are discussed below.
Operating Grants and Contributions decreased by $706, or approximately 37%, primarily due to fewer Water and Sewer Utility revenues received during fiscal year 2007 compared to 2006, associated with grant reimbursement projects, particularly water desalination studies and disaster assistance recoveries.
Capital Grants and Contributions increased by $63,817, or approximately 82%, primarily due to additional water and sewer main installations by developers.
Investment Income increased by $13,775, or approximately 81%, primarily due to changes in market values of all investments. This was primarily attributed to increases in the City’s investment pool, due to higher market values and an increase in the overall size of the investment pool from fiscal year 2006 to 2007.
Other revenues decreased by $1,118, or approximately 17%, primarily due to fewer receipts of permits and fees for the Sewer Utility department.
Environmental Services expense decreased by $4,355, or approximately 10%, as a result of a Business Process Reengineering process undergone by the department during fiscal year 2007. Operating inefficiencies were corrected, and it was discovered that the Environmental Services Fund paid for expenditures that should have been charged to the General Fund. As a result, the Environmental Services Fund was reimbursed approximately $2,000 from the General Fund during fiscal year 2007.
Golf Course expense increased by $1,127, or approximately 12%, primarily due to preparation for the U.S. Open held at the Torrey Pines municipal golf course during fiscal year 2008.
�0
City of San Diego ComprehenSive annual finanCial report
FINANCIAL ANALYSIS OF THE GOVERNMENT’S FUNDS
As noted earlier, the City uses fund accounting to ensure and demonstrate compliance with finance-related legal requirements.
GOVERNMENTAL FUNDS
The focus of the City’s governmental funds is to provide information on near-term inflows, outflows, and balances of spendable resources. Such information is useful in assessing the City’s financing requirements. In particular, unreserved fund balance may serve as a useful measure of a government’s net resources available for spending at the end of the fiscal year.
As of the end of fiscal year 2007, the City’s governmental funds reported combined ending fund balances of $1,365,763, an increase of $228,524 from fiscal year 2006. Approximately $825,212 constitutes unreserved fund balance, which is available forspending at the government’s direction. The remainder of fund balance is reserved to indicate that it is not available for newspending because it has already been committed (1) to liquidate contracts and purchase orders of the period, (2) to pay debt service, (3) to generate income to pay for the perpetual funding of various programs, or (4) for a variety of other purposes.
The General Fund is the principal operating fund of the City. At the end of fiscal year 2007, undesignated fund balance of theGeneral Fund was $95,031, while total fund balance was $132,048. This represents a $70,407 increase from the fiscal year 2006 total fund balance.
PROPRIETARY FUNDS
The City’s proprietary fund statements provide the same type of information found in the government-wide financial statements, but in more detail.
As of the end of fiscal year 2007, Unrestricted Net Assets of the Sewer Utility Fund are $152,060. Unrestricted Net Assets increased approximately $36,457, or approximately 32%, mainly due to decreased administration costs and vacant positions, combined with sewer rate increases and a transfer from the Central Garage and Machine Shop Fund of $7,000 for savings accumulated in the Sewer vehicle replacement funds.
As of the end of fiscal year 2007, Unrestricted Net Assets of the Water Utility Fund are $137,704. Unrestricted Net Assets decreased by $10,473, or approximately 7%.
GENERAL FUND BUDGETARY HIGHLIGHTS The original budget for expenditures and transfers out was $36,466 lower than the final budget due to increases (decreases) in appropriations primarily attributed to the following:
$4,745 for General Government. This was due to increased Public Liability costs, as well as the addition of Parking Management positions and related costs to the City Treasurer’s department. Effective in fiscal year 2007, the Parking Management Department was dissolved and the parking management functions and related positions were split between the Police and City Treasurer’s Departments. This change required increases in the Police and General Government budgets, and an offsetting decrease in the Transportation budget.
$5,126 for Public Safety-Police. This increase was related to the reclassification of Parking Management mentioned above, in addition to higher than anticipated data processing and energy costs for the Police department.
$2,868 for Public Safety-Fire and Life Safety and Homeland Security. This increase was mainly due to retirement contributions, energy, and fuel costs which exceeded anticipated amounts.
($6,521) for Transportation. This decrease is related to the reclassification of Parking Management mentioned in the General Government explanation above.
$2,038 for Sanitation and Health. This increase was related to repayments made to the Recycling and Environmental Services Funds for activities that were budgeted and charged to the Enterprise Funds in error.
�1
City of San Diego ComprehenSive annual finanCial report
$2,604 for Principal Retirement. This was due to capital lease payments for Police and Parking Enforcement vehicles, as well as equipment, vehicles, and helicopters for the Fire and Life Safety department.
$4,529 for Debt Service Interest. The amount of interest expense for the Tax Revenue Anticipation Notes was unknown at the time the original budget was developed.
$19,350 for Transfers to Other Funds. This increase was primarily due to a $10,000 transfer to the Other Construction capital improvements fund for streets resurfacing contracts and roof replacements in Balboa Park. There was an additional increase of approximately $9,000 for a transfer to the Police Decentralization special revenue fund. In prior years this fund received sales tax revenues directly, but effective in fiscal year 2007, all sales tax was reported in the General Fund and then transferred out to the other funds supported by sales tax revenues.
Actual revenues received for the General Fund were $15,348 less than budgeted. Property Taxes and Transient Occupancy Taxes were over budget by $5,714 and $7,840, respectively, as a result of higher than anticipated growth. Sales Taxes were under budget by $9,685, which was a result of slower than anticipated growth in local retail sales. Other Local Taxes were underbudget by $5,587 primarily due to decreased Property Transfer Tax revenues, as a result of a downturn in the real estate market.Fines, Forfeitures, and Penalties were over budget by $2,396, primarily due to litigation awards received related to prior yearaudits and actuarial valuations. Revenue from Other Agencies was $8,862 under budget. This was the result of Securitized Tobacco Revenue being budgeted as part of Revenue from Other Agencies, when in fact the actual receipts were recorded as a Transfer from Other Funds. Charges for Current Services were also under budget by $9,548, primarily due to reductions in service level agreements with other funds.
Actual expenditures for the General Fund were $52,017 less than budgeted, primarily due to vacant positions in the Police, Parks& Recreation, Engineering, and other General Government departments, including Auditor and Comptroller, City Treasurer, and Purchasing and Contracts.
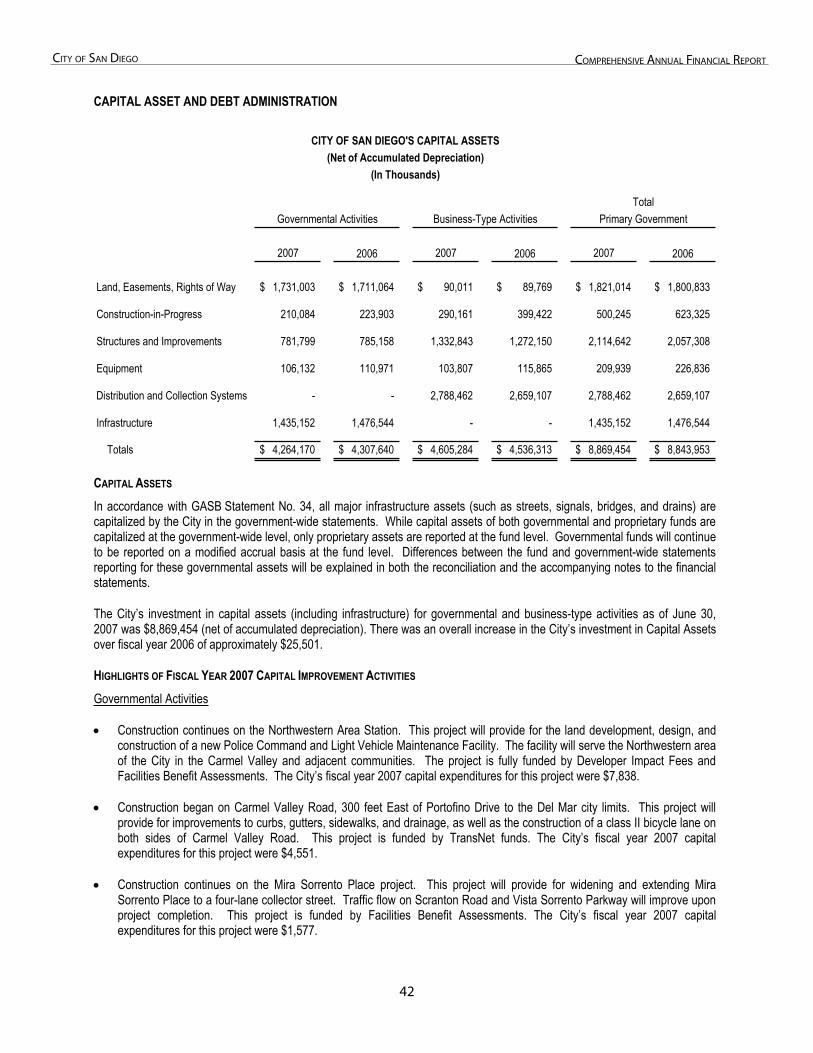
�2
City of San Diego ComprehenSive annual finanCial report
CAPITAL ASSET AND DEBT ADMINISTRATION
CITY OF SAN DIEGO'S CAPITAL ASSETS(Net of Accumulated Depreciation)
(In Thousands)
TotalGovernmental Activities Business-Type Activities Primary Government
2007 2006 2007 2006 2007 2006
Land, Easements, Rights of Way 1,731,003$ 1,711,064$ 90,011$ 89,769$ 1,821,014$ 1,800,833$
Construction-in-Progress 210,084 223,903 290,161 399,422 500,245 623,325
Structures and Improvements 781,799 785,158 1,332,843 1,272,150 2,114,642 2,057,308
Equipment 106,132 110,971 103,807 115,865 209,939 226,836
Distribution and Collection Systems - - 2,788,462 2,659,107 2,788,462 2,659,107
Infrastructure 1,435,152 1,476,544 - - 1,435,152 1,476,544
Totals 4,264,170$ 4,307,640$ 4,605,284$ 4,536,313$ 8,869,454$ 8,843,953$
CAPITAL ASSETS
th GASB Statement No. 34, all major infrastructure assets (such as streets, signals, bridges, and drains) are
The City’s investment in capital assets (including infrastructure) for governmental and business-type activities as of June 30,
HIGHLIGHTS OF FISCAL YEAR 2007 CAPITAL IMPROVEMENT ACTIVITIES
In accordance wicapitalized by the City in the government-wide statements. While capital assets of both governmental and proprietary funds arecapitalized at the government-wide level, only proprietary assets are reported at the fund level. Governmental funds will continueto be reported on a modified accrual basis at the fund level. Differences between the fund and government-wide statements reporting for these governmental assets will be explained in both the reconciliation and the accompanying notes to the financialstatements.
2007 was $8,869,454 (net of accumulated depreciation). There was an overall increase in the City’s investment in Capital Assetsover fiscal year 2006 of approximately $25,501.
Governmental Activities
Construction continues on the Northwestern Area Station. This project will provide for the land development, design, and
Construction began on Carmel Valley Road, 300 feet East of Portofino Drive to the Del Mar city limits. This project will
Construction continues on the Mira Sorrento Place project. This project will provide for widening and extending Mira
construction of a new Police Command and Light Vehicle Maintenance Facility. The facility will serve the Northwestern area of the City in the Carmel Valley and adjacent communities. The project is fully funded by Developer Impact Fees and Facilities Benefit Assessments. The City’s fiscal year 2007 capital expenditures for this project were $7,838.
provide for improvements to curbs, gutters, sidewalks, and drainage, as well as the construction of a class II bicycle lane on both sides of Carmel Valley Road. This project is funded by TransNet funds. The City’s fiscal year 2007 capital expenditures for this project were $4,551.
Sorrento Place to a four-lane collector street. Traffic flow on Scranton Road and Vista Sorrento Parkway will improve upon project completion. This project is funded by Facilities Benefit Assessments. The City’s fiscal year 2007 capital expenditures for this project were $1,577.
�3
City of San Diego ComprehenSive annual finanCial report
Construction continues on Judicial Drive from Golden Haven to Eastgate Mall. This project will provide a new four lane
Construction began on the Nobel Athletic Area. Upon completion, this project will provide an additional twenty-four acres of
Construction continues on the Carmel Mountain Road-Interstate 5 Interchange project. This project provides for a diamond
Construction began on the Pacific Highlands Ranch Fire Station #47. This project will provide for a new 10,500 square foot
Construction continues on the North University Community Branch Library. This project will provide for the construction of a
Construction was completed on Phase 1 of the Black Mountain Ranch Community Park. This first phase of the project
Construction continues on the Serra Mesa/Kearny Mesa Branch Library. This project will provide for the construction of a
usiness-Type Activities
major street and under-crossing at La Jolla Village Drive. The project is funded by the North University City Facilities Benefit Assessment. The City’s fiscal year 2007 capital expenditures for this project were $2,056.
developed park land. Improvements will include a 10,300 square foot recreation center, sports fields, comfort stations, an off-leash dog area, play, and parking areas in the University City area. The City’s fiscal year 2007 capital expenditures for this project were $5,538. The project is entirely funded by the North University City Facilities Benefit Assessment.
interchange at Interstate 5 and Carmel Mountain Road. This interchange will accommodate the increase in vehicular traffic created by development in the communities of Carmel Valley and Sorrento Hills. The City’s fiscal year 2007 capital expenditures for this project were $5,110. This project is funded by Facilities Benefit Assessments.
fire station to serve the Pacific Highlands Ranch community. The project is part of the Pacific Highlands Ranch Facilities Financing Plan. The City’s fiscal year 2007 capital expenditures for this project were $2,832.
15,000 square-foot library on a City owned park site at Nobel Drive and Judicial Drive to serve the community in North University City. This project is funded by Facilities Benefit Assessments. The City’s fiscal year 2007 capital expenditures forthis project were $3,581.
provided for the acquisition and development of 13 acres of useable park land including athletic fields and a parking lot. Phase 2 will provide for the development of an additional 17 acres of park land. This project is funded by Facilities Benefit Assessments. The City’s fiscal year 2007 capital expenditures for this project were $2,950.
new 15,000 square-foot library on the 8900 Block of Aero Drive. Upon completion the new facility will include additional meeting rooms, computer lab, separate children’s area and quiet study areas. Additional parking has also been incorporated into the design of the new facility. Serra Mesa and Kearny Mesa Developer Impact fees are the primary funding sources for this project. The City’s fiscal year 2007 capital expenditures for this project were $1,566.
B
During fiscal year 2007, the Water Utility Fund added approximately $35,300 in capital improvement projects (CIP). Upgrades
uring fiscal year 2007, the Sewer Utility Fund added approximately $30,900 in CIP, of which the Metropolitan system CIP
and expansion of the Miramar Water Treatment Plant and the Alvarado Water Treatment Plant continued, along with Water Main Replacements. Capital asset write-offs for fiscal year 2007 were approximately $5,900, and were primarily related to losses onabandoned projects, and retirements of developer contributed assets.
Dincreased approximately $2,200 and included the Point Loma Grit Processing Improvements. Municipal system CIP increased approximately $28,700 and included the following major projects: Pipeline Rehabilitation Phase C-1, Sorrento Valley Trunk Sewer Relocation, Pump Station Upgrades, and the continued replacement of sewer mains and upgrades to the sewer infrastructure. Capital asset write-offs for fiscal year 2007 were approximately $9,000, and were primarily related to losses onabandoned projects, and retirements of developer contributed assets.
��
City of San Diego ComprehenSive annual finanCial report
HIGHLIGHTS OF APPROVED FISCAL YEAR 2008 CAPITAL IMPROVEMENT PROJECTS (CIP) BUDGET
ich is an increase of $197,900, or
overnmental Activities
The Annual Approved Capital Improvements Budget for Fiscal Year 2008 is $491,600 whapproximately 67% over the fiscal year 2007 budget of $293,700. The increase in the Fiscal Year 2008 budget is primarily due to an increase in Water and Sewer projects. Water and Sewer projects comprise over 50% of the total CIP budget. Engineering & Capital Projects and General Services projects comprise 27%, and 9% of the total CIP budget, respectively. Funding for governmental projects include TransNet funds, Facilities Benefit Assessments, Developer Impact Fees, developer contributions, and Federal, State, local, and private contributions. Highlights of the key budgets by department are as follows:
G
Engineering and Capital Projects: $134,500 (27% of total CIP budget). Key projects include the undergrounding of
General Services: $44,000 (9% of total CIP budget). Key budgets include: $27,400 for deferred maintenance
Parks and Recreation: $30,700 (6% of total CIP budget). Planned project types for fiscal year 2008 include play area
Chief Information Officer: $19,600 (4% of total CIP budget). This allocation includes $16,300 for the Enterprise
usiness-Type Activities
City utilities to augment the California Public Utilities Commission (CPUC) Rule 20A funds. Funding is also allocated for conversion of City-owned street lighting and resurfacing of roadways associated with the undergrounding of utilities. The $58,600 annual allocation for these projects is entirely funded by the Underground Surcharge Fund. Other significant projects include: $7,700 for Palm Avenue/I-805 Improvements, $6,000 for Camino del Sur–Carmel Mountain Road, and $4,500 for Carroll Canyon Road–Sorrento Valley to Scranton Road.
including street resurfacing, storm drain repair, and sidewalk repair; $12,300 for ADA improvements; and $5,300 for City facilities improvements which include roof replacements and air conditioning and heating upgrade replacements.
upgrades, joint use fields, roof reconstruction, accessibility improvements, comfort stations, picnic shelters, sports field and security lighting, and new park development.
Resource Planning (ERP) System and $3,300 for public safety communication upgrade projects.
B
The fiscal year 2008 Water Utility CIP budget is $145,600. There are no phase funded projects budgeted for fiscal year 2008.
he fiscal year 2008 Sewer Utility CIP budget is $100,700. There are no phase funded projects budgeted for fiscal year 2008.
Significant projects include: $31,200 for replacing water mains citywide; $44,600 for the Miramar Water Treatment Plant; $19,200 for the Otay Water Treatment Plant; and $13,200 for the Alvarado Water Treatment Plant Expansion.
TSignificant projects include: $42,400 for continued sewer main replacements and upgrades to sewer infrastructure; $19,800 for repair and upgrade of pump stations; $18,600 for replacement of trunk sewers; and $7,600 for repair and upgrade of treatment plants.
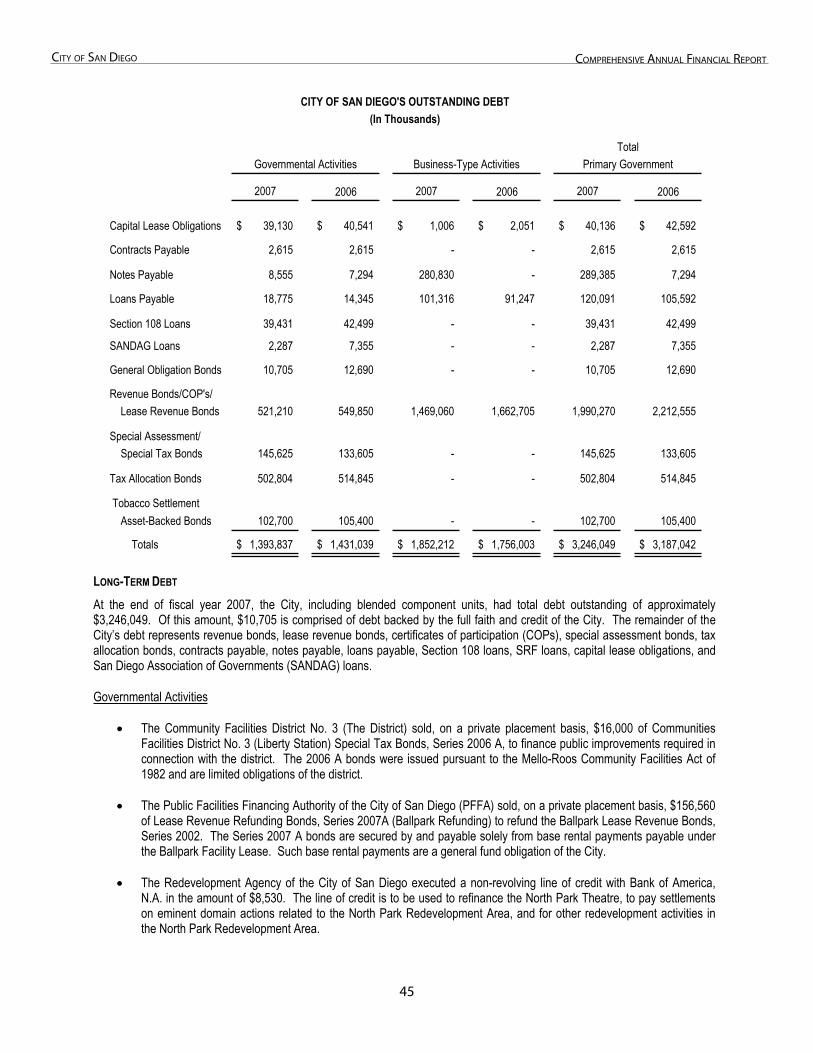
��
City of San Diego ComprehenSive annual finanCial report
CITY OF SAN DIEGO'S OUTSTANDING DEBT(In Thousands)
TotalGovernmental Activities Business-Type Activities Primary Government
2007 2006 2007 2006 2007 2006
Capital Lease Obligations 39,130$ 40,541$ 1,006$ 2,051$ 40,136$ 42,592$
Contracts Payable 2,615 2,615 - - 2,615 2,615
Notes Payable 8,555 7,294 280,830 - 289,385 7,294
Loans Payable 18,775 14,345 101,316 91,247 120,091 105,592
Section 108 Loans 39,431 42,499 - - 39,431 42,499
SANDAG Loans 2,287 7,355 - - 2,287 7,355
General Obligation Bonds 10,705 12,690 - - 10,705 12,690
Revenue Bonds/COP's/Lease Revenue Bonds 521,210 549,850 1,469,060 1,662,705 1,990,270 2,212,555
Special Assessment/Special Tax Bonds 145,625 133,605 - - 145,625 133,605
Tax Allocation Bonds 502,804 514,845 - - 502,804 514,845
Asset-Backed Bonds 102,700 105,400 - - 102,700 105,400
Totals 1,393,837$ 1,431,039$ 1,852,212$ 1,756,003$ 3,246,049$ 3,187,042$
Tobacco Settlement
LONG-TERM DEBT
At the end of fiscal year 2007, the City, including blended component units, had total debt outstanding of approximately $3,246,049. Of this amount, $10,705 is comprised of debt backed by the full faith and credit of the City. The remainder of theCity’s debt represents revenue bonds, lease revenue bonds, certificates of participation (COPs), special assessment bonds, tax allocation bonds, contracts payable, notes payable, loans payable, Section 108 loans, SRF loans, capital lease obligations, andSan Diego Association of Governments (SANDAG) loans.
Governmental Activities
The Community Facilities District No. 3 (The District) sold, on a private placement basis, $16,000 of Communities Facilities District No. 3 (Liberty Station) Special Tax Bonds, Series 2006 A, to finance public improvements required in connection with the district. The 2006 A bonds were issued pursuant to the Mello-Roos Community Facilities Act of 1982 and are limited obligations of the district.
The Public Facilities Financing Authority of the City of San Diego (PFFA) sold, on a private placement basis, $156,560 of Lease Revenue Refunding Bonds, Series 2007A (Ballpark Refunding) to refund the Ballpark Lease Revenue Bonds, Series 2002. The Series 2007 A bonds are secured by and payable solely from base rental payments payable under the Ballpark Facility Lease. Such base rental payments are a general fund obligation of the City.
The Redevelopment Agency of the City of San Diego executed a non-revolving line of credit with Bank of America, N.A. in the amount of $8,530. The line of credit is to be used to refinance the North Park Theatre, to pay settlements on eminent domain actions related to the North Park Redevelopment Area, and for other redevelopment activities in the North Park Redevelopment Area.
��
City of San Diego ComprehenSive annual finanCial report
Total principal payments for long-term debt were $72,690. $48,176 of this amount was for outstanding bonds, including $7,555 recorded as a principal payment for the amount transferred to escrow from resources other than the new debt proceeds issued for the purpose of refunding the PFFA Lease Revenue Bonds, Series 2002 (Ballpark Project). Payments on loans payable were $14,529, payments on notes payable were $919, and payments on capital leases were $9,066.
Business-Type Activities
Sewer loans from the State Water Resources Control Board for $3,858 and $11,068 were executed in order to construct capital improvement projects.
PFFA sold, on a private placement basis, $57,000 of Non-Transferable Subordinated Water Revenue Notes, Series 2007A to finance upgrades to and expansion of the City’s water system and to reimburse for costs previously incurred. The Series 2007A Notes are secured by and payable solely from net system revenues of the Water Utility Fund and the final maturity date is January 30, 2009. The 2007A Notes carried a six month call provision with no prepayment penalty after the call date and had no provisions for an extension beyond the final maturity date.
PFFA sold, on a private placement basis, $223,830 of Subordinate Sewer Revenue Notes, Series 2007 to finance and reimburse for costs previously incurred from upgrades to the City’s sewer system and to refund $144,400 of outstanding principal balance on the Sewer Revenue Bonds, Series 2004. The Series 2007 Notes are secured by and payable solely from net system revenues of the Sewer Utility Fund and the final maturity date is May 15, 2009. The 2007 Notes carried a one year call provision with no prepayment penalty after the call date and had no provisions for an extension beyond the final maturity date.
Total principal payments for long-term debt were $55,147 which includes $49,245 for outstanding bonds, $4,857 for loans payable and $1,045 for capital leases.
As of the issuance of this report, the credit ratings on the City of San Diego’s outstanding General Obligation Bonds, Revenue Bonds, Lease Revenue Bonds, and COPs are as follows:
Moody's Investors Service
Fitch Ratings Standard & Poor's
General Obligation Bonds A2 BBB+ A
General Fund Backed LeaseRevenue Obligations Baa1/Baa2 BBB- A-
Outlook Stable Positive Positive
Wastewater System Obligations A3 BBB+ A+ Outlook Stable Positive Stable
Water System Obligations A2/A3 BBB+/BBB AA-/A+ Outlook Stable Positive Stable
Standard & Poor’s suspended the City’s credit rating on September 20, 2004. The rating was reinstated on May 15, 2008. Fitch Ratings placed the City on positive Rating Watch as of March 27, 2008. On August 26, 2008, Moody’s upgraded the underlying ratings on the City’s general obligation bonds from A3 to A2. Also upgraded from Baa2 to Baa1 were the City’s General Fund lease revenue bonds and certificates of participation. The underlying rating on the taxable Lease Revenue Bonds, Series 1996A (San Diego Jack Murphy Stadium) was upgraded from Baa3 to Baa2.
As of January 2008, the City of San Diego Tobacco Settlement Revenue Funding Corporation Tobacco Settlement Asset- Backed Bonds, Series 2006, were upgraded by Fitch Ratings from BBB to BBB plus. MBIA Insurance Corporation, AMBAC Assurance Corporation, and FGIC Insurance Company bond insurance policies and surety debt reserve policies support ratings
�7
City of San Diego ComprehenSive annual finanCial report
and certain of the City’s debt obligations issued on a long term fixed rate basis. As of the date of this report, Fitch has withdrawn its ratings for MBIA and Ambac, and downgraded its rating on FGIC to CCC. Standard & Poor’s has lowered its ratings on MBIA and Ambac to AA. Moody’s has lowered its ratings on MBIA and Ambac to A2 and Aa3, respectively. None of the underlying ratings, as shown in the tables above, have been changed as a result of the rating agency actions on the insurers.
Section 90 of the City Charter provides that the general obligation bonded indebtedness for the development, conservation and furnishings of water shall not exceed 15% of the last preceding assessed valuation of all real and personal property of the Citysubject to direct taxation, and that the bonded indebtedness for other municipal improvements shall not exceed 10% of such valuation. The City’s current outstanding general obligation balances as of June 30, 2007 are significantly less than the currentdebt limitations for water and other purposes, which are $5,218,175 and $3,478,783, respectively (see Statistical Section, Table12).
It has been the City's practice, as provided for in Section 90.1 of the City Charter, to issue revenue bonds for the purpose ofconstructing water facilities. Per Section 90.1, revenue bonds do not constitute an indebtedness of the City, but an obligationpayable from the revenues received by the utility. Section 90.2 authorizes the issuance of Revenue Bonds for the purpose of constructing improvements to the City's sewer system.
Additional information on the City’s long-term debt can be found in the accompanying notes to the financial statements.
REQUESTS FOR INFORMATION
This financial report is designed to provide a general overview of the City’s finances. Questions concerning any of the information provided in this report or requests for additional financial information should be addressed to the Office of the CityComptroller, 202 C Street, San Diego, California 92101, or e-mailed to [email protected]. This financial report is also available on the City’s website at www.sandiego.gov, under the Office of the City Comptroller. Additional information intended for the investor community is available on the Investor Information web page also located on the City’s website listed above.

This Page Left Intentionally Blank
�8

BaSiC finanCial StatementS
Basic Financial Statements

This Page Left Intentionally Blank - Back of Divider Page

This Page Left Intentionally Blank
�1
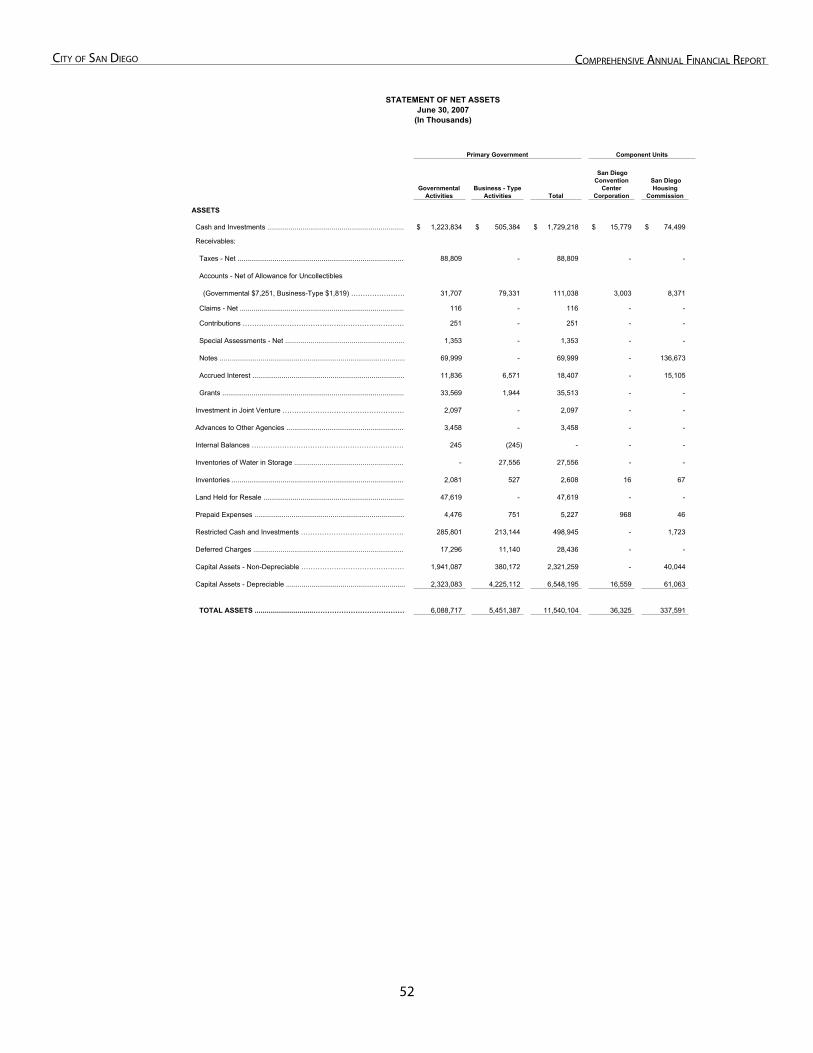
�2
City of San Diego ComprehenSive annual finanCial report
Government-Wide Financial Statements Statement of Net Assets
GovernmentalActivities
Business - Type Activities Total
San Diego Convention
CenterCorporation
San Diego Housing
Commission
ASSETS
Cash and Investments ....................................................................... 1,223,834$ 505,384$ 1,729,218$ 15,779$ 74,499$
Receivables:
Taxes - Net ...................................................................................... 88,809 - 88,809 - -
Accounts - Net of Allowance for Uncollectibles
(Governmental $7,251, Business-Type $1,819) …………………… 31,707 79,331 111,038 3,003 8,371
Claims - Net ..................................................................................... 116 - 116 - -
Contributions …………………………………………………………… 251 - 251 - -
Special Assessments - Net ............................................................. 1,353 - 1,353 - -
Notes ............................................................................................... 69,999 - 69,999 - 136,673
Accrued Interest .............................................................................. 11,836 6,571 18,407 - 15,105
Grants .............................................................................................. 33,569 1,944 35,513 - -
Investment in Joint Venture ……………………………………………… 2,097 - 2,097 - -
Advances to Other Agencies ............................................................. 3,458 - 3,458 - -
Internal Balances ………………………………………………………… 245 (245) - - -
Inventories of Water in Storage ......................................................... - 27,556 27,556 - -
Inventories ......................................................................................... 2,081 527 2,608 16 67
Land Held for Resale ......................................................................... 47,619 - 47,619 - -
Prepaid Expenses ............................................................................. 4,476 751 5,227 968 46
Restricted Cash and Investments ……………………………………… 285,801 213,144 498,945 - 1,723
Deferred Charges .............................................................................. 17,296 11,140 28,436 - -
Capital Assets - Non-Depreciable ……………………………………… 1,941,087 380,172 2,321,259 - 40,044
Capital Assets - Depreciable ............................................................. 2,323,083 4,225,112 6,548,195 16,559 61,063
TOTAL ASSETS ..............................………………………………… 6,088,717 5,451,387 11,540,104 36,325 337,591
(In Thousands)
STATEMENT OF NET ASSETSJune 30, 2007
Primary Government Component Units
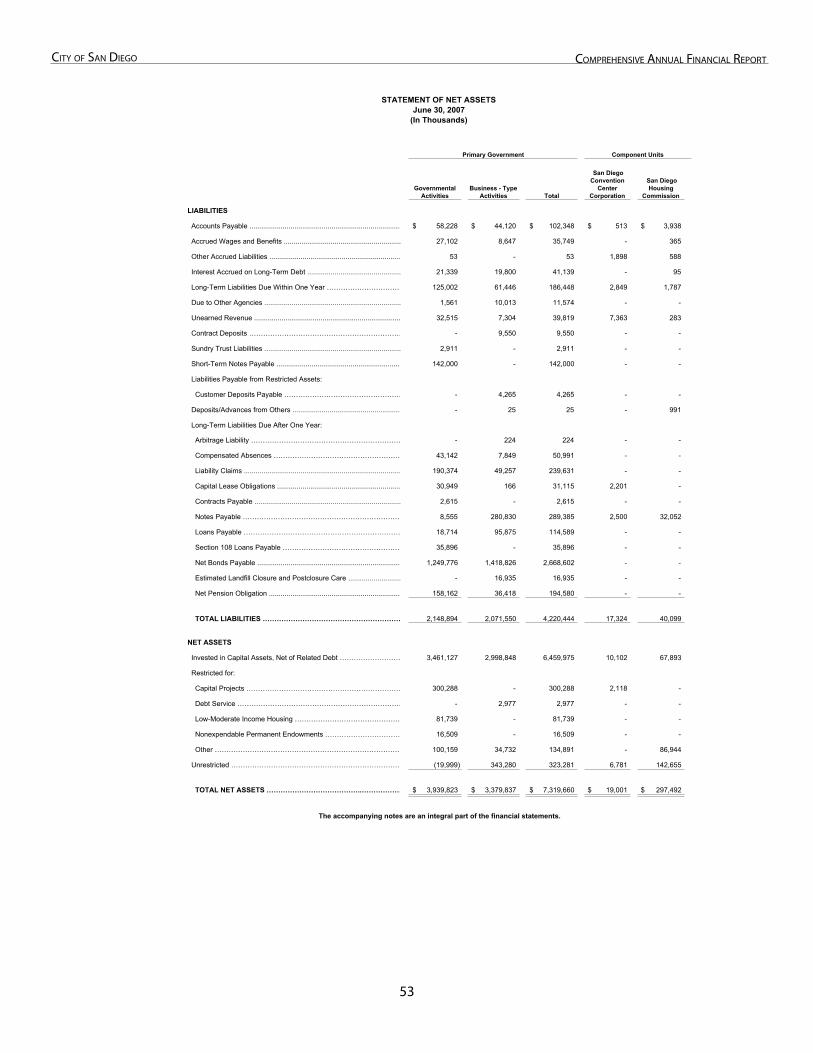
�3
City of San Diego ComprehenSive annual finanCial report
GovernmentalActivities
Business - Type Activities Total
San Diego Convention
CenterCorporation
San Diego Housing
Commission
(In Thousands)
STATEMENT OF NET ASSETSJune 30, 2007
Primary Government Component Units
LIABILITIES
Accounts Payable .............................................................................. 58,228$ 44,120$ 102,348$ 513$ 3,938$
Accrued Wages and Benefits ............................................................ 27,102 8,647 35,749 - 365
Other Accrued Liabilities ................................................................... 53 - 53 1,898 588
Interest Accrued on Long-Term Debt ................................................ 21,339 19,800 41,139 - 95
Long-Term Liabilities Due Within One Year …………………………… 125,002 61,446 186,448 2,849 1,787
Due to Other Agencies ...................................................................... 1,561 10,013 11,574 - -
Unearned Revenue ........................................................................... 32,515 7,304 39,819 7,363 283
Contract Deposits ………………………………………………………… - 9,550 9,550 - -
Sundry Trust Liabilities ...................................................................... 2,911 - 2,911 - -
Short-Term Notes Payable ................................................................ 142,000 - 142,000 - -
Liabilities Payable from Restricted Assets:
Customer Deposits Payable …………………………………………… - 4,265 4,265 - -
Deposits/Advances from Others ........................................................ - 25 25 - 991
Long-Term Liabilities Due After One Year:
Arbitrage Liability ………………………………………………………… - 224 224 - -
Compensated Absences ……………………………………………… 43,142 7,849 50,991 - -
Liability Claims ................................................................................ 190,374 49,257 239,631 - -
Capital Lease Obligations ............................................................... 30,949 166 31,115 2,201 -
Contracts Payable ........................................................................... 2,615 - 2,615 - -
Notes Payable …………………………………………………………… 8,555 280,830 289,385 2,500 32,052
Loans Payable …………………………………………………………… 18,714 95,875 114,589 - -
Section 108 Loans Payable …………………………………………… 35,896 - 35,896 - -
Net Bonds Payable .......................................................................... 1,249,776 1,418,826 2,668,602 - -
Estimated Landfill Closure and Postclosure Care ........................... - 16,935 16,935 - -
Net Pension Obligation .................................................................... 158,162 36,418 194,580 - -
TOTAL LIABILITIES …………………………………………………… 2,148,894 2,071,550 4,220,444 17,324 40,099
NET ASSETS
Invested in Capital Assets, Net of Related Debt ……………………… 3,461,127 2,998,848 6,459,975 10,102 67,893
Restricted for:
Capital Projects ………………………………………………………… 300,288 - 300,288 2,118 -
Debt Service ……………………………………………………………… - 2,977 2,977 - -
Low-Moderate Income Housing ……………………………………… 81,739 - 81,739 - -
Nonexpendable Permanent Endowments …………………………… 16,509 - 16,509 - -
Other ……………………………………………………………………. 100,159 34,732 134,891 - 86,944
Unrestricted ……………………………………………………………… (19,999) 343,280 323,281 6,781 142,655
TOTAL NET ASSETS …………………………………..……………… 3,939,823$ 3,379,837$ 7,319,660$ 19,001$ 297,492$
The accompanying notes are an integral part of the financial statements.
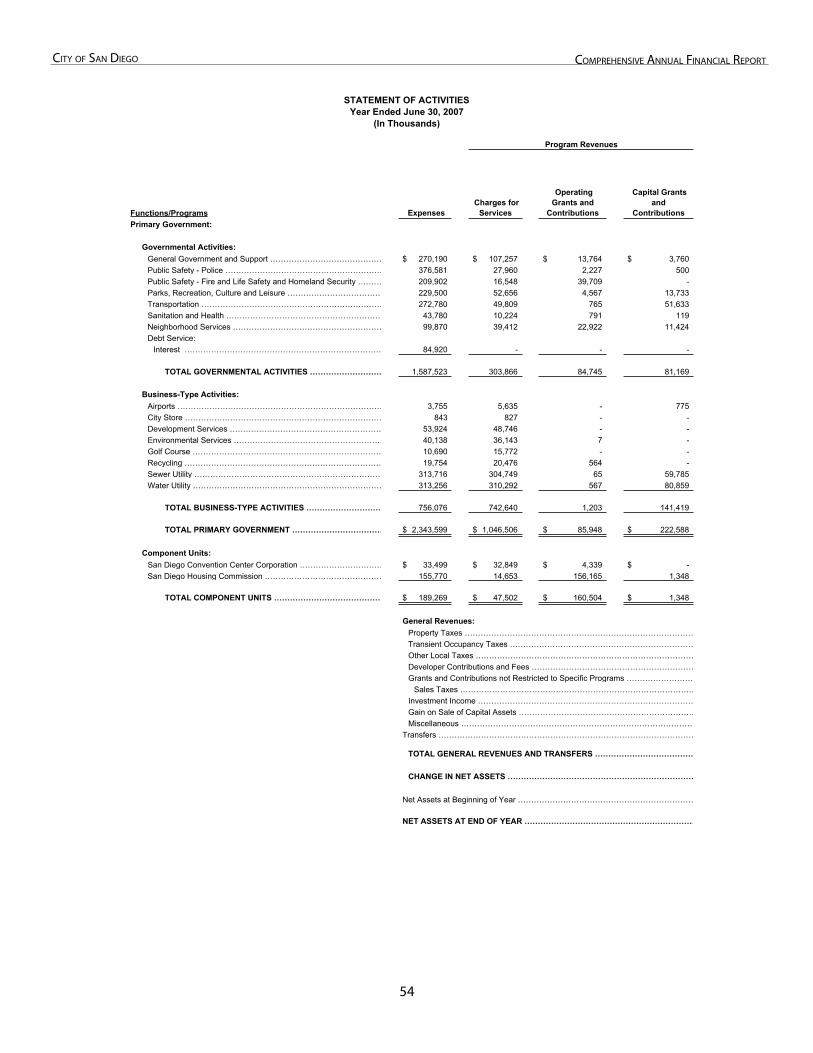
��
City of San Diego ComprehenSive annual finanCial report
Statement of Activities
Functions/Programs Expenses Charges for
Services
Operating Grants and
Contributions
Capital Grants and
ContributionsPrimary Government:
Governmental Activities:General Government and Support …………………………………… 270,190$ 107,257$ 13,764$ 3,760$ Public Safety - Police …………………………………………………… 376,581 27,960 2,227 500 Public Safety - Fire and Life Safety and Homeland Security ……… 209,902 16,548 39,709 - Parks, Recreation, Culture and Leisure ……………………………… 229,500 52,656 4,567 13,733 Transportation …………………………………………………………… 272,780 49,809 765 51,633 Sanitation and Health …………………………………………………… 43,780 10,224 791 119 Neighborhood Services ………………………………………………… 99,870 39,412 22,922 11,424 Debt Service:
Interest ………………………………………………………………… 84,920 - - -
TOTAL GOVERNMENTAL ACTIVITIES ……………………… 1,587,523 303,866 84,745 81,169
Business-Type Activities:Airports …………………………………………………………………… 3,755 5,635 - 775 City Store ………………………………………………………………… 843 827 - - Development Services ………………………………………………… 53,924 48,746 - - Environmental Services ………………………………………………… 40,138 36,143 7 - Golf Course ……………………………………………………………… 10,690 15,772 - - Recycling ………………………………………………………………… 19,754 20,476 564 - Sewer Utility ……………………………………………………………… 313,716 304,749 65 59,785 Water Utility ……………………………………………………………… 313,256 310,292 567 80,859
TOTAL BUSINESS-TYPE ACTIVITIES ………………………… 756,076 742,640 1,203 141,419
TOTAL PRIMARY GOVERNMENT ……………………………… 2,343,599$ 1,046,506$ 85,948$ 222,588$
Component Units:San Diego Convention Center Corporation …………………………… 33,499$ 32,849$ 4,339$ -$ San Diego Housing Commission ……………………………………… 155,770 14,653 156,165 1,348
TOTAL COMPONENT UNITS …………………………………… 189,269$ 47,502$ 160,504$ 1,348$
General Revenues:Property Taxes ……………………………………………………………………………Transient Occupancy Taxes …………………………………………………………… Other Local Taxes …………………………………………………………………………Developer Contributions and Fees ………………………………………………………Grants and Contributions not Restricted to Specific Programs ………………………
Sales Taxes ………………………………………………………………………………Investment Income ……………………………………………………………………… Gain on Sale of Capital Assets …………………………………………………………Miscellaneous ……………………………………………………………………………
Transfers ……………………………………………………………………………………
TOTAL GENERAL REVENUES AND TRANSFERS …………………………………
CHANGE IN NET ASSETS ………………………………………………………………
Net Assets at Beginning of Year …………………………………………………………
NET ASSETS AT END OF YEAR …………………………………………………………
STATEMENT OF ACTIVITIESYear Ended June 30, 2007
(In Thousands)
Program Revenues
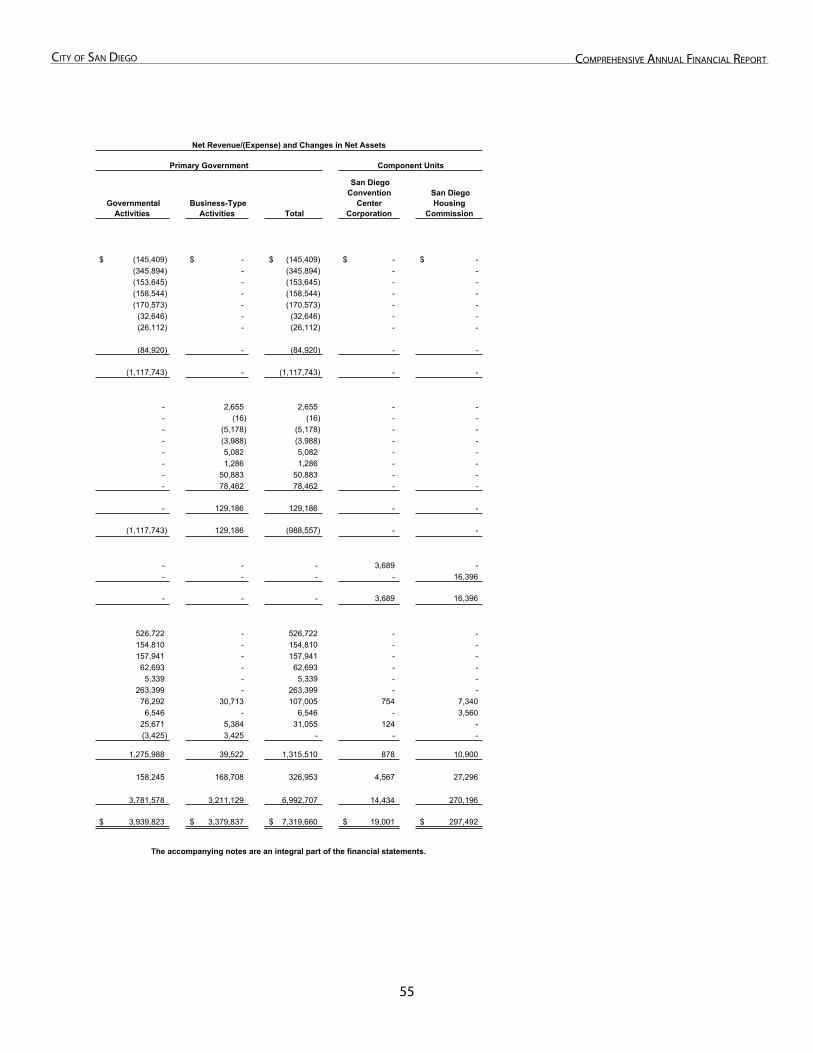
��
City of San Diego ComprehenSive annual finanCial report
Governmental Activities
Business-Type Activities Total
San Diego Convention
CenterCorporation
San Diego Housing
Commission
(145,409)$ -$ (145,409)$ -$ -$ (345,894) - (345,894) - - (153,645) - (153,645) - - (158,544) - (158,544) - - (170,573) - (170,573) - -
(32,646) - (32,646) - - (26,112) - (26,112) - -
(84,920) - (84,920) - -
(1,117,743) - (1,117,743) - -
- 2,655 2,655 - - - (16) (16) - - - (5,178) (5,178) - - - (3,988) (3,988) - - - 5,082 5,082 - - - 1,286 1,286 - - - 50,883 50,883 - - - 78,462 78,462 - -
- 129,186 129,186 - -
(1,117,743) 129,186 (988,557) - -
- - - 3,689 - - - - - 16,396
- - - 3,689 16,396
526,722 - 526,722 - - 154,810 - 154,810 - - 157,941 - 157,941 - -
62,693 - 62,693 - - 5,339 - 5,339 - -
263,399 - 263,399 - - 76,292 30,713 107,005 754 7,340
6,546 - 6,546 - 3,560 25,671 5,384 31,055 124 - (3,425) 3,425 - - -
1,275,988 39,522 1,315,510 878 10,900
158,245 168,708 326,953 4,567 27,296
3,781,578 3,211,129 6,992,707 14,434 270,196
3,939,823$ 3,379,837$ 7,319,660$ 19,001$ 297,492$
The accompanying notes are an integral part of the financial statements.
Net Revenue/(Expense) and Changes in Net Assets
Primary Government Component Units
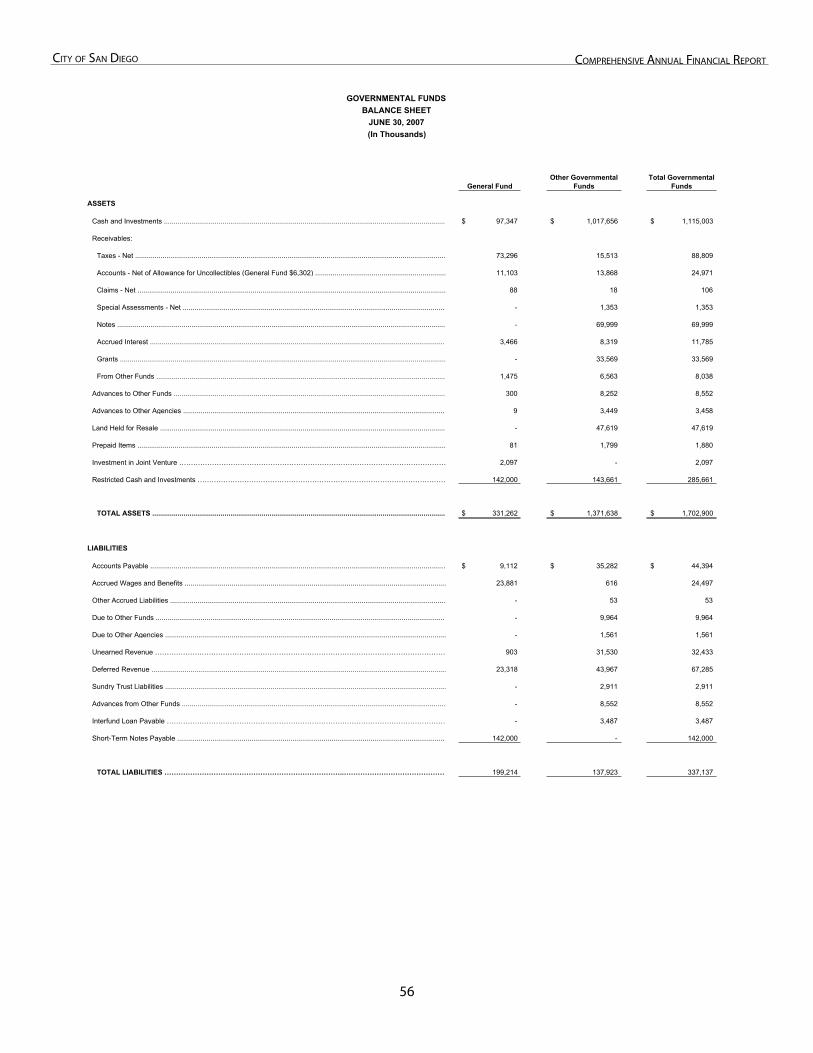
��
City of San Diego ComprehenSive annual finanCial report
Governmental Funds Financial Statements Balance Sheet
General FundOther Governmental
FundsTotal Governmental
Funds
ASSETS
Cash and Investments ................................................................................................................................................ 97,347$ 1,017,656$ 1,115,003$
Receivables:
Taxes - Net ............................................................................................................................................................... 73,296 15,513 88,809
Accounts - Net of Allowance for Uncollectibles (General Fund $6,302) ................................................................... 11,103 13,868 24,971
Claims - Net .............................................................................................................................................................. 88 18 106
Special Assessments - Net ....................................................................................................................................... - 1,353 1,353
Notes ........................................................................................................................................................................ - 69,999 69,999
Accrued Interest ........................................................................................................................................................ 3,466 8,319 11,785
Grants ....................................................................................................................................................................... - 33,569 33,569
From Other Funds .................................................................................................................................................... 1,475 6,563 8,038
Advances to Other Funds ........................................................................................................................................... 300 8,252 8,552
Advances to Other Agencies ....................................................................................................................................... 9 3,449 3,458
Land Held for Resale .................................................................................................................................................. - 47,619 47,619
Prepaid Items .............................................................................................................................................................. 81 1,799 1,880
Investment in Joint Venture …………………………………………………………………………………………………… 2,097 - 2,097
Restricted Cash and Investments ……………………………………………………………………………………………… 142,000 143,661 285,661
TOTAL ASSETS ....................................................................................................................................................... 331,262$ 1,371,638$ 1,702,900$
LIABILITIES
Accounts Payable .....................................................................................................................................................… 9,112$ 35,282$ 44,394$
Accrued Wages and Benefits ...................................................................................................................................... 23,881 616 24,497
Other Accrued Liabilities ............................................................................................................................................. - 53 53
Due to Other Funds ..................................................................................................................................................... - 9,964 9,964
Due to Other Agencies ................................................................................................................................................ - 1,561 1,561
Unearned Revenue ……………………………………………………………………………………………………………… 903 31,530 32,433
Deferred Revenue ....................................................................................................................................................... 23,318 43,967 67,285
Sundry Trust Liabilities ................................................................................................................................................ - 2,911 2,911
Advances from Other Funds ....................................................................................................................................... - 8,552 8,552
Interfund Loan Payable ………………………………………………………………………………………………………… - 3,487 3,487
Short-Term Notes Payable .......................................................................................................................................... 142,000 - 142,000
TOTAL LIABILITIES …………………………………………………………………..……………………………………… 199,214 137,923 337,137
GOVERNMENTAL FUNDSBALANCE SHEET
JUNE 30, 2007(In Thousands)
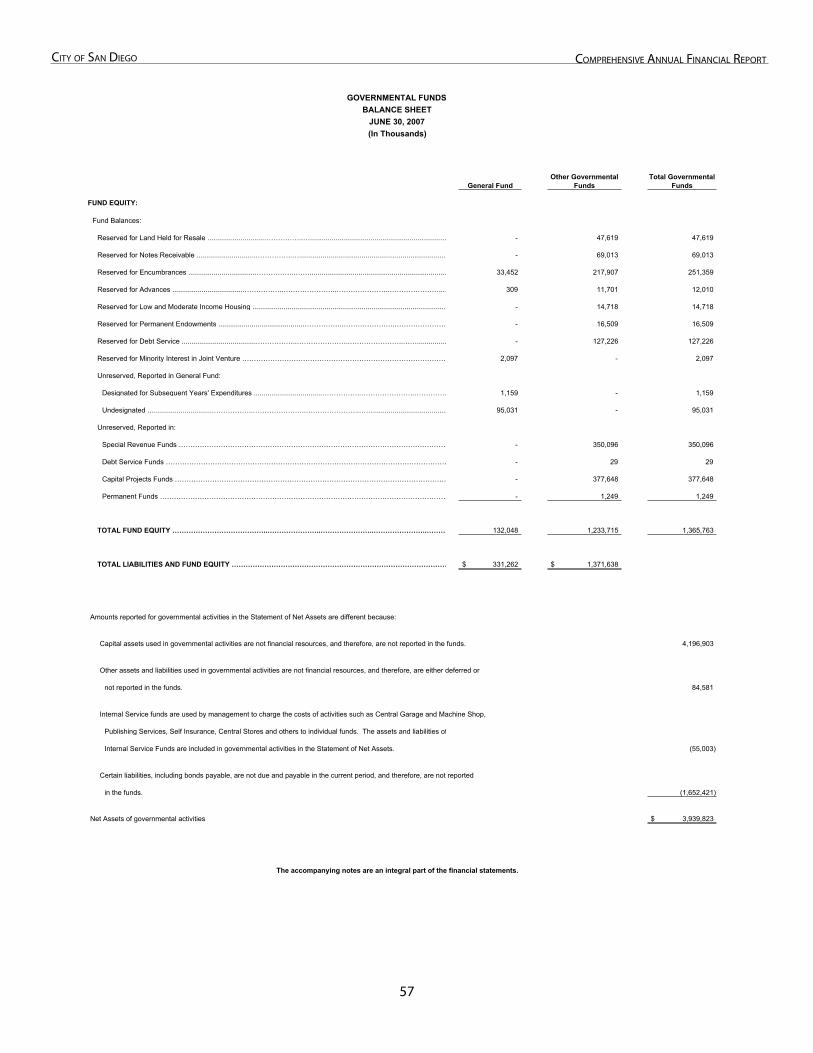
�7
City of San Diego ComprehenSive annual finanCial report
General FundOther Governmental
FundsTotal Governmental
Funds
GOVERNMENTAL FUNDSBALANCE SHEET
JUNE 30, 2007(In Thousands)
FUND EQUITY:
Fund Balances:
Reserved for Land Held for Resale .............................……………..…...................................................................... - 47,619 47,619
Reserved for Notes Receivable .............................……………..…........................................................................... - 69,013 69,013
Reserved for Encumbrances ...................................……………..……...................................................................... 33,452 217,907 251,359
Reserved for Advances .....................................……………..…………………..…………………..…………………..… 309 11,701 12,010
Reserved for Low and Moderate Income Housing ................................................................................................... - 14,718 14,718
Reserved for Permanent Endowments ...........................................……………..…………………..…………………. - 16,509 16,509
Reserved for Debt Service .......................................……………..…………………..…………………..……............... - 127,226 127,226
Reserved for Minority Interest in Joint Venture …………………………………………………………………………… 2,097 - 2,097
Unreserved, Reported in General Fund:
Designated for Subsequent Years' Expenditures ...................................……………..…………………..…………… 1,159 - 1,159
Undesignated ..................................……………..…………………..…………………..……...................................... 95,031 - 95,031
Unreserved, Reported in:
Special Revenue Funds …………………………………………………………………………………………………… - 350,096 350,096
Debt Service Funds ………………………………………………………………………………………………………… - 29 29
Capital Projects Funds ……………………………………………………………………………………………………… - 377,648 377,648
Permanent Funds …………………………………………………………………………………………………………… - 1,249 1,249
TOTAL FUND EQUITY …………………………………..…………………..…………………..…………………..……… 132,048 1,233,715 1,365,763
TOTAL LIABILITIES AND FUND EQUITY ………………………………………………………………………………… 331,262$ 1,371,638$
Amounts reported for governmental activities in the Statement of Net Assets are different because:
Capital assets used in governmental activities are not financial resources, and therefore, are not reported in the funds. 4,196,903
Other assets and liabilities used in governmental activities are not financial resources, and therefore, are either deferred or
not reported in the funds. 84,581
Internal Service funds are used by management to charge the costs of activities such as Central Garage and Machine Shop,
Publishing Services, Self Insurance, Central Stores and others to individual funds. The assets and liabilities of
Internal Service Funds are included in governmental activities in the Statement of Net Assets. (55,003)
Certain liabilities, including bonds payable, are not due and payable in the current period, and therefore, are not reported
in the funds. (1,652,421)
Net Assets of governmental activities 3,939,823$
The accompanying notes are an integral part of the financial statements.
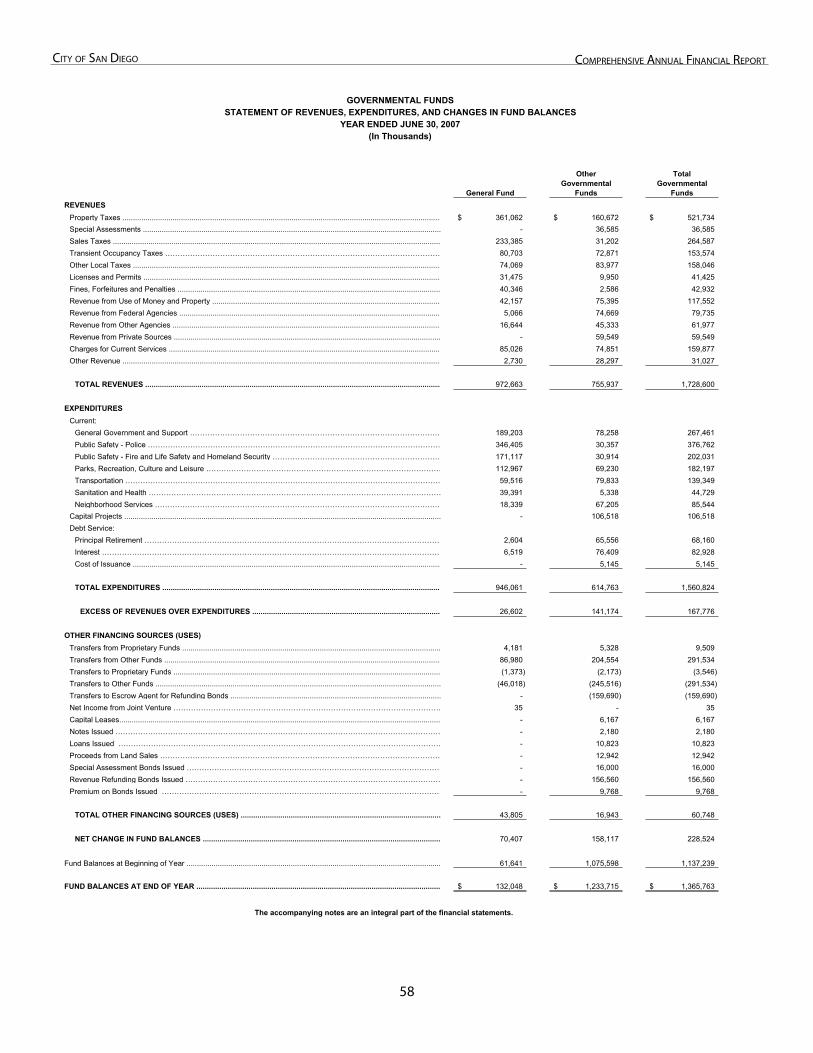
�8
City of San Diego ComprehenSive annual finanCial report
Statement of Revenues, Expenditures, and Changes in Fund Balances
General Fund
OtherGovernmental
Funds
TotalGovernmental
FundsREVENUES
Property Taxes ......................................................................................................................................................... 361,062$ 160,672$ 521,734$ Special Assessments ............................................................................................................................................... - 36,585 36,585 Sales Taxes ............................................................................................................................................................. 233,385 31,202 264,587 Transient Occupancy Taxes ………………………………………………………………………………………………… 80,703 72,871 153,574 Other Local Taxes .................................................................................................................................................... 74,069 83,977 158,046 Licenses and Permits ............................................................................................................................................... 31,475 9,950 41,425 Fines, Forfeitures and Penalties .............................................................................................................................. 40,346 2,586 42,932 Revenue from Use of Money and Property .............................................................................................................. 42,157 75,395 117,552 Revenue from Federal Agencies .............................................................................................................................. 5,066 74,669 79,735 Revenue from Other Agencies ................................................................................................................................. 16,644 45,333 61,977 Revenue from Private Sources ................................................................................................................................ - 59,549 59,549 Charges for Current Services ................................................................................................................................... 85,026 74,851 159,877 Other Revenue ......................................................................................................................................................... 2,730 28,297 31,027
TOTAL REVENUES .............................................................................................................................................. 972,663 755,937 1,728,600
EXPENDITURESCurrent:
General Government and Support ………………………………………………………………………………………… 189,203 78,258 267,461 Public Safety - Police ……………………………………………………………………………………………………… 346,405 30,357 376,762 Public Safety - Fire and Life Safety and Homeland Security …………………………………………………………… 171,117 30,914 202,031 Parks, Recreation, Culture and Leisure …………………………………………………………………………………… 112,967 69,230 182,197 Transportation ……………………………………………………………………………………………………………… 59,516 79,833 139,349 Sanitation and Health ……………………………………………………………………………………………………… 39,391 5,338 44,729 Neighborhood Services …………………………………………………………………………………………………… 18,339 67,205 85,544
Capital Projects ........................................................................................................................................................ - 106,518 106,518 Debt Service:
Principal Retirement ………………………………………………………………………………………………………… 2,604 65,556 68,160 Interest ………………………………………………………………………………………………………………………… 6,519 76,409 82,928 Cost of Issuance .................................................................................................................................................... - 5,145 5,145
TOTAL EXPENDITURES ...................................................................................................................................... 946,061 614,763 1,560,824
EXCESS OF REVENUES OVER EXPENDITURES ........................................................................................... 26,602 141,174 167,776
OTHER FINANCING SOURCES (USES)Transfers from Proprietary Funds ............................................................................................................................ 4,181 5,328 9,509 Transfers from Other Funds ..................................................................................................................................... 86,980 204,554 291,534 Transfers to Proprietary Funds ................................................................................................................................ (1,373) (2,173) (3,546) Transfers to Other Funds ......................................................................................................................................... (46,018) (245,516) (291,534) Transfers to Escrow Agent for Refunding Bonds ..................................................................................................... - (159,690) (159,690) Net Income from Joint Venture ……………………………………………………………………………………………… 35 - 35 Capital Leases.......................................................................................................................................................... - 6,167 6,167 Notes Issued …………………………………………………………………………………………………………………… - 2,180 2,180 Loans Issued ………………………………………………………………………………………………………………… - 10,823 10,823 Proceeds from Land Sales …………………………………………………………………………………………………… - 12,942 12,942 Special Assessment Bonds Issued ………………………………………………………………………………………… - 16,000 16,000 Revenue Refunding Bonds Issued ………………………………………………………………………………………… - 156,560 156,560 Premium on Bonds Issued …………………………………………………………………………………………………… - 9,768 9,768
TOTAL OTHER FINANCING SOURCES (USES) ................................................................................................ 43,805 16,943 60,748
NET CHANGE IN FUND BALANCES .................................................................................................................. 70,407 158,117 228,524
Fund Balances at Beginning of Year .......................................................................................................................... 61,641 1,075,598 1,137,239
FUND BALANCES AT END OF YEAR ..................................................................................................................... 132,048$ 1,233,715$ 1,365,763$
GOVERNMENTAL FUNDSSTATEMENT OF REVENUES, EXPENDITURES, AND CHANGES IN FUND BALANCES
The accompanying notes are an integral part of the financial statements.
YEAR ENDED JUNE 30, 2007(In Thousands)
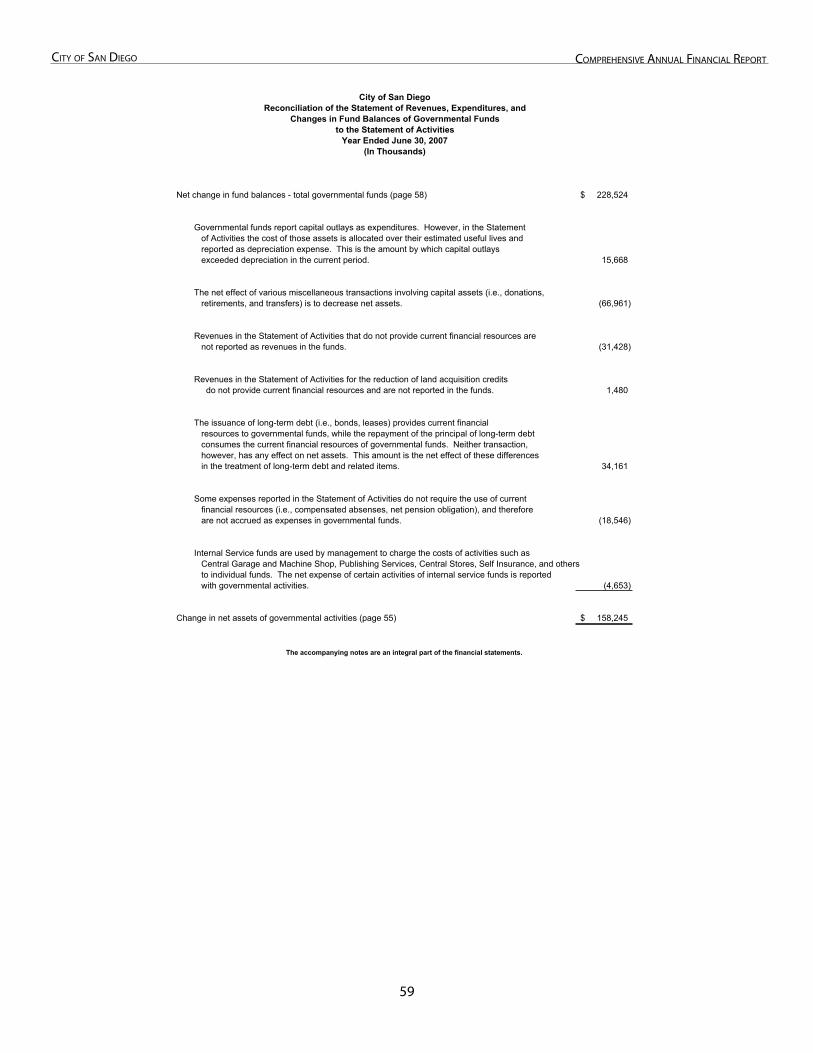
��
City of San Diego ComprehenSive annual finanCial report
Reconciliation of the Statement of Revenues, Expenditures,
City of San DiegoReconciliation of the Statement of Revenues, Expenditures, and
Changes in Fund Balances of Governmental Fundsto the Statement of Activities
Year Ended June 30, 2007(In Thousands)
Net change in fund balances - total governmental funds (page 58) 228,524$
Governmental funds report capital outlays as expenditures. However, in the Statementof Activities the cost of those assets is allocated over their estimated useful lives and reported as depreciation expense. This is the amount by which capital outlays exceeded depreciation in the current period. 15,668
The net effect of various miscellaneous transactions involving capital assets (i.e., donations,retirements, and transfers) is to decrease net assets. (66,961)
Revenues in the Statement of Activities that do not provide current financial resources arenot reported as revenues in the funds. (31,428)
Revenues in the Statement of Activities for the reduction of land acquisition credits do not provide current financial resources and are not reported in the funds. 1,480
The issuance of long-term debt (i.e., bonds, leases) provides current financialresources to governmental funds, while the repayment of the principal of long-term debtconsumes the current financial resources of governmental funds. Neither transaction,however, has any effect on net assets. This amount is the net effect of these differencesin the treatment of long-term debt and related items. 34,161
Some expenses reported in the Statement of Activities do not require the use of currentfinancial resources (i.e., compensated absenses, net pension obligation), and thereforeare not accrued as expenses in governmental funds. (18,546)
Internal Service funds are used by management to charge the costs of activities such asCentral Garage and Machine Shop, Publishing Services, Central Stores, Self Insurance, and othersto individual funds. The net expense of certain activities of internal service funds is reported with governmental activities. (4,653)
Change in net assets of governmental activities (page 55) 158,245$
The accompanying notes are an integral part of the financial statements.
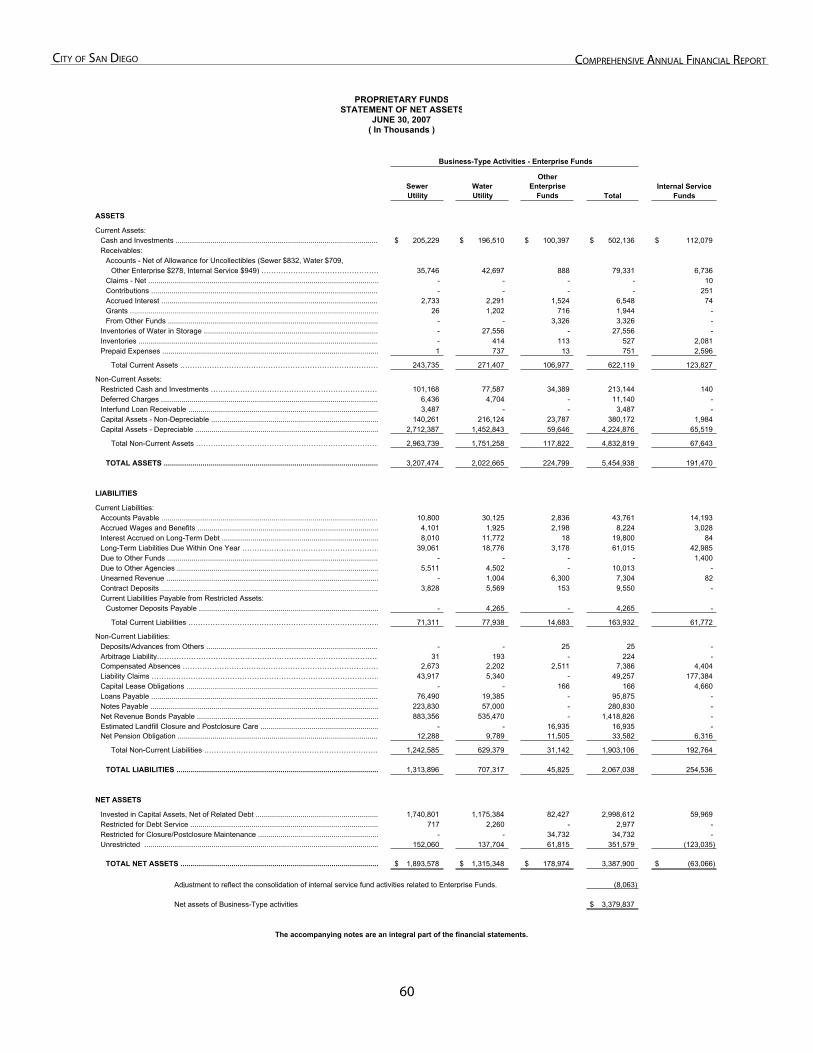
�0
City of San Diego ComprehenSive annual finanCial report
Proprietary Funds Financial Statements Statement of Net Assets
SewerUtility
WaterUtility
OtherEnterprise
Funds Total
ASSETS
Current Assets:Cash and Investments ................................................................................................... 205,229$ 196,510$ 100,397$ 502,136$ 112,079$ Receivables:
Accounts - Net of Allowance for Uncollectibles (Sewer $832, Water $709,Other Enterprise $278, Internal Service $949) ………………………………………… 35,746 42,697 888 79,331 6,736
Claims - Net ................................................................................................................. - - - - 10 Contributions ............................................................................................................... - - - - 251 Accrued Interest .......................................................................................................... 2,733 2,291 1,524 6,548 74 Grants .......................................................................................................................... 26 1,202 716 1,944 - From Other Funds ....................................................................................................... - - 3,326 3,326 -
Inventories of Water in Storage ...................................................................................... - 27,556 - 27,556 - Inventories ...................................................................................................................... - 414 113 527 2,081 Prepaid Expenses .......................................................................................................... 1 737 13 751 2,596
Total Current Assets ……………………………………………………………………… 243,735 271,407 106,977 622,119 123,827
Non-Current Assets:Restricted Cash and Investments …………………………………………………………… 101,168 77,587 34,389 213,144 140 Deferred Charges ........................................................................................................... 6,436 4,704 - 11,140 - Interfund Loan Receivable ............................................................................................. 3,487 - - 3,487 - Capital Assets - Non-Depreciable .................................................................................. 140,261 216,124 23,787 380,172 1,984 Capital Assets - Depreciable .......................................................................................... 2,712,387 1,452,843 59,646 4,224,876 65,519
Total Non-Current Assets ………………………………………………………………… 2,963,739 1,751,258 117,822 4,832,819 67,643
TOTAL ASSETS ......................................................................................................... 3,207,474 2,022,665 224,799 5,454,938 191,470
LIABILITIES
Current Liabilities:Accounts Payable .......................................................................................................... 10,800 30,125 2,836 43,761 14,193 Accrued Wages and Benefits ......................................................................................... 4,101 1,925 2,198 8,224 3,028
Interest Accrued on Long-Term Debt ............................................................................. 8,010 11,772 18 19,800 84 Long-Term Liabilities Due Within One Year ………………………………………………… 39,061 18,776 3,178 61,015 42,985 Due to Other Funds ........................................................................................................ - - - - 1,400 Due to Other Agencies ................................................................................................... 5,511 4,502 - 10,013 - Unearned Revenue ........................................................................................................ - 1,004 6,300 7,304 82 Contract Deposits ........................................................................................................... 3,828 5,569 153 9,550 - Current Liabilities Payable from Restricted Assets:
Customer Deposits Payable ........................................................................................ - 4,265 - 4,265 -
Total Current Liabilities …………………………………………………………………… 71,311 77,938 14,683 163,932 61,772
Non-Current Liabilities:Deposits/Advances from Others .................................................................................... - - 25 25 - Arbitrage Liability………………………………………………………………………………… 31 193 - 224 - Compensated Absences ……………………………………………………………………… 2,673 2,202 2,511 7,386 4,404 Liability Claims ………………………………………………………………………………… 43,917 5,340 - 49,257 177,384 Capital Lease Obligations .............................................................................................. - - 166 166 4,660 Loans Payable ............................................................................................................... 76,490 19,385 - 95,875 - Notes Payable ................................................................................................................ 223,830 57,000 - 280,830 - Net Revenue Bonds Payable ......................................................................................... 883,356 535,470 - 1,418,826 - Estimated Landfill Closure and Postclosure Care .......................................................... - - 16,935 16,935 - Net Pension Obligation .................................................................................................. 12,288 9,789 11,505 33,582 6,316
Total Non-Current Liabilities ……………………………………………………………… 1,242,585 629,379 31,142 1,903,106 192,764
TOTAL LIABILITIES ................................................................................................... 1,313,896 707,317 45,825 2,067,038 254,536
NET ASSETS
Invested in Capital Assets, Net of Related Debt ............................................................ 1,740,801 1,175,384 82,427 2,998,612 59,969 Restricted for Debt Service ............................................................................................ 717 2,260 - 2,977 - Restricted for Closure/Postclosure Maintenance ........................................................... - - 34,732 34,732 - Unrestricted ................................................................................................................... 152,060 137,704 61,815 351,579 (123,035)
TOTAL NET ASSETS ................................................................................................. 1,893,578$ 1,315,348$ 178,974$ 3,387,900 (63,066)$
Adjustment to reflect the consolidation of internal service fund activities related to Enterprise Funds. (8,063)
Net assets of Business-Type activities 3,379,837$
The accompanying notes are an integral part of the financial statements.
PROPRIETARY FUNDSSTATEMENT OF NET ASSETS
JUNE 30, 2007( In Thousands )
Business-Type Activities - Enterprise Funds
Internal Service Funds
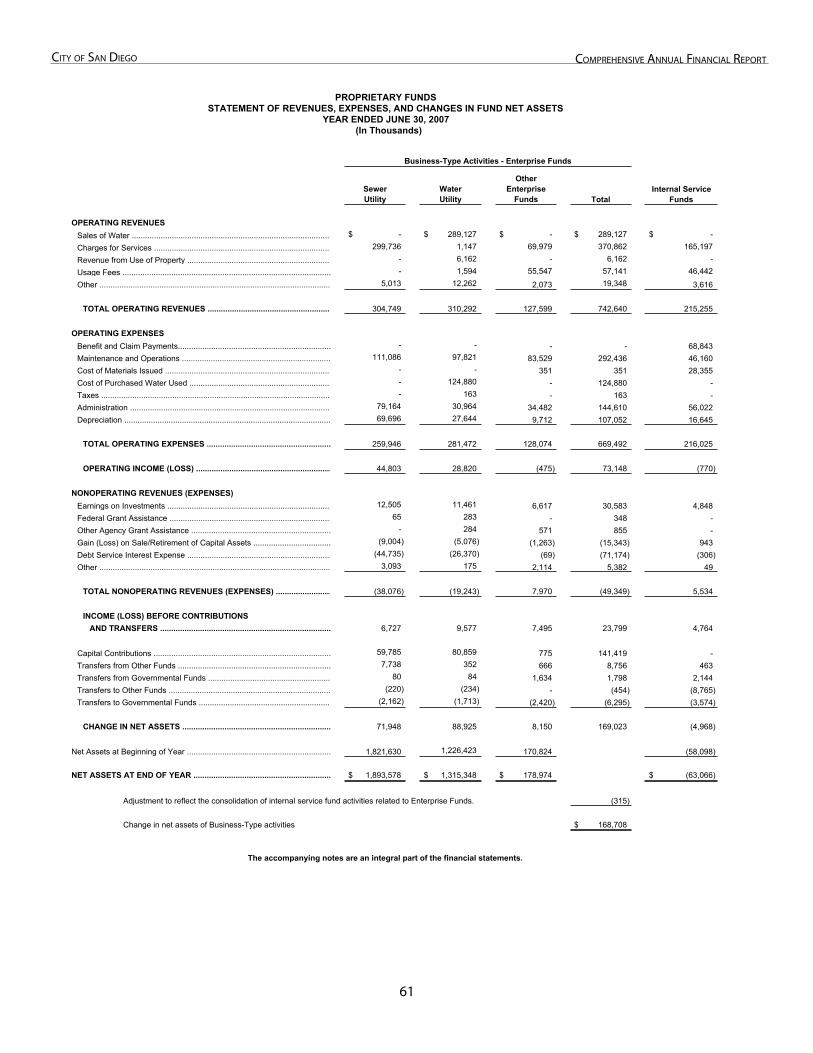
�1
City of San Diego ComprehenSive annual finanCial report
Statement of Revenues, Expenses, and
SewerUtility
WaterUtility
OtherEnterprise
Funds Total
OPERATING REVENUESSales of Water .......................................................................................... -$ 289,127$ -$ 289,127$ -$
Charges for Services ................................................................................ 299,736 1,147 69,979 370,862 165,197
Revenue from Use of Property ................................................................. - 6,162 - 6,162 -
Usage Fees .............................................................................................. - 1,594 55,547 57,141 46,442
Other ........................................................................................................ 5,013 12,262 2,073 19,348 3,616
TOTAL OPERATING REVENUES ........................................................ 304,749 310,292 127,599 742,640 215,255
OPERATING EXPENSESBenefit and Claim Payments..................................................................... - - - - 68,843 Maintenance and Operations ................................................................... 111,086 97,821 83,529 292,436 46,160 Cost of Materials Issued ........................................................................... - - 351 351 28,355 Cost of Purchased Water Used ................................................................ - 124,880 - 124,880 - Taxes ........................................................................................................ - 163 - 163 - Administration ........................................................................................... 79,164 30,964 34,482 144,610 56,022 Depreciation ............................................................................................. 69,696 27,644 9,712 107,052 16,645
TOTAL OPERATING EXPENSES ........................................................ 259,946 281,472 128,074 669,492 216,025
OPERATING INCOME (LOSS) ............................................................. 44,803 28,820 (475) 73,148 (770)
NONOPERATING REVENUES (EXPENSES)Earnings on Investments .......................................................................... 12,505 11,461 6,617 30,583 4,848 Federal Grant Assistance ......................................................................... 65 283 - 348 - Other Agency Grant Assistance ............................................................... - 284 571 855 - Gain (Loss) on Sale/Retirement of Capital Assets ................................... (9,004) (5,076) (1,263) (15,343) 943 Debt Service Interest Expense ................................................................. (44,735) (26,370) (69) (71,174) (306) Other ........................................................................................................ 3,093 175 2,114 5,382 49
TOTAL NONOPERATING REVENUES (EXPENSES) ......................... (38,076) (19,243) 7,970 (49,349) 5,534
INCOME (LOSS) BEFORE CONTRIBUTIONS AND TRANSFERS ............................................................................. 6,727 9,577 7,495 23,799 4,764
Capital Contributions ................................................................................ 59,785 80,859 775 141,419 - Transfers from Other Funds ..................................................................... 7,738 352 666 8,756 463 Transfers from Governmental Funds ....................................................... 80 84 1,634 1,798 2,144 Transfers to Other Funds ......................................................................... (220) (234) - (454) (8,765) Transfers to Governmental Funds ............................................................ (2,162) (1,713) (2,420) (6,295) (3,574)
CHANGE IN NET ASSETS ................................................................... 71,948 88,925 8,150 169,023 (4,968)
Net Assets at Beginning of Year ................................................................. 1,821,630 1,226,423 170,824 (58,098)
NET ASSETS AT END OF YEAR .............................................................. 1,893,578$ 1,315,348$ 178,974$ (63,066)$
Adjustment to reflect the consolidation of internal service fund activities related to Enterprise Funds. (315)
Change in net assets of Business-Type activities 168,708$
The accompanying notes are an integral part of the financial statements.
PROPRIETARY FUNDSSTATEMENT OF REVENUES, EXPENSES, AND CHANGES IN FUND NET ASSETS
YEAR ENDED JUNE 30, 2007 (In Thousands)
Business-Type Activities - Enterprise Funds
Internal Service Funds
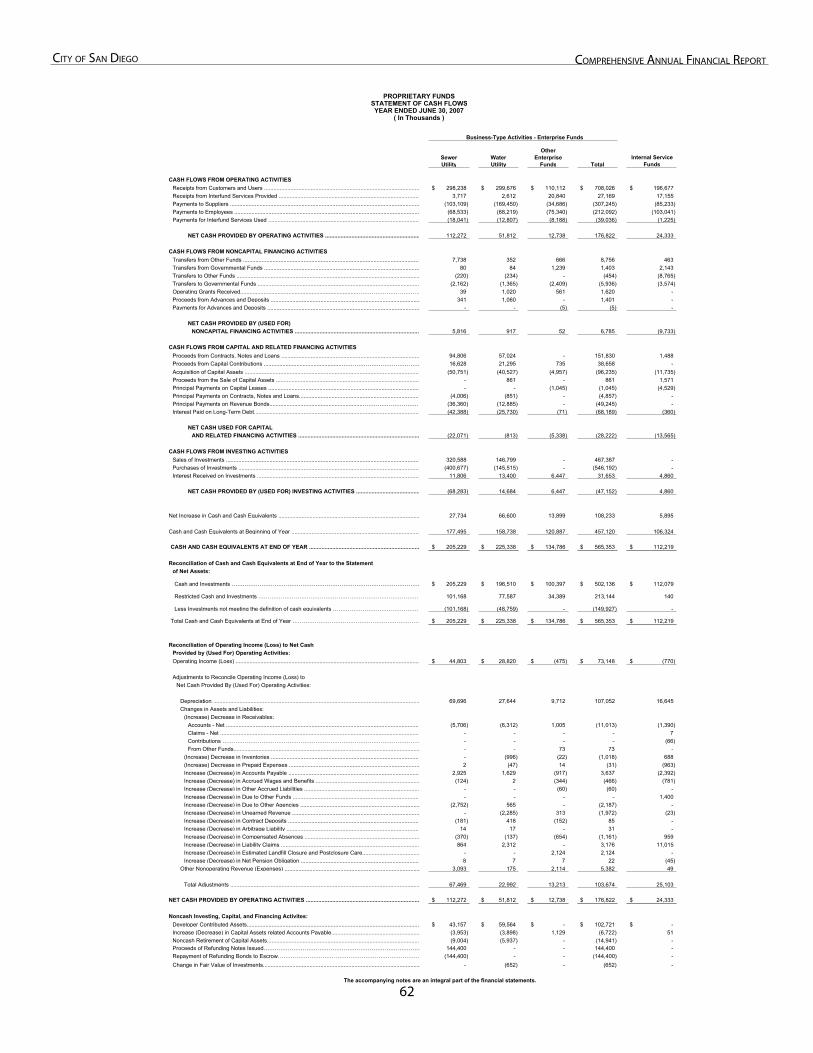
�2
City of San Diego ComprehenSive annual finanCial report
Statement of Cash Flows
SewerUtility
WaterUtility
OtherEnterprise
Funds Total
CASH FLOWS FROM OPERATING ACTIVITIESReceipts from Customers and Users .................................................................................................... 298,238$ 299,676$ 110,112$ 708,026$ 196,677$ Receipts from Interfund Services Provided ........................................................................................... 3,717 2,612 20,840 27,169 17,155 Payments to Suppliers .......................................................................................................................... (103,109) (169,450) (34,686) (307,245) (85,233) Payments to Employees ....................................................................................................................... (68,533) (68,219) (75,340) (212,092) (103,041) Payments for Interfund Services Used .................................................................................................. (18,041) (12,807) (8,188) (39,036) (1,225)
NET CASH PROVIDED BY OPERATING ACTIVITIES ............................................................. 112,272 51,812 12,738 176,822 24,333
CASH FLOWS FROM NONCAPITAL FINANCING ACTIVITIESTransfers from Other Funds .................................................................................................................. 7,738 352 666 8,756 463 Transfers from Governmental Funds .................................................................................................... 80 84 1,239 1,403 2,143 Transfers to Other Funds ...................................................................................................................... (220) (234) - (454) (8,765) Transfers to Governmental Funds ........................................................................................................ (2,162) (1,365) (2,409) (5,936) (3,574) Operating Grants Received...........................................................................……………………………… 39 1,020 561 1,620 - Proceeds from Advances and Deposits ................................................................................................ 341 1,060 - 1,401 - Payments for Advances and Deposits .................................................................................................. - - (5) (5) -
NET CASH PROVIDED BY (USED FOR)NONCAPITAL FINANCING ACTIVITIES ................................................................................. 5,816 917 52 6,785 (9,733)
CASH FLOWS FROM CAPITAL AND RELATED FINANCING ACTIVITIESProceeds from Contracts, Notes and Loans ......................................................................................... 94,806 57,024 - 151,830 1,488 Proceeds from Capital Contributions ..................................................…………………………………… 16,628 21,295 735 38,658 - Acquisition of Capital Assets ................................................................................................................. (50,751) (40,527) (4,957) (96,235) (11,735) Proceeds from the Sale of Capital Assets ............................................................................................. - 861 - 861 1,571 Principal Payments on Capital Leases .................................................................................................. - - (1,045) (1,045) (4,529) Principal Payments on Contracts, Notes and Loans.............................................................................. (4,006) (851) - (4,857) - Principal Payments on Revenue Bonds............................................................…………………………… (36,360) (12,885) - (49,245) - Interest Paid on Long-Term Debt........................................................................................................... (42,388) (25,730) (71) (68,189) (360)
NET CASH USED FOR CAPITALAND RELATED FINANCING ACTIVITIES .............................................................................. (22,071) (813) (5,338) (28,222) (13,565)
CASH FLOWS FROM INVESTING ACTIVITIESSales of Investments ............................................................................................................................. 320,588 146,799 - 467,387 - Purchases of Investments ..................................................................................................................... (400,677) (145,515) - (546,192) - Interest Received on Investments ......................................................................................................... 11,806 13,400 6,447 31,653 4,860
NET CASH PROVIDED BY (USED FOR) INVESTING ACTIVITIES ......................................... (68,283) 14,684 6,447 (47,152) 4,860
Net Increase in Cash and Cash Equivalents ........................................................................................... 27,734 66,600 13,899 108,233 5,895
Cash and Cash Equivalents at Beginning of Year ................................................................................... 177,495 158,738 120,887 457,120 106,324
CASH AND CASH EQUIVALENTS AT END OF YEAR ....................................................................... 205,229$ 225,338$ 134,786$ 565,353$ 112,219$
Reconciliation of Cash and Cash Equivalents at End of Year to the Statementof Net Assets:
Cash and Investments ………………………………………………………………………………………… 205,229$ 196,510$ 100,397$ 502,136$ 112,079$
Restricted Cash and Investments …………………………………………………………………………… 101,168 77,587 34,389 213,144 140
Less Investments not meeting the definition of cash equivalents ………………………………………… (101,168) (48,759) - (149,927) -
Total Cash and Cash Equivalents at End of Year …………………………………………………………… 205,229$ 225,338$ 134,786$ 565,353$ 112,219$
Reconciliation of Operating Income (Loss) to Net CashProvided by (Used For) Operating Activities:Operating Income (Loss) ....................................................................................................................... 44,803$ 28,820$ (475)$ 73,148$ (770)$
Adjustments to Reconcile Operating Income (Loss) toNet Cash Provided By (Used For) Operating Activities:
Depreciation ..................................................................................................................................... 69,696 27,644 9,712 107,052 16,645 Changes in Assets and Liabilities:
(Increase) Decrease in Receivables:Accounts - Net ............................................................................................................................. (5,706) (6,312) 1,005 (11,013) (1,390) Claims - Net ................................................................................................................................ - - - - 7 Contributions ……………………………………………………………………………………………… - - - - (66) From Other Funds........................................................................................................................ - - 73 73 -
(Increase) Decrease in Inventories ................................................................................................ - (996) (22) (1,018) 688 (Increase) Decrease in Prepaid Expenses .................................................................................... 2 (47) 14 (31) (963) Increase (Decrease) in Accounts Payable ..................................................................................... 2,925 1,629 (917) 3,637 (2,392) Increase (Decrease) in Accrued Wages and Benefits ................................................................... (124) 2 (344) (466) (781) Increase (Decrease) in Other Accrued Liabilities .......................................................................... - - (60) (60) - Increase (Decrease) in Due to Other Funds .................................................................................. - - - - 1,400 Increase (Decrease) in Due to Other Agencies ............................................................................. (2,752) 565 - (2,187) - Increase (Decrease) in Unearned Revenue .................................................................................. - (2,285) 313 (1,972) (23) Increase (Decrease) in Contract Deposits ..................................................................................... (181) 418 (152) 85 - Increase (Decrease) in Arbitrage Liability ...................................................................................... 14 17 - 31 - Increase (Decrease) in Compensated Absences .......................................................................... (370) (137) (654) (1,161) 959 Increase (Decrease) in Liability Claims ......................................................................................... 864 2,312 - 3,176 11,015 Increase (Decrease) in Estimated Landfill Closure and Postclosure Care..................................... - - 2,124 2,124 - Increase (Decrease) in Net Pension Obligation ............................................................................. 8 7 7 22 (45)
Other Nonoperating Revenue (Expenses) ....................................................................................... 3,093 175 2,114 5,382 49
Total Adjustments .......................................................................................................................... 67,469 22,992 13,213 103,674 25,103
NET CASH PROVIDED BY OPERATING ACTIVITIES ......................................................................... 112,272$ 51,812$ 12,738$ 176,822$ 24,333$
Noncash Investing, Capital, and Financing Activites:Developer Contributed Assets............................................................................................................... 43,157$ 59,564$ -$ 102,721$ -$ Increase (Decrease) in Capital Assets related Accounts Payable......................................................... (3,953) (3,898) 1,129 (6,722) 51
Noncash Retirement of Capital Assets.................................................................................................. (9,004) (5,937) - (14,941) - Proceeds of Refunding Notes Issued………………………………………………………………………… 144,400 - - 144,400 - Repayment of Refunding Bonds to Escrow…………………………………………………………………… (144,400) - - (144,400) -
Change in Fair Value of Investments..................................................................................................... - (652) - (652) -
The accompanying notes are an integral part of the financial statements.
PROPRIETARY FUNDSSTATEMENT OF CASH FLOWSYEAR ENDED JUNE 30, 2007
( In Thousands )
Business-Type Activities - Enterprise Funds
Internal Service Funds
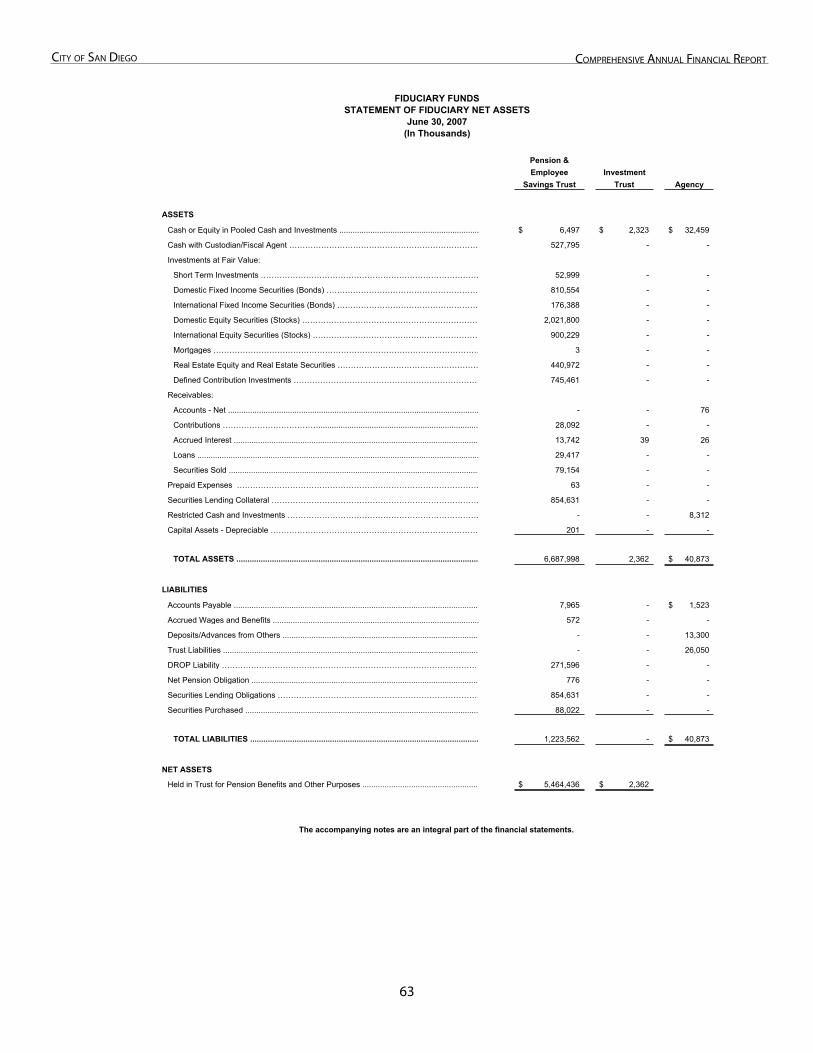
�3
City of San Diego ComprehenSive annual finanCial report
Fiduciary Funds Financial Statements Statement of Fiduciary Net Assets
Pension &Employee Investment
Savings Trust Trust Agency
ASSETS
Cash or Equity in Pooled Cash and Investments ............................................................... 6,497$ 2,323$ 32,459$
Cash with Custodian/Fiscal Agent ……………………………………………………………… 527,795 - -
Investments at Fair Value:
Short Term Investments ………………………………………………………………………… 52,999 - -
Domestic Fixed Income Securities (Bonds) ………………………………………………… 810,554 - -
International Fixed Income Securities (Bonds) ……………………………………………… 176,388 - -
Domestic Equity Securities (Stocks) ………………………………………………………… 2,021,800 - -
International Equity Securities (Stocks) ……………………………………………………… 900,229 - -
Mortgages ………………………………………………………………………………………… 3 - -
Real Estate Equity and Real Estate Securities ……………………………………………… 440,972 - -
Defined Contribution Investments ……………………………………………………………… 745,461 - -
Receivables:
Accounts - Net ................................................................................................................. - - 76
Contributions ………………………………........................................................................ 28,092 - -
Accrued Interest ............................................................................................................... 13,742 39 26
Loans ............................................................................................................................... 29,417 - -
Securities Sold ................................................................................................................. 79,154 - -
Prepaid Expenses ………………………………………………………………………………… 63 - -
Securities Lending Collateral …………………………………………………………………… 854,631 - -
Restricted Cash and Investments ……………………………………………………………… - - 8,312
Capital Assets - Depreciable …………………………………………………………………… 201 - -
TOTAL ASSETS ............................................................................................................. 6,687,998 2,362 40,873$
LIABILITIES
Accounts Payable ............................................................................................................... 7,965 - 1,523$
Accrued Wages and Benefits ............................................................................................. 572 - -
Deposits/Advances from Others ......................................................................................... - - 13,300
Trust Liabilities ................................................................................................................... - - 26,050
DROP Liability ……………………………………………………………………………………… 271,596 - -
Net Pension Obligation ....................................................................................................... 776 - -
Securities Lending Obligations …………………………………………………………………… 854,631 - -
Securities Purchased ......................................................................................................... 88,022 - -
TOTAL LIABILITIES ....................................................................................................... 1,223,562 - 40,873$
NET ASSETS
Held in Trust for Pension Benefits and Other Purposes ..................................................... 5,464,436$ 2,362$
STATEMENT OF FIDUCIARY NET ASSETSFIDUCIARY FUNDS
June 30, 2007(In Thousands)
The accompanying notes are an integral part of the financial statements.
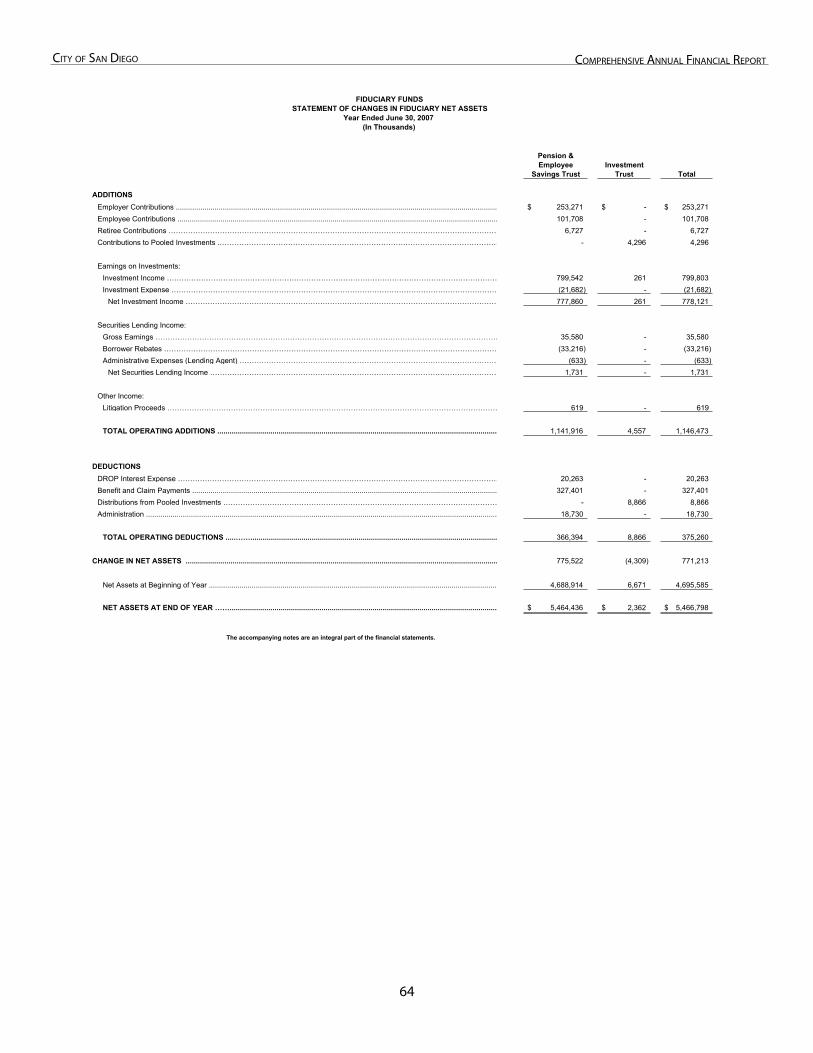
��
City of San Diego ComprehenSive annual finanCial report
Statement of Changes in Fidu-
FIDUCIARY FUNDSSTATEMENT OF CHANGES IN FIDUCIARY NET ASSETS
Year Ended June 30, 2007(In Thousands)
Pension &Employee Investment
Savings Trust Trust Total
ADDITIONSEmployer Contributions .............................................................................................................................................................. 253,271$ -$ 253,271$ Employee Contributions ............................................................................................................................................................. 101,708 - 101,708 Retiree Contributions ……………………………………………………………………………………………………………………… 6,727 - 6,727 Contributions to Pooled Investments .…………………………………………………………………………………………………… - 4,296 4,296
Earnings on Investments:Investment Income ……………………………………………………………………………………………………………………… 799,542 261 799,803 Investment Expense ……………………………………………………………………………………………………………………… (21,682) - (21,682)
Net Investment Income ………………………………………………………………………………………………………………… 777,860 261 778,121
Securities Lending Income:Gross Earnings …………………………………………………………………………………………………………………………… 35,580 - 35,580 Borrower Rebates ………………………………………………………………………………………………………………………… (33,216) - (33,216) Administrative Expenses (Lending Agent) …………………………………………………………………………………………… (633) - (633)
Net Securities Lending Income ……………………………………………………………………………………………………… 1,731 - 1,731
Other Income:Litigation Proceeds ……………………………………………………………………………………………………………………… 619 - 619
TOTAL OPERATING ADDITIONS ......................................................................................................................................... 1,141,916 4,557 1,146,473
DEDUCTIONSDROP Interest Expense …………………………………………………………………………………………………………………… 20,263 - 20,263 Benefit and Claim Payments ...................................................................................................................................................... 327,401 - 327,401 Distributions from Pooled Investments …………………………………………………………………………………………………… - 8,866 8,866 Administration ............................................................................................................................................................................ 18,730 - 18,730
TOTAL OPERATING DEDUCTIONS .....……......................................................................................................................... 366,394 8,866 375,260
CHANGE IN NET ASSETS ......................................................................................................................................................... 775,522 (4,309) 771,213
Net Assets at Beginning of Year ............................................................................................................................................. 4,688,914 6,671 4,695,585
NET ASSETS AT END OF YEAR ……................................................................................................................................... 5,464,436$ 2,362$ 5,466,798$
The accompanying notes are an integral part of the financial statements.
��
City of San Diego ComprehenSive annual finanCial report
Notes to the Financial Statements 1. Summary of Significant Accounting
NOTES TO THE FINANCIAL STATEMENTS
YEAR ENDED JUNE 30, 2007
1. SUMMARY OF SIGNIFICANT ACCOUNTING POLICIES (In Thousands)
The City of San Diego (the “City”) adopted its current charter on April 7, 1931 and operates as a municipality in accordance with State laws. Since adoption, the City Charter has been amended several times. The most recent amendments were added with voter approval of Propositions A, B and C during the June 3, 2008 election. Some of the amendments, which have taken effect immediately, include a more clear separation of the City’s internal auditing function from supervision of the Manager (Mayor) by creating the new office of the City Auditor, which is supervised by a restructured Audit Committee. The Audit Committee will be restructured to consist of two Councilmembers, one being chair, and three public members. The public members must have at least 10 years of professional finance experience, and would be appointed from candidates recommended from a screening committee comprised of the Chief Financial Officer (CFO), the Independent Budget Analyst (IBA), a Councilmember, and two outside experts. Proposition C also provides that the Manager (Mayor) would appoint, with Council confirmation, the CFO who would assume the City’s accounting responsibilities and oversee the City Treasurer. The measure also makes the Office of the IBA permanent, which would otherwise expire if the strong-mayor form of government does not get approved permanently in the year 2010.
The accounting policies of the City conform to accounting principles generally accepted in the United States of America (“GAAP”) as applicable to governmental units. The following is a summary of the City’s significant accounting policies:
a. Financial Reporting Entity
As required by GAAP, these financial statements present the primary government and its component units, entities for which the primary government is considered to be financially accountable.
Blended component units, although legally separate entities, are, in substance, part of the primary government’s operations and as a result, data from these units are combined with data of the primary government (references within this document to “the City” are referring to the primary government). Component units should be included in the reporting entity financial statements using the blending method if either of the following criteria is met:
i. The component unit’s governing body is substantively the same as the governing body of the primary government (the City).
ii. The component unit provides services entirely, or almost entirely, to the primary government or otherwise exclusively, or almost exclusively, benefits the primary government even though it does not provide services directly to it.
Included within the reporting entity as blended component units are the following:
Centre City Development Corporation City of San Diego/Metropolitan Transit Development Board Authority Community Facility and Other Special Assessment Districts Convention Center Expansion Financing Authority Public Facilities Financing Authority Redevelopment Agency of the City of San Diego San Diego Data Processing Corporation San Diego Facilities and Equipment Leasing Corporation
��
City of San Diego ComprehenSive annual finanCial report
San Diego Industrial Development Authority San Diego Open Space Park Facilities District #1 Southeastern Economic Development Corporation San Diego City Employees’ Retirement System Tobacco Settlement Revenue Funding Corporation
A brief description of each blended component unit follows:
Centre City Development Corporation, Inc. (CCDC) is a not-for-profit public benefit corporation established in 1975 to administer certain redevelopment projects in downtown San Diego and to provide redevelopment advisory services to the Redevelopment Agency of the City of San Diego. CCDC’s budget and governing board are approved by the City Council and services are provided exclusively to the primary government. CCDC is reported as a governmental fund. Financial statements can be requested from Centre City Development Corporation, 225 Broadway, Suite 1100, San Diego, California 92101.
The City of San Diego/Metropolitan Transit Development Board Authority (MTDB Authority) is a financing authority which was established in 1988 and acquires and constructs mass transit guide ways, public transit systems, and related transportation facilities primarily benefiting the residents of the City of San Diego. The City appoints two Council members to the governing board and the MTDB Authority appoints one. The MTDB Authority primarily provides services to the primary government. The MTDB Authority is reported as a governmental fund. Financial statements can be requested from the Office of the City Comptroller, 202 C Street, San Diego, California 92101.
The City maintains various Community Facility, Maintenance Assessment and Business Improvement Districts to pay for the construction, maintenance and improvement of community facilities and infrastructure. The governing body of Special Assessment Districts and Community Facilities Districts (special districts) is the City Council. Among its duties, it approves the budgets of special districts, parcel fees, special assessments, and special taxes. The special districts are reported in governmental fund types.
The Convention Center Expansion Financing Authority (CCEFA) was established in 1996 to acquire and construct the expansion to the existing convention center. During the period reported, the governing board was administered by the Mayor, the Port of San Diego Director, and a member of the Board of Commissioners for the Port of San Diego. The CCEFA provides services which primarily benefit the primary government. CCEFA is reported as a governmental fund. Financial statements can be requested from the Office of the City Comptroller, 202 C Street, San Diego, California 92101.
The Public Facilities Financing Authority (PFFA) was established in 1991 and currently acquires and constructs public capital improvements. PFFA is governed by a five member board appointed by the primary government. PFFA provides services exclusively to the primary government. Financing for governmental funds is reported as a governmental activity and financing for enterprise funds is reported as a business-type activity. Financial statements can be requested from the Office of the City Comptroller, 202 C Street, San Diego, California 92101.
The Redevelopment Agency of the City of San Diego (RDA) was established in 1958 in order to provide a method for revitalizing deteriorating and blighted areas of the City and began functioning in 1969 under the authority granted by the community redevelopment law. The City Council is the governing board and the RDA is reported as a governmental fund. Complete stand-alone financial statements can be requested from the Office of the City Comptroller, 202 C Street, San Diego, California 92101.
�7
City of San Diego ComprehenSive annual finanCial report
San Diego Data Processing Corporation (SDDPC) was formed in 1979 as a not-for-profit public benefit corporation for the purpose of providing data processing services. SDDPC's budget and governing board are approved by the City Council. SDDPC provides services almost exclusively to the primary government. SDDPC is reported as an Internal Service Fund. Financial statements can be requested from San Diego Data Processing Corporation, 5975 Santa Fe Street, San Diego, California 92109.
The San Diego Facilities and Equipment Leasing Corporation (SDFELC) is a not-for-profit public benefit corporation established in 1987 for the purpose of acquiring and leasing to the City real and personal property to be used in the municipal operations of the City. The City Council appoints two of the three members of the governing board and services are exclusively to the primary government. Financing for governmental funds is reported as a governmental activity and financing for enterprise funds is reported as a business-type activity. Financial statements can be requested from the Office of the City Comptroller, 202 C Street, San Diego, California 92101.
The San Diego Industrial Development Authority (SDIDA) was established in 1983 by the City for the purpose of providing an alternate method of financing to participating parties for economic development purposes. The City Council is the governing board. SDIDA is reported as a governmental fund. Financial statements can be requested from the Office of the City Comptroller, 202 C Street, San Diego, California 92101.
The San Diego Open Space Park Facilities District #1 (SDOSPFD) was established in 1978 by the City for the purpose of acquiring open space properties to implement the Open Space Element of the City's General Plan. The boundaries are contiguous with those of the City. The City Council is the governing board. SDOSPFD is reported as a governmental fund. Financial statements can be requested from the Office of the City Comptroller, 202 C Street, San Diego, California 92101.
Southeastern Economic Development Corporation (SEDC) is a not-for-profit public benefit corporation organized in 1980 by the City to administer certain redevelopment projects in southeast San Diego and to provide redevelopment advisory services to RDA. SEDC’s budget and governing board are approved by the City Council and services are provided exclusively to the primary government. SEDC is reported as a governmental fund. Financial statements can be requested from the Southeastern Economic Development Corporation, 995 Gateway Center Way, Suite 300, San Diego, California 92102.
San Diego City Employees’ Retirement System (SDCERS) was established in 1927 by the City and provides retirement, health insurance, disability, and death benefits. Currently, SDCERS also administers the Port of San Diego and the San Diego County Regional Airport Authority defined benefit plans.
SDCERS is a legally separate, blended component unit of the City of San Diego. It is managed by a Board of Administration, the majority of which is appointed by the City of San Diego, and a Pension Administrator who does not report to, or work under the direction of the elected officials or appointed managers of the City of San Diego. SDCERS provides services almost exclusively to the primary government. Additionally, during the period reported, SDCERS utilized legal counsel independent of the City of San Diego. As such, the City does not maintain direct operational oversight of SDCERS or its financial reports.
SDCERS is reported as a pension and employee savings trust fund. Complete stand-alone financial statements can be requested from the San Diego City Employees’ Retirement System, 401 West A Street, Suite 400, San Diego, California 92101.
The Tobacco Settlement Revenue Funding Corporation (TSRFC) is a not-for-profit public benefit corporation established in 2006 for the purpose of acquiring the Tobacco Settlement Revenues allocated to the City from the State of California,
�8
City of San Diego ComprehenSive annual finanCial report
pursuant to the Master Settlement Agreement. TSRFC is governed by the Board of Directors which consists of two officials of the City and one independent director. The independent director shall be appointed by the Mayor or the remaining directors. TSRFC is reported as a governmental fund. Financial statements can be requested from the Office of the City Comptroller, 202 C Street, San Diego, California, 92101.
Discretely presented component units, which are also legally separate entities, have financial data reported in a separate column from the financial data of the primary government to demonstrate they are financially and legally separate from the primary government.
There are two entities which are discretely presented component units:
San Diego Convention Center Corporation (SDCCC)
SDCCC is a not-for-profit public benefit corporation originally organized to market, operate and maintain the San Diego Convention Center. On August 1, 1993, SDCCC assumed similar responsibility for the Civic Theatre. The City is the sole member of SDCCC and acts through the San Diego City Council in accordance with the City Charter and the City’s Municipal Code. The City appoints seven voting members out of the nine-member Board of Directors of SDCCC. The City is liable for any operating deficits and would be secondarily liable for any debt issuances of SDCCC. SDCCC is discretely presented because it provides services directly to the citizens. Complete stand-alone financial statements can be requested from San Diego Convention Center Corporation, 111 West Harbor Drive, San Diego, California 92101.
San Diego Housing Commission (SDHC)
SDHC is a government agency which was formed by the City under Ordinance No. 2515 on December 5, 1978 in accordance with the Housing Authority Law of the State of California. SDHC primarily serves low-income families by providing rental assistance payments, rental housing, loans and grants to individuals and not-for-profit organizations and other services. Members of the Board of Commissioners are appointed by the Mayor and confirmed by the City Council. SDHC is discretely presented because it provides services directly to the citizens. Complete stand-alone financial statements can be requested from San Diego Housing Commission, 1122 Broadway, Suite 300, San Diego, California 92101.
Each blended and discretely presented component unit has a June 30 fiscal year-end.
b. Government-Wide and Fund Financial Statements
The government-wide financial statements (i.e., the Statement of Net Assets and the Statement of Activities) report information on all of the non-fiduciary activities of the primary government and its component units. Governmental activities, which normally are supported by taxes and intergovernmental revenues, are reported separately from business-type activities, which rely to a significant extent on fees and charges for support. Likewise, the primary government is reported discretely from certain legally separate component units for which the primary government is financially accountable.
The Statement of Activities demonstrates the degree to which the direct expenses of a given function or segment are offset by program revenues. Direct expenses are those that are clearly identifiable as to a specific function or segment. Direct expenses reported include administrative and overhead charges. Program revenues include (1) charges to customers or applicants who purchase, use, or directly benefit from goods, services, or privileges provided by a given function or segment and (2) grants and contributions that are restricted to meeting the operational or capital requirements of a particular function or segment. Taxes and other items not properly included among program revenues are reported instead as general revenues and contributions.
��
City of San Diego ComprehenSive annual finanCial report
Separate financial statements are provided for governmental funds, proprietary funds, and fiduciary funds, the latter of which are excluded from the government-wide financial statements. Major individual governmental funds and major individual enterprise funds are reported as separate columns in the fund financial statements.
c. Measurement Focus, Basis of Accounting, and Financial Statement Presentation
Government-wide financial statements are reported using the economic resources measurement focus and the accrual basis of accounting, as are the proprietary and fiduciary funds financial statements. Revenues are recorded when earned and expenses are recorded when a liability is incurred, regardless of the timing of related cash flows. Property taxes are recognized as revenues in the year for which they are levied. Grants and similar items are recognized as revenue as soon as all eligibility requirements have been met.
The business-type activities and proprietary funds financial statements apply all effective pronouncements of the Governmental Accounting Standards Board (“GASB”). In addition, these statements apply all Accounting Principles Board Opinions (“APBO”) and Financial Accounting Standards Board (“FASB”) Statements and Interpretations issued on or before November 30, 1989, except those that conflict with GASB pronouncements.
As a general rule, the effect of interfund activity has been eliminated from the government-wide financial statements. Exceptions to this general rule are payments-in-lieu of taxes and other charges between the government’s water and sewer functions and various other functions of the government. Elimination of these charges would distort the direct costs and program revenues reported for the various functions concerned.
All internal service funds, except for the Special Engineering Fund, have been included within governmental activities in the government-wide financial statements since they predominantly benefit governmental functions. The Special Engineering Fund, which services exclusively water and sewer activities, has been included within business-type activities in the government-wide financial statements.
Amounts reported as program revenues include (1) charges to customers for goods, services, or privileges provided, (2) operating grants and contributions, and (3) capital grants and contributions, including special assessments. General revenues include all taxes and investment income.
Governmental funds financial statements are reported using the current financial resources measurement focus and the modified accrual basis of accounting. Revenues are recognized as soon as they are both measurable and available. Revenues are considered to be available when they are collectible within the current period or soon enough thereafter to pay liabilities of the current period.
Revenues which are considered susceptible to accrual include: real and personal property taxes; other local taxes; franchise fees; fines, forfeitures and penalties; motor vehicle license fees; rents and concessions; interest; charges for services; and state and federal grants and subventions, provided they are received within 60 days from the end of the fiscal year.
Licenses and permits, including parking citations, and miscellaneous revenues are recorded as revenues when received in cash because they generally are not measurable until actually received.
Expenditures are recognized when the related fund liability is incurred except for (1) principal and interest of general long-term debt which are recognized when due; and (2) employee annual leave and claims and judgments from litigation which are recorded in the period due and payable since such amounts will not currently be liquidated with expendable available financial resources.
70
City of San Diego ComprehenSive annual finanCial report
The governmental funds financial statements do not present long-term debt, but the related debt is shown in the reconciliation of the Governmental Funds Balance Sheet to the Government-Wide Statement of Net Assets. Bond premiums, discounts and issuance costs are recognized during the current period.
Proprietary funds distinguish operating revenues and expenses from non-operating items. Operating revenues and expenses generally result from providing services and producing and delivering goods in connection with a proprietary fund’s principal ongoing operations. The principal operating revenues of the City’s proprietary funds are charges to customers for sales and services. Operating expenses for proprietary funds include the cost of sales and services, administrative expenses, and depreciation on capital assets. All revenues and expenses not meeting this definition are reported as non-operating revenues and expenses.
Fiduciary funds are used to account for assets held by the City in a trustee capacity or as an agent for individuals, private organizations, and/or other governmental units, and include pension and employee savings trust, investment trust, and agency funds. Pension and Employee Savings Trust Funds are reported using the same measurement focus and basis of accounting as Proprietary Funds. Agency funds are reported using the accrual basis of accounting.
The following is the City’s major governmental fund:
General Fund - The General Fund is the principal operating fund of the City. It is used to account for all financial resources, except those required to be accounted for in another fund.
The following are the City’s major Enterprise Funds:
Sewer Utility Fund - The sewer utility fund is used to account for the operation, maintenance and development of the City’s sewer system. The City’s sewer utility fund includes activities related to the performance of services for Participating Agencies.
Water Utility Fund - The water utility fund is used to account for operating and maintenance costs, replacements, betterments, expansion of facilities, and payments necessary in obtaining water from the Colorado River and the State Water Project.
The following are the City’s other fund types:
Internal Service Funds - These funds account for vehicle and transportation, printing, engineering, data processing, and storeroom services provided to City departments on a cost-reimbursement basis. Internal service funds also account for self-insurance activities, including workers’ compensation and long-term disability programs, which derive revenues from rates charged to benefiting departments. This fund type also accounts for the public liability reserve, which was established for the purpose of paying liability claims.
Pension and Employee Savings Trust Funds - These funds account for the San Diego City Employees’ Retirement System, the Supplemental Pension Savings Plan (SPSP), and the 401(k) Plan.
Investment Trust Fund - This fund was established to account for equity that legally separate entities have in the City Treasurer’s investment pool. The Automated Regional Justice Information System (ARJIS), the San Diego Graphic Information Source (SanGIS), and the Abandoned Vehicle Abatement (AVA) are all legally separate entities which have cash invested in the City Treasurer’s investment pool.
Agency Funds - These funds account for assets held by the City as an agent for individuals, private organizations, and other governments, including federal and state income taxes withheld from employees, parking citation revenues, and certain employee benefit plans.
71
City of San Diego ComprehenSive annual finanCial report
d. Property Taxes
The County of San Diego (the “County”) assesses, bills, and collects property taxes on behalf of numerous special districts and incorporated cities, including the City of San Diego. The City’s collections of the current year’s taxes are received through periodic apportionments from the County.
The County’s tax calendar is from July 1 to June 30. Property taxes attach as a lien on property on January 1. Taxes are levied on July 1 and are payable in two equal installments on November 1 and February 1, and become delinquent after December 10 and April 10, respectively. Since the passage of California’s Proposition 13, beginning with fiscal year ended 1979, general property taxes are based either on a flat 1% rate applied to the 1975-76 full value of the property or on 1% of the sales price of any property sold or of the cost of any new construction after the 1975-76 valuation. Taxable values of properties (exclusive of increases related to sales and new construction) can increase by a maximum of 2% per year. The Proposition 13 limitation on general property taxes does not apply to taxes levied to pay the debt service on any indebtedness approved by the voters prior to June 6, 1978 (the date of passage of Proposition 13).
At the government-wide level, property tax revenue is recognized in the fiscal year for which the taxes have been levied. Property taxes received after the fiscal year in which they were levied are not considered available as a resource that can be used to finance the current year operations of the City and, therefore, are recorded as deferred revenue in the governmental funds. The City provides an allowance for uncollected property taxes of 3% of the outstanding balance which reflects historical collections.
As a result of the recent decline in median residential home prices in the City, property owners can appeal the assessment value of their property to the County Assessment Appeals Board. In the event of a successful appeal, the County Assessor may reduce the taxable value of a property and/or provide a refund to affected property owners. Reductions of taxable property value within the City of San Diego will have a negative impact on future tax collections until assessed valuations increase.
e. Cash and Investments
The City’s cash and cash equivalents for Statement of Cash Flows purposes are considered to be cash on hand, demand deposits, restricted cash, and investments held by the City Treasurer in a cash management investment pool and reported at market value. Cash equivalents reported in the Statement of Cash Flows for the Water and Sewer Utilities do not include restricted investments represented as Restricted Cash and Investments with a maturity date greater than ninety days.
The City’s cash resources are combined to form a cash and investment pool managed by the City Treasurer (the pool). The pool is not registered as an investment company with the Securities and Exchange Commission (SEC) nor is it a 2a7–like pool. The investment activities of the Treasurer in managing the pool are governed by California Government Code § 53601 and the City’s Investment Policy, which is reviewed by the Investment Advisory Committee and approved annually by the City Council. Interest earned on pooled investments is allocated to participating funds and entities based upon their average daily cash balance during the allocation month. Fair market value adjustments to the pool are recorded annually; however, the City Treasury reports on market values monthly. The value of the shares in the pool is equal to the fair market value of the pool.
The pool participates in the California State Treasurer’s Local Agency Investment Fund (LAIF). Investments in LAIF are governed by State statutes and overseen by a five member Local Investment Advisory Board. The fair value of the City’s position in LAIF may be greater or less than the value of the shares. Investments in LAIF are valued in these financial statements using a fair value factor provided by LAIF applied to the value of the City’s shares in the investment pool.
72
City of San Diego ComprehenSive annual finanCial report
It has been the City’s policy to allow the General Fund to receive interest earned by certain governmental funds, internal service funds and agency funds, unless expressly stated in the resolutions creating individual funds. During the fiscal year ended June 30, 2007, approximately $4,714 interest was assigned from various funds to the General Fund. These transactions caused an increase in the “transfers from” amount for the General Fund and a corresponding increase in the “transfer to” amount for the fund disbursing the interest. In the case of negative interest, these transactions caused an increase in the “transfers from” amount for the fund transferring the negative interest and a corresponding increase in the “transfer to” amount for the General Fund.
Certain governmental funds maintain investments outside of the City’s investment pool. These funds are supervised and controlled by a five member Funds Commission which is appointed by the Mayor and confirmed by the City Council. The Funds Commission engages money managers to direct the investments of these funds. Additionally, the City and its component units maintain individual accounts pursuant to bond issuances and major construction contracts which may or may not be related to debt issuances. The investment of these funds is governed by the policies set forth in individual indenture and trustee agreements. Certain component units of the City also participate in LAIF separately from the City Treasurer’s investment pool.
All City investments are reported at fair value in accordance with the GASB 31, Accounting and Financial Reporting for Certain Investments and External Investment Pools. Note 3 of the notes to the financial statements contain additional information on permissible investments per the City investment policy and other policies applicable to the cash and investments reported herein.
The discharge of fiduciary duties by SDCERS’ Board is governed by Section 144 of the City Charter and Article XVI, Section 17 of the California State Constitution. Investment decisions are made on a risk versus return basis in a total portfolio context. SDCERS' Board has the authority to delegate investment management duties to outside advisors, to seek the advice of outside investment counsel, and to provide oversight and monitoring of the investment managers it hires. Furthermore, under the California State Constitution and other relevant authorities, SDCERS’ Board may, at its discretion, and when prudent in the informed opinion of the Board, invest funds in any form or type of investment, financial instrument, or financial transaction, unless otherwise limited by the San Diego City Council. SDCERS’ agents, in SDCERS’ name, manage all investments.
SDCERS’ investments are reported at fair value in the accompanying Statement of Fiduciary Net Assets. SDCERS’ custodian, State Street Bank & Trust Company, provides the market values of exchange traded assets. In the case of debt securities acquired through private placements, SDCERS’ contract investment advisors compute fair value based on market yields and average maturity dates of comparable quoted securities. Short-term investments are reported at cost or amortized cost, which approximates fair value. Real estate equity investment fair values are based on either annual valuation estimates provided by SDCERS’ contract real estate advisors or by independent certified appraisers. Fair value of investments in commingled funds of publicly traded securities are based on the funds’ underlying asset values determined from published market prices and quotations from major investment firms.
f. Inventories
Inventories reported in the government-wide financial statements and the proprietary funds financial statements, which consist of water in storage and supplies, are valued at the lower of cost or market. Such inventories are expensed when consumed using primarily the first-in, first-out (FIFO) and weighted-average methods, respectively. Inventory supplies of governmental funds are recorded as expenditures when purchased.
g. Land Held for Resale
Land Held for Resale, purchased by RDA, is reported in the government-wide and fund financial statements at the lower of cost or net realizable value.
73
City of San Diego ComprehenSive annual finanCial report
h. Deferred Charges
In the government-wide and proprietary funds financial statements, Deferred Charges represent the unamortized portion of bond issuance costs. These costs will be amortized over the life of the related bonds using a method which approximates the effective yield method.
i. Capital Assets
Non-depreciable Capital Assets, which include land and construction-in-progress, are reported in the applicable governmental or business-type activities column in the government-wide financial statements, as well as in the Proprietary Fund’s financial statements.
Depreciable Capital Assets, which include structures and improvements, equipment, distribution and collection systems, and infrastructure, are reported net of accumulated depreciation in the applicable governmental or business-type activities column in the government-wide financial statements, as well as in the Proprietary Fund’s financial statements. To meet the criteria for capitalization, an asset must have a useful life in excess of one year and in the case of equipment outlay, must equal or exceed a capitalization threshold of five thousand dollars. All other capital assets such as land, structures, infrastructure, and distribution and collection systems are capitalized regardless of cost. Subsequent improvements are capitalized to the extent that they extend the initial estimated useful life of the capitalized asset, or improve the efficiencyor capacity of that asset. Costs for routine maintenance are expensed as incurred. Interest expense incurred during the construction phase of business-type capital assets are reflected in the capitalized value of the asset constructed. During fiscal year 2007, $14,866 of interest expense incurred was capitalized, which is calculated net of related interest revenue of $1,132.
Capital assets, when purchased or constructed, are recorded at historical cost or estimated historical cost. Donated capital assets are recorded at the estimated fair market value on the date of donation. Depreciation of capital assets is computed using the straight-line method over the estimated useful life of the asset as follows:
Assets YearsStructures and Improvements
Buildings 40 - 50Building Improvements 15 - 40
EquipmentAutomobiles and Light Trucks 5 - 10Construction and Maintenance Vehicles 5 - 20General Machinery and Office Equipment 3 - 25
Distribution and Collection SystemsSewer Pipes and Water Mains 15 - 150Reservoirs 100 - 150
InfrastructurePavement and Traffic Signals 12 - 50Bridges 75Hardscape 20 - 50Flood Control Assets 40 - 75
7�
City of San Diego ComprehenSive annual finanCial report
j. Disposition and Development Agreements
RDA and McMillin-NTC, LLC entered into a Disposition and Development Agreement, dated June 26, 2000, and a Third Implementation Agreement, dated May 6, 2003, which were executed for the purpose of effectuating the Redevelopment Plan at the Naval Training Center Redevelopment Project, in addition to constructing and installing additional infrastructure improvements as required by the City. The developer has agreed to advance the funds needed to pay for infrastructure costs. RDA has consistently reimbursed McMillin-NTC, LLC for eligible costs as they are billed, therefore, this agreement is not treated as a loan, and instead expenditures are recognized as payments are made to the developer and a corresponding capital asset is recorded in the government-wide financial statements.
On March 30, 2004 RDA entered into a Disposition and Development Agreement with Western Pacific Housing for a condominium development project in the North Park Redevelopment Project Area. Under the agreement, RDA promised to pay the maximum aggregate principal amount of $3,000, of which $2,100 represents the Affordability component of RDA’s Payment Obligation, and $900 represents the Public Improvement component. The Affordability component is subject to an adjustment based on the actual project sales revenue proceeds received by the Developer. This adjustment amount cannot be computed until all 45 affordable units are sold. The principal amount outstanding bears simple interest at a rate equal to 5% per annum. Solely for the purposes of calculating the amount of interest payable, the developer shall be deemed to have paid an amount equal to 25% of RDA’s Payment Obligation as of the date which is 195 days after closing of escrow, 50% as of the date which is 390 days after closing of escrow, 75% as of the date which is 585 days after closing of escrow, and 100% at the completion date, which is the date on which the release of construction covenants under the agreement have been recorded in the official records of the San Diego County. For purposes of calculating the amount of interest payable, the principal amounts stated above will be reduced by a 10% per annum applied on a pro rata basis for the period of time the Developer is not in compliance with the schedule of performance dates stated in the agreement for commencement and completion of construction. All payments shall be made from the site-generated property tax increment. To date, only the $900, representing the Public Improvement component of RDA’s Payment Obligation, has been recognized as a liability since the remaining $2,100, representing the Affordability component of RDA’s Payment Obligation, is subject to adjustment upon final sales of all 45 affordable units, which has yet to occur.
k. Unearned/Deferred Revenue
In the government-wide and all fund level financial statements, unearned revenue represents amounts received which have not been earned. The government-wide financial statements include revenues earned from developer credits, which are not reported in governmental funds because they are non-monetary transactions. In the governmental funds financial statements, deferred revenue represents revenues which have been earned but have not met the recognition criteria based on the modified accrual basis of accounting.
l. Interfund Transactions
The City has the following types of interfund transactions:
Loans – amounts provided with a requirement for repayment. Interfund loans are normally reported as interfund receivables (i.e. Receivables from Other Funds) in lender funds and interfund payables (i.e. Due to Other Funds) in borrower funds. The non-current portions of long-term interfund loans receivable are reported as advances. There is one interfund loan between the Facilities Benefit Assessments (FBA) Fund and the Sewer Utility Fund, for developer fees owed for the Carmel Valley Trunk sewer project, which is reported as an Interfund Loan Receivable/Payable at the fund level and included with Internal Balances on the government-wide Statement of Net Assets.
7�
City of San Diego ComprehenSive annual finanCial report
Services provided and used – sales and purchases of goods and services between funds for a price approximating their external exchange value. Interfund services provided and used are reported as revenues in seller funds and expenditures or expenses in purchaser funds. Unpaid amounts are reported as interfund receivables and payables in the fund balance sheets or fund statements of net assets.
Reimbursements – repayments from the funds responsible for particular expenditures or expenses to the funds that initially paid for them. Reimbursement is reported as expenditures or expenses in the reimbursing fund and a reduction of expenditures or expenses in the paying fund.
Transfers – flows of assets (such as cash or goods) without equivalent flows of assets in return, and without a requirement for repayment. In governmental funds, transfers are reported as other financing uses in the funds making transfers and as other financing sources in the funds receiving transfers. In proprietary funds, transfers are reported after non-operating revenues and expenses.
m. Long-Term Liabilities
In the government-wide and proprietary funds financial statements, long-term debt and other long-term obligations are reported as liabilities in the applicable governmental activities, business-type activities, or proprietary funds statements ofnet assets. Capital appreciation bond accretion, bond premiums and discounts, and bond refunding gains and losses are amortized over the life of the bonds using a method which approximates the effective yield method. Net bonds payable reflects amortized bond accretion and unamortized bond discounts, premiums and refunding gains and losses. Bond accretion is not offset against capital assets as are discounts, premiums and refunding gains and losses.
n. Sundry Trust Liabilities
Under approval of certain agreements, developers submit to RDA an initial deposit to ensure the Developer proceeds diligently and in good faith to negotiate and perform all of the obligations under the agreement. These deposits can normally be used for administrative costs of RDA. In the government-wide financial statements and in the fund financial statements, the unspent portion of these deposits, called Sundry Trust Liabilities, are reported as liabilities of RDA.
o. Compensated Absences
The City provides combined annual leave to cover both vacation and sick leave. It is the City’s policy to permit employees to accumulate between 8.75 weeks and 17.5 weeks of earned but unused annual leave, depending on hire date. Accumulation of these earnings will be paid to employees upon separation from service.
The liability for compensated absences reported in the government-wide, proprietary and fiduciary fund financial statements consists of unpaid, accumulated vacation and sick leave balances. The liability has been calculated using the vesting method, in which leave amounts for both employees who currently are eligible to receive termination payments and other employees who are expected to become eligible in the future to receive such payments upon termination are included. The liability has been calculated based on the employees’ current salary level and includes salary related costs (e.g. Social Security and Medicare Tax). A liability for these amounts is reported in governmental funds only if they have matured, for example, as a result of employee resignations and retirements.
p. Claims and Judgments
The costs of claims and judgments are accrued when incurred and measurable in the government-wide financial statements and both proprietary and fiduciary funds financial statements. In governmental funds, the costs of claims and judgments are recorded as expenditures when payments are due and payable.
7�
City of San Diego ComprehenSive annual finanCial report
q. Non-Monetary Transactions
The City, as part of approving new development in the community planning process, requires that certain public facilities be constructed per the provisions of community financing plans. Historically, the City has agreed to pay a pro rata share of these assets. In lieu of providing direct funding for these assets, the City often provides developers with credits (also referred to as FBA credits) for future permit fees. These credits are earned by the developer upon successful completion of construction phases and when City engineers have accepted the work. The credits are recognized as permit revenue upon issuance and a corresponding capital asset is recorded in the government-wide financial statements.
r. Net Assets
In the government-wide and proprietary fund financial statements, net assets are categorized as follows:
Invested in Capital Assets, Net of Related Debt consists of capital assets, net of accumulated depreciation, and reduced by outstanding debt attributed to the acquisition of these assets.
Restricted Net Assets consist of assets with restrictions imposed on them by external creditors, grantors, contributors, laws and regulations of other governments, or law through constitutional provisions or enabling legislation. It is the City’s policy to first apply restricted resources when an expense is incurred for purposes which both restricted and unrestricted net assets are available. As of June 30, 2007 the amount of restricted net assets due to enabling legislation was approximately $277,000.
Unrestricted Net Assets consist of net assets that do not meet the definition of Invested in Capital Assets, Net of Related Debt or Restricted Net Assets.
s. Fund Balance
In the fund financial statements, portions of fund equity of governmental funds have been reserved for specific purposes. Reservations are created to either (1) satisfy legal covenants that require a portion of the fund balance to be segregated, or (2) identify the portion of the fund balance that is not appropriable for future expenditures.
Designated fund balance indicates that portion of fund equity for which the City has made tentative plans.
Undesignated fund balance indicates that portion of fund equity which is available for appropriation in future periods.
t. Reserves
City Charter Section 91 titled “General Reserve Fund” was approved by the voters on November 6, 1962. This section requires Council to create and maintain a General Reserve Fund for the purpose of keeping the payment of running expenses of the City on a cash basis. Section 91 requires the reserve be maintained in an amount sufficient to meet all legal demands against the City Treasury for the first four months or other necessary period of each fiscal year prior to the collection of taxes. This fund may be expended only in the event of a public emergency by the affirmative vote of two-thirds of the City Council. The argument for this charter section given by the Citizens Charter Review Committee, commissioned in 1962, was to “strengthen the financial position of the City through the more efficient utilization of tax monies by reducing the amount of taxes collected and lying idle during a great part of the year, and through focusing responsibility for fiscal policies on the elected City Council.”
On February 28, 1984, the City Attorney’s Office issued Opinion No. 84-3 which addresses issues in regards to the City’s compliance with the funding requirements of Charter Section 91. In the opinion of the City Attorney, “To the extent that the legislative body approves the issuance of short term notes, commonly referred to as Tax or Revenue Anticipation
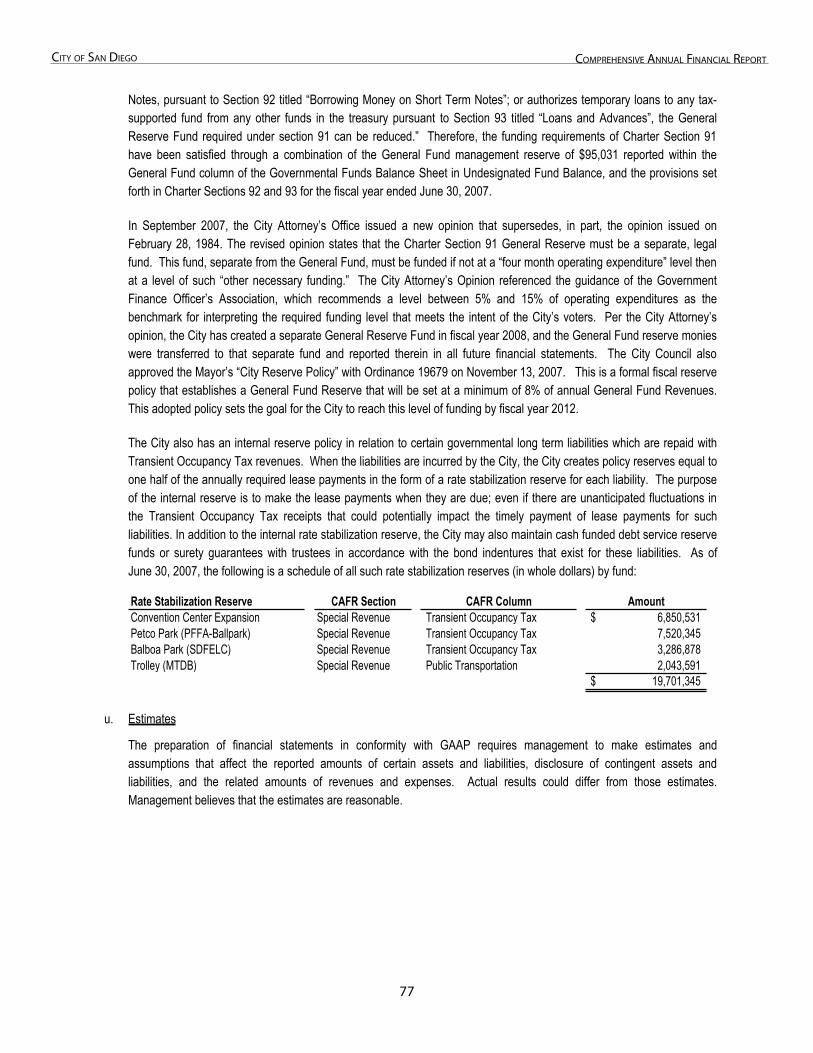
77
City of San Diego ComprehenSive annual finanCial report
Notes, pursuant to Section 92 titled “Borrowing Money on Short Term Notes”; or authorizes temporary loans to any tax-supported fund from any other funds in the treasury pursuant to Section 93 titled “Loans and Advances”, the General Reserve Fund required under section 91 can be reduced.” Therefore, the funding requirements of Charter Section 91 have been satisfied through a combination of the General Fund management reserve of $95,031 reported within the General Fund column of the Governmental Funds Balance Sheet in Undesignated Fund Balance, and the provisions set forth in Charter Sections 92 and 93 for the fiscal year ended June 30, 2007.
In September 2007, the City Attorney’s Office issued a new opinion that supersedes, in part, the opinion issued on February 28, 1984. The revised opinion states that the Charter Section 91 General Reserve must be a separate, legal fund. This fund, separate from the General Fund, must be funded if not at a “four month operating expenditure” level then at a level of such “other necessary funding.” The City Attorney’s Opinion referenced the guidance of the Government Finance Officer’s Association, which recommends a level between 5% and 15% of operating expenditures as the benchmark for interpreting the required funding level that meets the intent of the City’s voters. Per the City Attorney’s opinion, the City has created a separate General Reserve Fund in fiscal year 2008, and the General Fund reserve monies were transferred to that separate fund and reported therein in all future financial statements. The City Council also approved the Mayor’s “City Reserve Policy” with Ordinance 19679 on November 13, 2007. This is a formal fiscal reserve policy that establishes a General Fund Reserve that will be set at a minimum of 8% of annual General Fund Revenues. This adopted policy sets the goal for the City to reach this level of funding by fiscal year 2012.
The City also has an internal reserve policy in relation to certain governmental long term liabilities which are repaid with Transient Occupancy Tax revenues. When the liabilities are incurred by the City, the City creates policy reserves equal to one half of the annually required lease payments in the form of a rate stabilization reserve for each liability. The purpose of the internal reserve is to make the lease payments when they are due; even if there are unanticipated fluctuations in the Transient Occupancy Tax receipts that could potentially impact the timely payment of lease payments for such liabilities. In addition to the internal rate stabilization reserve, the City may also maintain cash funded debt service reservefunds or surety guarantees with trustees in accordance with the bond indentures that exist for these liabilities. As of June 30, 2007, the following is a schedule of all such rate stabilization reserves (in whole dollars) by fund:
Rate Stabilization Reserve CAFR Section CAFR Column AmountConvention Center Expansion Special Revenue Transient Occupancy Tax 6,850,531$ Petco Park (PFFA-Ballpark) Special Revenue Transient Occupancy Tax 7,520,345 Balboa Park (SDFELC) Special Revenue Transient Occupancy Tax 3,286,878 Trolley (MTDB) Special Revenue Public Transportation 2,043,591
19,701,345$
u. Estimates
The preparation of financial statements in conformity with GAAP requires management to make estimates and assumptions that affect the reported amounts of certain assets and liabilities, disclosure of contingent assets and liabilities, and the related amounts of revenues and expenses. Actual results could differ from those estimates. Management believes that the estimates are reasonable.
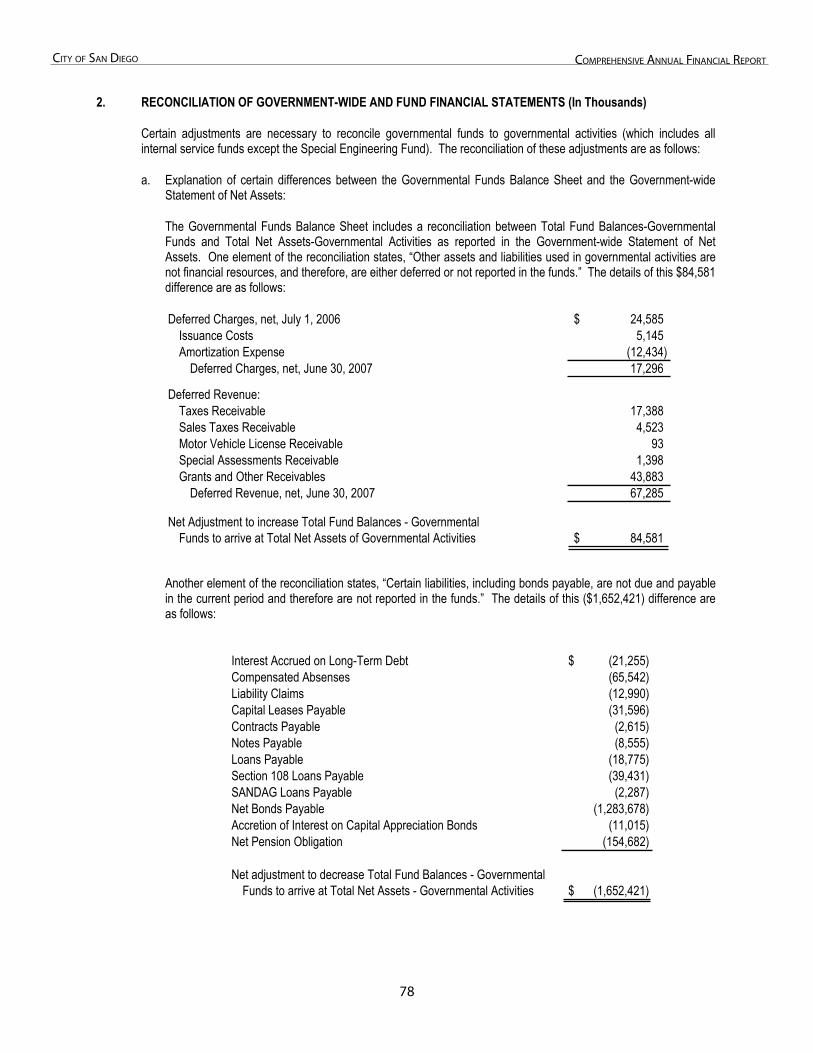
78
City of San Diego ComprehenSive annual finanCial report
2. Reconciliation of Government-Wide and Fund Financial
2. RECONCILIATION OF GOVERNMENT-WIDE AND FUND FINANCIAL STATEMENTS (In Thousands)
Certain adjustments are necessary to reconcile governmental funds to governmental activities (which includes all internal service funds except the Special Engineering Fund). The reconciliation of these adjustments are as follows:
a. Explanation of certain differences between the Governmental Funds Balance Sheet and the Government-wide Statement of Net Assets:
The Governmental Funds Balance Sheet includes a reconciliation between Total Fund Balances-Governmental Funds and Total Net Assets-Governmental Activities as reported in the Government-wide Statement of Net Assets. One element of the reconciliation states, “Other assets and liabilities used in governmental activities are not financial resources, and therefore, are either deferred or not reported in the funds.” The details of this $84,581 difference are as follows:
Deferred Charges, net, July 1, 2006 24,585$Issuance Costs 5,145 Amortization Expense (12,434)
Deferred Charges, net, June 30, 2007 17,296
Deferred Revenue:Taxes Receivable 17,388Sales Taxes Receivable 4,523 Motor Vehicle License Receivable 93 Special Assessments Receivable 1,398 Grants and Other Receivables 43,883
Deferred Revenue, net, June 30, 2007 67,285
Net Adjustment to increase Total Fund Balances - GovernmentalFunds to arrive at Total Net Assets of Governmental Activities 84,581$
Another element of the reconciliation states, “Certain liabilities, including bonds payable, are not due and payable in the current period and therefore are not reported in the funds.” The details of this ($1,652,421) difference are as follows:
Interest Accrued on Long-Term Debt (21,255)$Compensated Absenses (65,542)Liability Claims (12,990)Capital Leases Payable (31,596)Contracts Payable (2,615)Notes Payable (8,555)Loans Payable (18,775)Section 108 Loans Payable (39,431)SANDAG Loans Payable (2,287)Net Bonds Payable (1,283,678)Accretion of Interest on Capital Appreciation Bonds (11,015)Net Pension Obligation (154,682)
Net adjustment to decrease Total Fund Balances - GovernmentalFunds to arrive at Total Net Assets - Governmental Activities (1,652,421)$
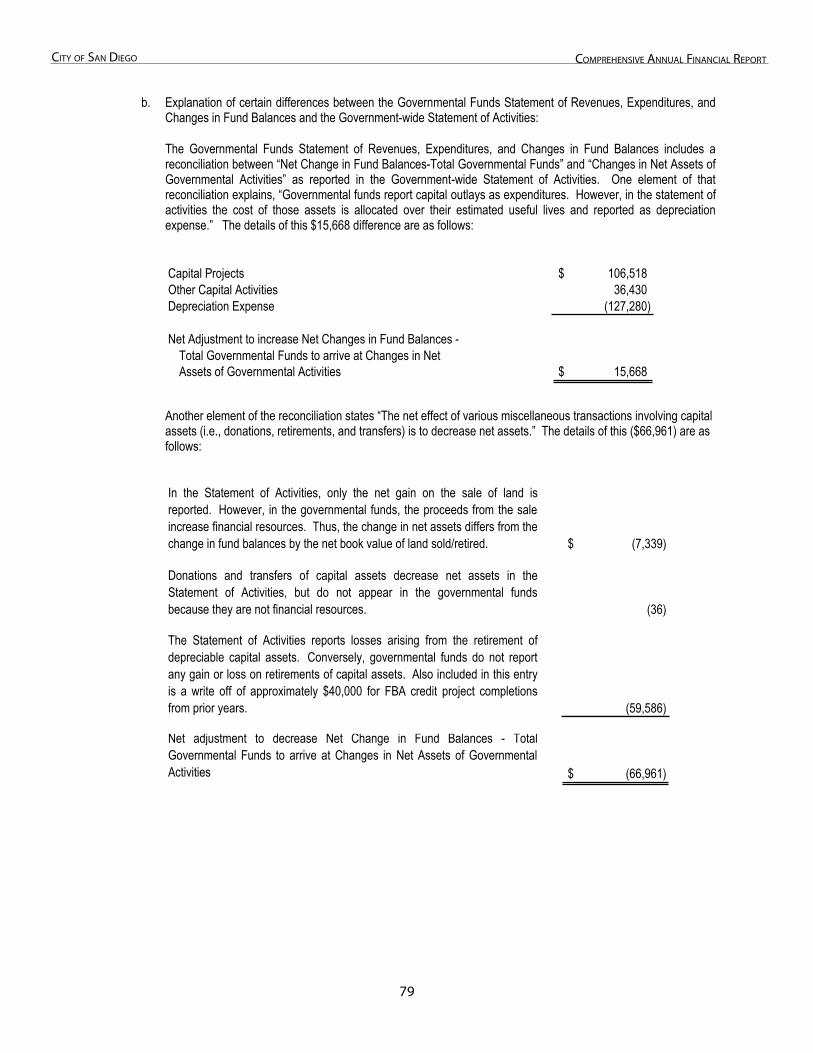
7�
City of San Diego ComprehenSive annual finanCial report
b. Explanation of certain differences between the Governmental Funds Statement of Revenues, Expenditures, and Changes in Fund Balances and the Government-wide Statement of Activities:
The Governmental Funds Statement of Revenues, Expenditures, and Changes in Fund Balances includes a reconciliation between “Net Change in Fund Balances-Total Governmental Funds” and “Changes in Net Assets of Governmental Activities” as reported in the Government-wide Statement of Activities. One element of that reconciliation explains, “Governmental funds report capital outlays as expenditures. However, in the statement of activities the cost of those assets is allocated over their estimated useful lives and reported as depreciation expense.” The details of this $15,668 difference are as follows:
Capital Projects 106,518$Other Capital Activities 36,430Depreciation Expense (127,280)
Net Adjustment to increase Net Changes in Fund Balances - Total Governmental Funds to arrive at Changes in NetAssets of Governmental Activities 15,668$
Another element of the reconciliation states “The net effect of various miscellaneous transactions involving capital assets (i.e., donations, retirements, and transfers) is to decrease net assets.” The details of this ($66,961) are as follows:
In the Statement of Activities, only the net gain on the sale of land isreported. However, in the governmental funds, the proceeds from the saleincrease financial resources. Thus, the change in net assets differs from thechange in fund balances by the net book value of land sold/retired. (7,339)$
Donations and transfers of capital assets decrease net assets in theStatement of Activities, but do not appear in the governmental fundsbecause they are not financial resources. (36)
The Statement of Activities reports losses arising from the retirement ofdepreciable capital assets. Conversely, governmental funds do not reportany gain or loss on retirements of capital assets. Also included in this entryis a write off of approximately $40,000 for FBA credit project completionsfrom prior years. (59,586)
Net adjustment to decrease Net Change in Fund Balances - TotalGovernmental Funds to arrive at Changes in Net Assets of GovernmentalActivities (66,961)$
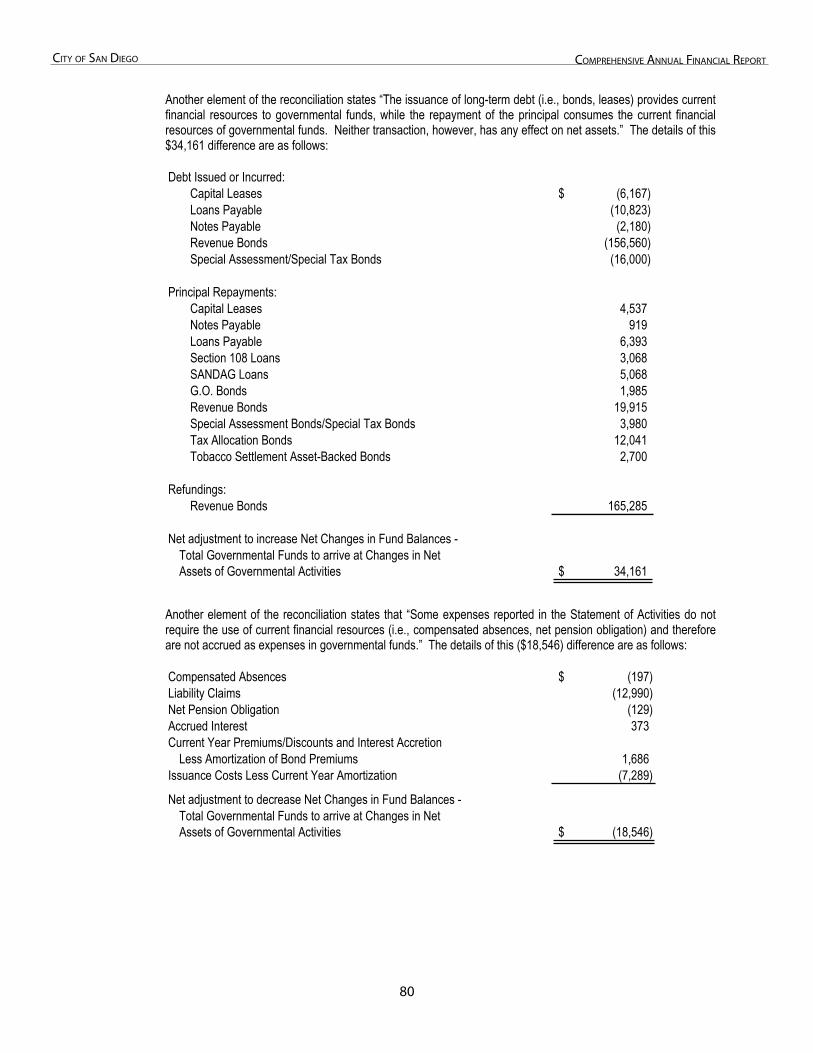
80
City of San Diego ComprehenSive annual finanCial report
Another element of the reconciliation states “The issuance of long-term debt (i.e., bonds, leases) provides current financial resources to governmental funds, while the repayment of the principal consumes the current financial resources of governmental funds. Neither transaction, however, has any effect on net assets.” The details of this $34,161 difference are as follows:
Debt Issued or Incurred:Capital Leases (6,167)$Loans Payable (10,823)Notes Payable (2,180)Revenue Bonds (156,560)Special Assessment/Special Tax Bonds (16,000)
Principal Repayments:Capital Leases 4,537Notes Payable 919 Loans Payable 6,393Section 108 Loans 3,068SANDAG Loans 5,068G.O. Bonds 1,985Revenue Bonds 19,915Special Assessment Bonds/Special Tax Bonds 3,980Tax Allocation Bonds 12,041Tobacco Settlement Asset-Backed Bonds 2,700
Refundings:Revenue Bonds 165,285
Net adjustment to increase Net Changes in Fund Balances -Total Governmental Funds to arrive at Changes in NetAssets of Governmental Activities 34,161$
Another element of the reconciliation states that “Some expenses reported in the Statement of Activities do not require the use of current financial resources (i.e., compensated absences, net pension obligation) and therefore are not accrued as expenses in governmental funds.” The details of this ($18,546) difference are as follows:
Compensated Absences (197)$ Liability Claims (12,990)Net Pension Obligation (129) Accrued Interest 373 Current Year Premiums/Discounts and Interest Accretion
Less Amortization of Bond Premiums 1,686Issuance Costs Less Current Year Amortization (7,289)
Net adjustment to decrease Net Changes in Fund Balances -Total Governmental Funds to arrive at Changes in Net Assets of Governmental Activities (18,546)$
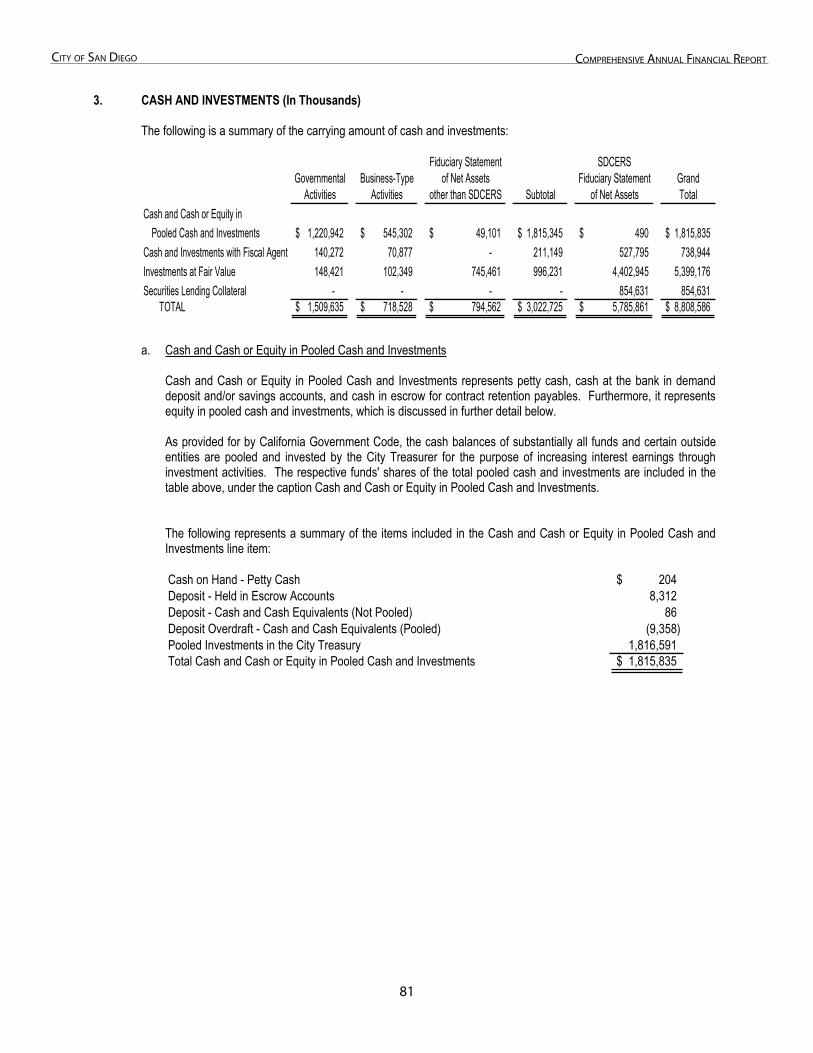
81
City of San Diego ComprehenSive annual finanCial report
3. Cash and Investments
3. CASH AND INVESTMENTS (In Thousands)
The following is a summary of the carrying amount of cash and investments:
Fiduciary Statement SDCERSGovernmental Business-Type of Net Assets Fiduciary Statement Grand
Activities Activities other than SDCERS Subtotal of Net Assets TotalCash and Cash or Equity in
Pooled Cash and Investments 1,220,942$ 545,302$ 49,101$ 1,815,345$ 490$ 1,815,835$Cash and Investments with Fiscal Agent 140,272 70,877 - 211,149 527,795 738,944 Investments at Fair Value 148,421 102,349 745,461 996,231 4,402,945 5,399,176 Securities Lending Collateral - - - - 854,631 854,631 TOTAL 1,509,635$ 718,528$ 794,562$ 3,022,725$ 5,785,861$ 8,808,586$
a. Cash and Cash or Equity in Pooled Cash and Investments
Cash and Cash or Equity in Pooled Cash and Investments represents petty cash, cash at the bank in demand deposit and/or savings accounts, and cash in escrow for contract retention payables. Furthermore, it represents equity in pooled cash and investments, which is discussed in further detail below.
As provided for by California Government Code, the cash balances of substantially all funds and certain outside entities are pooled and invested by the City Treasurer for the purpose of increasing interest earnings through investment activities. The respective funds' shares of the total pooled cash and investments are included in the table above, under the caption Cash and Cash or Equity in Pooled Cash and Investments.
The following represents a summary of the items included in the Cash and Cash or Equity in Pooled Cash and Investments line item:
Cash on Hand - Petty Cash 204$ Deposit - Held in Escrow Accounts 8,312 Deposit - Cash and Cash Equivalents (Not Pooled) 86 Deposit Overdraft - Cash and Cash Equivalents (Pooled) (9,358) Pooled Investments in the City Treasury 1,816,591Total Cash and Cash or Equity in Pooled Cash and Investments 1,815,835$
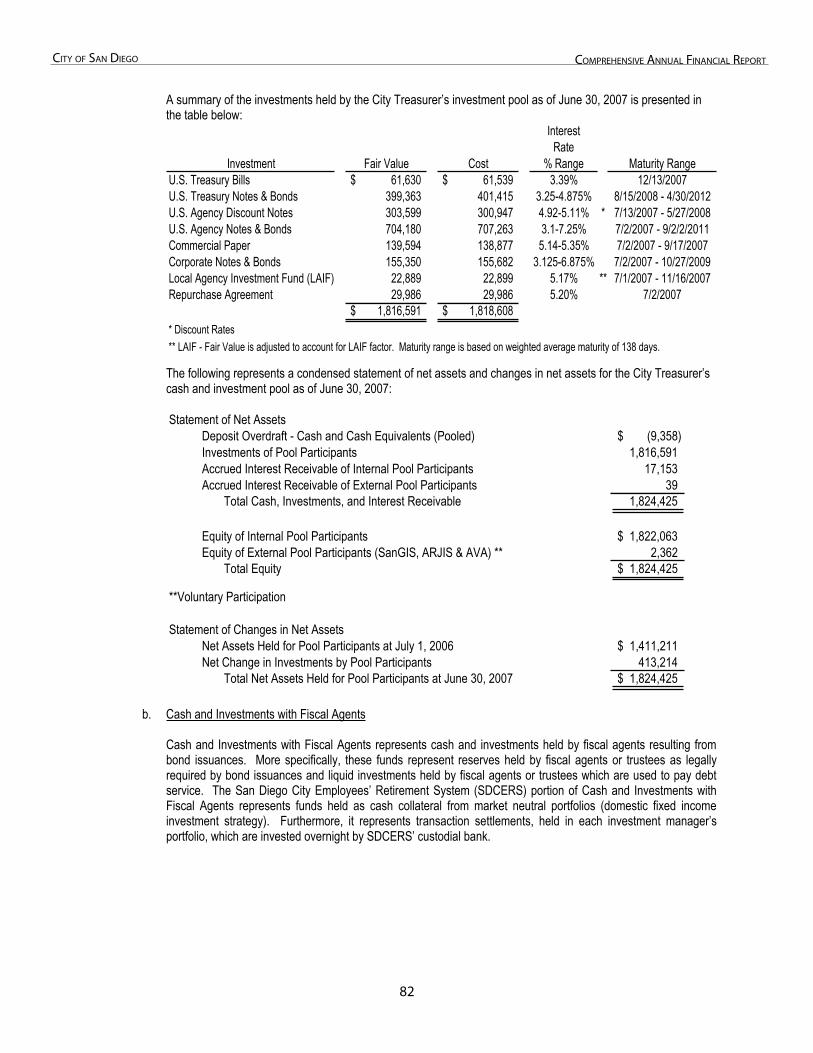
82
City of San Diego ComprehenSive annual finanCial report
A summary of the investments held by the City Treasurer’s investment pool as of June 30, 2007 is presented in the table below:
InterestRate
Investment Fair Value Cost % Range Maturity RangeU.S. Treasury Bills 61,630$ 61,539$ 3.39% 12/13/2007U.S. Treasury Notes & Bonds 399,363 401,415 3.25-4.875% 8/15/2008 - 4/30/2012U.S. Agency Discount Notes 303,599 300,947 4.92-5.11% * 7/13/2007 - 5/27/2008U.S. Agency Notes & Bonds 704,180 707,263 3.1-7.25% 7/2/2007 - 9/2/2/2011Commercial Paper 139,594 138,877 5.14-5.35% 7/2/2007 - 9/17/2007Corporate Notes & Bonds 155,350 155,682 3.125-6.875% 7/2/2007 - 10/27/2009Local Agency Investment Fund (LAIF) 22,889 22,899 5.17% ** 7/1/2007 - 11/16/2007Repurchase Agreement 29,986 29,986 5.20% 7/2/2007
1,816,591$ 1,818,608$ * Discount Rates** LAIF - Fair Value is adjusted to account for LAIF factor. Maturity range is based on weighted average maturity of 138 days.
The following represents a condensed statement of net assets and changes in net assets for the City Treasurer’s cash and investment pool as of June 30, 2007:
Statement of Net AssetsDeposit Overdraft - Cash and Cash Equivalents (Pooled) (9,358)$ Investments of Pool Participants 1,816,591Accrued Interest Receivable of Internal Pool Participants 17,153 Accrued Interest Receivable of External Pool Participants 39
Total Cash, Investments, and Interest Receivable 1,824,425
Equity of Internal Pool Participants 1,822,063$Equity of External Pool Participants (SanGIS, ARJIS & AVA) ** 2,362
Total Equity 1,824,425$
**Voluntary Participation
Statement of Changes in Net AssetsNet Assets Held for Pool Participants at July 1, 2006 1,411,211$Net Change in Investments by Pool Participants 413,214
Total Net Assets Held for Pool Participants at June 30, 2007 1,824,425$
b. Cash and Investments with Fiscal Agents
Cash and Investments with Fiscal Agents represents cash and investments held by fiscal agents resulting from bond issuances. More specifically, these funds represent reserves held by fiscal agents or trustees as legally required by bond issuances and liquid investments held by fiscal agents or trustees which are used to pay debt service. The San Diego City Employees’ Retirement System (SDCERS) portion of Cash and Investments with Fiscal Agents represents funds held as cash collateral from market neutral portfolios (domestic fixed income investment strategy). Furthermore, it represents transaction settlements, held in each investment manager’s portfolio, which are invested overnight by SDCERS’ custodial bank.
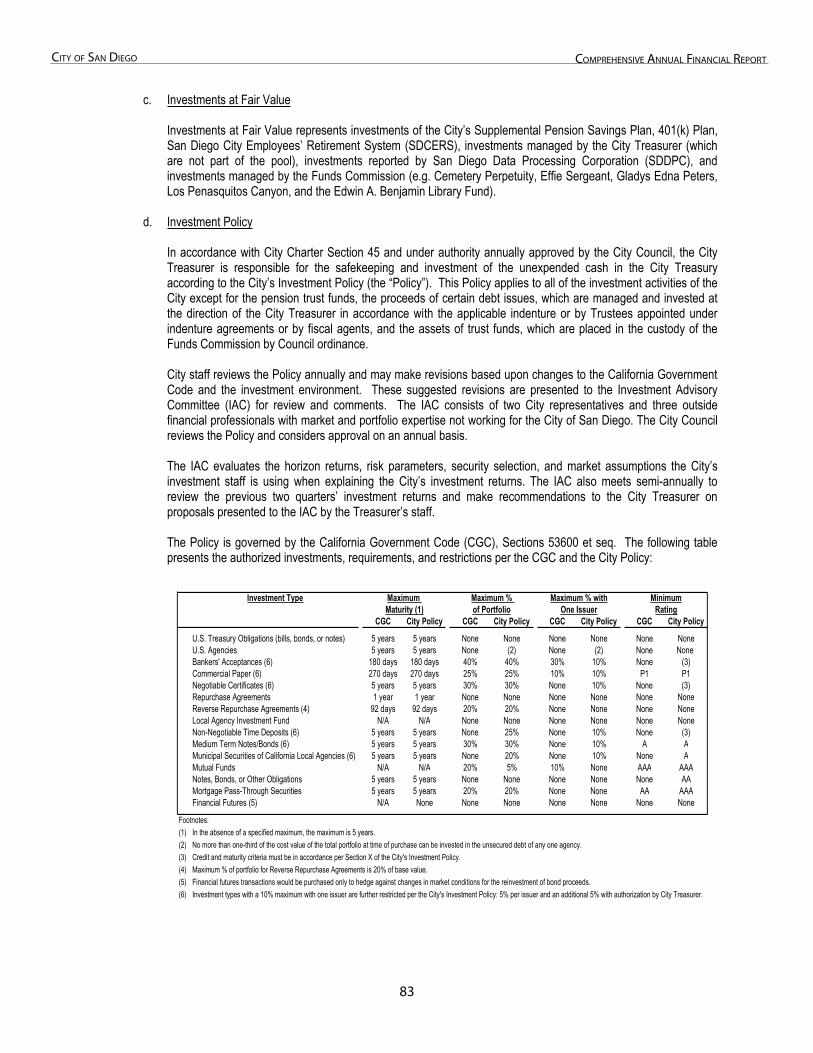
83
City of San Diego ComprehenSive annual finanCial report
c. Investments at Fair Value
Investments at Fair Value represents investments of the City’s Supplemental Pension Savings Plan, 401(k) Plan, San Diego City Employees’ Retirement System (SDCERS), investments managed by the City Treasurer (which are not part of the pool), investments reported by San Diego Data Processing Corporation (SDDPC), and investments managed by the Funds Commission (e.g. Cemetery Perpetuity, Effie Sergeant, Gladys Edna Peters, Los Penasquitos Canyon, and the Edwin A. Benjamin Library Fund).
d. Investment Policy
In accordance with City Charter Section 45 and under authority annually approved by the City Council, the City Treasurer is responsible for the safekeeping and investment of the unexpended cash in the City Treasury according to the City’s Investment Policy (the “Policy”). This Policy applies to all of the investment activities of the City except for the pension trust funds, the proceeds of certain debt issues, which are managed and invested at the direction of the City Treasurer in accordance with the applicable indenture or by Trustees appointed under indenture agreements or by fiscal agents, and the assets of trust funds, which are placed in the custody of the Funds Commission by Council ordinance.
City staff reviews the Policy annually and may make revisions based upon changes to the California Government Code and the investment environment. These suggested revisions are presented to the Investment Advisory Committee (IAC) for review and comments. The IAC consists of two City representatives and three outside financial professionals with market and portfolio expertise not working for the City of San Diego. The City Council reviews the Policy and considers approval on an annual basis.
The IAC evaluates the horizon returns, risk parameters, security selection, and market assumptions the City’s investment staff is using when explaining the City’s investment returns. The IAC also meets semi-annually to review the previous two quarters’ investment returns and make recommendations to the City Treasurer on proposals presented to the IAC by the Treasurer’s staff.
The Policy is governed by the California Government Code (CGC), Sections 53600 et seq. The following table presents the authorized investments, requirements, and restrictions per the CGC and the City Policy:
Investment Type
CGC City Policy CGC City Policy CGC City Policy CGC City Policy
U.S. Treasury Obligations (bills, bonds, or notes) 5 years 5 years None None None None None NoneU.S. Agencies 5 years 5 years None (2) None (2) None None Bankers' Acceptances (6) 180 days 180 days 40% 40% 30% 10% None (3)Commercial Paper (6) 270 days 270 days 25% 25% 10% 10% P1 P1Negotiable Certificates (6) 5 years 5 years 30% 30% None 10% None (3)Repurchase Agreements 1 year 1 year None None None None None NoneReverse Repurchase Agreements (4) 92 days 92 days 20% 20% None None None NoneLocal Agency Investment Fund N/A N/A None None None None None NoneNon-Negotiable Time Deposits (6) 5 years 5 years None 25% None 10% None (3)Medium Term Notes/Bonds (6) 5 years 5 years 30% 30% None 10% A AMunicipal Securities of California Local Agencies (6) 5 years 5 years None 20% None 10% None AMutual Funds N/A N/A 20% 5% 10% None AAA AAANotes, Bonds, or Other Obligations 5 years 5 years None None None None None AAMortgage Pass-Through Securities 5 years 5 years 20% 20% None None AA AAAFinancial Futures (5) N/A None None None None None None None
Footnotes:(1) In the absence of a specified maximum, the maximum is 5 years. (2) No more than one-third of the cost value of the total portfolio at time of purchase can be invested in the unsecured debt of any one agency.(3) Credit and maturity criteria must be in accordance per Section X of the City's Investment Policy.(4) Maximum % of portfolio for Reverse Repurchase Agreements is 20% of base value.(5) Financial futures transactions would be purchased only to hedge against changes in market conditions for the reinvestment of bond proceeds.(6) Investment types with a 10% maximum with one issuer are further restricted per the City's Investment Policy: 5% per issuer and an additional 5% with authorization by City Treasurer.
Minimumof Portfolio One Issuer Rating
Maximum Maximum % Maturity (1)
Maximum % with
8�
City of San Diego ComprehenSive annual finanCial report
According to the Policy, the City may enter into repurchase and reverse repurchase agreements only with primary dealers of the Federal Reserve Bank of New York with which the City has entered into a master repurchase agreement.
Additionally, the Policy authorizes investment in other specific types of securities. The City may invest in floating rate notes with coupon resets based upon a single fixed income index (which would be representative of an eligible investment), provided that security is not leveraged. Structured notes issued by U.S. government agencies that contain imbedded calls or options are authorized as long as those securities are not inverse floaters, range notes, or interest only strips derived from a pool of mortgages. A maximum of 8% of the “cost value” of the pooled portfolio may be invested in structured notes.
Ineligible investments prohibited from use in the portfolio include, but are not limited to, common stocks and long-term corporate notes/bonds. A copy of the investment Policy can be requested from the City Treasurer, 1200 3rd Avenue, Suite 1624, San Diego, CA 92101.
Other Investment Policies
The City currently has a Funds Commission whose role is to supervise and control all trust, perpetuity, and investment funds of the City and such pension funds as shall be placed in its custody. The statutory authority for the Funds Commission is created in the City Charter Article V, Section 41(a). While the duties described in the creation document form broad authority for the Funds Commission, in practice, the Funds Commission only oversees investments related to a small number of permanent endowments. The allowable investments for these funds are different than those as prescribed in the City Treasurer’s investment policy. Each permanent endowment fund has its own separate investment policy. Copies of the individual investment policies can be requested from the City Treasurer, 1200 3rd Avenue, Suite 1624, San Diego, CA 92101. Additionally, the City and its component units have funds invested in accordance with various bond indenture and trustee agreements.
City of San Diego – Disclosures for Specific Risks
e. Interest Rate Risk
Interest rate risk is the risk that changes in interest rates will adversely affect the fair value of an investment. Market or interest-rate risk for the City’s pooled investments is intended to be mitigated by establishing two portfolios, a liquidity portfolio and a core portfolio. Target durations are based upon the expected short and long-term cash needs of the City. The liquidity portfolio is structured with an adequate mix of highly liquid securities and maturities to meet major cash outflow requirements for at least six months (per CGC Section 53646). The liquidity portfolio uses the Merrill Lynch 3-6 month Treasury Index as a benchmark with a duration of plus or minus 20% of the duration of that benchmark.
The core portfolio uses the Merrill Lynch 1-3 year Treasury Index as a benchmark with a duration of plus or minus 20% of the duration of that benchmark. It consists of high quality liquid securities with a maximum maturity of 5 years and is structured to meet the longer-term cash needs of the City. Information about the sensitivity of the fair value of the City’s investments to market interest rate fluctuations is presented in the table on the next page.
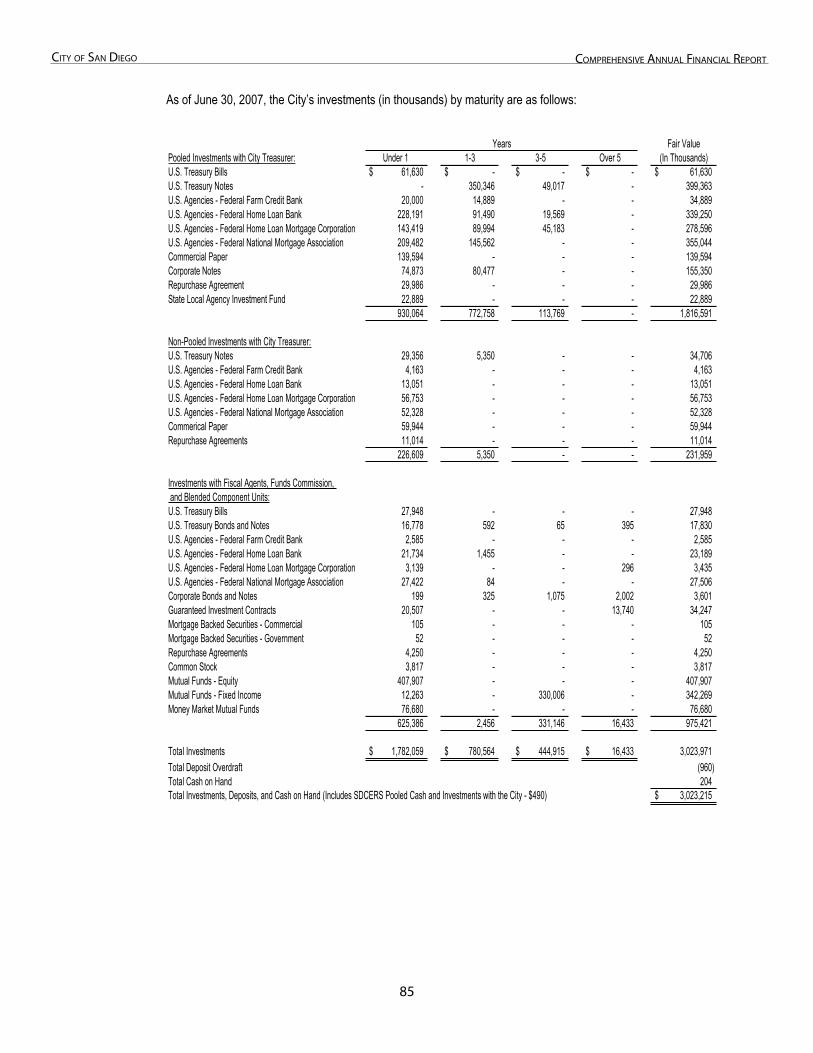
8�
City of San Diego ComprehenSive annual finanCial report
As of June 30, 2007, the City’s investments (in thousands) by maturity are as follows:
Fair ValuePooled Investments with City Treasurer: Under 1 1-3 3-5 Over 5 (In Thousands)U.S. Treasury Bills 61,630$ -$ -$ -$ 61,630$ U.S. Treasury Notes - 350,346 49,017 - 399,363 U.S. Agencies - Federal Farm Credit Bank 20,000 14,889 - - 34,889 U.S. Agencies - Federal Home Loan Bank 228,191 91,490 19,569 - 339,250 U.S. Agencies - Federal Home Loan Mortgage Corporation 143,419 89,994 45,183 - 278,596 U.S. Agencies - Federal National Mortgage Association 209,482 145,562 - - 355,044 Commercial Paper 139,594 - - - 139,594 Corporate Notes 74,873 80,477 - - 155,350 Repurchase Agreement 29,986 - - - 29,986 State Local Agency Investment Fund 22,889 - - - 22,889
930,064 772,758 113,769 - 1,816,591
Non-Pooled Investments with City Treasurer:U.S. Treasury Notes 29,356 5,350 - - 34,706 U.S. Agencies - Federal Farm Credit Bank 4,163 - - - 4,163 U.S. Agencies - Federal Home Loan Bank 13,051 - - - 13,051 U.S. Agencies - Federal Home Loan Mortgage Corporation 56,753 - - - 56,753 U.S. Agencies - Federal National Mortgage Association 52,328 - - - 52,328 Commerical Paper 59,944 - - - 59,944 Repurchase Agreements 11,014 - - - 11,014
226,609 5,350 - - 231,959
Investments with Fiscal Agents, Funds Commission, and Blended Component Units:U.S. Treasury Bills 27,948 - - - 27,948 U.S. Treasury Bonds and Notes 16,778 592 65 395 17,830 U.S. Agencies - Federal Farm Credit Bank 2,585 - - - 2,585 U.S. Agencies - Federal Home Loan Bank 21,734 1,455 - - 23,189 U.S. Agencies - Federal Home Loan Mortgage Corporation 3,139 - - 296 3,435 U.S. Agencies - Federal National Mortgage Association 27,422 84 - - 27,506 Corporate Bonds and Notes 199 325 1,075 2,002 3,601 Guaranteed Investment Contracts 20,507 - - 13,740 34,247 Mortgage Backed Securities - Commercial 105 - - - 105 Mortgage Backed Securities - Government 52 - - - 52 Repurchase Agreements 4,250 - - - 4,250 Common Stock 3,817 - - - 3,817 Mutual Funds - Equity 407,907 - - - 407,907 Mutual Funds - Fixed Income 12,263 - 330,006 - 342,269 Money Market Mutual Funds 76,680 - - - 76,680
625,386 2,456 331,146 16,433 975,421
Total Investments 1,782,059$ 780,564$ 444,915$ 16,433$ 3,023,971 Total Deposit Overdraft (960) Total Cash on Hand 204 Total Investments, Deposits, and Cash on Hand (Includes SDCERS Pooled Cash and Investments with the City - $490) 3,023,215$
Years
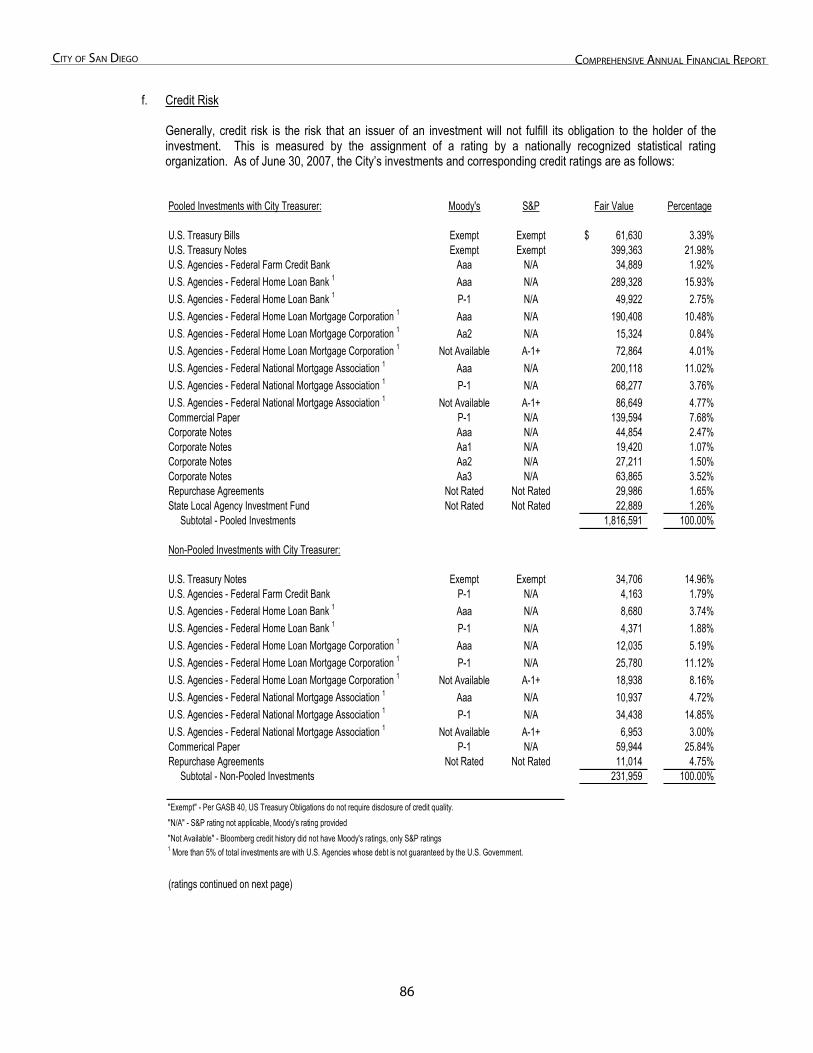
8�
City of San Diego ComprehenSive annual finanCial report
f. Credit Risk
Generally, credit risk is the risk that an issuer of an investment will not fulfill its obligation to the holder of the investment. This is measured by the assignment of a rating by a nationally recognized statistical rating organization. As of June 30, 2007, the City’s investments and corresponding credit ratings are as follows:
Pooled Investments with City Treasurer: Moody's S&P Fair Value Percentage
U.S. Treasury Bills Exempt Exempt 61,630$ 3.39%U.S. Treasury Notes Exempt Exempt 399,363 21.98%U.S. Agencies - Federal Farm Credit Bank Aaa N/A 34,889 1.92%U.S. Agencies - Federal Home Loan Bank 1 Aaa N/A 289,328 15.93%U.S. Agencies - Federal Home Loan Bank 1 P-1 N/A 49,922 2.75%U.S. Agencies - Federal Home Loan Mortgage Corporation 1 Aaa N/A 190,408 10.48%U.S. Agencies - Federal Home Loan Mortgage Corporation 1 Aa2 N/A 15,324 0.84%U.S. Agencies - Federal Home Loan Mortgage Corporation 1 Not Available A-1+ 72,864 4.01%U.S. Agencies - Federal National Mortgage Association 1 Aaa N/A 200,118 11.02%U.S. Agencies - Federal National Mortgage Association 1 P-1 N/A 68,277 3.76%U.S. Agencies - Federal National Mortgage Association 1 Not Available A-1+ 86,649 4.77%Commercial Paper P-1 N/A 139,594 7.68%Corporate Notes Aaa N/A 44,854 2.47%Corporate Notes Aa1 N/A 19,420 1.07%Corporate Notes Aa2 N/A 27,211 1.50%Corporate Notes Aa3 N/A 63,865 3.52%Repurchase Agreements Not Rated Not Rated 29,986 1.65%State Local Agency Investment Fund Not Rated Not Rated 22,889 1.26% Subtotal - Pooled Investments 1,816,591 100.00%
Non-Pooled Investments with City Treasurer:
U.S. Treasury Notes Exempt Exempt 34,706 14.96%U.S. Agencies - Federal Farm Credit Bank P-1 N/A 4,163 1.79%U.S. Agencies - Federal Home Loan Bank 1 Aaa N/A 8,680 3.74%U.S. Agencies - Federal Home Loan Bank 1 P-1 N/A 4,371 1.88%U.S. Agencies - Federal Home Loan Mortgage Corporation 1 Aaa N/A 12,035 5.19%U.S. Agencies - Federal Home Loan Mortgage Corporation 1 P-1 N/A 25,780 11.12%U.S. Agencies - Federal Home Loan Mortgage Corporation 1 Not Available A-1+ 18,938 8.16%U.S. Agencies - Federal National Mortgage Association 1 Aaa N/A 10,937 4.72%U.S. Agencies - Federal National Mortgage Association 1 P-1 N/A 34,438 14.85%U.S. Agencies - Federal National Mortgage Association 1 Not Available A-1+ 6,953 3.00%Commerical Paper P-1 N/A 59,944 25.84%Repurchase Agreements Not Rated Not Rated 11,014 4.75% Subtotal - Non-Pooled Investments 231,959 100.00%
"Exempt" - Per GASB 40, US Treasury Obligations do not require disclosure of credit quality."N/A" - S&P rating not applicable, Moody's rating provided"Not Available" - Bloomberg credit history did not have Moody's ratings, only S&P ratings1 More than 5% of total investments are with U.S. Agencies whose debt is not guaranteed by the U.S. Government.
(ratings continued on next page)
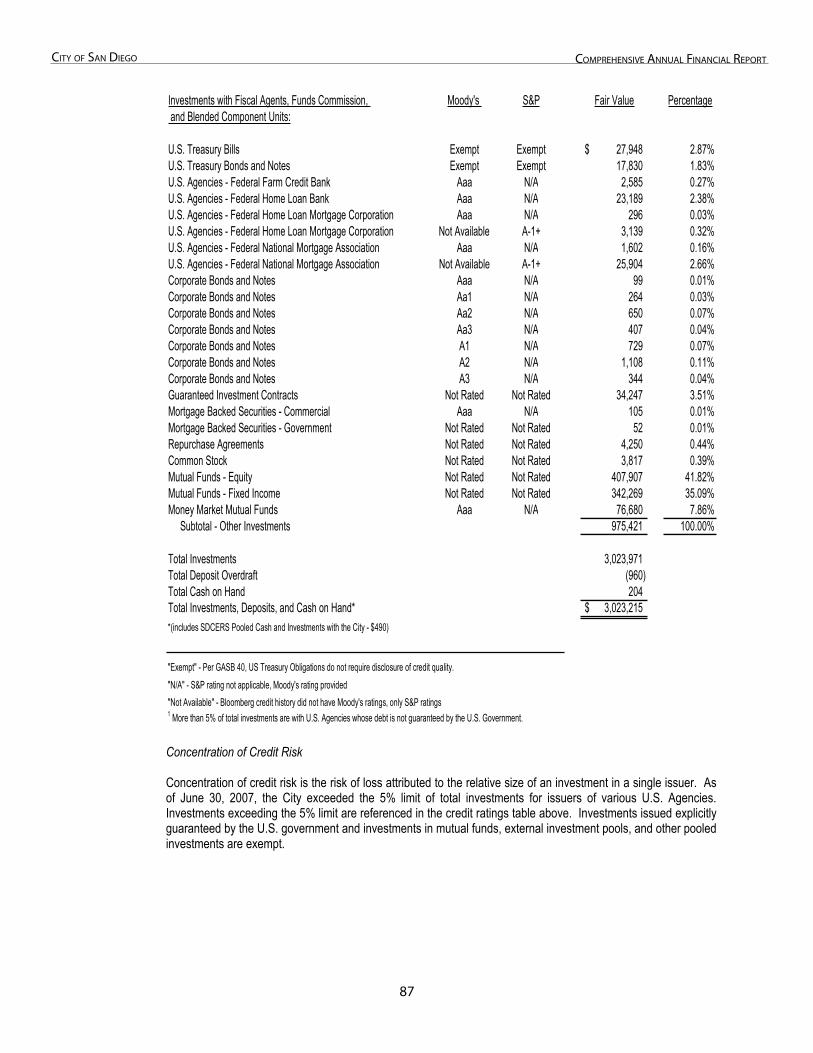
87
City of San Diego ComprehenSive annual finanCial report
Investments with Fiscal Agents, Funds Commission, Moody's S&P Fair Value Percentage and Blended Component Units:
U.S. Treasury Bills Exempt Exempt 27,948$ 2.87%U.S. Treasury Bonds and Notes Exempt Exempt 17,830 1.83%U.S. Agencies - Federal Farm Credit Bank Aaa N/A 2,585 0.27%U.S. Agencies - Federal Home Loan Bank Aaa N/A 23,189 2.38%U.S. Agencies - Federal Home Loan Mortgage Corporation Aaa N/A 296 0.03%U.S. Agencies - Federal Home Loan Mortgage Corporation Not Available A-1+ 3,139 0.32%U.S. Agencies - Federal National Mortgage Association Aaa N/A 1,602 0.16%U.S. Agencies - Federal National Mortgage Association Not Available A-1+ 25,904 2.66%Corporate Bonds and Notes Aaa N/A 99 0.01%Corporate Bonds and Notes Aa1 N/A 264 0.03%Corporate Bonds and Notes Aa2 N/A 650 0.07%Corporate Bonds and Notes Aa3 N/A 407 0.04%Corporate Bonds and Notes A1 N/A 729 0.07%Corporate Bonds and Notes A2 N/A 1,108 0.11%Corporate Bonds and Notes A3 N/A 344 0.04%Guaranteed Investment Contracts Not Rated Not Rated 34,247 3.51%Mortgage Backed Securities - Commercial Aaa N/A 105 0.01%Mortgage Backed Securities - Government Not Rated Not Rated 52 0.01%Repurchase Agreements Not Rated Not Rated 4,250 0.44%Common Stock Not Rated Not Rated 3,817 0.39%Mutual Funds - Equity Not Rated Not Rated 407,907 41.82%Mutual Funds - Fixed Income Not Rated Not Rated 342,269 35.09%Money Market Mutual Funds Aaa N/A 76,680 7.86% Subtotal - Other Investments 975,421 100.00%
Total Investments 3,023,971 Total Deposit Overdraft (960) Total Cash on Hand 204 Total Investments, Deposits, and Cash on Hand* 3,023,215$ *(includes SDCERS Pooled Cash and Investments with the City - $490)
"N/A" - S&P rating not applicable, Moody's rating provided"Not Available" - Bloomberg credit history did not have Moody's ratings, only S&P ratings1 More than 5% of total investments are with U.S. Agencies whose debt is not guaranteed by the U.S. Government.
"Exempt" - Per GASB 40, US Treasury Obligations do not require disclosure of credit quality.
Concentration of Credit Risk
Concentration of credit risk is the risk of loss attributed to the relative size of an investment in a single issuer. As of June 30, 2007, the City exceeded the 5% limit of total investments for issuers of various U.S. Agencies. Investments exceeding the 5% limit are referenced in the credit ratings table above. Investments issued explicitly guaranteed by the U.S. government and investments in mutual funds, external investment pools, and other pooled investments are exempt.
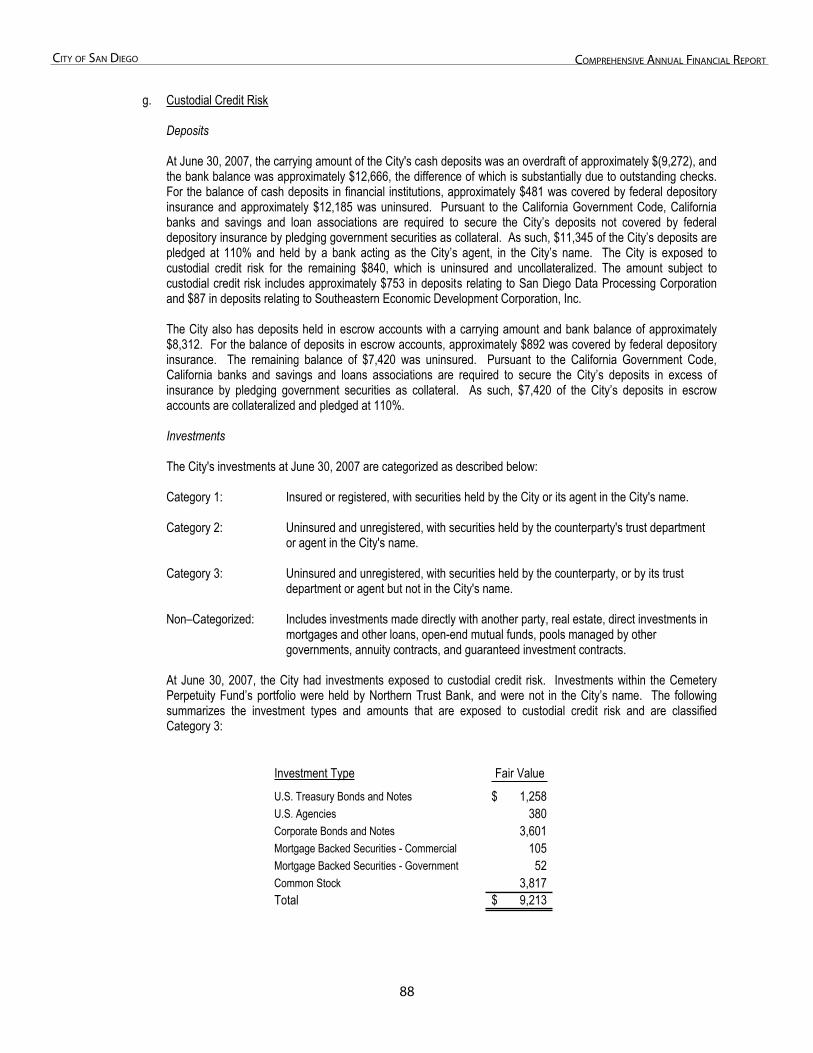
88
City of San Diego ComprehenSive annual finanCial report
g. Custodial Credit Risk
Deposits
At June 30, 2007, the carrying amount of the City's cash deposits was an overdraft of approximately $(9,272), and the bank balance was approximately $12,666, the difference of which is substantially due to outstanding checks. For the balance of cash deposits in financial institutions, approximately $481 was covered by federal depository insurance and approximately $12,185 was uninsured. Pursuant to the California Government Code, California banks and savings and loan associations are required to secure the City’s deposits not covered by federal depository insurance by pledging government securities as collateral. As such, $11,345 of the City’s deposits are pledged at 110% and held by a bank acting as the City’s agent, in the City’s name. The City is exposed to custodial credit risk for the remaining $840, which is uninsured and uncollateralized. The amount subject to custodial credit risk includes approximately $753 in deposits relating to San Diego Data Processing Corporation and $87 in deposits relating to Southeastern Economic Development Corporation, Inc.
The City also has deposits held in escrow accounts with a carrying amount and bank balance of approximately $8,312. For the balance of deposits in escrow accounts, approximately $892 was covered by federal depository insurance. The remaining balance of $7,420 was uninsured. Pursuant to the California Government Code, California banks and savings and loans associations are required to secure the City’s deposits in excess of insurance by pledging government securities as collateral. As such, $7,420 of the City’s deposits in escrow accounts are collateralized and pledged at 110%.
Investments
The City's investments at June 30, 2007 are categorized as described below:
Category 1: Insured or registered, with securities held by the City or its agent in the City's name.
Category 2: Uninsured and unregistered, with securities held by the counterparty's trust department or agent in the City's name.
Category 3: Uninsured and unregistered, with securities held by the counterparty, or by its trust department or agent but not in the City's name.
Non–Categorized: Includes investments made directly with another party, real estate, direct investments in mortgages and other loans, open-end mutual funds, pools managed by other governments, annuity contracts, and guaranteed investment contracts.
At June 30, 2007, the City had investments exposed to custodial credit risk. Investments within the Cemetery Perpetuity Fund’s portfolio were held by Northern Trust Bank, and were not in the City’s name. The following summarizes the investment types and amounts that are exposed to custodial credit risk and are classified Category 3:
Investment Type Fair ValueU.S. Treasury Bonds and Notes 1,258$U.S. Agencies 380Corporate Bonds and Notes 3,601Mortgage Backed Securities - Commercial 105Mortgage Backed Securities - Government 52 Common Stock 3,817Total 9,213$
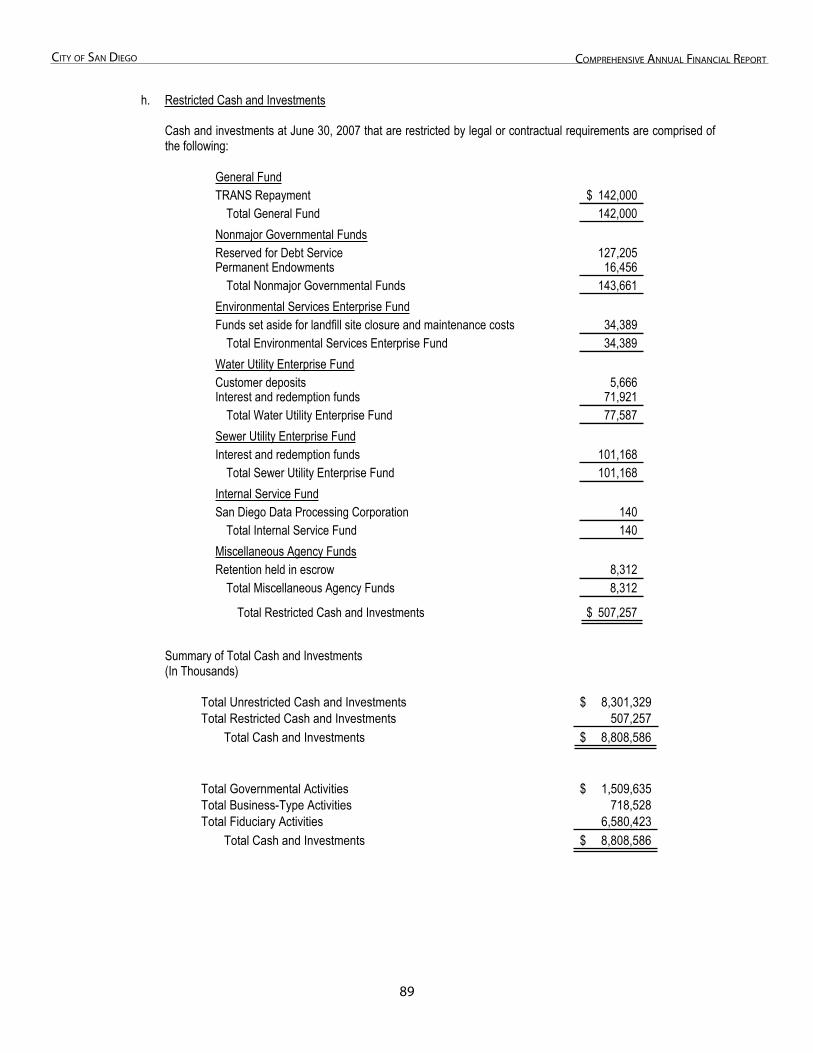
8�
City of San Diego ComprehenSive annual finanCial report
h. Restricted Cash and Investments
Cash and investments at June 30, 2007 that are restricted by legal or contractual requirements are comprised of the following:
General FundTRANS Repayment 142,000$
Total General Fund 142,000 Nonmajor Governmental FundsReserved for Debt Service 127,205 Permanent Endowments 16,456
Total Nonmajor Governmental Funds 143,661 Environmental Services Enterprise FundFunds set aside for landfill site closure and maintenance costs 34,389
Total Environmental Services Enterprise Fund 34,389 Water Utility Enterprise FundCustomer deposits 5,666 Interest and redemption funds 71,921
Total Water Utility Enterprise Fund 77,587 Sewer Utility Enterprise FundInterest and redemption funds 101,168
Total Sewer Utility Enterprise Fund 101,168 Internal Service FundSan Diego Data Processing Corporation 140
Total Internal Service Fund 140 Miscellaneous Agency FundsRetention held in escrow 8,312
Total Miscellaneous Agency Funds 8,312
Total Restricted Cash and Investments 507,257$
Summary of Total Cash and Investments (In Thousands)
Total Unrestricted Cash and Investments 8,301,329$ Total Restricted Cash and Investments 507,257
Total Cash and Investments 8,808,586$
Total Governmental Activities 1,509,635$ Total Business-Type Activities 718,528 Total Fiduciary Activities 6,580,423
Total Cash and Investments 8,808,586$
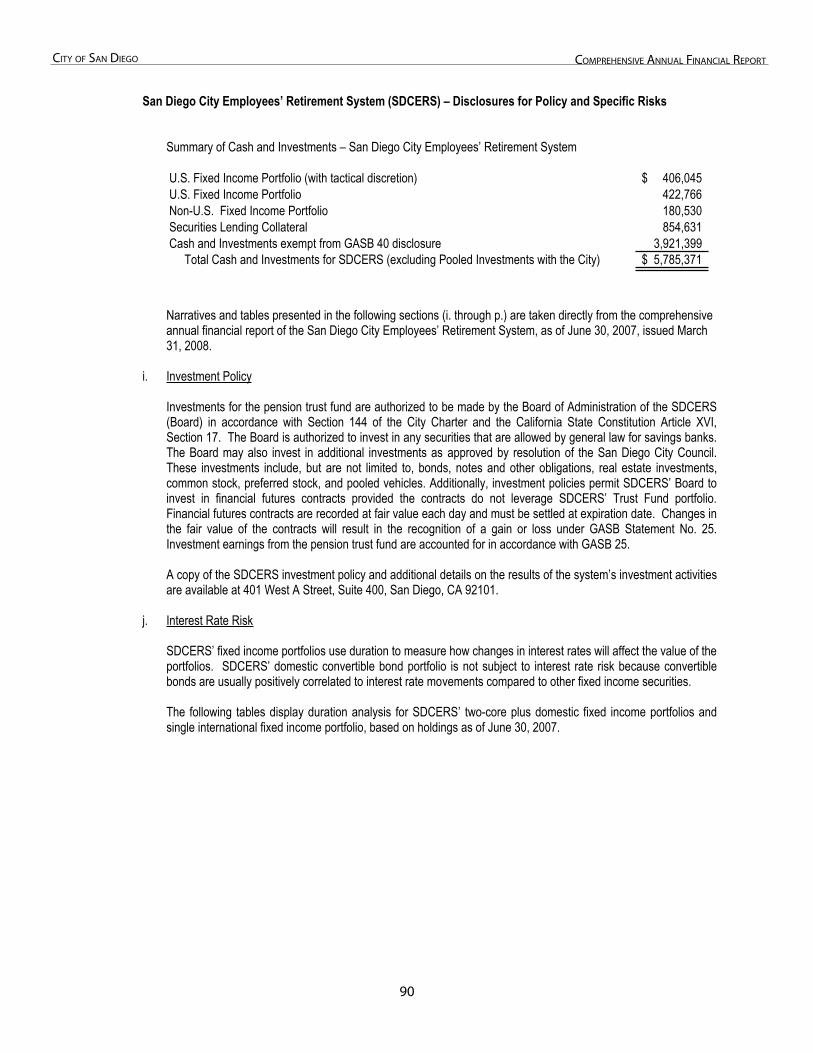
�0
City of San Diego ComprehenSive annual finanCial report
San Diego City Employees’ Retirement System (SDCERS) – Disclosures for Policy and Specific Risks
Summary of Cash and Investments – San Diego City Employees’ Retirement System
U.S. Fixed Income Portfolio (with tactical discretion) 406,045$U.S. Fixed Income Portfolio 422,766Non-U.S. Fixed Income Portfolio 180,530Securities Lending Collateral 854,631Cash and Investments exempt from GASB 40 disclosure 3,921,399 Total Cash and Investments for SDCERS (excluding Pooled Investments with the City) 5,785,371$
Narratives and tables presented in the following sections (i. through p.) are taken directly from the comprehensive annual financial report of the San Diego City Employees’ Retirement System, as of June 30, 2007, issued March 31, 2008.
i. Investment Policy
Investments for the pension trust fund are authorized to be made by the Board of Administration of the SDCERS (Board) in accordance with Section 144 of the City Charter and the California State Constitution Article XVI, Section 17. The Board is authorized to invest in any securities that are allowed by general law for savings banks. The Board may also invest in additional investments as approved by resolution of the San Diego City Council. These investments include, but are not limited to, bonds, notes and other obligations, real estate investments, common stock, preferred stock, and pooled vehicles. Additionally, investment policies permit SDCERS’ Board to invest in financial futures contracts provided the contracts do not leverage SDCERS’ Trust Fund portfolio. Financial futures contracts are recorded at fair value each day and must be settled at expiration date. Changes in the fair value of the contracts will result in the recognition of a gain or loss under GASB Statement No. 25. Investment earnings from the pension trust fund are accounted for in accordance with GASB 25.
A copy of the SDCERS investment policy and additional details on the results of the system’s investment activities are available at 401 West A Street, Suite 400, San Diego, CA 92101.
j. Interest Rate Risk
SDCERS’ fixed income portfolios use duration to measure how changes in interest rates will affect the value of the portfolios. SDCERS’ domestic convertible bond portfolio is not subject to interest rate risk because convertible bonds are usually positively correlated to interest rate movements compared to other fixed income securities.
The following tables display duration analysis for SDCERS’ two-core plus domestic fixed income portfolios and single international fixed income portfolio, based on holdings as of June 30, 2007.
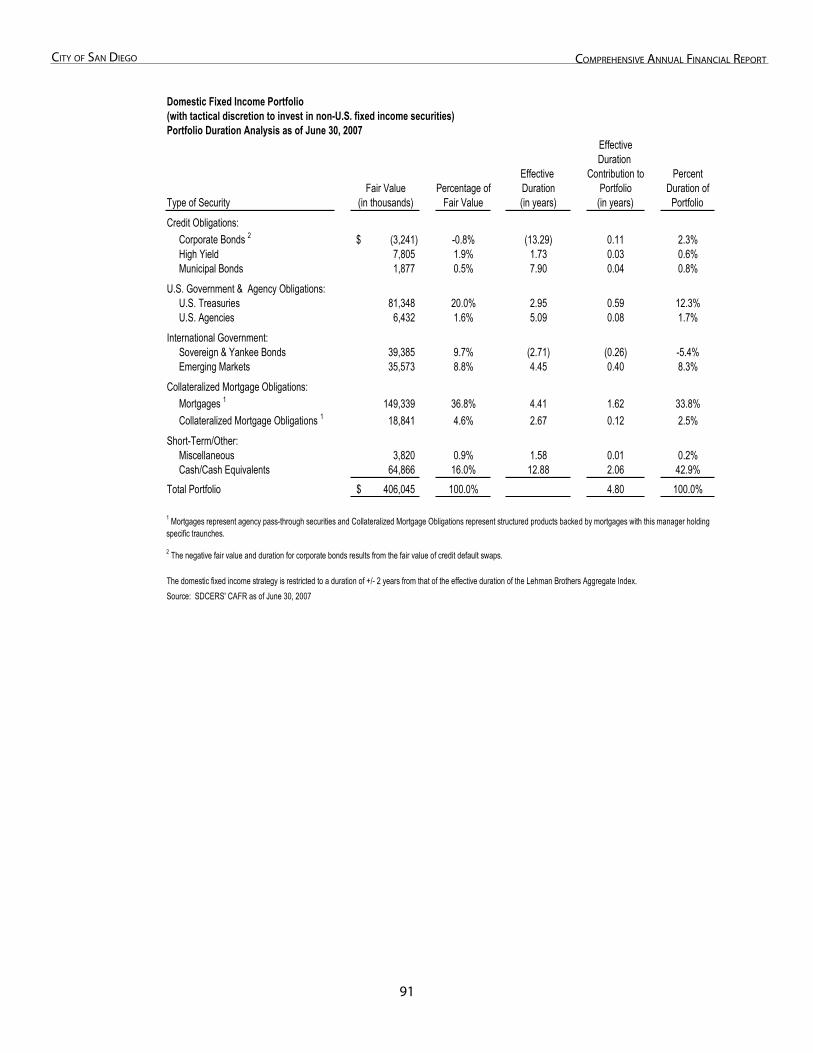
�1
City of San Diego ComprehenSive annual finanCial report
Domestic Fixed Income Portfolio(with tactical discretion to invest in non-U.S. fixed income securities)Portfolio Duration Analysis as of June 30, 2007
EffectiveDuration
Effective Contribution to PercentFair Value Percentage of Duration Portfolio Duration of
Type of Security (in thousands) Fair Value (in years) (in years) PortfolioCredit Obligations: Corporate Bonds 2 (3,241)$ -0.8% (13.29) 0.11 2.3% High Yield 7,805 1.9% 1.73 0.03 0.6% Municipal Bonds 1,877 0.5% 7.90 0.04 0.8%U.S. Government & Agency Obligations: U.S. Treasuries 81,348 20.0% 2.95 0.59 12.3% U.S. Agencies 6,432 1.6% 5.09 0.08 1.7%International Government: Sovereign & Yankee Bonds 39,385 9.7% (2.71) (0.26) -5.4% Emerging Markets 35,573 8.8% 4.45 0.40 8.3%Collateralized Mortgage Obligations: Mortgages 1 149,339 36.8% 4.41 1.62 33.8% Collateralized Mortgage Obligations 1 18,841 4.6% 2.67 0.12 2.5%Short-Term/Other: Miscellaneous 3,820 0.9% 1.58 0.01 0.2% Cash/Cash Equivalents 64,866 16.0% 12.88 2.06 42.9%Total Portfolio 406,045$ 100.0% 4.80 100.0%
2 The negative fair value and duration for corporate bonds results from the fair value of credit default swaps.
Source: SDCERS' CAFR as of June 30, 2007The domestic fixed income strategy is restricted to a duration of +/- 2 years from that of the effective duration of the Lehman Brothers Aggregate Index.
1 Mortgages represent agency pass-through securities and Collateralized Mortgage Obligations represent structured products backed by mortgages with this manager holding specific traunches.
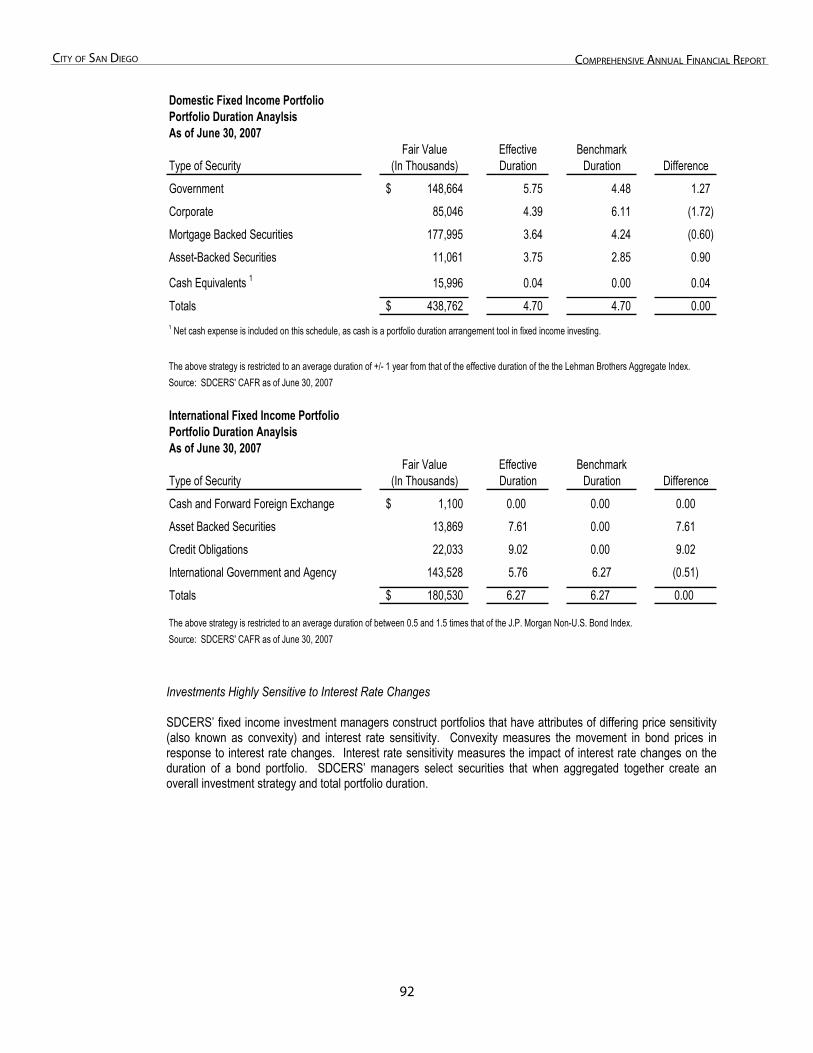
�2
City of San Diego ComprehenSive annual finanCial report
Domestic Fixed Income PortfolioPortfolio Duration AnaylsisAs of June 30, 2007
Fair Value Effective BenchmarkType of Security (In Thousands) Duration Duration DifferenceGovernment 148,664$ 5.75 4.48 1.27 Corporate 85,046 4.39 6.11 (1.72) Mortgage Backed Securities 177,995 3.64 4.24 (0.60) Asset-Backed Securities 11,061 3.75 2.85 0.90
Cash Equivalents 1 15,996 0.04 0.00 0.04 Totals 438,762$ 4.70 4.70 0.001 Net cash expense is included on this schedule, as cash is a portfolio duration arrangement tool in fixed income investing.
Source: SDCERS' CAFR as of June 30, 2007
International Fixed Income PortfolioPortfolio Duration AnaylsisAs of June 30, 2007
Fair Value Effective BenchmarkType of Security (In Thousands) Duration Duration DifferenceCash and Forward Foreign Exchange 1,100$ 0.00 0.00 0.00Asset Backed Securities 13,869 7.61 0.00 7.61Credit Obligations 22,033 9.02 0.00 9.02International Government and Agency 143,528 5.76 6.27 (0.51)Totals 180,530$ 6.27 6.27 0.00
Source: SDCERS' CAFR as of June 30, 2007The above strategy is restricted to an average duration of between 0.5 and 1.5 times that of the J.P. Morgan Non-U.S. Bond Index.
The above strategy is restricted to an average duration of +/- 1 year from that of the effective duration of the the Lehman Brothers Aggregate Index.
Investments Highly Sensitive to Interest Rate Changes
SDCERS’ fixed income investment managers construct portfolios that have attributes of differing price sensitivity (also known as convexity) and interest rate sensitivity. Convexity measures the movement in bond prices in response to interest rate changes. Interest rate sensitivity measures the impact of interest rate changes on the duration of a bond portfolio. SDCERS’ managers select securities that when aggregated together create an overall investment strategy and total portfolio duration.
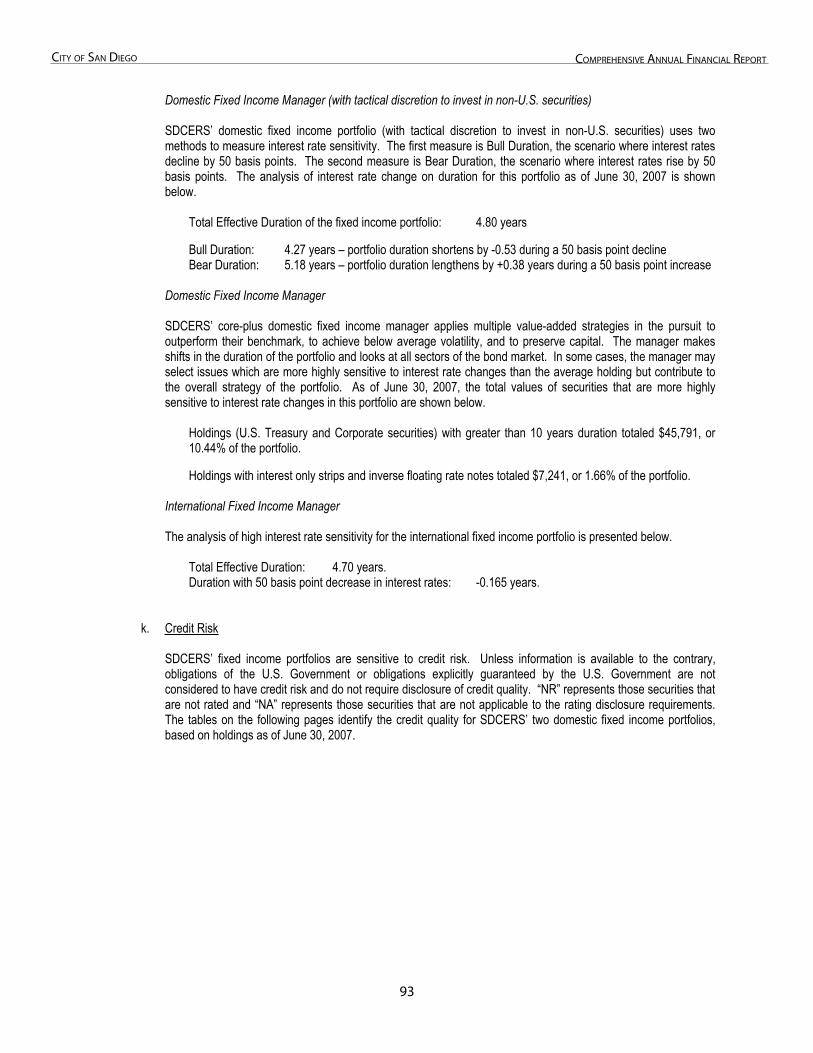
�3
City of San Diego ComprehenSive annual finanCial report
Domestic Fixed Income Manager (with tactical discretion to invest in non-U.S. securities)
SDCERS’ domestic fixed income portfolio (with tactical discretion to invest in non-U.S. securities) uses two methods to measure interest rate sensitivity. The first measure is Bull Duration, the scenario where interest rates decline by 50 basis points. The second measure is Bear Duration, the scenario where interest rates rise by 50 basis points. The analysis of interest rate change on duration for this portfolio as of June 30, 2007 is shown below.
Total Effective Duration of the fixed income portfolio: 4.80 years
Bull Duration: 4.27 years – portfolio duration shortens by -0.53 during a 50 basis point decline Bear Duration: 5.18 years – portfolio duration lengthens by +0.38 years during a 50 basis point increase
Domestic Fixed Income Manager
SDCERS’ core-plus domestic fixed income manager applies multiple value-added strategies in the pursuit to outperform their benchmark, to achieve below average volatility, and to preserve capital. The manager makes shifts in the duration of the portfolio and looks at all sectors of the bond market. In some cases, the manager may select issues which are more highly sensitive to interest rate changes than the average holding but contribute to the overall strategy of the portfolio. As of June 30, 2007, the total values of securities that are more highly sensitive to interest rate changes in this portfolio are shown below.
Holdings (U.S. Treasury and Corporate securities) with greater than 10 years duration totaled $45,791, or 10.44% of the portfolio.
Holdings with interest only strips and inverse floating rate notes totaled $7,241, or 1.66% of the portfolio.
International Fixed Income Manager
The analysis of high interest rate sensitivity for the international fixed income portfolio is presented below.
Total Effective Duration: 4.70 years. Duration with 50 basis point decrease in interest rates: -0.165 years.
k. Credit Risk
SDCERS’ fixed income portfolios are sensitive to credit risk. Unless information is available to the contrary, obligations of the U.S. Government or obligations explicitly guaranteed by the U.S. Government are not considered to have credit risk and do not require disclosure of credit quality. “NR” represents those securities that are not rated and “NA” represents those securities that are not applicable to the rating disclosure requirements. The tables on the following pages identify the credit quality for SDCERS’ two domestic fixed income portfolios, based on holdings as of June 30, 2007.
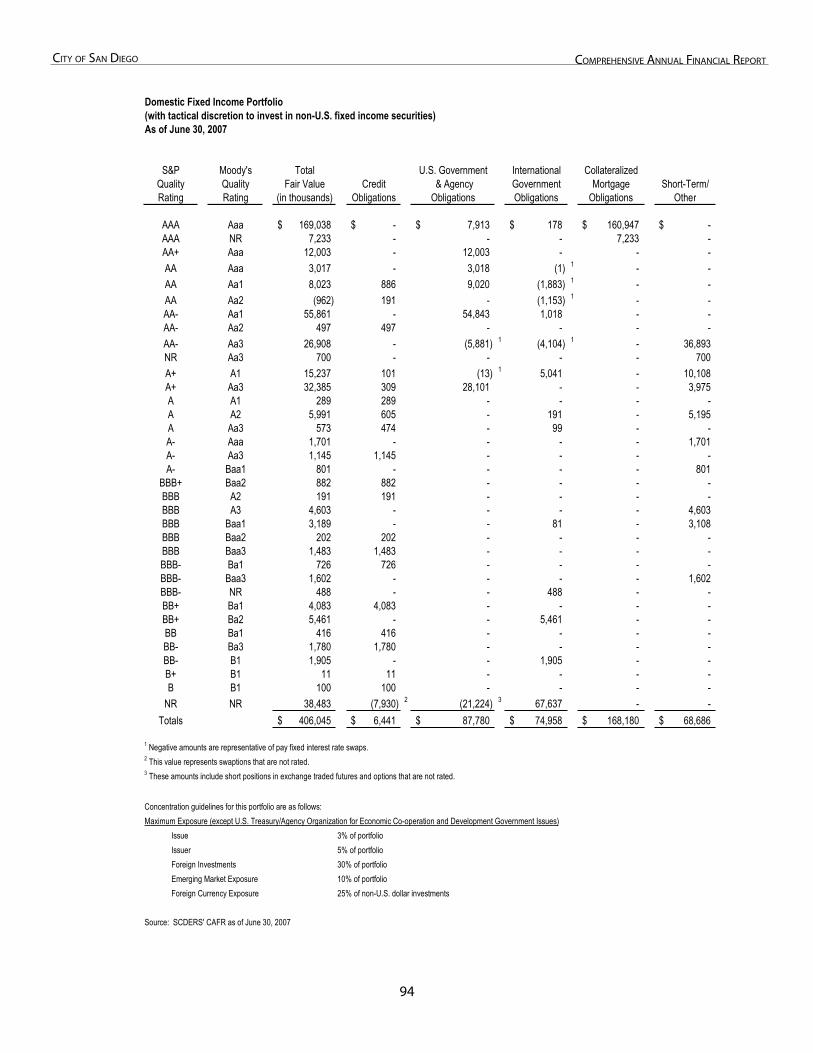
��
City of San Diego ComprehenSive annual finanCial report
Domestic Fixed Income Portfolio(with tactical discretion to invest in non-U.S. fixed income securities)As of June 30, 2007
S&P Moody's Total U.S. Government International CollateralizedQuality Quality Fair Value Credit & Agency Government Mortgage Short-Term/Rating Rating (in thousands) Obligations Obligations Obligations Obligations Other
AAA Aaa 169,038$ -$ 7,913$ 178$ 160,947$ -$ AAA NR 7,233 - - - 7,233 - AA+ Aaa 12,003 - 12,003 - - - AA Aaa 3,017 - 3,018 (1) 1 - - AA Aa1 8,023 886 9,020 (1,883) 1 - - AA Aa2 (962) 191 - (1,153) 1 - - AA- Aa1 55,861 - 54,843 1,018 - - AA- Aa2 497 497 - - - - AA- Aa3 26,908 - (5,881) 1 (4,104) 1 - 36,893NR Aa3 700 - - - - 700 A+ A1 15,237 101 (13) 1 5,041 - 10,108A+ Aa3 32,385 309 28,101 - - 3,975 A A1 289 289 - - - - A A2 5,991 605 - 191 - 5,195 A Aa3 573 474 - 99 - - A- Aaa 1,701 - - - - 1,701 A- Aa3 1,145 1,145 - - - - A- Baa1 801 - - - - 801
BBB+ Baa2 882 882 - - - - BBB A2 191 191 - - - - BBB A3 4,603 - - - - 4,603 BBB Baa1 3,189 - - 81 - 3,108 BBB Baa2 202 202 - - - - BBB Baa3 1,483 1,483 - - - - BBB- Ba1 726 726 - - - - BBB- Baa3 1,602 - - - - 1,602 BBB- NR 488 - - 488 - - BB+ Ba1 4,083 4,083 - - - - BB+ Ba2 5,461 - - 5,461 - - BB Ba1 416 416 - - - - BB- Ba3 1,780 1,780 - - - - BB- B1 1,905 - - 1,905 - - B+ B1 11 11 - - - - B B1 100 100 - - - -
NR NR 38,483 (7,930) 2 (21,224) 3 67,637 - - Totals 406,045$ 6,441$ 87,780$ 74,958$ 168,180$ 68,686$
1 Negative amounts are representative of pay fixed interest rate swaps.2 This value represents swaptions that are not rated.3 These amounts include short positions in exchange traded futures and options that are not rated.
Concentration guidelines for this portfolio are as follows:Maximum Exposure (except U.S. Treasury/Agency Organization for Economic Co-operation and Development Government Issues)
Issue 3% of portfolioIssuer 5% of portfolioForeign Investments 30% of portfolioEmerging Market Exposure 10% of portfolioForeign Currency Exposure 25% of non-U.S. dollar investments
Source: SCDERS' CAFR as of June 30, 2007
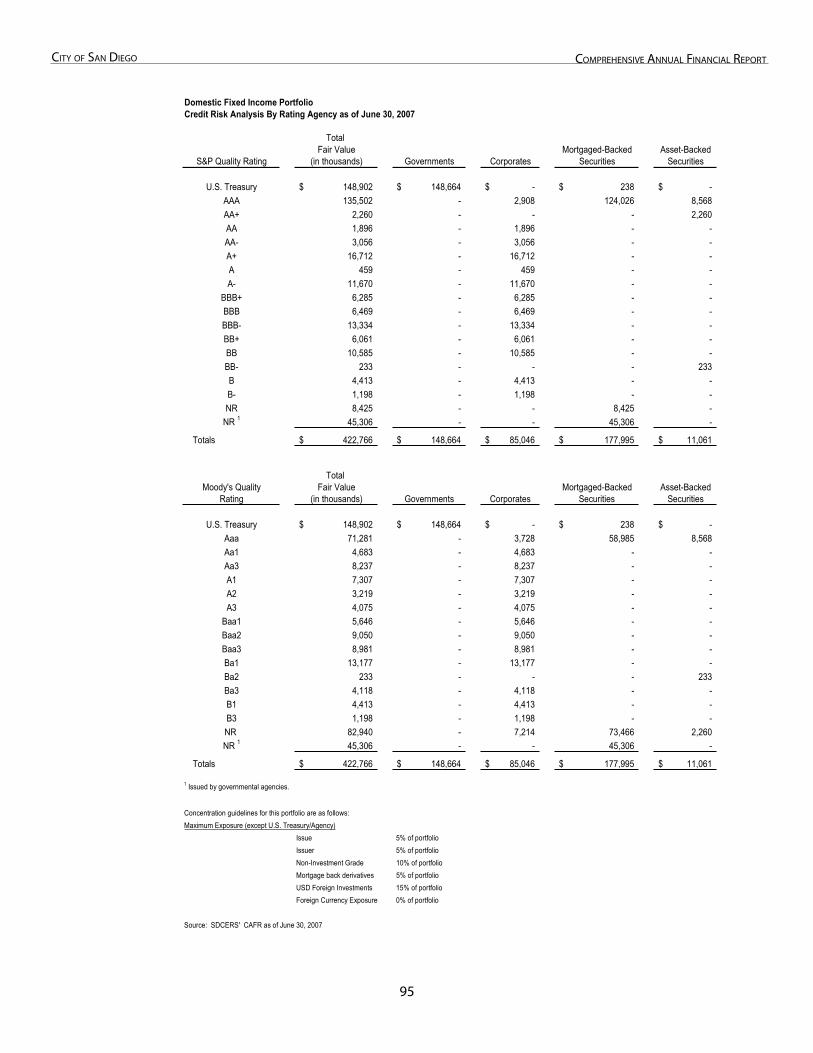
��
City of San Diego ComprehenSive annual finanCial report
Domestic Fixed Income PortfolioCredit Risk Analysis By Rating Agency as of June 30, 2007
Total Fair Value Mortgaged-Backed Asset-Backed
S&P Quality Rating (in thousands) Governments Corporates Securities Securities
U.S. Treasury 148,902$ 148,664$ -$ 238$ -$ AAA 135,502 - 2,908 124,026 8,568 AA+ 2,260 - - - 2,260 AA 1,896 - 1,896 - - AA- 3,056 - 3,056 - - A+ 16,712 - 16,712 - - A 459 - 459 - - A- 11,670 - 11,670 - -
BBB+ 6,285 - 6,285 - - BBB 6,469 - 6,469 - - BBB- 13,334 - 13,334 - - BB+ 6,061 - 6,061 - - BB 10,585 - 10,585 - - BB- 233 - - - 233 B 4,413 - 4,413 - - B- 1,198 - 1,198 - - NR 8,425 - - 8,425 -
NR 1 45,306 - - 45,306 -
Totals 422,766$ 148,664$ 85,046$ 177,995$ 11,061$
Total Moody's Quality Fair Value Mortgaged-Backed Asset-Backed
Rating (in thousands) Governments Corporates Securities Securities
U.S. Treasury 148,902$ 148,664$ -$ 238$ -$ Aaa 71,281 - 3,728 58,985 8,568 Aa1 4,683 - 4,683 - - Aa3 8,237 - 8,237 - - A1 7,307 - 7,307 - - A2 3,219 - 3,219 - - A3 4,075 - 4,075 - -
Baa1 5,646 - 5,646 - - Baa2 9,050 - 9,050 - - Baa3 8,981 - 8,981 - - Ba1 13,177 - 13,177 - - Ba2 233 - - - 233 Ba3 4,118 - 4,118 - - B1 4,413 - 4,413 - - B3 1,198 - 1,198 - - NR 82,940 - 7,214 73,466 2,260 NR 1 45,306 - - 45,306 -
Totals 422,766$ 148,664$ 85,046$ 177,995$ 11,061$
1 Issued by governmental agencies.
Concentration guidelines for this portfolio are as follows:Maximum Exposure (except U.S. Treasury/Agency)
Issue 5% of portfolioIssuer 5% of portfolioNon-Investment Grade 10% of portfolioMortgage back derivatives 5% of portfolioUSD Foreign Investments 15% of portfolioForeign Currency Exposure 0% of portfolio
Source: SDCERS' CAFR as of June 30, 2007
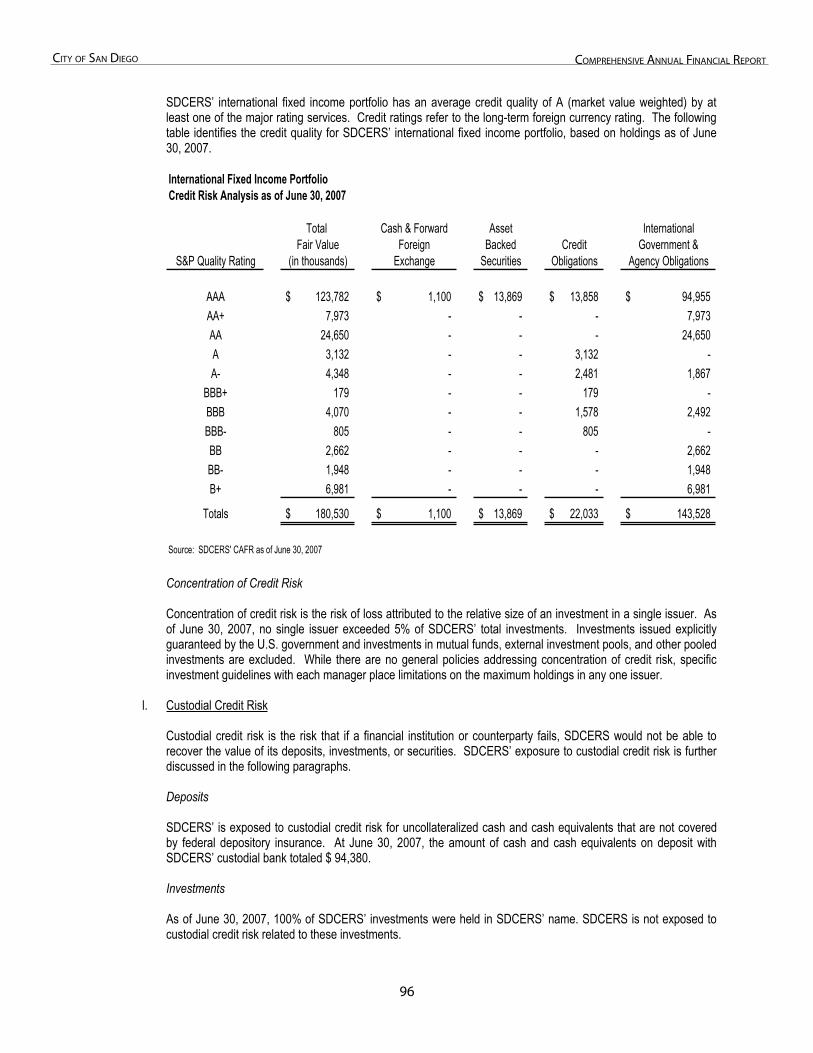
��
City of San Diego ComprehenSive annual finanCial report
SDCERS’ international fixed income portfolio has an average credit quality of A (market value weighted) by at least one of the major rating services. Credit ratings refer to the long-term foreign currency rating. The following table identifies the credit quality for SDCERS’ international fixed income portfolio, based on holdings as of June 30, 2007.
International Fixed Income PortfolioCredit Risk Analysis as of June 30, 2007
Total Cash & Forward Asset InternationalFair Value Foreign Backed Credit Government &
S&P Quality Rating (in thousands) Exchange Securities Obligations Agency Obligations
AAA 123,782$ 1,100$ 13,869$ 13,858$ 94,955$ AA+ 7,973 - - - 7,973 AA 24,650 - - - 24,650 A 3,132 - - 3,132 - A- 4,348 - - 2,481 1,867
BBB+ 179 - - 179 - BBB 4,070 - - 1,578 2,492 BBB- 805 - - 805 - BB 2,662 - - - 2,662 BB- 1,948 - - - 1,948 B+ 6,981 - - - 6,981
Totals 180,530$ 1,100$ 13,869$ 22,033$ 143,528$
Source: SDCERS' CAFR as of June 30, 2007
Concentration of Credit Risk
Concentration of credit risk is the risk of loss attributed to the relative size of an investment in a single issuer. As of June 30, 2007, no single issuer exceeded 5% of SDCERS’ total investments. Investments issued explicitly guaranteed by the U.S. government and investments in mutual funds, external investment pools, and other pooled investments are excluded. While there are no general policies addressing concentration of credit risk, specific investment guidelines with each manager place limitations on the maximum holdings in any one issuer.
l. Custodial Credit Risk
Custodial credit risk is the risk that if a financial institution or counterparty fails, SDCERS would not be able to recover the value of its deposits, investments, or securities. SDCERS’ exposure to custodial credit risk is further discussed in the following paragraphs.
Deposits
SDCERS’ is exposed to custodial credit risk for uncollateralized cash and cash equivalents that are not covered by federal depository insurance. At June 30, 2007, the amount of cash and cash equivalents on deposit with SDCERS’ custodial bank totaled $ 94,380.
Investments
As of June 30, 2007, 100% of SDCERS’ investments were held in SDCERS’ name. SDCERS is not exposed to custodial credit risk related to these investments.
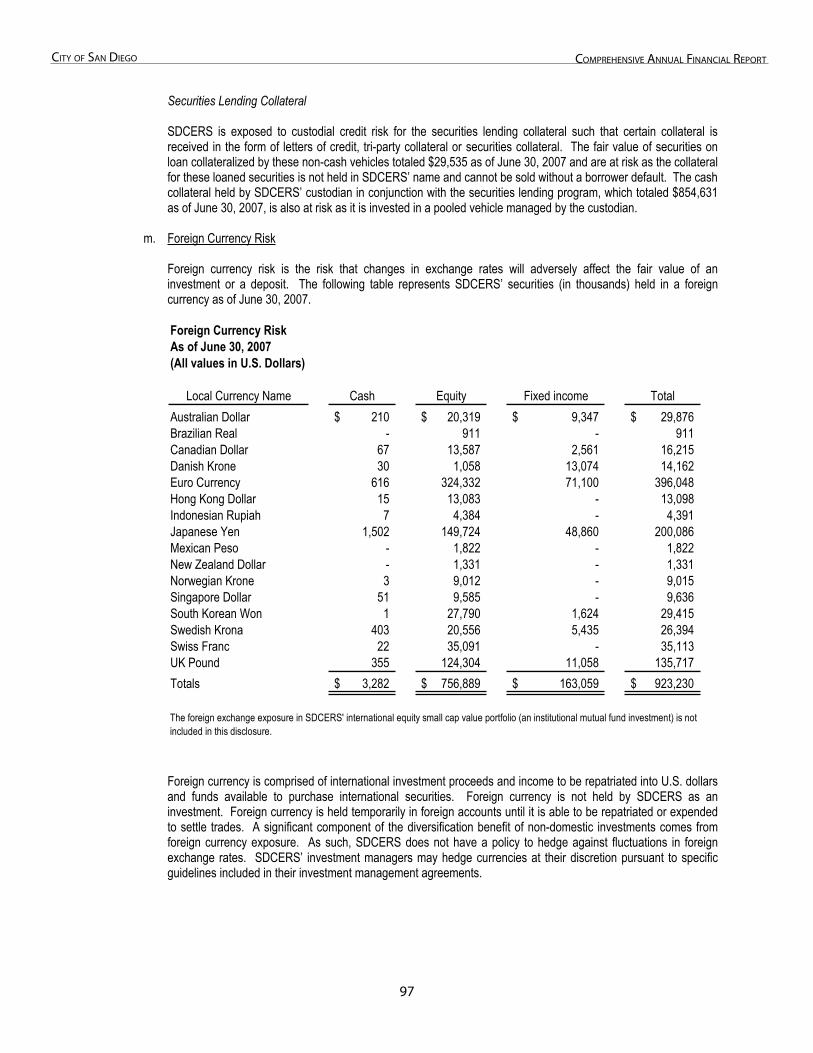
�7
City of San Diego ComprehenSive annual finanCial report
Securities Lending Collateral
SDCERS is exposed to custodial credit risk for the securities lending collateral such that certain collateral is received in the form of letters of credit, tri-party collateral or securities collateral. The fair value of securities on loan collateralized by these non-cash vehicles totaled $29,535 as of June 30, 2007 and are at risk as the collateral for these loaned securities is not held in SDCERS’ name and cannot be sold without a borrower default. The cash collateral held by SDCERS’ custodian in conjunction with the securities lending program, which totaled $854,631 as of June 30, 2007, is also at risk as it is invested in a pooled vehicle managed by the custodian.
m. Foreign Currency Risk
Foreign currency risk is the risk that changes in exchange rates will adversely affect the fair value of an investment or a deposit. The following table represents SDCERS’ securities (in thousands) held in a foreign currency as of June 30, 2007.
Foreign Currency RiskAs of June 30, 2007(All values in U.S. Dollars)
Local Currency Name Cash Equity Fixed income TotalAustralian Dollar 210$ 20,319$ 9,347$ 29,876$ Brazilian Real - 911 - 911 Canadian Dollar 67 13,587 2,561 16,215 Danish Krone 30 1,058 13,074 14,162 Euro Currency 616 324,332 71,100 396,048 Hong Kong Dollar 15 13,083 - 13,098 Indonesian Rupiah 7 4,384 - 4,391 Japanese Yen 1,502 149,724 48,860 200,086 Mexican Peso - 1,822 - 1,822 New Zealand Dollar - 1,331 - 1,331 Norwegian Krone 3 9,012 - 9,015 Singapore Dollar 51 9,585 - 9,636 South Korean Won 1 27,790 1,624 29,415 Swedish Krona 403 20,556 5,435 26,394 Swiss Franc 22 35,091 - 35,113 UK Pound 355 124,304 11,058 135,717 Totals 3,282$ 756,889$ 163,059$ 923,230$
The foreign exchange exposure in SDCERS' international equity small cap value portfolio (an institutional mutual fund investment) is not included in this disclosure.
Foreign currency is comprised of international investment proceeds and income to be repatriated into U.S. dollars and funds available to purchase international securities. Foreign currency is not held by SDCERS as an investment. Foreign currency is held temporarily in foreign accounts until it is able to be repatriated or expended to settle trades. A significant component of the diversification benefit of non-domestic investments comes from foreign currency exposure. As such, SDCERS does not have a policy to hedge against fluctuations in foreign exchange rates. SDCERS’ investment managers may hedge currencies at their discretion pursuant to specific guidelines included in their investment management agreements.
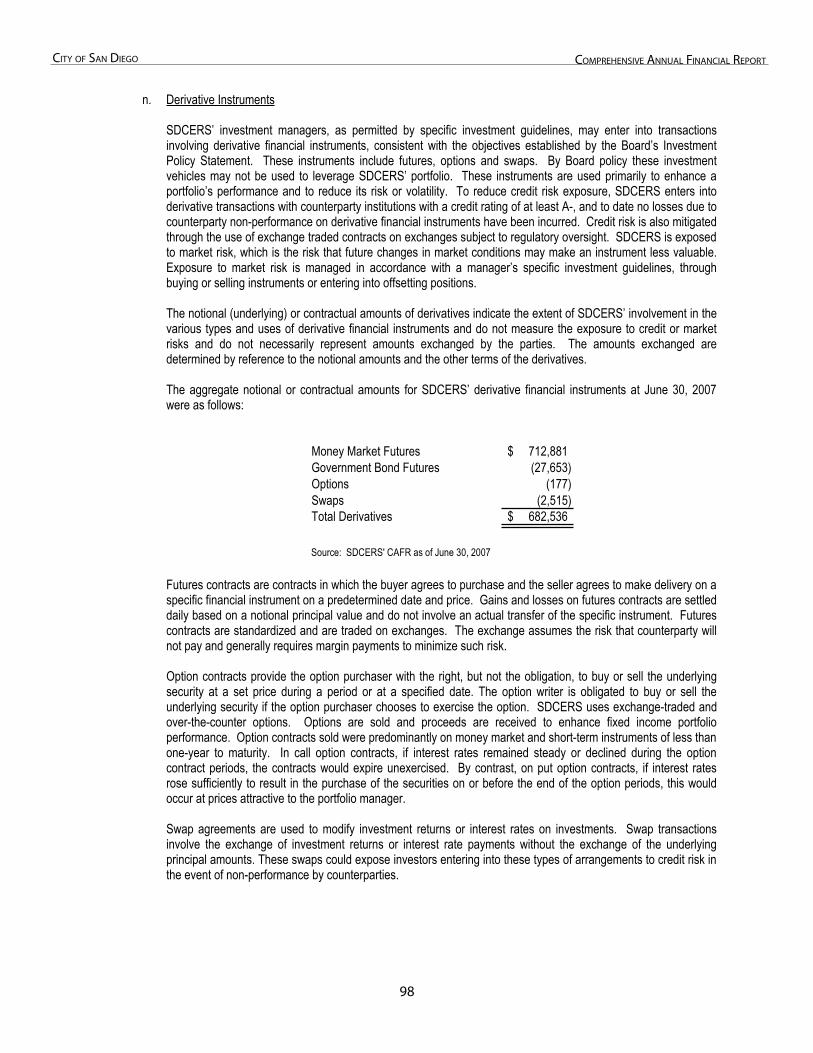
�8
City of San Diego ComprehenSive annual finanCial report
n. Derivative Instruments
SDCERS’ investment managers, as permitted by specific investment guidelines, may enter into transactions involving derivative financial instruments, consistent with the objectives established by the Board’s Investment Policy Statement. These instruments include futures, options and swaps. By Board policy these investment vehicles may not be used to leverage SDCERS’ portfolio. These instruments are used primarily to enhance a portfolio’s performance and to reduce its risk or volatility. To reduce credit risk exposure, SDCERS enters into derivative transactions with counterparty institutions with a credit rating of at least A-, and to date no losses due to counterparty non-performance on derivative financial instruments have been incurred. Credit risk is also mitigated through the use of exchange traded contracts on exchanges subject to regulatory oversight. SDCERS is exposed to market risk, which is the risk that future changes in market conditions may make an instrument less valuable. Exposure to market risk is managed in accordance with a manager’s specific investment guidelines, through buying or selling instruments or entering into offsetting positions.
The notional (underlying) or contractual amounts of derivatives indicate the extent of SDCERS’ involvement in the various types and uses of derivative financial instruments and do not measure the exposure to credit or market risks and do not necessarily represent amounts exchanged by the parties. The amounts exchanged are determined by reference to the notional amounts and the other terms of the derivatives.
The aggregate notional or contractual amounts for SDCERS’ derivative financial instruments at June 30, 2007 were as follows:
Money Market Futures 712,881$Government Bond Futures (27,653)Options (177) Swaps (2,515) Total Derivatives 682,536$
Source: SDCERS' CAFR as of June 30, 2007
Futures contracts are contracts in which the buyer agrees to purchase and the seller agrees to make delivery on a specific financial instrument on a predetermined date and price. Gains and losses on futures contracts are settled daily based on a notional principal value and do not involve an actual transfer of the specific instrument. Futures contracts are standardized and are traded on exchanges. The exchange assumes the risk that counterparty will not pay and generally requires margin payments to minimize such risk.
Option contracts provide the option purchaser with the right, but not the obligation, to buy or sell the underlying security at a set price during a period or at a specified date. The option writer is obligated to buy or sell the underlying security if the option purchaser chooses to exercise the option. SDCERS uses exchange-traded and over-the-counter options. Options are sold and proceeds are received to enhance fixed income portfolio performance. Option contracts sold were predominantly on money market and short-term instruments of less than one-year to maturity. In call option contracts, if interest rates remained steady or declined during the option contract periods, the contracts would expire unexercised. By contrast, on put option contracts, if interest rates rose sufficiently to result in the purchase of the securities on or before the end of the option periods, this would occur at prices attractive to the portfolio manager.
Swap agreements are used to modify investment returns or interest rates on investments. Swap transactions involve the exchange of investment returns or interest rate payments without the exchange of the underlying principal amounts. These swaps could expose investors entering into these types of arrangements to credit risk in the event of non-performance by counterparties.
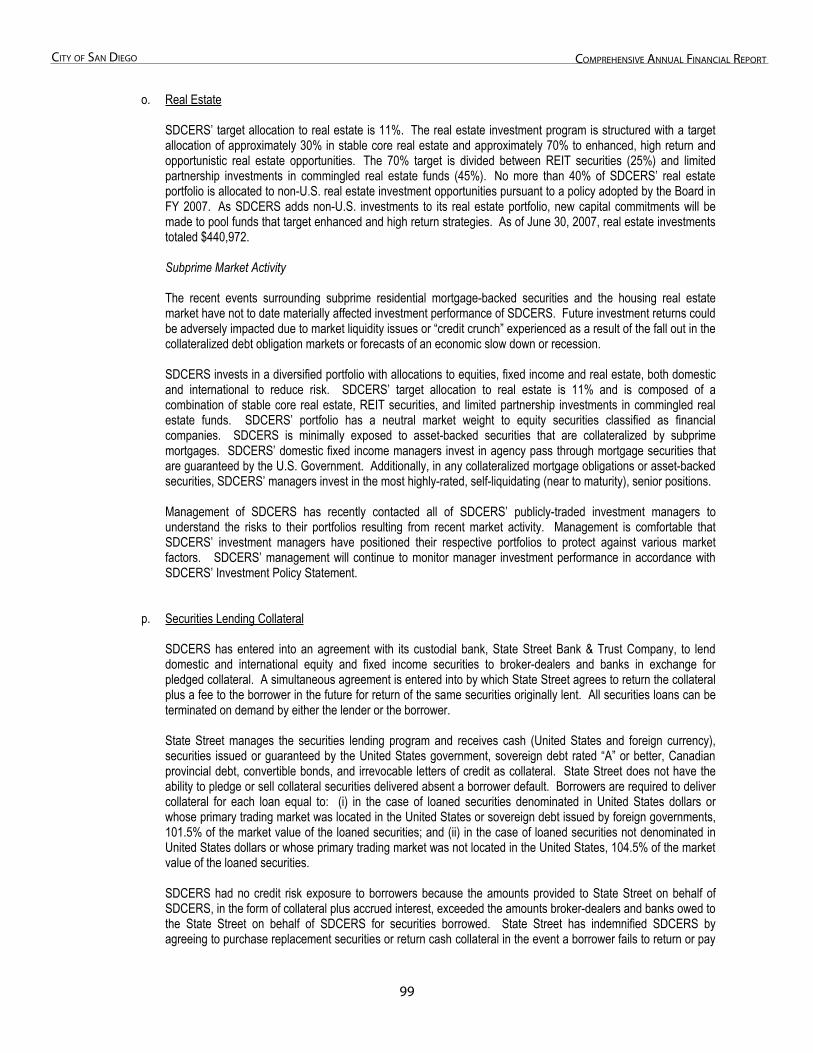
��
City of San Diego ComprehenSive annual finanCial report
o. Real Estate
SDCERS’ target allocation to real estate is 11%. The real estate investment program is structured with a target allocation of approximately 30% in stable core real estate and approximately 70% to enhanced, high return and opportunistic real estate opportunities. The 70% target is divided between REIT securities (25%) and limited partnership investments in commingled real estate funds (45%). No more than 40% of SDCERS’ real estate portfolio is allocated to non-U.S. real estate investment opportunities pursuant to a policy adopted by the Board in FY 2007. As SDCERS adds non-U.S. investments to its real estate portfolio, new capital commitments will be made to pool funds that target enhanced and high return strategies. As of June 30, 2007, real estate investments totaled $440,972.
Subprime Market Activity
The recent events surrounding subprime residential mortgage-backed securities and the housing real estate market have not to date materially affected investment performance of SDCERS. Future investment returns could be adversely impacted due to market liquidity issues or “credit crunch” experienced as a result of the fall out in the collateralized debt obligation markets or forecasts of an economic slow down or recession.
SDCERS invests in a diversified portfolio with allocations to equities, fixed income and real estate, both domestic and international to reduce risk. SDCERS’ target allocation to real estate is 11% and is composed of a combination of stable core real estate, REIT securities, and limited partnership investments in commingled real estate funds. SDCERS’ portfolio has a neutral market weight to equity securities classified as financial companies. SDCERS is minimally exposed to asset-backed securities that are collateralized by subprime mortgages. SDCERS’ domestic fixed income managers invest in agency pass through mortgage securities that are guaranteed by the U.S. Government. Additionally, in any collateralized mortgage obligations or asset-backed securities, SDCERS’ managers invest in the most highly-rated, self-liquidating (near to maturity), senior positions.
Management of SDCERS has recently contacted all of SDCERS’ publicly-traded investment managers to understand the risks to their portfolios resulting from recent market activity. Management is comfortable that SDCERS’ investment managers have positioned their respective portfolios to protect against various market factors. SDCERS’ management will continue to monitor manager investment performance in accordance with SDCERS’ Investment Policy Statement.
p. Securities Lending Collateral
SDCERS has entered into an agreement with its custodial bank, State Street Bank & Trust Company, to lend domestic and international equity and fixed income securities to broker-dealers and banks in exchange for pledged collateral. A simultaneous agreement is entered into by which State Street agrees to return the collateral plus a fee to the borrower in the future for return of the same securities originally lent. All securities loans can be terminated on demand by either the lender or the borrower.
State Street manages the securities lending program and receives cash (United States and foreign currency), securities issued or guaranteed by the United States government, sovereign debt rated “A” or better, Canadian provincial debt, convertible bonds, and irrevocable letters of credit as collateral. State Street does not have the ability to pledge or sell collateral securities delivered absent a borrower default. Borrowers are required to deliver collateral for each loan equal to: (i) in the case of loaned securities denominated in United States dollars or whose primary trading market was located in the United States or sovereign debt issued by foreign governments, 101.5% of the market value of the loaned securities; and (ii) in the case of loaned securities not denominated in United States dollars or whose primary trading market was not located in the United States, 104.5% of the market value of the loaned securities.
SDCERS had no credit risk exposure to borrowers because the amounts provided to State Street on behalf of SDCERS, in the form of collateral plus accrued interest, exceeded the amounts broker-dealers and banks owed to the State Street on behalf of SDCERS for securities borrowed. State Street has indemnified SDCERS by agreeing to purchase replacement securities or return cash collateral in the event a borrower fails to return or pay
100
City of San Diego ComprehenSive annual finanCial report
distributions on a loaned security. Non-cash collateral (securities and letters of credit) cannot be pledged or sold without a borrower default and are therefore not reported as an asset of SDCERS for financial reporting purposes.
The SDCERS securities lending transactions, collateralized by cash as of June 30, 2007 had a fair value of $831,415 and a collateral value of $854,631, which were reported in the assets or liabilities in the statements of plan net assets for the City Employees’ Retirement System in accordance with GASB Statement No. 28. As of June 30, 2007, the securities lending transactions collateralized by securities, irrevocable letters of credit, or tri-party collateral had a fair value of $29,535 and a collateral value of $34,075, which were not reported in the assets or liabilities in the accompanying statements of plan net assets for the City Employees’ Retirement System per GASB Statement No. 28. The total collateral pledged to SDCERS at fiscal year end for its securities lending activities was $888,705.
The cash collateral received on lent securities was invested by State Street, together with the cash collateral of other qualified tax-exempt plan lenders, in a collective investment pool. Because the securities loans were terminable at will, their duration did not generally match the duration of the investments made with cash collateral. As of June 30, 2007, the investment pool had an average duration of 68.25 days and an average weighted maturity of 532.81 days for U.S. Dollar (USD) denominated collateral. Beginning in fiscal year 2007, the securities lending program was expanded to allow the acceptance of Euro (EUR) denominated collateral. The Euro collateral pool had an average duration of 49 days and an average weighted maturity of 871 days.
SDCERS may encounter various risks related to securities lending agreements. However, State Street is required to maintain its securities lending program in compliance with applicable laws of the United States and all countries in which lending activities take place, and all rules, regulations, and exemptions from time to time promulgated and issued under the authority of those laws.
Discretely Presented Component Units – Disclosures for Policy and Specific Risks
Narratives and tables presented in the following sections (q. through r.) are taken directly from the comprehensive annual financial reports of the San Diego Convention Center Corporation and the San Diego Housing Commission, as of June 30, 2007.
q. San Diego Convention Center Corporation
Deposits (In Thousands)
On June 30, 2007, the carrying amount of the San Diego Convention Center Corporation’s (SDCCC) cash on hand and deposits was $639 and the bank balance was $682. Of the bank balance, $383 was covered by federal depository insurance. The remaining balance was either collateralized with the collateral held by an affiliate of the counterparty’s financial institution or is uncollateralized, and therefore exposed to custodial credit risk. SDCCC does not have a formal deposit and investment policy that addresses custodial credit risk.
Investments (In Thousands)
At June 30, 2007, SDCCC had a total investment balance of $15,140. The total investment balance includes $13,858 in several money market funds and $1,282 maintained in two certificates of deposit, which bear an interest rate of 4.05% and have maturities of less than one year. Neither the money market mutual funds nor the certificates of deposit are rated by credit rating agencies. SDCCC does not have a formal deposit and investment policy that addresses credit quality risk.
101
City of San Diego ComprehenSive annual finanCial report
Cash deposits and investments for SDCCC were categorized as follows at June 30, 2007:
Cash on hand 24$ Deposits 615 Money market mutual funds 13,858 Certificates of deposit 1,282
Total cash and investments 15,779$
r. San Diego Housing Commission
Cash, cash equivalents, and investments at June 30, 2007 consisted of the following:
Deposits 744$ Petty cash 9 Certificates of deposit 35,000 Local agency investment fund 38,746
Total cash and investments 74,499 Restricted cash and cash equivalents 1,723
Total 76,222$
Deposits (In Thousands)
The carrying amounts of the San Diego Housing Commission’s (SDHC) cash deposits were $1,081 and the bank balance was $1,640 at June 30, 2007. The bank balances were fully insured and/or collateralized with securities held by the pledging financial institutions in SDHC’s name. The California Government Code requires California banks and savings and loan associations to secure SDHC’s deposits by pledging securities as collateral. This Code states that collateral pledged in this manner shall have the effect of perfecting a security interest in such collateral superior to those of a general creditor. Thus, collateral for cash deposits is considered to be held in SDHC’s name.
At June 30, 2007, SDHC had a carrying amount and bank balance of $35,000 in non-negotiable certificates of deposit. The certificates of deposit were not covered by insurance and were collateralized 100% with securities held by pledging financial institutions.
Investments (In Thousands)
As of June 30, 2007, SDHC had $38,746 invested with the California Local Agency Investment Fund (LAIF). The investment in LAIF represents SDHC’s equity in the pooled investments of that fund. LAIF had 3.466% of the pool investment funds in structured notes and asset-backed securities.
Policy
In accordance with state statutes and HUD regulations, SDHC has authorized the CFO, the Budget Officer, or their designee to invest in obligations of the U.S. Treasury and U.S. Government agencies. There are many factors that can affect the value of investments. Some factors, such as credit risk, custodial risk, concentration of credit risk, and interest rate risk, may affect both equity and fixed income securities. It is the investment policy of SDHC to invest substantially all of its funds in fixed income securities which limits SDHC’s exposure to most types of risk.
102
City of San Diego ComprehenSive annual finanCial report
Interest Rate Risk
In accordance with its investment policy, SDHC manages its interest rate risk by limiting the weighted average maturity of its investment portfolio. This is accomplished by matching portfolio maturities to projected liabilities and by continuously investing a portion of the portfolio in readily available funds to ensure that appropriate liquidity is maintained in order to meet ongoing operations. At June 30, 2007, SDHC does not have any debt investments that are highly sensitive to changes in interest rates.
Credit Risk
SDHC will minimize credit risk by limiting investments to those listed in the investment policy. In addition, SDHC will pre-qualify the financial institutions, broker/dealers, intermediaries, and advisors with which SDHC will do business in accordance with the investment policy. SDHC will diversify the portion of the investment portfolio not invested in U.S. Treasury Bills, Notes, Bonds, and Collateralized Certificates of Deposit to minimize potential losses from any one type of security or issuer.
Concentration of Credit Risk
Concentration of credit risk is the risk associated with a lack of diversification, such as having substantial investments in a few individual issuers. Investments issued or guaranteed by the U.S. government and investments in external investment pools such as the California LAIF are not considered subject to concentration of credit risk. SDHC may choose to maintain 100% of its investment portfolio in U.S. Treasury Bills, Notes, Bonds, and Collateralized Certificates of Deposit.
Custodial Credit Risk
At June 30, 2007, SDHC did not have any investments exposed to custodial risk. All investments are held by the State of California or a pledging financial institution in the name of SDHC.
103
City of San Diego ComprehenSive annual finanCial report
4. Capital Assets
4. CAPITAL ASSETS (In Thousands) Capital asset activity for the year ended June 30, 2007 was as follows:
Primary Government
Beginning Decreases/ EndingBalance Increases Adjustments Transfers Balance
GOVERNMENTAL ACTIVITIES:
Non-Depreciable Capital Assets:
Land, Easements, Rights of Way 1,711,064$ 13,013$ (7,340)$ 14,266$ 1,731,003$
Construction in Progress 223,903 100,460 (9,733) (104,546) 210,084
Total Non-Depreciable Capital Assets 1,934,967 113,473 (17,073) (90,280) 1,941,087
Depreciable Capital Assets:
Structures and Improvements 1,045,029 412 (14,502) 41,084 1,072,023
Equipment 374,240 20,229 (13,648) 1,820 382,641
Infrastructure 2,863,314 33,888 (39,531) 48,846 2,906,517
Total Depreciable Capital Assets 4,282,583 54,529 (67,681) 91,750 4,361,181
Less Accumulated Depreciation For:
Structures and Improvements (259,871) (33,095) 2,715 27 (290,224)
Equipment (263,269) (24,323) 12,616 (1,533) (276,509)
Infrastructure (1,386,770) (86,464) 1,869 - (1,471,365)
Total Accumulated Depreciation (1,909,910) (143,882) 17,200 (1,506) (2,038,098)
Total Depreciable Capital Assets - Net of Depreciation 2,372,673 (89,353) (50,481) 90,244 2,323,083
Governmental Activities Capital Assets, Net 4,307,640$ 24,120$ (67,554)$ (36)$ 4,264,170$
BUSINESS-TYPE ACTIVITIES:
Non-Depreciable Capital Assets:
Land, Easements, Rights of Way 89,769$ 180$ -$ 62$ 90,011$
Construction in Progress 399,422 70,325 (13,139) (166,447) 290,161
Total Non-Depreciable Capital Assets 489,191 70,505 (13,139) (166,385) 380,172
Depreciable Capital Assets:
Structures and Improvements 1,565,973 10,746 (26) 85,871 1,662,564
Equipment 316,115 2,230 (149) 8,404 326,600
Distribution & Collection Systems and Other Infrastructure 3,205,493 108,753 (4,565) 70,640 3,380,321
Total Depreciable Capital Assets 5,087,581 121,729 (4,740) 164,915 5,369,485
Less Accumulated Depreciation For:
Structures and Improvements (293,823) (35,896) 25 (27) (329,721)
Equipment (200,250) (24,224) 148 1,533 (222,793)
Distribution & Collection Systems and Other Infrastructure (546,386) (46,975) 1,502 - (591,859)
Total Accumulated Depreciation (1,040,459) (107,095) 1,675 1,506 (1,144,373)
Total Depreciable Capital Assets - Net of Depreciation 4,047,122 14,634 (3,065) 166,421 4,225,112
Business-Type Activities Capital Assets, Net 4,536,313$ 85,139$ (16,204)$ 36$ 4,605,284$ -
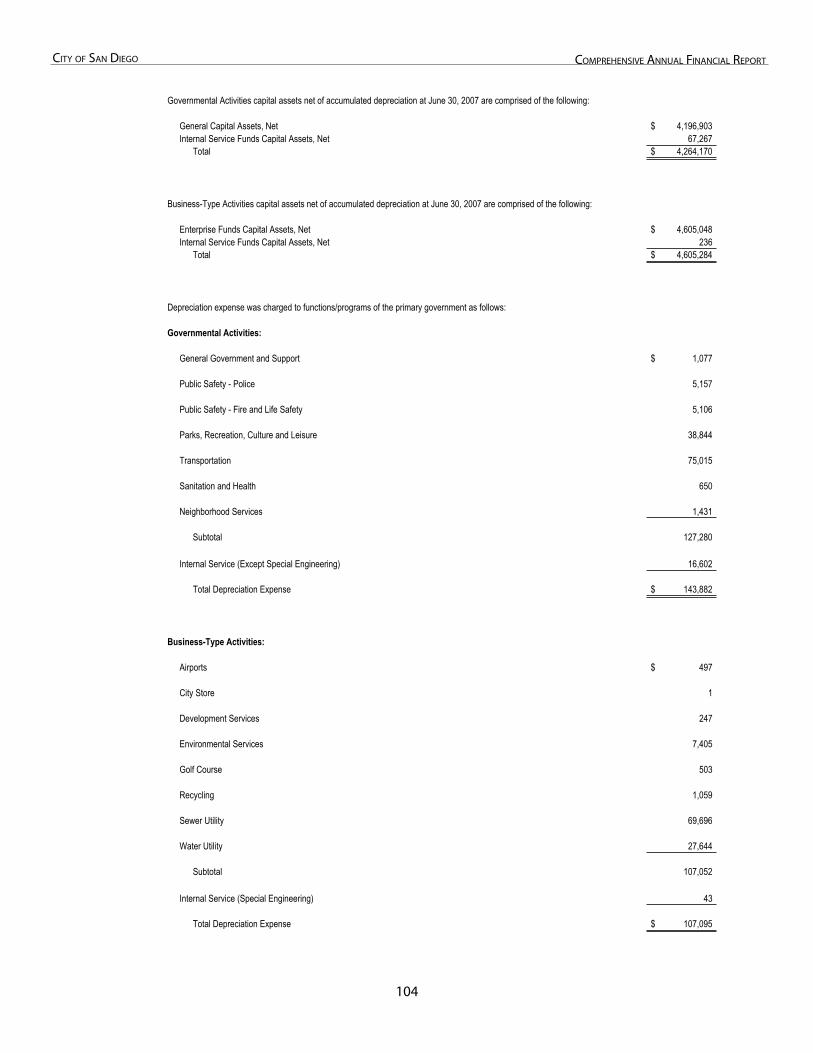
10�
City of San Diego ComprehenSive annual finanCial report
- Governmental Activities capital assets net of accumulated depreciation at June 30, 2007 are comprised of the following:
General Capital Assets, Net 4,196,903$ Internal Service Funds Capital Assets, Net 67,267 Total 4,264,170$
-
Business-Type Activities capital assets net of accumulated depreciation at June 30, 2007 are comprised of the following:
Enterprise Funds Capital Assets, Net 4,605,048$ Internal Service Funds Capital Assets, Net 236 Total 4,605,284$
-
Depreciation expense was charged to functions/programs of the primary government as follows:
Governmental Activities:
General Government and Support 1,077$
Public Safety - Police 5,157
Public Safety - Fire and Life Safety 5,106
Parks, Recreation, Culture and Leisure 38,844
Transportation 75,015
Sanitation and Health 650
Neighborhood Services 1,431
Subtotal 127,280
Internal Service (Except Special Engineering) 16,602
Total Depreciation Expense 143,882$ -
Business-Type Activities:
Airports 497$
City Store 1
Development Services 247
Environmental Services 7,405
Golf Course 503
Recycling 1,059
Sewer Utility 69,696
Water Utility 27,644
Subtotal 107,052
Internal Service (Special Engineering) 43
Total Depreciation Expense 107,095$ -
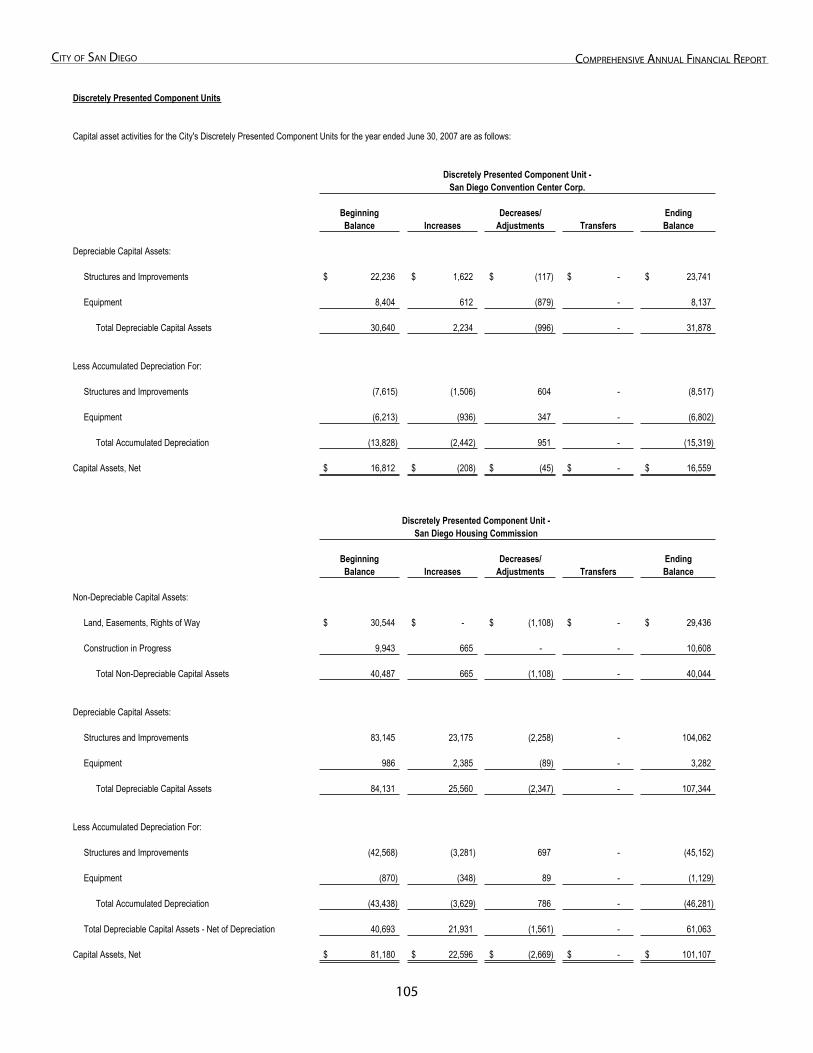
10�
City of San Diego ComprehenSive annual finanCial report
Discretely Presented Component Units
Capital asset activities for the City's Discretely Presented Component Units for the year ended June 30, 2007 are as follows:
Beginning Decreases/ EndingBalance Increases Adjustments Transfers Balance
Depreciable Capital Assets:
Structures and Improvements 22,236$ 1,622$ (117)$ -$ 23,741$
Equipment 8,404 612 (879) - 8,137
Total Depreciable Capital Assets 30,640 2,234 (996) - 31,878
Less Accumulated Depreciation For:
Structures and Improvements (7,615) (1,506) 604 - (8,517)
Equipment (6,213) (936) 347 - (6,802)
Total Accumulated Depreciation (13,828) (2,442) 951 - (15,319)
Capital Assets, Net 16,812$ (208)$ (45)$ -$ 16,559$
Discretely Presented Component Unit -San Diego Housing Commission
Beginning Decreases/ EndingBalance Increases Adjustments Transfers Balance
Non-Depreciable Capital Assets:
Land, Easements, Rights of Way 30,544$ -$ (1,108)$ -$ 29,436$
Construction in Progress 9,943 665 - - 10,608
Total Non-Depreciable Capital Assets 40,487 665 (1,108) - 40,044
Depreciable Capital Assets:
Structures and Improvements 83,145 23,175 (2,258) - 104,062
Equipment 986 2,385 (89) - 3,282
Total Depreciable Capital Assets 84,131 25,560 (2,347) - 107,344
Less Accumulated Depreciation For:
Structures and Improvements (42,568) (3,281) 697 - (45,152)
Equipment (870) (348) 89 - (1,129)
Total Accumulated Depreciation (43,438) (3,629) 786 - (46,281)
Total Depreciable Capital Assets - Net of Depreciation 40,693 21,931 (1,561) - 61,063
Capital Assets, Net 81,180$ 22,596$ (2,669)$ -$ 101,107$
Discretely Presented Component Unit -San Diego Convention Center Corp.
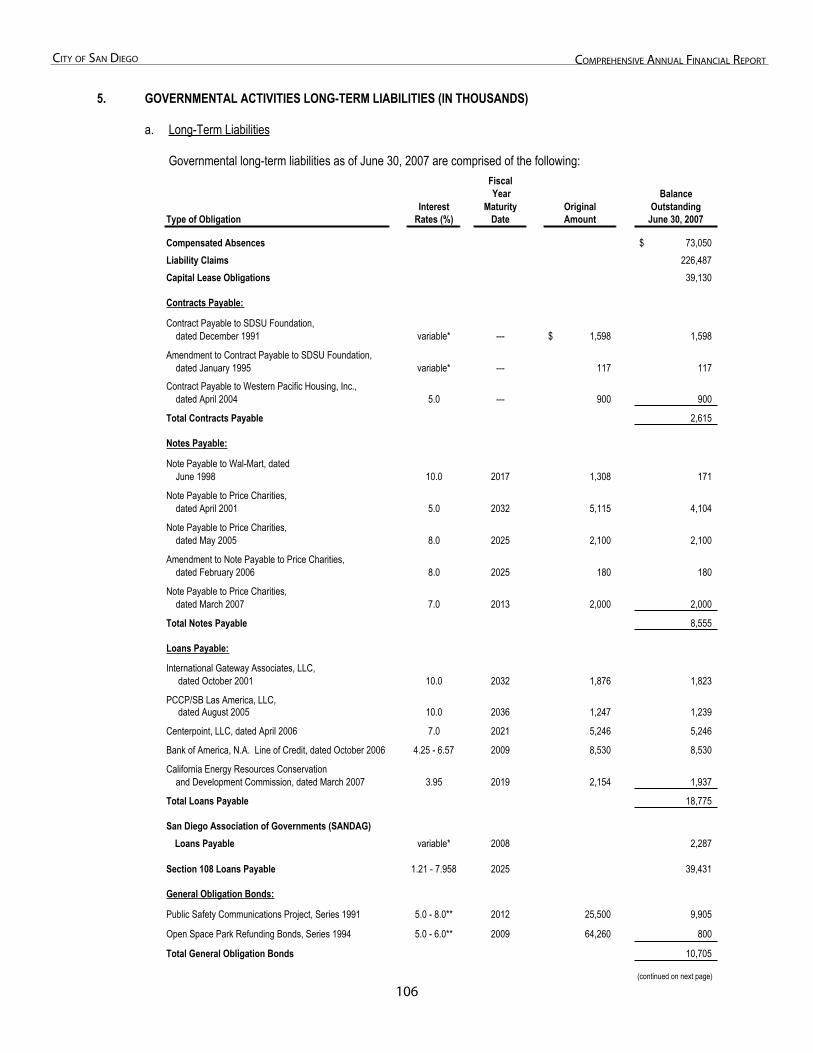
10�
City of San Diego ComprehenSive annual finanCial report
5. Governmental Activities Long-
5. GOVERNMENTAL ACTIVITIES LONG-TERM LIABILITIES (IN THOUSANDS)
a. Long-Term Liabilities
Governmental long-term liabilities as of June 30, 2007 are comprised of the following: FiscalYear Balance
Interest Maturity Original OutstandingType of Obligation Rates (%) Date Amount June 30, 2007
Compensated Absences 73,050$ Liability Claims 226,487 Capital Lease Obligations 39,130
Contracts Payable:
Contract Payable to SDSU Foundation, dated December 1991 variable* --- 1,598$ 1,598
Amendment to Contract Payable to SDSU Foundation, dated January 1995 variable* --- 117 117
Contract Payable to Western Pacific Housing, Inc., dated April 2004 5.0 --- 900 900
Total Contracts Payable 2,615
Notes Payable:
Note Payable to Wal-Mart, dated June 1998 10.0 2017 1,308 171
Note Payable to Price Charities, dated April 2001 5.0 2032 5,115 4,104
Note Payable to Price Charities, dated May 2005 8.0 2025 2,100 2,100
Amendment to Note Payable to Price Charities, dated February 2006 8.0 2025 180 180
Note Payable to Price Charities, dated March 2007 7.0 2013 2,000 2,000
Total Notes Payable 8,555
Loans Payable:
International Gateway Associates, LLC, dated October 2001 10.0 2032 1,876 1,823
PCCP/SB Las America, LLC, dated August 2005 10.0 2036 1,247 1,239
Centerpoint, LLC, dated April 2006 7.0 2021 5,246 5,246
Bank of America, N.A. Line of Credit, dated October 2006 4.25 - 6.57 2009 8,530 8,530
California Energy Resources Conservation and Development Commission, dated March 2007 3.95 2019 2,154 1,937
Total Loans Payable 18,775
San Diego Association of Governments (SANDAG)Loans Payable variable* 2008 2,287
Section 108 Loans Payable 1.21 - 7.958 2025 39,431
General Obligation Bonds:
Public Safety Communications Project, Series 1991 5.0 - 8.0** 2012 25,500 9,905
Open Space Park Refunding Bonds, Series 1994 5.0 - 6.0** 2009 64,260 800
Total General Obligation Bonds 10,705
(continued on next page)
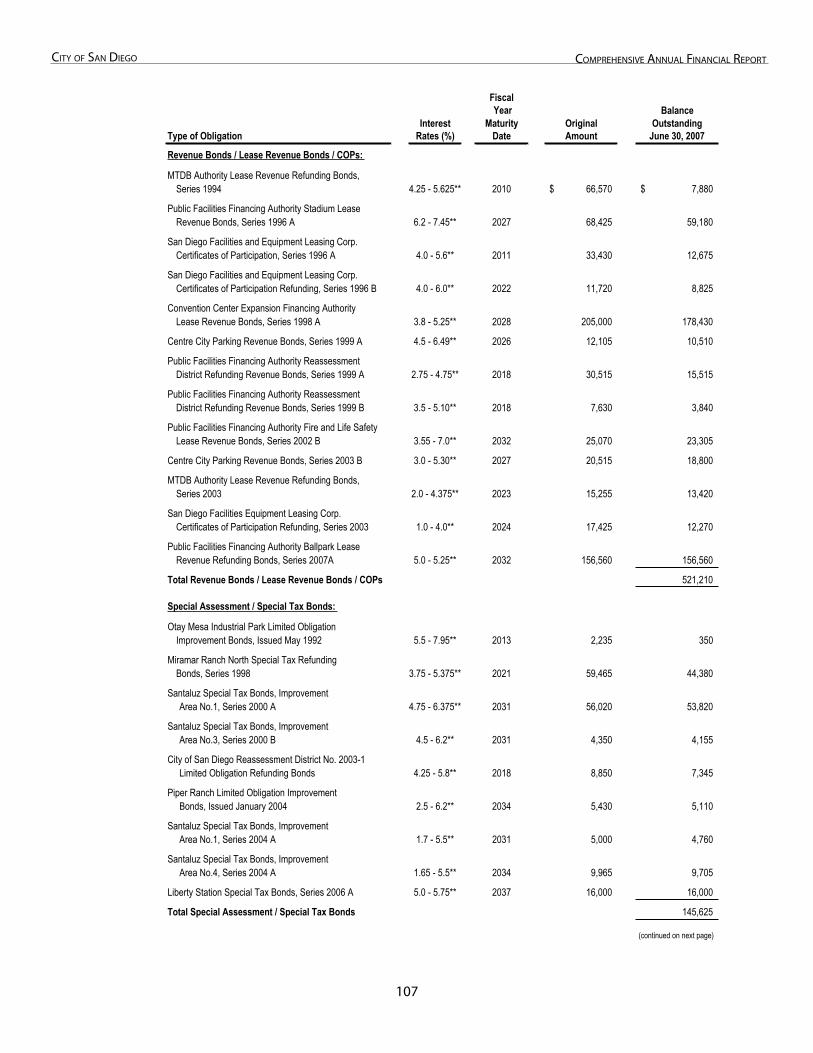
107
City of San Diego ComprehenSive annual finanCial report
FiscalYear Balance
Interest Maturity Original OutstandingType of Obligation Rates (%) Date Amount June 30, 2007
Revenue Bonds / Lease Revenue Bonds / COPs:
MTDB Authority Lease Revenue Refunding Bonds,Series 1994 4.25 - 5.625** 2010 66,570$ 7,880$
Public Facilities Financing Authority Stadium LeaseRevenue Bonds, Series 1996 A 6.2 - 7.45** 2027 68,425 59,180
San Diego Facilities and Equipment Leasing Corp.Certificates of Participation, Series 1996 A 4.0 - 5.6** 2011 33,430 12,675
San Diego Facilities and Equipment Leasing Corp.Certificates of Participation Refunding, Series 1996 B 4.0 - 6.0** 2022 11,720 8,825
Convention Center Expansion Financing AuthorityLease Revenue Bonds, Series 1998 A 3.8 - 5.25** 2028 205,000 178,430
Centre City Parking Revenue Bonds, Series 1999 A 4.5 - 6.49** 2026 12,105 10,510
Public Facilities Financing Authority ReassessmentDistrict Refunding Revenue Bonds, Series 1999 A 2.75 - 4.75** 2018 30,515 15,515
Public Facilities Financing Authority ReassessmentDistrict Refunding Revenue Bonds, Series 1999 B 3.5 - 5.10** 2018 7,630 3,840
Public Facilities Financing Authority Fire and Life SafetyLease Revenue Bonds, Series 2002 B 3.55 - 7.0** 2032 25,070 23,305
Centre City Parking Revenue Bonds, Series 2003 B 3.0 - 5.30** 2027 20,515 18,800
MTDB Authority Lease Revenue Refunding Bonds, Series 2003 2.0 - 4.375** 2023 15,255 13,420
San Diego Facilities Equipment Leasing Corp. Certificates of Participation Refunding, Series 2003 1.0 - 4.0** 2024 17,425 12,270
Public Facilities Financing Authority Ballpark LeaseRevenue Refunding Bonds, Series 2007A 5.0 - 5.25** 2032 156,560 156,560
Total Revenue Bonds / Lease Revenue Bonds / COPs 521,210
Special Assessment / Special Tax Bonds:
Otay Mesa Industrial Park Limited ObligationImprovement Bonds, Issued May 1992 5.5 - 7.95** 2013 2,235 350
Miramar Ranch North Special Tax RefundingBonds, Series 1998 3.75 - 5.375** 2021 59,465 44,380
Santaluz Special Tax Bonds, Improvement Area No.1, Series 2000 A 4.75 - 6.375** 2031 56,020 53,820
Santaluz Special Tax Bonds, Improvement Area No.3, Series 2000 B 4.5 - 6.2** 2031 4,350 4,155
City of San Diego Reassessment District No. 2003-1 Limited Obligation Refunding Bonds 4.25 - 5.8** 2018 8,850 7,345
Piper Ranch Limited Obligation Improvement Bonds, Issued January 2004 2.5 - 6.2** 2034 5,430 5,110
Santaluz Special Tax Bonds, Improvement Area No.1, Series 2004 A 1.7 - 5.5** 2031 5,000 4,760
Santaluz Special Tax Bonds, Improvement Area No.4, Series 2004 A 1.65 - 5.5** 2034 9,965 9,705
Liberty Station Special Tax Bonds, Series 2006 A 5.0 - 5.75** 2037 16,000 16,000
Total Special Assessment / Special Tax Bonds 145,625
(continued on next page)
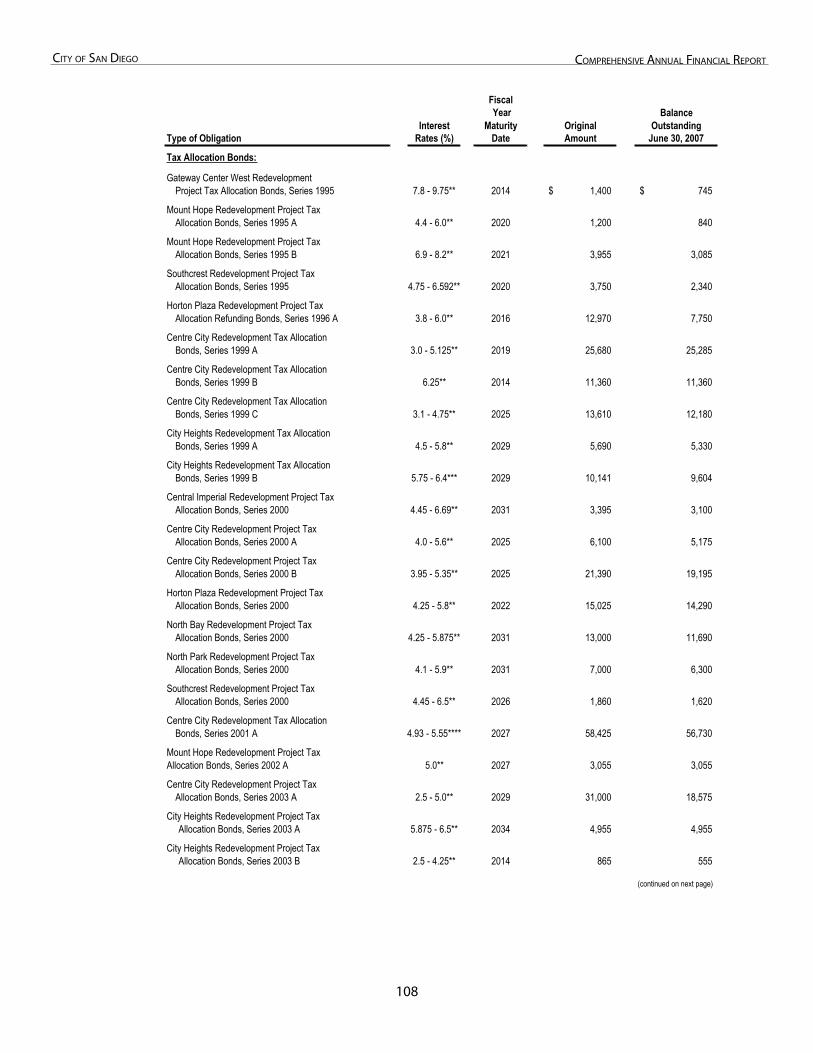
108
City of San Diego ComprehenSive annual finanCial report
FiscalYear Balance
Interest Maturity Original OutstandingType of Obligation Rates (%) Date Amount June 30, 2007
Tax Allocation Bonds:
Gateway Center West RedevelopmentProject Tax Allocation Bonds, Series 1995 7.8 - 9.75** 2014 1,400$ 745$
Mount Hope Redevelopment Project TaxAllocation Bonds, Series 1995 A 4.4 - 6.0** 2020 1,200 840
Mount Hope Redevelopment Project TaxAllocation Bonds, Series 1995 B 6.9 - 8.2** 2021 3,955 3,085
Southcrest Redevelopment Project TaxAllocation Bonds, Series 1995 4.75 - 6.592** 2020 3,750 2,340
Horton Plaza Redevelopment Project TaxAllocation Refunding Bonds, Series 1996 A 3.8 - 6.0** 2016 12,970 7,750
Centre City Redevelopment Tax AllocationBonds, Series 1999 A 3.0 - 5.125** 2019 25,680 25,285
Centre City Redevelopment Tax AllocationBonds, Series 1999 B 6.25** 2014 11,360 11,360
Centre City Redevelopment Tax AllocationBonds, Series 1999 C 3.1 - 4.75** 2025 13,610 12,180
City Heights Redevelopment Tax AllocationBonds, Series 1999 A 4.5 - 5.8** 2029 5,690 5,330
City Heights Redevelopment Tax AllocationBonds, Series 1999 B 5.75 - 6.4*** 2029 10,141 9,604
Central Imperial Redevelopment Project TaxAllocation Bonds, Series 2000 4.45 - 6.69** 2031 3,395 3,100
Centre City Redevelopment Project TaxAllocation Bonds, Series 2000 A 4.0 - 5.6** 2025 6,100 5,175
Centre City Redevelopment Project TaxAllocation Bonds, Series 2000 B 3.95 - 5.35** 2025 21,390 19,195
Horton Plaza Redevelopment Project TaxAllocation Bonds, Series 2000 4.25 - 5.8** 2022 15,025 14,290
North Bay Redevelopment Project TaxAllocation Bonds, Series 2000 4.25 - 5.875** 2031 13,000 11,690
North Park Redevelopment Project TaxAllocation Bonds, Series 2000 4.1 - 5.9** 2031 7,000 6,300
Southcrest Redevelopment Project TaxAllocation Bonds, Series 2000 4.45 - 6.5** 2026 1,860 1,620
Centre City Redevelopment Tax AllocationBonds, Series 2001 A 4.93 - 5.55**** 2027 58,425 56,730
Mount Hope Redevelopment Project TaxAllocation Bonds, Series 2002 A 5.0** 2027 3,055 3,055
Centre City Redevelopment Project TaxAllocation Bonds, Series 2003 A 2.5 - 5.0** 2029 31,000 18,575
City Heights Redevelopment Project Tax Allocation Bonds, Series 2003 A 5.875 - 6.5** 2034 4,955 4,955
City Heights Redevelopment Project Tax Allocation Bonds, Series 2003 B 2.5 - 4.25** 2014 865 555
(continued on next page)
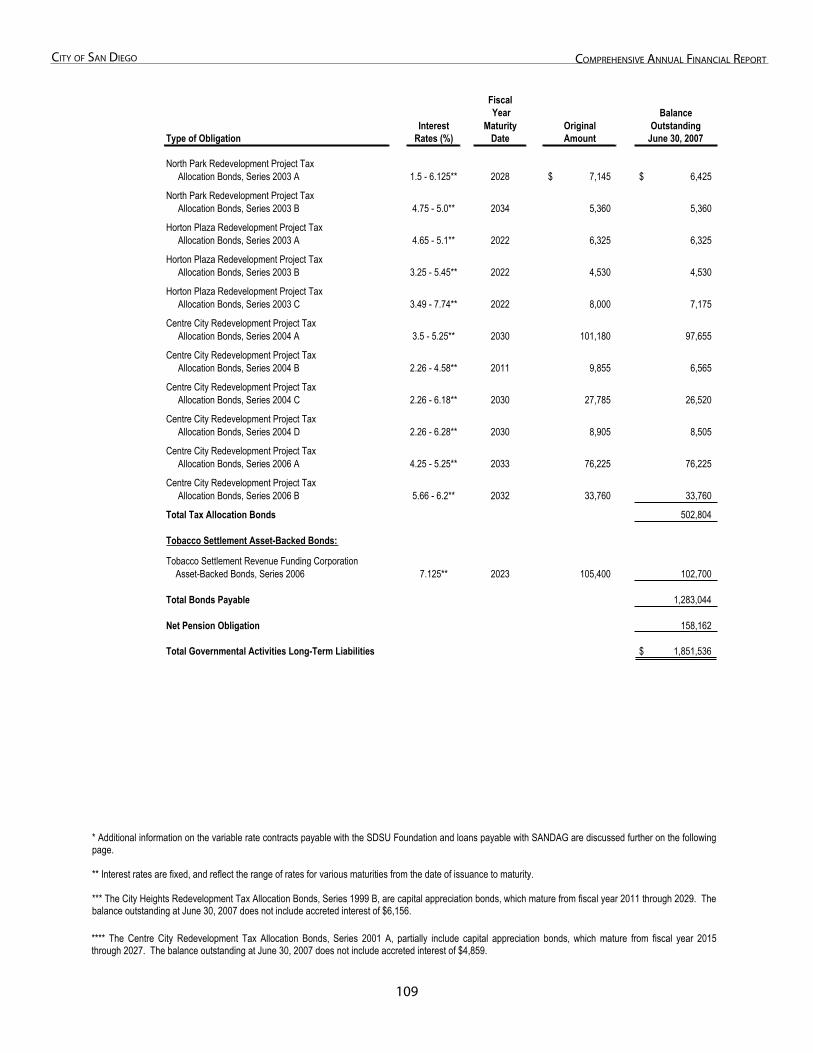
10�
City of San Diego ComprehenSive annual finanCial report
* Additional information on the variable rate contracts payable with the SDSU Foundation and loans payable with SANDAG are discussed further on the following page.
** Interest rates are fixed, and reflect the range of rates for various maturities from the date of issuance to maturity.
*** The City Heights Redevelopment Tax Allocation Bonds, Series 1999 B, are capital appreciation bonds, which mature from fiscal year 2011 through 2029. The balance outstanding at June 30, 2007 does not include accreted interest of $6,156.
**** The Centre City Redevelopment Tax Allocation Bonds, Series 2001 A, partially include capital appreciation bonds, which mature from fiscal year 2015 through 2027. The balance outstanding at June 30, 2007 does not include accreted interest of $4,859.
FiscalYear Balance
Interest Maturity Original OutstandingType of Obligation Rates (%) Date Amount June 30, 2007
North Park Redevelopment Project Tax Allocation Bonds, Series 2003 A 1.5 - 6.125** 2028 7,145$ 6,425$
North Park Redevelopment Project Tax Allocation Bonds, Series 2003 B 4.75 - 5.0** 2034 5,360 5,360
Horton Plaza Redevelopment Project Tax Allocation Bonds, Series 2003 A 4.65 - 5.1** 2022 6,325 6,325
Horton Plaza Redevelopment Project Tax Allocation Bonds, Series 2003 B 3.25 - 5.45** 2022 4,530 4,530
Horton Plaza Redevelopment Project Tax Allocation Bonds, Series 2003 C 3.49 - 7.74** 2022 8,000 7,175
Centre City Redevelopment Project Tax Allocation Bonds, Series 2004 A 3.5 - 5.25** 2030 101,180 97,655
Centre City Redevelopment Project Tax Allocation Bonds, Series 2004 B 2.26 - 4.58** 2011 9,855 6,565
Centre City Redevelopment Project Tax Allocation Bonds, Series 2004 C 2.26 - 6.18** 2030 27,785 26,520
Centre City Redevelopment Project Tax Allocation Bonds, Series 2004 D 2.26 - 6.28** 2030 8,905 8,505
Centre City Redevelopment Project Tax Allocation Bonds, Series 2006 A 4.25 - 5.25** 2033 76,225 76,225
Centre City Redevelopment Project Tax Allocation Bonds, Series 2006 B 5.66 - 6.2** 2032 33,760 33,760
Total Tax Allocation Bonds 502,804
Tobacco Settlement Asset-Backed Bonds:
Tobacco Settlement Revenue Funding Corporation Asset-Backed Bonds, Series 2006 7.125** 2023 105,400 102,700
Total Bonds Payable 1,283,044
Net Pension Obligation 158,162
Total Governmental Activities Long-Term Liabilities 1,851,536$
110
City of San Diego ComprehenSive annual finanCial report
Liability claims are primarily liquidated by the Self Insurance Fund and Enterprise Funds. Compensated absences are paid out of the operating funds and certain internal service funds. Pension liabilities are paid out of the operating funds based on a percentage of payroll.
Public safety general obligation bonds are secured by a pledge of the full faith and credit of the City or by a pledge of the City to levy ad valorem property taxes without limitation. Open space general obligation bonds are backed by Environmental Growth Fund 2/3 franchise fees.
Revenue bonds are secured by a pledge of specific revenue generally derived from fees or service charges related to the operation of the project being financed. Certificates of Participation (COPs) and lease revenue bonds provide long-term financing through a lease agreement, installment sales agreement, or loan agreement that does not constitute indebtedness under the state constitutional debt limitation and is not subject to other statutory requirements applicable to bonds.
Special assessment/special tax bonds are issued by the City to provide funds for public improvements in/and or serving special assessment and Mello-Roos districts created by the City. The bonds are secured by assessments and special taxes levied on the properties located within the assessment districts and the community facilities districts, and are payable solely from the assessments and special taxes collected. The assessments and special taxes, and any bonds payable from them, are secured by a lien on the properties upon which the assessments and special taxes are levied. Neither the faith and credit nor the taxing power of the City is pledged to the payment of the bonds.
Section 108 loans are the loan guarantee provisions of the Community Development Block Grant (CDBG) program. Section 108 loans provide the community with a source of financing for economic development, housing rehabilitation, public facilities,and capital improvement and infrastructure projects.
SANDAG loans are comprised of two components: repayment of debt service on bonds, and repayment of proceeds from commercial paper. The City receives distributions of SANDAG bond proceeds, based on the City’s agreement with SANDAG. The annual debt service payments related to these bond issuances are recovered by SANDAG through reductions in TransNet allocations that would otherwise be available for payment to the City. TransNet-Proposition A, was passed in 1987 to enact a ½ percent sales tax increase to fund regional transportation projects. All expenses must first be approved by SANDAG and be included on the Regional Transportation Plan (RTP). The City recognizes repayment of the principal and interest on bonds as an increase in TransNet revenues and an offsetting debt service expenditure. The interest rates on the outstanding bonds range from 4.75 percent to 5.50 percent. In addition to financing from bond issuances, financing for TransNet related projectsis available through the issuance of commercial paper notes by SANDAG, at the request of the City. Repayment of proceeds related to the commercial paper is collected in future periods through reductions in TransNet allocations, similar to the repayment of the debt service on bonds. Interest rates on commercial paper notes during the current year have varied from 2.40 percent to 3.58 percent, with maturities from 1 day to 166 days. Interest rates on outstanding commercial paper note amounts at June 30, 2007 ranged from 3.50 percent to 3.58 percent. The maturity date of the current SANDAG loan is June 2008.
San Diego State University Foundation executed an Agreement for Processing a Redevelopment Plan and Land Use Entitlements with RDA, which allows for reimbursement of expenses incurred by the Foundation, in assisting in the preparation and processing of the Redevelopment Plan and Land Use Entitlements in the College Area. The agreement is a variable rate obligation of RDA. The unpaid principal bears interest at the prime rate and is fixed on a quarterly basis, using the prime rate established on the first banking day of each calendar quarter. Interest calculations are made on the quarterly weighted average of the principal balance and are made at the end of the quarter based upon the rate fixed for that quarter. The effective interest rate as of June 30, 2007 is 8.25 percent.
Loans Payable includes a line of credit executed by RDA with Bank of America, N.A. on October 31, 2006. The line of credit is to be used to refinance the North Park Theatre, to pay sums of settlement of eminent domain actions relating to the North Park Redevelopment Area and for other redevelopment activities in the North Park Redevelopment Area. As of June 30, 2007, the tax-exempt portion of the line of credit has an effective interest rate of 4.25 percent and the taxable portion has an effectiveinterest rate of 6.57 percent . The effective interest rate will reset on October 31, annually.
Tobacco Settlement Asset-Backed Bonds are limited obligations of the Tobacco Settlement Revenue Funding Corporation, which is a separate legal California nonprofit public benefit corporation established by the City of San Diego. The Corporationpurchased from the City the rights to receive future tobacco settlement revenues due to the City. The Tobacco Settlement Asset-Backed Bonds are payable from and secured solely by pledged tobacco settlement revenues.
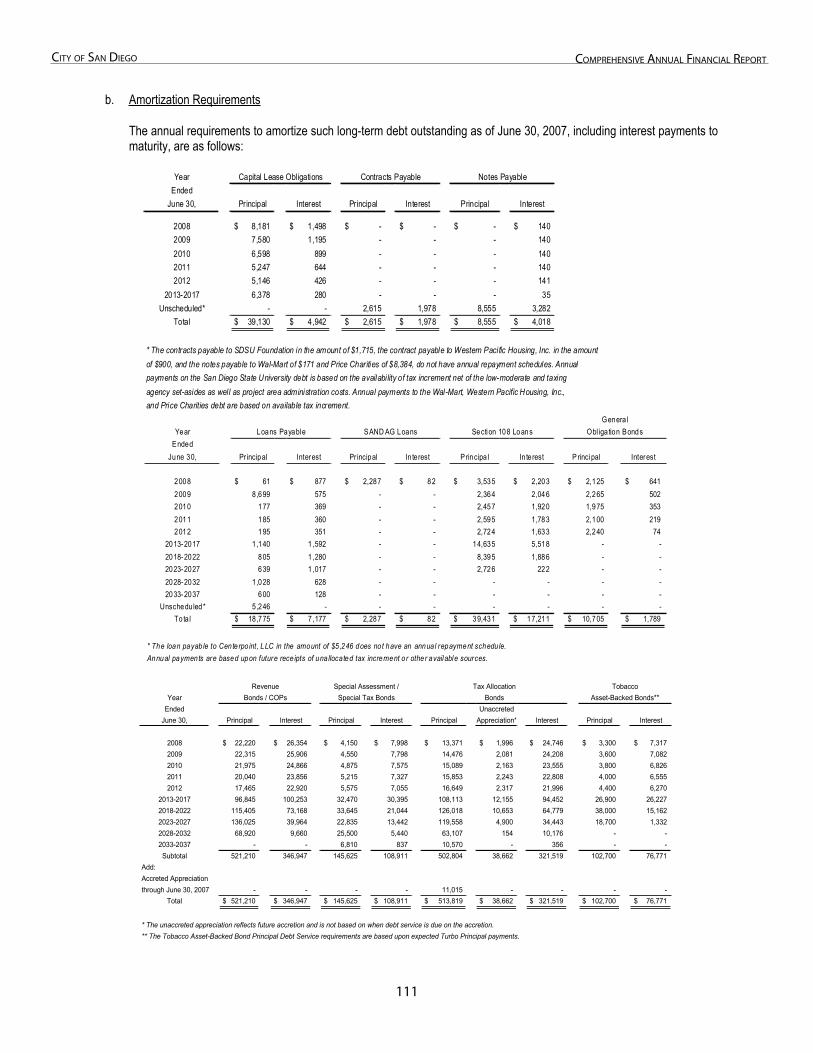
111
City of San Diego ComprehenSive annual finanCial report
b. Amortization Requirements
The annual requirements to amortize such long-term debt outstanding as of June 30, 2007, including interest payments to maturity, are as follows:
Year Capital Lease Obligations Contracts Payable Notes PayableEnded
June 30, Principal Interest Principal Interest Principal Interest
2008 8,181$ 1,498$ -$ -$ -$ 140$ 2009 7,580 1,195 - - - 140 2010 6,598 899 - - - 140 2011 5,247 644 - - - 140 2012 5,146 426 - - - 141
2013-2017 6,378 280 - - - 35 Unscheduled* - - 2,615 1,978 8,555 3,282
Total 39,130$ 4,942$ 2,615$ 1,978$ 8,555$ 4,018$
* The contracts payable to SDSU Foundation in the amount of $1,715, the contract payable to Western Pacific Housing, Inc. in the amountof $900, and the notes payable to Wal-Mart of $171 and Price Charities of $8,384, do not have annual repayment schedules. Annualpayments on the San Diego State University debt is based on the availability of tax increment net of the low-moderate and taxingagency set-asides as well as project area administration costs. Annual payments to the Wal-Mart, Western Pacific Housing, Inc.,and Price Charities debt are based on available tax increment.
Genera lYear Loans Payable SAND AG Loans Section 108 Loans Obl iga tion Bonds
EndedJune 30, Pr incipal Interest Pr incipal In terest P rincipa l In te rest P rincipal Interest
2008 61$ 877$ 2,287$ 82$ 3,535$ 2,203$ 2,125$ 641$ 2009 8,699 575 - - 2,364 2,046 2,265 502 2010 177 369 - - 2,457 1,920 1,975 353 2011 185 360 - - 2,595 1,783 2,100 219 2012 195 351 - - 2,724 1,633 2,240 74
2013-2017 1,140 1 ,592 - - 14,635 5,518 - - 2018-2022 805 1 ,280 - - 8,395 1,886 - - 2023-2027 639 1 ,017 - - 2,726 222 - - 2028-2032 1,028 628 - - - - - - 2033-2037 600 128 - - - - - -
Unschedu led* 5,246 - - - - - - - To ta l 18 ,775$ 7 ,177$ 2,287$ 82$ 39,431$ 17,211$ 10,705$ 1,789$
* The loan payab le to Cente rpo int, LLC in the amount of $5 ,246 does no t have an annua l repayment schedu le.Annual payments are based upon future rece ipts of una llocated tax increment o r other available sources.
Revenue Special Assessment / Tax Allocation TobaccoYear Bonds / COPs Special Tax Bonds Bonds Asset-Backed Bonds**
Ended Unaccreted June 30, Principal Interest Principal Interest Principal Appreciation* Interest Principal Interest
2008 22,220$ 26,354$ 4,150$ 7,998$ 13,371$ 1,996$ 24,746$ 3,300$ 7,317$ 2009 22,315 25,906 4,550 7,798 14,476 2,081 24,208 3,600 7,082 2010 21,975 24,866 4,875 7,575 15,089 2,163 23,555 3,800 6,826 2011 20,040 23,856 5,215 7,327 15,853 2,243 22,808 4,000 6,555 2012 17,465 22,920 5,575 7,055 16,649 2,317 21,996 4,400 6,270
2013-2017 96,845 100,253 32,470 30,395 108,113 12,155 94,452 26,900 26,227 2018-2022 115,405 73,168 33,645 21,044 126,018 10,653 64,779 38,000 15,162 2023-2027 136,025 39,964 22,835 13,442 119,558 4,900 34,443 18,700 1,332 2028-2032 68,920 9,660 25,500 5,440 63,107 154 10,176 - - 2033-2037 - - 6,810 837 10,570 - 356 - - Subtotal 521,210 346,947 145,625 108,911 502,804 38,662 321,519 102,700 76,771
Add:Accreted Appreciationthrough June 30, 2007 - - - - 11,015 - - - -
Total 521,210$ 346,947$ 145,625$ 108,911$ 513,819$ 38,662$ 321,519$ 102,700$ 76,771$
* The unaccreted appreciation reflects future accretion and is not based on when debt service is due on the accretion. ** The Tobacco Asset-Backed Bond Principal Debt Service requirements are based upon expected Turbo Principal payments.
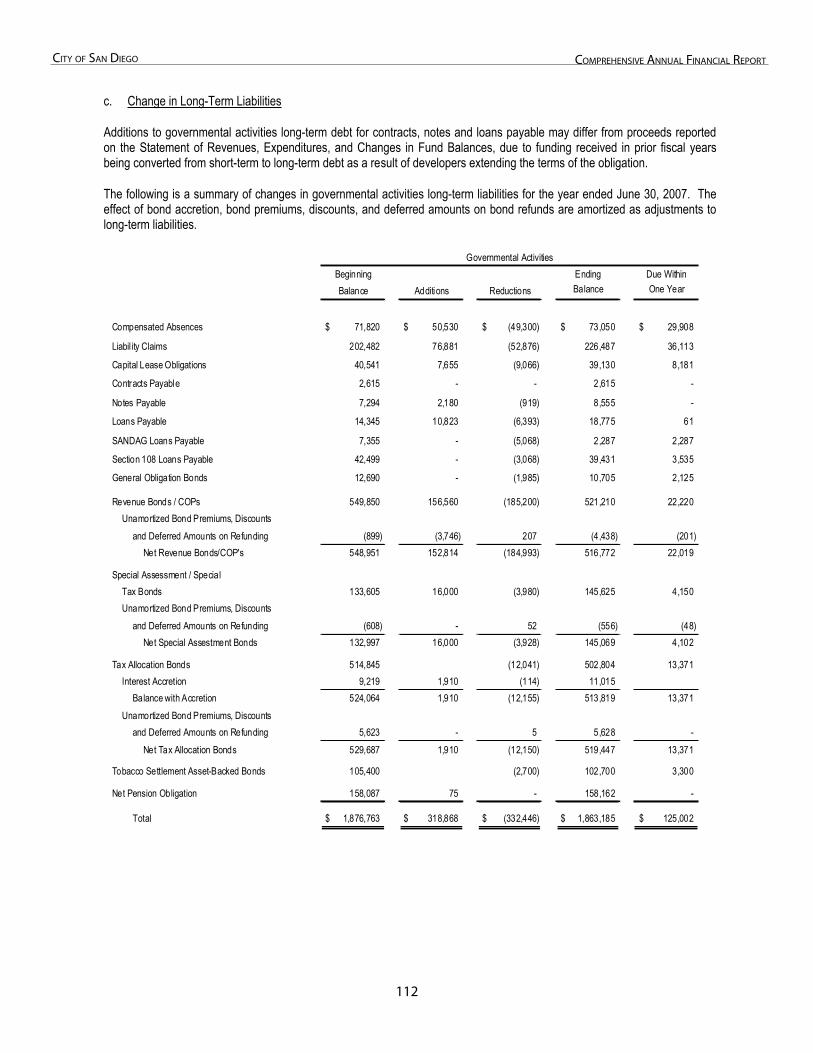
112
City of San Diego ComprehenSive annual finanCial report
c. Change in Long-Term Liabilities
Additions to governmental activities long-term debt for contracts, notes and loans payable may differ from proceeds reported on the Statement of Revenues, Expenditures, and Changes in Fund Balances, due to funding received in prior fiscal years being converted from short-term to long-term debt as a result of developers extending the terms of the obligation.
The following is a summary of changes in governmental activities long-term liabilities for the year ended June 30, 2007. The effect of bond accretion, bond premiums, discounts, and deferred amounts on bond refunds are amortized as adjustments to long-term liabilities.
Governmental ActivitiesBeginning Ending Due WithinBalance Additions Reductions Balance One Year
Compensated Absences 71,820$ 50,530$ (49,300)$ 73,050$ 29,908$
Liabil ity Claims 202,482 76,881 (52,876) 226,487 36,113
Capital Lease Obligations 40,541 7,655 (9,066) 39,130 8,181
Contracts Payable 2,615 - - 2,615 -
Notes Payable 7,294 2,180 (919) 8,555 -
Loans Payable 14,345 10,823 (6,393) 18,775 61
SANDAG Loans Payable 7,355 - (5,068) 2,287 2,287
Section 108 Loans Payable 42,499 - (3,068) 39,431 3,535
General Obligation Bonds 12,690 - (1,985) 10,705 2,125
Revenue Bonds / COPs 549,850 156,560 (185,200) 521,210 22,220 Unamortized Bond Premiums, Discounts
and Deferred Amounts on Refunding (899) (3,746) 207 (4,438) (201) Net Revenue Bonds/COP's 548,951 152,814 (184,993) 516,772 22,019
Special Assessment / SpecialTax Bonds 133,605 16,000 (3,980) 145,625 4,150 Unamortized Bond Premiums, Discounts
and Deferred Amounts on Refunding (608) - 52 (556) (48) Net Special Assestment Bonds 132,997 16,000 (3,928) 145,069 4,102
Tax Allocation Bonds 514,845 (12,041) 502,804 13,371 Interest Accretion 9,219 1,910 (114) 11,015
Balance with Accretion 524,064 1,910 (12,155) 513,819 13,371 Unamortized Bond Premiums, Discounts
and Deferred Amounts on Refunding 5,623 - 5 5,628 - Net Tax Allocation Bonds 529,687 1,910 (12,150) 519,447 13,371
Tobacco Settlement Asset-Backed Bonds 105,400 (2,700) 102,700 3,300
Net Pension Obligation 158,087 75 - 158,162 -
Total 1,876,763$ 318,868$ (332,446)$ 1,863,185$ 125,002$
113
City of San Diego ComprehenSive annual finanCial report
d. Redemption of Debt
Lease Revenue Refunding Bonds, Series 2007A (Ballpark Refunding) for PFFA were issued in the amount of $156,560. The bond proceeds were used to refund the remaining outstanding PFFA Lease Revenue Bonds, Series 2002 (Ballpark Project). The refunded bonds are fully redeemed and the corresponding liability has been removed from the Statement of Net Assets. The refunding transaction resulted in a total economic gain of approximately $51,572 and a cash flow savings of approximately $93,017. The refunded bonds were redeemed at a call date prior to the end of the fiscal year, and accordingly, there was no balance outstanding as of June 30, 2007.
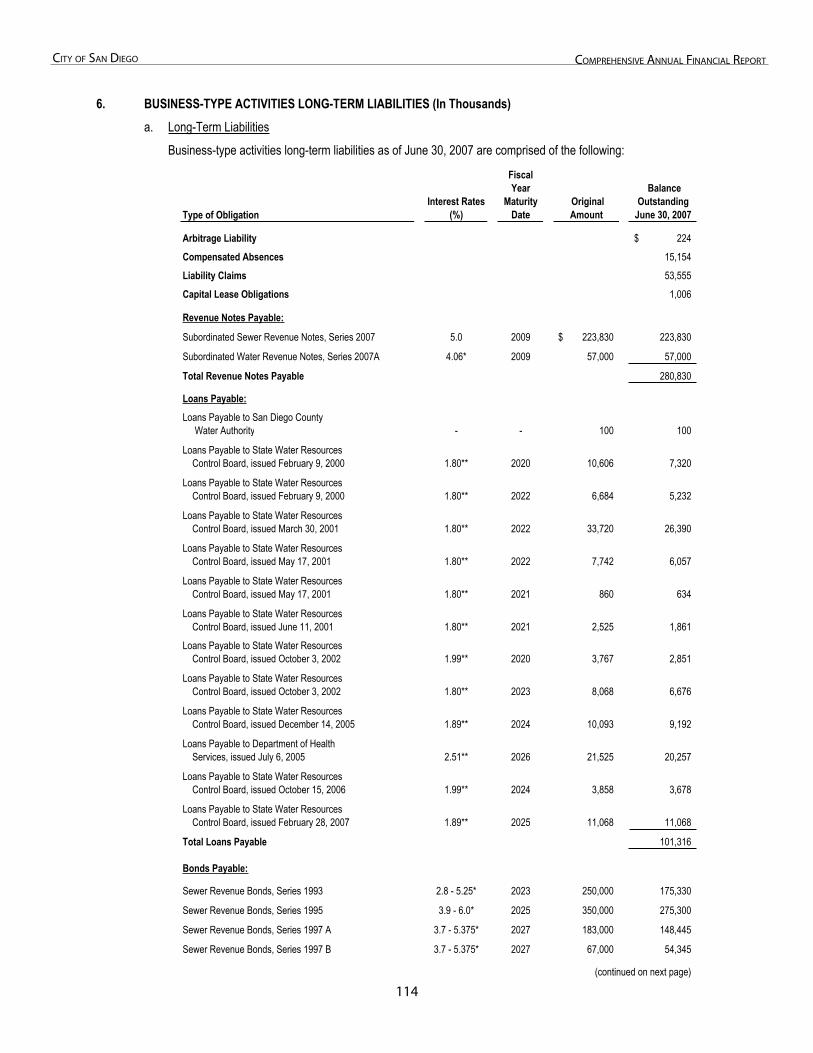
11�
City of San Diego ComprehenSive annual finanCial report
6. Business-Type Activities Long-Term Liabilities
6. BUSINESS-TYPE ACTIVITIES LONG-TERM LIABILITIES (In Thousands) a. Long-Term Liabilities
Business-type activities long-term liabilities as of June 30, 2007 are comprised of the following:
Type of ObligationInterest Rates
(%)
FiscalYear
MaturityDate
Original Amount
Balance Outstanding
June 30, 2007
Arbitrage Liability 224$
Compensated Absences 15,154
Liability Claims 53,555
Capital Lease Obligations 1,006
Revenue Notes Payable:
Subordinated Sewer Revenue Notes, Series 2007 5.0 2009 223,830$ 223,830
Subordinated Water Revenue Notes, Series 2007A 4.06* 2009 57,000 57,000
Total Revenue Notes Payable 280,830
Loans Payable:Loans Payable to San Diego County Water Authority - - 100 100
Loans Payable to State Water Resources Control Board, issued February 9, 2000 1.80** 2020 10,606 7,320
Loans Payable to State Water Resources Control Board, issued February 9, 2000 1.80** 2022 6,684 5,232
Loans Payable to State Water Resources Control Board, issued March 30, 2001 1.80** 2022 33,720 26,390
Loans Payable to State Water Resources Control Board, issued May 17, 2001 1.80** 2022 7,742 6,057
Loans Payable to State Water Resources Control Board, issued May 17, 2001 1.80** 2021 860 634
Loans Payable to State Water Resources Control Board, issued June 11, 2001 1.80** 2021 2,525 1,861
Loans Payable to State Water Resources Control Board, issued October 3, 2002 1.99** 2020 3,767 2,851
Loans Payable to State Water Resources Control Board, issued October 3, 2002 1.80** 2023 8,068 6,676
Loans Payable to State Water Resources Control Board, issued December 14, 2005 1.89** 2024 10,093 9,192
Loans Payable to Department of Health Services, issued July 6, 2005 2.51** 2026 21,525 20,257
Loans Payable to State Water Resources Control Board, issued October 15, 2006 1.99** 2024 3,858 3,678
Loans Payable to State Water Resources Control Board, issued February 28, 2007 1.89** 2025 11,068 11,068
Total Loans Payable 101,316
Bonds Payable:
Sewer Revenue Bonds, Series 1993 2.8 - 5.25* 2023 250,000 175,330
Sewer Revenue Bonds, Series 1995 3.9 - 6.0* 2025 350,000 275,300
Sewer Revenue Bonds, Series 1997 A 3.7 - 5.375* 2027 183,000 148,445
Sewer Revenue Bonds, Series 1997 B 3.7 - 5.375* 2027 67,000 54,345
(continued on next page)
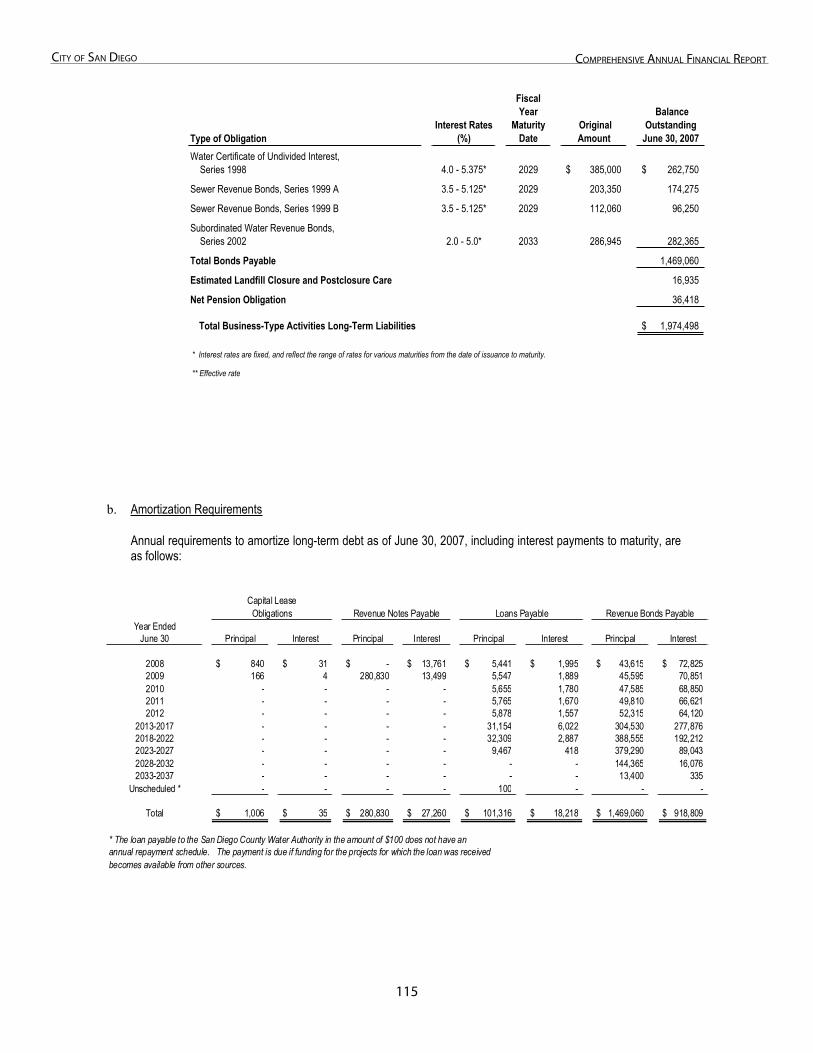
11�
City of San Diego ComprehenSive annual finanCial report
b. Amortization Requirements
Annual requirements to amortize long-term debt as of June 30, 2007, including interest payments to maturity, are as follows:
Capital LeaseObligations Revenue Notes Payable Loans Payable Revenue Bonds Payable
Year EndedJune 30 Principal Interest Principal Interest Principal Interest Principal Interest
2008 840$ 31$ -$ 13,761$ 5,441$ 1,995$ 43,615$ 72,825$ 2009 166 4 280,830 13,499 5,547 1,889 45,595 70,851 2010 - - - - 5,655 1,780 47,585 68,850 2011 - - - - 5,765 1,670 49,810 66,621 2012 - - - - 5,878 1,557 52,315 64,120
2013-2017 - - - - 31,154 6,022 304,530 277,876 2018-2022 - - - - 32,309 2,887 388,555 192,212 2023-2027 - - - - 9,467 418 379,290 89,043 2028-2032 - - - - - - 144,365 16,076 2033-2037 - - - - - - 13,400 335
Unscheduled * - - - - 100 - - -
Total 1,006$ 35$ 280,830$ 27,260$ 101,316$ 18,218$ 1,469,060$ 918,809$
* The loan payable to the San Diego County Water Authority in the amount of $100 does not have anannual repayment schedule. The payment is due if funding for the projects for which the loan was receivedbecomes available from other sources.
Type of ObligationInterest Rates
(%)
FiscalYear
MaturityDate
Original Amount
Balance Outstanding
June 30, 2007 Water Certificate of Undivided Interest, Series 1998 4.0 - 5.375* 2029 385,000$ 262,750$
Sewer Revenue Bonds, Series 1999 A 3.5 - 5.125* 2029 203,350 174,275
Sewer Revenue Bonds, Series 1999 B 3.5 - 5.125* 2029 112,060 96,250
Subordinated Water Revenue Bonds, Series 2002 2.0 - 5.0* 2033 286,945 282,365
Total Bonds Payable 1,469,060
Estimated Landfill Closure and Postclosure Care 16,935
Net Pension Obligation 36,418
Total Business-Type Activities Long-Term Liabilities 1,974,498$
* Interest rates are fixed, and reflect the range of rates for various maturities from the date of issuance to maturity.
** Effective rate
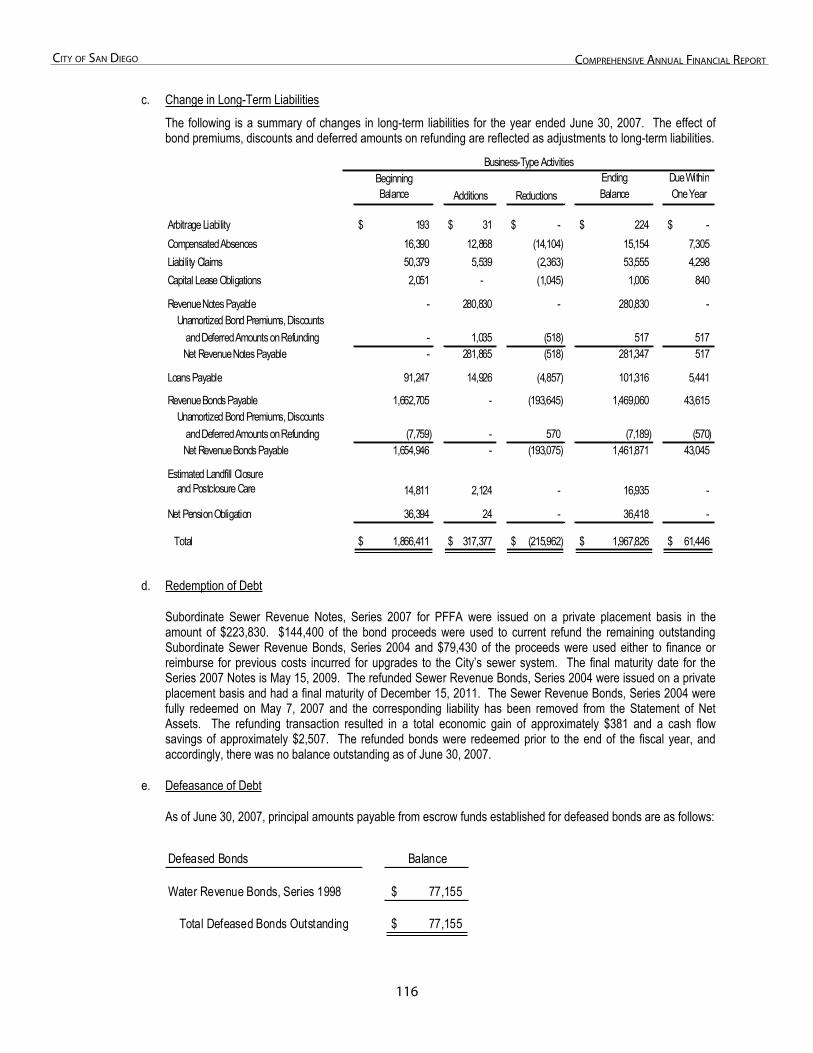
11�
City of San Diego ComprehenSive annual finanCial report
c. Change in Long-Term Liabilities
The following is a summary of changes in long-term liabilities for the year ended June 30, 2007. The effect of bond premiums, discounts and deferred amounts on refunding are reflected as adjustments to long-term liabilities.
Beginning Ending Due WithinBalance Additions Reductions Balance One Year
Arbitrage Liability 193$ 31$ -$ 224$ -$ Compensated Absences 16,390 12,868 (14,104) 15,154 7,305 Liability Claims 50,379 5,539 (2,363) 53,555 4,298 Capital Lease Obligations 2,051 - (1,045) 1,006 840
Revenue Notes Payable - 280,830 - 280,830 - Unamortized Bond Premiums, Discounts
and Deferred Amounts on Refunding - 1,035 (518) 517 517 Net Revenue Notes Payable - 281,865 (518) 281,347 517
Loans Payable 91,247 14,926 (4,857) 101,316 5,441
Revenue Bonds Payable 1,662,705 - (193,645) 1,469,060 43,615 Unamortized Bond Premiums, Discounts
and Deferred Amounts on Refunding (7,759) - 570 (7,189) (570) Net Revenue Bonds Payable 1,654,946 - (193,075) 1,461,871 43,045
Estimated Landfill Closureand Postclosure Care 14,811 2,124 - 16,935 -
Net Pension Obligation 36,394 24 - 36,418 -
Total 1,866,411$ 317,377$ (215,962)$ 1,967,826$ 61,446$
Business-Type Activities
d. Redemption of Debt
Subordinate Sewer Revenue Notes, Series 2007 for PFFA were issued on a private placement basis in the amount of $223,830. $144,400 of the bond proceeds were used to current refund the remaining outstanding Subordinate Sewer Revenue Bonds, Series 2004 and $79,430 of the proceeds were used either to finance or reimburse for previous costs incurred for upgrades to the City’s sewer system. The final maturity date for the Series 2007 Notes is May 15, 2009. The refunded Sewer Revenue Bonds, Series 2004 were issued on a private placement basis and had a final maturity of December 15, 2011. The Sewer Revenue Bonds, Series 2004 were fully redeemed on May 7, 2007 and the corresponding liability has been removed from the Statement of Net Assets. The refunding transaction resulted in a total economic gain of approximately $381 and a cash flow savings of approximately $2,507. The refunded bonds were redeemed prior to the end of the fiscal year, and accordingly, there was no balance outstanding as of June 30, 2007.
e. Defeasance of Debt
As of June 30, 2007, principal amounts payable from escrow funds established for defeased bonds are as follows:
Defeased Bonds Balance
Water Revenue Bonds, Series 1998 77,155$
Total Defeased Bonds Outstanding 77,155$
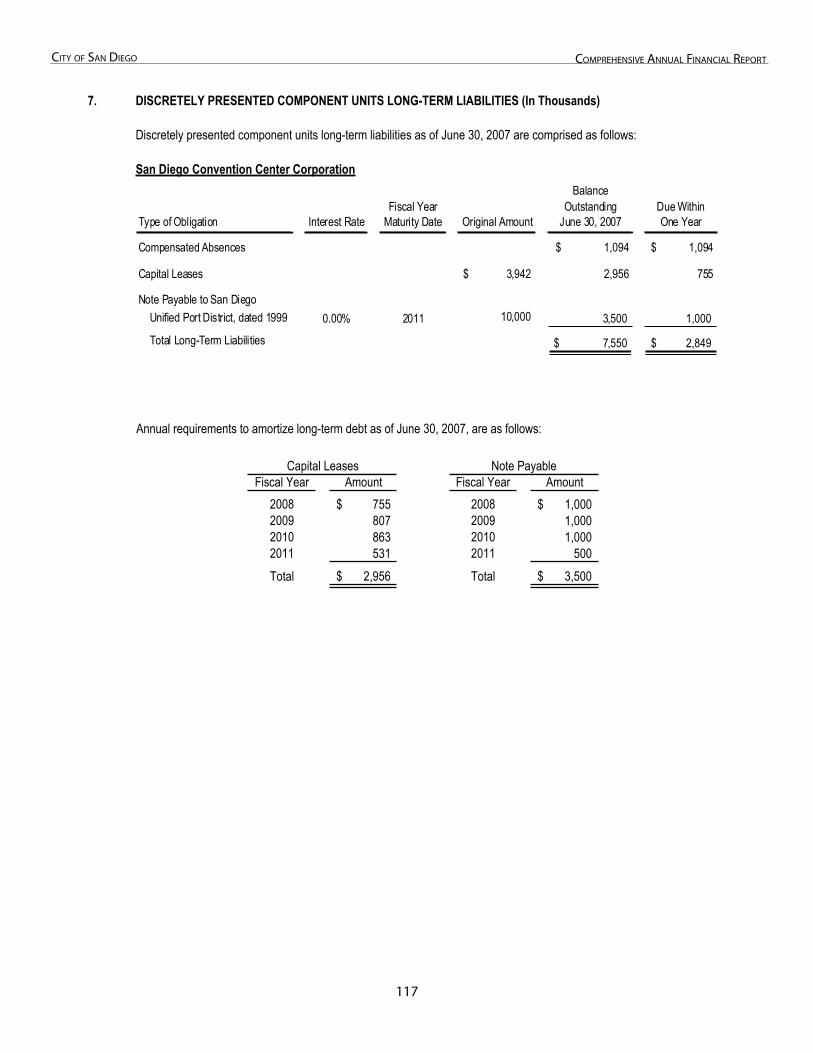
117
City of San Diego ComprehenSive annual finanCial report
7. Discretely Presented Component Units Long-Term Liabilities
7. DISCRETELY PRESENTED COMPONENT UNITS LONG-TERM LIABILITIES (In Thousands)
Discretely presented component units long-term liabilities as of June 30, 2007 are comprised as follows:
San Diego Convention Center Corporation
Type of Obligation Interest RateFiscal Year
Maturity Date Original Amount
Balance Outstanding
June 30, 2007Due Within One Year
Compensated Absences $ 1,094 $ 1,094
Capital Leases $ 3,942 2,956 755
Note Payable to San Diego0.00% 2011 10,000 3,500 1,000
Total Long-Term Liabilities 7,550$ 2,849$
Unified Port District, dated 1999
Annual requirements to amortize long-term debt as of June 30, 2007, are as follows:
Capital Leases Note PayableFiscal Year Amount Fiscal Year Amount
2008 755$ 2008 1,000$2009 807 2009 1,000 2010 863 2010 1,000 2011 531 2011 500 Total 2,956$ Total 3,500$
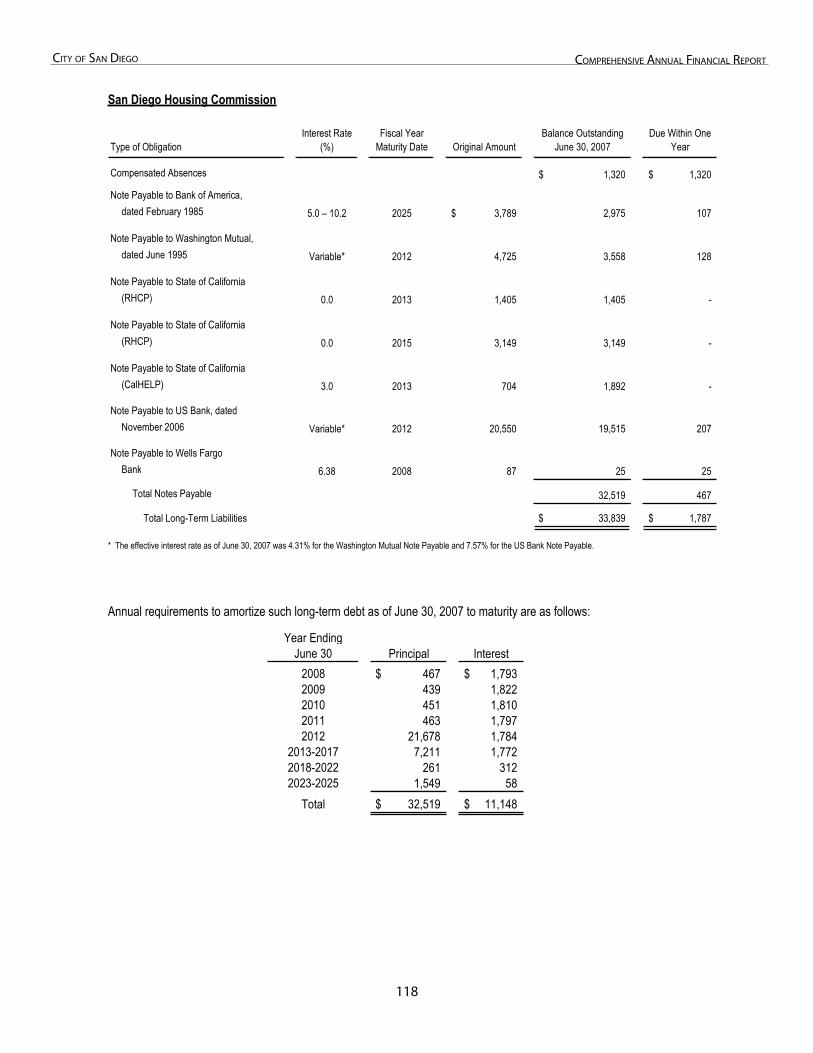
118
City of San Diego ComprehenSive annual finanCial report
San Diego Housing Commission
Type of ObligationInterest Rate
(%)Fiscal Year
Maturity Date Original AmountBalance Outstanding
June 30, 2007Due Within One
Year
Compensated Absences 1,320$ 1,320$
Note Payable to Bank of America,dated February 1985 5.0 – 10.2 2025 3,789$ 2,975 107
Note Payable to Washington Mutual,dated June 1995 Variable* 2012 4,725 3,558 128
Note Payable to State of California(RHCP) 0.0 2013 1,405 1,405 -
Note Payable to State of California(RHCP) 0.0 2015 3,149 3,149 -
Note Payable to State of California(CalHELP) 3.0 2013 704 1,892 -
Note Payable to US Bank, datedNovember 2006 Variable* 2012 20,550 19,515 207
Note Payable to Wells FargoBank 6.38 2008 87 25 25
Total Notes Payable 32,519 467
Total Long-Term Liabilities 33,839$ 1,787$
* The effective interest rate as of June 30, 2007 was 4.31% for the Washington Mutual Note Payable and 7.57% for the US Bank Note Payable.
Annual requirements to amortize such long-term debt as of June 30, 2007 to maturity are as follows:
Year EndingJune 30
2008 467$ 1,793$ 2009 439 1,8222010 451 1,8102011 463 1,7972012 21,678 1,784
2013-2017 7,211 1,7722018-2022 261 3122023-2025 1,549 58
Total 32,519$ 11,148$
Principal Interest
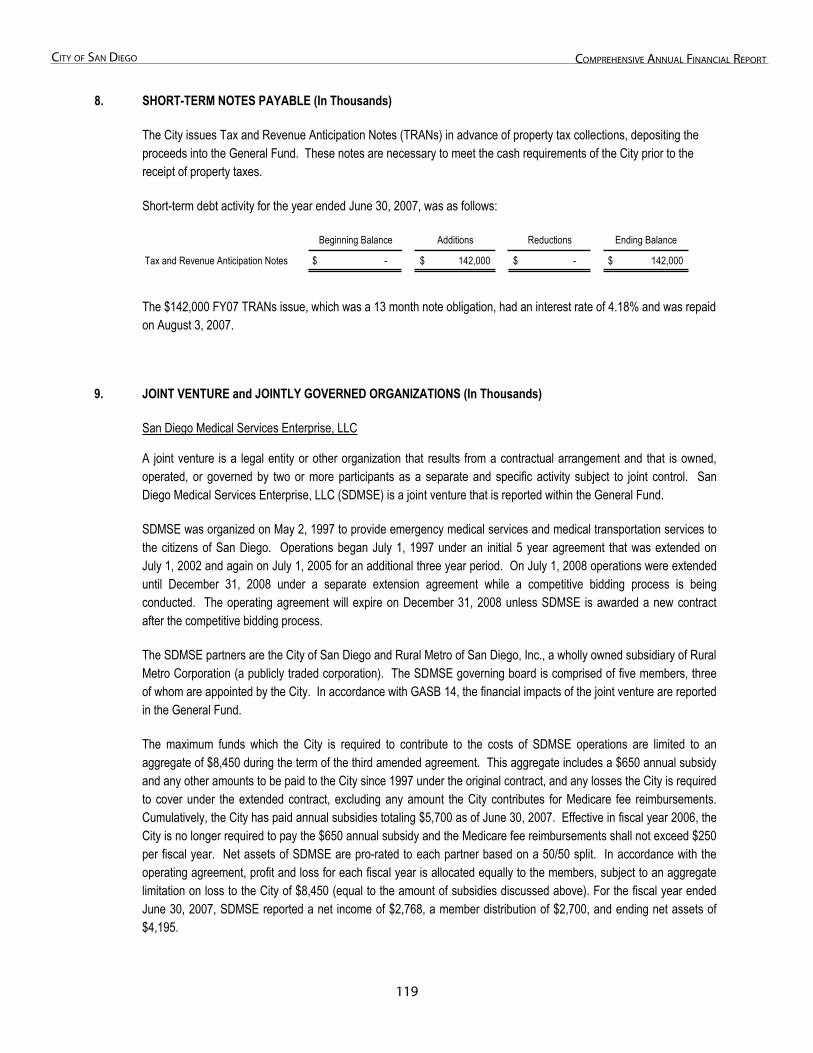
11�
City of San Diego ComprehenSive annual finanCial report
8. Short-Term Notes Payable
8. SHORT-TERM NOTES PAYABLE (In Thousands)
The City issues Tax and Revenue Anticipation Notes (TRANs) in advance of property tax collections, depositing the proceeds into the General Fund. These notes are necessary to meet the cash requirements of the City prior to the receipt of property taxes.
Short-term debt activity for the year ended June 30, 2007, was as follows:
Beginning Balance Additions Reductions Ending Balance
Tax and Revenue Anticipation Notes -$ 142,000$ -$ 142,000$
The $142,000 FY07 TRANs issue, which was a 13 month note obligation, had an interest rate of 4.18% and was repaid on August 3, 2007.
9. Joint Venture and Jointly Governed Organizations
9. JOINT VENTURE and JOINTLY GOVERNED ORGANIZATIONS (In Thousands)
San Diego Medical Services Enterprise, LLC
A joint venture is a legal entity or other organization that results from a contractual arrangement and that is owned, operated, or governed by two or more participants as a separate and specific activity subject to joint control. San Diego Medical Services Enterprise, LLC (SDMSE) is a joint venture that is reported within the General Fund.
SDMSE was organized on May 2, 1997 to provide emergency medical services and medical transportation services to the citizens of San Diego. Operations began July 1, 1997 under an initial 5 year agreement that was extended on July 1, 2002 and again on July 1, 2005 for an additional three year period. On July 1, 2008 operations were extended until December 31, 2008 under a separate extension agreement while a competitive bidding process is being conducted. The operating agreement will expire on December 31, 2008 unless SDMSE is awarded a new contract after the competitive bidding process.
The SDMSE partners are the City of San Diego and Rural Metro of San Diego, Inc., a wholly owned subsidiary of Rural Metro Corporation (a publicly traded corporation). The SDMSE governing board is comprised of five members, three of whom are appointed by the City. In accordance with GASB 14, the financial impacts of the joint venture are reported in the General Fund.
The maximum funds which the City is required to contribute to the costs of SDMSE operations are limited to an aggregate of $8,450 during the term of the third amended agreement. This aggregate includes a $650 annual subsidy and any other amounts to be paid to the City since 1997 under the original contract, and any losses the City is required to cover under the extended contract, excluding any amount the City contributes for Medicare fee reimbursements. Cumulatively, the City has paid annual subsidies totaling $5,700 as of June 30, 2007. Effective in fiscal year 2006, the City is no longer required to pay the $650 annual subsidy and the Medicare fee reimbursements shall not exceed $250 per fiscal year. Net assets of SDMSE are pro-rated to each partner based on a 50/50 split. In accordance with the operating agreement, profit and loss for each fiscal year is allocated equally to the members, subject to an aggregate limitation on loss to the City of $8,450 (equal to the amount of subsidies discussed above). For the fiscal year ended June 30, 2007, SDMSE reported a net income of $2,768, a member distribution of $2,700, and ending net assets of $4,195.
120
City of San Diego ComprehenSive annual finanCial report
Under the terms of an operating agreement between Rural/Metro of San Diego, Inc. and SDMSE, Rural/Metro of San Diego, Inc. has made available a line-of-credit in the initial amount of $3,500 bearing an interest rate of 9.5%. SDMSE did not have an outstanding balance, nor did it borrow on the line-of-credit at June 30, 2007.
Complete financial statements can be requested from San Diego Medical Services Enterprise, LLC, 8401 East Indian School Rd., Scottsdale, Arizona 85251.
San Diego Workforce Partnership
The City of San Diego and the County of San Diego jointly govern the San Diego Workforce Partnership (Consortium). The Consortium’s Board of Directors consists of two members of the City Council, two members from the County Board of Supervisors, and one member of a charitable organization. The purpose of the Consortium is to provide regional employment and training services in order to develop and create job opportunities throughout San Diego County. The Consortium is empowered to make applications for and receive grants from governmental or private sources. The City does not appoint a majority of the Board, is not able to impose its will on the Consortium, and the Consortium is not fiscally dependent on the City. Therefore, it is the City’s conclusion that the Consortium is a governmental organization with a jointly appointed board and not a component unit of the City. However, the City and County do share a joint responsibility for any liabilities arising from mismanagement of federal funds. The United States Department of Labor (DOL) issued an audit report in February 2007, finding that the Consortium did not consistently follow Federal cost principles and regulations when managing federal grant funds. A settlement was reached between the Consortium and the DOL in June 2008 which resulted in a liability of approximately $1,100 payable to the DOL for the disallowed project costs. This liability will be split between the City and County and paid over a four year period. City Council approved the first payment of $67 (city’s share) to the DOL on October 14, 2008 per resolution 304261.
Complete financial statements can be requested from San Diego Workforce Partnership, Inc. 3910 University Avenue, Suite 400, San Diego, CA 92105.
San Diego Geographic Information Source (SanGIS)
SanGIS was created in July 1997 as a joint powers agreement between the City of San Diego and the County of San Diego. SanGIS objectives are to create and maintain a geographic information system, marketing and licensing compiled digital geographic data and software, providing technical services and publishing geographical and land-related information.
Complete financial statements can be requested from SanGIS, 5469 Kearney Villa Road, Suite 102, San Diego, CA 92123.
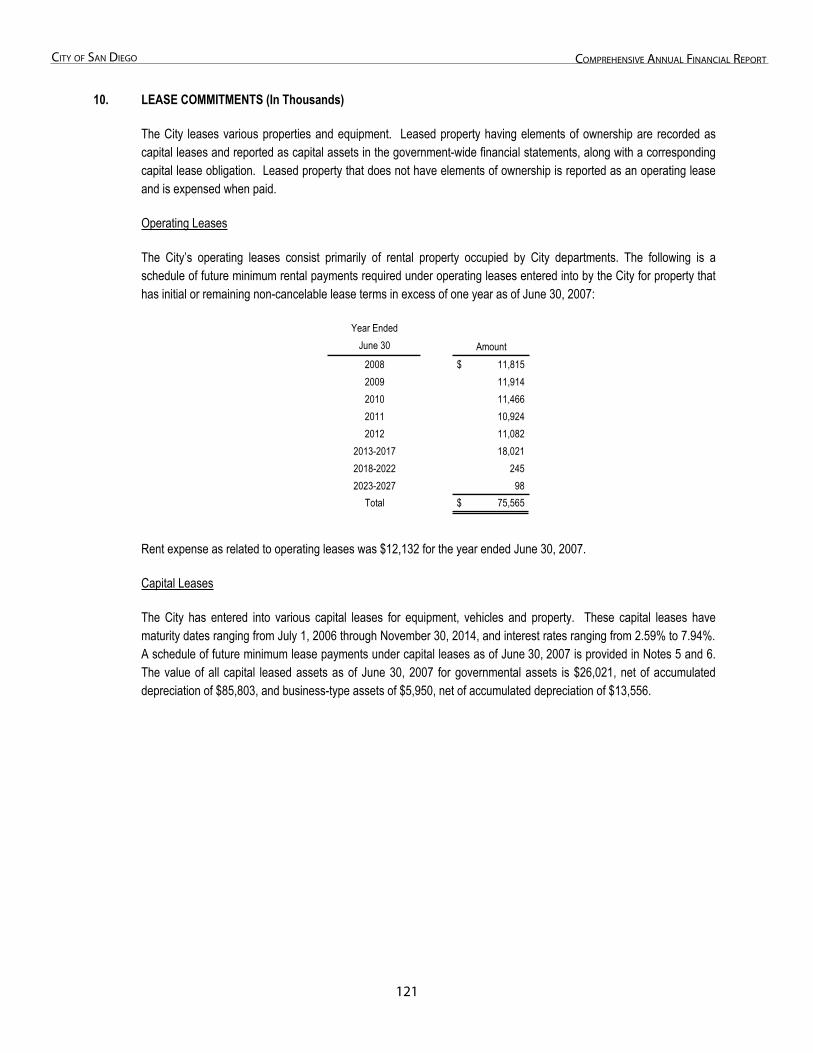
121
City of San Diego ComprehenSive annual finanCial report
10. Lease Commitments
10. LEASE COMMITMENTS (In Thousands)
The City leases various properties and equipment. Leased property having elements of ownership are recorded as capital leases and reported as capital assets in the government-wide financial statements, along with a corresponding capital lease obligation. Leased property that does not have elements of ownership is reported as an operating lease and is expensed when paid.
Operating Leases
The City’s operating leases consist primarily of rental property occupied by City departments. The following is a schedule of future minimum rental payments required under operating leases entered into by the City for property that has initial or remaining non-cancelable lease terms in excess of one year as of June 30, 2007:
Year EndedJune 30
2008 11,815$ 2009 11,914 2010 11,466 2011 10,924 2012 11,082
2013-2017 18,021 2018-2022 245 2023-2027 98
Total 75,565$
Amount
Rent expense as related to operating leases was $12,132 for the year ended June 30, 2007.
Capital Leases
The City has entered into various capital leases for equipment, vehicles and property. These capital leases have maturity dates ranging from July 1, 2006 through November 30, 2014, and interest rates ranging from 2.59% to 7.94%. A schedule of future minimum lease payments under capital leases as of June 30, 2007 is provided in Notes 5 and 6. The value of all capital leased assets as of June 30, 2007 for governmental assets is $26,021, net of accumulated depreciation of $85,803, and business-type assets of $5,950, net of accumulated depreciation of $13,556.
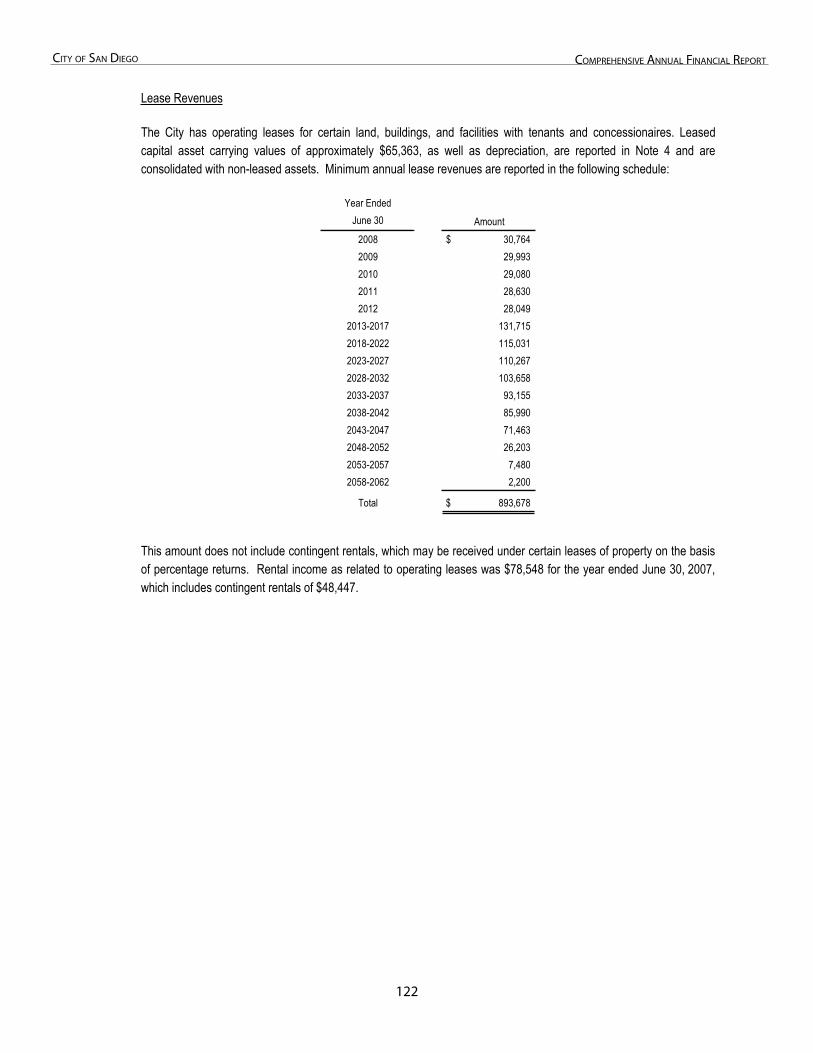
122
City of San Diego ComprehenSive annual finanCial report
Lease Revenues
The City has operating leases for certain land, buildings, and facilities with tenants and concessionaires. Leased capital asset carrying values of approximately $65,363, as well as depreciation, are reported in Note 4 and are consolidated with non-leased assets. Minimum annual lease revenues are reported in the following schedule:
Year EndedJune 30
2008 30,764$ 2009 29,993 2010 29,080 2011 28,630 2012 28,049
2013-2017 131,715 2018-2022 115,031 2023-2027 110,267 2028-2032 103,658 2033-2037 93,155 2038-2042 85,990 2043-2047 71,463 2048-2052 26,203 2053-2057 7,480 2058-2062 2,200
Total 893,678$
Amount
This amount does not include contingent rentals, which may be received under certain leases of property on the basis of percentage returns. Rental income as related to operating leases was $78,548 for the year ended June 30, 2007, which includes contingent rentals of $48,447.
123
City of San Diego ComprehenSive annual finanCial report
11. Deferred Compensation Plan
11. DEFERRED COMPENSATION PLAN (In Thousands)
The City, San Diego Convention Center Corporation (SDCCC), San Diego Data Processing Corporation (SDDPC), and San Diego Housing Commission (SDHC) each offer their employees a deferred compensation plan, created in accordance with Internal Revenue Service Code Section 457, State and Local Government Deferred Compensation Plans. These plans, available to eligible employees, permit them to defer, pre-tax, a portion of their salary until future years. Deferred compensation is not available to employees until termination, retirement, death, disability, or an unforeseeable emergency. All assets and income of the deferred compensation plan are held in trust for the exclusive benefit of plan participants and their beneficiaries. The deferred compensation plans are not considered part of the City of San Diego’s financial reporting entity.
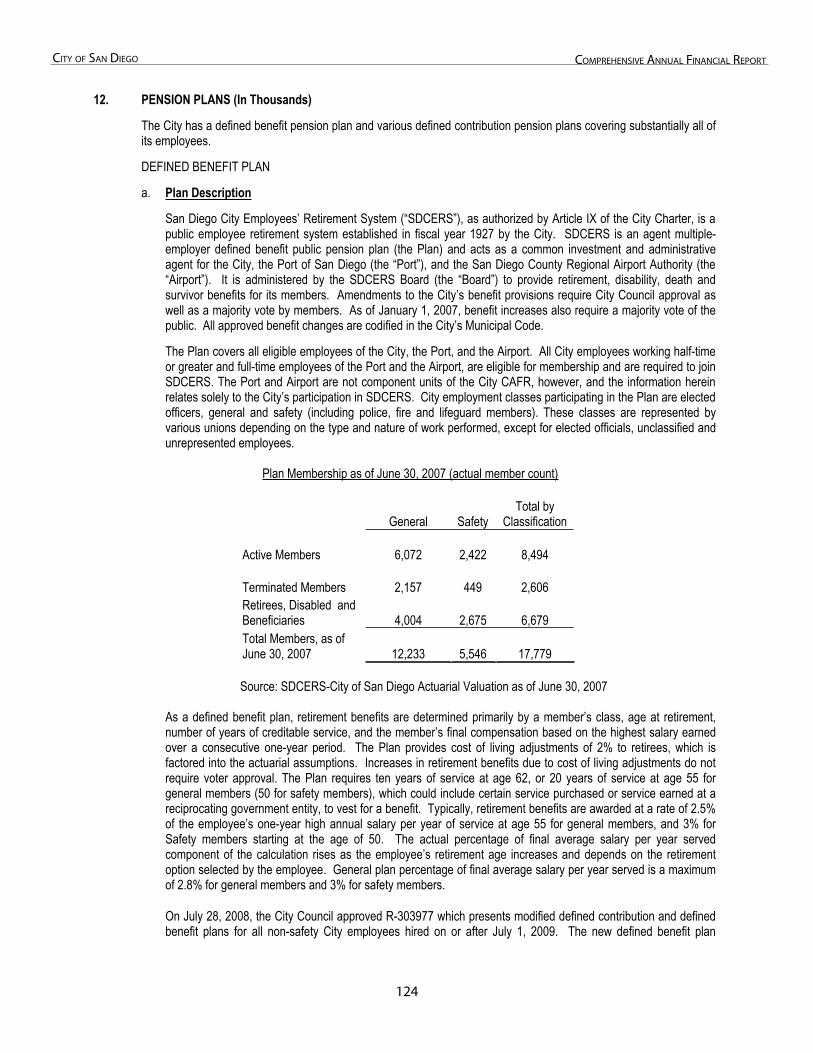
12�
City of San Diego ComprehenSive annual finanCial report
12. Pension Plans
12. PENSION PLANS (In Thousands)
The City has a defined benefit pension plan and various defined contribution pension plans covering substantially all of its employees.
DEFINED BENEFIT PLAN
a. Plan Description
San Diego City Employees’ Retirement System (“SDCERS”), as authorized by Article IX of the City Charter, is a public employee retirement system established in fiscal year 1927 by the City. SDCERS is an agent multiple-employer defined benefit public pension plan (the Plan) and acts as a common investment and administrative agent for the City, the Port of San Diego (the “Port”), and the San Diego County Regional Airport Authority (the “Airport”). It is administered by the SDCERS Board (the “Board”) to provide retirement, disability, death and survivor benefits for its members. Amendments to the City’s benefit provisions require City Council approval as well as a majority vote by members. As of January 1, 2007, benefit increases also require a majority vote of the public. All approved benefit changes are codified in the City’s Municipal Code.
The Plan covers all eligible employees of the City, the Port, and the Airport. All City employees working half-time or greater and full-time employees of the Port and the Airport, are eligible for membership and are required to join SDCERS. The Port and Airport are not component units of the City CAFR, however, and the information herein relates solely to the City’s participation in SDCERS. City employment classes participating in the Plan are elected officers, general and safety (including police, fire and lifeguard members). These classes are represented by various unions depending on the type and nature of work performed, except for elected officials, unclassified and unrepresented employees.
Plan Membership as of June 30, 2007 (actual member count)
General SafetyTotal by
Classification
Active Members 6,072 2,422 8,494
Terminated Members 2,157 449 2,606Retirees, Disabled and Beneficiaries 4,004 2,675 6,679Total Members, as of June 30, 2007 12,233 5,546 17,779
Source: SDCERS-City of San Diego Actuarial Valuation as of June 30, 2007 As a defined benefit plan, retirement benefits are determined primarily by a member’s class, age at retirement, number of years of creditable service, and the member’s final compensation based on the highest salary earned over a consecutive one-year period. The Plan provides cost of living adjustments of 2% to retirees, which is factored into the actuarial assumptions. Increases in retirement benefits due to cost of living adjustments do not require voter approval. The Plan requires ten years of service at age 62, or 20 years of service at age 55 for general members (50 for safety members), which could include certain service purchased or service earned at a reciprocating government entity, to vest for a benefit. Typically, retirement benefits are awarded at a rate of 2.5% of the employee’s one-year high annual salary per year of service at age 55 for general members, and 3% for Safety members starting at the age of 50. The actual percentage of final average salary per year served component of the calculation rises as the employee’s retirement age increases and depends on the retirement option selected by the employee. General plan percentage of final average salary per year served is a maximum of 2.8% for general members and 3% for safety members.
On July 28, 2008, the City Council approved R-303977 which presents modified defined contribution and defined benefit plans for all non-safety City employees hired on or after July 1, 2009. The new defined benefit plan
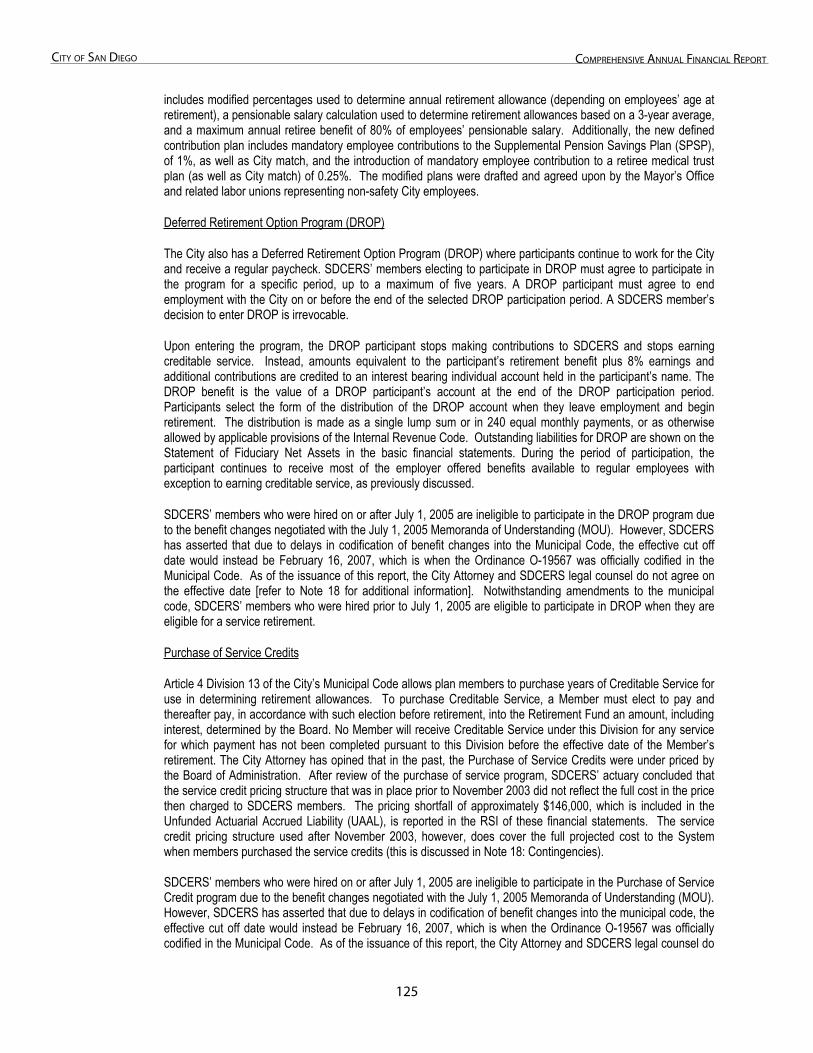
12�
City of San Diego ComprehenSive annual finanCial report
includes modified percentages used to determine annual retirement allowance (depending on employees’ age at retirement), a pensionable salary calculation used to determine retirement allowances based on a 3-year average, and a maximum annual retiree benefit of 80% of employees’ pensionable salary. Additionally, the new defined contribution plan includes mandatory employee contributions to the Supplemental Pension Savings Plan (SPSP), of 1%, as well as City match, and the introduction of mandatory employee contribution to a retiree medical trust plan (as well as City match) of 0.25%. The modified plans were drafted and agreed upon by the Mayor’s Office and related labor unions representing non-safety City employees.
Deferred Retirement Option Program (DROP)
The City also has a Deferred Retirement Option Program (DROP) where participants continue to work for the City and receive a regular paycheck. SDCERS’ members electing to participate in DROP must agree to participate in the program for a specific period, up to a maximum of five years. A DROP participant must agree to end employment with the City on or before the end of the selected DROP participation period. A SDCERS member’s decision to enter DROP is irrevocable.
Upon entering the program, the DROP participant stops making contributions to SDCERS and stops earning creditable service. Instead, amounts equivalent to the participant’s retirement benefit plus 8% earnings and additional contributions are credited to an interest bearing individual account held in the participant’s name. The DROP benefit is the value of a DROP participant’s account at the end of the DROP participation period. Participants select the form of the distribution of the DROP account when they leave employment and begin retirement. The distribution is made as a single lump sum or in 240 equal monthly payments, or as otherwise allowed by applicable provisions of the Internal Revenue Code. Outstanding liabilities for DROP are shown on the Statement of Fiduciary Net Assets in the basic financial statements. During the period of participation, the participant continues to receive most of the employer offered benefits available to regular employees with exception to earning creditable service, as previously discussed.
SDCERS’ members who were hired on or after July 1, 2005 are ineligible to participate in the DROP program due to the benefit changes negotiated with the July 1, 2005 Memoranda of Understanding (MOU). However, SDCERS has asserted that due to delays in codification of benefit changes into the Municipal Code, the effective cut off date would instead be February 16, 2007, which is when the Ordinance O-19567 was officially codified in the Municipal Code. As of the issuance of this report, the City Attorney and SDCERS legal counsel do not agree on the effective date [refer to Note 18 for additional information]. Notwithstanding amendments to the municipal code, SDCERS’ members who were hired prior to July 1, 2005 are eligible to participate in DROP when they are eligible for a service retirement.
Purchase of Service Credits
Article 4 Division 13 of the City’s Municipal Code allows plan members to purchase years of Creditable Service for use in determining retirement allowances. To purchase Creditable Service, a Member must elect to pay and thereafter pay, in accordance with such election before retirement, into the Retirement Fund an amount, including interest, determined by the Board. No Member will receive Creditable Service under this Division for any service for which payment has not been completed pursuant to this Division before the effective date of the Member’s retirement. The City Attorney has opined that in the past, the Purchase of Service Credits were under priced by the Board of Administration. After review of the purchase of service program, SDCERS’ actuary concluded that the service credit pricing structure that was in place prior to November 2003 did not reflect the full cost in the price then charged to SDCERS members. The pricing shortfall of approximately $146,000, which is included in the Unfunded Actuarial Accrued Liability (UAAL), is reported in the RSI of these financial statements. The service credit pricing structure used after November 2003, however, does cover the full projected cost to the System when members purchased the service credits (this is discussed in Note 18: Contingencies).
SDCERS’ members who were hired on or after July 1, 2005 are ineligible to participate in the Purchase of Service Credit program due to the benefit changes negotiated with the July 1, 2005 Memoranda of Understanding (MOU). However, SDCERS has asserted that due to delays in codification of benefit changes into the municipal code, the effective cut off date would instead be February 16, 2007, which is when the Ordinance O-19567 was officially codified in the Municipal Code. As of the issuance of this report, the City Attorney and SDCERS legal counsel do
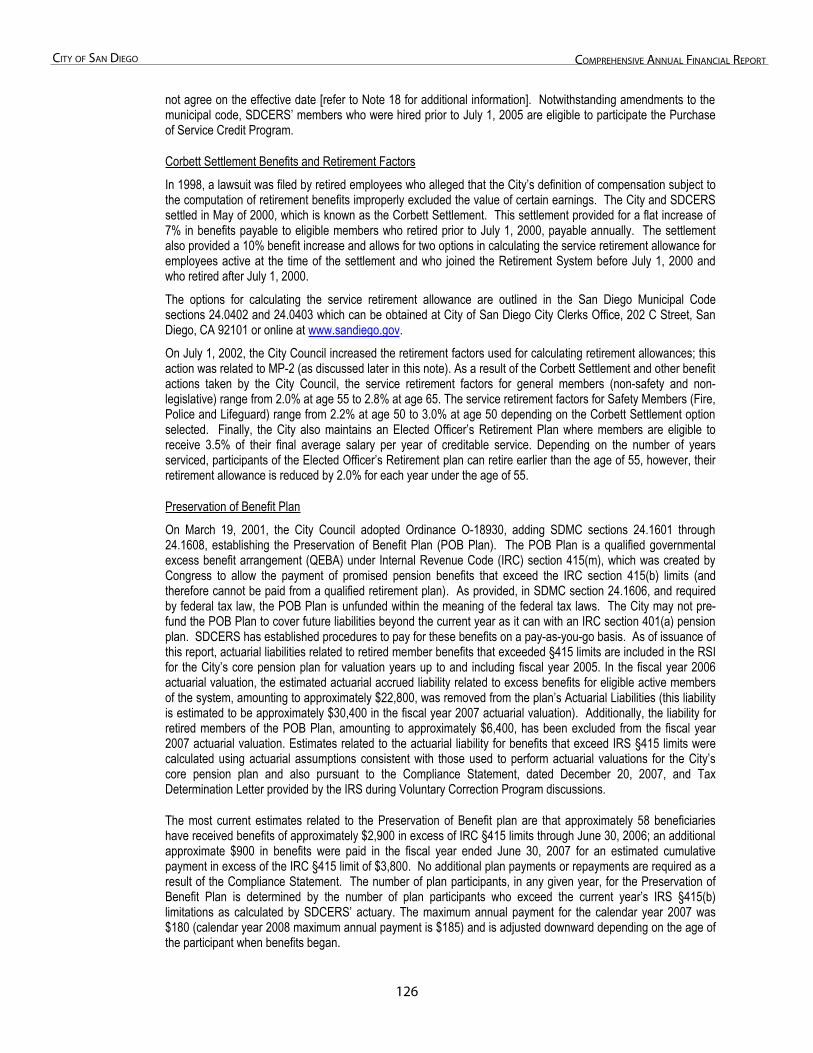
12�
City of San Diego ComprehenSive annual finanCial report
not agree on the effective date [refer to Note 18 for additional information]. Notwithstanding amendments to the municipal code, SDCERS’ members who were hired prior to July 1, 2005 are eligible to participate the Purchase of Service Credit Program.
Corbett Settlement Benefits and Retirement Factors
In 1998, a lawsuit was filed by retired employees who alleged that the City’s definition of compensation subject to the computation of retirement benefits improperly excluded the value of certain earnings. The City and SDCERS settled in May of 2000, which is known as the Corbett Settlement. This settlement provided for a flat increase of 7% in benefits payable to eligible members who retired prior to July 1, 2000, payable annually. The settlement also provided a 10% benefit increase and allows for two options in calculating the service retirement allowance for employees active at the time of the settlement and who joined the Retirement System before July 1, 2000 and who retired after July 1, 2000.
The options for calculating the service retirement allowance are outlined in the San Diego Municipal Code sections 24.0402 and 24.0403 which can be obtained at City of San Diego City Clerks Office, 202 C Street, San Diego, CA 92101 or online at www.sandiego.gov.
On July 1, 2002, the City Council increased the retirement factors used for calculating retirement allowances; this action was related to MP-2 (as discussed later in this note). As a result of the Corbett Settlement and other benefit actions taken by the City Council, the service retirement factors for general members (non-safety and non-legislative) range from 2.0% at age 55 to 2.8% at age 65. The service retirement factors for Safety Members (Fire, Police and Lifeguard) range from 2.2% at age 50 to 3.0% at age 50 depending on the Corbett Settlement option selected. Finally, the City also maintains an Elected Officer’s Retirement Plan where members are eligible to receive 3.5% of their final average salary per year of creditable service. Depending on the number of years serviced, participants of the Elected Officer’s Retirement plan can retire earlier than the age of 55, however, their retirement allowance is reduced by 2.0% for each year under the age of 55.
Preservation of Benefit PlanOn March 19, 2001, the City Council adopted Ordinance O-18930, adding SDMC sections 24.1601 through 24.1608, establishing the Preservation of Benefit Plan (POB Plan). The POB Plan is a qualified governmental excess benefit arrangement (QEBA) under Internal Revenue Code (IRC) section 415(m), which was created by Congress to allow the payment of promised pension benefits that exceed the IRC section 415(b) limits (and therefore cannot be paid from a qualified retirement plan). As provided, in SDMC section 24.1606, and required by federal tax law, the POB Plan is unfunded within the meaning of the federal tax laws. The City may not pre-fund the POB Plan to cover future liabilities beyond the current year as it can with an IRC section 401(a) pension plan. SDCERS has established procedures to pay for these benefits on a pay-as-you-go basis. As of issuance of this report, actuarial liabilities related to retired member benefits that exceeded §415 limits are included in the RSI for the City’s core pension plan for valuation years up to and including fiscal year 2005. In the fiscal year 2006 actuarial valuation, the estimated actuarial accrued liability related to excess benefits for eligible active members of the system, amounting to approximately $22,800, was removed from the plan’s Actuarial Liabilities (this liability is estimated to be approximately $30,400 in the fiscal year 2007 actuarial valuation). Additionally, the liability for retired members of the POB Plan, amounting to approximately $6,400, has been excluded from the fiscal year 2007 actuarial valuation. Estimates related to the actuarial liability for benefits that exceed IRS §415 limits were calculated using actuarial assumptions consistent with those used to perform actuarial valuations for the City’s core pension plan and also pursuant to the Compliance Statement, dated December 20, 2007, and Tax Determination Letter provided by the IRS during Voluntary Correction Program discussions.
The most current estimates related to the Preservation of Benefit plan are that approximately 58 beneficiaries have received benefits of approximately $2,900 in excess of IRC §415 limits through June 30, 2006; an additional approximate $900 in benefits were paid in the fiscal year ended June 30, 2007 for an estimated cumulative payment in excess of the IRC §415 limit of $3,800. No additional plan payments or repayments are required as a result of the Compliance Statement. The number of plan participants, in any given year, for the Preservation of Benefit Plan is determined by the number of plan participants who exceed the current year’s IRS §415(b) limitations as calculated by SDCERS’ actuary. The maximum annual payment for the calendar year 2007 was $180 (calendar year 2008 maximum annual payment is $185) and is adjusted downward depending on the age of the participant when benefits began.
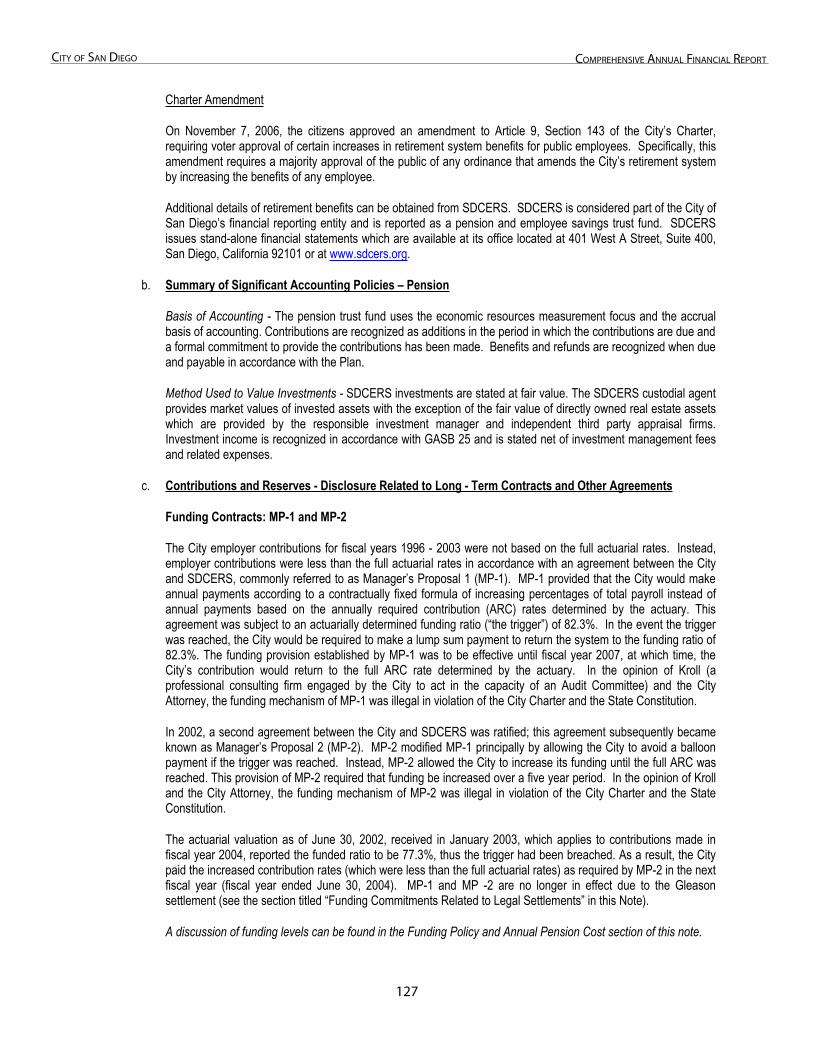
127
City of San Diego ComprehenSive annual finanCial report
Charter Amendment
On November 7, 2006, the citizens approved an amendment to Article 9, Section 143 of the City’s Charter, requiring voter approval of certain increases in retirement system benefits for public employees. Specifically, this amendment requires a majority approval of the public of any ordinance that amends the City’s retirement system by increasing the benefits of any employee.
Additional details of retirement benefits can be obtained from SDCERS. SDCERS is considered part of the City of San Diego’s financial reporting entity and is reported as a pension and employee savings trust fund. SDCERS issues stand-alone financial statements which are available at its office located at 401 West A Street, Suite 400, San Diego, California 92101 or at www.sdcers.org.
b. Summary of Significant Accounting Policies – Pension
Basis of Accounting - The pension trust fund uses the economic resources measurement focus and the accrual basis of accounting. Contributions are recognized as additions in the period in which the contributions are due and a formal commitment to provide the contributions has been made. Benefits and refunds are recognized when due and payable in accordance with the Plan.
Method Used to Value Investments - SDCERS investments are stated at fair value. The SDCERS custodial agent provides market values of invested assets with the exception of the fair value of directly owned real estate assets which are provided by the responsible investment manager and independent third party appraisal firms. Investment income is recognized in accordance with GASB 25 and is stated net of investment management fees and related expenses.
c. Contributions and Reserves - Disclosure Related to Long - Term Contracts and Other Agreements
Funding Contracts: MP-1 and MP-2
The City employer contributions for fiscal years 1996 - 2003 were not based on the full actuarial rates. Instead, employer contributions were less than the full actuarial rates in accordance with an agreement between the City and SDCERS, commonly referred to as Manager’s Proposal 1 (MP-1). MP-1 provided that the City would make annual payments according to a contractually fixed formula of increasing percentages of total payroll instead of annual payments based on the annually required contribution (ARC) rates determined by the actuary. This agreement was subject to an actuarially determined funding ratio (“the trigger”) of 82.3%. In the event the trigger was reached, the City would be required to make a lump sum payment to return the system to the funding ratio of 82.3%. The funding provision established by MP-1 was to be effective until fiscal year 2007, at which time, the City’s contribution would return to the full ARC rate determined by the actuary. In the opinion of Kroll (a professional consulting firm engaged by the City to act in the capacity of an Audit Committee) and the City Attorney, the funding mechanism of MP-1 was illegal in violation of the City Charter and the State Constitution.
In 2002, a second agreement between the City and SDCERS was ratified; this agreement subsequently became known as Manager’s Proposal 2 (MP-2). MP-2 modified MP-1 principally by allowing the City to avoid a balloon payment if the trigger was reached. Instead, MP-2 allowed the City to increase its funding until the full ARC was reached. This provision of MP-2 required that funding be increased over a five year period. In the opinion of Kroll and the City Attorney, the funding mechanism of MP-2 was illegal in violation of the City Charter and the State Constitution.
The actuarial valuation as of June 30, 2002, received in January 2003, which applies to contributions made in fiscal year 2004, reported the funded ratio to be 77.3%, thus the trigger had been breached. As a result, the City paid the increased contribution rates (which were less than the full actuarial rates) as required by MP-2 in the next fiscal year (fiscal year ended June 30, 2004). MP-1 and MP -2 are no longer in effect due to the Gleason settlement (see the section titled “Funding Commitments Related to Legal Settlements” in this Note).
A discussion of funding levels can be found in the Funding Policy and Annual Pension Cost section of this note.
128
City of San Diego ComprehenSive annual finanCial report
Funding Contracts: Union Agreements
The City has historically picked up a portion of the employee’s retirement contributions. The fiscal year 2006 MOUs and the changes to current and future employee benefits therein were introduced to Council in June 2005, and the changes in benefit eligibility were approved by Council Resolution 300600.
The agreement in the MOUs (agreements with the police union were not reached) was to reduce the amount of individual employees’ pension contributions which are paid for by the City, effective fiscal year 2006. The agreements with labor unions resulted in the reduction of City offset of the employee pension contribution by 3% for the Municipal Employees’ Association (MEA), the International Association of Fire Fighters Local 145, and the Deputy City Attorney Association (DCAA) and a unilaterally imposed reduction of 3.2% for the San Diego Police Officers Association (POA). In addition, the American Federation of State and County Municipal Employees (AFSCME) Local 127 negotiated a 1.9% salary reduction in lieu of a City “pick up” contribution reduction and a benefit freeze.
The agreements with the bargaining units explicitly indicate that savings to the City must be used to help address its UAAL within the timeframe of the respective contracts. The labor contract with Local 127 states that “By June 30, 2008, if the City has not dedicated a total of $600,000 or more to the UAAL reduction, including the amount received by leveraging employee salary reduction and pension contribution monies, the AFSCME salary reduction monies with interest will revert to SDCERS Employee Contribution Rate Reserve for benefit of Local 127 unit members to defray employee pension contributions.”
In June 2006, the City leveraged a portion of the employee pick up savings by contributing $90,800 from securitization of future tobacco settlement revenues, $9,200 of current tobacco settlement revenues, and $8,300 from the remaining balance in the employee “pick-up” amount as part of meeting its negotiated commitment. The $100,000 payment in excess of the ARC from tobacco settlement revenues is 100% backed by general fund revenues, and therefore, was directly allocated to reduce the Net Pension Obligation (NPO) of the general fund only. The additional contribution of $8,300 in excess of the ARC, however, was allocated Citywide as a reduction to the NPO. In June 2007, the City contributed approximately $7,000 in addition to the ARC from the savings of the employee “pick-up” reduction and in July 2007 the City contributed approximately $27,300 in addition to the ARC. (These agreements are also discussed in the Subsequent Events Note 22). Upon the conclusion of the fiscal year ended June 30, 2008, the City was not able to meet the outstanding commitment in its entirety. As such, the City is currently in discussions with Local 127 and MEA regarding the plan to return the salary reduction and employee contribution offset monies, with interest, to the bargaining unit memberships. Also after June 30, 2008 MEA filed a grievance against the City, which as of the issuance of this report is under negotiation.
Funding Commitments Related to Legal Settlements
Subsequent to the adoption of MP-2, the City settled a class action lawsuit regarding alleged breaches of fiduciary duty and law regarding the City’s underfunding of the pension system resulting from the adoption of MP-1 and MP-2. The Gleason Settlement Agreement addressed the issues raised regarding the City’s underfunding of the pension system by imposing the following requirements on the City for fiscal years 2005 through 2008:
1. Contribute $130,000 in fiscal year 2005. * 2. Pay its full ARC beginning fiscal year 2006. 3. Repeal Municipal Code Sections that legitimized the City’s contribution obligations related to MP-2. 4. Provide a total of $375,000 of real property as collateral for payments required via the Gleason
Settlement Agreement.
* The City’s Gleason Settlement required contribution of $130,000 in fiscal year 2005 was paid prior to the execution of the agreement on July 7, 2005, and therefore, was omitted from the final agreement.
The Gleason Settlement also stipulated that certain actuarial assumptions be fixed, notably, that the amortization period was reset to a 29-year closed period commencing with the June 30, 2004 Annual Actuarial Valuation. These assumptions were to remain in place for the duration of the settlement. On July 1, 2004, the City made the Gleason Settlement required contribution of $130,000 for fiscal year 2005 in addition to providing real property
12�
City of San Diego ComprehenSive annual finanCial report
totaling $375,000 as collateral to be returned in annual installments of $125,000. On July 1, 2005, the City made the annually required contribution of $163,000 for fiscal year 2006. Additionally, the City made a contribution in excess of the ARC in the amount of $108,300 on June 30, 2006. On July 3, 2006 the City made its full annually required contribution of $162,000 as well as an additional $7,000 contribution in excess of the ARC for fiscal year 2007 and on July 2, 2007, the City made its full annually required contribution of $137,700 as well as an additional $27,300 contribution in excess of the ARC for fiscal year 2008. The final installment of $125,000 of real property collateral was returned to the City on November 9, 2007.
The annual required contributions for fiscal years 2005, 2006, and 2007 did not include the effects of the Corbett settlement because the SDCERS’ Board viewed those benefits as contingent (see section a. for a description of the Corbett Settlement). Subsequent to those payments, the City determined that the Corbett Settlement liabilities are not contingent. As a result, the ARC for financial reporting was restated from the original ARC calculated by SDCERS’ actuary to include Corbett Settlement liabilities. As a result, the City’s NPO includes the effects of the Corbett Settlement.
In September 2006, the City entered into a settlement of McGuigan v. City of San Diego (the “McGuigan Settlement”) related to the underfunding by the City of the pension system. This agreement stipulated that the City pay $173,000 plus interest on amounts outstanding to SDCERS over a period of 5 years. An additional requirement of the McGuigan Settlement is that the City provides SDCERS real property collateral totaling $100,000 (Non-Depreciable Capital Assets – Land). These amounts are in addition to those required by the Gleason Settlement and are to be returned upon the full payment of the settlement.
As of the issuance of this report, the City has provided the real property collateral in addition to approximately $142,600 of additional payments to SDCERS, in an attempt to meet the terms of the McGuigan Settlement. This leaves an outstanding obligation resulting from the McGuigan Settlement of approximately $35,000, including interest. The McGuigan Settlement was partially funded through the securitization of future tobacco revenue, transfers of actual tobacco revenue receipts, additional employee “pick up” savings, and City contributions made in addition to the ARC. This contribution is further discussed in the Funding Contracts: Union Agreements section above.
In January, 2006, the City reached a settlement on a separate civil action captioned: Newsome v. City of San Diego Retirement System, City of San Diego (the “Newsome Settlement”). As part of this settlement, the plaintiff has agreed to dismiss the lawsuit if the City provides an additional $100,000 in funding over five years to SDCERS or, the funding ratio of the City’s retirement plan returns to 82.3%. The amounts stipulated in the Newsome settlement are in addition to the amount stipulated in the settlement of the McGuigan Settlement. Under the Newsome Settlement, if the City does not provide the additional funding, the plaintiff then has the right to re-file the lawsuit after giving the City 60 days notice.
d. Funding Policy and Contribution Rates
City Charter Article IX Section 143 requires employees and employers to contribute to the retirement plan. The Charter section, which was amended in fiscal year 2005, stipulates that funding obligations of the City shall be determined by the Board of SDCERS and are not subject to modification by the City. The section also stipulates that under no circumstances, may the City and Board enter into any multi-year funding agreements that delay full funding of the retirement plan. The Charter requires that employer contributions be substantially equal to employee contributions (SDCERS’ legal counsel has opined that this requirement applies to the normal cost contribution only). Pursuant to the Charter, City employer contribution rates, adjusted for payment at the beginning of the year, are actuarially determined rates and are expressed as a fixed annual required contribution as well as percentages of annual covered payroll. The entire expense of SDCERS’ administration is charged against the earnings and plan assets of SDCERS.
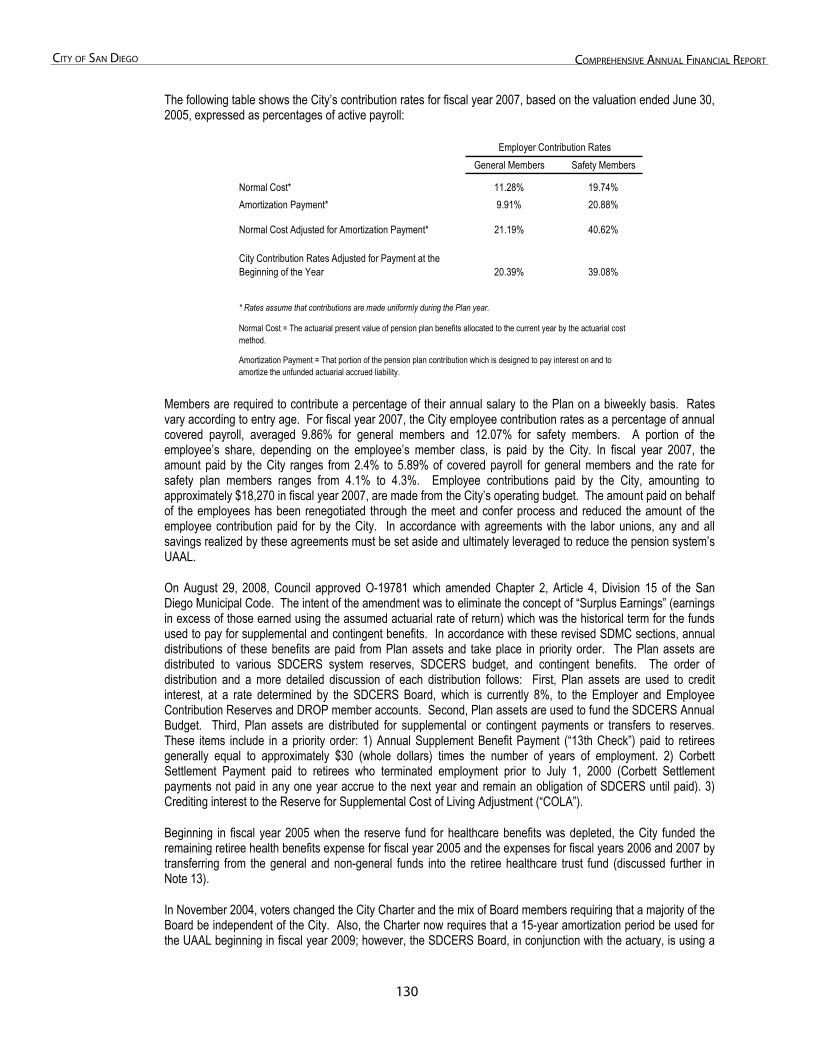
130
City of San Diego ComprehenSive annual finanCial report
The following table shows the City’s contribution rates for fiscal year 2007, based on the valuation ended June 30, 2005, expressed as percentages of active payroll:
General Members Safety Members
Normal Cost* 11.28% 19.74%Amortization Payment* 9.91% 20.88%
Normal Cost Adjusted for Amortization Payment* 21.19% 40.62%
City Contribution Rates Adjusted for Payment at the Beginning of the Year 20.39% 39.08%
Normal Cost = The actuarial present value of pension plan benefits allocated to the current year by the actuarial cost method.
Amortization Payment = That portion of the pension plan contribution which is designed to pay interest on and to amortize the unfunded actuarial accrued liability.
Employer Contribution Rates
* Rates assume that contributions are made uniformly during the Plan year.
Members are required to contribute a percentage of their annual salary to the Plan on a biweekly basis. Rates vary according to entry age. For fiscal year 2007, the City employee contribution rates as a percentage of annual covered payroll, averaged 9.86% for general members and 12.07% for safety members. A portion of the employee’s share, depending on the employee’s member class, is paid by the City. In fiscal year 2007, the amount paid by the City ranges from 2.4% to 5.89% of covered payroll for general members and the rate for safety plan members ranges from 4.1% to 4.3%. Employee contributions paid by the City, amounting to approximately $18,270 in fiscal year 2007, are made from the City’s operating budget. The amount paid on behalf of the employees has been renegotiated through the meet and confer process and reduced the amount of the employee contribution paid for by the City. In accordance with agreements with the labor unions, any and all savings realized by these agreements must be set aside and ultimately leveraged to reduce the pension system’s UAAL.
On August 29, 2008, Council approved O-19781 which amended Chapter 2, Article 4, Division 15 of the San Diego Municipal Code. The intent of the amendment was to eliminate the concept of “Surplus Earnings” (earnings in excess of those earned using the assumed actuarial rate of return) which was the historical term for the funds used to pay for supplemental and contingent benefits. In accordance with these revised SDMC sections, annual distributions of these benefits are paid from Plan assets and take place in priority order. The Plan assets are distributed to various SDCERS system reserves, SDCERS budget, and contingent benefits. The order of distribution and a more detailed discussion of each distribution follows: First, Plan assets are used to credit interest, at a rate determined by the SDCERS Board, which is currently 8%, to the Employer and Employee Contribution Reserves and DROP member accounts. Second, Plan assets are used to fund the SDCERS Annual Budget. Third, Plan assets are distributed for supplemental or contingent payments or transfers to reserves. These items include in a priority order: 1) Annual Supplement Benefit Payment (“13th Check”) paid to retirees generally equal to approximately $30 (whole dollars) times the number of years of employment. 2) Corbett Settlement Payment paid to retirees who terminated employment prior to July 1, 2000 (Corbett Settlement payments not paid in any one year accrue to the next year and remain an obligation of SDCERS until paid). 3) Crediting interest to the Reserve for Supplemental Cost of Living Adjustment (“COLA”).
Beginning in fiscal year 2005 when the reserve fund for healthcare benefits was depleted, the City funded the remaining retiree health benefits expense for fiscal year 2005 and the expenses for fiscal years 2006 and 2007 by transferring from the general and non-general funds into the retiree healthcare trust fund (discussed further in Note 13).
In November 2004, voters changed the City Charter and the mix of Board members requiring that a majority of the Board be independent of the City. Also, the Charter now requires that a 15-year amortization period be used for the UAAL beginning in fiscal year 2009; however, the SDCERS Board, in conjunction with the actuary, is using a
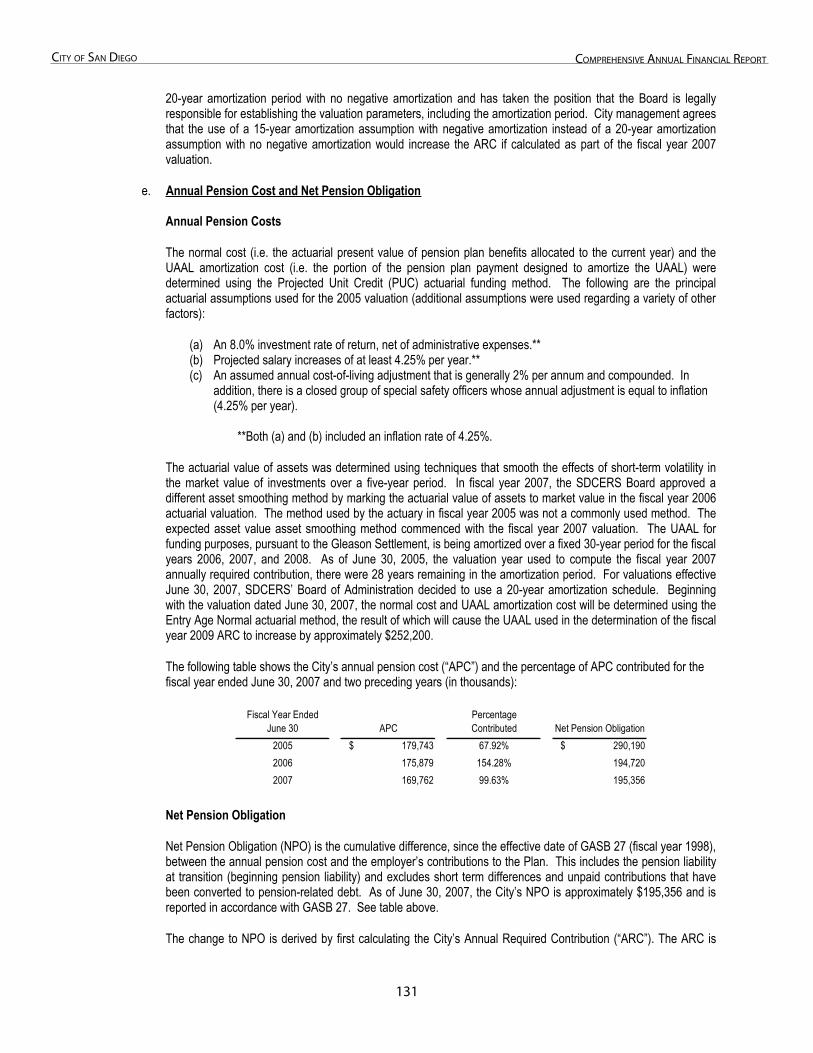
131
City of San Diego ComprehenSive annual finanCial report
20-year amortization period with no negative amortization and has taken the position that the Board is legally responsible for establishing the valuation parameters, including the amortization period. City management agrees that the use of a 15-year amortization assumption with negative amortization instead of a 20-year amortization assumption with no negative amortization would increase the ARC if calculated as part of the fiscal year 2007 valuation.
e. Annual Pension Cost and Net Pension Obligation
Annual Pension Costs
The normal cost (i.e. the actuarial present value of pension plan benefits allocated to the current year) and the UAAL amortization cost (i.e. the portion of the pension plan payment designed to amortize the UAAL) were determined using the Projected Unit Credit (PUC) actuarial funding method. The following are the principal actuarial assumptions used for the 2005 valuation (additional assumptions were used regarding a variety of other factors):
(a) An 8.0% investment rate of return, net of administrative expenses.** (b) Projected salary increases of at least 4.25% per year.** (c) An assumed annual cost-of-living adjustment that is generally 2% per annum and compounded. In
addition, there is a closed group of special safety officers whose annual adjustment is equal to inflation (4.25% per year).
**Both (a) and (b) included an inflation rate of 4.25%.
The actuarial value of assets was determined using techniques that smooth the effects of short-term volatility in the market value of investments over a five-year period. In fiscal year 2007, the SDCERS Board approved a different asset smoothing method by marking the actuarial value of assets to market value in the fiscal year 2006 actuarial valuation. The method used by the actuary in fiscal year 2005 was not a commonly used method. The expected asset value asset smoothing method commenced with the fiscal year 2007 valuation. The UAAL for funding purposes, pursuant to the Gleason Settlement, is being amortized over a fixed 30-year period for the fiscal years 2006, 2007, and 2008. As of June 30, 2005, the valuation year used to compute the fiscal year 2007 annually required contribution, there were 28 years remaining in the amortization period. For valuations effective June 30, 2007, SDCERS’ Board of Administration decided to use a 20-year amortization schedule. Beginning with the valuation dated June 30, 2007, the normal cost and UAAL amortization cost will be determined using the Entry Age Normal actuarial method, the result of which will cause the UAAL used in the determination of the fiscal year 2009 ARC to increase by approximately $252,200.
The following table shows the City’s annual pension cost (“APC”) and the percentage of APC contributed for the fiscal year ended June 30, 2007 and two preceding years (in thousands):
Fiscal Year Ended June 30 APC
Percentage Contributed Net Pension Obligation
2005 $ 179,743 67.92% $ 290,1902006 175,879 154.28% 194,7202007 169,762 99.63% 195,356
Net Pension Obligation
Net Pension Obligation (NPO) is the cumulative difference, since the effective date of GASB 27 (fiscal year 1998), between the annual pension cost and the employer’s contributions to the Plan. This includes the pension liability at transition (beginning pension liability) and excludes short term differences and unpaid contributions that have been converted to pension-related debt. As of June 30, 2007, the City’s NPO is approximately $195,356 and is reported in accordance with GASB 27. See table above.
The change to NPO is derived by first calculating the City’s Annual Required Contribution (“ARC”). The ARC is
132
City of San Diego ComprehenSive annual finanCial report
calculated by actuarially determining the cost of pension benefits accrued during the year (normal cost) and adding to that the annual amount needed to amortize the UAAL (amortization cost) as reported by the actuary, in accordance with the amortization period and method selected. The ARC is then increased by interest accruing on any outstanding NPO (NPO Interest) and then reduced by the amortization of the UAAL that is related to the NPO (ARC Adjustment).
The following shows the calculation for NPO based on the actuarial information provided to the City (in thousands):
ARC [Fiscal Year 2007] $ 165,222 Contributions [Fiscal Year 2007] (169,126)Interest on NPO 15,556 ARC Adjustment (11,016)Change in NPO 636 NPO Beginning of Year [July 1, 2006] 194,720 NPO End of Year [June 30, 2007] $ 195,356
NPO Components related to Retiree Health
The City’s annual contribution to SDCERS pension trust fund, for the fiscal years ended June 30, 2005, 2004, and 2003, included amounts that were contributed to the 401(h) Fund for healthcare benefits and are reported net of this contribution. Annual realized earnings, as determined by the SDMC Sections 24.1501 and 24.1502, in the pension trust fund were withdrawn and used to offset the portion of the City’s contribution that went to healthcare benefits instead of being retained in the pension trust fund. This funding mechanism is a violation of the Internal Revenue Code (IRC) Section 401(a). SDCERS hired counsel to make a filing to the IRS to correct this operational failure and IRC violation. (See Contingencies Note 18 for additional disclosures). The amounts paid from the pension trust fund for healthcare benefits were approximately $7,900 in fiscal year 2005, $12,800 in fiscal year 2004, and $11,500 in fiscal year 2003. These payments have been removed from the City contribution amounts and resulted in an increase to the City’s NPO. The cumulative impact to the City’s NPO related to the diversion of assets to fund retiree health is approximately $79,000. The City’s contribution related to retiree health for the fiscal year 2007 was placed in a Retiree Health Trust Fund which is paid from the City’s operating funds. (See Other Post Employment Benefits Note 13 for further details.)
NPO Components related to Employee Offset Liabilities
In fiscal year 1998, the City set aside $37,800 in funds from the pension trust fund’s undistributed earnings to fund the Employee Contribution Rate Reserve, and in accordance with SDMC §24.1502, annually added 8% interest earnings to this reserve. This employee contribution reserve was to pay for the City’s share (offset) of the employee’s retirement contribution. The amount of NPO related to the employee offset as of June 30, 2007 is $34,500. This reserve was depleted in fiscal year 2006. As noted in the Funding Contracts: Union Agreements section above, the agreements with labor unions resulted in the reduction of City “pick-up” of the employee pension contribution, followed by employees paying for the contribution upon depletion of the reserve.
NPO Components related to Corbett Settlement and Subsequent Benefit Increases
The City is amortizing the unfunded liability incurred as a result of the benefit increases pursuant to the Corbett Settlement. The City interprets GASB 27 to require that the amortization methods used in calculating funding for the Plan to be consistent with the method used to calculate Plan expense. Thus, the previous amortization method of 40 years open for expensing plan costs was found to be incorrect. The impact on the NPO related to Corbett as of June 30, 2007 is approximately $32,000.
NPO Components related to the Under Funding of Plan Contributions
As a result of the MP-1 and MP-2 funding contracts, the City’s contributions for fiscal years 1996-2003 were less than the annual required contribution as determined by the actuary. The impact on the NPO related to the under funding of plan contributions as of June 30, 2007 is approximately $49,900.
133
City of San Diego ComprehenSive annual finanCial report
f. Actions taken on behalf of the City to address Pension Liability and Net Pension Obligation
As part of the agreements with the labor unions, several benefits were altered or eliminated for all employees hired on or after July 1, 2005, including the Deferred Retirement Option Plan (DROP), the 13th Check, the option to purchase years of service credits (“air-time”), and retiree healthcare benefits; however, the retirement formula generally remains 2.5% at 55 for general members and 3.0% at 50 for safety members. Also for employees hired on or after July 1, 2005, it was agreed to establish a trust vehicle for a defined contribution plan to fund and determine retiree medical benefits. As of the issuance of this report, the employer/employee contributions for such a plan have not been determined. The City has consolidated health care options to help manage the cost of health care for both current and retired employees, and as part of the agreements with the labor unions, the new definition of “health-eligible retiree” states that employees must have 10 years of service with the City to receive 100% of the retiree health benefit and five years of service to receive 50% of the retiree health benefit.
In fiscal years 2006 and 2007, the City contributed $115,300 in addition to the ARC through the securitization of future tobacco revenue, transfers of actual tobacco revenue receipts, and additional employee “pick up” savings. In fiscal year 2008, the City contributed approximately $27,300 in addition to the ARC which resulted in a total cumulative payment in addition to the ARC of approximately $142,600 for the fiscal years 2006 through 2008. These contributions are the same as those discussed in the Funding Contracts: Union Agreements section discussed previously.
DEFINED CONTRIBUTION PLANS
a. Supplemental Pension Savings Plan - City
Pursuant to the City’s withdrawal from the Federal Social Security System effective January 8, 1982, the City established the Supplemental Pension Savings Plan (“SPSP”). Pursuant to the Federal Government’s mandate of a Social Security Medicare tax for all employees not covered by Social Security hired on or after April 1, 1986, the City established the Supplemental Pension Savings Plan-Medicare (“SPSP-M”). The SPSP and SPSP-M Plans were merged into a single plan (“SPSP”) on November 12, 2004 for administrative simplification, without a change in benefits. Pursuant to the requirements of the Omnibus Budget Reconciliation Act of 1990 (“OBRA-90”) requiring employee coverage under a retirement system in lieu of coverage under the Federal Insurance Contributions Act (“FICA”) effective July 1, 1991, the City established the Supplemental Pension Savings Plan-Hourly (“SPSP-H”). These supplemental plans are defined contribution plans administered by Wachovia Corporation to provide pension benefits for eligible employees. There are no plan members who belong to an entity other than the City. In a defined contribution plan, benefits depend solely on amounts contributed to the plan plus investment earnings, less investment losses. The City’s general retirement members and lifeguard members of the City’s safety retirement members participate in the plan. Eligible employees may participate from the date of employment.
The following table details plan participation as of June 30, 2007:
Plan ParticipantsSPSP 8,461
SPSP – H 4,181
The SPSP Plan requires that both the employee and the City contribute an amount equal to 3% of the employee’s total salary each pay period. Participants in the Plan hired before July 1, 1986 may voluntarily contribute up to an additional 4.5% and participants hired on or after July 1, 1986 may voluntarily contribute up to an additional 3.05% of total salary, with the City matching each. Hourly employees contribute 3.75% on a mandatory basis which is also matched by City contributions.
Under the SPSP Plan, the City’s contributions for each employee (and interest allocated to the employee’s account) are fully vested after five years of continuous service at a rate of 20% for each year of service. Hourly employees are immediately 100% vested. The unvested portion of City contributions and interest forfeited by employees who leave employment before five years of service are used to reduce the City’s cost.
13�
City of San Diego ComprehenSive annual finanCial report
In fiscal year 2007, the City and the covered employees contributed approximately $23,372 and $23,360, respectively. As of June 30, 2007, the fair value of plan assets totaled approximately $542,777. SPSP is considered part of the City of San Diego’s financial reporting entity and is reported as a pension and employee savings trust fund.
b. 401(k) Plan - City
The City established a 401(k) Plan effective July 1, 1985. The 401(k) Plan is a defined contribution plan administered by Wachovia Corporation to provide pension benefits for eligible employees. Employees are eligible to participate from date of employment. Employees make contributions to their 401(k) Plan accounts through payroll deductions, and may also elect to contribute to their 401(k) account through the City’s Employees’ Flexible Benefits Program.
The employees’ 401(k) contributions are based on IRS calendar year limits. Employees contributed approximately $27,025 during the fiscal year ended June 30, 2007. There is no City contribution towards the 401(k) Plan.
As of June 30, 2007, the fair value of plan assets totaled approximately $234,883. The 401(k) Plan is considered part of the City’s financial reporting entity and is reported as a pension and employee savings trust fund.
c. Pension Plan - Centre City Development Corporation (CCDC)
CCDC has a Money Purchase Pension Plan covering all full-time permanent employees (the “CCDC Plan”). The CCDC Plan is a defined contribution plan under which benefits depend solely on amounts contributed to the plan plus investment earnings. Employees are eligible to participate on the first day of the month following 90 days after their date of employment. During each year, CCDC contributes semi-monthly an amount equal to 8% of the total quarterly compensation for all employees. CCDC’s contributions for each employee are fully vested after six years of continuous service. CCDC’s total payroll in fiscal year 2007 was approximately $3,900. CCDC contributions were calculated using the base salary amount of approximately $3,544. CCDC made the required 8% contribution amounting to approximately $284 (net of forfeitures) for fiscal year 2007.
In addition, CCDC has a Tax Deferred Annuity Plan covering all full-time permanent employees. The CCDC Plan is a defined contribution plan under which benefits depend solely on amounts contributed to the plan by the employer and the employees, plus investment earnings. Employees are eligible to participate on the first day of the month following 90 days after their date of employment. During each plan year, CCDC contributes semi-monthly an amount equal to 16% of the total semi-monthly compensation for eligible employees. CCDC’s contributions for each employee are fully vested at time of contribution. The Tax Deferred Annuity Plan includes amounts deposited by employees prior to CCDC becoming a contributor to the CCDC Plan. CCDC made the required 16% contribution amounting to approximately $567 for fiscal year 2007.
The fiduciary responsibilities of CCDC consist of making contributions and remitting deposits collected. The City does not hold these assets in a trustee or agency capacity for CCDC; therefore, these assets are not reported within the City’s basic financial statements.
d. Pension Plan - San Diego Convention Center Corporation (SDCCC)
SDCCC’s Money Purchase Pension Plan (the “SDCCC Plan”) became effective January 1, 1986. The SDCCC Plan is a qualified defined contribution plan and as such, benefits depend on amounts contributed to the SDCCC Plan plus investment earnings less allowable plan expenses. The SDCCC Plan covers employees not otherwise entitled to a retirement/pension plan provided through a collective bargaining unit agreement. Employees are eligible at the earlier of the date on which they complete six months of continuous full-time service, or the twelve-month period beginning on the hire date (or any subsequent Plan year) during which they complete 1,000 hours of service.
A plan year is defined as a calendar year. SDCCC’s balance for each eligible employee is vested gradually over five years of continuing service with an eligible employee becoming fully vested after five years. Forfeitures and
13�
City of San Diego ComprehenSive annual finanCial report
SDCCC Plan expenses are allocated in accordance with Plan provisions. A trustee bank holds the SDCCC Plan assets. The City does not act in a trustee or agency capacity for the SDCCC plan; therefore, these assets are not reported within the City’s basic financial statements.
For the year ended June 30, 2007, pension expenditures for the SDCCC Plan amounted to $1,269. SDCCC records pension expenditures during the fiscal year based upon estimated covered compensation.
e. Pension Plan - San Diego Data Processing Corporation (SDDPC)
SDDPC has accrued and set aside funds in a money market account to provide employees who transferred from the City to SDDPC with retirement benefits approximately equal to those under the City’s retirement plan. As of June 30, 2007, the balance in the account was $140.
The balance at June 30, 2007 consisted of the total estimated liability plus interest earned on the account since its establishment in fiscal year 1991.
In addition, SDDPC has in effect a Money Purchase Pension Plan (the “SDDPC Plan”) covering substantially all employees. The SDDPC Plan is a defined contribution plan, wherein benefits depend solely on amounts contributed to the plan plus investment earnings. Employees are eligible to participate from the date of employment. During each plan year, SDDPC contributes monthly an amount equal to 20% of the total monthly compensation for all employees. SDDPC contributions for each employee are fully vested after four years of continuing service. The City does not act in a trustee or agency capacity for the SDDPC Plan; therefore, these assets are not reported within the City’s basic financial statements. In fiscal year 2007, SDDPC made the required 20% contribution, amounting to approximately $3,483.
SDDPC also administers a Tax Sheltered Annuity Plan, a voluntary defined contribution plan covering all employees of SDDPC who are eligible for membership as defined by the plan document. There are no employer contributions to this plan.
f. Pension Plan - San Diego Housing Commission (SDHC)
SDHC provides pension benefits for all its full-time employees through a defined contribution plan (the “SDHC Plan”). In a defined contribution plan, benefits depend solely on amounts contributed to the plan plus investment earnings. Employees are eligible to participate on the first day of their employment. SDHC’s contributions for each employee (and interest allocated to the employee’s account) are fully vested after four years of continuous service. SDHC’s contributions for, and interest forfeited by, employees who leave employment before four years of service are used to reduce the SDHC’s current-period contribution requirement. SDHC’s covered payroll in fiscal year 2007 was approximately $11,514. SDHC made the required 14% contribution, amounting to approximately $1,614 for fiscal year 2007. The City does not act in a trustee or agency capacity for the SDHC Plan; therefore, these assets are not reported within the City’s basic financial statements.
g. Pension Plan - Southeastern Economic Development Corporation (SEDC)
SEDC has an optional Simplified Employee Pension Plan covering all full-time permanent employees (the “SEDC Plan”). The SEDC Plan is a defined contribution plan administered by James Kerr & Associates, Inc and Morgan Stanley Dean Witter is the investment advisor. Under section 212 of the SEDC Employee Handbook, employees are eligible to participate six months after their date of employment, and SEDC contributes a monthly amount equal to 12% of the employees’ base salary, or 15% of management employees’ base salary. Such contributions are fully vested upon contribution. SEDC’s total payroll in fiscal year 2007 was approximately $1,009. SEDC contributions were calculated using the base salary amount of approximately $889. SEDC made the required contribution, amounting to approximately $118 for fiscal year 2007. SEDC Plan members contributed an additional $3.6.
13�
City of San Diego ComprehenSive annual finanCial report
13. Other Post Employment Benefits
13. OTHER POSTEMPLOYMENT BENEFITS (In Thousands)
a. Plan Description
The City provides certain healthcare benefits to a variety of retired employees through SDCERS, as provided for in San Diego Municipal Code (SDMC) Sections 24.1201 through 24.1204. Currently, the benefits are primarily for health eligible retirees who were actively employed on or after October 5, 1980 and were otherwise entitled to retirement allowances. Health eligible retirees can obtain health insurance coverage with the plan of their choice, including any City sponsored, union sponsored, or privately secured health plan. In fiscal year 2007, health eligible retirees who are also eligible for Medicare are entitled to receive reimbursement/payment of healthcare premiums, limited to approximately $7.8 per year, in addition to reimbursement/payment for Medicare Part B premiums, limited to approximately $1.1 per year. Health eligible retirees who are not eligible for Medicare are entitled to receive reimbursement/payment of healthcare premiums, limited to approximately $7.3 per year. Non-health eligible employees who retired or terminated prior to October 6, 1980 and who are otherwise eligible for retirement allowances are also eligible for reimbursement/payment of healthcare benefits limited to a total of $1.2 per year.
b. Contributions
Expenses for postemployment healthcare benefits were paid for on a pay-as-you-go basis through fiscal year 2007. In fiscal year 2007, approximately 4,400 retirees received either City paid insurance or were reimbursed for other health insurance costs incurred amounting to approximately $27,100. Approximately $20,400 was paid by the City and approximately $6,700 was paid by retirees for beneficiary health benefits. These contributions were placed into a trust fund called the Retiree Health Trust Fund, and all retiree healthcare expenses are paid directly from this fund by SDCERS.
In July 2004, GASB issued GASB 45, Accounting and Financial Reporting by Employers for Postemployment Benefits Other Than Pensions (OPEB), which establishes standards for the measurement, recognition, and display of OPEB expense/expenditures and related liabilities, note disclosures, and, if applicable, required supplementary information in the financial statements. The City will implement GASB 45 in the financial statements for the fiscal year ending June 30, 2008. In preparation to meet the requirements of GASB 45, the City entered into an agreement on January 18, 2008 to pre-fund expenses related to postemployment healthcare benefits. The investment trust, administered by CalPERS, requires the City to pre-fund the trust in an amount not less than $5 annually. The City has already submitted partial ARC contributions to CalPERS for fiscal years 2008 and 2009, amounting to approximately $30,129 and $23,911, respectively. Beginning in fiscal year 2008, the postemployment healthcare actuarial accrued liability of approximately $882,646, all of which is unfunded, will be reported in the notes to the financial statements as well as in the required supplemental information in a manner similar to pension obligations.
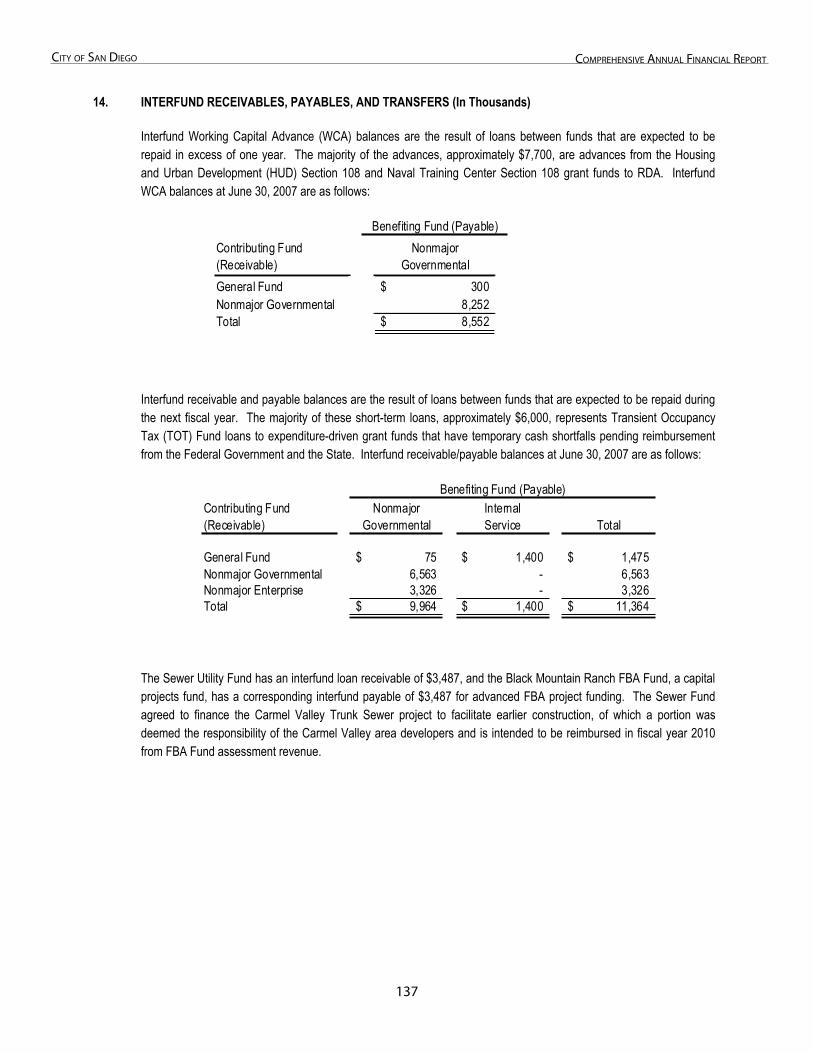
137
City of San Diego ComprehenSive annual finanCial report
14. Interfund Receivables, Payables, and
14. INTERFUND RECEIVABLES, PAYABLES, AND TRANSFERS (In Thousands)
Interfund Working Capital Advance (WCA) balances are the result of loans between funds that are expected to be repaid in excess of one year. The majority of the advances, approximately $7,700, are advances from the Housing and Urban Development (HUD) Section 108 and Naval Training Center Section 108 grant funds to RDA. Interfund WCA balances at June 30, 2007 are as follows:
Contributing Fund (Receivable)
Nonmajor Governmental
General Fund 300$ Nonmajor Governmental 8,252 Total 8,552$
Benefiting Fund (Payable)
Interfund receivable and payable balances are the result of loans between funds that are expected to be repaid during the next fiscal year. The majority of these short-term loans, approximately $6,000, represents Transient Occupancy Tax (TOT) Fund loans to expenditure-driven grant funds that have temporary cash shortfalls pending reimbursement from the Federal Government and the State. Interfund receivable/payable balances at June 30, 2007 are as follows:
Contributing Fund Nonmajor Internal(Receivable) Governmental Service Total
General Fund 75$ 1,400$ 1,475$ Nonmajor Governmental 6,563 - 6,563 Nonmajor Enterprise 3,326 - 3,326 Total 9,964$ 1,400$ 11,364$
Benefiting Fund (Payable)
The Sewer Utility Fund has an interfund loan receivable of $3,487, and the Black Mountain Ranch FBA Fund, a capital projects fund, has a corresponding interfund payable of $3,487 for advanced FBA project funding. The Sewer Fund agreed to finance the Carmel Valley Trunk Sewer project to facilitate earlier construction, of which a portion was deemed the responsibility of the Carmel Valley area developers and is intended to be reimbursed in fiscal year 2010 from FBA Fund assessment revenue.
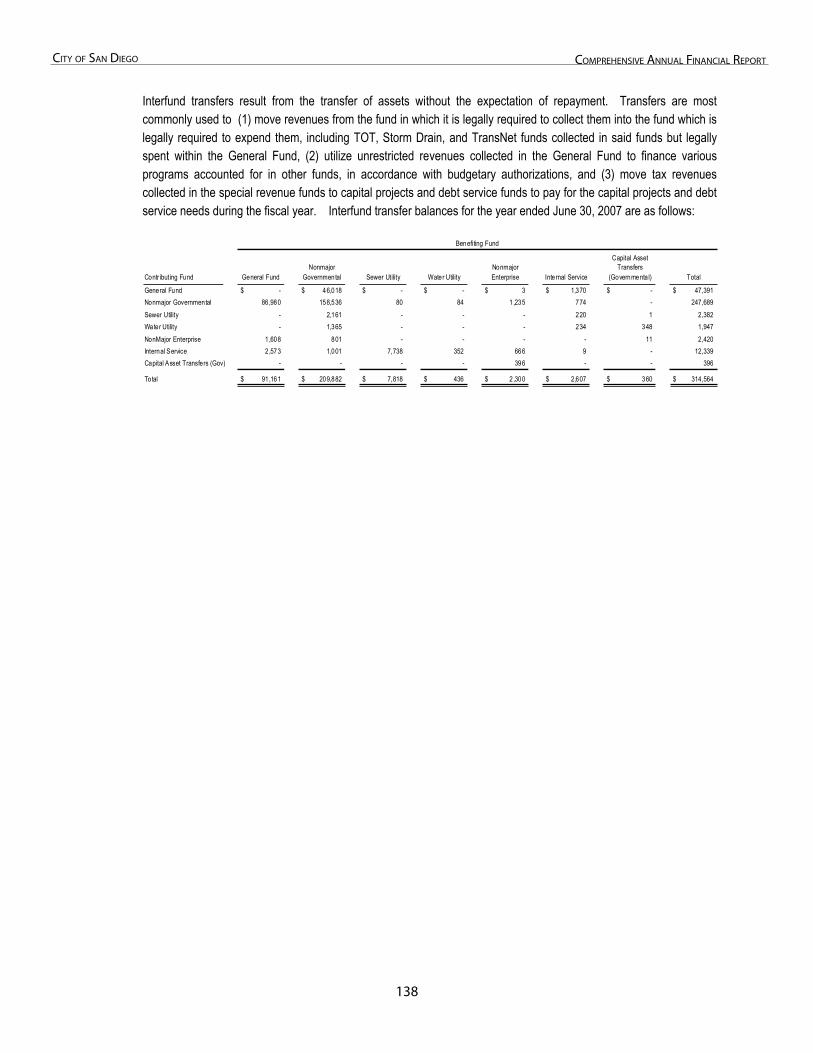
138
City of San Diego ComprehenSive annual finanCial report
Interfund transfers result from the transfer of assets without the expectation of repayment. Transfers are most commonly used to (1) move revenues from the fund in which it is legally required to collect them into the fund which is legally required to expend them, including TOT, Storm Drain, and TransNet funds collected in said funds but legally spent within the General Fund, (2) utilize unrestricted revenues collected in the General Fund to finance various programs accounted for in other funds, in accordance with budgetary authorizations, and (3) move tax revenues collected in the special revenue funds to capital projects and debt service funds to pay for the capital projects and debt service needs during the fiscal year. Interfund transfer balances for the year ended June 30, 2007 are as follows:
Contr ibuting Fund General FundNonmajor
Governmental Sewer Utility Water UtilityNonmajor Enterprise Internal Service
Capital Asset Transfers
(Governmenta l) Total
General Fund -$ 46,018$ -$ -$ 3$ 1,370$ -$ 47,391$ Nonmajor Governmental 86,980 158,536 80 84 1 ,235 774 - 247,689 Sewer Utility - 2,161 - - - 220 1 2,382 Water Utility - 1,365 - - - 234 348 1,947 NonMajor Enterprise 1,608 801 - - - - 11 2,420 Internal Service 2,573 1,001 7,738 352 666 9 - 12,339 Capital Asset Transfers (Gov) - - - - 396 - - 396
Total 91,161$ 209,882$ 7,818$ 436$ 2 ,300$ 2,607$ 360$ 314,564$
Benefi ting Fund
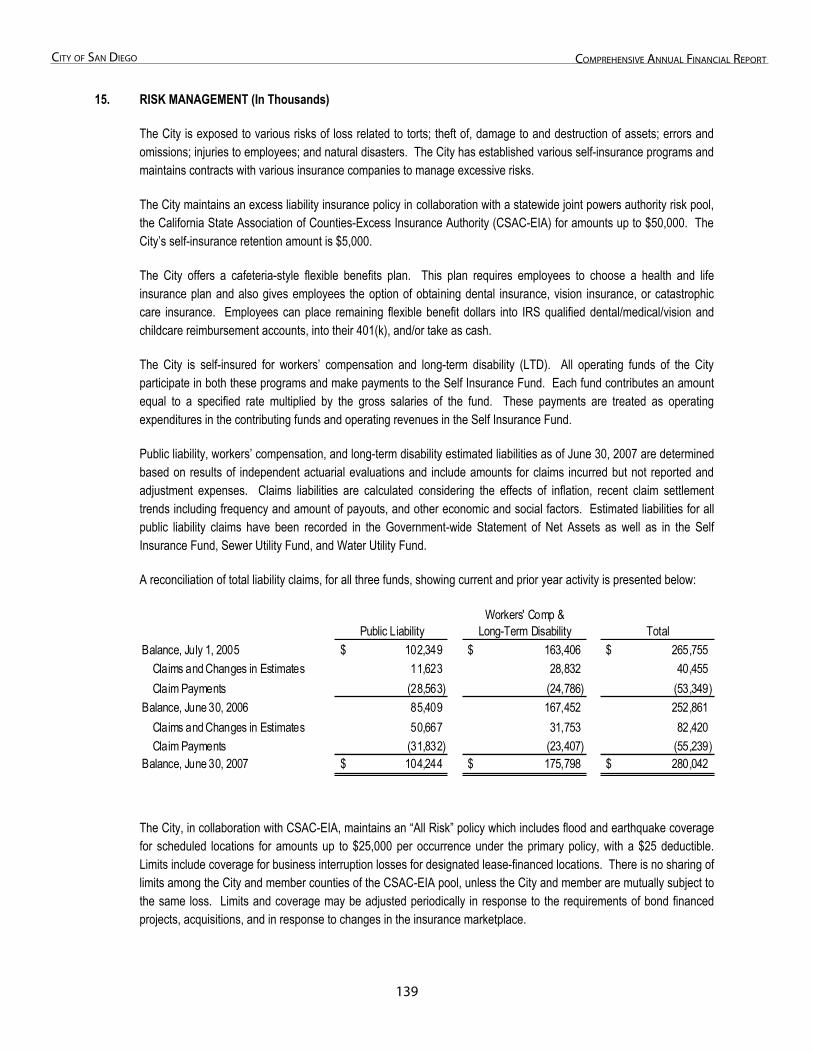
13�
City of San Diego ComprehenSive annual finanCial report
15. Risk Management
15. RISK MANAGEMENT (In Thousands)
The City is exposed to various risks of loss related to torts; theft of, damage to and destruction of assets; errors and omissions; injuries to employees; and natural disasters. The City has established various self-insurance programs and maintains contracts with various insurance companies to manage excessive risks.
The City maintains an excess liability insurance policy in collaboration with a statewide joint powers authority risk pool, the California State Association of Counties-Excess Insurance Authority (CSAC-EIA) for amounts up to $50,000. The City’s self-insurance retention amount is $5,000.
The City offers a cafeteria-style flexible benefits plan. This plan requires employees to choose a health and life insurance plan and also gives employees the option of obtaining dental insurance, vision insurance, or catastrophic care insurance. Employees can place remaining flexible benefit dollars into IRS qualified dental/medical/vision and childcare reimbursement accounts, into their 401(k), and/or take as cash.
The City is self-insured for workers’ compensation and long-term disability (LTD). All operating funds of the City participate in both these programs and make payments to the Self Insurance Fund. Each fund contributes an amount equal to a specified rate multiplied by the gross salaries of the fund. These payments are treated as operating expenditures in the contributing funds and operating revenues in the Self Insurance Fund.
Public liability, workers’ compensation, and long-term disability estimated liabilities as of June 30, 2007 are determined based on results of independent actuarial evaluations and include amounts for claims incurred but not reported and adjustment expenses. Claims liabilities are calculated considering the effects of inflation, recent claim settlement trends including frequency and amount of payouts, and other economic and social factors. Estimated liabilities for all public liability claims have been recorded in the Government-wide Statement of Net Assets as well as in the Self Insurance Fund, Sewer Utility Fund, and Water Utility Fund.
A reconciliation of total liability claims, for all three funds, showing current and prior year activity is presented below:
Workers' Comp &Public Liability Long-Term Disability Total
Balance, July 1, 2005 102,349$ 163,406$ 265,755$ Claims and Changes in Estimates 11,623 28,832 40,455 Claim Payments (28,563) (24,786) (53,349)
Balance, June 30, 2006 85,409 167,452 252,861 Claims and Changes in Estimates 50,667 31,753 82,420 Claim Payments (31,832) (23,407) (55,239)
Balance, June 30, 2007 104,244$ 175,798$ 280,042$
The City, in collaboration with CSAC-EIA, maintains an “All Risk” policy which includes flood and earthquake coverage for scheduled locations for amounts up to $25,000 per occurrence under the primary policy, with a $25 deductible. Limits include coverage for business interruption losses for designated lease-financed locations. There is no sharing of limits among the City and member counties of the CSAC-EIA pool, unless the City and member are mutually subject to the same loss. Limits and coverage may be adjusted periodically in response to the requirements of bond financed projects, acquisitions, and in response to changes in the insurance marketplace.
1�0
City of San Diego ComprehenSive annual finanCial report
Earthquake coverage is provided for designated buildings/structures and certain designated City lease-financed locations in the amount of $60,000, including coverage for business interruption caused by earthquake at certain designated locations. Earthquake coverage is subject to a deductible of 5% of total values per unit per occurrence, subject to a $100 minimum. The City’s earthquake coverage is purchased jointly and shared with the member counties in the CSAC-EIA pool. Due to the potential for geographically concentrated earthquake losses, the CSAC-EIA pool is geographically diverse to minimize any potential sharing of coverage in the case of an individual earthquake occurrence. Depending upon the availability and affordability of such earthquake insurance, the City may elect not to purchase such coverage in the future, or the City may elect to increase the deductible or reduce the coverage from present levels.
The City is a public agency subject to liability for the dishonest and negligent acts or omissions of its officers and employees acting within the scope of their duty (“employee dishonesty” and “faithful performance”). The City participates in the joint purchase of insurance covering employee dishonesty and faithful performance through the CSAC-EIA pool. Coverage is provided in the amount of $10,000 per occurrence, subject to a $25 deductible.
During fiscal year 2007, there were no significant reductions in insurance coverage from the prior year. For each of the past three fiscal years, the settlements have not exceeded insurance coverage.
See Contingencies, Note 18, for additional information.
1�1
City of San Diego ComprehenSive annual finanCial report
16. Fund Balance/Net Assets (Deficit)
16. FUND BALANCE / NET ASSETS (DEFICIT) (In Thousands)
The Grants Fund (Special Revenue) and the Capital Outlay Fund (Capital Projects) have net deficits of approximately ($8,971) and ($6,533), respectively, due to the large number of reimbursement grants accounted for within these funds. With reimbursement grants, the resources remain the property of the grantor until allowable costs are incurred. The grants revenues are recognized as soon as all eligibility criteria have been met and the amounts become available. This results in a deficit fund balance in these funds.
The Self Insurance Fund (Internal Service) has a net deficit of approximately ($178,686), which represents unfunded estimated claims and claim settlements related to Public Liability, Workers’ Compensation, and Long-Term Disability. It is anticipated that individual claim settlements will be funded through future user charges subsequent to the filing of a claim and prior to its settlement. In addition to user charges, in January 2008, the Mayor’s office presented a five-year financial outlook to the City Council that outlines a proposal to fund the Self Insurance Fund by contributing an additional $5,000 to the Public Liability Reserves in fiscal year 2008, $10,000 in fiscal year 2009, and an additional $5,000 to workers compensation in fiscal year 2009. On November 13, 2007 the City Council also approved the formal City Reserve Policy. This policy contains a “Risk Management Reserve Policy” for the self insurance funds which addresses funding reserves for both the Public Liability and Worker’s Compensation funds in the future.
Publishing Services (Internal Service) has a net deficit of ($944), due to a decline in work production, and outdated pricing for services which are not fully cost recoverable. Publishing services is restructuring their rates to ensure full cost recovery.
Special Engineering (Internal Service) has a net deficit of ($1,005) which is primarily the result of the net pension costs incurred in the fund. Rates will be restructured to ensure this fund is fully cost recoverable.
1�2
City of San Diego ComprehenSive annual finanCial report
17. Commitments
17. COMMITMENTS (In Thousands)
As of June 30, 2007, the City’s business-type activities contractual commitments are as follows:
Airports 1,864$ Environmental Services 15,403 Sewer Utility 59,515 Water Utility 53,373 Other 5,706 Total Contractual Commitments 135,861$
The contractual commitments are to be financed with existing reserves and future service charges. In addition, the Sewer and Water Utility Funds intend to finance the contractual commitments with existing reserves, future service charges, and financing proceeds secured by system revenues.
Consent Decree
On April 2, 2001, two environmental groups filed suit against the City alleging that the Municipal System’s collection system was deficient as a result of sewer spills from December 1996 to the time of the filing. The complaint sought injunctive relief to prevent illegal discharges, a compliance schedule to upgrade the Municipal System’s collection system, and civil penalties of $27.5 per day for each day of a violation. The City contested the plaintiffs’ claims.
The U.S. Environmental Protection Agency (EPA) and the State also filed suits against the City alleging the same collection system violations, seeking unspecified penalties and injunctive relief for collection system improvements. All three cases were consolidated. On March 16, 2005, the City settled the State lawsuit for $1,200. Of this total, $1,000 funded three supplemental environmental projects to benefit the local environment, and $200 was deposited in the State’s Cleanup and Abatement Account.
The EPA, the City and the environmental groups reached an agreement on additional requirements to reduce sewer spills, which are set forth in a Consent Decree (the “Consent Decree”). The Consent Decree requires increased sewer spill response and tracking, increased root control, replacement or rehabilitation of 250 miles of pipeline, a canyon economic and environmental analysis, pump station and force main upgrades, and entails court supervision of these upgrades at least through June 2013. The estimated average annual cost of this commitment is $108,000 per year in capital projects and $47,000 per year in operational maintenance to the sewer system through the term of the settlement; however, the costs for bidding, constructing and completing the required work will fluctuate depending on variables such as changes in the cost of materials and labor. No civil penalty payment was required, though stipulated penalties ranging from $375 (in whole dollars) to $20,000 (in whole dollars) per occurrence are included for subsequent violations of the Consent Decree. The Consent Decree was approved by the Court on October 9, 2007, settling all remaining issues in the case.
Four sewer rate increases were approved for FY 2007 through FY 2010 to partially fund the obligations of the Consent Decree. However, additional rate increases will be necessary (likely beginning in year 2011) to completely fund the Consent Decree. The City funds the Capital Projects in the Consent Decree through the issuance of notes and bonds which are repaid by the sewer system’s revenues.
1�3
City of San Diego ComprehenSive annual finanCial report
California Department of Public Health Compliance Order
In 1994, the City of San Diego entered into a compliance agreement with the State of California Department of Public Health (“DPH”) with the approval of City Council, after the DPH Drinking Water Field Operations Branch conducted a sanitary survey of the City’s water system. This agreement required the City to correct operational deficiencies and begin necessary capital improvements. The City was notified in January of 1997 that it was not in compliance with this agreement. At that time, the DPH issued a compliance order. The January 1997 Compliance Order was last amended in May of 2007 (“Amendment 11”), and included additional items that were not in the original Compliance Order. The DPH Compliance Order will remain in effect until the required projects are completed.
Presently, the Water Department is meeting all of the requirements of the DPH Compliance Order, including the ongoing obligation to provide DPH with quarterly progress reports. On February 26, 2007, the City authorized an increase in water rates and charges to continue funding projects mandated in the DPH Compliance Order as well as other Capital Improvement Program projects. In addition, on October 8, 2007, the City authorized a “pass-through” rate increase to account for the higher cost of water purchased from the San Diego County Water Authority. The pass-through rate increase took effect on January 1, 2008 and will help preserve the funds previously committed to DPH Compliance Order projects.
DPH has the authority to impose civil penalties if the City fails to meet DPH Compliance Order deadlines, although DPH has not imposed such penalties to date. Violation of the DPH Compliance Order may be subject to judicial action, including civil penalties specified in California Health and Safety Code, Section 116725. Section 116725 penalties for violating a schedule of compliance for a primary drinking water standard can go as high as $25,000 (in whole dollars) per day for each violation; for violating other standards, such as turbidity, the penalties can reach $5,000 (in whole dollars) per day. There are a number of additional enforcement tools prescribed by law, including mandatory water conservation, litigation and service connection moratoriums.
The costs for bidding, constructing and completing the required work will fluctuate depending on variables such as changes in the cost of materials and labor. As of 2007, the Water Department’s DPH Compliance Order project and DPH related project costs approximate:
Total Projects FY07 FY08 - FY11 FY12 - FY19 TOTAL
DPH & EPA Requirements 28,292$ 345,747$ 214,877$ 588,916$ DPH Related Projects 4,614 137,191 315,245 457,050
These commitments are to be financed with existing net assets, present and future revenues, and financing proceeds secured by system revenues.
Convention Center Dewatering
The City is responsible for the disposition and monitoring of the quality of groundwater from the parking structure at the San Diego Convention Center located adjacent to San Diego Bay. The Convention Center includes a subterranean parking garage, which is subject to infiltration of groundwater, much of which originates from the bay. This groundwater must be continually pumped from the parking structure to prevent it from being inundated. Approximately 500,000 gallons of groundwater is pumped daily from the parking structure. Until March 26, 2008 this water was discharged into San Diego Bay. The City held a National Pollutant Discharge Elimination System (“NPDES”) permit for the discharge, issued by the Regional Water Quality Control Board ("RWQCB"). The discharge had been failing to consistently meet water quality standards set forth in the permit, potentially exposing the City to fines and penalties of
1��
City of San Diego ComprehenSive annual finanCial report
up to $25,000 (in whole dollars) per day.
Monthly groundwater discharge sample results have not met the standards dictated by the NPDES permit since the end of calendar year 2005. This triggered the implementation of work to cease effluent violations within twenty seven months (from the end of March 2008), pursuant to an order of the RWQCB.
To achieve compliance with groundwater discharge requirements, the City retained an engineering consultant in 2006 to review all previous work and develop the most cost-effective engineering solution to achieve compliance. The consultant’s final report was received in August 2007. This report determined that the most cost effective method to comply with the RWQCB Order in the near term was to divert the discharge from the bay to the sewer system. The cost for implementing this solution is estimated to be $709,488 (in whole dollars) for FY 2009, with subsequent annual increases based on approved sewer rates, for operational and sewer service charges. There is also a one-time sewer capacity charge of $5,904,930 (in whole dollars) that is due after the first year of diversion to the sewer. The City’s General Fund is responsible for the funding, although the San Diego Port District, which owns the Convention Center property, may also be partially responsible.
The City of San Diego established the diversion to the sewer effective March 26, 2008 in compliance with the RWQCB Order. On May 19, 2008, the City requested permission from the EPA to make diversion of the groundwater into the sewer system permanent. As of the issuance of this report, the EPA is considering this request.
1��
City of San Diego ComprehenSive annual finanCial report
18. Contingencies
18. CONTINGENCIES (In Thousands)
FEDERAL AND STATE GRANTS
Grant monies received as reimbursement for costs incurred in Federal and State programs administered by the City are recognized as revenue. Although the City's Federal grant programs are audited in accordance with the requirements of the Federal Single Audit Act of 1984, the Single Audit Act Amendments of 1996, and the related U.S. Office of Management and Budget Circular A-133, these programs may be subject to financial and compliance audits by the reimbursing agencies. The amount, if any, of expenditures which may be disallowed by the granting agencies cannot be determined at this time. The Single Audits for fiscal years ended June 30, 2004, 2005 and 2006 were completed by Macias Gini & O’Connell LLP and have been received and filed by the City Council.
Additionally, the local unit of the U.S. Department of Housing and Urban Development (HUD) has recently conducted an audit survey of the City’s Community Development Block Grant (CDBG) program. The overall objective of the audit survey was to determine whether management complied with applicable laws, regulations, and requirements of HUD’s CDBG program. After reviewing the program, HUD indicated that the City may not be in compliance with CFR 85.25. Specifically, HUD is concerned with CDBG loans to RDA, “Re-Loans”, and other program eligibility issues.
The Office of the Inspector General (OIG) subsequently began an audit which focused on CDBG loans with RDA. As part of the audit process HUD has recommended that the City and RDA ensure timely payments of both principal and interest on CDBG loans made from the City to RDA. The total amount of the loans identified by HUD was $139,202. These loans are reported as a component of loans payable and accrued interest payable to the City in the long-term liabilities footnote of the Redevelopment Agency Financial Statements with an “unscheduled” maturity date. OIG has indicated a need to establish a repayment schedule; however, did not stipulate a proposed time period for repayment. Depending on the outcome of negotiations with HUD, repayment of the loans by RDA could impact RDA’s liquidity. These loans do not appear in the City’s CAFR as they represent interfund loans between two governmental funds in which repayment is not expected in a reasonable amount of time. Therefore, these loans are reported as interfund transfers in the fund level statements, and then eliminated as interfund activity in the government wide statements per GASB 34.
It is currently uncertain what, if any, other action HUD will take concerning potential non-compliance regulations over the use of federal funds. HUD also plans to proceed with another audit focusing on other CDBG activities, and this is scheduled to begin in October 2008.
CONTINUING DISCLOSURE OBLIGATIONS
The City, in connection with all bond offerings since the effective date (July 1995) of the continuing disclosure requirements of SEC Rule 15c2-12, has contractually obligated itself to provide annual financial information, including audited financial statements, within certain specified time periods (generally nine months) after the end of each fiscal year. The City has not been able to satisfy its contractual obligations to provide to the national repositories audited financial statements, or financial information and operating data derived from the financial statements, for fiscal years 2003 through 2007 on a timely basis. At the time of each deadline, the City, as required by its continuing disclosure contractual obligations, provided to the national repositories a notice of the failure to file the audited annual financial statements information.
REGULATORY AND OTHER INDEPENDENT INVESTIGATIONS
In November 2006, the Securities and Exchange Commission (SEC) entered an Order sanctioning the City of San Diego for committing securities fraud by failing to disclose, in 2002 and 2003, material information about its pension and retiree healthcare obligations in connection with disclosures relating to the sale of its municipal bonds. To settle the action, the City
1��
City of San Diego ComprehenSive annual finanCial report
agreed to cease and desist from future securities fraud violations and to retain an independent consultant for three years to foster compliance with its disclosure obligations under the federal securities laws.
The SEC made the following determinations in the Order (figures are as of the date of the Order unless otherwise noted):
The City failed to disclose that the City's unfunded liability to its pension plan was projected to increase to an estimated $2 billion at the beginning of fiscal year 2009, and that the City knew and failed to disclose that its health care liability would be in excess of $1.1 billion. (The information presented in the SDCERS actuarial valuation for the fiscal year ended June 30, 2007, which will be incorporated in the City’s fiscal year 2009 financial statements, reported the unfunded actuarial liability to be $1.183 billion.)
The City failed to disclose that it had been intentionally under-funding its pension obligations so that it could increase pension benefits but defer the costs, and that it would face severe difficulty funding its future pension and retiree healthcare obligations unless new revenues were obtained, pension and healthcare benefits were reduced, or City services were reduced.
The City knew or was reckless in not knowing that its disclosures were materially misleading.
The City made these misleading statements through three different means:
1. In the offering documents for five municipal offerings in 2002 and 2003 that raised over $260 million from investors. The offering documents containing the misleading statements included the "official statements," which were intended to disclose material information to investors, and the "preliminary official statements," which were used to gauge investors' interest in a bond issuance.
2. The City made misleading statements to the agencies that gave the City its credit rating for its municipal bonds.
3. The City made misleading statements in its "continuing disclosure statements," which described the City's financial condition and were provided by the City to the municipal securities market with respect to prior City bond offerings.
The City consented to the issuance of the Order without admitting or denying the findings in the Order. The SEC's investigation with respect to the City’s misleading disclosures is ongoing as to individuals and other entities that may have violated the federal securities laws.
The SEC Order sanctioning the City of San Diego for committing securities fraud is available at: www.sec.gov
Prior to settlement with the SEC, the City engaged a number of firms to review the City’s disclosure practices and to investigate potential illegal acts. In February 2004, the law firm of Vinson & Elkins LLP (V&E) was engaged to conduct a review of the adequacy of the City’s financial disclosure relating to the pension fund in bond offerings from 1996 to 2002 and to prepare a report on its findings. In September 2004, V&E released a report that identified a number of disclosure deficiencies and made recommendations on how to remediate their causes. The report did not offer conclusions on the culpability of individual members of the City’s government.
Many of the recommendations contained in the V&E report were adopted by the City in October 2004. However, the City’s accounting firm, KPMG, advised that the report did not provide a sufficient basis to conclude that all questions necessary to the completion of the audit were sufficiently investigated and resolved in a manner that would permit the issuance of an audit report. In response, the City engaged a professional consulting firm, Kroll Inc. (Kroll) and the law firm Willkie, Farr andGallagher LLP, to act in the capacity of an audit committee. Kroll took over the investigation. The independent investigations
1�7
City of San Diego ComprehenSive annual finanCial report
concluded when Kroll presented its final report to the City on August 8, 2006. The Kroll report concluded that there were numerous failures on the part of City government to conform to law, to adhere to principles of sound governance and financial reporting, and to protect the financial integrity of the City’s pension system. The Kroll report was more fully summarized in the City’s fiscal year 2003 financial report. The City’s fiscal year 2003 financial report, and the entire Krollreport including interview summaries and footnotes, as well as the V&E report, are available at: www.sandiego.gov.
REMEDIATION OF CITY DISCLOSURE DEFICIENCIES
The City has taken a variety of remedial actions in the wake of the disclosure deficiencies identified by V&E, Kroll and the SEC. In response to the V&E Report, the City amended the municipal code to address certain control environment issues. The Disclosure Ordinance created the Disclosure Practices Working Group composed of City officials and outside disclosure counsel to review the form and content of all financial disclosures by the City and its related entities and a finance and disclosure unit within the City Attorney’s Office. Pursuant to the Ordinance, the Auditor and Comptroller is required to annually review and report on internal controls within the City. In addition, mandatory training is required for City staff andofficials, including the City Council and Mayor, regarding their obligations under federal and state securities laws.
Further reforms were proposed by the Mayor to address deficiencies identified in the Kroll Report. A monitor, who also serves as the Independent Consultant pursuant to the Order, was appointed on January 26, 2007, to oversee the implementation of the Mayor’s remediation plan. Structural changes were made to the City’s Finance Department to enhance accountability to the City’s Chief Financial Officer, who also serves as the Auditor and Comptroller. The City Council amended the Municipal Code to create an Audit Committee comprised of three Councilmembers, which provides legislative oversight of the City’s accounting and financial reporting processes and internal audit function.
In Fall 2007, an Internal Auditor was appointed by the Mayor, in consultation with the Audit Committee. The Internal Auditor reports to both the Chief Operating Officer and the Audit Committee. The City has also retained an independent actuary to provide periodic analysis of SDCERS’ actuarial reporting and of the fiscal impact of pension and benefit related decisions. An Enterprise Resource Planning (“ERP”) system has been purchased to enhance the timeliness and accuracy of the City’s operational reporting; the first ERP modules are scheduled for activation in October 2008.
Certain recommendations included in the Kroll Report and the Mayor’s remediation plan require further action by the City or the voters. An ordinance imposing criminal penalties for City employees who improperly influence the City’s outside consultants has not been presented to the City Council for consideration. Changes to the City Charter to enhance the independence of both the Internal Auditor and the Audit Committee were approved with the passage of Proposition C (Prop C) in the June 3, 2008 election and are discussed in more detail below and in Note 22.
INDEPENDENT CONSULTANT’S ANNUAL REVIEW
The Independent Consultant required by the SEC Order has several specific mandates. Among these are annual reviews, for a three year period, of the City’s policies, procedures and internal controls regarding financial disclosures. The Independent Consultant is also required to make recommendations concerning the City’s policies, procedures and internal controls and to assess the City’s adoption and implementation of these recommendations.
On June 7, 2007, the Independent Consultant issued an interim report to the City and the SEC to provide a preliminary review and assessment of the City’s policies, procedures and internal controls over financial reporting. This report was not an annual review, but intended to provide an initial update of the City’s progress. The SEC issued a letter acknowledging this initial report on July 23, 2007, recognizing the recommendations outlined and indicating that subsequent reports would provide more complete, specific and concrete recommendations with specific deadlines. The City responded to the SEC
1�8
City of San Diego ComprehenSive annual finanCial report
letter on September 25, 2007, citing actions already taken by the City to strengthen internal controls over financial reportingand confirming the City’s intent to continue working with the Independent Consultant in the near future.
On March 25, 2008 the Independent Consultant issued his first annual report to the City of San Diego which was received by the City Council on April 1, 2008. This report focused solely on the City’s ongoing disclosure efforts and future compliance with disclosure obligations under federal securities laws. His recommendations are summarized below:
Reconstitute the Audit Committee to be independent from financial management, which has the requisite expertise to perform its oversight functions, and has a sufficient relationship with the City Council to engender its confidence in view of the Council’s role in the City’s financial reporting. This recommendation was consistent with the June 3, 2008 Prop C charter revision which approved an Audit Committee consisting of two Councilmembers, one of whom would be chair, and three public members who must have at least 10 years of professional finance experience. Creation of an internal audit department separate from the Auditor and Comptroller’s Office which directly reports to the Audit Committee. This recommendation was implemented with the approval of Prop C. Significantly increase staffing of the internal audit department. Involve the Audit Committee with hotline activity involving improper financial conduct and fraud. Establish a clear Chief Financial Officer position in the City Charter. This recommendation was implemented with the approval of Prop C. Better integrate and coordinate ERP and Internal Controls over Financial Reporting (ICFR) process to align objective and maximize resources. Devote additional resources to the ICFR process, and develop period end financial reporting routines. Also, report quarterly to the Audit Committee on the progress of these efforts. There were also several recommendations regarding the Audit Committee’s procedures over CAFR review; consideration of a shelf-like disclosure system with the DPWG; review of the DPWG practices and functions; and others.
The complete report is available at: www.sandiego.gov.
GENERAL INVESTIGATIONS
The City Attorney is currently being investigated by the California State Bar. Bar investigations are confidential and the scope, nature, and likely outcome of the investigation are not known.
LITIGATION AND REGULATORY ACTIONS
The City is a defendant in lawsuits pertaining to material matters, including claims asserted which are incidental to performing routine governmental and other functions. This litigation includes but is not limited to: actions commenced and claims asserted against the City arising out of alleged torts; alleged breaches of contracts; alleged violations of law; and condemnation proceedings. The City has received approximately 2,300 notices of claims in fiscal year 2007.
The estimate of the liability for unsettled claims has been reported in the Government-Wide Statement of Net Assets and the Proprietary Funds financial statements. The liability was estimated by categorizing the various claims and supplemented by information provided by the City Attorney with respect to certain large individual claims and proceedings. The recorded liability is the City’s best estimate based on available information.
1��
City of San Diego ComprehenSive annual finanCial report
Significant individual lawsuits are described below.
SDCERS v. City of San Diego
In 1996 and 2002, SDCERS, the City and various labor unions entered into agreements wherein the City of San Diego contributed less to the pension system than what was actuarially required. SDCERS has filed a complaint claiming the benefits are legal and should continue to be paid by the City. The City Attorney filed a cross-complaint alleging the benefitswere not legal; however, that case was dismissed in December 2006. The City Attorney is currently appealing the case before the Court of Appeals.
San Diego Police Officer’s/ABBE v. City of San Diego
On October 25, 2005, the SDPOA (SDPOA #2) filed a lawsuit against the City alleging failure to pay for overtime work under the Fair Labor Standards Act. The likelihood of an unfavorable outcome is reasonably possible and the liability is estimated to be in the range of $0 - $15,000.
Wayne Akeson, et al. v. City of San Diego
On August 6, 2006, a lawsuit arose following a water main break which caused flooding along a private street in the Colony Hills Homeowners Association (HOA) in La Jolla. Claimants allege the water main failure caused soil subsidence, hillside failure, road failure and diminished property values of 40 HOA homes. In the event of an adverse ruling, the liability facing the City is estimated to be in the range of $0 - $40,000.
Ace Properties v. City of San Diego
On October 2, 2006, Ace Properties entered into an inverse condemnation case against the City of San Diego. In the event of an adverse ruling, the liability facing the City is estimated to be in the range of $0 - $3,000.
Significant regulatory actions are described below (Other regulatory actions are described in Notes 17 and 22).
California Regional Water Quality Board Administrative Proceeding
The City is in an on-going administrative proceeding before the California Regional Water Quality Control Board (RWQCB) where it has been alleged that the City, along with eight other entities, have contributed to polluting San Diego Bay, a condition which requires abatement. The allegations relate to current and historic discharges of urban runoff into Chollas Creek, which drains into the San Diego Bay. The City has retained consultants to assess the available data and therefore it is difficult to determine likelihood of an unfavorable outcome. However, the RWQCB has estimated that remediation costs could range between $900 and $122,000 depending on the remedy selected, and the City would have a yet-to-be determined share of those remediation costs if an unfavorable outcome were to happen.
IRS Voluntary Correction Program Settlement
SDCERS is operated as a qualified governmental defined benefit plan under Internal Revenue Code (IRC) §§ 401(a) and 414(d). In light of various concerns raised in investigative reports regarding practices of SDCERS that could have jeopardized its status as a qualified governmental defined benefit plan, SDCERS requested its outside tax counsel, Ice Miller LLP, to perform a comprehensive document compliance review, prepare submissions in accordance with the IRS Voluntary Correction Program (VCP), and work with the IRS to finalize a compliance statement to resolve SDCERS’ compliance issues. A comprehensive settlement was reached between the IRS and SDCERS on December 20, 2007 (Settlement). The Settlement required the City and SCDERS to take certain corrective actions, some of which required Council approval, regarding certain provisions of its retirement plan within 150 days of December 20, 2007. The Settlement
1�0
City of San Diego ComprehenSive annual finanCial report
did not require the City to pay any penalty payments or to make any additional contributions to the retirement system. On April 15, 2008, Council approved Ordinance O-2008-133 to comply with the IRS requirements outlined in the Settlement.
The VCP filings identified violations and proposed corrections regarding the City’s Presidential Leave Program for presidents of certain labor organizations that represent City employees; compensation limits under IRC § 401(a)(17); minimum distribution requirements under IRC § 401(a)(9); eligible rollover distribution compliance under IRC § 401(a)(31); minimum distribution requirements from the Deferred Retirement Option Plan (DROP) program; overpayment of disability benefits; conversion of annual leave to purchased service credits; retiree healthcare benefits and health administrative expenses under IRC § 401(h); benefit and compensation limits under IRC §§§ 415(b), 415(c) and 415(n); and remedial plan amendments.
The practice of using pension plan assets, and later a bifurcation of City contributions to the pension plan to fund retirementhealthcare benefits, resulted in the most significant plan violation in monetary terms. The compliance statement identified that from 1983 through 1991, retiree health benefits were paid by SDCERS when the plan document did not provide for such benefits. Additionally, the compliance statement states that the plan was not appropriately reimbursed for administrative expenses related to the provision of retiree health benefits from 1993 to 2006. Both of these failures were related to non-compliance with IRC § 401(a)(2). The cumulative value of improper payments associated with this failure was approximately $34 million. In a separate failure, the compliance statement also identified that from 1998 through 2005, the terms of the Plan did not comply with all of the provisions of IRC §§ 401(a)2 and 401(h) as it relates to the plan’s administration of retirement health benefits and the use of plan earnings to fund the benefits. The compliance statement indicated that the manner in which the benefits were funded “made it extremely difficult, if not impossible to resolve that there was no inappropriate use of the Plan Assets.” In this regard, and for the purposes of presenting fairly the effect on netassets, the City has estimated that from 1988 through 2006, the cumulative effect of the improper funding and administration of Retiree Health Benefits was approximately $77.1 million. These amounts will be treated as a reduction to City contributions against its Annually Required Contribution during the year in which the expenditures occurred and instead recorded as part of the City’s Net Pension Obligation.
With regard to benefit and compensation limits, in March 2001, the City Council authorized the establishment of a Preservation of Benefit Plan. A preservation of benefit plan (POB) is a qualified governmental excess benefit arrangement (QEBA) under IRC § 415(m), which is a vehicle created by Congress to allow the payment of promised pension benefits that exceed the IRC § 415(b) limits. While the City Council approved the establishment of a POB satisfying the requirements of § 415(m), the City has not received a determination letter from the IRS approving the formation of its POB QEBA. Under the Internal Revenue Code, the City may not pre-fund the POB to cover future liabilities beyond the current year, as with the 401(a) plan. Despite the creation of the POB by the City Council in March 2001, SDCERS continued to treat the excess amounts as payable from the 401(a) plan assets in violation of law. SDCERS did not establish a POB and Trust until February 2007. In future years, SDCERS will determine the amount necessary to fund any pension benefits payable during the calendar year in excess of the amount permitted by IRC § 415(b). This amount will include the projected amount of all excess pension benefits payable for the calendar year as well as the projected cost of administering the POB for the calendar year. SDCERS will provide this information to the City and the City will pay these costs on an annual basis. The City transferred money into a new POB account in December 2007 to fund POB payments. With the issuance of the Compliance Statement, SDCERS has stopped paying benefits in excess of IRC § 415(b) limits from the SDCERS Trust Fund. Benefits in excess of IRC § 415(b) limits will be paid only from the POB.
The estimated actuarially accrued liability related to excess benefits for eligible active members of the system, amounting to approximately $22.8 million, has been excluded from the actuarial valuation of the 401(a) retirement plan beginning in fiscal year 2006 (this liability is estimated to be approximately $30.4 million in the fiscal year 2007 actuarial valuation). Additionally, the liability for retired members of the Preservation of Benefit Plan, amounting to approximately $6.4 million, has been excluded from the fiscal year 2007 actuarial valuation of the 401(a) retirement plan. Accordingly, the liability related to excess benefits for retired members is reflected in the actuarial liabilities of the 401(a) plan in the actuarial
1�1
City of San Diego ComprehenSive annual finanCial report
valuation dated June 30, 2006 as well as in the ARC payable in fiscal year 2008.
In fiscal year 2005, costs related to the Preservation of Benefit Plan for both retired and active members are included in the actuarial liabilities presented in the Required Supplementary Information (RSI) for the City’s core pension plan and are valued using the same set of assumptions. In a review of the financial statements of other local governments, the City has noted significant diversity of practice in how governments are accounting for QEBAs. As such, the City is in the process of implementing a plan to account for the QEBA with SDCERS.
City Attorney Concerns with Pension System
The City Attorney has concluded that, in his opinion, the retirement benefits paid in excess of IRC § 415(b) limits referenced above, require voter approval as such benefits constitute a distinct pension plan not authorized under the City Charter. Therefore, it is also his opinion that the retirement benefits paid in excess of IRC § 415(b) limits are illegal and that the City should immediately discontinue payment. Other members of management believe that this issue has yet to be resolved in court related to lawsuits previously filed by the City Attorney. As such, the City intends to continue to treat these benefits aslegal obligations until instructed to do otherwise by a court of law. In the opinion of management, a decision to terminate such benefits would expose the City’s residents to unnecessary and costly legal fees.
In addition, the City Attorney has written to the Internal Revenue Service, in letters dated September 13, 2007, October 3, 2007 and November 6, 2007, expressing his concerns that the pension plan in its current form violates various provisions of the City Charter and the Municipal Code, and that such violations could jeopardize the status of SDCERS as a qualified governmental defined benefit plan. In addition to matters identified elsewhere in these notes and the IRS Compliance Statement, set forth below are additional concerns raised in such letters or in other public pronouncements of the City Attorney:
1. DROP: The City Attorney has alleged that the DROP program, as discussed in Note 12, is not currently operated on a cost neutral basis. Municipal Code section 24.1401(b) provides that “DROP is intended to be cost neutral.” In DROP, the employee’s retirement benefit calculation is fixed as of the date of participation and they continue to work for the City up to five years, while their monthly pension benefit is deposited into an individual account held by SDCERS. ¹
2. Purchase of Service Credit Program: Employees hired before July 1, 2005 were permitted to buy creditable years of service below cost; however, such program was also intended to be cost neutral as reflected in a City Manager Memorandum to the Council at the time Council approved such program.¹
3. Term Limit: Elected officials are permitted to buy creditable years of service in excess of the time they are permitted to serve under section 12(f) of the City Charter (two consecutive four-year terms). ²
4. Pension Plan Vesting Requirement: Employees were allowed credit for pension years purchased below cost to satisfy the retirement plan’s 10 year vesting requirement. In relation to non-public safety employees, the Charter provides that “No employee shall be retired before reaching the age of 62 years and before completing 10 years of service for which payment has been made, except such employees may be given the option to retire at the age of 55 years after 20 years of service for which payment has been made with a proportionally reduced allowance”.¹
¹ As of issuance of this report, these matters are currently on appeal to the California Court of Appeals, Fourth District, and the parties are presently waiting to be apprised of the briefing schedule by the court.
² As of issuance of this report, this concern has not been involved in any type of litigation.

1�2
City of San Diego ComprehenSive annual finanCial report
5. Retirement Age: Non-public safety employees were permitted to use pension years purchased below cost to retire at 55 rather than 62, without regard to whether they have 20 years of service.¹
Other members of management believe that the legal status of these matters has not been definitively determined and do not raise IRS qualification issues. Furthermore, other members of management note that while the IRS was made aware of these issues prior to issuing the compliance statement and Determination Letter discussed earlier in the note, to date the IRS has not determined to take any action regarding the issues alleged by the City Attorney.
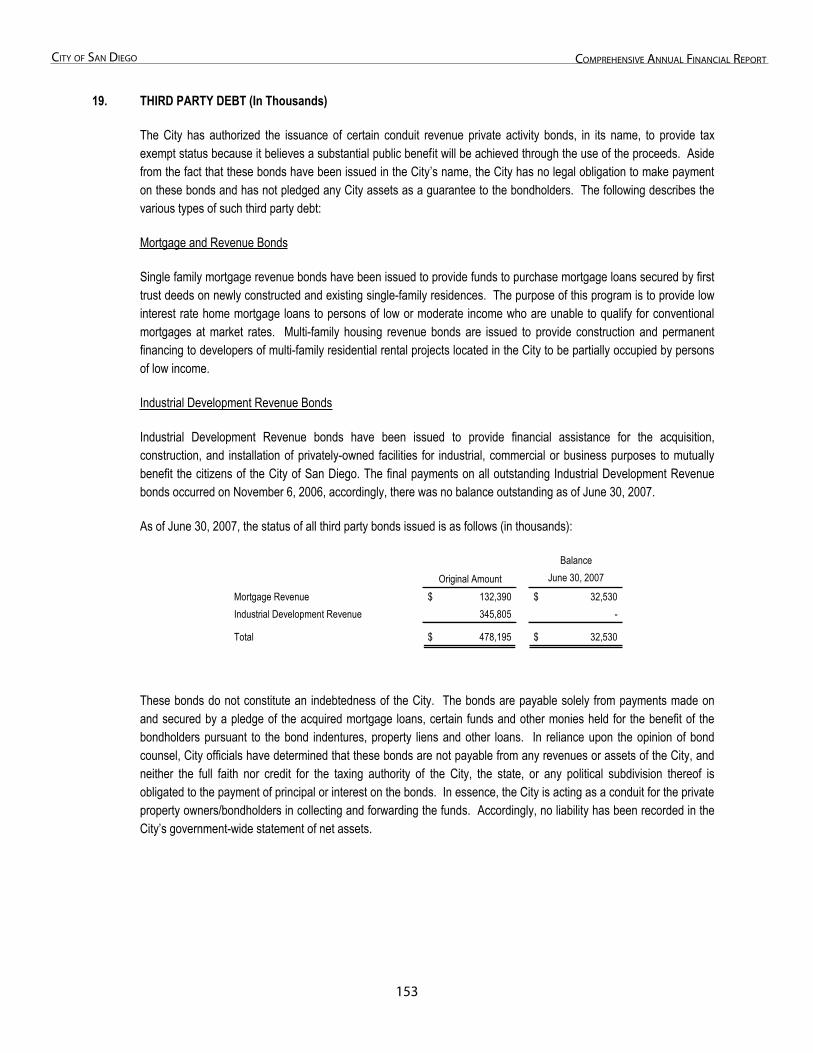
1�3
City of San Diego ComprehenSive annual finanCial report
19. Third Party Debt
19. THIRD PARTY DEBT (In Thousands)
The City has authorized the issuance of certain conduit revenue private activity bonds, in its name, to provide tax exempt status because it believes a substantial public benefit will be achieved through the use of the proceeds. Aside from the fact that these bonds have been issued in the City’s name, the City has no legal obligation to make payment on these bonds and has not pledged any City assets as a guarantee to the bondholders. The following describes the various types of such third party debt:
Mortgage and Revenue Bonds
Single family mortgage revenue bonds have been issued to provide funds to purchase mortgage loans secured by first trust deeds on newly constructed and existing single-family residences. The purpose of this program is to provide low interest rate home mortgage loans to persons of low or moderate income who are unable to qualify for conventional mortgages at market rates. Multi-family housing revenue bonds are issued to provide construction and permanent financing to developers of multi-family residential rental projects located in the City to be partially occupied by persons of low income.
Industrial Development Revenue Bonds
Industrial Development Revenue bonds have been issued to provide financial assistance for the acquisition, construction, and installation of privately-owned facilities for industrial, commercial or business purposes to mutually benefit the citizens of the City of San Diego. The final payments on all outstanding Industrial Development Revenue bonds occurred on November 6, 2006, accordingly, there was no balance outstanding as of June 30, 2007.
As of June 30, 2007, the status of all third party bonds issued is as follows (in thousands):
BalanceJune 30, 2007
Mortgage Revenue 132,390$ 32,530$ Industrial Development Revenue 345,805 -
Total 478,195$ 32,530$
Original Amount
These bonds do not constitute an indebtedness of the City. The bonds are payable solely from payments made on and secured by a pledge of the acquired mortgage loans, certain funds and other monies held for the benefit of the bondholders pursuant to the bond indentures, property liens and other loans. In reliance upon the opinion of bond counsel, City officials have determined that these bonds are not payable from any revenues or assets of the City, and neither the full faith nor credit for the taxing authority of the City, the state, or any political subdivision thereof is obligated to the payment of principal or interest on the bonds. In essence, the City is acting as a conduit for the private property owners/bondholders in collecting and forwarding the funds. Accordingly, no liability has been recorded in the City’s government-wide statement of net assets.
1��
City of San Diego ComprehenSive annual finanCial report
20. Closure and Post Closure
20. CLOSURE AND POST CLOSURE CARE COST (In Thousands)
State and federal laws and regulations require that the City of San Diego place a final cover on its Miramar Landfill site when it stops accepting waste and to perform certain maintenance and monitoring functions at the site for thirty years after closure. Although closure and post closure care costs will be paid only near or after the date that the landfill stops accepting waste, the City reports a portion of these closure and post closure care costs as an operating expense in each period based on landfill capacity used as of each financial statement date.
The $16,935 reported as landfill closure and post closure care liability at June 30, 2007 represents the cumulative amount reported to date based on the use of 84% of the estimated capacity of the landfill.
The City will recognize the remaining estimated cost of closure and post closure care of $3,216 as the remaining estimated capacity is filled. These amounts are based on what it would cost to perform all closure and post-closure care at June 30, 2007. The City expects to close the landfill in fiscal year 2012. Actual costs may be higher due to inflation, changes in technology, or changes in regulations.
The City is required by state and federal laws and regulations to make annual contributions to finance closure and post-closure care. The City is in compliance with these requirements and at June 30, 2007, cash or equity in pooled cash and investments of $34,389 was held for this purpose. This is reported as restricted assets on the statement of net assets in the Environmental Services Fund. The City expects that future inflation costs will be paid from interest earnings on these annual contributions. However, if interest earnings are inadequate or additional post-closure care requirements are determined (due to changes in technology or applicable laws or regulations, for example), these costs may need to be paid by charges to future landfill users or from other sources.
1��
City of San Diego ComprehenSive annual finanCial report
21. Operating Agreements
21. OPERATING AGREEMENTS (In Thousands)
San Diego Data Processing Corporation and Automated Regional Justice Information System
SDDPC has a yearly information technology services contract agreement with a joint powers agency known as the Automated Regional Justice Information System (“ARJIS”) whose main purpose is to pursue development of computerized law enforcement systems in the region.
Under the agreement, SDDPC provides information technology services to ARJIS at rates which, on an annual basis, are equivalent to those charged to other governmental agency clients. Included in SDDPC’s services revenue is approximately $2,833 related to ARJIS for the year ended June 30, 2007.
City of San Diego and San Diego Medical Services Enterprise, LLC
On July 1, 1997, the City entered into an operating agreement with Rural/Metro Corporation, a provider of emergency medical transport services, to form San Diego Medical Services Enterprise, LLC (SDMSE) for the purpose of providing the City with emergency medical services and to provide for “911” emergency calls. The operating agreement and related contracts to provide such services were renewed on July 1, 2002 and again on July 1, 2005. On July 1, 2008 operations were extended until December 31, 2008 under a separate extension agreement while a competitive bidding process is being conducted. The operating agreement will expire on December 31, 2008 unless SDMSE is awarded a new contract after the competitive bidding process.
City of San Diego and Padres L.P.
On February 1, 2000, the City entered into a Joint Use and Management Agreement (Agreement) with the San Diego Padres baseball team (Padres) governing the rights and duties of the City and Padres with respect to the use and operation of the new Petco Park Ballpark Facility (Facility). The Facility was completed and operational in April 2004. The City and Padres jointly own the facility; the Padres having a 30% divided interest based upon the original Facility cost estimate of $267,500 (or $80,250) with the City owning 70% which is capitalized on the City’s books. The City and the Padres have agreed upon the schedule of items and components that constitute the Padres’ divided ownership, and the value of that divided ownership may vary from (but does not exceed) 30% due to the calculation of cost overruns for the Ballpark. Following termination of any occupancy agreement for the Ballpark, the Padres’ ownership interest will automatically transfer to the City. Under the terms of the Agreement, the Padres are responsible for Facility operation and management, including maintenance, repairs and security required to preserve its condition. The City is responsible for paying certain expenses associated with the operation and maintenance of the Facility, up to a maximum of $3,500 per year, subject to certain inflationary adjustments.
1��
City of San Diego ComprehenSive annual finanCial report
22. Subsequent Events
22. SUBSEQUENT EVENTS (In Thousands)
On July 2, 2007, the City privately placed a fiscal year 2007-2008 Tax Revenue Anticipation Note in the amount of $116,000 to meet general fund cash flow needs of the City on a thirteen month term. The fiscal year 2007-2008 Tax Revenue Anticipation Note was repaid on August 1, 2008.
On July 12, 2007, PFFA issued $17,230 of Series 2007A taxable pooled financing bonds for Southcrest, Central Imperial and Mount Hope Redevelopment Projects and $17,755 of Series 2007B tax-exempt pooled financing Bonds for Southcrest and Central Imperial Redevelopment Projects. The Series 2007A and Series 2007B bonds were issued to make loans to RDA for financing and refinancing redevelopment activities in the Southcrest, Central Imperial and Mount Hope Redevelopment Project areas. The issuance was through a public offering. The Series 2007A and 2007B bonds are secured by a Loan Agreement, a Second Supplemental Trust Agreement (Central Imperial Redevelopment Project Area), a Third Supplemental Trust Agreement (Southcrest Redevelopment Project Area), and a Fourth Supplemental Trust Agreement (Mount Hope Redevelopment Area), and are payable solely from the tax increment revenues derived from each project area. The fixed rate on the term bonds range from 4.0% to 6.65%, and the final maturity date is October 1, 2037.
On July 17, 2007, a breach of contract lawsuit was filed against the City of San Diego. In the event of an adverse ruling, the liability facing the City is estimated to be in the range of $0 - $2,000.
On July 26, 2007, RDA executed six separate non-revolving secured three-year term taxable and tax-exempt lines of credit with San Diego National Bank. Four taxable lines of credit are for affordable housing in North Park, City Heights, North Bay and Naval Training Center (NTC) Redevelopment Project Areas for an aggregate of $34,000. The two remaining lines of credit are for non-housing or general purposes, one of which is a taxable line of credit in the amount of $20,000 for City Heights, and the other is for the NTC Redevelopment Project, which is taxable for $6,000 and tax-exempt for $10,000. RDA may elect to have the taxable advance bear interest at a fixed rate equal to the United States Three-Year Treasury Constant Maturities Index plus 1.90%, which will remain fixed for the entire period of such advance, or elect to have the interest set at a fixed rate equal to the One-Month LIBOR Rate plus 1.10%. Tax-exempt advances will bear interest at a fixed rate determined by adding .70% to the product of the One-Month LIBOR Rate multiplied by 90%. Interest will be payable quarterly in arrears along with a .45% per annum loan fee on the unused commitment. Principal is due at maturity with no prepayment penalty.
On September 28, 2007, several current firefighters for the City of San Diego filed suit against the City of San Diego Fire Department alleging sexual harassment, failure to prevent harassment, retaliation, emotional distress, and violation of freedom of speech experienced during the 2007 Gay Pride Parade in San Diego. In the event of an adverse ruling, the liability facing the City is estimated to be in the range of $0 - $3,000.
On October 21, 2007, multiple wild fires began burning throughout the county of San Diego. Fueled by dry Santa Ana winds, these fires prompted the evacuation of an estimated 500,000 residents. As of the issuance of this report, the City estimates that the fire related costs are approximately $24,000. The City has received cash advances of $5,800 to reimburse a portion of these costs and expects to receive additional reimbursements from federal and state agencies and other sources ranging from $0 - $16,000.
In December, 2007 the City of San Diego submitted an application to the EPA to request a renewal of a modified permit for the Point Loma Wastewater Treatment Plant. Point Loma successfully received a modified permit (also known as a waiver) in 1995, which was renewed in 2002. This will be the City’s second renewal request. The application is currently under review and a tentative decision is expected in late November or December 2008. In the event the waiver is not approved for renewal the current cost estimate is $1,500,000 to the City, assuming the City cannot access land from the Navy or the United States Park Service. This estimate includes all financing and interest costs. There would also be an estimated increase in operating and maintenance costs of approximately $40,000 per year.
On January 18, 2008, the City Council approved, by majority vote, to enter into a trust arrangement to pre-fund expenses related to Other Post Employment Benefits. The trust, administered by CalPERS, requires the City to pre-fund the post employment benefits in an amount not less than $5 annually.
1�7
City of San Diego ComprehenSive annual finanCial report
On February 28, 2008, PFFA sold, on a private placement basis, $150,000 of Subordinated Water Revenue Notes to finance the acquisition and construction of the City’s water system and to reimburse for previous costs incurred. The Series 2008A Notes are secured by and payable solely from net system revenues of the Water Utility Fund. The 2008A Notes bear an interest rate of 3.28%, and the maturity date is August 28, 2009.
On April 1, 2008, the City Council approved, by majority vote, the tri-party Compliance Statement between the City of San Diego, SDCERS, and the Internal Revenue Service, which resolves SDCERS’ Voluntary Correction Plan submissions. The Compliance Statement requires City Council to adopt certain Technical Tax ordinance amendments in order for SDCERS to maintain their qualified tax exempt status. On April 15, 2008, O-19740 was approved unanimously by City Council to amend the Tax Ordinance Retirement Plan consistent with the Compliance Statement.
On April 10, 2008, the City issued $3,950 of Community Facilities District No. 3 (Liberty Station) Special Tax Bonds, Series 2008A. Proceeds of the bonds were used to finance various public improvements needed to develop property located within the District. The 2008 bonds were issued pursuant to the Mello-Roos Community Facilities Act of 1982 and are special, limited obligations of the district. The bonds are structured as serial and term bonds and were issued on a fixed rate basis. The interest rate on the bonds range from 3.5% to 6.1%, and the final maturity date is September 1, 2036.
On June 3, 2008, the voters of San Diego approved Proposition C (Prop C). Prop C amends the City Charter to separate the City’s internal auditing function from supervision of the Manager (Mayor) by creating the new office of the City Auditor, which will be supervised by a restructured Audit Committee. The Audit Committee will consist of two Council members, one being chair, and three public members. The public members must have at least 10 years of professional finance experience, and will be appointed from candidates recommended from a screening committee comprised of the CFO, the IBA, one Council member, and two outside experts. Prop C also provides that the Manager (Mayor) will appoint, with Council confirmation, the CFO, who will assume the City’s accounting responsibilities and oversee the City Treasurer. The measure also makes the Office of the IBA permanent, which would otherwise expire if the strong-mayor form of government does not get approved permanently in the year 2010.
On June 5, 2008, RDA issued $69,000 of Housing Tax Allocation Bonds for the purpose of financing certain improvements relating to, or increasing the supply of, low and moderate income housing in the Centre City Redevelopment Project and such other areas as authorized by the Redevelopment Law. The Series 2008A bonds are payable from, secured equally and are on parity with, outstanding Centre City Redevelopment Project Tax Allocation Housing Bonds, Series 2004C, Series 2004D and 2006B bonds, by a charge and lien on the pledged housing tax revenues derived by RDA from the Redevelopment Project. The bond issuance is structured as serial and term bonds and has an interest rate that ranges from 3.74% to 6.30%, with a final maturity date of September 1, 2020.
On July 1, 2008, the City privately placed a fiscal year 2008-2009 Tax Revenue Anticipation Note in the amount of $135,000 to meet the general fund cash flow needs of the City on a fifteen month term.
Effective July 1, 2008, the San Diego Transportation Improvement Program Ordinance and Expenditure Plan (TransNet Extension Ordinance) took effect based on the November 4, 2004 ballot approved by voters of San Diego County. The TransNet Extension Ordinance provides that SANDAG, acting as the Regional Transportation Commission, shall approve a multi-year program of projects submitted by local jurisdictions, identifying those transportation projects eligible to use transportation sales tax (TransNet) funds. The five-year period covered by the 2008 Regional Transportation Improvement Program (RTIP) includes fiscal years 2009 through 2013 and requires that annually, the amount of local discretionary funding for streets and roads be budgeted per the most recently established minimum maintenance of effort requirement adopted by SANDAG. The TransNet Extension Ordinance also requires an extraction of two thousand dollars from the private sector for each newly constructed residential housing unit in each jurisdiction to comply with the provisions of the Regional Transportation Congestion Improvement Program (RTCIP). On June 17, 2008, the City Council authorized the Mayor, or his designee, to make a submission for the 2008 RTIP for the City of San Diego.
On July 23, 2008, the President of SEDC was terminated by the Board of SEDC under allegations of misconduct. There currently is litigation over the appropriateness of the severance package awarded and also seeking to recover misappropriated assets. In September, an audit report was released publicly that documented suspected incidences of fraudulent activity related to, among other things, executive compensation. On September 10, 2008, the Mayor
1�8
City of San Diego ComprehenSive annual finanCial report
requested that the District Attorney investigate this audit finding to determine if there was any criminal conduct involved.
On July 24, 2008, the President of CCDC resigned. During the months preceding and also subsequent to the resignation, allegations of misconduct stemming from potential violations of City and State of California conflict of interest laws became public. CCDC has since suspended activity on the projects associated with the alleged conflict of interest violations. Depending on the extent to which the counterparty was aware of conflicts of interest, CCDC could potentially be subject to litigation arising from construction delays or project cancellations. The full nature and extent of the misconduct along with the extent of any possible liability to the City or CCDC is currently unknown.
On August 21, 2008, the City issued $12,365 of Community Facilities District No. 4 (Black Mountain Ranch Villages) Special Tax Bonds to finance public improvements required in connection with the district. The Series 2008A bonds were issued pursuant to the Mello-Roos Community Facilities Act of 1982 and are limited obligations of the district. The bonds were structured as serial and term bonds, and were issued on a fixed rate basis. The fixed rate on the bonds range from 3.125% to 6.0%, and the final maturity date is September 1, 2037.
On September 22, 2008, the State passed its fiscal year 2008-2009 budget. This budget included a one-year, one-time ERAF shift of $350,000 from all California redevelopment agencies. ERAF is the Educational Revenue Anticipation Fund which is used by the County to accumulate property tax amounts shifted from local governments back to the State. These funds will not be repaid. The negative impact to RDA is projected to be $11,675 across all project areas.
The recent turmoil in the financial markets has been unprecedented. SDCERS has advised the City that as of June 30, 2008 the fair value of the Retirement System’s total portfolio was approximately $4,687,989 (unaudited), excluding securities lending and transactions in transit. As of September 30, 2008, SDCERS has estimated the fair value to be $4,320,007 (unaudited), which represents a decrease of $367,982, or 7.8%, during the first quarter in fiscal year 2009 (all values are based on available unaudited information). Changes in the value of the Retirement System assets are the result of gains and losses in investments and the variability of cash flows. The market continues to be volatile after September 30, 2008, but this cutoff date was chosen because it is the most recently closed period in SDCERS management’s monthly investment reporting process and a reasonable cut off period for disclosure of subsequent events to the fiscal year 2007 financial statements.
As is the case with most retirement systems, SDCERS is exposed to general market risk. This general market risk is reflected in asset valuations fluctuating with market volatility. Any impact from market volatility on the Retirement System depends in large measure on how deep the market downturn is, how long it lasts, and how it fits within fiscal year reporting periods. The resulting market risk and associated realized and unrealized gains and losses could impact the financial condition of the Retirement System and the City’s required contribution to the Retirement System. The reader of these financial statements is advised that financial markets continue to be volatile and are experiencing significant changes on almost a daily basis.
The City Treasurer’s Investment Policy limits the composition of the holdings within the City’s Equity in Pooled Cash and Investments held in City Treasury. The City Treasurer’s Investment staff continues to focus investment decisions in accordance with Investment Policy primary objectives, which are preservation of principal and liquidity and therefore any potential loss of principal on any of the City’s pooled investments is limited.
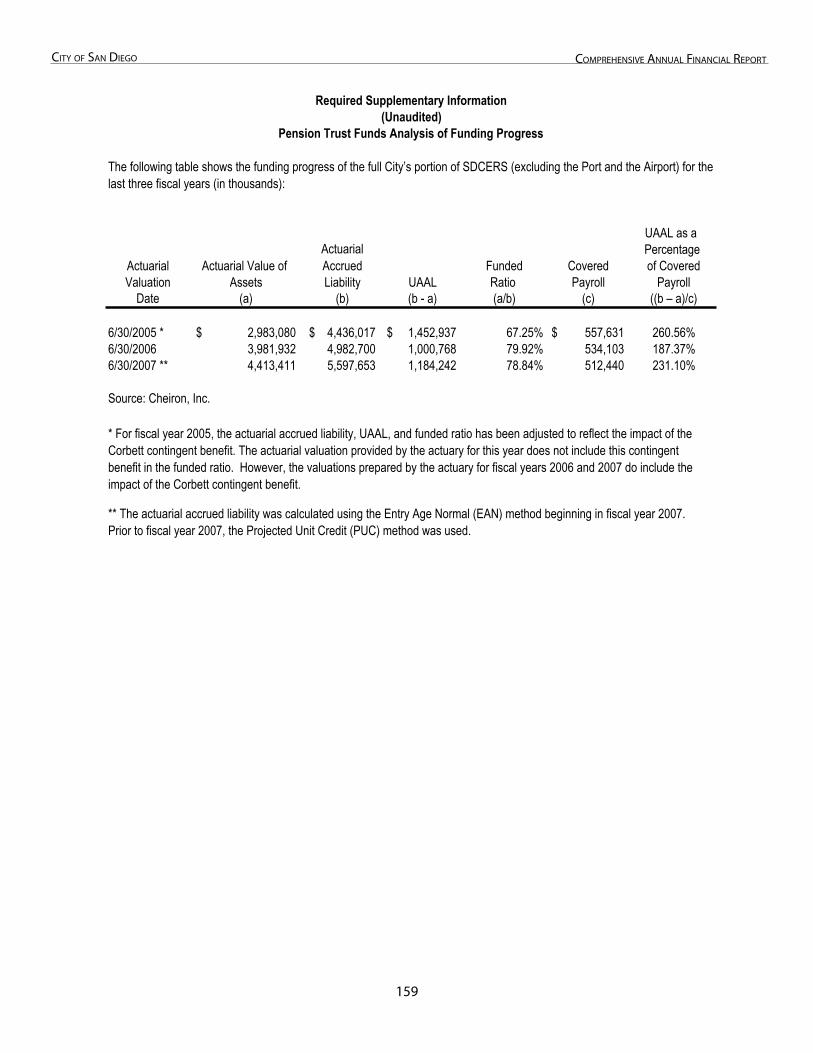
1��
City of San Diego ComprehenSive annual finanCial report
Required Supplementary Information
Pension Trust Funds Analysis of Funding
Required Supplementary Information(Unaudited)
Pension Trust Funds Analysis of Funding Progress
The following table shows the funding progress of the full City’s portion of SDCERS (excluding the Port and the Airport) for the last three fiscal years (in thousands):
UAAL as a
Actuarial Actuarial Value of ActuarialAccrued Funded Covered
Percentageof Covered
Valuation Assets Liability UAAL Ratio Payroll PayrollDate (a) (b) (b - a) (a/b) (c) ((b – a)/c)
6/30/2005 * 2,983,080$ 4,436,017$ 1,452,937$ 67.25% 557,631$ 260.56%6/30/2006 3,981,932 4,982,700 1,000,768 79.92% 534,103 187.37%6/30/2007 ** 4,413,411 5,597,653 1,184,242 78.84% 512,440 231.10%
Source: Cheiron, Inc.
* For fiscal year 2005, the actuarial accrued liability, UAAL, and funded ratio has been adjusted to reflect the impact of the Corbett contingent benefit. The actuarial valuation provided by the actuary for this year does not include this contingent benefit in the funded ratio. However, the valuations prepared by the actuary for fiscal years 2006 and 2007 do include the impact of the Corbett contingent benefit.
** The actuarial accrued liability was calculated using the Entry Age Normal (EAN) method beginning in fiscal year 2007.Prior to fiscal year 2007, the Projected Unit Credit (PUC) method was used.

This Page Left Intentionally Blank
1�0
requireD Supplementary information - general funD
General Fund Budgetary Information

This Page Left Intentionally Blank - Back of Divider Page
1�3
City of San Diego ComprehenSive annual finanCial report
GENERAL FUND
The general fund is the chief operating fund of the City. It is used to account for all financial resources except those required to be accounted for in another fund.
General fund revenues are derived from such sources as: Taxes; Licenses and Permits; Fines, Forfeitures, and Penalties; Use of Money and Property; Aid from Other Governmental Agencies; Charges for Current Services; and Other Revenue.
Current expenditures and encumbrances are classified by the functions of: General Government and Support; Public Safety–Police; Public Safety–Fire and Life Safety and Homeland Security; Parks, Recreation, Culture and Leisure; Transportation; Sanitation and Health; Neighborhood Services; and Debt Service Principal and Interest. Appropriations are made from the fund annually.
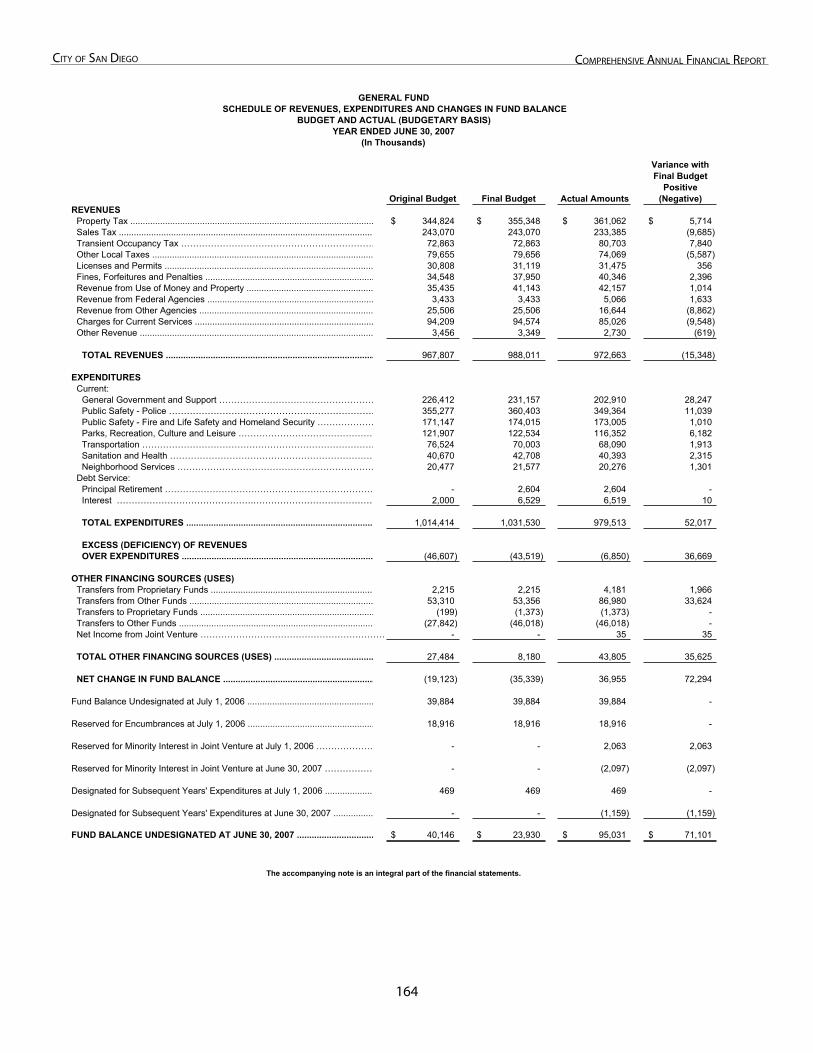
1��
City of San Diego ComprehenSive annual finanCial report
GENERAL FUNDSCHEDULE OF REVENUES, EXPENDITURES AND CHANGES IN FUND BALANCE
BUDGET AND ACTUAL (BUDGETARY BASIS)YEAR ENDED JUNE 30, 2007
(In Thousands)
Original Budget Final Budget Actual Amounts
Variance with Final Budget
Positive(Negative)
REVENUESProperty Tax .................................................................................................. 344,824$ 355,348$ 361,062$ 5,714$ Sales Tax ...................................................................................................... 243,070 243,070 233,385 (9,685) Transient Occupancy Tax ………………………………………………………… 72,863 72,863 80,703 7,840 Other Local Taxes ......................................................................................... 79,655 79,656 74,069 (5,587) Licenses and Permits .................................................................................... 30,808 31,119 31,475 356 Fines, Forfeitures and Penalties .................................................................... 34,548 37,950 40,346 2,396 Revenue from Use of Money and Property ................................................... 35,435 41,143 42,157 1,014 Revenue from Federal Agencies ................................................................... 3,433 3,433 5,066 1,633 Revenue from Other Agencies ...................................................................... 25,506 25,506 16,644 (8,862) Charges for Current Services ........................................................................ 94,209 94,574 85,026 (9,548) Other Revenue .............................................................................................. 3,456 3,349 2,730 (619)
TOTAL REVENUES .................................................................................... 967,807 988,011 972,663 (15,348)
EXPENDITURESCurrent:
General Government and Support ……………………………………………… 226,412 231,157 202,910 28,247 Public Safety - Police …………………………………………………………… 355,277 360,403 349,364 11,039 Public Safety - Fire and Life Safety and Homeland Security ………………… 171,147 174,015 173,005 1,010 Parks, Recreation, Culture and Leisure ……………………………………… 121,907 122,534 116,352 6,182 Transportation …………………………………………………………………… 76,524 70,003 68,090 1,913 Sanitation and Health …………………………………………………………… 40,670 42,708 40,393 2,315 Neighborhood Services ………………………………………………………… 20,477 21,577 20,276 1,301
Debt Service: Principal Retirement ……………………………………….…………………… - 2,604 2,604 - Interest ……………………………………….…………………………………… 2,000 6,529 6,519 10
TOTAL EXPENDITURES ........................................................................... 1,014,414 1,031,530 979,513 52,017
EXCESS (DEFICIENCY) OF REVENUES OVER EXPENDITURES ............................................................................. (46,607) (43,519) (6,850) 36,669
OTHER FINANCING SOURCES (USES)Transfers from Proprietary Funds ................................................................. 2,215 2,215 4,181 1,966 Transfers from Other Funds .......................................................................... 53,310 53,356 86,980 33,624 Transfers to Proprietary Funds ...................................................................... (199) (1,373) (1,373) - Transfers to Other Funds .............................................................................. (27,842) (46,018) (46,018) - Net Income from Joint Venture ……………………………………………………… - - 35 35
TOTAL OTHER FINANCING SOURCES (USES) ........................................ 27,484 8,180 43,805 35,625
NET CHANGE IN FUND BALANCE ............................................................. (19,123) (35,339) 36,955 72,294
Fund Balance Undesignated at July 1, 2006 ................................................... 39,884 39,884 39,884 -
Reserved for Encumbrances at July 1, 2006 ................................................... 18,916 18,916 18,916 -
Reserved for Minority Interest in Joint Venture at July 1, 2006 ………………… - - 2,063 2,063
Reserved for Minority Interest in Joint Venture at June 30, 2007 ……………… - - (2,097) (2,097)
Designated for Subsequent Years' Expenditures at July 1, 2006 ................... 469 469 469 -
Designated for Subsequent Years' Expenditures at June 30, 2007 ................ - - (1,159) (1,159)
FUND BALANCE UNDESIGNATED AT JUNE 30, 2007 ............................... 40,146$ 23,930$ 95,031$ 71,101$
The accompanying note is an integral part of the financial statements.
1��
City of San Diego ComprehenSive annual finanCial report
Note to Required Supplementary Information
Note to Required Supplementary Information Year Ended June 30, 2007
1. SUMMARY OF SIGNIFICANT ACCOUNTING POLICIES
a. Budgetary Data
On or before the first meeting in May of each year, the City Manager submits to the City Council a proposed operating and capital improvements budget for the fiscal year commencing July 1. This budget includes annual budgets for the following funds:
General Fund Special Revenue Funds:
-City of San Diego: -Acquisition, Improvement and Operations -Environmental Growth Funds:
-Two-Thirds Requirement -One-Third Requirement -Police Decentralization
-Public Transportation -Qualcomm Stadium Operations -Special Gas Tax Street Improvement
-Street Division Operations -Transient Occupancy Tax
-Underground Surcharge -Zoological Exhibits
-Other Special Revenue -Centre City Development Corporation -Southeastern Economic Development Corporation
Debt Service Funds: -City of San Diego: -Public Safety Communications Project -San Diego Open Space Park Facilities District #1
Public hearings are then conducted to obtain citizen comments on the proposed budget. During the month of July the budget is legally adopted through passage of an appropriation ordinance by the City Council. Budgets are prepared on the modified accrual basis of accounting except that (1) encumbrances outstanding at year-end are considered expenditures and (2) the increase/decrease in reserve for advances and deposits to other funds and agencies are considered as additions/deductions of expenditures. The City budget is prepared excluding unrealized gains or losses resulting from the change in fair value of investments, proceeds from capital leases, and net income from joint venture.
The legal level of budgetary control for the City’s general fund is exercised at the salaries and wages and non-personnel expenditures level. Budgetary control for the other budgeted funds, including those of certain component units, is maintained at the total fund appropriation level. All amendments to the adopted budget require City Council approval except as delegated in the Annual Appropriation Ordinance.
Reported budget figures are as originally adopted or subsequently amended plus prior year continuing appropriations.
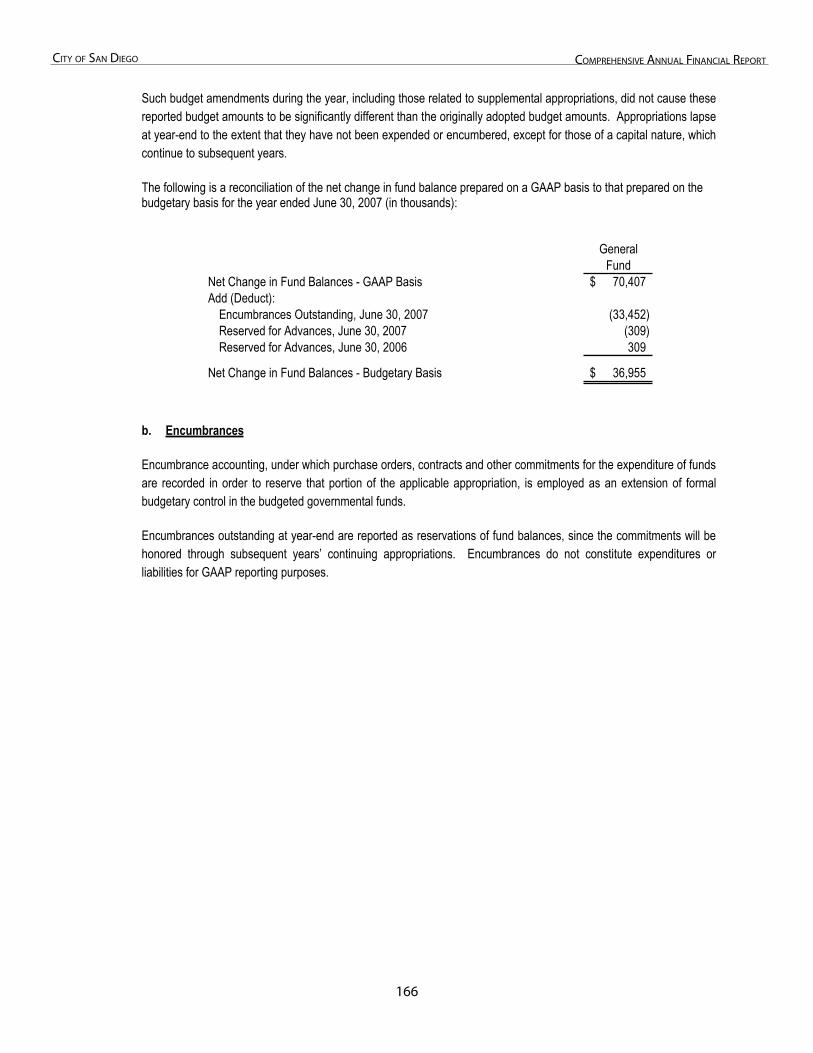
1��
City of San Diego ComprehenSive annual finanCial report
Such budget amendments during the year, including those related to supplemental appropriations, did not cause these reported budget amounts to be significantly different than the originally adopted budget amounts. Appropriations lapse at year-end to the extent that they have not been expended or encumbered, except for those of a capital nature, which continue to subsequent years.
The following is a reconciliation of the net change in fund balance prepared on a GAAP basis to that prepared on the budgetary basis for the year ended June 30, 2007 (in thousands):
GeneralFund
Net Change in Fund Balances - GAAP Basis 70,407$Add (Deduct):
Encumbrances Outstanding, June 30, 2007 (33,452)Reserved for Advances, June 30, 2007 (309)Reserved for Advances, June 30, 2006 309
Net Change in Fund Balances - Budgetary Basis 36,955$
b. Encumbrances
Encumbrance accounting, under which purchase orders, contracts and other commitments for the expenditure of funds are recorded in order to reserve that portion of the applicable appropriation, is employed as an extension of formal budgetary control in the budgeted governmental funds.
Encumbrances outstanding at year-end are reported as reservations of fund balances, since the commitments will be honored through subsequent years’ continuing appropriations. Encumbrances do not constitute expenditures or liabilities for GAAP reporting purposes.
Supplementary information - general funD
Supplementary Information Supplementary Information - General

This Page Left Intentionally Blank - Back of Divider Page
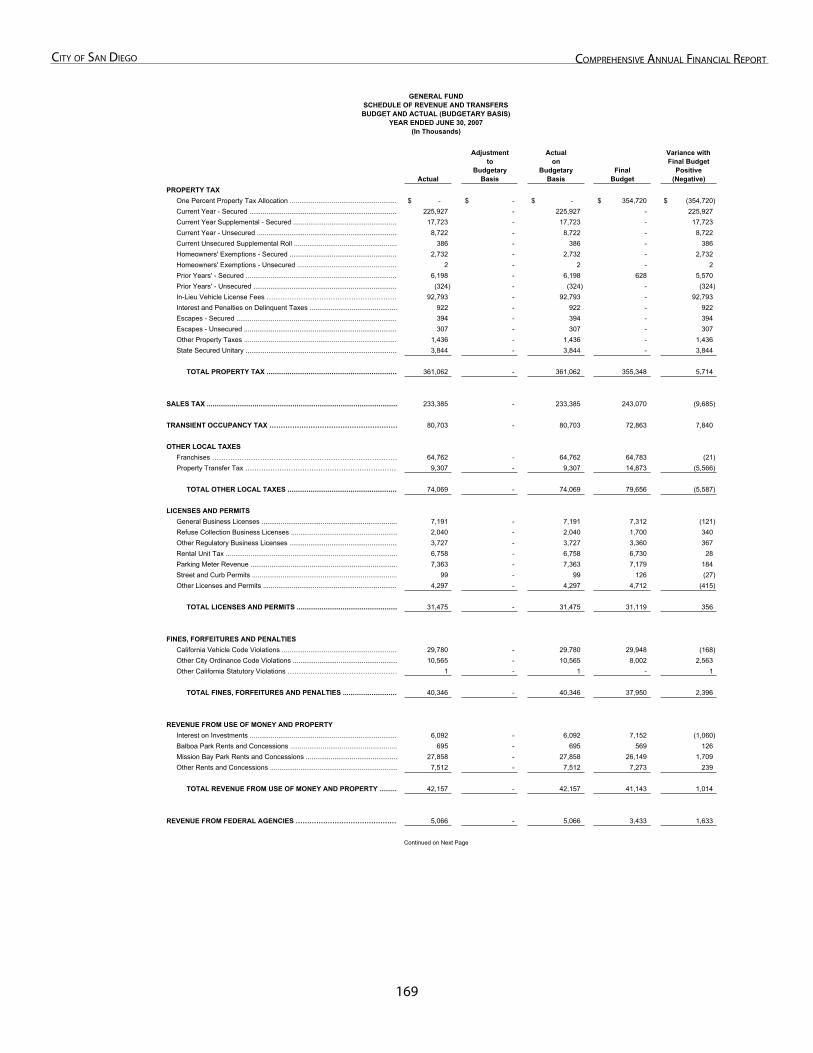
1��
City of San Diego ComprehenSive annual finanCial report
GENERAL FUNDSCHEDULE OF REVENUE AND TRANSFERSBUDGET AND ACTUAL (BUDGETARY BASIS)
YEAR ENDED JUNE 30, 2007(In Thousands)
Actual
Adjustmentto
BudgetaryBasis
Actualon
BudgetaryBasis
FinalBudget
Variance with Final Budget
Positive(Negative)
PROPERTY TAXOne Percent Property Tax Allocation ........................................................ -$ -$ -$ 354,720$ (354,720)$ Current Year - Secured .............................................................................. 225,927 - 225,927 - 225,927 Current Year Supplemental - Secured ....................................................... 17,723 - 17,723 - 17,723 Current Year - Unsecured .......................................................................... 8,722 - 8,722 - 8,722 Current Unsecured Supplemental Roll ...................................................... 386 - 386 - 386 Homeowners' Exemptions - Secured ......................................................... 2,732 - 2,732 - 2,732 Homeowners' Exemptions - Unsecured ..................................................... 2 - 2 - 2 Prior Years' - Secured ................................................................................ 6,198 - 6,198 628 5,570 Prior Years' - Unsecured ............................................................................ (324) - (324) - (324) In-Lieu Vehicle License Fees ………………………………………………… 92,793 - 92,793 - 92,793 Interest and Penalties on Delinquent Taxes .............................................. 922 - 922 - 922 Escapes - Secured .................................................................................... 394 - 394 - 394 Escapes - Unsecured ................................................................................ 307 - 307 - 307 Other Property Taxes ................................................................................ 1,436 - 1,436 - 1,436 State Secured Unitary ................................................................................ 3,844 - 3,844 - 3,844
TOTAL PROPERTY TAX ..................................................................... 361,062 - 361,062 355,348 5,714
SALES TAX .................................................................................................... 233,385 - 233,385 243,070 (9,685)
TRANSIENT OCCUPANCY TAX ………………………………………………… 80,703 - 80,703 72,863 7,840
OTHER LOCAL TAXESFranchises ……………………………………………………………………… 64,762 - 64,762 64,783 (21) Property Transfer Tax …………………………………………………………… 9,307 - 9,307 14,873 (5,566)
TOTAL OTHER LOCAL TAXES .......................................................... 74,069 - 74,069 79,656 (5,587)
LICENSES AND PERMITSGeneral Business Licenses ....................................................................... 7,191 - 7,191 7,312 (121) Refuse Collection Business Licenses ........................................................ 2,040 - 2,040 1,700 340 Other Regulatory Business Licenses ......................................................... 3,727 - 3,727 3,360 367 Rental Unit Tax .......................................................................................... 6,758 - 6,758 6,730 28 Parking Meter Revenue ............................................................................. 7,363 - 7,363 7,179 184 Street and Curb Permits ............................................................................ 99 - 99 126 (27) Other Licenses and Permits ...................................................................... 4,297 - 4,297 4,712 (415)
TOTAL LICENSES AND PERMITS ..................................................... 31,475 - 31,475 31,119 356
FINES, FORFEITURES AND PENALTIESCalifornia Vehicle Code Violations ............................................................. 29,780 - 29,780 29,948 (168) Other City Ordinance Code Violations ....................................................... 10,565 - 10,565 8,002 2,563 Other California Statutory Violations ………………………………………… 1 - 1 - 1
TOTAL FINES, FORFEITURES AND PENALTIES ............................. 40,346 - 40,346 37,950 2,396
REVENUE FROM USE OF MONEY AND PROPERTYInterest on Investments ............................................................................. 6,092 - 6,092 7,152 (1,060) Balboa Park Rents and Concessions ........................................................ 695 - 695 569 126 Mission Bay Park Rents and Concessions ................................................ 27,858 - 27,858 26,149 1,709 Other Rents and Concessions ................................................................... 7,512 - 7,512 7,273 239
TOTAL REVENUE FROM USE OF MONEY AND PROPERTY ......... 42,157 - 42,157 41,143 1,014
REVENUE FROM FEDERAL AGENCIES ……………………………………… 5,066 - 5,066 3,433 1,633
Continued on Next Page
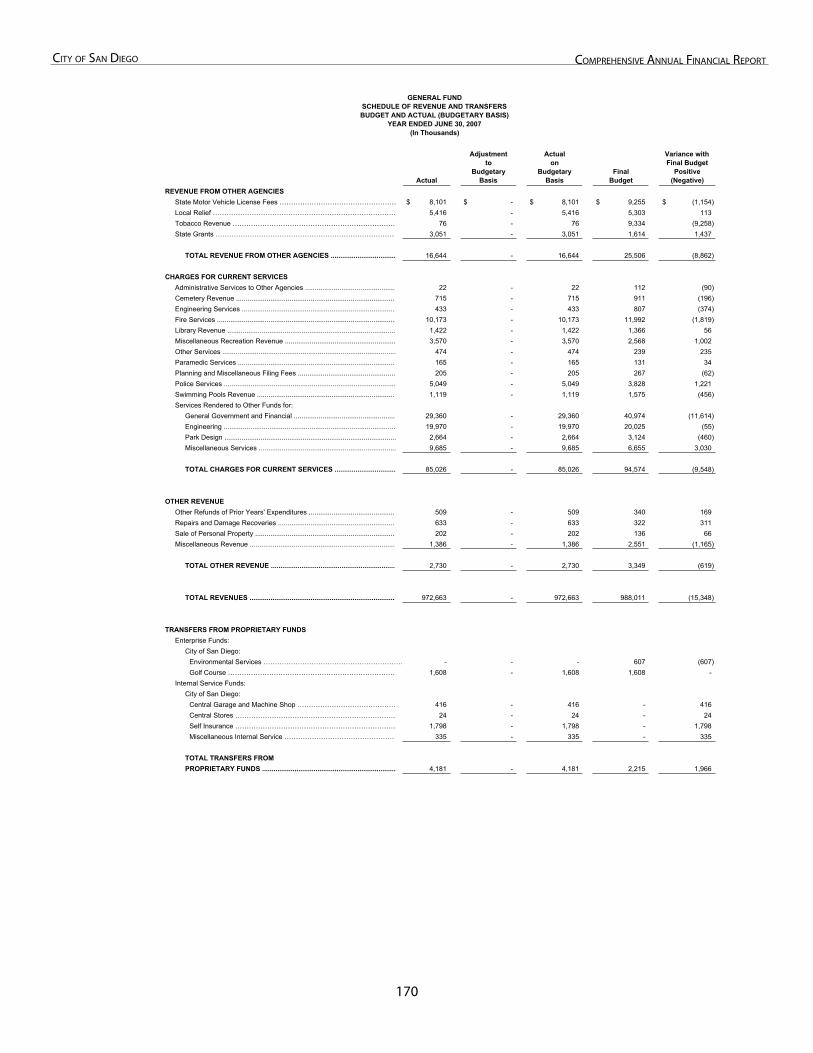
170
City of San Diego ComprehenSive annual finanCial report
GENERAL FUNDSCHEDULE OF REVENUE AND TRANSFERSBUDGET AND ACTUAL (BUDGETARY BASIS)
YEAR ENDED JUNE 30, 2007(In Thousands)
Actual
Adjustmentto
BudgetaryBasis
Actualon
BudgetaryBasis
FinalBudget
Variance with Final Budget
Positive(Negative)
REVENUE FROM OTHER AGENCIESState Motor Vehicle License Fees …………………………………………… 8,101$ -$ 8,101$ 9,255$ (1,154)$ Local Relief ……………………………………………………………………… 5,416 - 5,416 5,303 113 Tobacco Revenue ……………………………………………………………… 76 - 76 9,334 (9,258) State Grants ……………………………………………………………………… 3,051 - 3,051 1,614 1,437
TOTAL REVENUE FROM OTHER AGENCIES .................................. 16,644 - 16,644 25,506 (8,862)
CHARGES FOR CURRENT SERVICESAdministrative Services to Other Agencies ................................................ 22 - 22 112 (90) Cemetery Revenue .................................................................................... 715 - 715 911 (196) Engineering Services ................................................................................. 433 - 433 807 (374) Fire Services .............................................................................................. 10,173 - 10,173 11,992 (1,819) Library Revenue ........................................................................................ 1,422 - 1,422 1,366 56 Miscellaneous Recreation Revenue .......................................................... 3,570 - 3,570 2,568 1,002 Other Services ........................................................................................... 474 - 474 239 235 Paramedic Services ................................................................................... 165 - 165 131 34 Planning and Miscellaneous Filing Fees ................................................... 205 - 205 267 (62) Police Services .......................................................................................... 5,049 - 5,049 3,828 1,221 Swimming Pools Revenue ......................................................................... 1,119 - 1,119 1,575 (456) Services Rendered to Other Funds for:
General Government and Financial ...................................................... 29,360 - 29,360 40,974 (11,614) Engineering .......................................................................................... 19,970 - 19,970 20,025 (55) Park Design .......................................................................................... 2,664 - 2,664 3,124 (460) Miscellaneous Services ........................................................................ 9,685 - 9,685 6,655 3,030
TOTAL CHARGES FOR CURRENT SERVICES ................................ 85,026 - 85,026 94,574 (9,548)
OTHER REVENUEOther Refunds of Prior Years' Expenditures .............................................. 509 - 509 340 169 Repairs and Damage Recoveries .............................................................. 633 - 633 322 311 Sale of Personal Property .......................................................................... 202 - 202 136 66 Miscellaneous Revenue ............................................................................. 1,386 - 1,386 2,551 (1,165)
TOTAL OTHER REVENUE .................................................................. 2,730 - 2,730 3,349 (619)
TOTAL REVENUES ............................................................................. 972,663 - 972,663 988,011 (15,348)
TRANSFERS FROM PROPRIETARY FUNDSEnterprise Funds:
City of San Diego:Environmental Services ……………………………………………………… - - - 607 (607) Golf Course ………………………………………………………………… 1,608 - 1,608 1,608 -
Internal Service Funds:City of San Diego:
Central Garage and Machine Shop ……………………………………… 416 - 416 - 416 Central Stores ……………………………………………………………… 24 - 24 - 24 Self Insurance ……………………………………………………………… 1,798 - 1,798 - 1,798 Miscellaneous Internal Service …………………………………………… 335 - 335 - 335
TOTAL TRANSFERS FROM PROPRIETARY FUNDS ...................................................................... 4,181 - 4,181 2,215 1,966
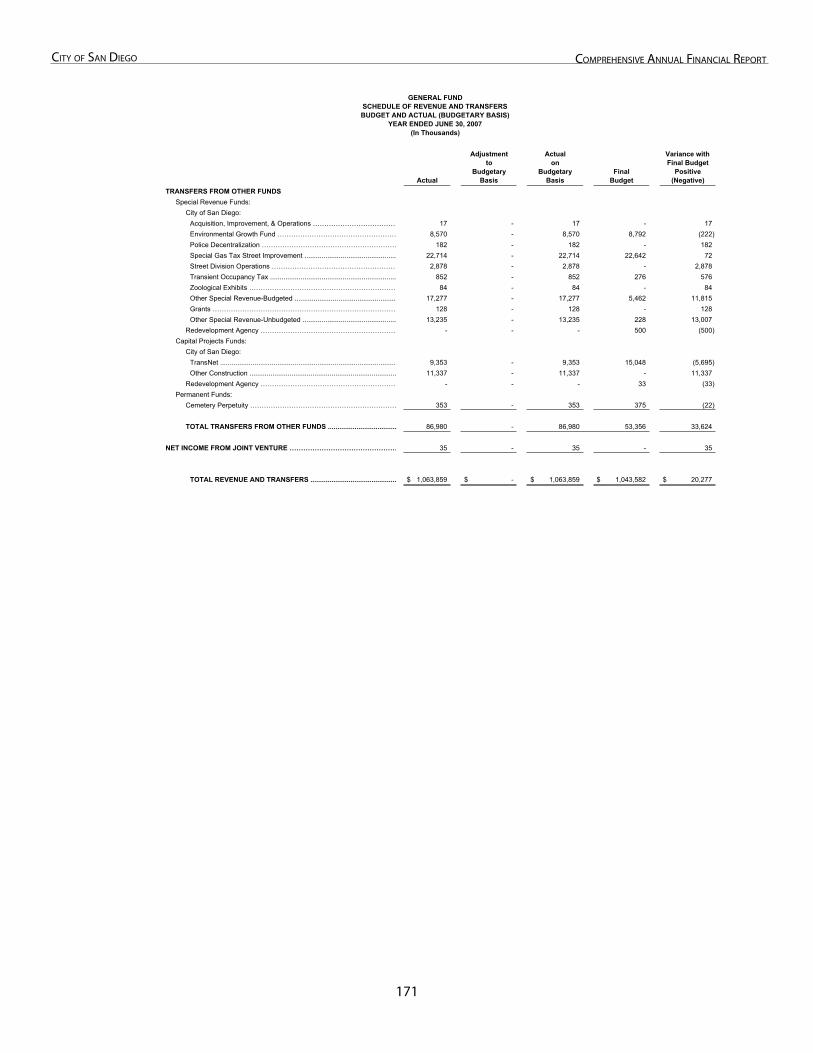
171
City of San Diego ComprehenSive annual finanCial report
GENERAL FUNDSCHEDULE OF REVENUE AND TRANSFERSBUDGET AND ACTUAL (BUDGETARY BASIS)
YEAR ENDED JUNE 30, 2007(In Thousands)
Actual
Adjustmentto
BudgetaryBasis
Actualon
BudgetaryBasis
FinalBudget
Variance with Final Budget
Positive(Negative)
TRANSFERS FROM OTHER FUNDSSpecial Revenue Funds:
City of San Diego:Acquisition, Improvement, & Operations ………………………………… 17 - 17 - 17 Environmental Growth Fund ……………………………………………… 8,570 - 8,570 8,792 (222) Police Decentralization …………………………………………………… 182 - 182 - 182 Special Gas Tax Street Improvement ................................................ 22,714 - 22,714 22,642 72 Street Division Operations ………………………………………………… 2,878 - 2,878 - 2,878 Transient Occupancy Tax .................................................................. 852 - 852 276 576 Zoological Exhibits ………………………………………………………… 84 - 84 - 84 Other Special Revenue-Budgeted ..................................................... 17,277 - 17,277 5,462 11,815 Grants ……………………………………………………………………… 128 - 128 - 128 Other Special Revenue-Unbudgeted ................................................. 13,235 - 13,235 228 13,007
Redevelopment Agency …………………………………………………… - - - 500 (500) Capital Projects Funds:
City of San Diego: TransNet ............................................................................................. 9,353 - 9,353 15,048 (5,695) Other Construction ............................................................................. 11,337 - 11,337 - 11,337
Redevelopment Agency …………………………………………………… - - - 33 (33) Permanent Funds:
Cemetery Perpetuity ………………………………………………………… 353 - 353 375 (22)
TOTAL TRANSFERS FROM OTHER FUNDS .................................... 86,980 - 86,980 53,356 33,624
NET INCOME FROM JOINT VENTURE ………………………………………… 35 - 35 - 35
TOTAL REVENUE AND TRANSFERS ............................................. 1,063,859$ -$ 1,063,859$ 1,043,582$ 20,277$
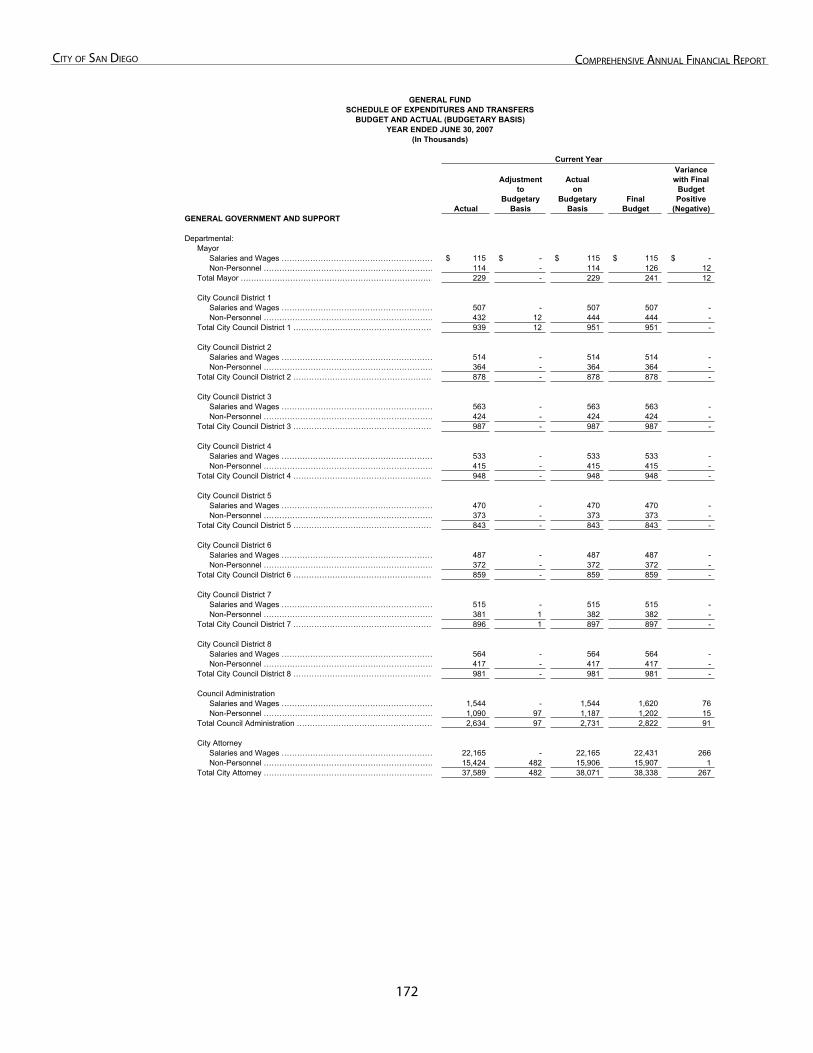
172
City of San Diego ComprehenSive annual finanCial report
GENERAL FUNDSCHEDULE OF EXPENDITURES AND TRANSFERS
BUDGET AND ACTUAL (BUDGETARY BASIS)YEAR ENDED JUNE 30, 2007
(In Thousands)
Current Year
Actual
Adjustmentto
BudgetaryBasis
Actualon
BudgetaryBasis
FinalBudget
Variancewith Final
BudgetPositive
(Negative)GENERAL GOVERNMENT AND SUPPORT
Departmental:Mayor
Salaries and Wages …………………………………………………… 115$ -$ 115$ 115$ -$ Non-Personnel ………………………………………………………… 114 - 114 126 12
Total Mayor ………………………………………………………………… 229 - 229 241 12
City Council District 1 Salaries and Wages …………………………………………………… 507 - 507 507 - Non-Personnel ………………………………………………………… 432 12 444 444 -
Total City Council District 1 ……………………………………………… 939 12 951 951 -
City Council District 2 Salaries and Wages …………………………………………………… 514 - 514 514 - Non-Personnel ………………………………………………………… 364 - 364 364 -
Total City Council District 2 ……………………………………………… 878 - 878 878 -
City Council District 3 Salaries and Wages …………………………………………………… 563 - 563 563 - Non-Personnel ………………………………………………………… 424 - 424 424 -
Total City Council District 3 ……………………………………………… 987 - 987 987 -
City Council District 4 Salaries and Wages …………………………………………………… 533 - 533 533 - Non-Personnel ………………………………………………………… 415 - 415 415 -
Total City Council District 4 ……………………………………………… 948 - 948 948 -
City Council District 5 Salaries and Wages …………………………………………………… 470 - 470 470 - Non-Personnel ………………………………………………………… 373 - 373 373 -
Total City Council District 5 ……………………………………………… 843 - 843 843 -
City Council District 6 Salaries and Wages …………………………………………………… 487 - 487 487 - Non-Personnel ………………………………………………………… 372 - 372 372 -
Total City Council District 6 ……………………………………………… 859 - 859 859 -
City Council District 7 Salaries and Wages …………………………………………………… 515 - 515 515 - Non-Personnel ………………………………………………………… 381 1 382 382 -
Total City Council District 7 ……………………………………………… 896 1 897 897 -
City Council District 8 Salaries and Wages …………………………………………………… 564 - 564 564 - Non-Personnel ………………………………………………………… 417 - 417 417 -
Total City Council District 8 ……………………………………………… 981 - 981 981 -
Council Administration Salaries and Wages …………………………………………………… 1,544 - 1,544 1,620 76 Non-Personnel ………………………………………………………… 1,090 97 1,187 1,202 15
Total Council Administration ……………………………………………… 2,634 97 2,731 2,822 91
City Attorney Salaries and Wages …………………………………………………… 22,165 - 22,165 22,431 266 Non-Personnel ………………………………………………………… 15,424 482 15,906 15,907 1
Total City Attorney ………………………………………………………… 37,589 482 38,071 38,338 267
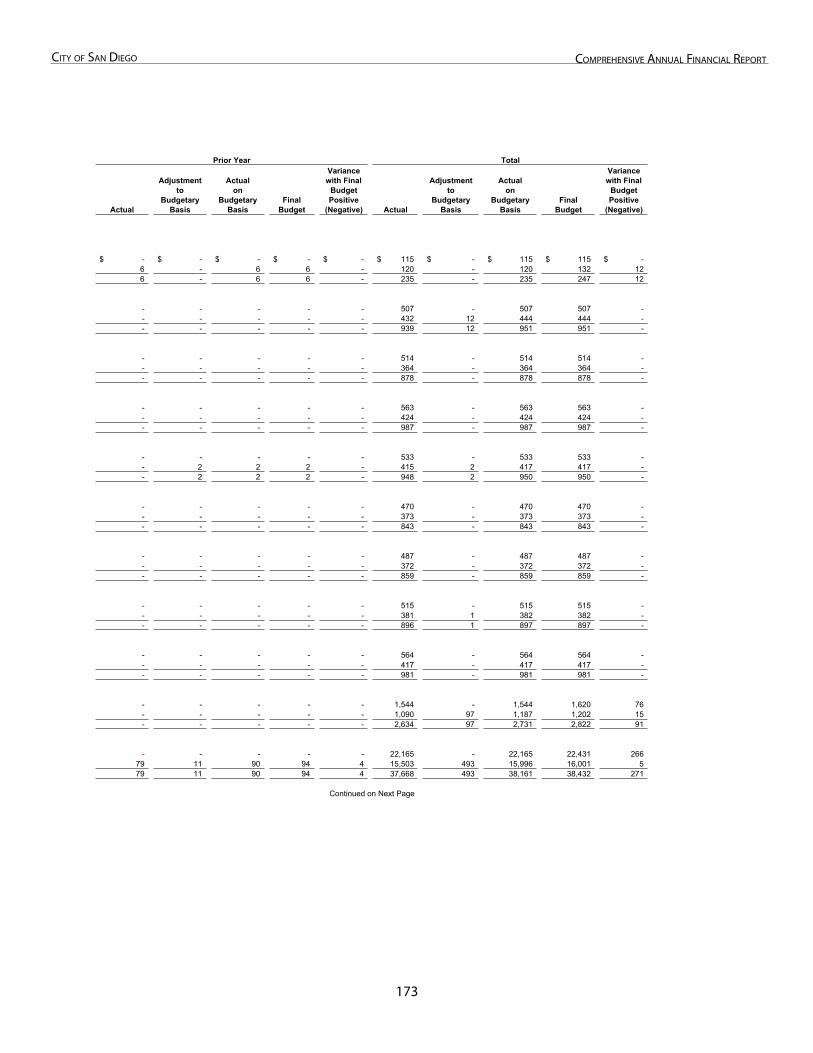
173
City of San Diego ComprehenSive annual finanCial report
Prior Year Total
Actual
Adjustmentto
BudgetaryBasis
Actualon
BudgetaryBasis
FinalBudget
Variancewith Final
BudgetPositive
(Negative) Actual
Adjustmentto
BudgetaryBasis
Actualon
BudgetaryBasis
FinalBudget
Variancewith Final
BudgetPositive
(Negative)
-$ -$ -$ -$ -$ 115$ -$ 115$ 115$ -$ 6 - 6 6 - 120 - 120 132 12 6 - 6 6 - 235 - 235 247 12
- - - - - 507 - 507 507 - - - - - - 432 12 444 444 - - - - - - 939 12 951 951 -
- - - - - 514 - 514 514 - - - - - - 364 - 364 364 - - - - - - 878 - 878 878 -
- - - - - 563 - 563 563 - - - - - - 424 - 424 424 - - - - - - 987 - 987 987 -
- - - - - 533 - 533 533 - - 2 2 2 - 415 2 417 417 - - 2 2 2 - 948 2 950 950 -
- - - - - 470 - 470 470 - - - - - - 373 - 373 373 - - - - - - 843 - 843 843 -
- - - - - 487 - 487 487 - - - - - - 372 - 372 372 - - - - - - 859 - 859 859 -
- - - - - 515 - 515 515 - - - - - - 381 1 382 382 - - - - - - 896 1 897 897 -
- - - - - 564 - 564 564 - - - - - - 417 - 417 417 - - - - - - 981 - 981 981 -
- - - - - 1,544 - 1,544 1,620 76 - - - - - 1,090 97 1,187 1,202 15 - - - - - 2,634 97 2,731 2,822 91
- - - - - 22,165 - 22,165 22,431 266 79 11 90 94 4 15,503 493 15,996 16,001 5 79 11 90 94 4 37,668 493 38,161 38,432 271
Continued on Next Page
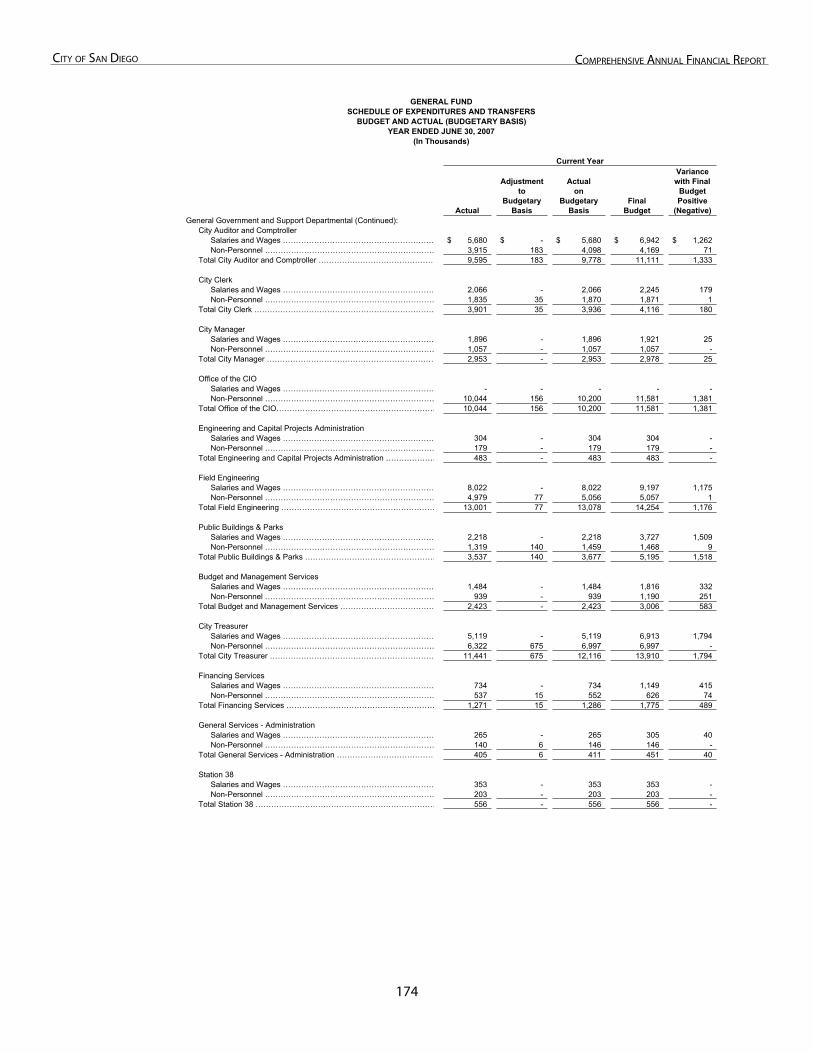
17�
City of San Diego ComprehenSive annual finanCial report
GENERAL FUNDSCHEDULE OF EXPENDITURES AND TRANSFERS
BUDGET AND ACTUAL (BUDGETARY BASIS)YEAR ENDED JUNE 30, 2007
(In Thousands)
Current Year
Actual
Adjustmentto
BudgetaryBasis
Actualon
BudgetaryBasis
FinalBudget
Variancewith Final
BudgetPositive
(Negative)General Government and Support Departmental (Continued):
City Auditor and Comptroller Salaries and Wages …………………………………………………… 5,680$ -$ 5,680$ 6,942$ 1,262$ Non-Personnel ………………………………………………………… 3,915 183 4,098 4,169 71
Total City Auditor and Comptroller ……………………………………… 9,595 183 9,778 11,111 1,333
City Clerk Salaries and Wages …………………………………………………… 2,066 - 2,066 2,245 179 Non-Personnel ………………………………………………………… 1,835 35 1,870 1,871 1
Total City Clerk …………………………………………………………… 3,901 35 3,936 4,116 180
City Manager Salaries and Wages …………………………………………………… 1,896 - 1,896 1,921 25 Non-Personnel ………………………………………………………… 1,057 - 1,057 1,057 -
Total City Manager ………………………………………………………… 2,953 - 2,953 2,978 25
Office of the CIO Salaries and Wages …………………………………………………… - - - - - Non-Personnel ………………………………………………………… 10,044 156 10,200 11,581 1,381
Total Office of the CIO……………………………………………………… 10,044 156 10,200 11,581 1,381
Engineering and Capital Projects Administration Salaries and Wages …………………………………………………… 304 - 304 304 - Non-Personnel ………………………………………………………… 179 - 179 179 -
Total Engineering and Capital Projects Administration ………………… 483 - 483 483 -
Field Engineering Salaries and Wages …………………………………………………… 8,022 - 8,022 9,197 1,175 Non-Personnel ………………………………………………………… 4,979 77 5,056 5,057 1
Total Field Engineering …………………………………………………… 13,001 77 13,078 14,254 1,176
Public Buildings & Parks Salaries and Wages …………………………………………………… 2,218 - 2,218 3,727 1,509 Non-Personnel ………………………………………………………… 1,319 140 1,459 1,468 9
Total Public Buildings & Parks …………………………………………… 3,537 140 3,677 5,195 1,518
Budget and Management Services Salaries and Wages …………………………………………………… 1,484 - 1,484 1,816 332 Non-Personnel ………………………………………………………… 939 - 939 1,190 251
Total Budget and Management Services ……………………………… 2,423 - 2,423 3,006 583
City TreasurerSalaries and Wages …………………………………………………… 5,119 - 5,119 6,913 1,794 Non-Personnel ………………………………………………………… 6,322 675 6,997 6,997 -
Total City Treasurer ……………………………………………………… 11,441 675 12,116 13,910 1,794
Financing Services Salaries and Wages …………………………………………………… 734 - 734 1,149 415 Non-Personnel ………………………………………………………… 537 15 552 626 74
Total Financing Services ………………………………………………… 1,271 15 1,286 1,775 489
General Services - AdministrationSalaries and Wages …………………………………………………… 265 - 265 305 40 Non-Personnel ………………………………………………………… 140 6 146 146 -
Total General Services - Administration ………………………………… 405 6 411 451 40
Station 38Salaries and Wages …………………………………………………… 353 - 353 353 - Non-Personnel ………………………………………………………… 203 - 203 203 -
Total Station 38 …………………………………………………………… 556 - 556 556 -
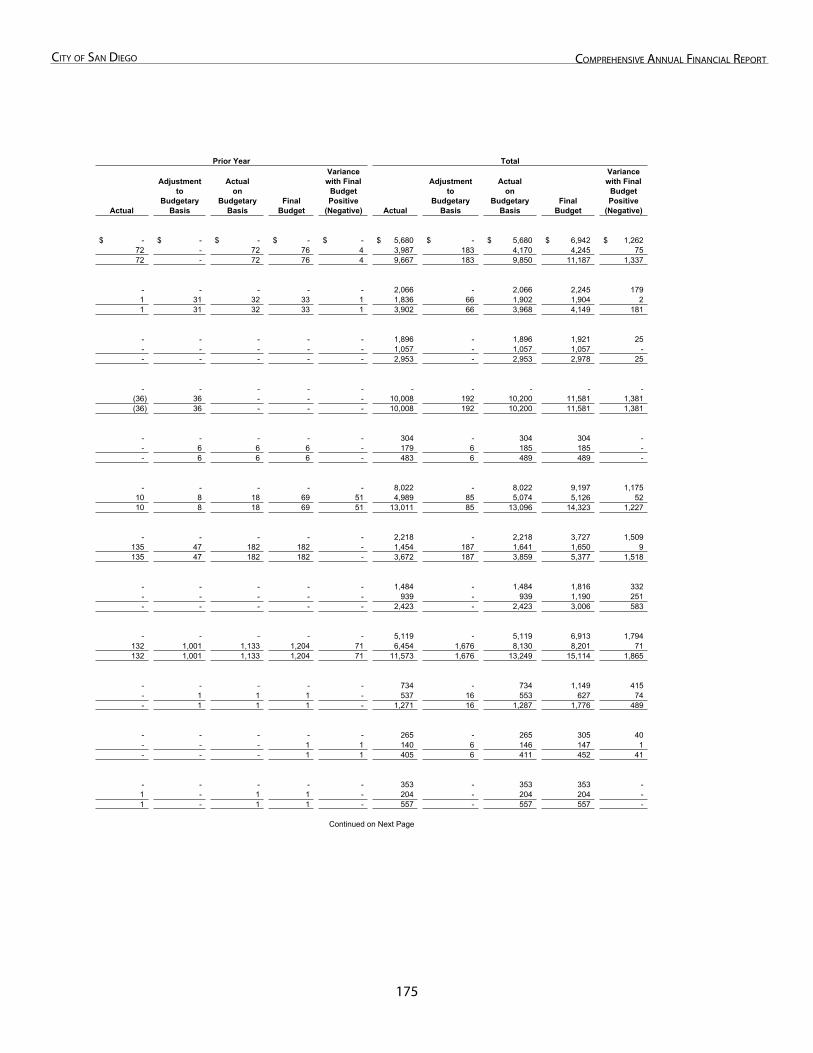
17�
City of San Diego ComprehenSive annual finanCial report
Prior Year Total
Actual
Adjustmentto
BudgetaryBasis
Actualon
BudgetaryBasis
FinalBudget
Variancewith Final
BudgetPositive
(Negative) Actual
Adjustmentto
BudgetaryBasis
Actualon
BudgetaryBasis
FinalBudget
Variancewith Final
BudgetPositive
(Negative)
-$ -$ -$ -$ -$ 5,680$ -$ 5,680$ 6,942$ 1,262$ 72 - 72 76 4 3,987 183 4,170 4,245 75 72 - 72 76 4 9,667 183 9,850 11,187 1,337
- - - - - 2,066 - 2,066 2,245 179 1 31 32 33 1 1,836 66 1,902 1,904 2 1 31 32 33 1 3,902 66 3,968 4,149 181
- - - - - 1,896 - 1,896 1,921 25 - - - - - 1,057 - 1,057 1,057 - - - - - - 2,953 - 2,953 2,978 25
- - - - - - - - - - (36) 36 - - - 10,008 192 10,200 11,581 1,381 (36) 36 - - - 10,008 192 10,200 11,581 1,381
- - - - - 304 - 304 304 - - 6 6 6 - 179 6 185 185 - - 6 6 6 - 483 6 489 489 -
- - - - - 8,022 - 8,022 9,197 1,175 10 8 18 69 51 4,989 85 5,074 5,126 52 10 8 18 69 51 13,011 85 13,096 14,323 1,227
- - - - - 2,218 - 2,218 3,727 1,509 135 47 182 182 - 1,454 187 1,641 1,650 9 135 47 182 182 - 3,672 187 3,859 5,377 1,518
- - - - - 1,484 - 1,484 1,816 332 - - - - - 939 - 939 1,190 251 - - - - - 2,423 - 2,423 3,006 583
- - - - - 5,119 - 5,119 6,913 1,794 132 1,001 1,133 1,204 71 6,454 1,676 8,130 8,201 71 132 1,001 1,133 1,204 71 11,573 1,676 13,249 15,114 1,865
- - - - - 734 - 734 1,149 415 - 1 1 1 - 537 16 553 627 74 - 1 1 1 - 1,271 16 1,287 1,776 489
- - - - - 265 - 265 305 40 - - - 1 1 140 6 146 147 1 - - - 1 1 405 6 411 452 41
- - - - - 353 - 353 353 - 1 - 1 1 - 204 - 204 204 - 1 - 1 1 - 557 - 557 557 -
Continued on Next Page
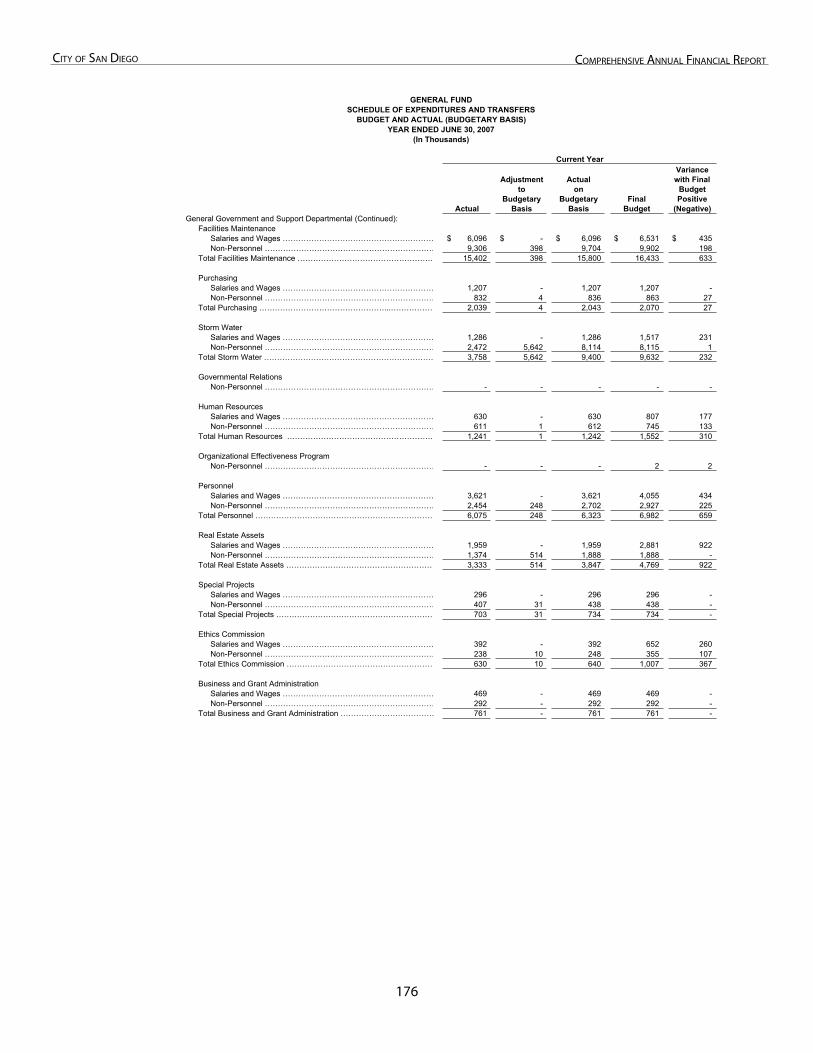
17�
City of San Diego ComprehenSive annual finanCial report
GENERAL FUNDSCHEDULE OF EXPENDITURES AND TRANSFERS
BUDGET AND ACTUAL (BUDGETARY BASIS)YEAR ENDED JUNE 30, 2007
(In Thousands)
Current Year
Actual
Adjustmentto
BudgetaryBasis
Actualon
BudgetaryBasis
FinalBudget
Variancewith Final
BudgetPositive
(Negative)General Government and Support Departmental (Continued):
Facilities MaintenanceSalaries and Wages …………………………………………………… 6,096$ -$ 6,096$ 6,531$ 435$ Non-Personnel ………………………………………………………… 9,306 398 9,704 9,902 198
Total Facilities Maintenance ……………………………………………… 15,402 398 15,800 16,433 633
Purchasing Salaries and Wages …………………………………………………… 1,207 - 1,207 1,207 - Non-Personnel ………………………………………………………… 832 4 836 863 27
Total Purchasing …………………………………………...……………… 2,039 4 2,043 2,070 27
Storm Water Salaries and Wages …………………………………………………… 1,286 - 1,286 1,517 231 Non-Personnel ………………………………………………………… 2,472 5,642 8,114 8,115 1
Total Storm Water ………………………………………………………… 3,758 5,642 9,400 9,632 232
Governmental Relations Non-Personnel ………………………………………………………… - - - - -
Human Resources Salaries and Wages …………………………………………………… 630 - 630 807 177 Non-Personnel ………………………………………………………… 611 1 612 745 133
Total Human Resources ………………………………………………… 1,241 1 1,242 1,552 310
Organizational Effectiveness Program Non-Personnel ………………………………………………………… - - - 2 2
Personnel Salaries and Wages …………………………………………………… 3,621 - 3,621 4,055 434 Non-Personnel ………………………………………………………… 2,454 248 2,702 2,927 225
Total Personnel …………………………………………………………… 6,075 248 6,323 6,982 659
Real Estate Assets Salaries and Wages …………………………………………………… 1,959 - 1,959 2,881 922 Non-Personnel ………………………………………………………… 1,374 514 1,888 1,888 -
Total Real Estate Assets ………………………………………………… 3,333 514 3,847 4,769 922
Special Projects Salaries and Wages …………………………………………………… 296 - 296 296 - Non-Personnel ………………………………………………………… 407 31 438 438 -
Total Special Projects ……………………………………………………… 703 31 734 734 -
Ethics Commission Salaries and Wages …………………………………………………… 392 - 392 652 260 Non-Personnel ………………………………………………………… 238 10 248 355 107
Total Ethics Commission ………………………………………………… 630 10 640 1,007 367
Business and Grant Administration Salaries and Wages …………………………………………………… 469 - 469 469 - Non-Personnel ………………………………………………………… 292 - 292 292 -
Total Business and Grant Administration ……………………………… 761 - 761 761 -
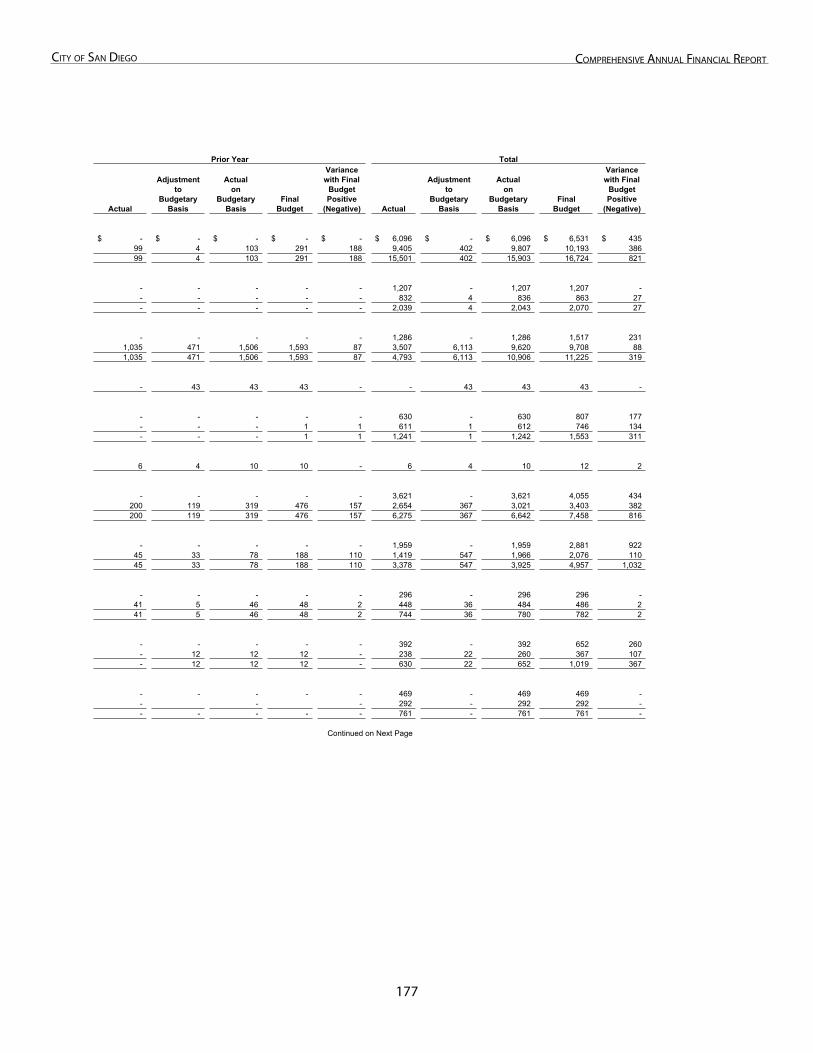
177
City of San Diego ComprehenSive annual finanCial report
Prior Year Total
Actual
Adjustmentto
BudgetaryBasis
Actualon
BudgetaryBasis
FinalBudget
Variancewith Final
BudgetPositive
(Negative) Actual
Adjustmentto
BudgetaryBasis
Actualon
BudgetaryBasis
FinalBudget
Variancewith Final
BudgetPositive
(Negative)
-$ -$ -$ -$ -$ 6,096$ -$ 6,096$ 6,531$ 435$ 99 4 103 291 188 9,405 402 9,807 10,193 386 99 4 103 291 188 15,501 402 15,903 16,724 821
- - - - - 1,207 - 1,207 1,207 - - - - - - 832 4 836 863 27 - - - - - 2,039 4 2,043 2,070 27
- - - - - 1,286 - 1,286 1,517 231 1,035 471 1,506 1,593 87 3,507 6,113 9,620 9,708 88 1,035 471 1,506 1,593 87 4,793 6,113 10,906 11,225 319
- 43 43 43 - - 43 43 43 -
- - - - - 630 - 630 807 177 - - - 1 1 611 1 612 746 134 - - - 1 1 1,241 1 1,242 1,553 311
6 4 10 10 - 6 4 10 12 2
- - - - - 3,621 - 3,621 4,055 434 200 119 319 476 157 2,654 367 3,021 3,403 382 200 119 319 476 157 6,275 367 6,642 7,458 816
- - - - - 1,959 - 1,959 2,881 922 45 33 78 188 110 1,419 547 1,966 2,076 110 45 33 78 188 110 3,378 547 3,925 4,957 1,032
- - - - - 296 - 296 296 - 41 5 46 48 2 448 36 484 486 2 41 5 46 48 2 744 36 780 782 2
- - - - - 392 - 392 652 260 - 12 12 12 - 238 22 260 367 107 - 12 12 12 - 630 22 652 1,019 367
- - - - - 469 - 469 469 - - - - 292 - 292 292 - - - - - - 761 - 761 761 -
Continued on Next Page
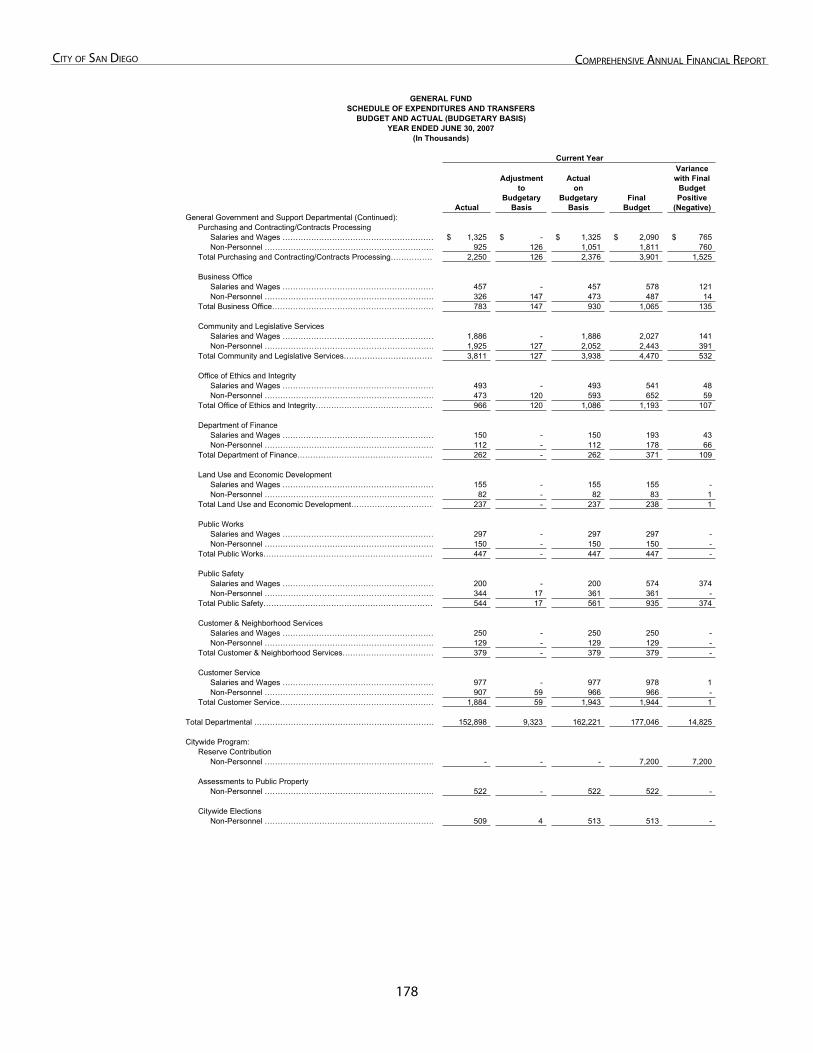
178
City of San Diego ComprehenSive annual finanCial report
GENERAL FUNDSCHEDULE OF EXPENDITURES AND TRANSFERS
BUDGET AND ACTUAL (BUDGETARY BASIS)YEAR ENDED JUNE 30, 2007
(In Thousands)
Current Year
Actual
Adjustmentto
BudgetaryBasis
Actualon
BudgetaryBasis
FinalBudget
Variancewith Final
BudgetPositive
(Negative)General Government and Support Departmental (Continued):
Purchasing and Contracting/Contracts Processing Salaries and Wages …………………………………………………… 1,325$ -$ 1,325$ 2,090$ 765$ Non-Personnel ………………………………………………………… 925 126 1,051 1,811 760
Total Purchasing and Contracting/Contracts Processing……………… 2,250 126 2,376 3,901 1,525
Business Office Salaries and Wages …………………………………………………… 457 - 457 578 121 Non-Personnel ………………………………………………………… 326 147 473 487 14
Total Business Office……………………………………………………… 783 147 930 1,065 135
Community and Legislative Services Salaries and Wages …………………………………………………… 1,886 - 1,886 2,027 141 Non-Personnel ………………………………………………………… 1,925 127 2,052 2,443 391
Total Community and Legislative Services……………………………… 3,811 127 3,938 4,470 532
Office of Ethics and Integrity Salaries and Wages …………………………………………………… 493 - 493 541 48 Non-Personnel ………………………………………………………… 473 120 593 652 59
Total Office of Ethics and Integrity……………………………………… 966 120 1,086 1,193 107
Department of Finance Salaries and Wages …………………………………………………… 150 - 150 193 43 Non-Personnel ………………………………………………………… 112 - 112 178 66
Total Department of Finance……………………………………………… 262 - 262 371 109
Land Use and Economic Development Salaries and Wages …………………………………………………… 155 - 155 155 - Non-Personnel ………………………………………………………… 82 - 82 83 1
Total Land Use and Economic Development…………………………… 237 - 237 238 1
Public Works Salaries and Wages …………………………………………………… 297 - 297 297 - Non-Personnel ………………………………………………………… 150 - 150 150 -
Total Public Works………………………………………………………… 447 - 447 447 -
Public Safety Salaries and Wages …………………………………………………… 200 - 200 574 374 Non-Personnel ………………………………………………………… 344 17 361 361 -
Total Public Safety………………………………………………………… 544 17 561 935 374
Customer & Neighborhood Services Salaries and Wages …………………………………………………… 250 - 250 250 - Non-Personnel ………………………………………………………… 129 - 129 129 -
Total Customer & Neighborhood Services……………………………… 379 - 379 379 -
Customer Service Salaries and Wages …………………………………………………… 977 - 977 978 1 Non-Personnel ………………………………………………………… 907 59 966 966 -
Total Customer Service…………………………………………………… 1,884 59 1,943 1,944 1
Total Departmental …………………………………………………………… 152,898 9,323 162,221 177,046 14,825
Citywide Program:Reserve Contribution
Non-Personnel ………………………………………………………… - - - 7,200 7,200
Assessments to Public Property Non-Personnel ………………………………………………………… 522 - 522 522 -
Citywide Elections Non-Personnel ………………………………………………………… 509 4 513 513 -
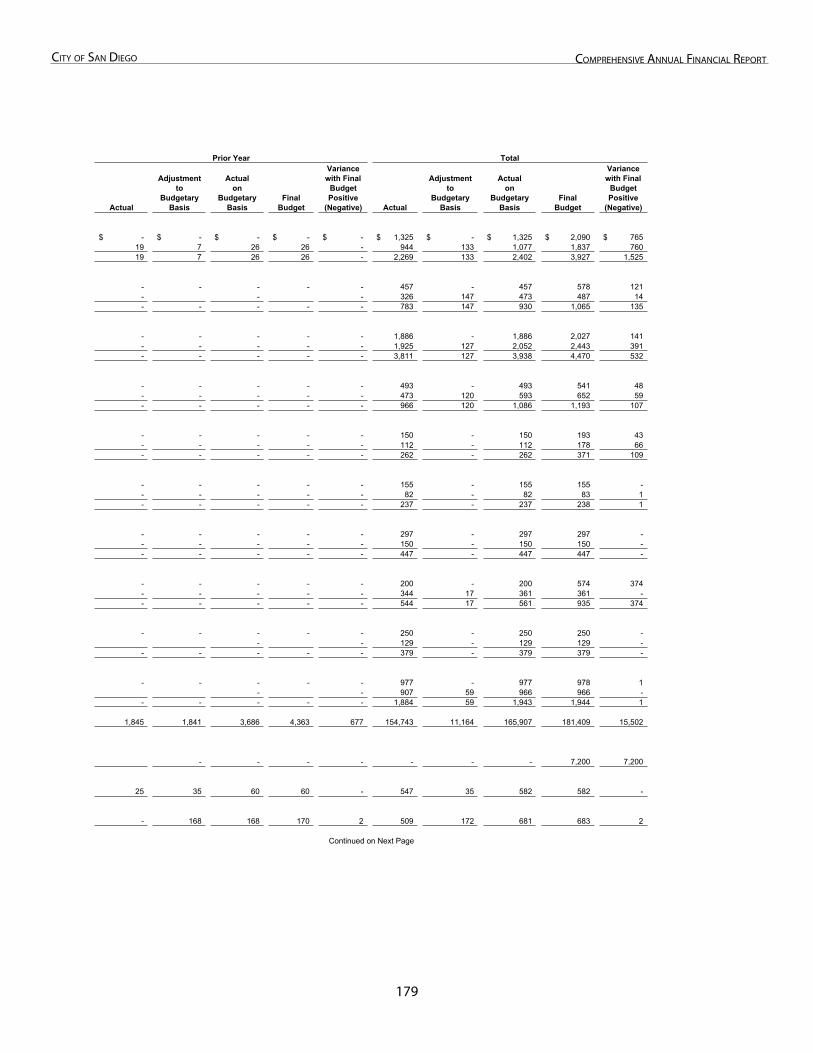
17�
City of San Diego ComprehenSive annual finanCial report
Prior Year Total
Actual
Adjustmentto
BudgetaryBasis
Actualon
BudgetaryBasis
FinalBudget
Variancewith Final
BudgetPositive
(Negative) Actual
Adjustmentto
BudgetaryBasis
Actualon
BudgetaryBasis
FinalBudget
Variancewith Final
BudgetPositive
(Negative)
-$ -$ -$ -$ -$ 1,325$ -$ 1,325$ 2,090$ 765$ 19 7 26 26 - 944 133 1,077 1,837 760 19 7 26 26 - 2,269 133 2,402 3,927 1,525
- - - - - 457 - 457 578 121 - - - 326 147 473 487 14 - - - - - 783 147 930 1,065 135
- - - - - 1,886 - 1,886 2,027 141 - - - - - 1,925 127 2,052 2,443 391 - - - - - 3,811 127 3,938 4,470 532
- - - - - 493 - 493 541 48 - - - - - 473 120 593 652 59 - - - - - 966 120 1,086 1,193 107
- - - - - 150 - 150 193 43 - - - - - 112 - 112 178 66 - - - - - 262 - 262 371 109
- - - - - 155 - 155 155 - - - - - - 82 - 82 83 1 - - - - - 237 - 237 238 1
- - - - - 297 - 297 297 - - - - - - 150 - 150 150 - - - - - - 447 - 447 447 -
- - - - - 200 - 200 574 374 - - - - - 344 17 361 361 - - - - - - 544 17 561 935 374
- - - - - 250 - 250 250 - - - 129 - 129 129 -
- - - - - 379 - 379 379 -
- - - - - 977 - 977 978 1 - - 907 59 966 966 -
- - - - - 1,884 59 1,943 1,944 1
1,845 1,841 3,686 4,363 677 154,743 11,164 165,907 181,409 15,502
- - - - - - - 7,200 7,200
25 35 60 60 - 547 35 582 582 -
- 168 168 170 2 509 172 681 683 2
Continued on Next Page
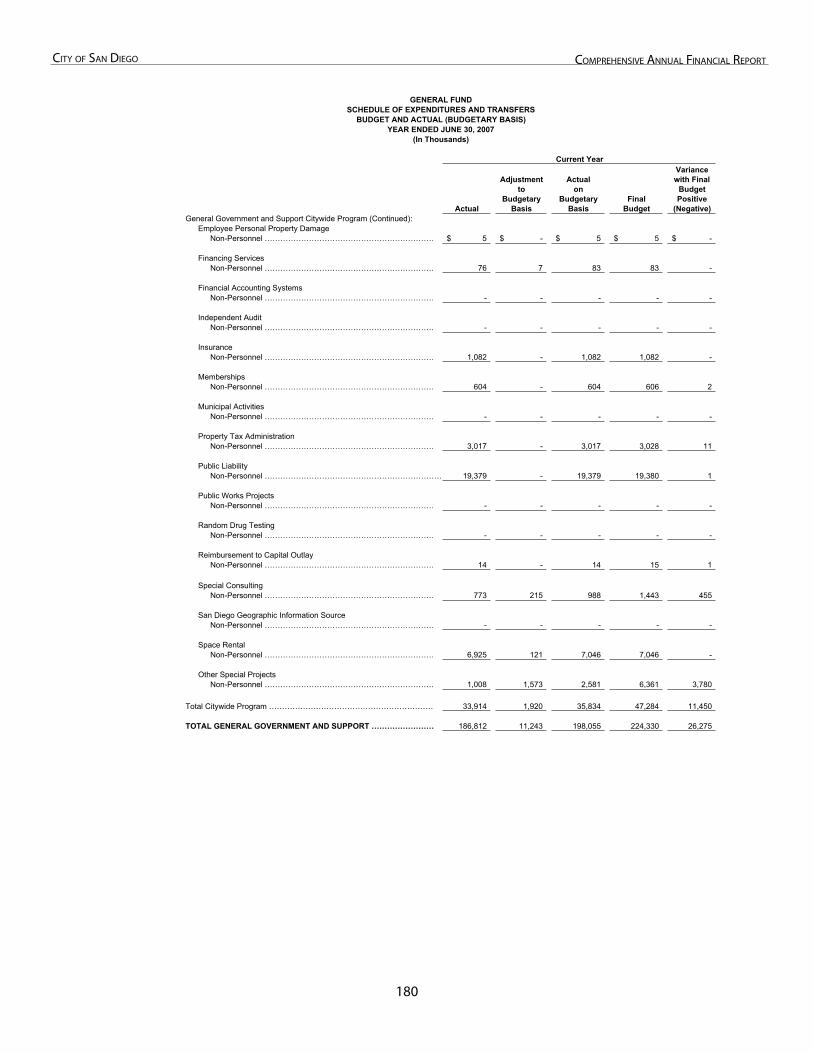
180
City of San Diego ComprehenSive annual finanCial report
GENERAL FUNDSCHEDULE OF EXPENDITURES AND TRANSFERS
BUDGET AND ACTUAL (BUDGETARY BASIS)YEAR ENDED JUNE 30, 2007
(In Thousands)
Current Year
Actual
Adjustmentto
BudgetaryBasis
Actualon
BudgetaryBasis
FinalBudget
Variancewith Final
BudgetPositive
(Negative)General Government and Support Citywide Program (Continued):
Employee Personal Property Damage Non-Personnel ………………………………………………………… 5$ -$ 5$ 5$ -$
Financing Services Non-Personnel ………………………………………………………… 76 7 83 83 -
Financial Accounting Systems Non-Personnel ………………………………………………………… - - - - -
Independent Audit Non-Personnel ………………………………………………………… - - - - -
Insurance Non-Personnel ………………………………………………………… 1,082 - 1,082 1,082 -
Memberships Non-Personnel ………………………………………………………… 604 - 604 606 2
Municipal Activities Non-Personnel ………………………………………………………… - - - - -
Property Tax Administration Non-Personnel ………………………………………………………… 3,017 - 3,017 3,028 11
Public LiabilityNon-Personnel …………………………………………………………… 19,379 - 19,379 19,380 1
Public Works Projects Non-Personnel ………………………………………………………… - - - - -
Random Drug Testing Non-Personnel ………………………………………………………… - - - - -
Reimbursement to Capital Outlay Non-Personnel ………………………………………………………… 14 - 14 15 1
Special Consulting Non-Personnel ………………………………………………………… 773 215 988 1,443 455
San Diego Geographic Information Source Non-Personnel ………………………………………………………… - - - - -
Space Rental Non-Personnel ………………………………………………………… 6,925 121 7,046 7,046 -
Other Special Projects Non-Personnel ………………………………………………………… 1,008 1,573 2,581 6,361 3,780
Total Citywide Program ……………………………………………………… 33,914 1,920 35,834 47,284 11,450
TOTAL GENERAL GOVERNMENT AND SUPPORT …………………… 186,812 11,243 198,055 224,330 26,275
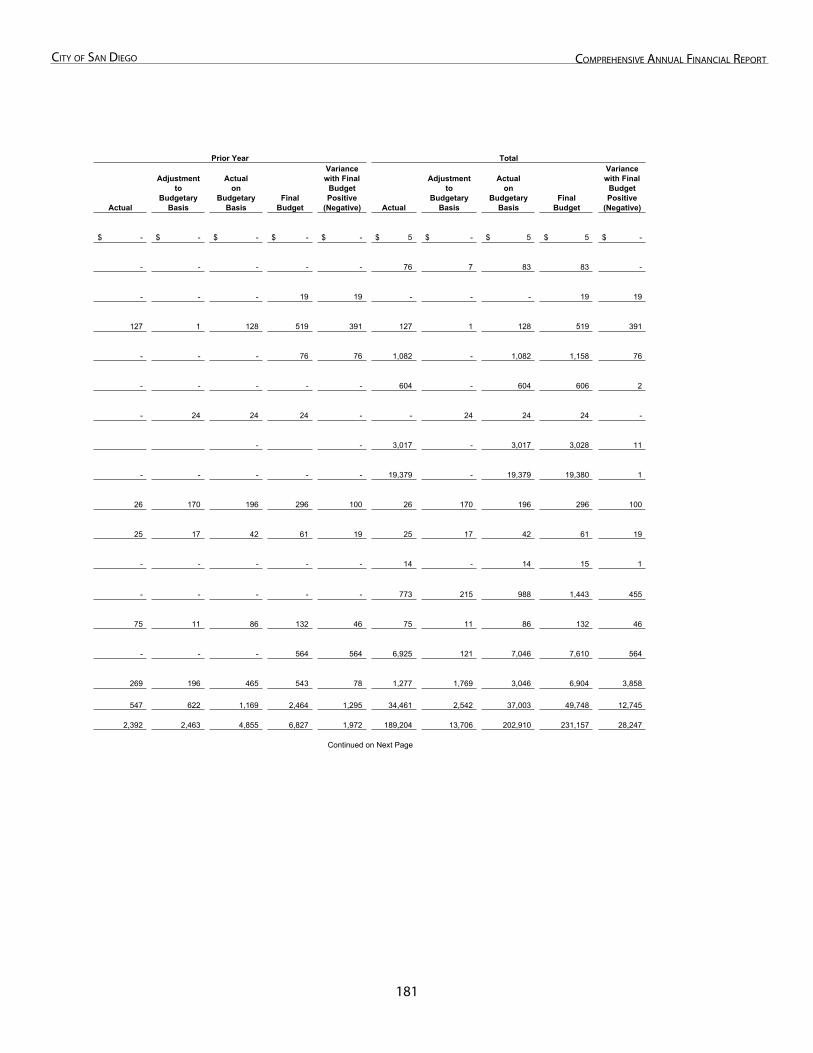
181
City of San Diego ComprehenSive annual finanCial report
Prior Year Total
Actual
Adjustmentto
BudgetaryBasis
Actualon
BudgetaryBasis
FinalBudget
Variancewith Final
BudgetPositive
(Negative) Actual
Adjustmentto
BudgetaryBasis
Actualon
BudgetaryBasis
FinalBudget
Variancewith Final
BudgetPositive
(Negative)
-$ -$ -$ -$ -$ 5$ -$ 5$ 5$ -$
- - - - - 76 7 83 83 -
- - - 19 19 - - - 19 19
127 1 128 519 391 127 1 128 519 391
- - - 76 76 1,082 - 1,082 1,158 76
- - - - - 604 - 604 606 2
- 24 24 24 - - 24 24 24 -
- - 3,017 - 3,017 3,028 11
- - - - - 19,379 - 19,379 19,380 1
26 170 196 296 100 26 170 196 296 100
25 17 42 61 19 25 17 42 61 19
- - - - - 14 - 14 15 1
- - - - - 773 215 988 1,443 455
75 11 86 132 46 75 11 86 132 46
- - - 564 564 6,925 121 7,046 7,610 564
269 196 465 543 78 1,277 1,769 3,046 6,904 3,858
547 622 1,169 2,464 1,295 34,461 2,542 37,003 49,748 12,745
2,392 2,463 4,855 6,827 1,972 189,204 13,706 202,910 231,157 28,247
Continued on Next Page
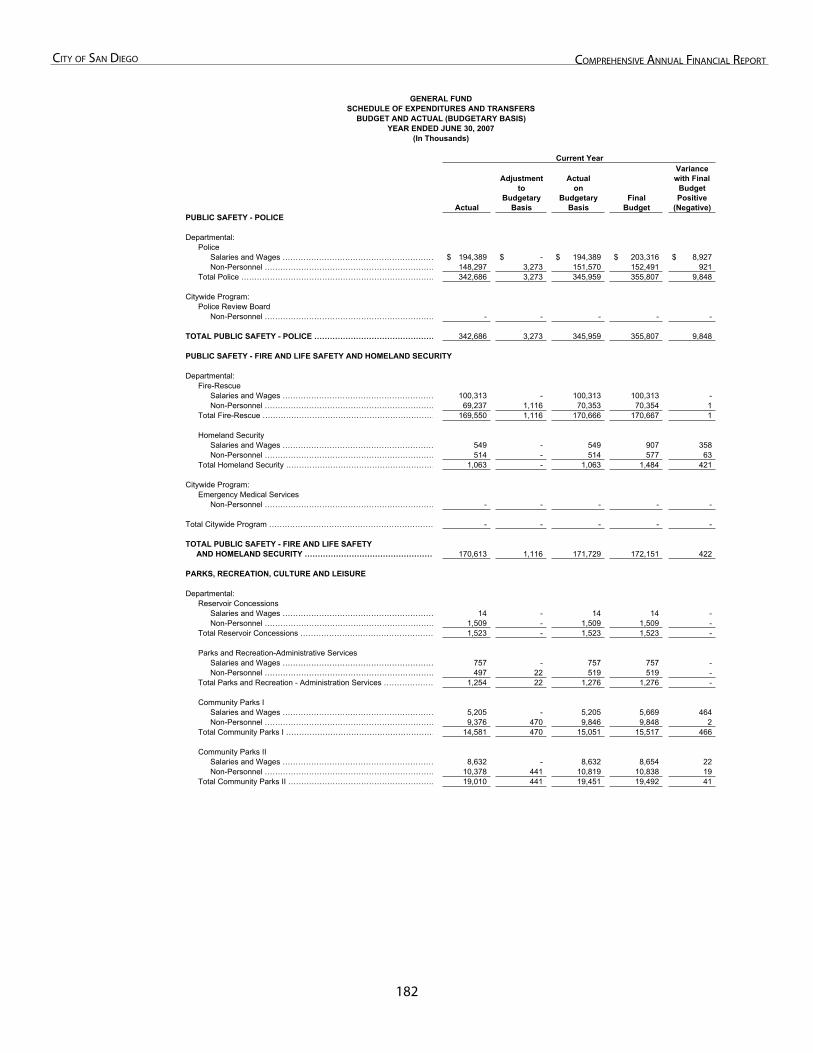
182
City of San Diego ComprehenSive annual finanCial report
GENERAL FUNDSCHEDULE OF EXPENDITURES AND TRANSFERS
BUDGET AND ACTUAL (BUDGETARY BASIS)YEAR ENDED JUNE 30, 2007
(In Thousands)
Current Year
Actual
Adjustmentto
BudgetaryBasis
Actualon
BudgetaryBasis
FinalBudget
Variancewith Final
BudgetPositive
(Negative)PUBLIC SAFETY - POLICE
Departmental:Police
Salaries and Wages …………………………………………………… 194,389$ -$ 194,389$ 203,316$ 8,927$ Non-Personnel ………………………………………………………… 148,297 3,273 151,570 152,491 921
Total Police ………………………………………………………………… 342,686 3,273 345,959 355,807 9,848
Citywide Program:Police Review Board
Non-Personnel ………………………………………………………… - - - - -
TOTAL PUBLIC SAFETY - POLICE ………………………………………… 342,686 3,273 345,959 355,807 9,848
PUBLIC SAFETY - FIRE AND LIFE SAFETY AND HOMELAND SECURITY
Departmental:Fire-Rescue
Salaries and Wages …………………………………………………… 100,313 - 100,313 100,313 - Non-Personnel ………………………………………………………… 69,237 1,116 70,353 70,354 1
Total Fire-Rescue ………………………………………………………… 169,550 1,116 170,666 170,667 1
Homeland Security Salaries and Wages …………………………………………………… 549 - 549 907 358 Non-Personnel ………………………………………………………… 514 - 514 577 63
Total Homeland Security ………………………………………………… 1,063 - 1,063 1,484 421
Citywide Program:Emergency Medical Services
Non-Personnel ………………………………………………………… - - - - -
Total Citywide Program ……………………………………………………… - - - - -
TOTAL PUBLIC SAFETY - FIRE AND LIFE SAFETY AND HOMELAND SECURITY …………………………………………… 170,613 1,116 171,729 172,151 422
PARKS, RECREATION, CULTURE AND LEISURE
Departmental:Reservoir Concessions
Salaries and Wages …………………………………………………… 14 - 14 14 - Non-Personnel ………………………………………………………… 1,509 - 1,509 1,509 -
Total Reservoir Concessions …………………………………………… 1,523 - 1,523 1,523 -
Parks and Recreation-Administrative Services Salaries and Wages …………………………………………………… 757 - 757 757 - Non-Personnel ………………………………………………………… 497 22 519 519 -
Total Parks and Recreation - Administration Services ………………… 1,254 22 1,276 1,276 -
Community Parks I Salaries and Wages …………………………………………………… 5,205 - 5,205 5,669 464 Non-Personnel ………………………………………………………… 9,376 470 9,846 9,848 2
Total Community Parks I ………………………………………………… 14,581 470 15,051 15,517 466
Community Parks II Salaries and Wages …………………………………………………… 8,632 - 8,632 8,654 22 Non-Personnel ………………………………………………………… 10,378 441 10,819 10,838 19
Total Community Parks II ………………………………………………… 19,010 441 19,451 19,492 41
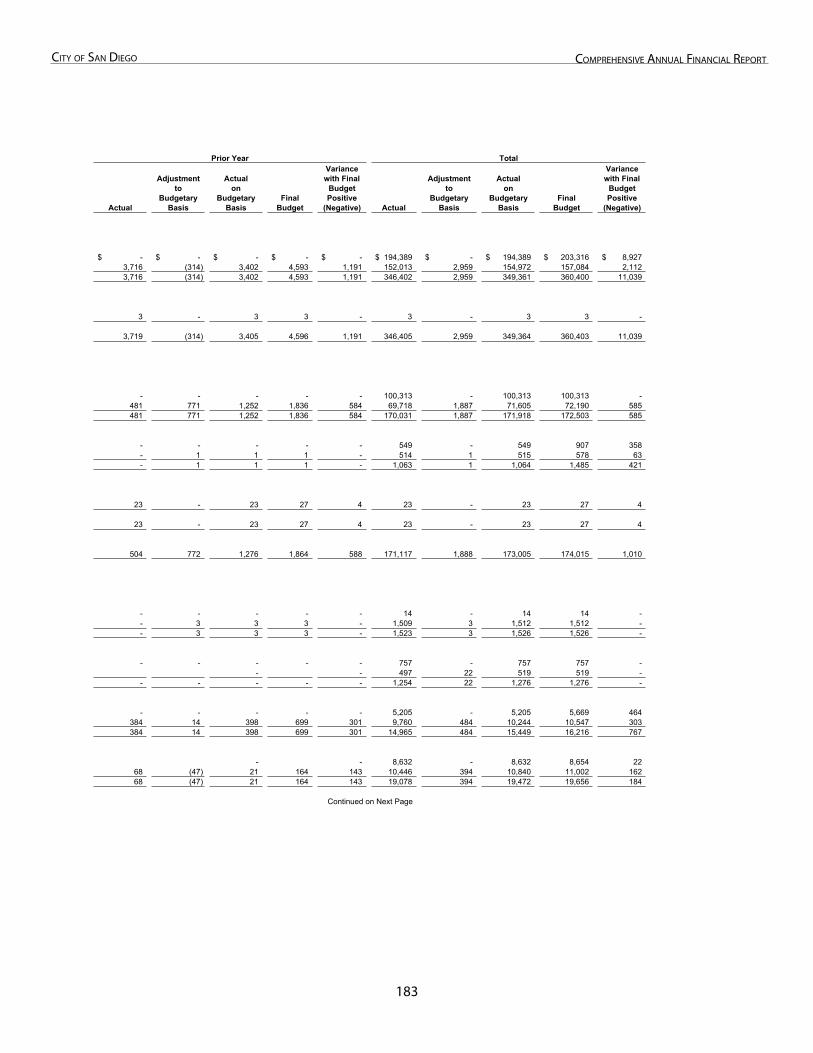
183
City of San Diego ComprehenSive annual finanCial report
Prior Year Total
Actual
Adjustmentto
BudgetaryBasis
Actualon
BudgetaryBasis
FinalBudget
Variancewith Final
BudgetPositive
(Negative) Actual
Adjustmentto
BudgetaryBasis
Actualon
BudgetaryBasis
FinalBudget
Variancewith Final
BudgetPositive
(Negative)
-$ -$ -$ -$ -$ 194,389$ -$ 194,389$ 203,316$ 8,927$ 3,716 (314) 3,402 4,593 1,191 152,013 2,959 154,972 157,084 2,112 3,716 (314) 3,402 4,593 1,191 346,402 2,959 349,361 360,400 11,039
3 - 3 3 - 3 - 3 3 -
3,719 (314) 3,405 4,596 1,191 346,405 2,959 349,364 360,403 11,039
- - - - - 100,313 - 100,313 100,313 - 481 771 1,252 1,836 584 69,718 1,887 71,605 72,190 585 481 771 1,252 1,836 584 170,031 1,887 171,918 172,503 585
- - - - - 549 - 549 907 358 - 1 1 1 - 514 1 515 578 63 - 1 1 1 - 1,063 1 1,064 1,485 421
23 - 23 27 4 23 - 23 27 4
23 - 23 27 4 23 - 23 27 4
504 772 1,276 1,864 588 171,117 1,888 173,005 174,015 1,010
- - - - - 14 - 14 14 - - 3 3 3 - 1,509 3 1,512 1,512 - - 3 3 3 - 1,523 3 1,526 1,526 -
- - - - - 757 - 757 757 - - - 497 22 519 519 -
- - - - - 1,254 22 1,276 1,276 -
- - - - - 5,205 - 5,205 5,669 464 384 14 398 699 301 9,760 484 10,244 10,547 303 384 14 398 699 301 14,965 484 15,449 16,216 767
- - 8,632 - 8,632 8,654 22 68 (47) 21 164 143 10,446 394 10,840 11,002 162 68 (47) 21 164 143 19,078 394 19,472 19,656 184
Continued on Next Page

18�
City of San Diego ComprehenSive annual finanCial report
GENERAL FUNDSCHEDULE OF EXPENDITURES AND TRANSFERS
BUDGET AND ACTUAL (BUDGETARY BASIS)YEAR ENDED JUNE 30, 2007
(In Thousands)
Current Year
Actual
Adjustmentto
BudgetaryBasis
Actualon
BudgetaryBasis
FinalBudget
Variancewith Final
BudgetPositive
(Negative)Parks, Recreation, Culture and Leisure Departmental (Continued):
Developed Regional Parks Salaries and Wages …………………………………………………… 12,622$ -$ 12,622$ 12,907$ 285$ Non-Personnel ………………………………………………………… 19,406 881 20,287 20,341 54
Total Developed Regional Parks ………………………………………… 32,028 881 32,909 33,248 339
Open Space Division Salaries and Wages …………………………………………………… 1,711 - 1,711 1,711 - Non-Personnel ………………………………………………………… 3,067 704 3,771 3,771 -
Total Open Space Division ……………………………………………… 4,778 704 5,482 5,482 -
Park and Planning Development Salaries and Wages …………………………………………………… 2,559 - 2,559 2,559 - Non-Personnel ………………………………………………………… 1,501 - 1,501 1,502 1
Total Park and Planning Development ………………………………… 4,060 - 4,060 4,061 1
Library Salaries and Wages …………………………………………………… 17,890 - 17,890 19,169 1,279 Non-Personnel ………………………………………………………… 16,919 479 17,398 17,561 163
Total Library ………………………………………………………………… 34,809 479 35,288 36,730 1,442
Total Departmental …………………………………………………………… 112,043 2,997 115,040 117,329 2,289
Citywide Program:Parks and Recreation Programs
Non-Personnel ………………………………………………………… 15 3 18 2,265 2,247
TOTAL PARKS, RECREATIONCULTURE AND LEISURE ……………………………..………………........ 112,058 3,000 115,058 119,594 4,536
TRANSPORTATION
DepartmentStreets
Salaries and Wages …………………………………………………… 12,819 - 12,819 12,819 - Non-Personnel ………………………………………………………… 30,556 7,708 38,264 38,645 381
Total Streets ……………………………………………………………… 43,375 7,708 51,083 51,464 381
Parking Management Non-Personnel ………………………………………………………… (79) - (79) (79) -
Transportation Design Salaries and Wages …………………………………………………… 4,291 - 4,291 4,728 437 Non-Personnel ………………………………………………………… 2,530 91 2,621 2,700 79
Total Transportation Design ……………………………………………… 6,821 91 6,912 7,428 516
Traffic Engineering Salaries and Wages …………………………………………………… 3,507 - 3,507 3,638 131 Non-Personnel ………………………………………………………… 3,402 146 3,548 3,670 122
Total Traffic Engineering ………………………………………………… 6,909 146 7,055 7,308 253
Total Departmental……………………………………………………………… 57,026 7,945 64,971 66,121 1,150
Citywide Program: Transportation
Non-Personnel ………………………………………………………… 278 - 278 278 -
TOTAL TRANSPORTATION ………………………………………………… 57,304 7,945 65,249 66,399 1,150
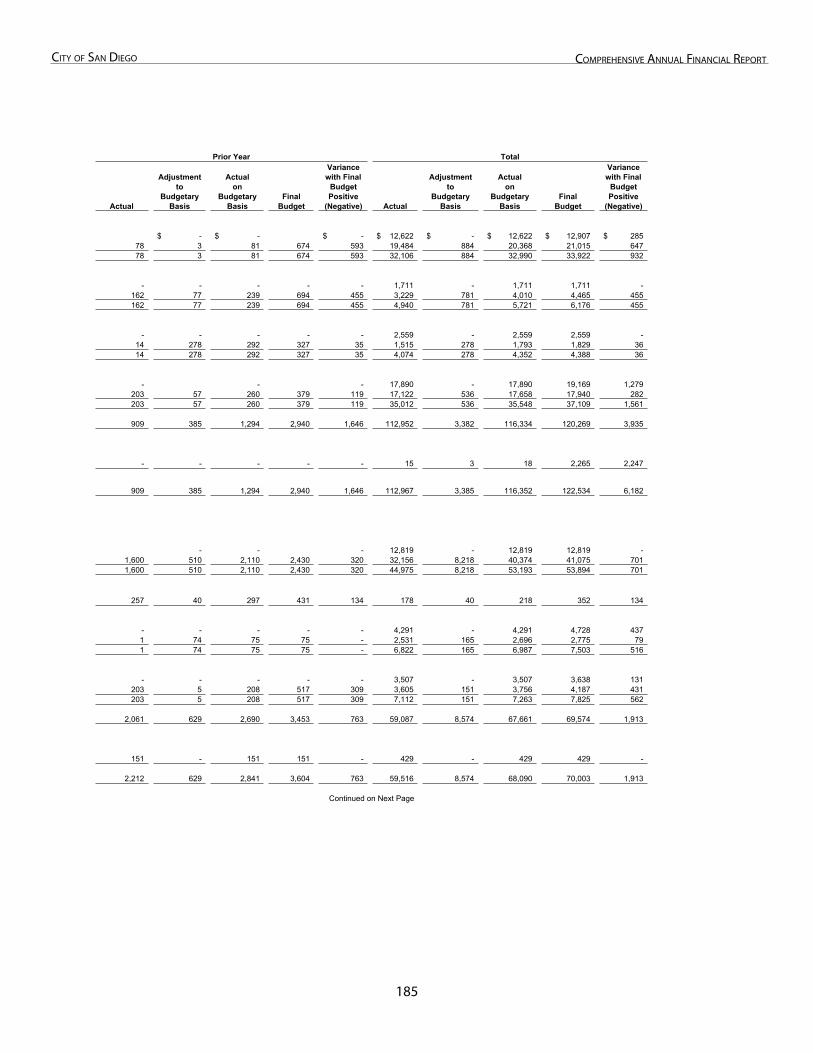
18�
City of San Diego ComprehenSive annual finanCial report
Prior Year Total
Actual
Adjustmentto
BudgetaryBasis
Actualon
BudgetaryBasis
FinalBudget
Variancewith Final
BudgetPositive
(Negative) Actual
Adjustmentto
BudgetaryBasis
Actualon
BudgetaryBasis
FinalBudget
Variancewith Final
BudgetPositive
(Negative)
-$ -$ -$ 12,622$ -$ 12,622$ 12,907$ 285$ 78 3 81 674 593 19,484 884 20,368 21,015 647 78 3 81 674 593 32,106 884 32,990 33,922 932
- - - - - 1,711 - 1,711 1,711 - 162 77 239 694 455 3,229 781 4,010 4,465 455 162 77 239 694 455 4,940 781 5,721 6,176 455
- - - - - 2,559 - 2,559 2,559 - 14 278 292 327 35 1,515 278 1,793 1,829 36 14 278 292 327 35 4,074 278 4,352 4,388 36
- - - 17,890 - 17,890 19,169 1,279 203 57 260 379 119 17,122 536 17,658 17,940 282 203 57 260 379 119 35,012 536 35,548 37,109 1,561
909 385 1,294 2,940 1,646 112,952 3,382 116,334 120,269 3,935
- - - - - 15 3 18 2,265 2,247
909 385 1,294 2,940 1,646 112,967 3,385 116,352 122,534 6,182
- - - 12,819 - 12,819 12,819 - 1,600 510 2,110 2,430 320 32,156 8,218 40,374 41,075 701 1,600 510 2,110 2,430 320 44,975 8,218 53,193 53,894 701
257 40 297 431 134 178 40 218 352 134
- - - - - 4,291 - 4,291 4,728 437 1 74 75 75 - 2,531 165 2,696 2,775 79 1 74 75 75 - 6,822 165 6,987 7,503 516
- - - - - 3,507 - 3,507 3,638 131 203 5 208 517 309 3,605 151 3,756 4,187 431 203 5 208 517 309 7,112 151 7,263 7,825 562
2,061 629 2,690 3,453 763 59,087 8,574 67,661 69,574 1,913
151 - 151 151 - 429 - 429 429 -
2,212 629 2,841 3,604 763 59,516 8,574 68,090 70,003 1,913
Continued on Next Page
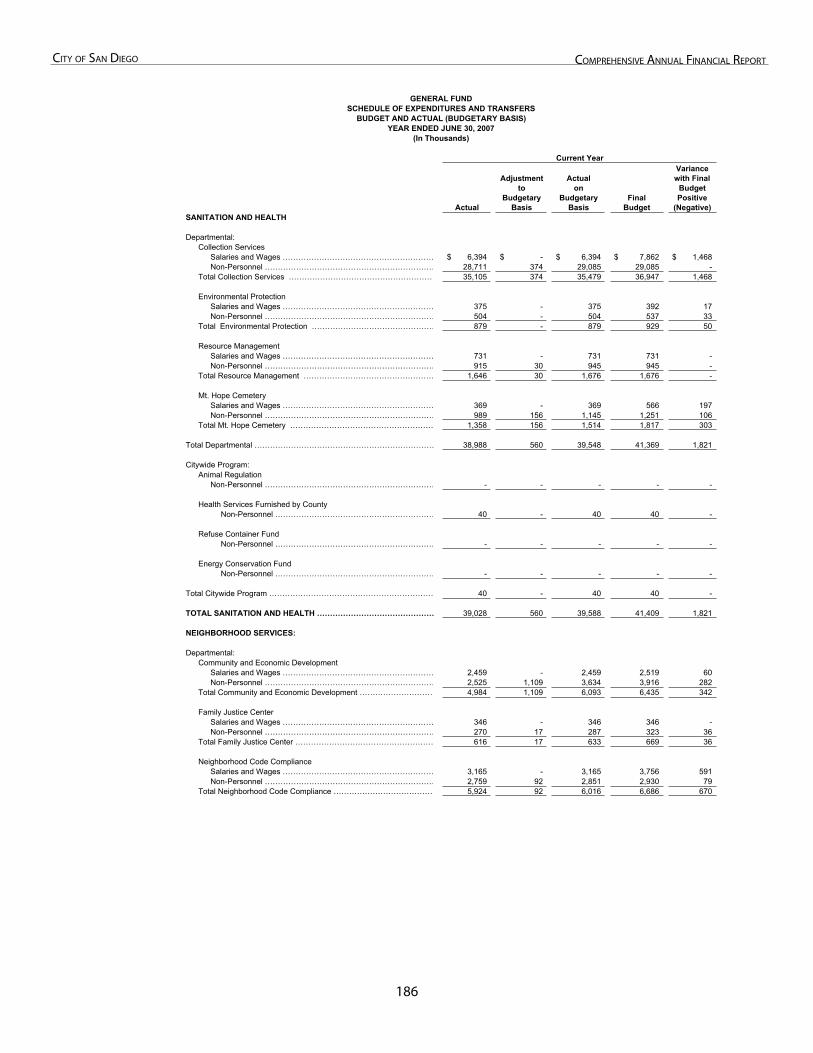
18�
City of San Diego ComprehenSive annual finanCial report
GENERAL FUNDSCHEDULE OF EXPENDITURES AND TRANSFERS
BUDGET AND ACTUAL (BUDGETARY BASIS)YEAR ENDED JUNE 30, 2007
(In Thousands)
Current Year
Actual
Adjustmentto
BudgetaryBasis
Actualon
BudgetaryBasis
FinalBudget
Variancewith Final
BudgetPositive
(Negative)SANITATION AND HEALTH
Departmental:Collection Services
Salaries and Wages …………………………………………………… 6,394$ -$ 6,394$ 7,862$ 1,468$ Non-Personnel ………………………………………………………… 28,711 374 29,085 29,085 -
Total Collection Services ………………………………………………… 35,105 374 35,479 36,947 1,468
Environmental Protection Salaries and Wages …………………………………………………… 375 - 375 392 17 Non-Personnel ………………………………………………………… 504 - 504 537 33
Total Environmental Protection ………………………………………… 879 - 879 929 50
Resource Management Salaries and Wages …………………………………………………… 731 - 731 731 - Non-Personnel ………………………………………………………… 915 30 945 945 -
Total Resource Management …………………………………………… 1,646 30 1,676 1,676 -
Mt. Hope Cemetery Salaries and Wages …………………………………………………… 369 - 369 566 197 Non-Personnel ………………………………………………………… 989 156 1,145 1,251 106
Total Mt. Hope Cemetery ………………………………………………… 1,358 156 1,514 1,817 303
Total Departmental …………………………………………………………… 38,988 560 39,548 41,369 1,821
Citywide Program:Animal Regulation
Non-Personnel ………………………………………………………… - - - - -
Health Services Furnished by County Non-Personnel ……………………………………………………… 40 - 40 40 -
Refuse Container Fund Non-Personnel ……………………………………………………… - - - - -
Energy Conservation Fund Non-Personnel ……………………………………………………… - - - - -
Total Citywide Program ……………………………………………………… 40 - 40 40 -
TOTAL SANITATION AND HEALTH ……………………………………… 39,028 560 39,588 41,409 1,821
NEIGHBORHOOD SERVICES:
Departmental:Community and Economic Development
Salaries and Wages …………………………………………………… 2,459 - 2,459 2,519 60 Non-Personnel ………………………………………………………… 2,525 1,109 3,634 3,916 282
Total Community and Economic Development ………………………… 4,984 1,109 6,093 6,435 342
Family Justice CenterSalaries and Wages …………………………………………………… 346 - 346 346 - Non-Personnel ………………………………………………………… 270 17 287 323 36
Total Family Justice Center ……………………………………………… 616 17 633 669 36
Neighborhood Code Compliance Salaries and Wages …………………………………………………… 3,165 - 3,165 3,756 591 Non-Personnel ………………………………………………………… 2,759 92 2,851 2,930 79
Total Neighborhood Code Compliance ………………………………… 5,924 92 6,016 6,686 670
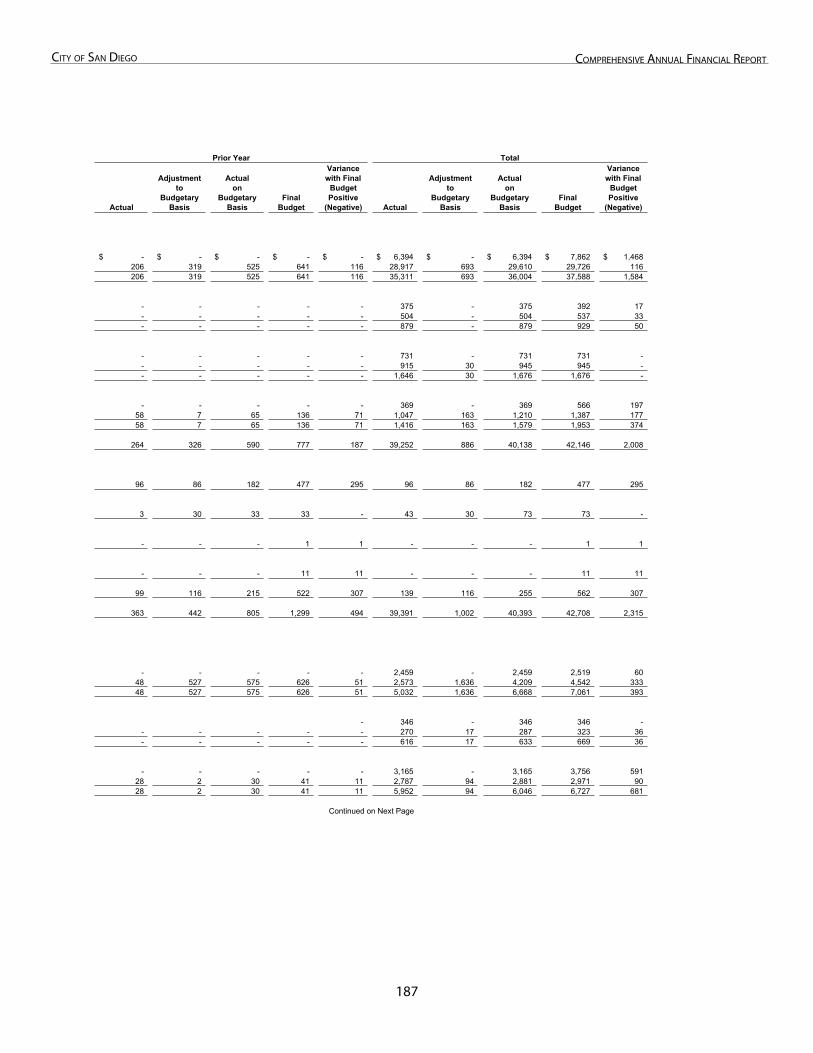
187
City of San Diego ComprehenSive annual finanCial report
Prior Year Total
Actual
Adjustmentto
BudgetaryBasis
Actualon
BudgetaryBasis
FinalBudget
Variancewith Final
BudgetPositive
(Negative) Actual
Adjustmentto
BudgetaryBasis
Actualon
BudgetaryBasis
FinalBudget
Variancewith Final
BudgetPositive
(Negative)
-$ -$ -$ -$ -$ 6,394$ -$ 6,394$ 7,862$ 1,468$ 206 319 525 641 116 28,917 693 29,610 29,726 116 206 319 525 641 116 35,311 693 36,004 37,588 1,584
- - - - - 375 - 375 392 17 - - - - - 504 - 504 537 33 - - - - - 879 - 879 929 50
- - - - - 731 - 731 731 - - - - - - 915 30 945 945 - - - - - - 1,646 30 1,676 1,676 -
- - - - - 369 - 369 566 197 58 7 65 136 71 1,047 163 1,210 1,387 177 58 7 65 136 71 1,416 163 1,579 1,953 374
264 326 590 777 187 39,252 886 40,138 42,146 2,008
96 86 182 477 295 96 86 182 477 295
3 30 33 33 - 43 30 73 73 -
- - - 1 1 - - - 1 1
- - - 11 11 - - - 11 11
99 116 215 522 307 139 116 255 562 307
363 442 805 1,299 494 39,391 1,002 40,393 42,708 2,315
- - - - - 2,459 - 2,459 2,519 60 48 527 575 626 51 2,573 1,636 4,209 4,542 333 48 527 575 626 51 5,032 1,636 6,668 7,061 393
- 346 - 346 346 - - - - - - 270 17 287 323 36 - - - - - 616 17 633 669 36
- - - - - 3,165 - 3,165 3,756 591 28 2 30 41 11 2,787 94 2,881 2,971 90 28 2 30 41 11 5,952 94 6,046 6,727 681
Continued on Next Page
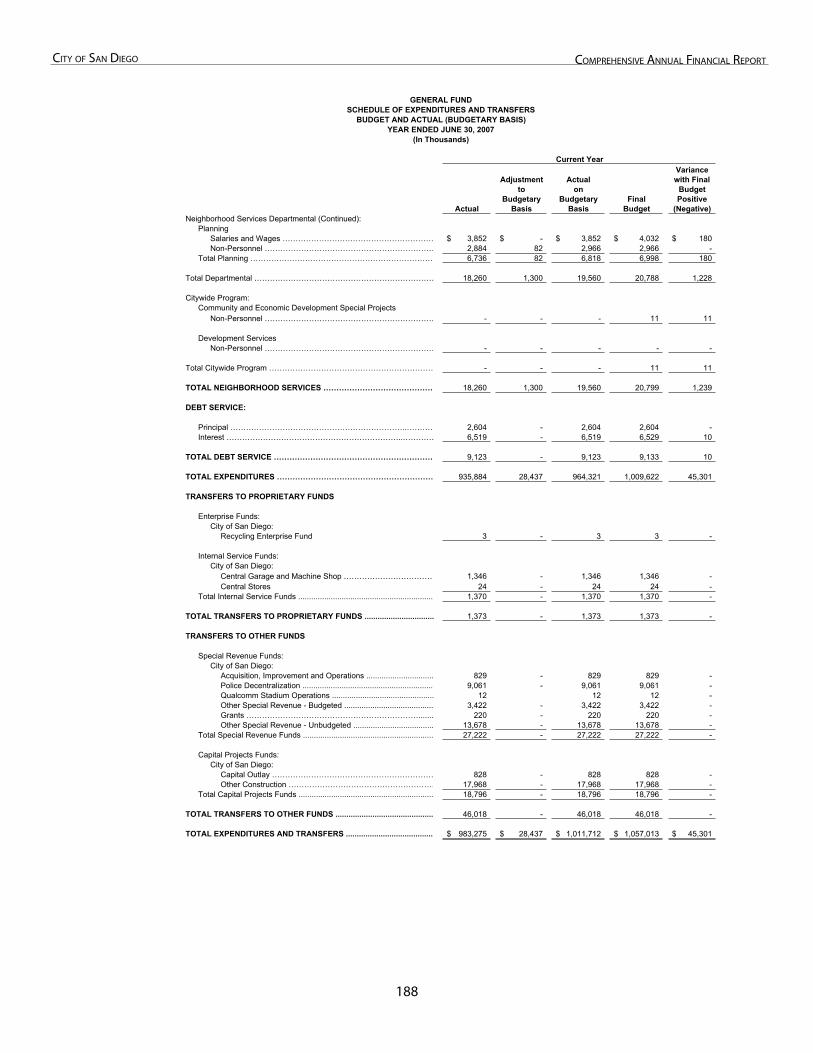
188
City of San Diego ComprehenSive annual finanCial report
GENERAL FUNDSCHEDULE OF EXPENDITURES AND TRANSFERS
BUDGET AND ACTUAL (BUDGETARY BASIS)YEAR ENDED JUNE 30, 2007
(In Thousands)
Current Year
Actual
Adjustmentto
BudgetaryBasis
Actualon
BudgetaryBasis
FinalBudget
Variancewith Final
BudgetPositive
(Negative)Neighborhood Services Departmental (Continued):
Planning Salaries and Wages …………………………………………………… 3,852$ -$ 3,852$ 4,032$ 180$ Non-Personnel ………………………………………………………… 2,884 82 2,966 2,966 -
Total Planning ……………………………………………………………… 6,736 82 6,818 6,998 180
Total Departmental …………………………………………………………… 18,260 1,300 19,560 20,788 1,228
Citywide Program:Community and Economic Development Special Projects
Non-Personnel ………………………………………………………… - - - 11 11
Development Services Non-Personnel ………………………………………………………… - - - - -
Total Citywide Program ……………………………………………………… - - - 11 11
TOTAL NEIGHBORHOOD SERVICES ……………………………………… 18,260 1,300 19,560 20,799 1,239
DEBT SERVICE:
Principal …………………………………………………………..………… 2,604 - 2,604 2,604 - Interest …………………………………………………………..………… 6,519 - 6,519 6,529 10
TOTAL DEBT SERVICE ……………………………………………………… 9,123 - 9,123 9,133 10
TOTAL EXPENDITURES …………………………………………………… 935,884 28,437 964,321 1,009,622 45,301
TRANSFERS TO PROPRIETARY FUNDS
Enterprise Funds:City of San Diego:
Recycling Enterprise Fund 3 - 3 3 -
Internal Service Funds: City of San Diego:
Central Garage and Machine Shop ……………………………… 1,346 - 1,346 1,346 - Central Stores 24 - 24 24 -
Total Internal Service Funds ............................................................... 1,370 - 1,370 1,370 -
TOTAL TRANSFERS TO PROPRIETARY FUNDS ................................ 1,373 - 1,373 1,373 -
TRANSFERS TO OTHER FUNDS
Special Revenue Funds: City of San Diego:
Acquisition, Improvement and Operations ............................... 829 - 829 829 - Police Decentralization ............................................................. 9,061 - 9,061 9,061 - Qualcomm Stadium Operations ............................................... 12 12 12 - Other Special Revenue - Budgeted ......................................... 3,422 - 3,422 3,422 - Grants …………………………………………………………....... 220 - 220 220 - Other Special Revenue - Unbudgeted ..................................... 13,678 - 13,678 13,678 -
Total Special Revenue Funds ............................................................ 27,222 - 27,222 27,222 -
Capital Projects Funds:City of San Diego:
Capital Outlay ……………………………………………………… 828 - 828 828 - Other Construction ………………………………………………… 17,968 - 17,968 17,968 -
Total Capital Projects Funds .............................................................. 18,796 - 18,796 18,796 -
TOTAL TRANSFERS TO OTHER FUNDS ............................................. 46,018 - 46,018 46,018 -
TOTAL EXPENDITURES AND TRANSFERS ......................................... 983,275$ 28,437$ 1,011,712$ 1,057,013$ 45,301$
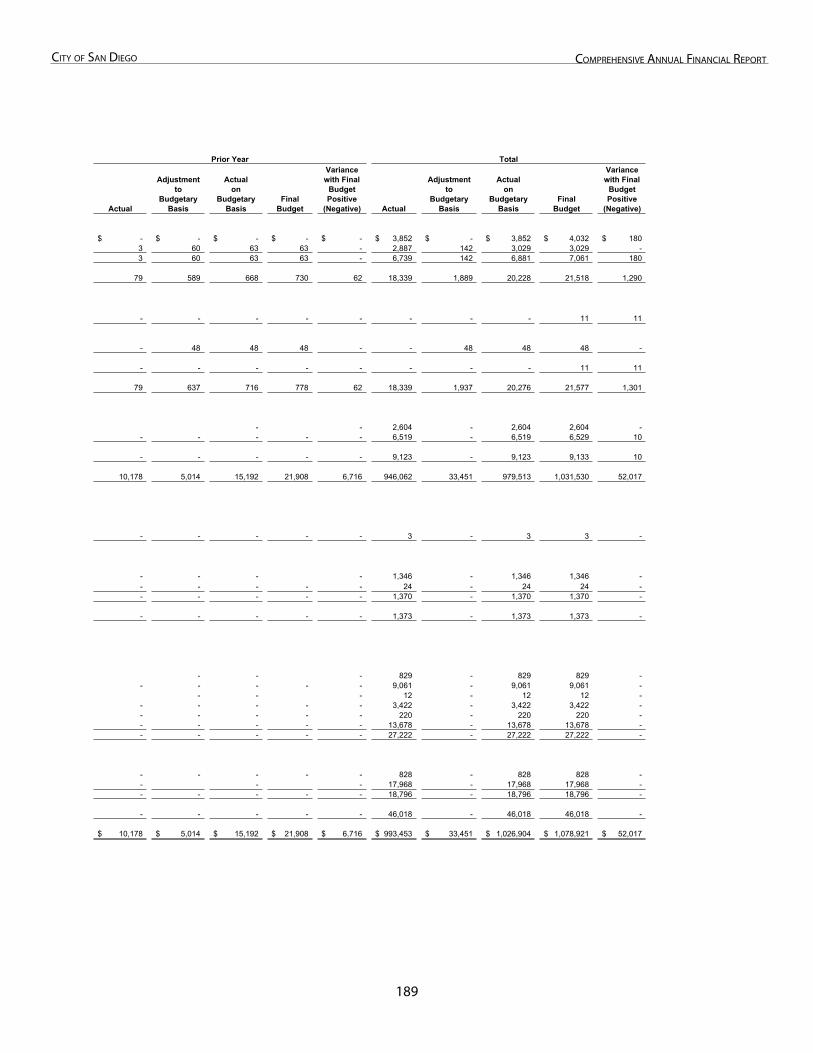
18�
City of San Diego ComprehenSive annual finanCial report
Prior Year Total
Actual
Adjustmentto
BudgetaryBasis
Actualon
BudgetaryBasis
FinalBudget
Variancewith Final
BudgetPositive
(Negative) Actual
Adjustmentto
BudgetaryBasis
Actualon
BudgetaryBasis
FinalBudget
Variancewith Final
BudgetPositive
(Negative)
-$ -$ -$ -$ -$ 3,852$ -$ 3,852$ 4,032$ 180$ 3 60 63 63 - 2,887 142 3,029 3,029 - 3 60 63 63 - 6,739 142 6,881 7,061 180
79 589 668 730 62 18,339 1,889 20,228 21,518 1,290
- - - - - - - - 11 11
- 48 48 48 - - 48 48 48 -
- - - - - - - - 11 11
79 637 716 778 62 18,339 1,937 20,276 21,577 1,301
- - 2,604 - 2,604 2,604 - - - - - - 6,519 - 6,519 6,529 10
- - - - - 9,123 - 9,123 9,133 10
10,178 5,014 15,192 21,908 6,716 946,062 33,451 979,513 1,031,530 52,017
- - - - - 3 - 3 3 -
- - - - 1,346 - 1,346 1,346 - - - - - - 24 - 24 24 - - - - - - 1,370 - 1,370 1,370 -
- - - - - 1,373 - 1,373 1,373 -
- - - 829 - 829 829 - - - - - - 9,061 - 9,061 9,061 -
- - - 12 - 12 12 - - - - - - 3,422 - 3,422 3,422 - - - - - - 220 - 220 220 - - - - - - 13,678 - 13,678 13,678 - - - - - - 27,222 - 27,222 27,222 -
- - - - - 828 - 828 828 - - - - 17,968 - 17,968 17,968 - - - - - - 18,796 - 18,796 18,796 -
- - - - - 46,018 - 46,018 46,018 -
10,178$ 5,014$ 15,192$ 21,908$ 6,716$ 993,453$ 33,451$ 1,026,904$ 1,078,921$ 52,017$

This Page Left Intentionally Blank
1�0
non-major governmental funDS
Non-Major Governmental Funds
This Page Left Intentionally Blank - Back of Divider Page
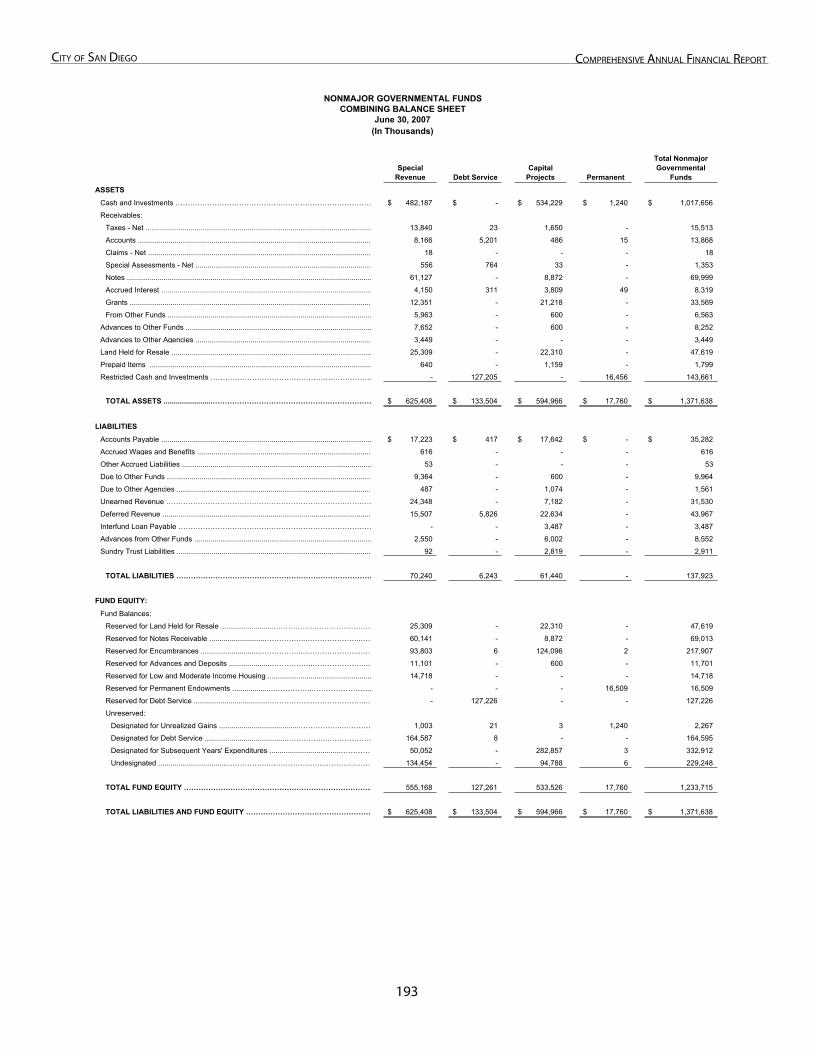
1�3
City of San Diego ComprehenSive annual finanCial report
SpecialRevenue Debt Service
CapitalProjects Permanent
Total Nonmajor Governmental
FundsASSETS
Cash and Investments ……………………………………………………………………… 482,187$ -$ 534,229$ 1,240$ 1,017,656$
Receivables:
Taxes - Net ............................................................................................................... 13,840 23 1,650 - 15,513
Accounts ................................................................................................................... 8,166 5,201 486 15 13,868
Claims - Net .............................................................................................................. 18 - - - 18
Special Assessments - Net ...................................................................................... 556 764 33 - 1,353
Notes ........................................................................................................................ 61,127 - 8,872 - 69,999
Accrued Interest ....................................................................................................... 4,150 311 3,809 49 8,319
Grants ....................................................................................................................... 12,351 - 21,218 - 33,569
From Other Funds .................................................................................................... 5,963 - 600 - 6,563
Advances to Other Funds ........................................................................................... 7,652 - 600 - 8,252
Advances to Other Agencies ...................................................................................... 3,449 - - - 3,449
Land Held for Resale .................................................................................................. 25,309 - 22,310 - 47,619
Prepaid Items ............................................................................................................. 640 - 1,159 - 1,799
Restricted Cash and Investments ………………………………………………………… - 127,205 - 16,456 143,661
TOTAL ASSETS ........................………………………………………………………… 625,408$ 133,504$ 594,966$ 17,760$ 1,371,638$
LIABILITIES
Accounts Payable ....................................................................................................... 17,223$ 417$ 17,642$ -$ 35,282$
Accrued Wages and Benefits ...................................................................................... 616 - - - 616
Other Accrued Liabilities ............................................................................................. 53 - - - 53
Due to Other Funds .................................................................................................... 9,364 - 600 - 9,964
Due to Other Agencies ................................................................................................ 487 - 1,074 - 1,561
Unearned Revenue ………………………………………………………………………… 24,348 - 7,182 - 31,530
Deferred Revenue ....................................................................................................... 15,507 5,826 22,634 - 43,967
Interfund Loan Payable ……………………………………………………………………… - - 3,487 - 3,487
Advances from Other Funds ....................................................................................... 2,550 - 6,002 - 8,552
Sundry Trust Liabilities ................................................................................................ 92 - 2,819 - 2,911
TOTAL LIABILITIES ……………………………………………………………………… 70,240 6,243 61,440 - 137,923
FUND EQUITY:
Fund Balances:
Reserved for Land Held for Resale ...........................……………..………………….. 25,309 - 22,310 - 47,619
Reserved for Notes Receivable ...........................……………..…………………..…… 60,141 - 8,872 - 69,013
Reserved for Encumbrances ..............................……………..…………………..…… 93,803 6 124,096 2 217,907
Reserved for Advances and Deposits .....................……………..…………………..… 11,101 - 600 - 11,701
Reserved for Low and Moderate Income Housing ................................................... 14,718 - - - 14,718
Reserved for Permanent Endowments ....................……………..…………………..… - - - 16,509 16,509
Reserved for Debt Service .....................................……………..…………………..… - 127,226 - - 127,226
Unreserved:
Designated for Unrealized Gains ........................................……………..………… 1,003 21 3 1,240 2,267
Designated for Debt Service ........................................……………..……………… 164,587 8 - - 164,595
Designated for Subsequent Years' Expenditures ...................................…………… 50,052 - 282,857 3 332,912
Undesignated ..................................……………..…………………..………………… 134,454 - 94,788 6 229,248
TOTAL FUND EQUITY …………………………………………………………………… 555,168 127,261 533,526 17,760 1,233,715
TOTAL LIABILITIES AND FUND EQUITY …………………………………………… 625,408$ 133,504$ 594,966$ 17,760$ 1,371,638$
NONMAJOR GOVERNMENTAL FUNDSCOMBINING BALANCE SHEET
June 30, 2007(In Thousands)
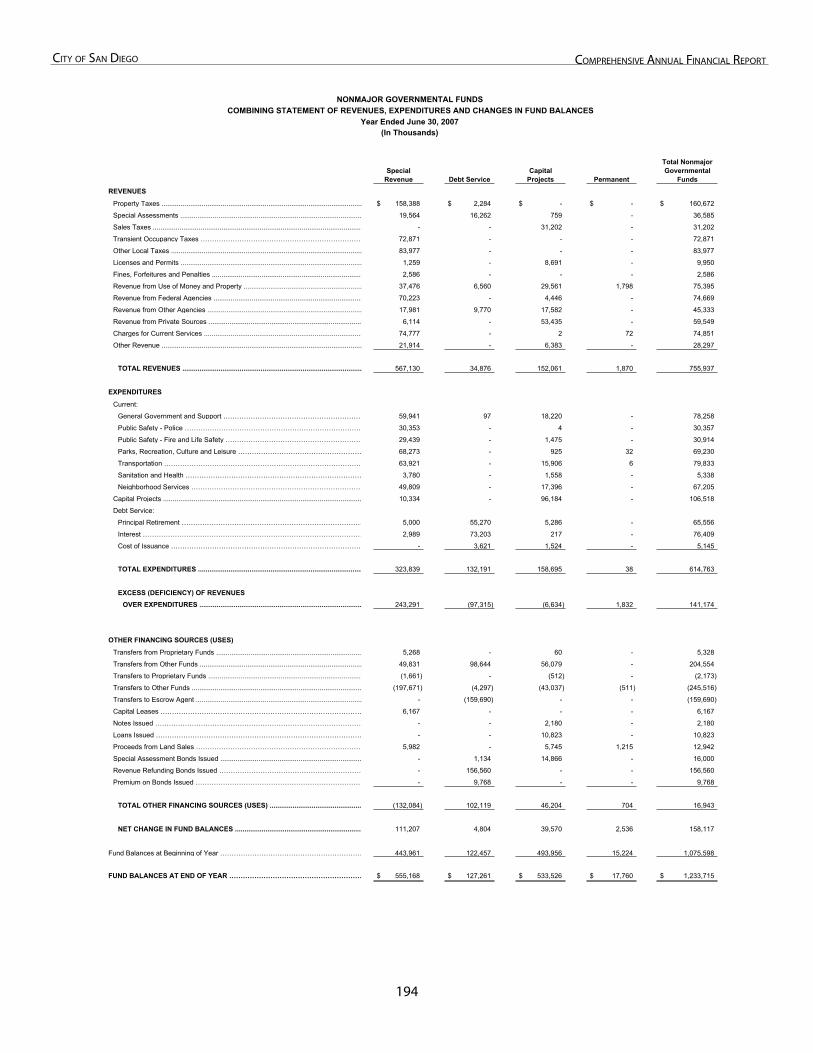
1��
City of San Diego ComprehenSive annual finanCial report
SpecialRevenue Debt Service
CapitalProjects Permanent
Total Nonmajor Governmental
FundsREVENUES
Property Taxes ......................................................................................................... 158,388$ 2,284$ -$ -$ 160,672$
Special Assessments ............................................................................................... 19,564 16,262 759 - 36,585
Sales Taxes .............................................................................................................. - - 31,202 - 31,202
Transient Occupancy Taxes ……………………………………………………………… 72,871 - - - 72,871
Other Local Taxes .................................................................................................... 83,977 - - - 83,977
Licenses and Permits ............................................................................................... 1,259 - 8,691 - 9,950
Fines, Forfeitures and Penalties ............................................................................... 2,586 - - - 2,586
Revenue from Use of Money and Property .............................................................. 37,476 6,560 29,561 1,798 75,395
Revenue from Federal Agencies .............................................................................. 70,223 - 4,446 - 74,669
Revenue from Other Agencies ................................................................................. 17,981 9,770 17,582 - 45,333
Revenue from Private Sources ................................................................................ 6,114 - 53,435 - 59,549
Charges for Current Services ................................................................................... 74,777 - 2 72 74,851
Other Revenue ......................................................................................................... 21,914 - 6,383 - 28,297
TOTAL REVENUES .............................................................................................. 567,130 34,876 152,061 1,870 755,937
EXPENDITURES
Current:
General Government and Support ……………………………………………………… 59,941 97 18,220 - 78,258
Public Safety - Police …………………………………………………………………… 30,353 - 4 - 30,357
Public Safety - Fire and Life Safety …………………………………………………… 29,439 - 1,475 - 30,914
Parks, Recreation, Culture and Leisure ……………………………………………… 68,273 - 925 32 69,230
Transportation …………………………………………………………………………… 63,921 - 15,906 6 79,833
Sanitation and Health …………………………………………………………………… 3,780 - 1,558 - 5,338
Neighborhood Services ………………………………………………………………… 49,809 - 17,396 - 67,205
Capital Projects ........................................................................................................ 10,334 - 96,184 - 106,518
Debt Service:
Principal Retirement ……………………………………………………………………… 5,000 55,270 5,286 - 65,556
Interest …………………………………………………………………………………… 2,989 73,203 217 - 76,409
Cost of Issuance ………………………………………………………………………… - 3,621 1,524 - 5,145
TOTAL EXPENDITURES ...................................................................................... 323,839 132,191 158,695 38 614,763
EXCESS (DEFICIENCY) OF REVENUES
OVER EXPENDITURES ..................................................................................... 243,291 (97,315) (6,634) 1,832 141,174
OTHER FINANCING SOURCES (USES)
Transfers from Proprietary Funds ............................................................................ 5,268 - 60 - 5,328
Transfers from Other Funds ..................................................................................... 49,831 98,644 56,079 - 204,554
Transfers to Proprietary Funds ................................................................................. (1,661) - (512) - (2,173)
Transfers to Other Funds ......................................................................................... (197,671) (4,297) (43,037) (511) (245,516)
Transfers to Escrow Agent ....................................................................................... - (159,690) - - (159,690)
Capital Leases ……………………………………………………………………………… 6,167 - - - 6,167
Notes Issued ……………………………………………………………………………… - - 2,180 - 2,180
Loans Issued ……………………………………………………………………………… - - 10,823 - 10,823
Proceeds from Land Sales ……………………………………………………………… 5,982 - 5,745 1,215 12,942
Special Assessment Bonds Issued .......................................................................... - 1,134 14,866 - 16,000
Revenue Refunding Bonds Issued ……………………………………………………… - 156,560 - - 156,560
Premium on Bonds Issued ………………………………………………………………… - 9,768 - - 9,768
TOTAL OTHER FINANCING SOURCES (USES) ................................................ (132,084) 102,119 46,204 704 16,943
NET CHANGE IN FUND BALANCES ................................................................... 111,207 4,804 39,570 2,536 158,117
Fund Balances at Beginning of Year ……………………………………………………… 443,961 122,457 493,956 15,224 1,075,598
FUND BALANCES AT END OF YEAR …………………………………………………… 555,168$ 127,261$ 533,526$ 17,760$ 1,233,715$
(In Thousands)
NONMAJOR GOVERNMENTAL FUNDSCOMBINING STATEMENT OF REVENUES, EXPENDITURES AND CHANGES IN FUND BALANCES
Year Ended June 30, 2007

non-major governmental funDS - SpeCial revenue
Special Revenue

This Page Left Intentionally Blank - Back of Divider Page
1�7
City of San Diego ComprehenSive annual finanCial report
SPECIAL REVENUE FUNDS
Special revenue funds are used to account for the proceeds of specific revenue sources (other than those for major capital projects) that are legally restricted to expenditures for specified purposes.
CITY OF SAN DIEGO
ACQUISITION, IMPROVEMENT AND OPERATIONS
This Fund accounts for various operating activities including business improvement areas, lighting and landscape maintenance areas, facilities financing, and the City's public art program. Revenues are derived from business tax surcharges, special assessments on property, various rents, concessions and fees, and interest earnings derived there from.
ENVIRONMENTAL GROWTH
This Fund was established in accordance with Section 103.1a of the City Charter to receive 25 percent of all monies derived from the revenues accruing to the City from gas, electricity, and steam franchises. One third of the franchise monies and the interest derived there from are used exclusively for the purpose of preserving and enhancing the environment of the City of SanDiego. Two thirds of the franchise monies and the interest derived there from are used as matching funds for open space acquisition and for debt service of bonds issued by the San Diego Open Space Facilities District No. 1.
POLICE DECENTRALIZATION
This Fund accounts for monies allocated for Police department decentralization expenditures for temporary facilities and to devise future capital improvement projects. Revenues are derived from sales tax allocations.
PUBLIC TRANSPORTATION
This Fund was established to account for funds set aside as reserves to be used for transportation-related purposes. Fund transfers and interest derived there from are the main sources of revenue.
QUALCOMM STADIUM OPERATIONS
This Fund accounts for the operations of the Stadium. The Stadium hosts various sporting events for its football tenants. Revenues are derived from rents, concessions, parking, and advertising.
SPECIAL GAS TAX STREET IMPROVEMENT
This Fund was established to account for the receipt of motor vehicle fuel taxes from the State under Sections 2106 and 2107 ofthe Streets and Highways Code. Expenditures are for the construction, improvement, maintenance, and operation of public streets and highways.
STREET DIVISION OPERATIONS
This Fund was established to account for the operations of Transportation’s Street division. Revenues are derived from sales taxallocations and transfers from Gas Tax and TransNet, as well as services performed by the Streets Division. Expenditures are for maintenance and operation of City streets.
TRANSIENT OCCUPANCY TAX
This Fund was established to receive and expend transient occupancy taxes. Since 1964, a tax has been imposed on transients of hotel and motel rooms in the City of San Diego. Effective August 1994, the tax was increased from 9% to 10.5%.
1�8
City of San Diego ComprehenSive annual finanCial report
UNDERGROUND SURCHARGE
This fund was established to account primarily for the capital improvement activities related to the undergrounding of utilities.This fund receives and disburses undergrounding surcharge revenue in accordance with the City’s franchise agreements with San Diego Gas & Electric.
ZOOLOGICAL EXHIBITS
This Fund was established to collect monies from a fixed property tax levy authorized by Section 77a of the City Charter for themaintenance of zoological exhibits. These funds are remitted in accordance with a contractual agreement with the San Diego Zoological Society, a not-for-profit corporation independent from the City of San Diego.
OTHER SPECIAL REVENUE - BUDGETED
This Fund was established to account for revenues derived specifically for a variety of budgeted special programs administered by departments such as Police, Development Services, and General Services. Revenues in this Fund are derived from service charges, revenues from other agencies, and fines.
GRANTS
This Fund was established to account for revenue received from federal, state and other governmental agencies. Expenditures are made and accounted for as prescribed by appropriate grant provisions/agreements.
OTHER SPECIAL REVENUE FUND - UNBUDGETED
This Fund was established to account for revenues earmarked for a variety of special programs administered by such departments as Engineering and Capital Projects, Libraries, Park and Recreation, and Police. Revenues in this fund are derivedfrom such sources as parking fees, service charges, contributions from other agencies and private sources, and interest earnings.
BLENDED COMPONENT UNITS
CENTRE CITY DEVELOPMENT CORPORATION
This Fund was established to account for the revenues and expenditures of the Centre City Development Corporation (CCDC). CCDC is a non-profit corporation that administers certain redevelopment projects in downtown San Diego and provides redevelopment advisory services to RDA. CCDC is primarily funded by RDA and the City of San Diego.
PUBLIC FACILITIES FINANCING AUTHORITY
This Fund was established to account for the activities of the Public Facilities Financing Authority (PFFA). PFFA, which was created by the City and RDA, facilitates the financing, acquisition, and construction of public capital facility improvements of RDA and the City. PFFA’s special revenue account is generally used to account for revenues from the Reassessment District Bond Fund and investment income used to pay for costs of issuance and administrative expenses related to debt redemption.
REDEVELOPMENT AGENCY
This Fund was established to account for the activities of the Redevelopment Agency of the City of San Diego (RDA). RDA was established to provide a method for revitalizing deteriorated and blighted areas of the City of San Diego. The special revenueaccount is used to account for funds restricted for the benefit of low and moderate income housing. Funding is primarily from property tax increment revenues and the City of San Diego.
1��
City of San Diego ComprehenSive annual finanCial report
SAN DIEGO INDUSTRIAL DEVELOPMENT AUTHORITY
This Fund was established to account for revenues and expenditures of the San Diego Industrial Development Authority (SDIDA). SDIDA was formed in 1983 pursuant to the California Industrial Development Financing Act for the purpose of providing an alternative method of financing to participating parties for economic development purposes, through the sale and issuance of revenue bonds. Revenues are derived from fees collected from companies applying for industrial development bond financing. Expenditures are incurred for management and administrative services provided by the City of San Diego.
SOUTHEASTERN ECONOMIC DEVELOPMENT CORPORATION
This Fund was established to account for the revenues and expenditures of the Southeastern Economic Development Corporation (SEDC). SEDC is a non-profit corporation that administers economic development projects within the community of Southeast San Diego and provides redevelopment advisory services to RDA. SEDC is primarily funded by RDA and by the City of San Diego pursuant to operating agreements under which SEDC is reimbursed for eligible costs incurred in connection with such activities.
TOBACCO SETTLEMENT REVENUE FUNDING CORPORATION
This fund was established to account for the activities of the Tobacco Settlement Revenue Funding Corporation (TSRFC). The TSRFC was established for the purpose of acquiring the Tobacco Settlement Revenues allocated to the City from the State of California, pursuant to the Master Settlement Agreement. The TSRFC’s special revenue fund is used to account for the expenditures incurred for administrative services provided by the City of San Diego.
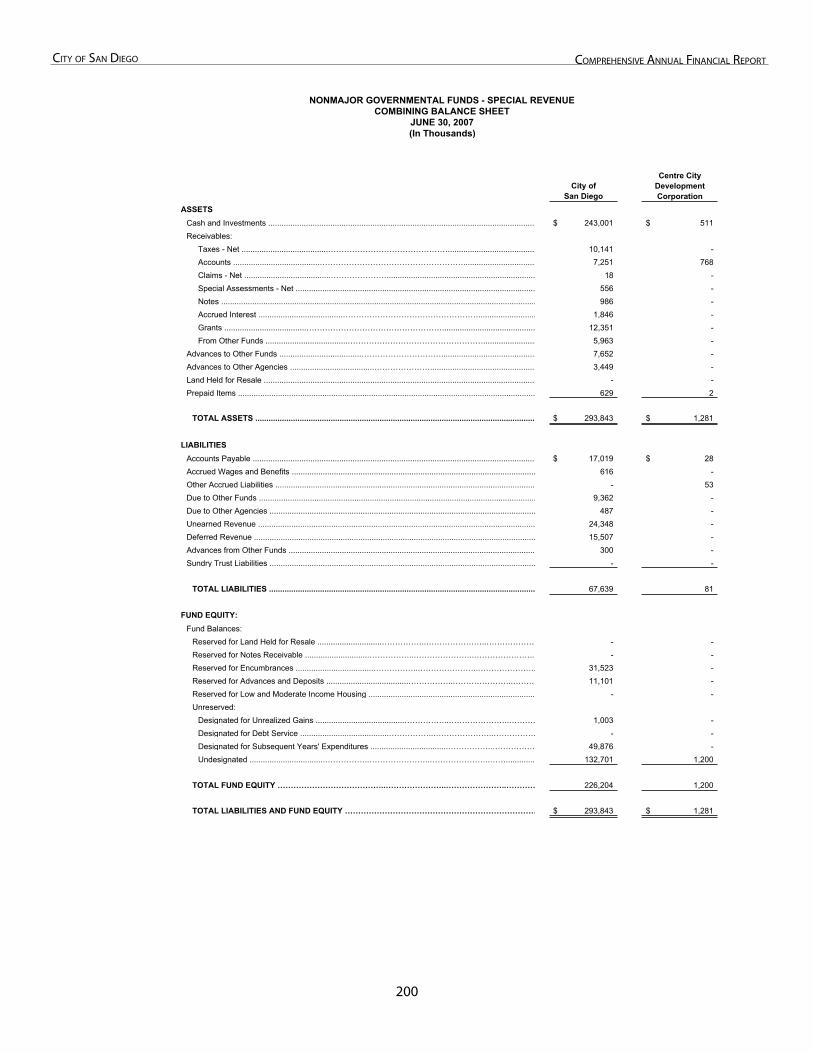
200
City of San Diego ComprehenSive annual finanCial report
NONMAJOR GOVERNMENTAL FUNDS - SPECIAL REVENUECOMBINING BALANCE SHEET
JUNE 30, 2007(In Thousands)
City ofSan Diego
ASSETSCash and Investments ......................................................................................................................... 243,001$ 511$ Receivables:
Taxes - Net .......................................………………………………………........................................ 10,141 - Accounts .......................................………………………………………………................................. 7,251 768 Claims - Net .......................................…………………................................................................... 18 - Special Assessments - Net ............................................................................................................ 556 - Notes .............................................................................................................................................. 986 - Accrued Interest ......................................…………………………………………….......................... 1,846 - Grants .....................................…………………………………………….......................................... 12,351 - From Other Funds .....................................……………………………………………........................ 5,963 -
Advances to Other Funds .....................................…………………………........................................... 7,652 - Advances to Other Agencies ......................................…………………................................................ 3,449 - Land Held for Resale ........................................................................................................................... - - Prepaid Items ...................................................................................................................................... 629 2
TOTAL ASSETS .............................................................................................................................. 293,843$ 1,281$
LIABILITIESAccounts Payable ................................................................................................................................ 17,019$ 28$ Accrued Wages and Benefits .............................................................................................................. 616 - Other Accrued Liabilities ..................................................................................................................... - 53 Due to Other Funds ............................................................................................................................. 9,362 - Due to Other Agencies ........................................................................................................................ 487 - Unearned Revenue ............................................................................................................................. 24,348 - Deferred Revenue ............................................................................................................................... 15,507 - Advances from Other Funds ............................................................................................................... 300 - Sundry Trust Liabilities ........................................................................................................................ - -
TOTAL LIABILITIES ........................................................................................................................ 67,639 81
FUND EQUITY:Fund Balances:
Reserved for Land Held for Resale .............................……………..…………………..………………… - - Reserved for Notes Receivable .............................……………..…………………..…………………..… - - Reserved for Encumbrances ...................................……………..…………………..…………………. 31,523 - Reserved for Advances and Deposits .....................................……………..…………………..……… 11,101 - Reserved for Low and Moderate Income Housing ........................................................................... - - Unreserved:
Designated for Unrealized Gains ........................................……………..…………………..………… 1,003 - Designated for Debt Service ........................................……………..…………………..……………… - - Designated for Subsequent Years' Expenditures ...................................……………..……………… 49,876 - Undesignated ..................................……………..…………………..…………………..……............. 132,701 1,200
TOTAL FUND EQUITY …………………………………..…………………..…………………..………… 226,204 1,200
TOTAL LIABILITIES AND FUND EQUITY ……………………………………………………………… 293,843$ 1,281$
Centre City DevelopmentCorporation
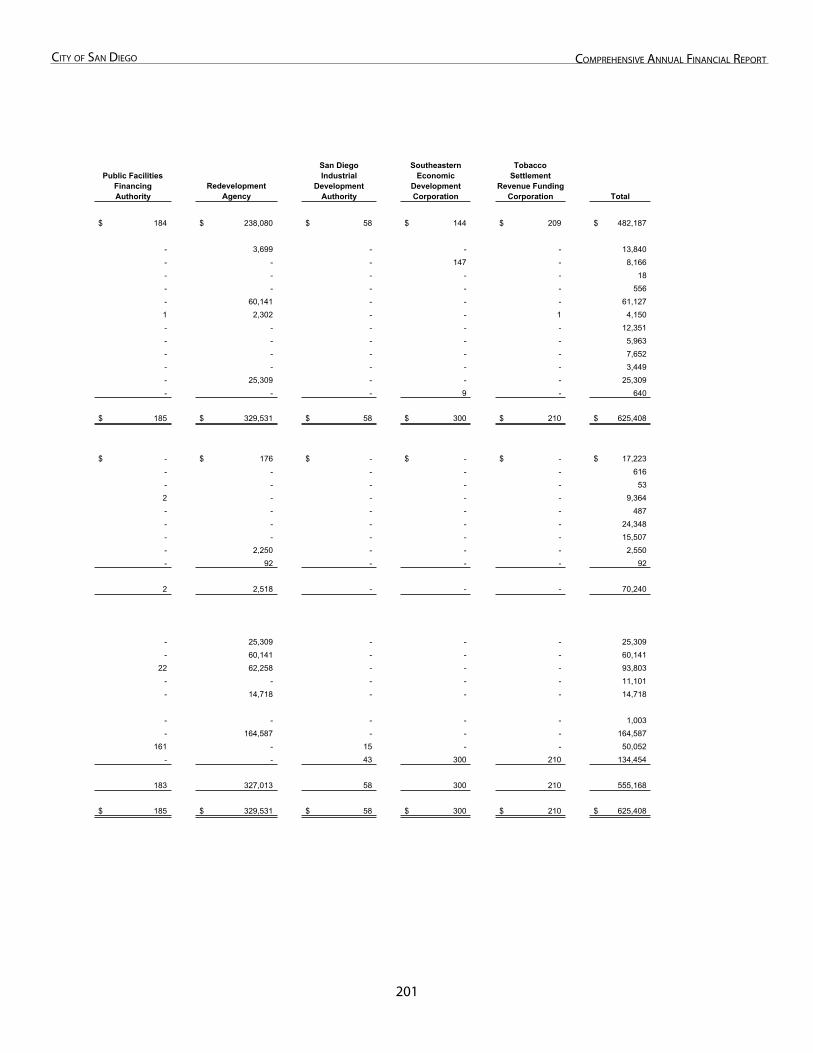
201
City of San Diego ComprehenSive annual finanCial report
RedevelopmentAgency Total
184$ 238,080$ 58$ 144$ 209$ 482,187$
- 3,699 - - - 13,840 - - - 147 - 8,166 - - - - - 18 - - - - - 556 - 60,141 - - - 61,127 1 2,302 - - 1 4,150 - - - - - 12,351 - - - - - 5,963 - - - - - 7,652 - - - - - 3,449 - 25,309 - - - 25,309 - - - 9 - 640
185$ 329,531$ 58$ 300$ 210$ 625,408$
-$ 176$ -$ -$ -$ 17,223$ - - - - - 616 - - - - - 53 2 - - - - 9,364 - - - - - 487 - - - - - 24,348 - - - - - 15,507 - 2,250 - - - 2,550 - 92 - - - 92
2 2,518 - - - 70,240
- 25,309 - - - 25,309 - 60,141 - - - 60,141
22 62,258 - - - 93,803 - - - - - 11,101 - 14,718 - - - 14,718
- - - - - 1,003 - 164,587 - - - 164,587
161 - 15 - - 50,052 - - 43 300 210 134,454
183 327,013 58 300 210 555,168
185$ 329,531$ 58$ 300$ 210$ 625,408$
TobaccoSettlement
Revenue Funding Corporation
SoutheasternEconomic
DevelopmentCorporation
San Diego Industrial
DevelopmentAuthority
Public Facilities FinancingAuthority
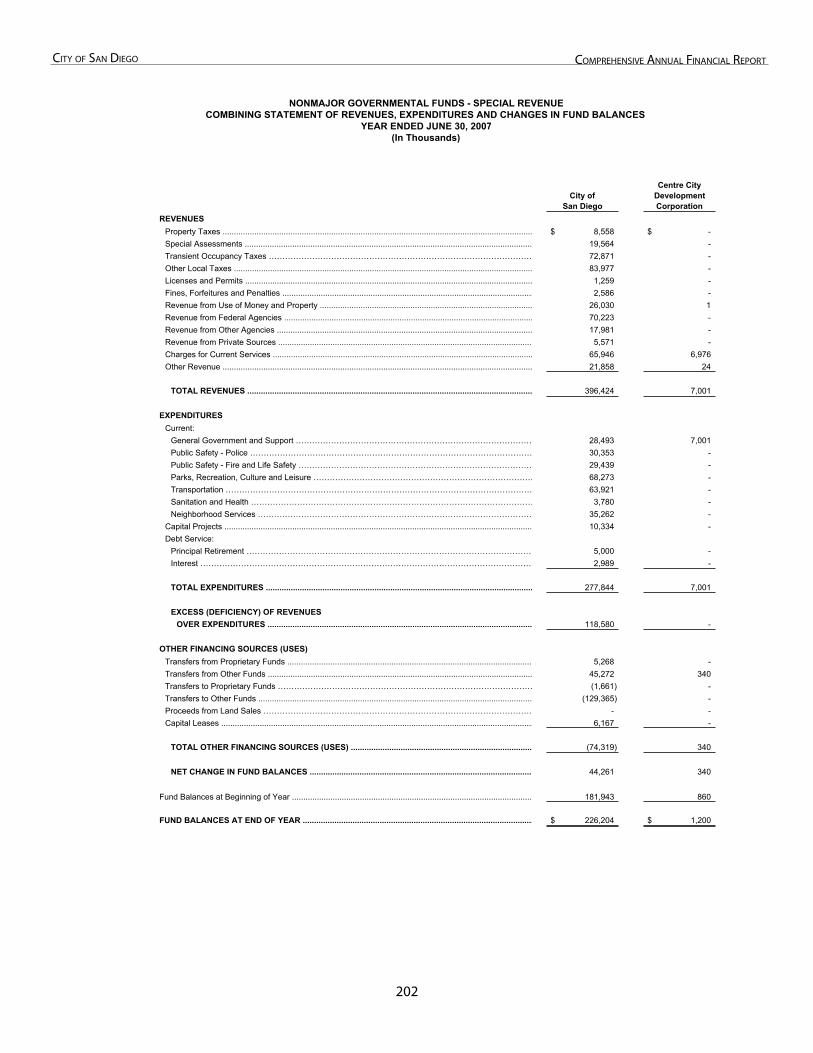
202
City of San Diego ComprehenSive annual finanCial report
NONMAJOR GOVERNMENTAL FUNDS - SPECIAL REVENUECOMBINING STATEMENT OF REVENUES, EXPENDITURES AND CHANGES IN FUND BALANCES
YEAR ENDED JUNE 30, 2007(In Thousands)
City ofSan Diego
Centre City DevelopmentCorporation
REVENUESProperty Taxes ......................................................................................................................................... 8,558$ -$ Special Assessments ............................................................................................................................... 19,564 - Transient Occupancy Taxes ……………………………………………………………………………………… 72,871 - Other Local Taxes .................................................................................................................................... 83,977 - Licenses and Permits ............................................................................................................................... 1,259 - Fines, Forfeitures and Penalties ............................................................................................................... 2,586 - Revenue from Use of Money and Property .............................................................................................. 26,030 1 Revenue from Federal Agencies .............................................................................................................. 70,223 - Revenue from Other Agencies ................................................................................................................. 17,981 - Revenue from Private Sources ................................................................................................................ 5,571 - Charges for Current Services ................................................................................................................... 65,946 6,976 Other Revenue ......................................................................................................................................... 21,858 24
TOTAL REVENUES .............................................................................................................................. 396,424 7,001
EXPENDITURESCurrent:
General Government and Support …………………………………………………………………………… 28,493 7,001 Public Safety - Police …………………………………………………………………………………………… 30,353 - Public Safety - Fire and Life Safety …………………………………………………………………………… 29,439 - Parks, Recreation, Culture and Leisure ……………………………………………………………………… 68,273 - Transportation …………………………………………………………………………………………………… 63,921 - Sanitation and Health …………………………………………………………………………………………… 3,780 - Neighborhood Services ………………………………………………………………………………………… 35,262 -
Capital Projects ........................................................................................................................................ 10,334 - Debt Service:
Principal Retirement …………………………………………………………………………………………… 5,000 - Interest …………………………………………………………………………………………………………… 2,989 -
TOTAL EXPENDITURES ...................................................................................................................... 277,844 7,001
EXCESS (DEFICIENCY) OF REVENUES OVER EXPENDITURES ..................................................................................................................... 118,580 -
OTHER FINANCING SOURCES (USES)Transfers from Proprietary Funds ............................................................................................................ 5,268 - Transfers from Other Funds ..................................................................................................................... 45,272 340 Transfers to Proprietary Funds …………………………………………………………………………………… (1,661) - Transfers to Other Funds ......................................................................................................................... (129,365) - Proceeds from Land Sales ……………………………………………………………………………………… - - Capital Leases .......................................................................................................................................... 6,167 -
TOTAL OTHER FINANCING SOURCES (USES) ................................................................................ (74,319) 340
NET CHANGE IN FUND BALANCES .................................................................................................. 44,261 340
Fund Balances at Beginning of Year .......................................................................................................... 181,943 860
FUND BALANCES AT END OF YEAR ...................................................................................................... 226,204$ 1,200$
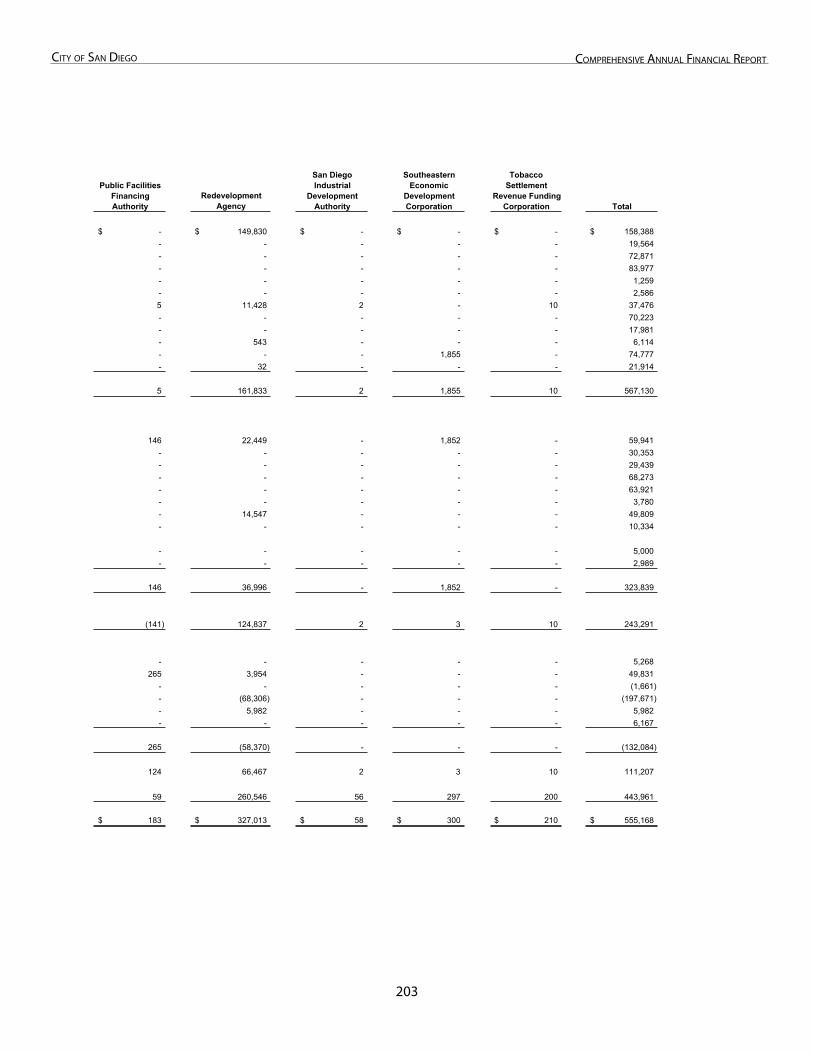
203
City of San Diego ComprehenSive annual finanCial report
RedevelopmentAgency Total
-$ 149,830$ -$ -$ -$ 158,388$ - - - - - 19,564 - - - - - 72,871 - - - - - 83,977 - - - - - 1,259 - - - - - 2,586 5 11,428 2 - 10 37,476 - - - - - 70,223 - - - - - 17,981 - 543 - - - 6,114 - - - 1,855 - 74,777 - 32 - - - 21,914
5 161,833 2 1,855 10 567,130
146 22,449 - 1,852 - 59,941 - - - - - 30,353 - - - - - 29,439 - - - - - 68,273 - - - - - 63,921 - - - - - 3,780 - 14,547 - - - 49,809 - - - - - 10,334
- - - - - 5,000 - - - - - 2,989
146 36,996 - 1,852 - 323,839
(141) 124,837 2 3 10 243,291
- - - - - 5,268 265 3,954 - - - 49,831
- - - - - (1,661) - (68,306) - - - (197,671) - 5,982 - - - 5,982 - - - - - 6,167
265 (58,370) - - - (132,084)
124 66,467 2 3 10 111,207
59 260,546 56 297 200 443,961
183$ 327,013$ 58$ 300$ 210$ 555,168$
San Diego Industrial
DevelopmentAuthority
SoutheasternEconomic
DevelopmentCorporation
Public Facilities FinancingAuthority
TobaccoSettlement
Revenue Funding Corporation
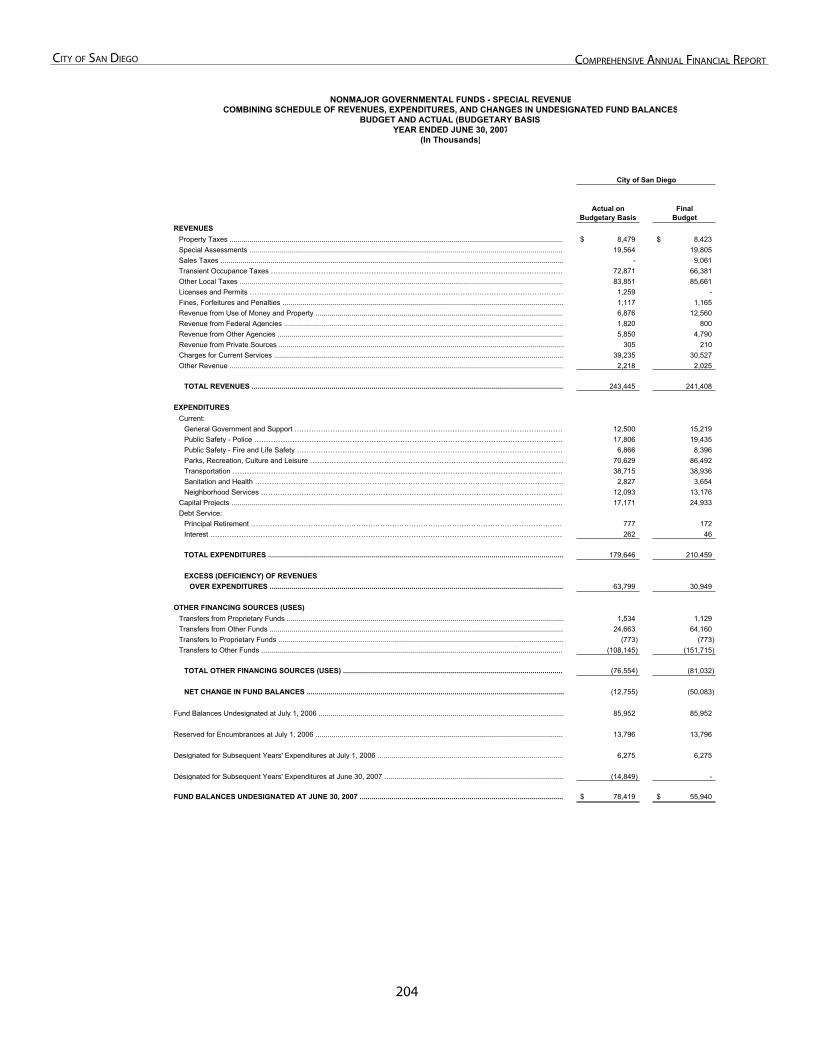
20�
City of San Diego ComprehenSive annual finanCial report
.
…
…
…
……
….
……
.
.
NONMAJOR GOVERNMENTAL FUNDS - SPECIAL REVENUECOMBINING SCHEDULE OF REVENUES, EXPENDITURES, AND CHANGES IN UNDESIGNATED FUND BALANCES
BUDGET AND ACTUAL (BUDGETARY BASIS)YEAR ENDED JUNE 30, 2007
(In Thousands)
City of San Diego
Actual on Budgetary Basis
FinalBudget
REVENUESProperty Taxes ........................................................................................................................................................................ 8,479$ 8,423$ Special Assessments ............................................................................................................................................................. 19,564 19,805 Sales Taxes ............................................................................................................................................................................ - 9,061 Transient Occupance Taxes ………………………………………………………………………………………………………… 72,871 66,381 Other Local Taxes ................................................................................................................................................................... 83,851 85,661 Licenses and Permits ………………………………………………………………………………………………………………… 1,259 - Fines, Forfeitures and Penalties ............................................................................................................................................. 1,117 1,165 Revenue from Use of Money and Property ............................................................................................................................. 6,876 12,560 Revenue from Federal Agencies ............................................................................................................................................ 1,820 800 Revenue from Other Agencies ................................................................................................................................................ 5,850 4,790 Revenue from Private Sources ............................................................................................................................................... 305 210 Charges for Current Services ................................................................................................................................................. 39,235 30,527 Other Revenue ........................................................................................................................................................................ 2,218 2,025
TOTAL REVENUES ............................................................................................................................................................. 243,445 241,408
EXPENDITURESCurrent:
General Government and Support ………………………………………………………………………………………………… 12,500 15,219 Public Safety - Police …………………………………………………………………………………………………………………… 17,806 19,435 Public Safety - Fire and Life Safety ………………………………………………………………………………………………… 6,866 8,396 Parks, Recreation, Culture and Leisure …………………………………………………………………………………………… 70,629 86,492 Transportation …………………………………………………………………………………………………………………………… 38,715 38,936 Sanitation and Health ………………………………………………………………………………………………………………… 2,827 3,654 Neighborhood Services ……………………………………………………………………………………………………………… 12,093 13,176
Capital Projects ...................................................................................................................................................................... 17,171 24,933 Debt Service:
Principal Retirement ………………………………………………………………………………………………………………… 777 172 Interest ………………………………………………………………………………………………………………………………… 262 46
TOTAL EXPENDITURES .................................................................................................................................................... 179,646 210,459
EXCESS (DEFICIENCY) OF REVENUES OVER EXPENDITURES .................................................................................................................................................... 63,799 30,949
OTHER FINANCING SOURCES (USES)Transfers from Proprietary Funds ........................................................................................................................................... 1,534 1,129 Transfers from Other Funds .................................................................................................................................................... 24,663 64,160 Transfers to Proprietary Funds ............................................................................................................................................... (773) (773) Transfers to Other Funds ....................................................................................................................................................... (108,145) (151,715)
TOTAL OTHER FINANCING SOURCES (USES) .............................................................................................................. (76,554) (81,032)
NET CHANGE IN FUND BALANCES ................................................................................................................................. (12,755) (50,083)
Fund Balances Undesignated at July 1, 2006 ........................................................................................................................... 85,952 85,952
Reserved for Encumbrances at July 1, 2006 ............................................................................................................................. 13,796 13,796
Designated for Subsequent Years' Expenditures at July 1, 2006 .............................................................................................. 6,275 6,275
Designated for Subsequent Years' Expenditures at June 30, 2007 .......................................................................................... (14,849) -
FUND BALANCES UNDESIGNATED AT JUNE 30, 2007 ....................................................................................................... 78,419$ 55,940$
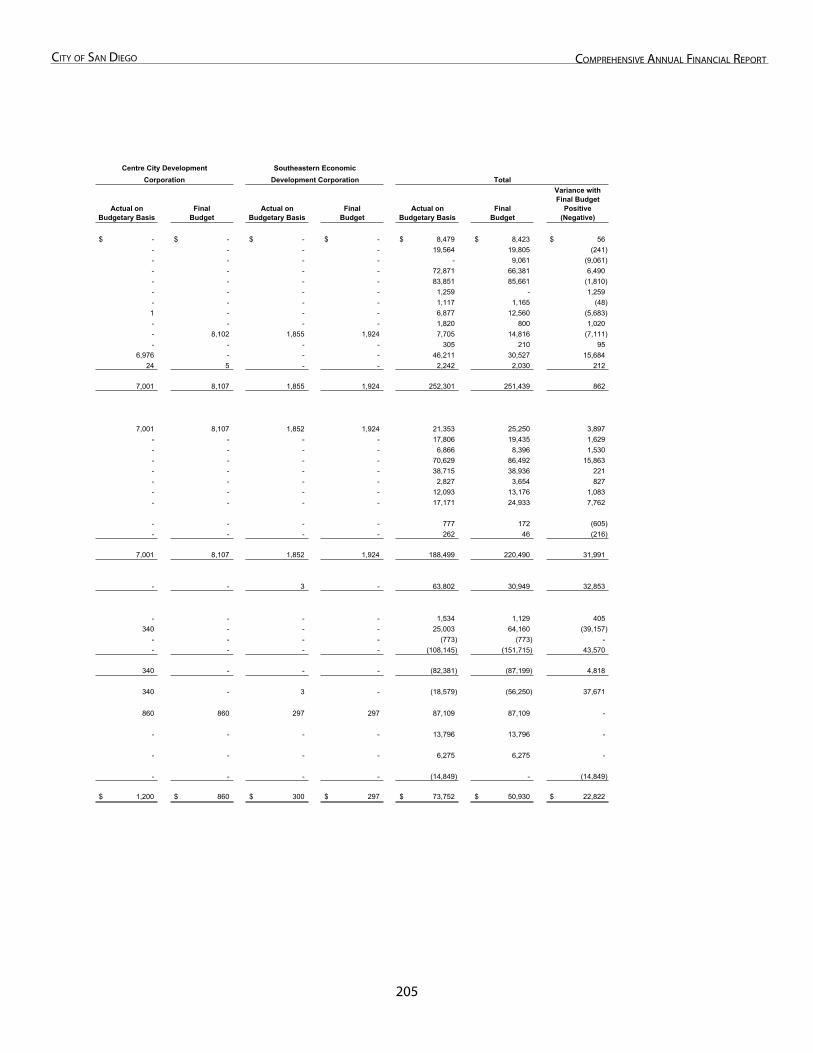
20�
City of San Diego ComprehenSive annual finanCial report
Centre City Development Southeastern EconomicCorporation Development Corporation Total
Actual on Budgetary Basis
FinalBudget
Actual on Budgetary Basis
FinalBudget
Actual on Budgetary Basis
FinalBudget
Variance with Final Budget
Positive(Negative)
-$ -$ -$ -$ 8,479$ 8,423$ 56$ - - - - 19,564 19,805 (241) - - - - - 9,061 (9,061) - - - - 72,871 66,381 6,490 - - - - 83,851 85,661 (1,810) - - - - 1,259 - 1,259 - - - - 1,117 1,165 (48) 1 - - - 6,877 12,560 (5,683) - - - - 1,820 800 1,020 - 8,102 1,855 1,924 7,705 14,816 (7,111) - - - - 305 210 95
6,976 - - - 46,211 30,527 15,684 24 5 - - 2,242 2,030 212
7,001 8,107 1,855 1,924 252,301 251,439 862
7,001 8,107 1,852 1,924 21,353 25,250 3,897 - - - - 17,806 19,435 1,629 - - - - 6,866 8,396 1,530 - - - - 70,629 86,492 15,863 - - - - 38,715 38,936 221 - - - - 2,827 3,654 827 - - - - 12,093 13,176 1,083 - - - - 17,171 24,933 7,762
- - - - 777 172 (605) - - - - 262 46 (216)
7,001 8,107 1,852 1,924 188,499 220,490 31,991
- - 3 - 63,802 30,949 32,853
- - - - 1,534 1,129 405 340 - - - 25,003 64,160 (39,157)
- - - - (773) (773) - - - - - (108,145) (151,715) 43,570
340 - - - (82,381) (87,199) 4,818
340 - 3 - (18,579) (56,250) 37,671
860 860 297 297 87,109 87,109 -
- - - - 13,796 13,796 -
- - - - 6,275 6,275 -
- - - - (14,849) - (14,849)
1,200$ 860$ 300$ 297$ 73,752$ 50,930$ 22,822$
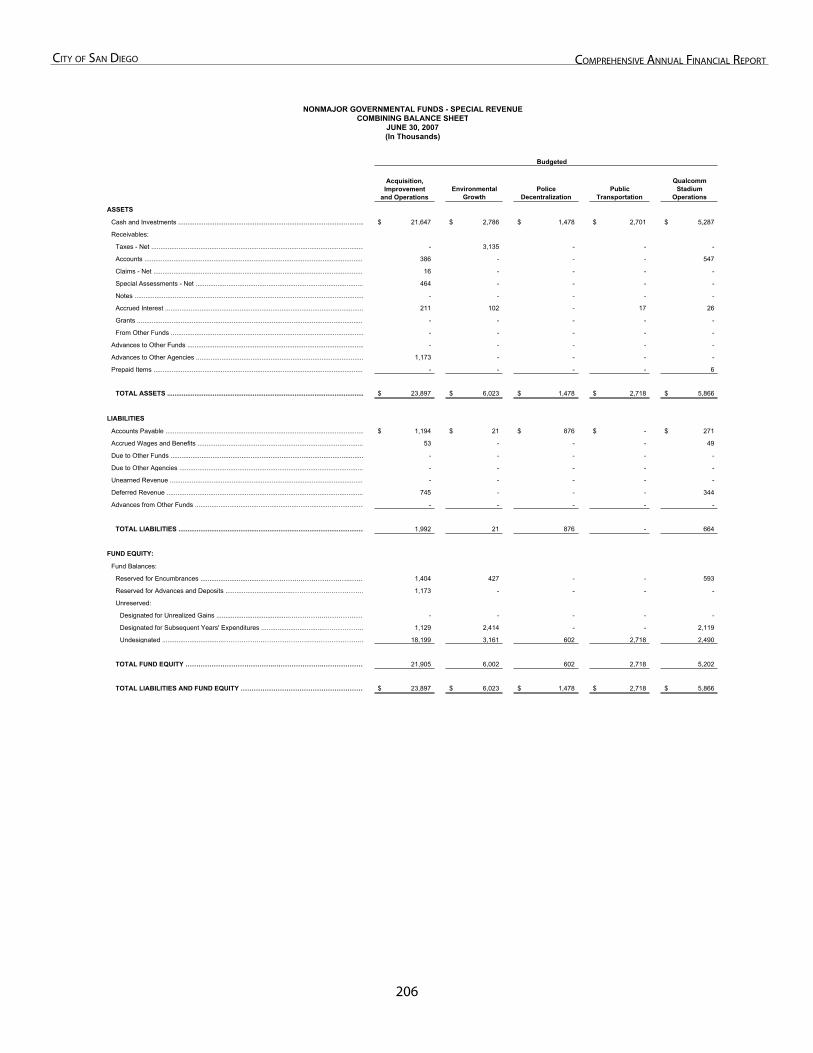
20�
City of San Diego ComprehenSive annual finanCial report
EnvironmentalGrowth
PoliceDecentralization
PublicTransportation
QualcommStadium
Operations
ASSETS
Cash and Investments ...................................................................................................... 21,647$ 2,786$ 1,478$ 2,701$ 5,287$
Receivables:
Taxes - Net ..................................................................................................................... - 3,135 - - -
Accounts ........................................................................................................................ 386 - - - 547
Claims - Net ................................................................................................................... 16 - - - -
Special Assessments - Net ............................................................................................ 464 - - - -
Notes .............................................................................................................................. - - - - -
Accrued Interest ............................................................................................................. 211 102 - 17 26
Grants ............................................................................................................................ - - - - -
From Other Funds .......................................................................................................... - - - - -
Advances to Other Funds ................................................................................................. - - - - -
Advances to Other Agencies ............................................................................................ 1,173 - - - -
Prepaid Items ................................................................................................................... - - - - 6
TOTAL ASSETS ............................................................................................................ 23,897$ 6,023$ 1,478$ 2,718$ 5,866$
LIABILITIES
Accounts Payable ............................................................................................................. 1,194$ 21$ 876$ -$ 271$
Accrued Wages and Benefits ........................................................................................... 53 - - - 49
Due to Other Funds .......................................................................................................... - - - - -
Due to Other Agencies ..................................................................................................... - - - - -
Unearned Revenue .......................................................................................................... - - - - -
Deferred Revenue ............................................................................................................ 745 - - - 344
Advances from Other Funds ............................................................................................. - - - - -
TOTAL LIABILITIES ...................................................................................................... 1,992 21 876 - 664
FUND EQUITY:
Fund Balances:
Reserved for Encumbrances ...................................……………..…………………..…… 1,404 427 - - 593
Reserved for Advances and Deposits .....................................……………..……………… 1,173 - - - -
Unreserved:
Designated for Unrealized Gains ........................................……………..……………… - - - - -
Designated for Subsequent Years' Expenditures ...................................……………..… 1,129 2,414 - - 2,119
Undesignated ..................................……………..…………………..…………………..… 18,199 3,161 602 2,718 2,490
TOTAL FUND EQUITY …………………………………..…………………..……………… 21,905 6,002 602 2,718 5,202
TOTAL LIABILITIES AND FUND EQUITY ………………………………………………… 23,897$ 6,023$ 1,478$ 2,718$ 5,866$
Acquisition,Improvement
and Operations
Budgeted
(In Thousands)
COMBINING BALANCE SHEETNONMAJOR GOVERNMENTAL FUNDS - SPECIAL REVENUE
JUNE 30, 2007
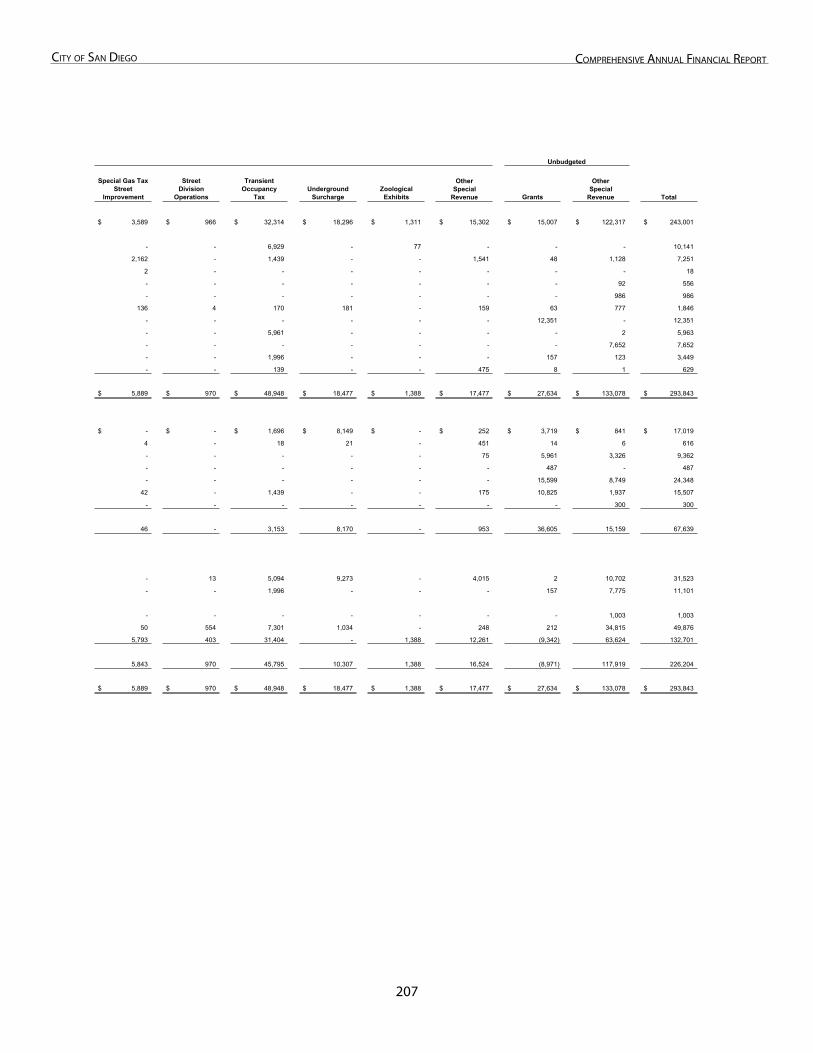
207
City of San Diego ComprehenSive annual finanCial report
Special Gas Tax Street
Improvement
StreetDivision
Operations
TransientOccupancy
TaxUnderground
SurchargeZoological
Exhibits Grants Total
3,589$ 966$ 32,314$ 18,296$ 1,311$ 15,302$ 15,007$ 122,317$ 243,001$
- - 6,929 - 77 - - - 10,141
2,162 - 1,439 - - 1,541 48 1,128 7,251
2 - - - - - - - 18
- - - - - - - 92 556
- - - - - - - 986 986
136 4 170 181 - 159 63 777 1,846
- - - - - - 12,351 - 12,351
- - 5,961 - - - - 2 5,963
- - - - - - - 7,652 7,652
- - 1,996 - - - 157 123 3,449
- - 139 - - 475 8 1 629
5,889$ 970$ 48,948$ 18,477$ 1,388$ 17,477$ 27,634$ 133,078$ 293,843$
-$ -$ 1,696$ 8,149$ -$ 252$ 3,719$ 841$ 17,019$
4 - 18 21 - 451 14 6 616
- - - - - 75 5,961 3,326 9,362
- - - - - - 487 - 487
- - - - - - 15,599 8,749 24,348
42 - 1,439 - - 175 10,825 1,937 15,507
- - - - - - - 300 300
46 - 3,153 8,170 - 953 36,605 15,159 67,639
- 13 5,094 9,273 - 4,015 2 10,702 31,523
- - 1,996 - - - 157 7,775 11,101
- - - - - - - 1,003 1,003
50 554 7,301 1,034 - 248 212 34,815 49,876
5,793 403 31,404 - 1,388 12,261 (9,342) 63,624 132,701
5,843 970 45,795 10,307 1,388 16,524 (8,971) 117,919 226,204
5,889$ 970$ 48,948$ 18,477$ 1,388$ 17,477$ 27,634$ 133,078$ 293,843$
Unbudgeted
OtherSpecial
Revenue
OtherSpecial
Revenue
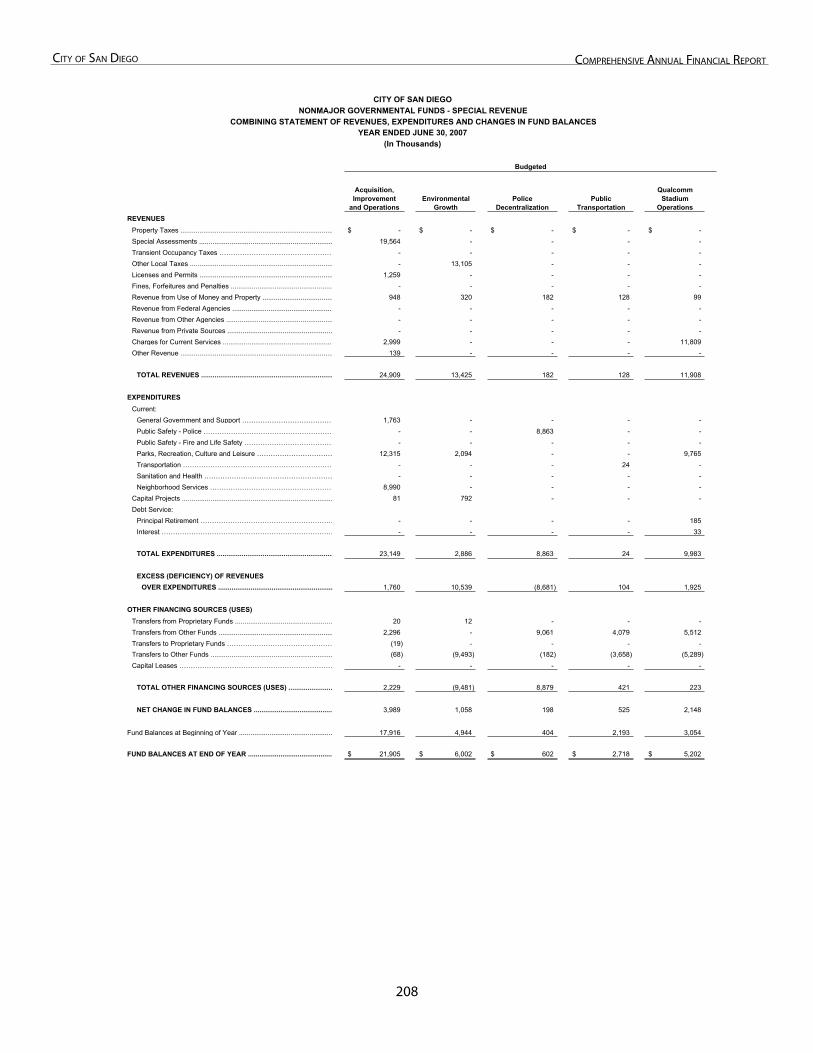
208
City of San Diego ComprehenSive annual finanCial report
EnvironmentalGrowth
PoliceDecentralization
PublicTransportation
QualcommStadium
OperationsREVENUES
Property Taxes ................................................................................ -$ -$ -$ -$ -$ Special Assessments ...................................................................... 19,564 - - - - Transient Occupancy Taxes …………………………………………… - - - - - Other Local Taxes ........................................................................... - 13,105 - - - Licenses and Permits ...................................................................... 1,259 - - - - Fines, Forfeitures and Penalties ..................................................... - - - - - Revenue from Use of Money and Property ..................................... 948 320 182 128 99 Revenue from Federal Agencies ..................................................... - - - - - Revenue from Other Agencies ........................................................ - - - - - Revenue from Private Sources ....................................................... - - - - - Charges for Current Services .......................................................... 2,999 - - - 11,809 Other Revenue ................................................................................ 139 - - - -
TOTAL REVENUES ..................................................................... 24,909 13,425 182 128 11,908
EXPENDITURESCurrent:
General Government and Support …………………………………… 1,763 - - - - Public Safety - Police ………………………………………………… - - 8,863 - - Public Safety - Fire and Life Safety ………………………………… - - - - - Parks, Recreation, Culture and Leisure …………………………… 12,315 2,094 - - 9,765 Transportation ………………………………………………………… - - - 24 - Sanitation and Health ………………………………………………… - - - - - Neighborhood Services ……………………………………………… 8,990 - - - -
Capital Projects ............................................................................... 81 792 - - - Debt Service:
Principal Retirement …………………………………………………… - - - - 185 Interest ………………………………………………………………… - - - - 33
TOTAL EXPENDITURES ............................................................. 23,149 2,886 8,863 24 9,983
EXCESS (DEFICIENCY) OF REVENUES
OVER EXPENDITURES ............................................................ 1,760 10,539 (8,681) 104 1,925
OTHER FINANCING SOURCES (USES)Transfers from Proprietary Funds ................................................... 20 12 - - - Transfers from Other Funds ............................................................ 2,296 - 9,061 4,079 5,512 Transfers to Proprietary Funds ………………………………………… (19) - - - - Transfers to Other Funds ................................................................ (68) (9,493) (182) (3,658) (5,289) Capital Leases …………………………………………………………… - - - - -
TOTAL OTHER FINANCING SOURCES (USES) ....................... 2,229 (9,481) 8,879 421 223
NET CHANGE IN FUND BALANCES ......................................... 3,989 1,058 198 525 2,148
Fund Balances at Beginning of Year ................................................. 17,916 4,944 404 2,193 3,054
FUND BALANCES AT END OF YEAR ............................................ 21,905$ 6,002$ 602$ 2,718$ 5,202$
CITY OF SAN DIEGO
COMBINING STATEMENT OF REVENUES, EXPENDITURES AND CHANGES IN FUND BALANCESYEAR ENDED JUNE 30, 2007
(In Thousands)
NONMAJOR GOVERNMENTAL FUNDS - SPECIAL REVENUE
Acquisition,Improvement
and Operations
Budgeted
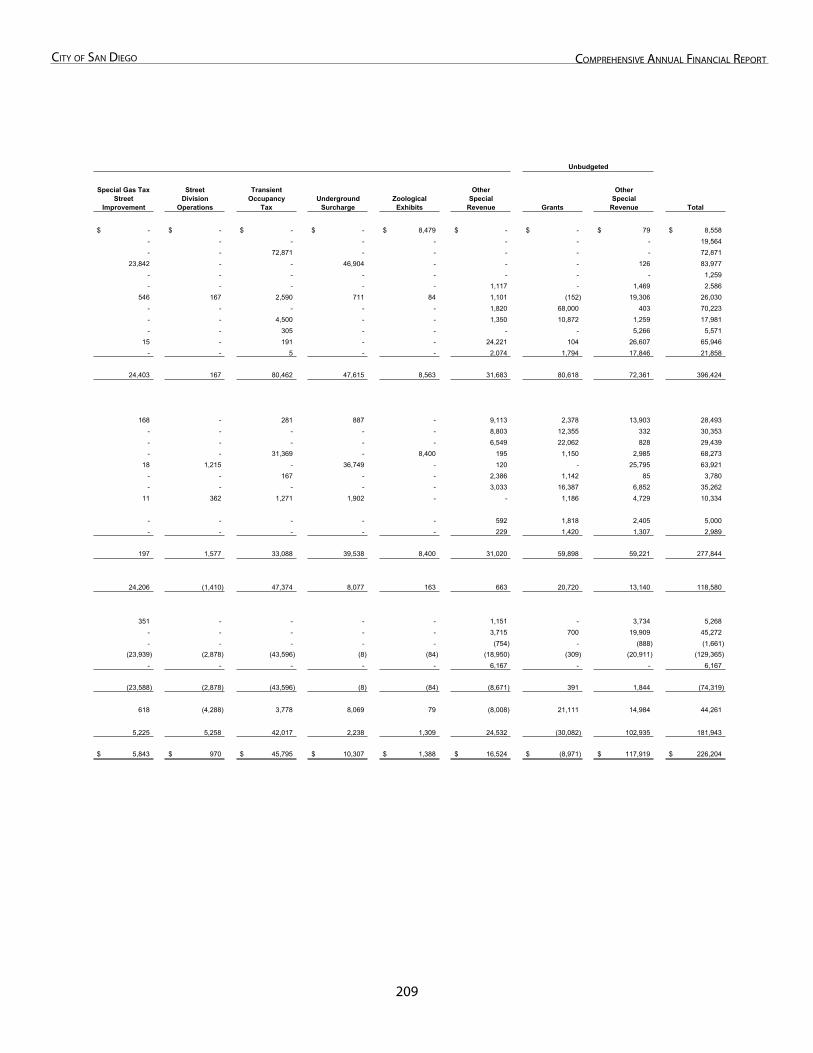
20�
City of San Diego ComprehenSive annual finanCial report
Special Gas Tax Street
Improvement
StreetDivision
Operations
TransientOccupancy
TaxUnderground
SurchargeZoological
Exhibits Grants Total
-$ -$ -$ -$ 8,479$ -$ -$ 79$ 8,558$ - - - - - - - - 19,564 - - 72,871 - - - - - 72,871
23,842 - - 46,904 - - - 126 83,977 - - - - - - - - 1,259 - - - - - 1,117 - 1,469 2,586
546 167 2,590 711 84 1,101 (152) 19,306 26,030 - - - - - 1,820 68,000 403 70,223 - - 4,500 - - 1,350 10,872 1,259 17,981 - - 305 - - - - 5,266 5,571
15 - 191 - - 24,221 104 26,607 65,946 - - 5 - - 2,074 1,794 17,846 21,858
24,403 167 80,462 47,615 8,563 31,683 80,618 72,361 396,424
168 - 281 887 - 9,113 2,378 13,903 28,493 - - - - - 8,803 12,355 332 30,353 - - - - - 6,549 22,062 828 29,439 - - 31,369 - 8,400 195 1,150 2,985 68,273
18 1,215 - 36,749 - 120 - 25,795 63,921 - - 167 - - 2,386 1,142 85 3,780 - - - - - 3,033 16,387 6,852 35,262
11 362 1,271 1,902 - - 1,186 4,729 10,334
- - - - - 592 1,818 2,405 5,000 - - - - - 229 1,420 1,307 2,989
197 1,577 33,088 39,538 8,400 31,020 59,898 59,221 277,844
24,206 (1,410) 47,374 8,077 163 663 20,720 13,140 118,580
351 - - - - 1,151 - 3,734 5,268 - - - - - 3,715 700 19,909 45,272 - - - - - (754) - (888) (1,661)
(23,939) (2,878) (43,596) (8) (84) (18,950) (309) (20,911) (129,365) - - - - - 6,167 - - 6,167
(23,588) (2,878) (43,596) (8) (84) (8,671) 391 1,844 (74,319)
618 (4,288) 3,778 8,069 79 (8,008) 21,111 14,984 44,261
5,225 5,258 42,017 2,238 1,309 24,532 (30,082) 102,935 181,943
5,843$ 970$ 45,795$ 10,307$ 1,388$ 16,524$ (8,971)$ 117,919$ 226,204$
Unbudgeted
OtherSpecial
Revenue
OtherSpecial
Revenue
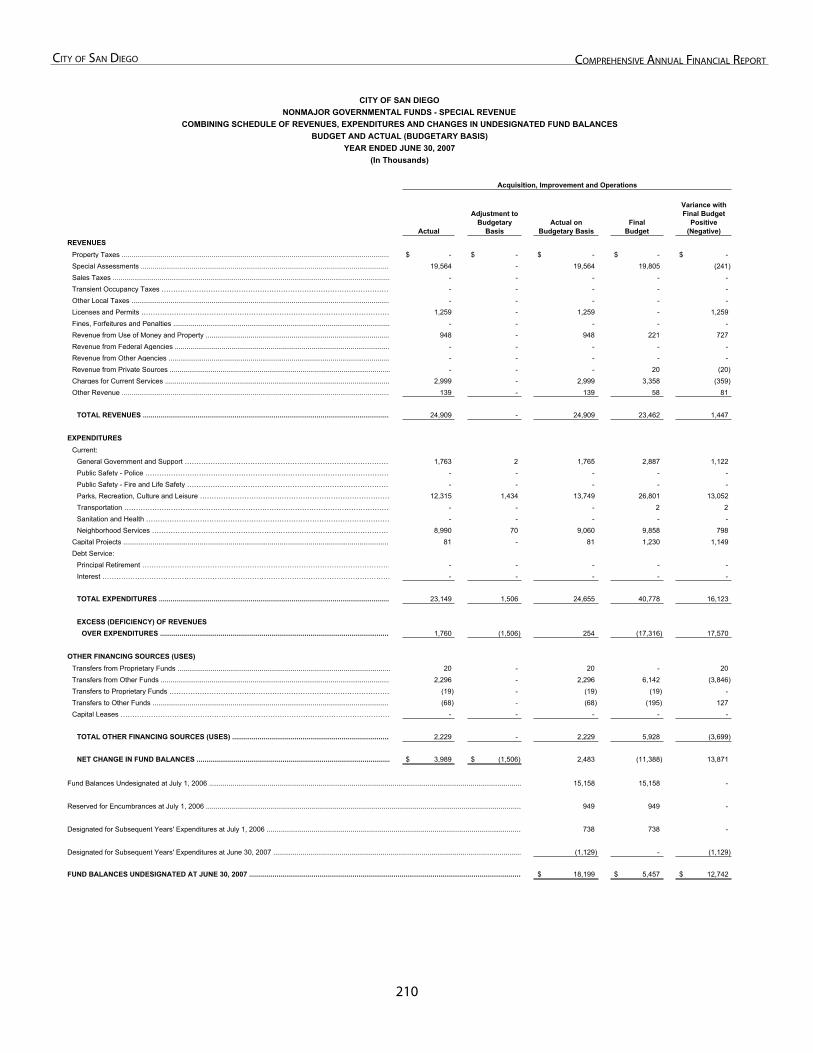
210
City of San Diego ComprehenSive annual finanCial report
Actual
Adjustment to Budgetary
BasisActual on
Budgetary BasisFinal
Budget
Variance with Final Budget
Positive(Negative)
REVENUESProperty Taxes ......................................................................................................................................... -$ -$ -$ -$ -$ Special Assessments ................................................................................................................................ 19,564 - 19,564 19,805 (241) Sales Taxes .............................................................................................................................................. - - - - - Transient Occupancy Taxes ……………………………………………………………………………………… - - - - - Other Local Taxes .................................................................................................................................... - - - - - Licenses and Permits ……………………………………………………………………………………………… 1,259 - 1,259 - 1,259 Fines, Forfeitures and Penalties ............................................................................................................... - - - - - Revenue from Use of Money and Property .............................................................................................. 948 - 948 221 727 Revenue from Federal Agencies .............................................................................................................. - - - - - Revenue from Other Agencies ................................................................................................................. - - - - - Revenue from Private Sources ................................................................................................................. - - - 20 (20) Charges for Current Services ................................................................................................................... 2,999 - 2,999 3,358 (359) Other Revenue ......................................................................................................................................... 139 - 139 58 81
TOTAL REVENUES ............................................................................................................................... 24,909 - 24,909 23,462 1,447
EXPENDITURES
Current: General Government and Support ……………………………………………………………………………… 1,763 2 1,765 2,887 1,122 Public Safety - Police …………………………………………………………………………………………… - - - - - Public Safety - Fire and Life Safety …………………………………………………………………………… - - - - - Parks, Recreation, Culture and Leisure ……………………………………………………………………… 12,315 1,434 13,749 26,801 13,052 Transportation …………………………………………………………………………………………………… - - - 2 2 Sanitation and Health …………………………………………………………………………………………… - - - - - Neighborhood Services ………………………………………………………………………………………… 8,990 70 9,060 9,858 798
Capital Projects ......................................................................................................................................... 81 - 81 1,230 1,149 Debt Service:
Principal Retirement ……………………………………………………………………………………………… - - - - - Interest …………………………………………………………………………………………………………… - - - - -
TOTAL EXPENDITURES ...................................................................................................................... 23,149 1,506 24,655 40,778 16,123
EXCESS (DEFICIENCY) OF REVENUES
OVER EXPENDITURES ...................................................................................................................... 1,760 (1,506) 254 (17,316) 17,570
OTHER FINANCING SOURCES (USES)Transfers from Proprietary Funds ............................................................................................................. 20 - 20 - 20 Transfers from Other Funds ..................................................................................................................... 2,296 - 2,296 6,142 (3,846) Transfers to Proprietary Funds …………………………………………………………………………………… (19) - (19) (19) - Transfers to Other Funds .......................................................................................................................... (68) - (68) (195) 127 Capital Leases ……………………………………………………………………………………………………… - - - - -
TOTAL OTHER FINANCING SOURCES (USES) ................................................................................. 2,229 - 2,229 5,928 (3,699)
NET CHANGE IN FUND BALANCES ................................................................................................... 3,989$ (1,506)$ 2,483 (11,388) 13,871
Fund Balances Undesignated at July 1, 2006 ................................................................................................................................................................ 15,158 15,158 -
Reserved for Encumbrances at July 1, 2006 .................................................................................................................................................................. 949 949 -
Designated for Subsequent Years' Expenditures at July 1, 2006 ................................................................................................................................... 738 738 -
Designated for Subsequent Years' Expenditures at June 30, 2007 ............................................................................................................................... (1,129) - (1,129)
FUND BALANCES UNDESIGNATED AT JUNE 30, 2007 ............................................................................................................................................ 18,199$ 5,457$ 12,742$
Acquisition, Improvement and Operations
CITY OF SAN DIEGO
YEAR ENDED JUNE 30, 2007(In Thousands)
NONMAJOR GOVERNMENTAL FUNDS - SPECIAL REVENUE
BUDGET AND ACTUAL (BUDGETARY BASIS)COMBINING SCHEDULE OF REVENUES, EXPENDITURES AND CHANGES IN UNDESIGNATED FUND BALANCES
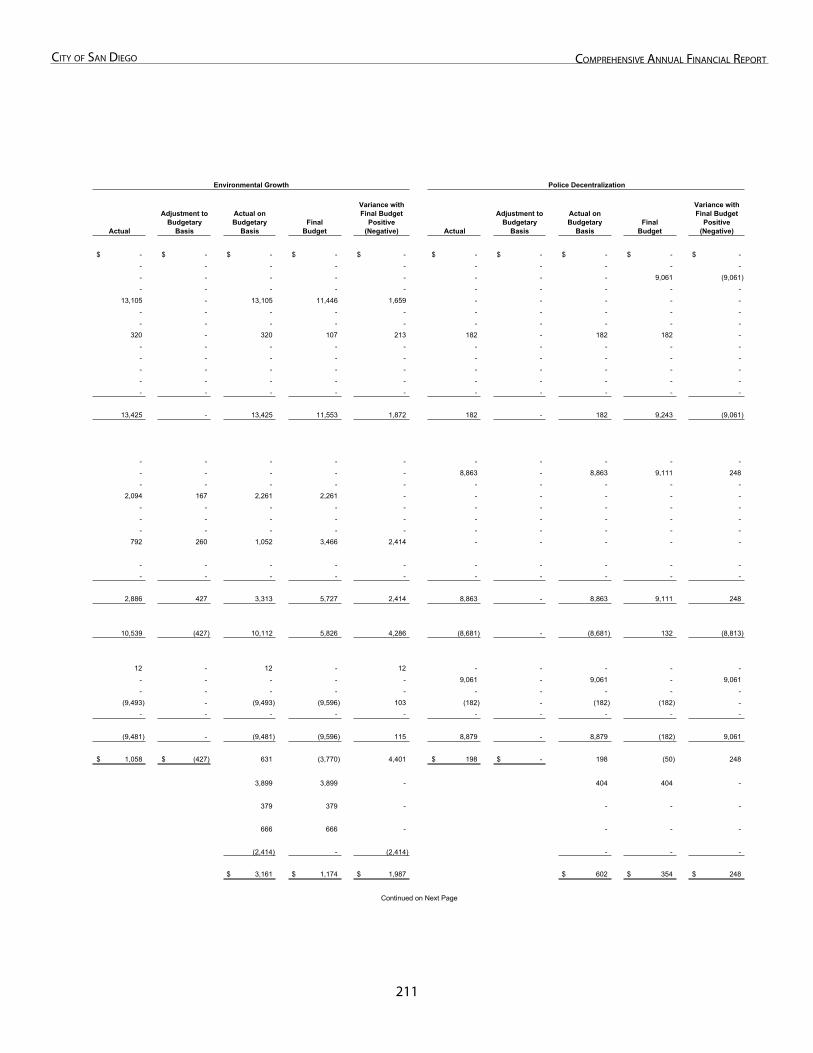
211
City of San Diego ComprehenSive annual finanCial report
Actual
Adjustment to Budgetary
Basis
Actual on Budgetary
BasisFinal
Budget
Variance with Final Budget
Positive(Negative) Actual
Adjustment to Budgetary
Basis
Actual on Budgetary
BasisFinal
Budget
Variance with Final Budget
Positive(Negative)
-$ -$ -$ -$ -$ -$ -$ -$ -$ -$ - - - - - - - - - - - - - - - - - - 9,061 (9,061) - - - - - - - - - -
13,105 - 13,105 11,446 1,659 - - - - - - - - - - - - - - - - - - - - - - - - -
320 - 320 107 213 182 - 182 182 - - - - - - - - - - - - - - - - - - - - - - - - - - - - - - - - - - - - - - - - - - - - - - - - - - -
13,425 - 13,425 11,553 1,872 182 - 182 9,243 (9,061)
- - - - - - - - - - - - - - - 8,863 - 8,863 9,111 248 - - - - - - - - - -
2,094 167 2,261 2,261 - - - - - - - - - - - - - - - - - - - - - - - - - - - - - - - - - - - -
792 260 1,052 3,466 2,414 - - - - -
- - - - - - - - - - - - - - - - - - - -
2,886 427 3,313 5,727 2,414 8,863 - 8,863 9,111 248
10,539 (427) 10,112 5,826 4,286 (8,681) - (8,681) 132 (8,813)
12 - 12 - 12 - - - - - - - - - - 9,061 - 9,061 - 9,061 - - - - - - - - - -
(9,493) - (9,493) (9,596) 103 (182) - (182) (182) - - - - - - - - - - -
(9,481) - (9,481) (9,596) 115 8,879 - 8,879 (182) 9,061
1,058$ (427)$ 631 (3,770) 4,401 198$ -$ 198 (50) 248
3,899 3,899 - 404 404 -
379 379 - - - -
666 666 - - - -
(2,414) - (2,414) - - -
3,161$ 1,174$ 1,987$ 602$ 354$ 248$
Continued on Next Page
Environmental Growth Police Decentralization
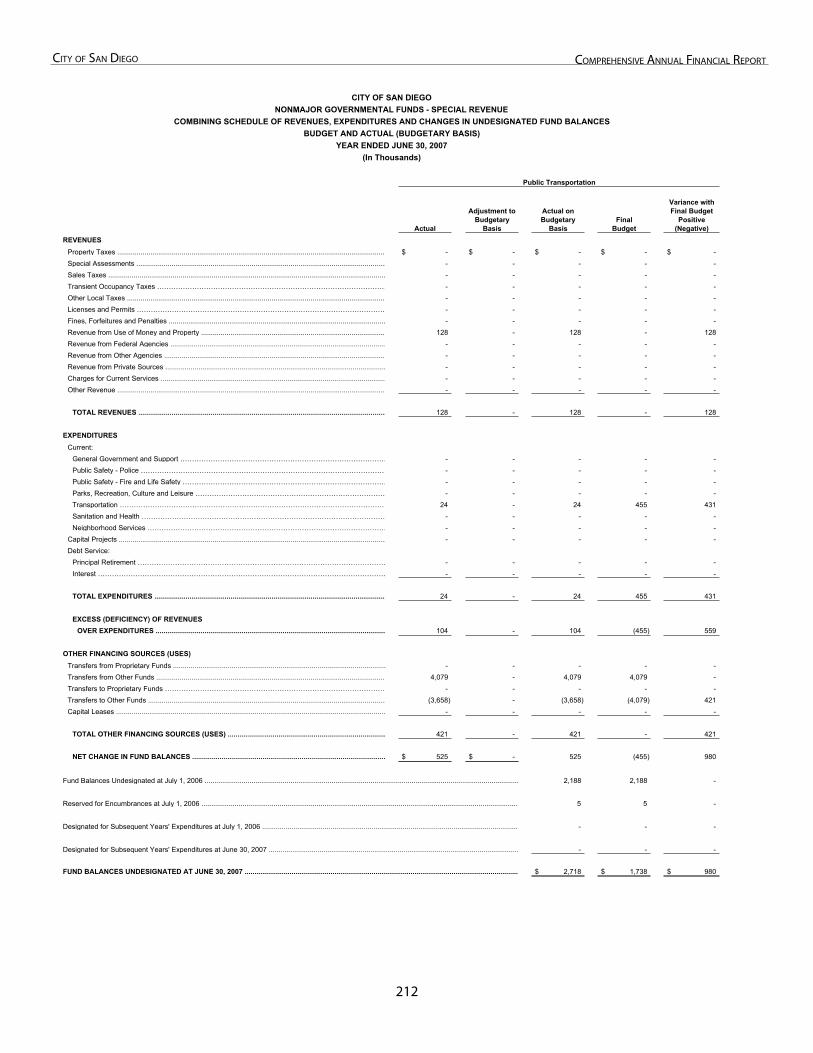
212
City of San Diego ComprehenSive annual finanCial report
Actual
Adjustment to Budgetary
Basis
Actual on Budgetary
BasisFinal
Budget
Variance with Final Budget
Positive(Negative)
REVENUESProperty Taxes ......................................................................................................................................... -$ -$ -$ -$ -$ Special Assessments ................................................................................................................................ - - - - - Sales Taxes .............................................................................................................................................. - - - - - Transient Occupancy Taxes ……………………………………………………………………………………… - - - - - Other Local Taxes .................................................................................................................................... - - - - - Licenses and Permits ……………………………………………………………………………………………… - - - - - Fines, Forfeitures and Penalties ............................................................................................................... - - - - - Revenue from Use of Money and Property .............................................................................................. 128 - 128 - 128 Revenue from Federal Agencies .............................................................................................................. - - - - - Revenue from Other Agencies ................................................................................................................. - - - - - Revenue from Private Sources ................................................................................................................. - - - - - Charges for Current Services ................................................................................................................... - - - - - Other Revenue ......................................................................................................................................... - - - - -
TOTAL REVENUES ............................................................................................................................... 128 - 128 - 128
EXPENDITURES
Current: General Government and Support ……………………………………………………………………………… - - - - - Public Safety - Police …………………………………………………………………………………………… - - - - - Public Safety - Fire and Life Safety …………………………………………………………………………… - - - - - Parks, Recreation, Culture and Leisure ……………………………………………………………………… - - - - - Transportation …………………………………………………………………………………………………… 24 - 24 455 431 Sanitation and Health …………………………………………………………………………………………… - - - - - Neighborhood Services ………………………………………………………………………………………… - - - - -
Capital Projects ......................................................................................................................................... - - - - - Debt Service:
Principal Retirement ……………………………………………………………………………………………… - - - - - Interest …………………………………………………………………………………………………………… - - - - -
TOTAL EXPENDITURES ...................................................................................................................... 24 - 24 455 431
EXCESS (DEFICIENCY) OF REVENUES
OVER EXPENDITURES ...................................................................................................................... 104 - 104 (455) 559
OTHER FINANCING SOURCES (USES)Transfers from Proprietary Funds ............................................................................................................. - - - - - Transfers from Other Funds ..................................................................................................................... 4,079 - 4,079 4,079 - Transfers to Proprietary Funds …………………………………………………………………………………… - - - - - Transfers to Other Funds .......................................................................................................................... (3,658) - (3,658) (4,079) 421 Capital Leases .......................................................................................................................................... - - - - -
TOTAL OTHER FINANCING SOURCES (USES) ................................................................................. 421 - 421 - 421
NET CHANGE IN FUND BALANCES ................................................................................................... 525$ -$ 525 (455) 980
Fund Balances Undesignated at July 1, 2006 ................................................................................................................................................................. 2,188 2,188 -
Reserved for Encumbrances at July 1, 2006 ................................................................................................................................................................... 5 5 -
Designated for Subsequent Years' Expenditures at July 1, 2006 ................................................................................................................................... - - -
Designated for Subsequent Years' Expenditures at June 30, 2007 ................................................................................................................................ - - -
FUND BALANCES UNDESIGNATED AT JUNE 30, 2007 ............................................................................................................................................ 2,718$ 1,738$ 980$
Public Transportation
BUDGET AND ACTUAL (BUDGETARY BASIS)COMBINING SCHEDULE OF REVENUES, EXPENDITURES AND CHANGES IN UNDESIGNATED FUND BALANCES
CITY OF SAN DIEGONONMAJOR GOVERNMENTAL FUNDS - SPECIAL REVENUE
YEAR ENDED JUNE 30, 2007(In Thousands)
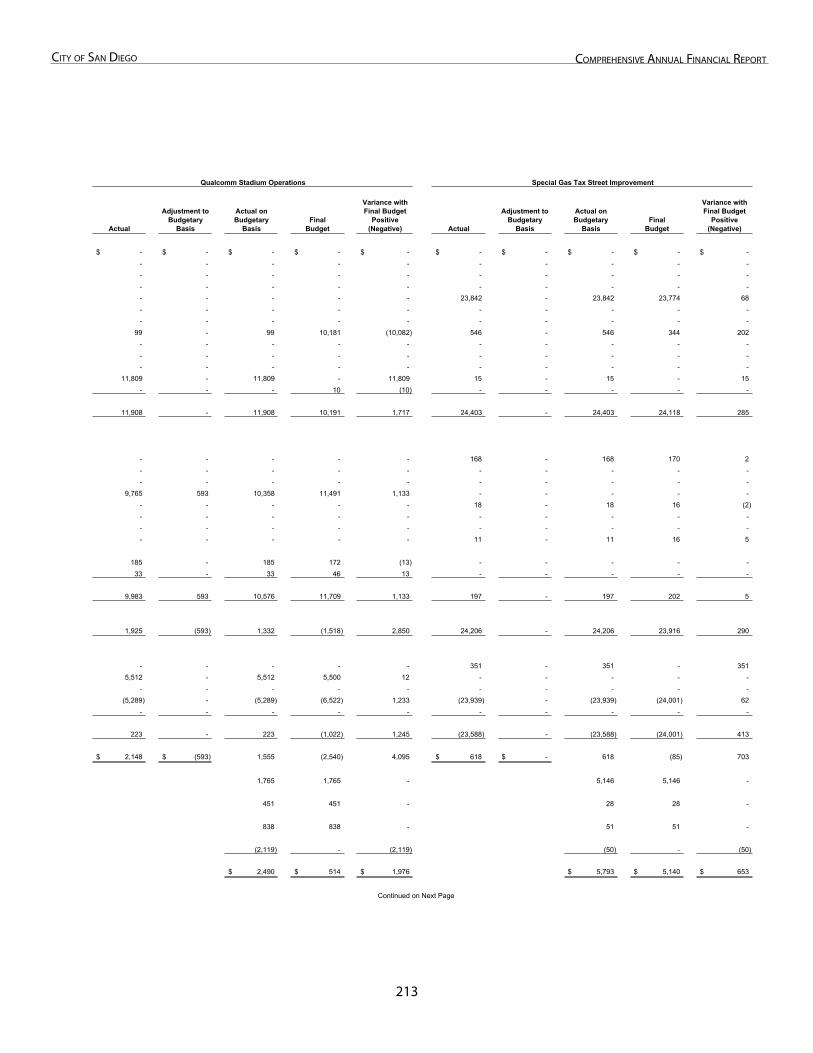
213
City of San Diego ComprehenSive annual finanCial report
Actual
Adjustment to Budgetary
Basis
Actual on Budgetary
BasisFinal
Budget
Variance with Final Budget
Positive(Negative) Actual
Adjustment to Budgetary
Basis
Actual on Budgetary
BasisFinal
Budget
Variance with Final Budget
Positive(Negative)
-$ -$ -$ -$ -$ -$ -$ -$ -$ -$ - - - - - - - - - - - - - - - - - - - - - - - - - - - - - - - - - - - 23,842 - 23,842 23,774 68 - - - - - - - - - - - - - - - - - - - -
99 - 99 10,181 (10,082) 546 - 546 344 202 - - - - - - - - - - - - - - - - - - - - - - - - - - - - - -
11,809 - 11,809 - 11,809 15 - 15 - 15 - - - 10 (10) - - - - -
11,908 - 11,908 10,191 1,717 24,403 - 24,403 24,118 285
- - - - - 168 - 168 170 2 - - - - - - - - - - - - - - - - - - - -
9,765 593 10,358 11,491 1,133 - - - - - - - - - - 18 - 18 16 (2) - - - - - - - - - - - - - - - - - - - - - - - - - 11 - 11 16 5
185 - 185 172 (13) - - - - - 33 - 33 46 13 - - - - -
9,983 593 10,576 11,709 1,133 197 - 197 202 5
1,925 (593) 1,332 (1,518) 2,850 24,206 - 24,206 23,916 290
- - - - - 351 - 351 - 351 5,512 - 5,512 5,500 12 - - - - -
- - - - - - - - - - (5,289) - (5,289) (6,522) 1,233 (23,939) - (23,939) (24,001) 62
- - - - - - - - - -
223 - 223 (1,022) 1,245 (23,588) - (23,588) (24,001) 413
2,148$ (593)$ 1,555 (2,540) 4,095 618$ -$ 618 (85) 703
1,765 1,765 - 5,146 5,146 -
451 451 - 28 28 -
838 838 - 51 51 -
(2,119) - (2,119) (50) - (50)
2,490$ 514$ 1,976$ 5,793$ 5,140$ 653$
Continued on Next Page
Qualcomm Stadium Operations Special Gas Tax Street Improvement
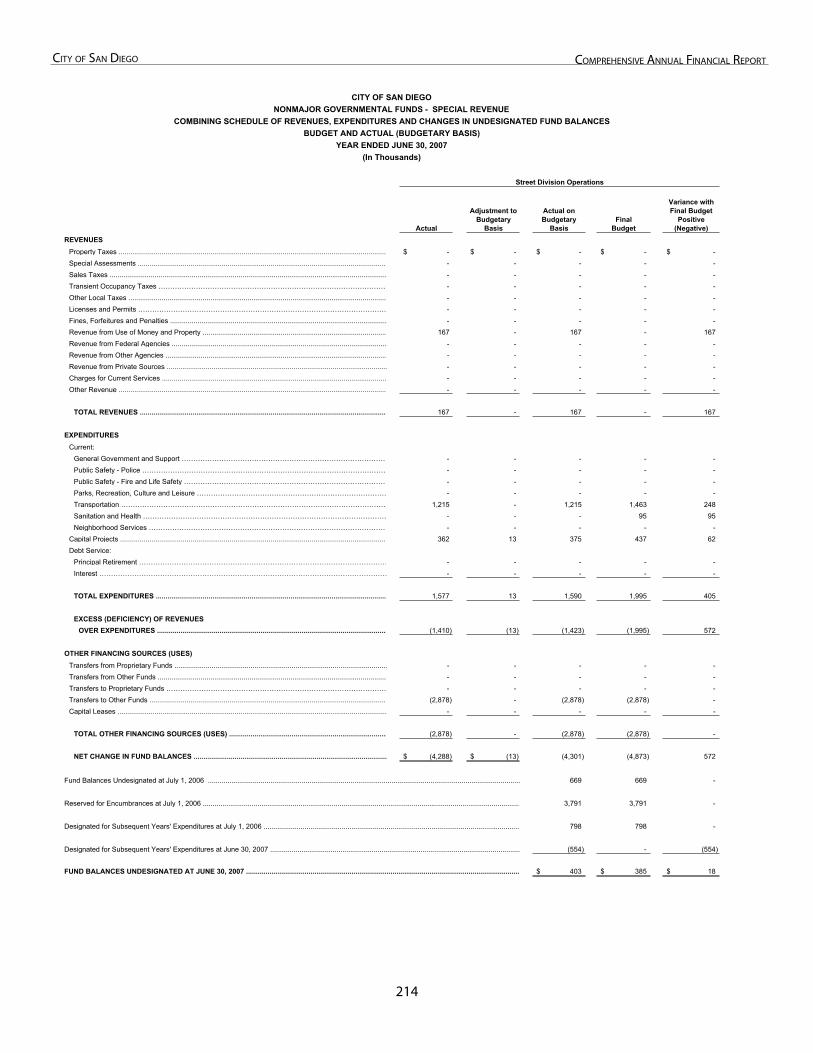
21�
City of San Diego ComprehenSive annual finanCial report
Actual
Adjustment to Budgetary
Basis
Actual on Budgetary
BasisFinal
Budget
Variance with Final Budget
Positive(Negative)
REVENUESProperty Taxes ......................................................................................................................................... -$ -$ -$ -$ -$ Special Assessments ................................................................................................................................ - - - - - Sales Taxes .............................................................................................................................................. - - - - - Transient Occupancy Taxes ……………………………………………………………………………………… - - - - - Other Local Taxes .................................................................................................................................... - - - - - Licenses and Permits ……………………………………………………………………………………………… - - - - - Fines, Forfeitures and Penalties ............................................................................................................... - - - - - Revenue from Use of Money and Property .............................................................................................. 167 - 167 - 167 Revenue from Federal Agencies .............................................................................................................. - - - - - Revenue from Other Agencies ................................................................................................................. - - - - - Revenue from Private Sources ................................................................................................................. - - - - - Charges for Current Services ................................................................................................................... - - - - - Other Revenue ......................................................................................................................................... - - - - -
TOTAL REVENUES ............................................................................................................................... 167 - 167 - 167
EXPENDITURES
Current: General Government and Support ……………………………………………………………………………… - - - - - Public Safety - Police …………………………………………………………………………………………… - - - - - Public Safety - Fire and Life Safety …………………………………………………………………………… - - - - - Parks, Recreation, Culture and Leisure ……………………………………………………………………… - - - - - Transportation …………………………………………………………………………………………………… 1,215 - 1,215 1,463 248 Sanitation and Health …………………………………………………………………………………………… - - - 95 95 Neighborhood Services ………………………………………………………………………………………… - - - - -
Capital Projects ......................................................................................................................................... 362 13 375 437 62 Debt Service:
Principal Retirement ……………………………………………………………………………………………… - - - - - Interest …………………………………………………………………………………………………………… - - - - -
TOTAL EXPENDITURES ...................................................................................................................... 1,577 13 1,590 1,995 405
EXCESS (DEFICIENCY) OF REVENUES
OVER EXPENDITURES ...................................................................................................................... (1,410) (13) (1,423) (1,995) 572
OTHER FINANCING SOURCES (USES)Transfers from Proprietary Funds ............................................................................................................. - - - - - Transfers from Other Funds ..................................................................................................................... - - - - - Transfers to Proprietary Funds …………………………………………………………………………………… - - - - - Transfers to Other Funds .......................................................................................................................... (2,878) - (2,878) (2,878) - Capital Leases .......................................................................................................................................... - - - - -
TOTAL OTHER FINANCING SOURCES (USES) ................................................................................. (2,878) - (2,878) (2,878) -
NET CHANGE IN FUND BALANCES ................................................................................................... (4,288)$ (13)$ (4,301) (4,873) 572
Fund Balances Undesignated at July 1, 2006 ................................................................................................................................................................ 669 669 -
Reserved for Encumbrances at July 1, 2006 ................................................................................................................................................................... 3,791 3,791 -
Designated for Subsequent Years' Expenditures at July 1, 2006 ................................................................................................................................... 798 798 -
Designated for Subsequent Years' Expenditures at June 30, 2007 ................................................................................................................................ (554) - (554)
FUND BALANCES UNDESIGNATED AT JUNE 30, 2007 ............................................................................................................................................ 403$ 385$ 18$
COMBINING SCHEDULE OF REVENUES, EXPENDITURES AND CHANGES IN UNDESIGNATED FUND BALANCESBUDGET AND ACTUAL (BUDGETARY BASIS)
CITY OF SAN DIEGONONMAJOR GOVERNMENTAL FUNDS - SPECIAL REVENUE
YEAR ENDED JUNE 30, 2007(In Thousands)
Street Division Operations
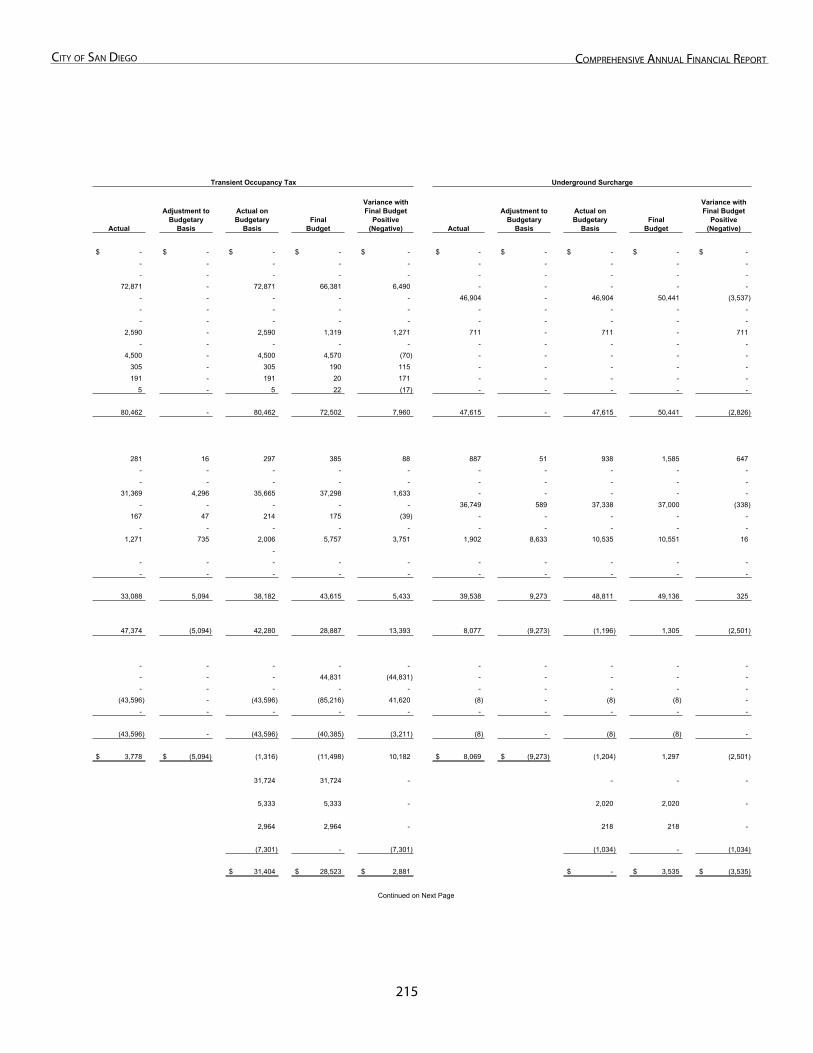
21�
City of San Diego ComprehenSive annual finanCial report
Actual
Adjustment to Budgetary
Basis
Actual on Budgetary
BasisFinal
Budget
Variance with Final Budget
Positive(Negative) Actual
Adjustment to Budgetary
Basis
Actual on Budgetary
BasisFinal
Budget
Variance with Final Budget
Positive(Negative)
-$ -$ -$ -$ -$ -$ -$ -$ -$ -$ - - - - - - - - - - - - - - - - - - - -
72,871 - 72,871 66,381 6,490 - - - - - - - - - - 46,904 - 46,904 50,441 (3,537) - - - - - - - - - - - - - - - - - - - -
2,590 - 2,590 1,319 1,271 711 - 711 - 711 - - - - - - - - - -
4,500 - 4,500 4,570 (70) - - - - - 305 - 305 190 115 - - - - - 191 - 191 20 171 - - - - -
5 - 5 22 (17) - - - - -
80,462 - 80,462 72,502 7,960 47,615 - 47,615 50,441 (2,826)
281 16 297 385 88 887 51 938 1,585 647
- - - - - - - - - - - - - - - - - - - -
31,369 4,296 35,665 37,298 1,633 - - - - - - - - - - 36,749 589 37,338 37,000 (338)
167 47 214 175 (39) - - - - - - - - - - - - - - -
1,271 735 2,006 5,757 3,751 1,902 8,633 10,535 10,551 16 -
- - - - - - - - - - - - - - - - - - - -
33,088 5,094 38,182 43,615 5,433 39,538 9,273 48,811 49,136 325
47,374 (5,094) 42,280 28,887 13,393 8,077 (9,273) (1,196) 1,305 (2,501)
- - - - - - - - - - - - - 44,831 (44,831) - - - - - - - - - - - - - - -
(43,596) - (43,596) (85,216) 41,620 (8) - (8) (8) - - - - - - - - - - -
(43,596) - (43,596) (40,385) (3,211) (8) - (8) (8) -
3,778$ (5,094)$ (1,316) (11,498) 10,182 8,069$ (9,273)$ (1,204) 1,297 (2,501)
31,724 31,724 - - - -
5,333 5,333 - 2,020 2,020 -
2,964 2,964 - 218 218 -
(7,301) - (7,301) (1,034) - (1,034)
31,404$ 28,523$ 2,881$ -$ 3,535$ (3,535)$
Continued on Next Page
Transient Occupancy Tax Underground Surcharge
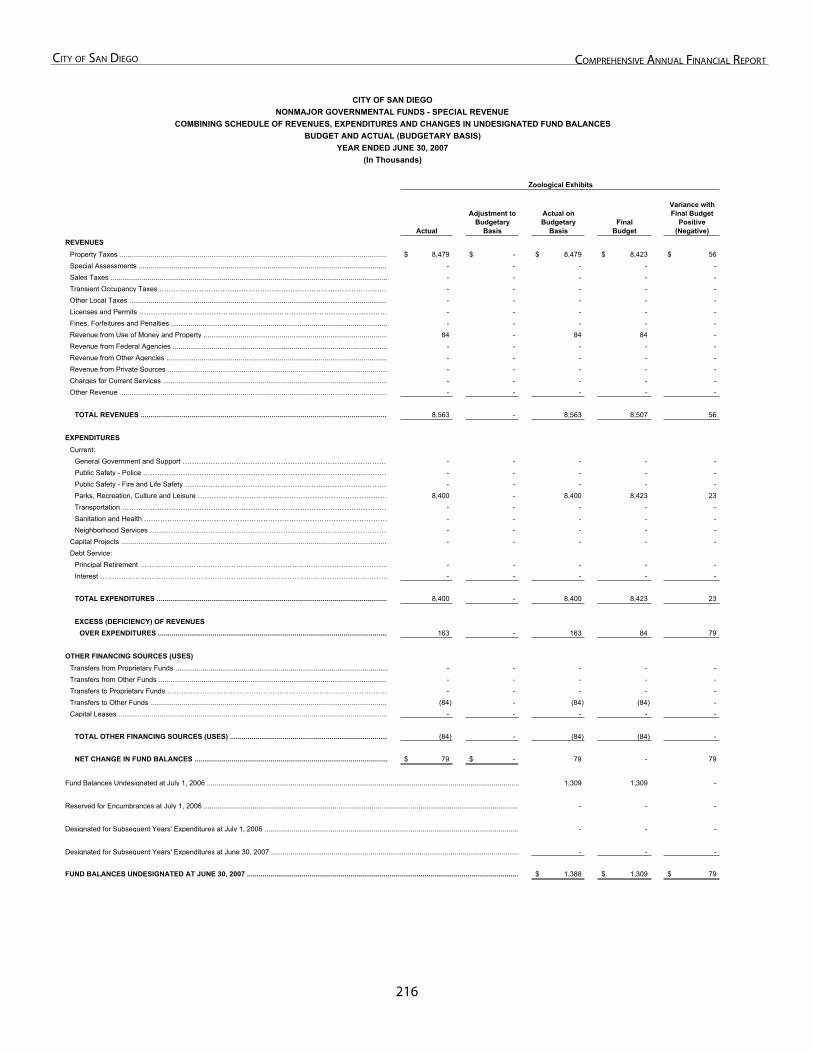
21�
City of San Diego ComprehenSive annual finanCial report
Actual
Adjustment to Budgetary
Basis
Actual on Budgetary
BasisFinal
Budget
Variance with Final Budget
Positive(Negative)
REVENUESProperty Taxes ......................................................................................................................................... 8,479$ -$ 8,479$ 8,423$ 56$ Special Assessments ................................................................................................................................ - - - - - Sales Taxes .............................................................................................................................................. - - - - - Transient Occupancy Taxes ……………………………………………………………………………………… - - - - - Other Local Taxes .................................................................................................................................... - - - - - Licenses and Permits ……………………………………………………………………………………………… - - - - - Fines, Forfeitures and Penalties ............................................................................................................... - - - - - Revenue from Use of Money and Property .............................................................................................. 84 - 84 84 - Revenue from Federal Agencies .............................................................................................................. - - - - - Revenue from Other Agencies ................................................................................................................. - - - - - Revenue from Private Sources ................................................................................................................. - - - - - Charges for Current Services ................................................................................................................... - - - - - Other Revenue ......................................................................................................................................... - - - - -
TOTAL REVENUES ............................................................................................................................... 8,563 - 8,563 8,507 56
EXPENDITURES
Current: General Government and Support ……………………………………………………………………………… - - - - - Public Safety - Police …………………………………………………………………………………………… - - - - - Public Safety - Fire and Life Safety …………………………………………………………………………… - - - - - Parks, Recreation, Culture and Leisure ……………………………………………………………………… 8,400 - 8,400 8,423 23 Transportation …………………………………………………………………………………………………… - - - - - Sanitation and Health …………………………………………………………………………………………… - - - - - Neighborhood Services ………………………………………………………………………………………… - - - - -
Capital Projects ......................................................................................................................................... - - - - - Debt Service:
Principal Retirement ……………………………………………………………………………………………… - - - - - Interest …………………………………………………………………………………………………………… - - - - -
TOTAL EXPENDITURES ...................................................................................................................... 8,400 - 8,400 8,423 23
EXCESS (DEFICIENCY) OF REVENUES
OVER EXPENDITURES ...................................................................................................................... 163 - 163 84 79
OTHER FINANCING SOURCES (USES)
Transfers from Proprietary Funds ............................................................................................................. - - - - - Transfers from Other Funds ..................................................................................................................... - - - - - Transfers to Proprietary Funds …………………………………………………………………………………… - - - - - Transfers to Other Funds .......................................................................................................................... (84) - (84) (84) - Capital Leases .......................................................................................................................................... - - - - -
TOTAL OTHER FINANCING SOURCES (USES) ................................................................................. (84) - (84) (84) -
NET CHANGE IN FUND BALANCES ................................................................................................... 79$ -$ 79 - 79
Fund Balances Undesignated at July 1, 2006 ................................................................................................................................................................ 1,309 1,309 -
Reserved for Encumbrances at July 1, 2006 .................................................................................................................................................................. - - -
Designated for Subsequent Years' Expenditures at July 1, 2006 .................................................................................................................................. - - -
Designated for Subsequent Years' Expenditures at June 30, 2007 ............................................................................................................................... - - -
FUND BALANCES UNDESIGNATED AT JUNE 30, 2007 ........................................................................................................................................... 1,388$ 1,309$ 79$
YEAR ENDED JUNE 30, 2007(In Thousands)
CITY OF SAN DIEGONONMAJOR GOVERNMENTAL FUNDS - SPECIAL REVENUE
COMBINING SCHEDULE OF REVENUES, EXPENDITURES AND CHANGES IN UNDESIGNATED FUND BALANCESBUDGET AND ACTUAL (BUDGETARY BASIS)
Zoological Exhibits
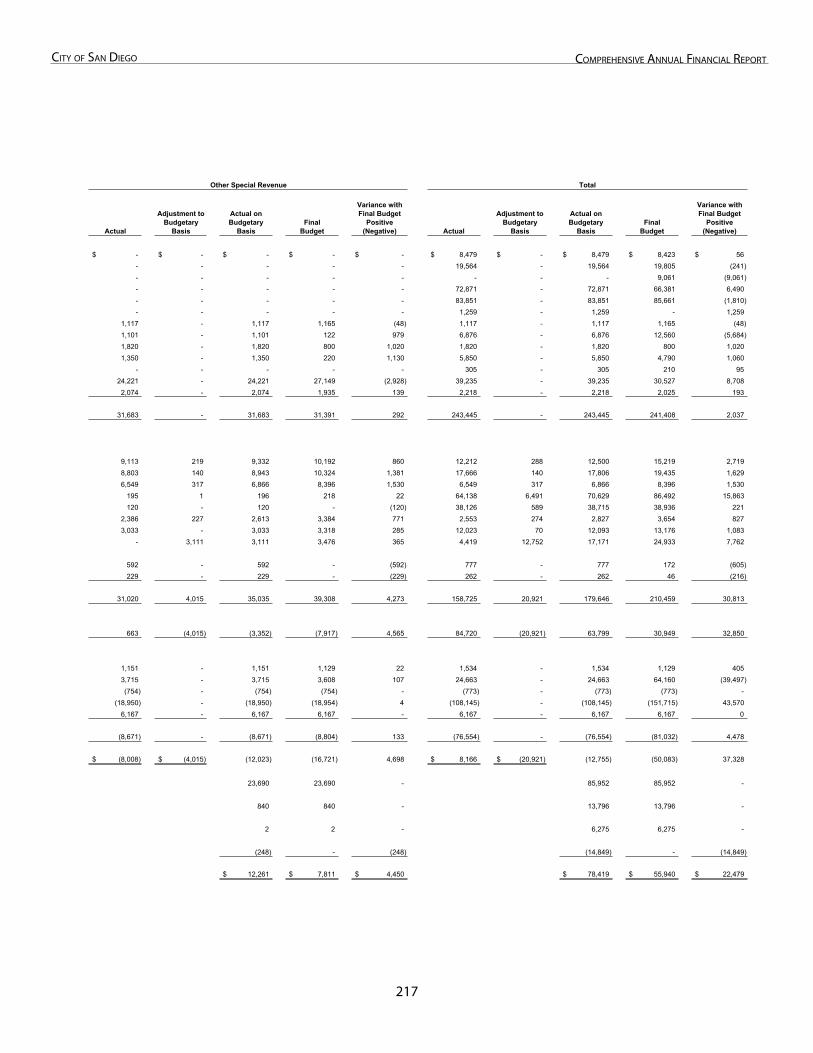
217
City of San Diego ComprehenSive annual finanCial report
Actual
Adjustment to Budgetary
Basis
Actual on Budgetary
BasisFinal
Budget
Variance with Final Budget
Positive(Negative) Actual
Adjustment to Budgetary
Basis
Actual on Budgetary
BasisFinal
Budget
Variance with Final Budget
Positive(Negative)
-$ -$ -$ -$ -$ 8,479$ -$ 8,479$ 8,423$ 56$ - - - - - 19,564 - 19,564 19,805 (241) - - - - - - - - 9,061 (9,061) - - - - - 72,871 - 72,871 66,381 6,490 - - - - - 83,851 - 83,851 85,661 (1,810) - - - - - 1,259 - 1,259 - 1,259
1,117 - 1,117 1,165 (48) 1,117 - 1,117 1,165 (48) 1,101 - 1,101 122 979 6,876 - 6,876 12,560 (5,684) 1,820 - 1,820 800 1,020 1,820 - 1,820 800 1,020 1,350 - 1,350 220 1,130 5,850 - 5,850 4,790 1,060
- - - - - 305 - 305 210 95 24,221 - 24,221 27,149 (2,928) 39,235 - 39,235 30,527 8,708 2,074 - 2,074 1,935 139 2,218 - 2,218 2,025 193
31,683 - 31,683 31,391 292 243,445 - 243,445 241,408 2,037
9,113 219 9,332 10,192 860 12,212 288 12,500 15,219 2,719 8,803 140 8,943 10,324 1,381 17,666 140 17,806 19,435 1,629 6,549 317 6,866 8,396 1,530 6,549 317 6,866 8,396 1,530
195 1 196 218 22 64,138 6,491 70,629 86,492 15,863 120 - 120 - (120) 38,126 589 38,715 38,936 221
2,386 227 2,613 3,384 771 2,553 274 2,827 3,654 827 3,033 - 3,033 3,318 285 12,023 70 12,093 13,176 1,083
- 3,111 3,111 3,476 365 4,419 12,752 17,171 24,933 7,762
592 - 592 - (592) 777 - 777 172 (605) 229 - 229 - (229) 262 - 262 46 (216)
31,020 4,015 35,035 39,308 4,273 158,725 20,921 179,646 210,459 30,813
663 (4,015) (3,352) (7,917) 4,565 84,720 (20,921) 63,799 30,949 32,850
1,151 - 1,151 1,129 22 1,534 - 1,534 1,129 405 3,715 - 3,715 3,608 107 24,663 - 24,663 64,160 (39,497) (754) - (754) (754) - (773) - (773) (773) -
(18,950) - (18,950) (18,954) 4 (108,145) - (108,145) (151,715) 43,570 6,167 - 6,167 6,167 - 6,167 - 6,167 6,167 0
(8,671) - (8,671) (8,804) 133 (76,554) - (76,554) (81,032) 4,478
(8,008)$ (4,015)$ (12,023) (16,721) 4,698 8,166$ (20,921)$ (12,755) (50,083) 37,328
23,690 23,690 - 85,952 85,952 -
840 840 - 13,796 13,796 -
2 2 - 6,275 6,275 -
(248) - (248) (14,849) - (14,849)
12,261$ 7,811$ 4,450$ 78,419$ 55,940$ 22,479$
Other Special Revenue Total

This Page Left Intentionally Blank
218
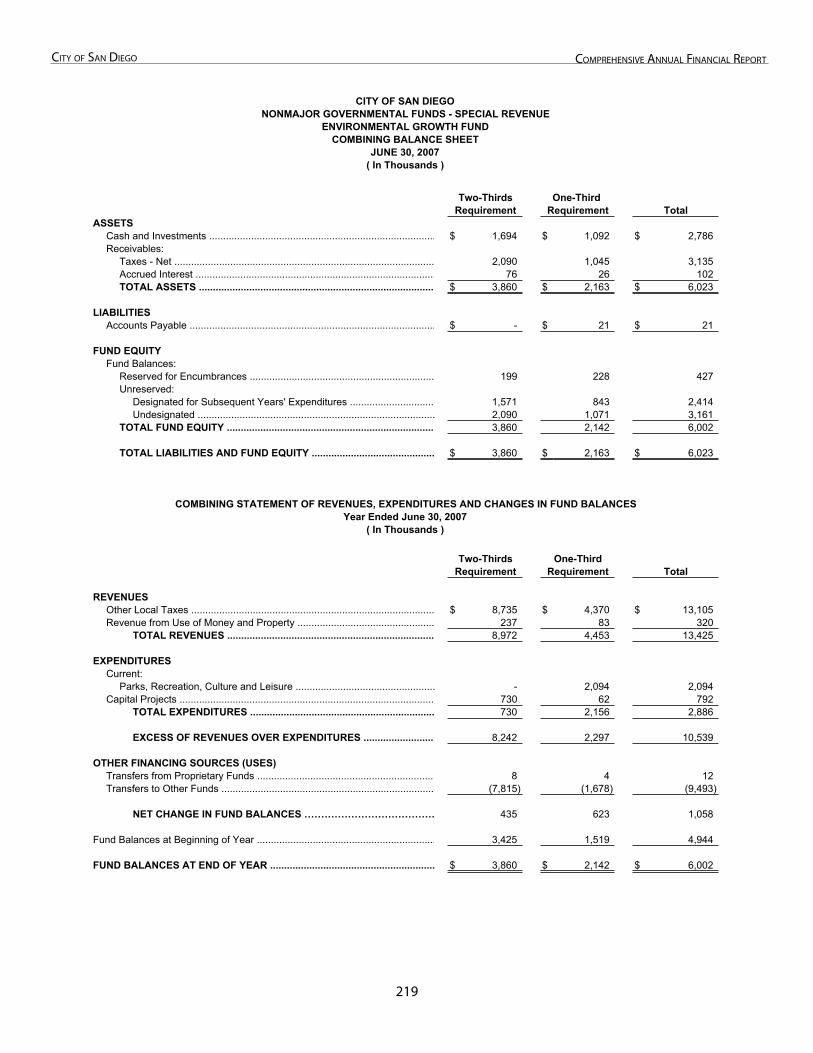
21�
City of San Diego ComprehenSive annual finanCial report
CITY OF SAN DIEGONONMAJOR GOVERNMENTAL FUNDS - SPECIAL REVENUE
ENVIRONMENTAL GROWTH FUNDCOMBINING BALANCE SHEET
JUNE 30, 2007( In Thousands )
Two-Thirds One-Third Requirement Requirement
ASSETS Cash and Investments ................................................................................. $ 1,694 $ 1,092 $ 2,786 Receivables:
Taxes - Net ............................................................................................. 2,090 1,045 3,135 Accrued Interest ...................................................................................... 76 26 102 TOTAL ASSETS ..................................................................................... $ 3,860 $ 2,163 $ 6,023
LIABILITIESAccounts Payable ........................................................................................ $ - $ 21 $ 21
FUND EQUITYFund Balances:
Reserved for Encumbrances .................................................................. 199 228 427 Unreserved:
Designated for Subsequent Years' Expenditures .............................. 1,571 843 2,414 Undesignated ..................................................................................... 2,090 1,071 3,161
TOTAL FUND EQUITY ........................................................................... 3,860 2,142 6,002
TOTAL LIABILITIES AND FUND EQUITY ............................................ $ 3,860 $ 2,163 $ 6,023
COMBINING STATEMENT OF REVENUES, EXPENDITURES AND CHANGES IN FUND BALANCESYear Ended June 30, 2007
( In Thousands )
Two-Thirds One-ThirdRequirement Requirement
REVENUESOther Local Taxes ....................................................................................... $ 8,735 $ 4,370 $ 13,105 Revenue from Use of Money and Property ................................................. 237 83 320
TOTAL REVENUES .......................................................................... 8,972 4,453 13,425
EXPENDITURESCurrent:
Parks, Recreation, Culture and Leisure .................................................. - 2,094 2,094 Capital Projects ........................................................................................... 730 62 792
TOTAL EXPENDITURES .................................................................. 730 2,156 2,886
EXCESS OF REVENUES OVER EXPENDITURES .......................... 8,242 2,297 10,539
OTHER FINANCING SOURCES (USES)Transfers from Proprietary Funds ................................................................ 8 4 12 Transfers to Other Funds ............................................................................ (7,815) (1,678) (9,493)
NET CHANGE IN FUND BALANCES ………………………………… 435 623 1,058
Fund Balances at Beginning of Year ................................................................ 3,425 1,519 4,944
FUND BALANCES AT END OF YEAR ........................................................... $ 3,860 $ 2,142 $ 6,002
Total
Total
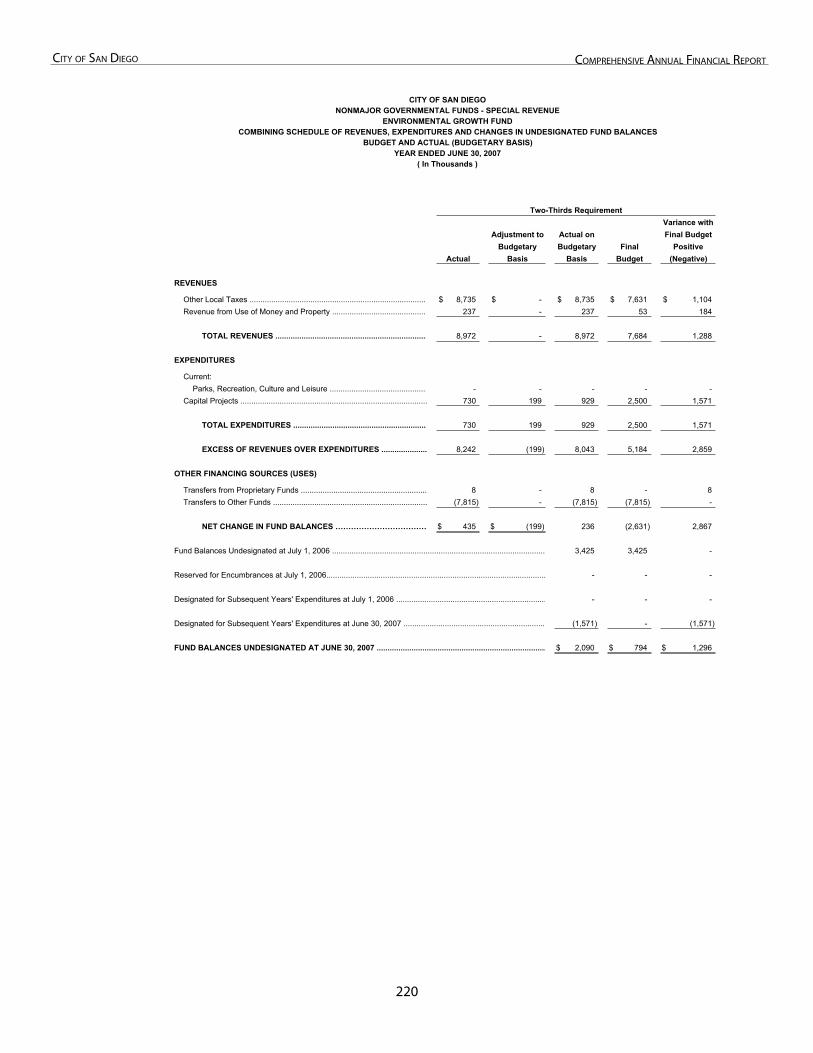
220
City of San Diego ComprehenSive annual finanCial report
CITY OF SAN DIEGONONMAJOR GOVERNMENTAL FUNDS - SPECIAL REVENUE
ENVIRONMENTAL GROWTH FUNDCOMBINING SCHEDULE OF REVENUES, EXPENDITURES AND CHANGES IN UNDESIGNATED FUND BALANCES
BUDGET AND ACTUAL (BUDGETARY BASIS)YEAR ENDED JUNE 30, 2007
( In Thousands )
REVENUES
Other Local Taxes .................................................................................. $ 8,735 $ - $ 8,735 $ 7,631 $ 1,104 Revenue from Use of Money and Property ............................................ 237 - 237 53 184
TOTAL REVENUES ...................................................................... 8,972 - 8,972 7,684 1,288
EXPENDITURES
Current:Parks, Recreation, Culture and Leisure ............................................. - - - - -
Capital Projects ...................................................................................... 730 199 929 2,500 1,571
TOTAL EXPENDITURES .............................................................. 730 199 929 2,500 1,571
EXCESS OF REVENUES OVER EXPENDITURES ..................... 8,242 (199) 8,043 5,184 2,859
OTHER FINANCING SOURCES (USES)
Transfers from Proprietary Funds .......................................................... 8 - 8 - 8 Transfers to Other Funds ....................................................................... (7,815) - (7,815) (7,815) -
NET CHANGE IN FUND BALANCES ……………………………… $ 435 $ (199) 236 (2,631) 2,867
Fund Balances Undesignated at July 1, 2006 .................................................................................................. 3,425 3,425 -
Reserved for Encumbrances at July 1, 2006..................................................................................................... - - -
Designated for Subsequent Years' Expenditures at July 1, 2006 ..................................................................... - - -
Designated for Subsequent Years' Expenditures at June 30, 2007 ................................................................. (1,571) - (1,571)
FUND BALANCES UNDESIGNATED AT JUNE 30, 2007 .............................................................................. $ 2,090 $ 794 $ 1,296
Basis Budget
Final Budget
(Negative)Final Positive
Two-Thirds Requirement
Actual
Adjustment toBudgetary
Basis
Actual onBudgetary
Variance with
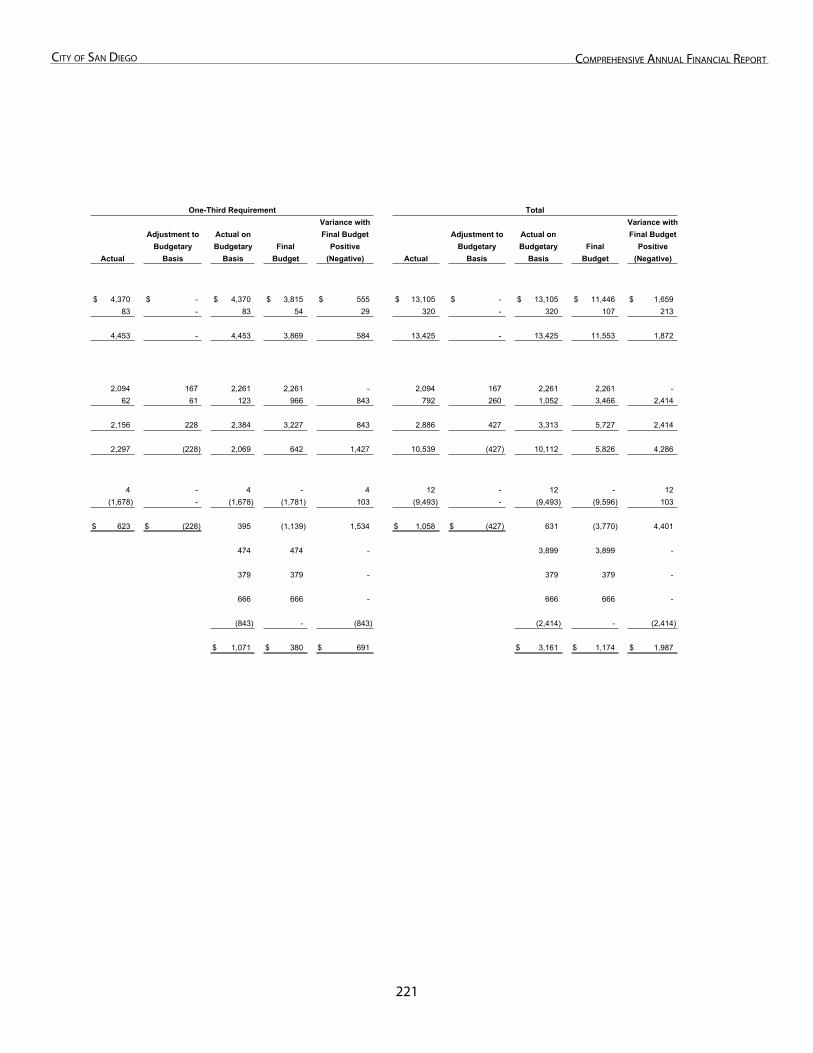
221
City of San Diego ComprehenSive annual finanCial report
Variance withFinal Budget
Final PositiveBudget (Negative)
$ 4,370 $ - $ 4,370 $ 3,815 $ 555 $ 13,105 $ - $ 13,105 $ 11,446 $ 1,659 83 - 83 54 29 320 - 320 107 213
4,453 - 4,453 3,869 584 13,425 - 13,425 11,553 1,872
2,094 167 2,261 2,261 - 2,094 167 2,261 2,261 - 62 61 123 966 843 792 260 1,052 3,466 2,414
2,156 228 2,384 3,227 843 2,886 427 3,313 5,727 2,414
2,297 (228) 2,069 642 1,427 10,539 (427) 10,112 5,826 4,286
4 - 4 - 4 12 - 12 - 12 (1,678) - (1,678) (1,781) 103 (9,493) - (9,493) (9,596) 103
$ 623 $ (228) 395 (1,139) 1,534 $ 1,058 $ (427) 631 (3,770) 4,401
474 474 - 3,899 3,899 -
379 379 - 379 379 -
666 666 - 666 666 -
(843) - (843) (2,414) - (2,414)
$ 1,071 $ 380 $ 691 $ 3,161 $ 1,174 $ 1,987
Actual onBudgetary
Basis
Adjustment toBudgetary
BasisBasis Budget (Negative) ActualActual
Adjustment toBudgetary
Basis
One-Third Requirement TotalVariance withFinal Budget
PositiveFinalActual onBudgetary

This Page Left Intentionally Blank
222
non-major governmental funDS - DeBt ServiCe
Debt Service

This Page Left Intentionally Blank - Back of Divider Page
22�
City of San Diego ComprehenSive annual finanCial report
DEBT SERVICE FUNDS
Debt service funds are used to account for the accumulation of resources for, and the payment of, general long-term debt principal, interest, and related costs.
CITY OF SAN DIEGO
PUBLIC SAFETY COMMUNICATIONS PROJECT
This fund was established to account for the payment of principal and interest on general obligation bonds issued in 1991. These bonds are serviced by property taxes.
OTHER SPECIAL ASSESSMENTS
This fund was established to account for the payment of principal and interest for bonds issued under the Improvement Bond Act of 1915 and the Mello-Roos Community Facilities Act of 1982. These bonds are serviced by assessments and special taxes levied on property owners within each district.
BLENDED COMPONENT UNITS
CITY OF SAN DIEGO METROPOLITAN TRANSIT DEVELOPMENT BOARD AUTHORITY
This fund was established to account for the debt service activities of the City of San Diego Metropolitan Transit Development Board Authority (MTDB). MTDB was created to acquire and construct mass public transit guideways, systems and related facilities. MTDB’s debt service fund is used to account for the payment of long-term debt principal and interest. This fund isserviced by investment income, lease payments from the City of San Diego, and proceeds from lease revenue bonds and certificates of participation.
CONVENTION CENTER EXPANSION FINANCING AUTHORITY
This fund was established to account for the debt service activities of the Convention Center Expansion Financing Authority (CCEFA). CCEFA, created by the City of San Diego and the Port of San Diego, facilitates the financing, acquisition and construction of an expansion to the existing convention center. CCEFA’s debt service fund is used to account for the payment oflong-term debt principal and interest.
PUBLIC FACILITIES FINANCING AUTHORITY
This fund was established to account for the debt service activities of the Public Facilities Financing Authority (PFFA). PFFA,which was created by the City of San Diego and RDA, facilitates the financing, acquisition and construction of public capital facility improvements of RDA or the City. PFFA’s debt service fund is used to account for the payment of long-term debt principal and interest.
REDEVELOPMENT AGENCY
This fund was established to account for the debt service activities of the Redevelopment Agency of the City of San Diego (RDA). RDA was established to provide a method for revitalizing deteriorated and blighted areas of the City of San Diego. Thisfund is serviced by property tax increments, sale of real estate, and investment income.
SAN DIEGO FACILITIES AND EQUIPMENT LEASING CORPORATION
This fund was established to account for the debt service activities of the San Diego Facilities and Equipment Leasing Corporation (SDFELC). SDFELC was established to acquire and lease to the City of San Diego real and personal property to be used in the municipal operations of the City. The City makes lease payments from annual appropriations payable out of any source of legally available funds.
22�
City of San Diego ComprehenSive annual finanCial report
SAN DIEGO OPEN SPACE PARK FACILITIES DISTRICT #1
This fund was established for the purpose of acquiring open space properties to implement the Open Space element of the City of San Diego General Plan, and accounts for financial resources accumulated for the payment of long-term debt principal and interest. This fund is serviced by City contributions and investment income.
TOBACCO SETTLEMENT REVENUE FUNDING CORPORATION
This fund was established to account for the debt service activities of the Tobacco Settlement Revenue Funding Corporation (TSRFC). The TSRFC was established for the purpose of acquiring the tobacco settlement revenues allocated to the City from the State of California, pursuant to the Master Settlement Agreement. The TSRFC’s debt service fund is used to account for thepayment of long-term debt principal and interest.
This Page Left Intentionally Blank
227
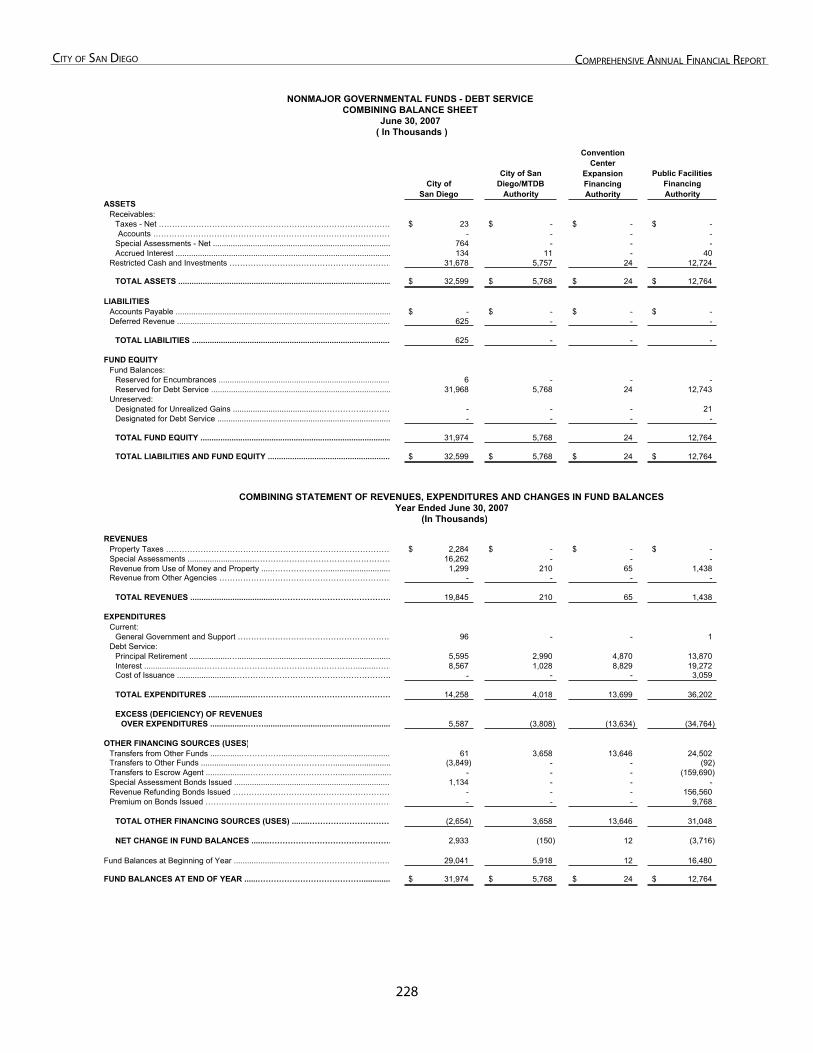
228
City of San Diego ComprehenSive annual finanCial report
NONMAJOR GOVERNMENTAL FUNDS - DEBT SERVICECOMBINING BALANCE SHEET
June 30, 2007( In Thousands )
City ofSan Diego
City of San Diego/MTDB
Authority
Public Facilities FinancingAuthority
ASSETSReceivables:
Taxes - Net …………………………………………………………………………… 23$ -$ -$ -$ Accounts ……………………………………………………………………………… - - - -
Special Assessments - Net ................................................................................ 764 - - - Accrued Interest ................................................................................................. 134 11 - 40
Restricted Cash and Investments ……………………………………………………… 31,678 5,757 24 12,724
TOTAL ASSETS ................................................................................................ 32,599$ 5,768$ 24$ 12,764$
LIABILITIESAccounts Payable ................................................................................................. -$ -$ -$ -$ Deferred Revenue ................................................................................................ 625 - - -
TOTAL LIABILITIES .......................................................................................... 625 - - -
FUND EQUITYFund Balances:
Reserved for Encumbrances .............................................................................. 6 - - - Reserved for Debt Service ................................................................................. 31,968 5,768 24 12,743
Unreserved:Designated for Unrealized Gains ........................................……………..……… - - - 21 Designated for Debt Service .............................................................................. - - - -
TOTAL FUND EQUITY ...................................................................................... 31,974 5,768 24 12,764
TOTAL LIABILITIES AND FUND EQUITY ........................................................ 32,599$ 5,768$ 24$ 12,764$
COMBINING STATEMENT OF REVENUES, EXPENDITURES AND CHANGES IN FUND BALANCESYear Ended June 30, 2007
(In Thousands)
REVENUESProperty Taxes …………………………………………………………………………… 2,284$ -$ -$ -$ Special Assessments .............................……………………………………………… 16,262 - - - Revenue from Use of Money and Property .....…………………............................ 1,299 210 65 1,438 Revenue from Other Agencies ………………………………………………………… - - - -
TOTAL REVENUES .......................................……………………………………… 19,845 210 65 1,438
EXPENDITURESCurrent:
General Government and Support …………………………………………………… 96 - - 1 Debt Service:
Principal Retirement ..................…..................................................................... 5,595 2,990 4,870 13,870 Interest ...........................………………………………………………….........…… 8,567 1,028 8,829 19,272 Cost of Issuance ...........................…………………………………………………. - - - 3,059
TOTAL EXPENDITURES .....................…………………………………………… 14,258 4,018 13,699 36,202
EXCESS (DEFICIENCY) OF REVENUESOVER EXPENDITURES .................……......................................................... 5,587 (3,808) (13,634) (34,764)
OTHER FINANCING SOURCES (USES)Transfers from Other Funds ..............……………................................................. 61 3,658 13,646 24,502 Transfers to Other Funds ....................…………………………….......................... (3,849) - - (92)Transfers to Escrow Agent ....................……………………………........................ - - - (159,690)Special Assessment Bonds Issued ....................................................................... 1,134 - - -Revenue Refunding Bonds Issued …………………………………………………… - - - 156,560Premium on Bonds Issued ……………………………………………………………… - - - 9,768
TOTAL OTHER FINANCING SOURCES (USES) ........…………………………… (2,654) 3,658 13,646 31,048
NET CHANGE IN FUND BALANCES ........………………………………………. 2,933 (150) 12 (3,716)
Fund Balances at Beginning of Year .........................………………………………... 29,041 5,918 12 16,480
FUND BALANCES AT END OF YEAR ......…………………………………............. 31,974$ 5,768$ 24$ 12,764$
ConventionCenter
ExpansionFinancingAuthority
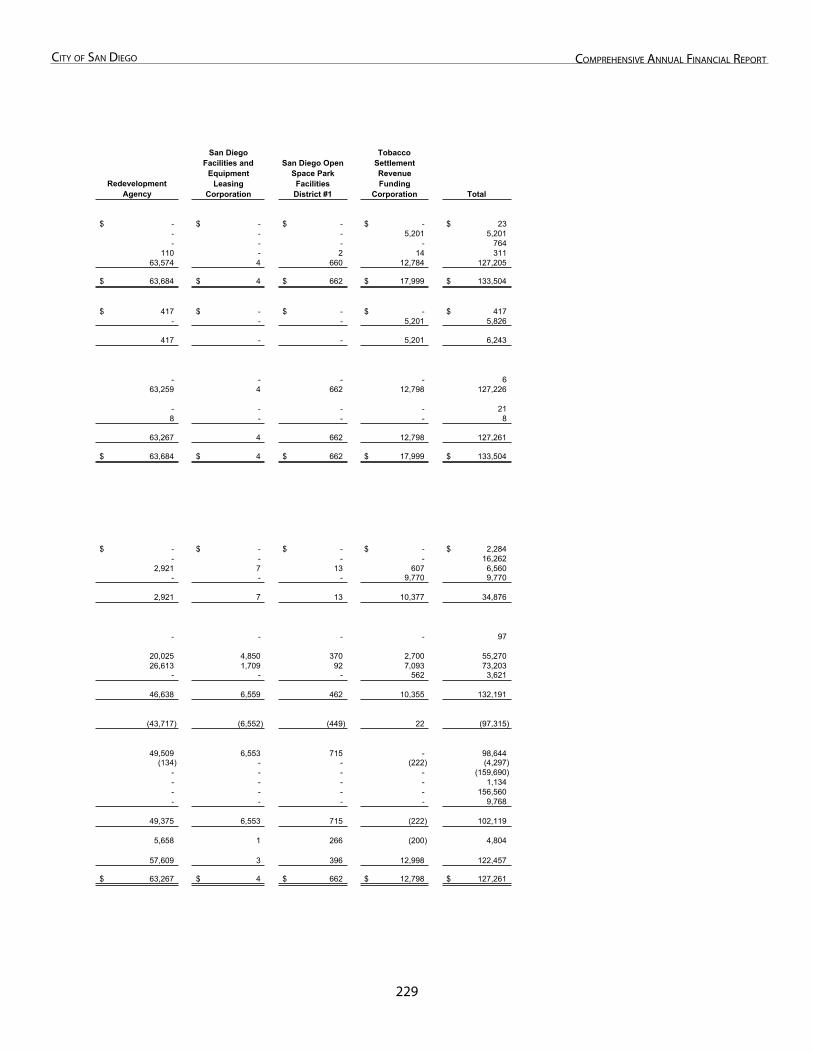
22�
City of San Diego ComprehenSive annual finanCial report
RedevelopmentAgency Total
-$ -$ -$ -$ 23$ - - - 5,201 5,201 - - - - 764
110 - 2 14 311 63,574 4 660 12,784 127,205
63,684$ 4$ 662$ 17,999$ 133,504$
417$ -$ -$ -$ 417$ - - - 5,201 5,826
417 - - 5,201 6,243
- - - - 6 63,259 4 662 12,798 127,226
- - - - 21 8 - - - 8
63,267 4 662 12,798 127,261
63,684$ 4$ 662$ 17,999$ 133,504$
-$ -$ -$ -$ 2,284$ - - - - 16,262
2,921 7 13 607 6,560 - - - 9,770 9,770
2,921 7 13 10,377 34,876
- - - - 97
20,025 4,850 370 2,700 55,270 26,613 1,709 92 7,093 73,203
- - - 562 3,621
46,638 6,559 462 10,355 132,191
(43,717) (6,552) (449) 22 (97,315)
49,509 6,553 715 - 98,644 (134) - - (222) (4,297)
- - - - (159,690)- - - - 1,134- - - - 156,560- - - - 9,768
49,375 6,553 715 (222) 102,119
5,658 1 266 (200) 4,804
57,609 3 396 12,998 122,457
63,267$ 4$ 662$ 12,798$ 127,261$
San Diego Open Space Park Facilities
District #1
San DiegoFacilities and
EquipmentLeasing
Corporation
TobaccoSettlementRevenueFunding
Corporation
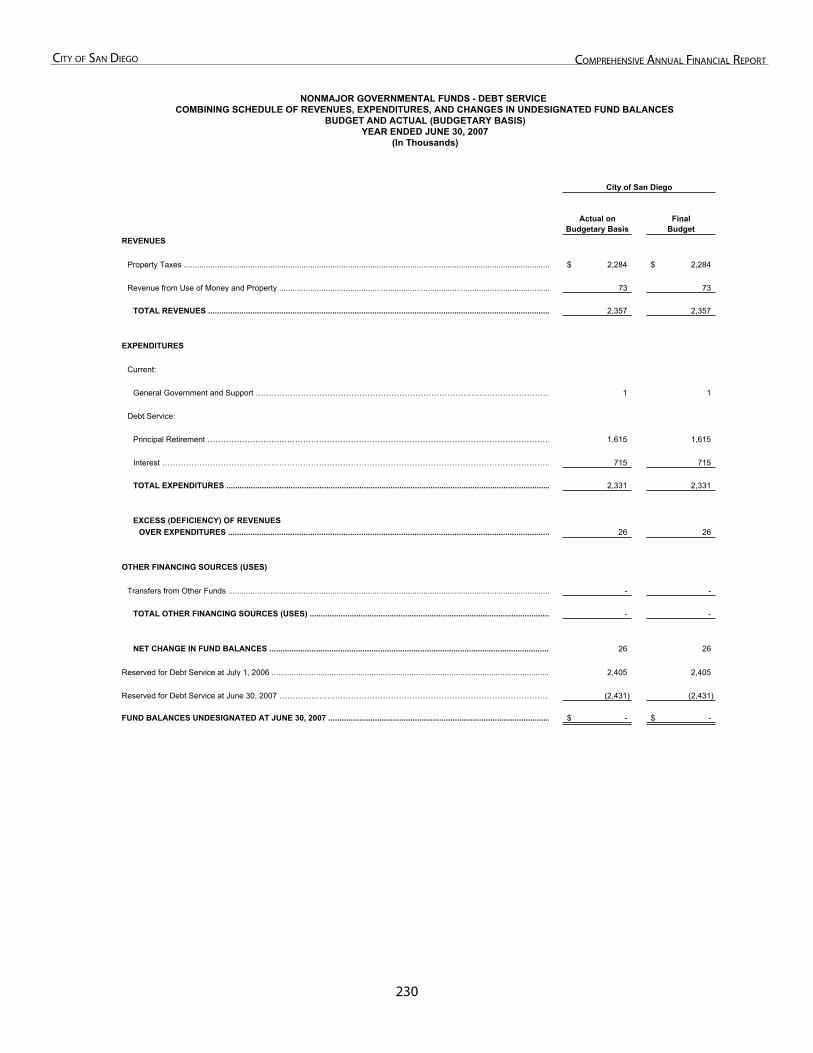
230
City of San Diego ComprehenSive annual finanCial report
.
…
…
…
.
…
NONMAJOR GOVERNMENTAL FUNDS - DEBT SERVICE COMBINING SCHEDULE OF REVENUES, EXPENDITURES, AND CHANGES IN UNDESIGNATED FUND BALANCES
BUDGET AND ACTUAL (BUDGETARY BASIS)YEAR ENDED JUNE 30, 2007
(In Thousands)
City of San Diego
Actual on Budgetary Basis
FinalBudget
REVENUES
Property Taxes ..................................................................................................................................................................... 2,284$ 2,284$
Revenue from Use of Money and Property .......................................................................................................................... 73 73
TOTAL REVENUES ......................................................................................................................................................... 2,357 2,357
EXPENDITURES
Current:
General Government and Support ……………………………………………………………………………………………… 1 1
Debt Service:
Principal Retirement ……………………………………………………………………………………………………………… 1,615 1,615
Interest ……………………………………………………………………………………………………………………………… 715 715
TOTAL EXPENDITURES .................................................................................................................................................. 2,331 2,331
EXCESS (DEFICIENCY) OF REVENUES OVER EXPENDITURES ................................................................................................................................................ 26 26
OTHER FINANCING SOURCES (USES)
Transfers from Other Funds ................................................................................................................................................. - -
TOTAL OTHER FINANCING SOURCES (USES) ............................................................................................................ - -
NET CHANGE IN FUND BALANCES .............................................................................................................................. 26 26
Reserved for Debt Service at July 1, 2006 ............................................................................................................................. 2,405 2,405
Reserved for Debt Service at June 30, 2007 ……………………………………………………………………………………… (2,431) (2,431)
FUND BALANCES UNDESIGNATED AT JUNE 30, 2007 .................................................................................................... -$ -$
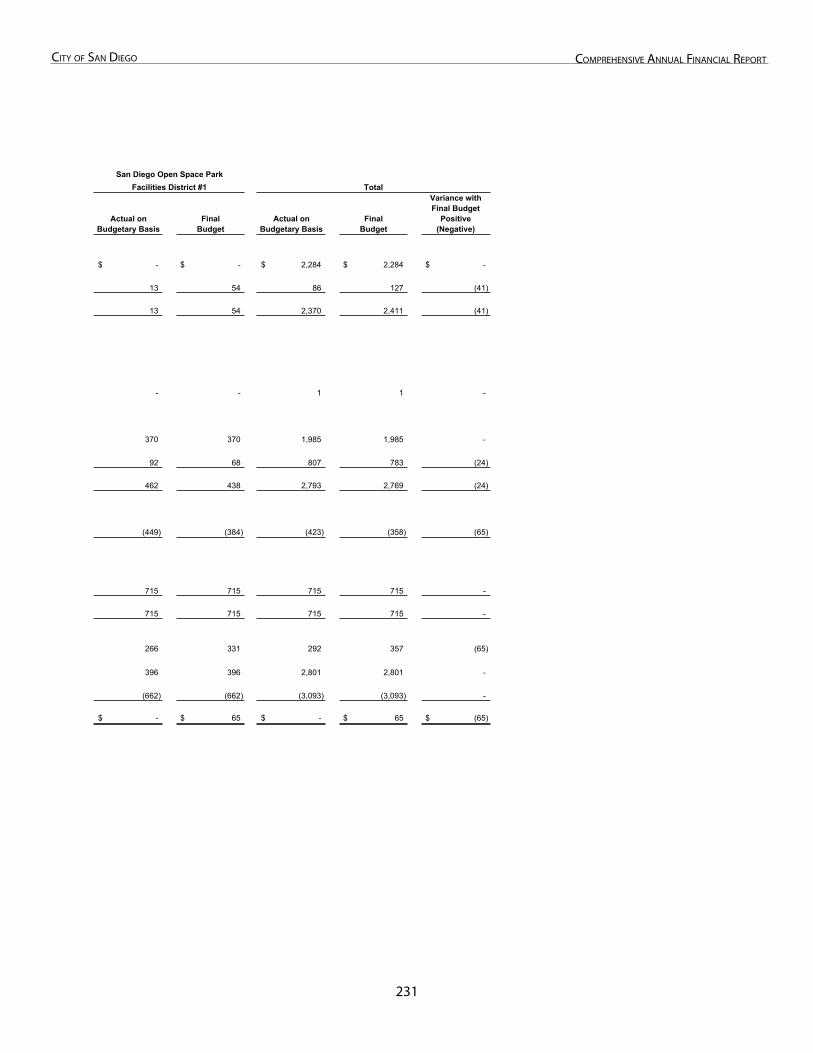
231
City of San Diego ComprehenSive annual finanCial report
San Diego Open Space ParkFacilities District #1 Total
Actual on Budgetary Basis
FinalBudget
Actual on Budgetary Basis
FinalBudget
Variance with Final Budget
Positive(Negative)
-$ -$ 2,284$ 2,284$ -$
13 54 86 127 (41)
13 54 2,370 2,411 (41)
- - 1 1 -
370 370 1,985 1,985 -
92 68 807 783 (24)
462 438 2,793 2,769 (24)
(449) (384) (423) (358) (65)
715 715 715 715 -
715 715 715 715 -
266 331 292 357 (65)
396 396 2,801 2,801 -
(662) (662) (3,093) (3,093) -
-$ 65$ -$ 65$ (65)$
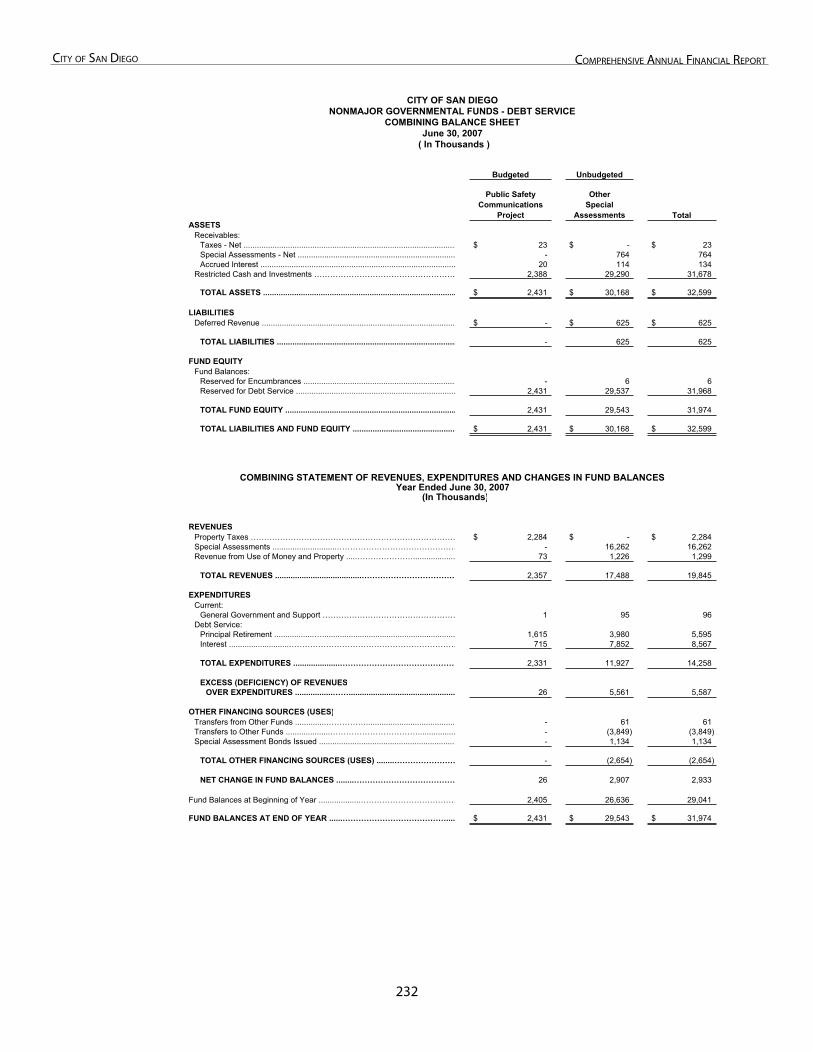
232
City of San Diego ComprehenSive annual finanCial report
Budgeted Unbudgeted
Public Safety Communications
Project
OtherSpecial
Assessments TotalASSETS
Receivables: Taxes - Net ................................................................................................ 23$ -$ 23$ Special Assessments - Net ....................................................................... - 764 764 Accrued Interest ........................................................................................ 20 114 134
Restricted Cash and Investments ……………………………………………… 2,388 29,290 31,678
TOTAL ASSETS ....................................................................................... 2,431$ 30,168$ 32,599$
LIABILITIESDeferred Revenue ....................................................................................... -$ 625$ 625$
TOTAL LIABILITIES ................................................................................. - 625 625
FUND EQUITYFund Balances:
Reserved for Encumbrances ..................................................................... - 6 6 Reserved for Debt Service ........................................................................ 2,431 29,537 31,968
TOTAL FUND EQUITY ............................................................................. 2,431 29,543 31,974
TOTAL LIABILITIES AND FUND EQUITY ............................................... 2,431$ 30,168$ 32,599$
REVENUESProperty Taxes …………………………………………………………………… 2,284$ -$ 2,284$ Special Assessments .............................……………………………………… - 16,262 16,262 Revenue from Use of Money and Property .....…………………................... 73 1,226 1,299
TOTAL REVENUES .......................................……………………………… 2,357 17,488 19,845
EXPENDITURESCurrent:
General Government and Support …………………………………………… 1 95 96 Debt Service:
Principal Retirement ..................…............................................................ 1,615 3,980 5,595 Interest ...........................……………………………………………………… 715 7,852 8,567
TOTAL EXPENDITURES .....................……………………………………… 2,331 11,927 14,258
EXCESS (DEFICIENCY) OF REVENUESOVER EXPENDITURES .................……................................................ 26 5,561 5,587
OTHER FINANCING SOURCES (USES)Transfers from Other Funds ..............……………........................................ - 61 61 Transfers to Other Funds ....................……………………………................. - (3,849) (3,849) Special Assessment Bonds Issued .............................................................. - 1,134 1,134
TOTAL OTHER FINANCING SOURCES (USES) ........…………………… - (2,654) (2,654)
NET CHANGE IN FUND BALANCES ........………………………………… 26 2,907 2,933
Fund Balances at Beginning of Year ...................……………………………… 2,405 26,636 29,041
FUND BALANCES AT END OF YEAR ......………………………………….... 2,431$ 29,543$ 31,974$
(In Thousands)
( In Thousands )
COMBINING STATEMENT OF REVENUES, EXPENDITURES AND CHANGES IN FUND BALANCESYear Ended June 30, 2007
CITY OF SAN DIEGO
COMBINING BALANCE SHEETJune 30, 2007
NONMAJOR GOVERNMENTAL FUNDS - DEBT SERVICE
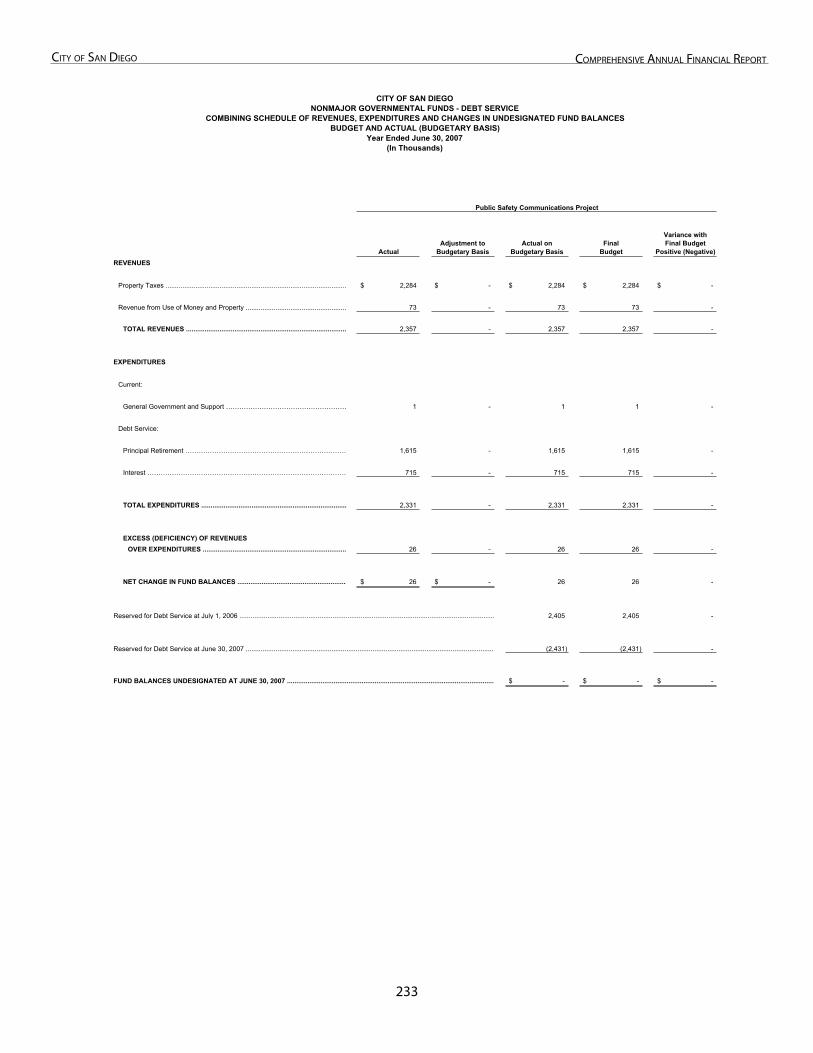
233
City of San Diego ComprehenSive annual finanCial report
ActualAdjustment to
Budgetary BasisActual on
Budgetary BasisFinal
Budget
Variance with Final Budget
Positive (Negative)REVENUES
Property Taxes ................................................................................................. 2,284$ -$ 2,284$ 2,284$ -$
Revenue from Use of Money and Property ...................................................... 73 - 73 73 -
TOTAL REVENUES ...................................................................................... 2,357 - 2,357 2,357 -
EXPENDITURES
Current:
General Government and Support ……………………………………………… 1 - 1 1 -
Debt Service:
Principal Retirement ……………………………………………………………… 1,615 - 1,615 1,615 -
Interest ……………………………………………………………………………… 715 - 715 715 -
TOTAL EXPENDITURES .............................................................................. 2,331 - 2,331 2,331 -
EXCESS (DEFICIENCY) OF REVENUES OVER EXPENDITURES ............................................................................. 26 - 26 26 -
NET CHANGE IN FUND BALANCES ........................................................... 26$ -$ 26 26 -
Reserved for Debt Service at July 1, 2006 ......................................................................................................................................... 2,405 2,405 -
Reserved for Debt Service at June 30, 2007 ..................................................................................................................................... (2,431) (2,431) -
FUND BALANCES UNDESIGNATED AT JUNE 30, 2007 ............................................................................................................... -$ -$ -$
CITY OF SAN DIEGONONMAJOR GOVERNMENTAL FUNDS - DEBT SERVICE
BUDGET AND ACTUAL (BUDGETARY BASIS)Year Ended June 30, 2007
(In Thousands)
Public Safety Communications Project
COMBINING SCHEDULE OF REVENUES, EXPENDITURES AND CHANGES IN UNDESIGNATED FUND BALANCES
This Page Left Intentionally Blank
23�
non-major governmental funDS - Capital projeCtS
Capital Projects

This Page Left Intentionally Blank - Back of Divider Page
237
City of San Diego ComprehenSive annual finanCial report
CAPITAL PROJECTS FUNDS
Capital projects funds are used to account for financial resources to be used for the acquisition or construction of major capitalfacilities (other than those financed by proprietary funds and fiduciary funds).
CITY OF SAN DIEGO
CAPITAL OUTLAY
This fund was established per Section 77 of the City Charter to account for the acquisition, construction and completion of permanent public improvements and real property. Capital outlay fund revenues are derived from the sale of City-owned real property supplemented by sales tax revenue.
PARK & RECREATION DISTRICTS
This fund was established to account for park fees collected at the time of subdivision or permit issuance and is mandated per the City of San Diego Municipal Code. Fee assessments are only to be used for park purposes within a Community Park Service District to purchase land, facilities, or reimburse those who have donated more than their proportionate responsibilities.
FACILITIES BENEFIT ASSESSMENTS
This fund was established to account for building permit fees collected at the time of permit issuance and is mandated by the City Charter. Fee assessments are only to be used in the community the assessments are collected and are the primary source of project funding, excluding maintenance costs.
IMPACT FEES
This fund was established to account for building permit fees collected at the time of permit issuance and has specific State reporting requirements. Fee assessments are only to be used in the community the assessments are collected and are not the primary source of project funding and exclude maintenance costs.
SPECIAL ASSESSMENT/SPECIAL TAX BONDS
This fund was established to account for Community Facilities Districts and Special Assessment Districts, which under various sections of State law, issues limited obligation bonds to finance infrastructure facilities and other public improvements necessary to facilitate development of the properties within each district. The bonds are secured solely by the properties within each district, and are repaid through revenues generated by the annual levy of special taxes or special assessments on the benefiting properties.
TRANSNET
This fund was established to account for transportation improvements funded by a local sales tax approved by voters in the County of San Diego. Funds are to help relieve traffic congestion, increase safety, and improve air quality by performing repairs,restorations, and construction of needed facilities within the public rights-of-way.
238
City of San Diego ComprehenSive annual finanCial report
OTHER CONSTRUCTION
This fund was established to account for a variety of capital projects such as park and street improvements and construction ofpublic facilities in new development areas. Revenues in this fund are derived from such sources as contributions from developers, grants from Federal, State and other governmental agencies, special assessments, special taxes, fees, and interest derived there from.
BLENDED COMPONENT UNITS
PUBLIC FACILITIES FINANCING AUTHORITY
This fund was established to account for the capital improvement acquisition and construction activities of the Public FacilitiesFinancing Authority (PFFA). PFFA, which was created by the City of San Diego and RDA, facilitates the financing and construction of public capital improvements of the City or RDA. Revenues are derived from the issuance of bonds and interest earnings on investments.
REDEVELOPMENT AGENCY
This fund was established to account for the capital improvement activities of the Redevelopment Agency of the City of San Diego (RDA). RDA was established to provide a method for revitalizing deteriorated and blighted areas of the City of San Diego.Funds are derived from the City of San Diego, from the issuance of bonds for specific redevelopment projects, sale of real estateand investment income.
SAN DIEGO FACILITIES AND EQUIPMENT LEASING CORPORATION
This fund was established to account for the capital improvement activities of the San Diego Facilities and Equipment Leasing Corporation (SDFELC). SDFELC was established to acquire and lease to the City of San Diego real and personal property to be used in the municipal operations of the City. This fund accounts for proceeds from the issuance of Certificates of Participation used to finance construction projects in Balboa and Mission Bay parks.

This Page Left Intentionally Blank
23�
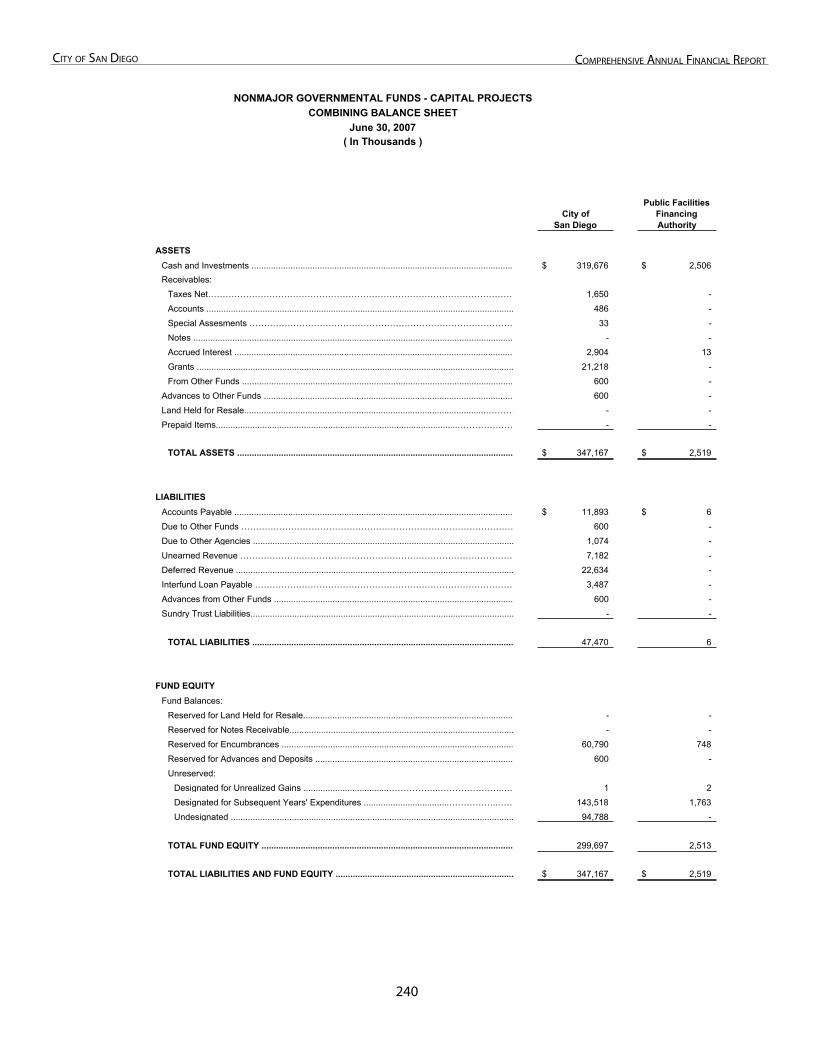
2�0
City of San Diego ComprehenSive annual finanCial report
NONMAJOR GOVERNMENTAL FUNDS - CAPITAL PROJECTSCOMBINING BALANCE SHEET
June 30, 2007( In Thousands )
City ofSan Diego
Public Facilities FinancingAuthority
ASSETSCash and Investments ............................................................................................................ 319,676$ 2,506$ Receivables:
Taxes Net…………………………………………………………………………………………… 1,650 - Accounts .............................................................................................................................. 486 - Special Assesments ……………………………………………………………………………… 33 - Notes ................................................................................................................................... - - Accrued Interest ................................................................................................................... 2,904 13 Grants .................................................................................................................................. 21,218 - From Other Funds ............................................................................................................... 600 -
Advances to Other Funds ....................................................................................................... 600 - Land Held for Resale...................................................................................................………… - - Prepaid Items...................................................................................................………………… - -
TOTAL ASSETS .................................................................................................................. 347,167$ 2,519$
LIABILITIESAccounts Payable ................................................................................................................... 11,893$ 6$ Due to Other Funds ………………………………………………………………………………… 600 - Due to Other Agencies ........................................................................................................... 1,074 - Unearned Revenue …………………………………………………………………………………… 7,182 - Deferred Revenue .................................................................................................................. 22,634 - Interfund Loan Payable ……………………………………………………………………………… 3,487 - Advances from Other Funds .................................................................................................. 600 - Sundry Trust Liabilities............................................................................................................ - -
TOTAL LIABILITIES ........................................................................................................... 47,470 6
FUND EQUITYFund Balances:
Reserved for Land Held for Resale...................................................................................... - - Reserved for Notes Receivable............................................................................................ - - Reserved for Encumbrances ............................................................................................... 60,790 748 Reserved for Advances and Deposits ................................................................................. 600 - Unreserved:
Designated for Unrealized Gains ...................................……………..…………………..… 1 2 Designated for Subsequent Years' Expenditures ...................................……………..…… 143,518 1,763 Undesignated .................................................................................................................... 94,788 -
TOTAL FUND EQUITY ........................................................................................................ 299,697 2,513
TOTAL LIABILITIES AND FUND EQUITY ......................................................................... 347,167$ 2,519$
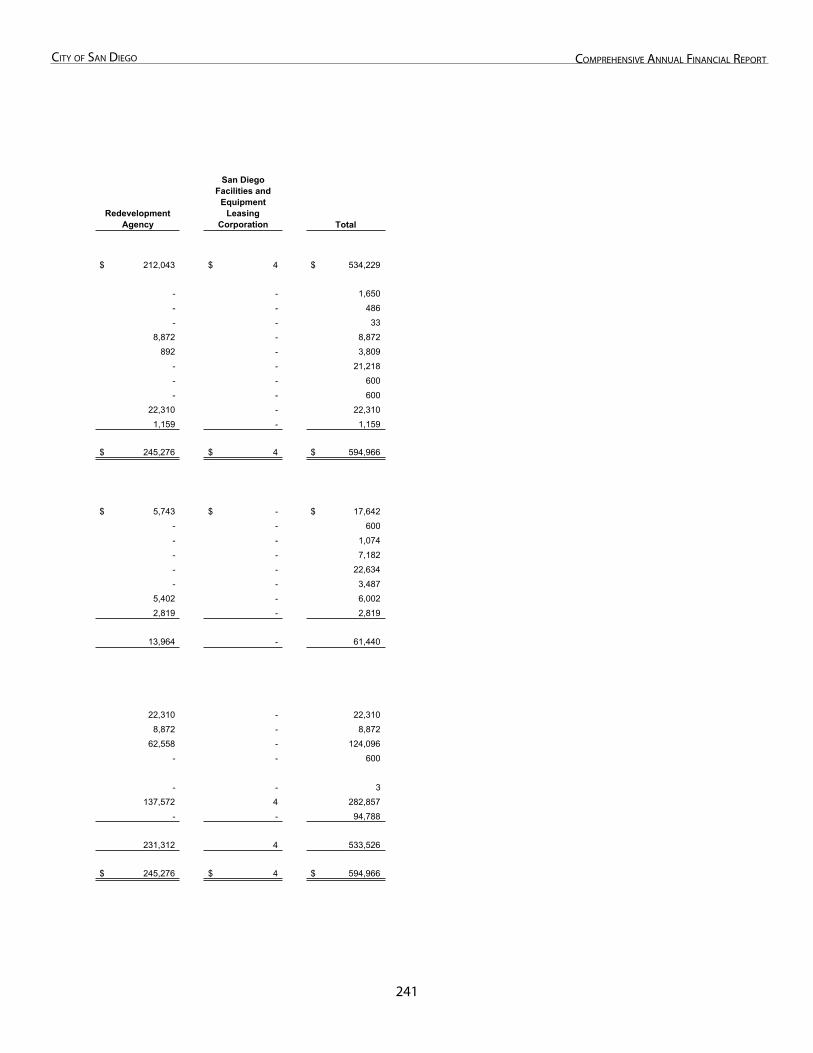
2�1
City of San Diego ComprehenSive annual finanCial report
RedevelopmentAgency
San Diego Facilities and
EquipmentLeasing
Corporation Total
212,043$ 4$ 534,229$
- - 1,650 - - 486 - - 33
8,872 - 8,872 892 - 3,809
- - 21,218 - - 600 - - 600
22,310 - 22,310 1,159 - 1,159
245,276$ 4$ 594,966$
5,743$ -$ 17,642$ - - 600 - - 1,074 - - 7,182 - - 22,634 - - 3,487
5,402 - 6,002 2,819 - 2,819
13,964 - 61,440
22,310 - 22,310 8,872 - 8,872
62,558 - 124,096 - - 600
- - 3 137,572 4 282,857
- - 94,788
231,312 4 533,526
245,276$ 4$ 594,966$
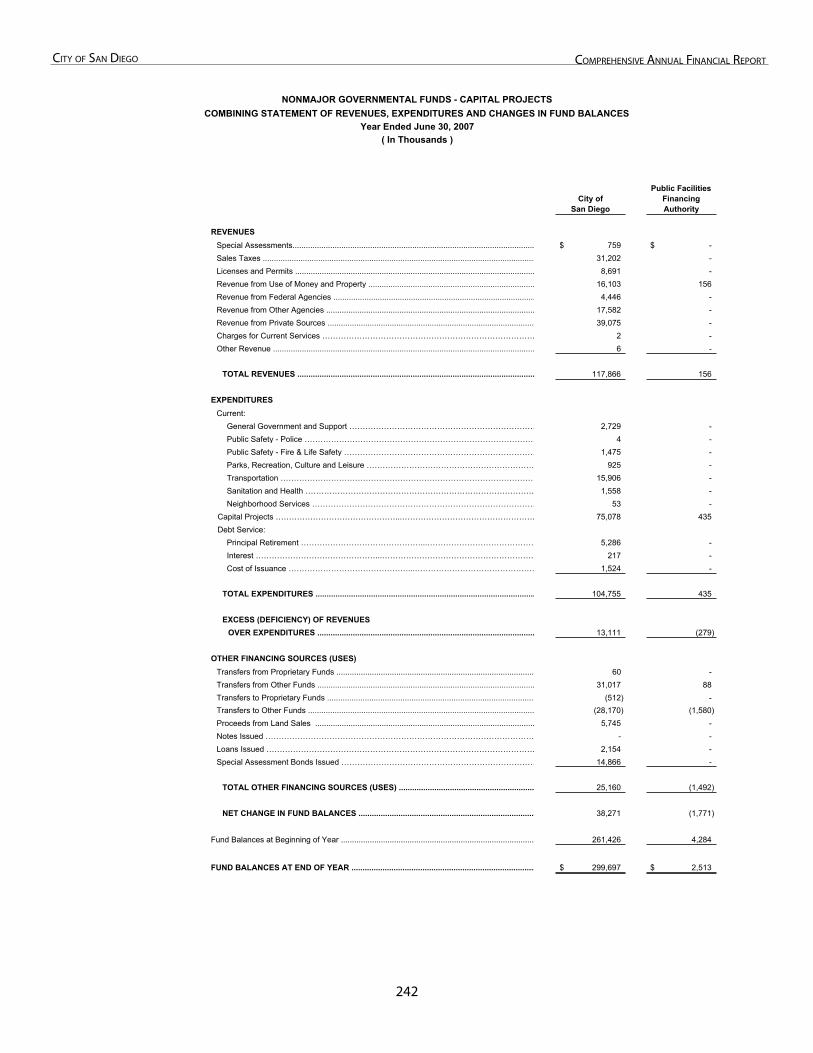
2�2
City of San Diego ComprehenSive annual finanCial report
NONMAJOR GOVERNMENTAL FUNDS - CAPITAL PROJECTSCOMBINING STATEMENT OF REVENUES, EXPENDITURES AND CHANGES IN FUND BALANCES
Year Ended June 30, 2007( In Thousands )
City ofSan Diego
Public Facilities FinancingAuthority
REVENUESSpecial Assessments............................................................................................................. 759$ -$ Sales Taxes ........................................................................................................................... 31,202 - Licenses and Permits ............................................................................................................ 8,691 - Revenue from Use of Money and Property ........................................................................... 16,103 156 Revenue from Federal Agencies ........................................................................................... 4,446 - Revenue from Other Agencies .............................................................................................. 17,582 - Revenue from Private Sources ............................................................................................. 39,075 - Charges for Current Services ……………………………………………………………………… 2 - Other Revenue ...................................................................................................................... 6 -
TOTAL REVENUES ........................................................................................................... 117,866 156
EXPENDITURESCurrent:
General Government and Support ……………………………………………………………… 2,729 - Public Safety - Police …………………………………………………………………………… 4 - Public Safety - Fire & Life Safety ……………………………………………………………… 1,475 - Parks, Recreation, Culture and Leisure ……………………………………………………… 925 - Transportation …………………………………………………………………………………… 15,906 - Sanitation and Health …………………………………………………………………………… 1,558 - Neighborhood Services ………………………………………………………………………… 53 -
Capital Projects ………………………………………...…………………………………………… 75,078 435 Debt Service:
Principal Retirement ………………………………………...…………………………………… 5,286 - Interest ………………………………………...………………………………………………… 217 - Cost of Issuance ………………………………………...……………………………………… 1,524 -
TOTAL EXPENDITURES ................................................................................................... 104,755 435
EXCESS (DEFICIENCY) OF REVENUESOVER EXPENDITURES .................................................................................................. 13,111 (279)
OTHER FINANCING SOURCES (USES)Transfers from Proprietary Funds ......................................................................................... 60 - Transfers from Other Funds .................................................................................................. 31,017 88 Transfers to Proprietary Funds .............................................................................................. (512) - Transfers to Other Funds ...................................................................................................... (28,170) (1,580) Proceeds from Land Sales ................................................................................................... 5,745 - Notes Issued ………………………………………………………………………………………… - - Loans Issued ………………………………………………………………………………………… 2,154 - Special Assessment Bonds Issued ………………………………………………………………… 14,866 -
TOTAL OTHER FINANCING SOURCES (USES) ............................................................. 25,160 (1,492)
NET CHANGE IN FUND BALANCES ................................................................................ 38,271 (1,771)
Fund Balances at Beginning of Year ....................................................................................... 261,426 4,284
FUND BALANCES AT END OF YEAR ................................................................................... 299,697$ 2,513$
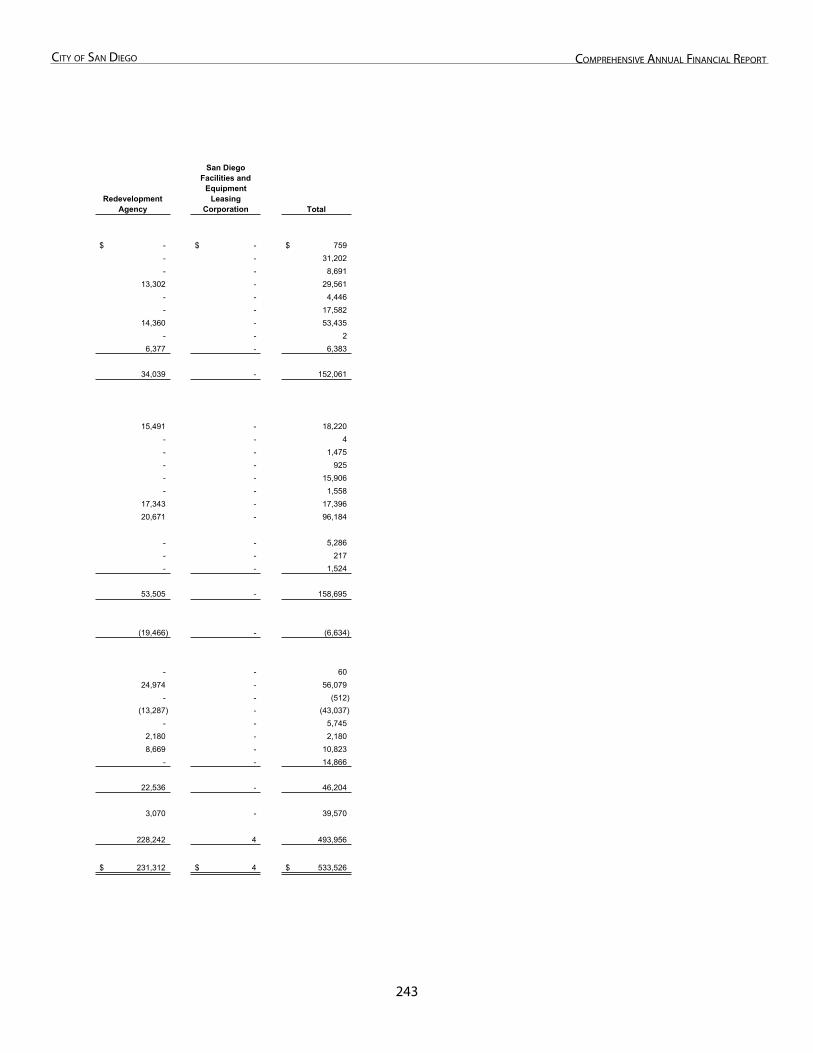
2�3
City of San Diego ComprehenSive annual finanCial report
RedevelopmentAgency
San Diego Facilities and
EquipmentLeasing
Corporation Total
-$ -$ 759$ - - 31,202 - - 8,691
13,302 - 29,561 - - 4,446 - - 17,582
14,360 - 53,435 - - 2
6,377 - 6,383
34,039 - 152,061
15,491 - 18,220 - - 4 - - 1,475 - - 925 - - 15,906 - - 1,558
17,343 - 17,396 20,671 - 96,184
- - 5,286 - - 217 - - 1,524
53,505 - 158,695
(19,466) - (6,634)
- - 60 24,974 - 56,079
- - (512) (13,287) - (43,037)
- - 5,745 2,180 - 2,180 8,669 - 10,823
- - 14,866
22,536 - 46,204
3,070 - 39,570
228,242 4 493,956
231,312$ 4$ 533,526$
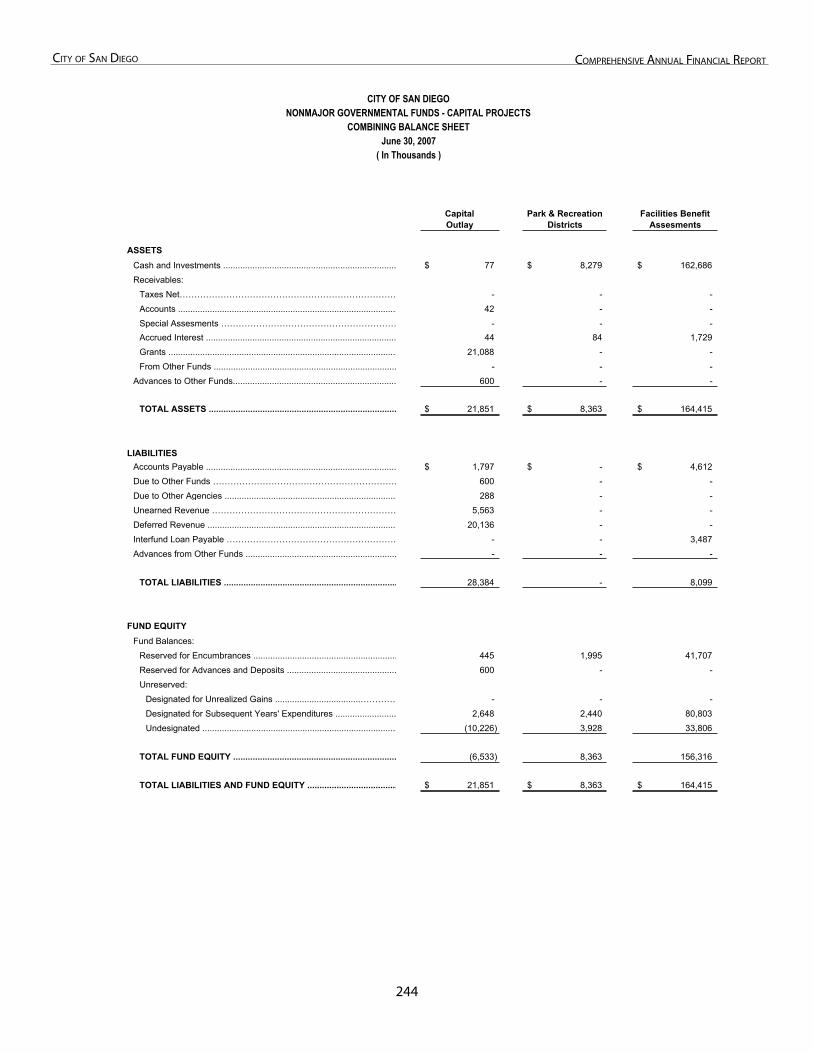
2��
City of San Diego ComprehenSive annual finanCial report
CapitalOutlay
Park & Recreation Districts
Facilities Benefit Assesments
ASSETSCash and Investments ....................................................................... 77$ 8,279$ 162,686$ Receivables:
Taxes Net………………………………………………………………… - - - Accounts .......................................................................................... 42 - - Special Assesments …………………………………………………… - - - Accrued Interest .............................................................................. 44 84 1,729 Grants .............................................................................................. 21,088 - - From Other Funds ........................................................................... - - -
Advances to Other Funds................................................................... 600 - -
TOTAL ASSETS ............................................................................. 21,851$ 8,363$ 164,415$
LIABILITIESAccounts Payable .............................................................................. 1,797$ -$ 4,612$ Due to Other Funds ……………………………………………………… 600 - - Due to Other Agencies ...................................................................... 288 - - Unearned Revenue ……………………………………………………… 5,563 - - Deferred Revenue ............................................................................. 20,136 - - Interfund Loan Payable …………………………………………………… - - 3,487 Advances from Other Funds .............................................................. - - -
TOTAL LIABILITIES ....................................................................... 28,384 - 8,099
FUND EQUITYFund Balances:
Reserved for Encumbrances ........................................................... 445 1,995 41,707 Reserved for Advances and Deposits ............................................. 600 - - Unreserved:
Designated for Unrealized Gains ...................................………… - - - Designated for Subsequent Years' Expenditures ......................... 2,648 2,440 80,803 Undesignated ................................................................................ (10,226) 3,928 33,806
TOTAL FUND EQUITY ................................................................... (6,533) 8,363 156,316
TOTAL LIABILITIES AND FUND EQUITY ..................................... 21,851$ 8,363$ 164,415$
( In Thousands )
CITY OF SAN DIEGONONMAJOR GOVERNMENTAL FUNDS - CAPITAL PROJECTS
COMBINING BALANCE SHEETJune 30, 2007
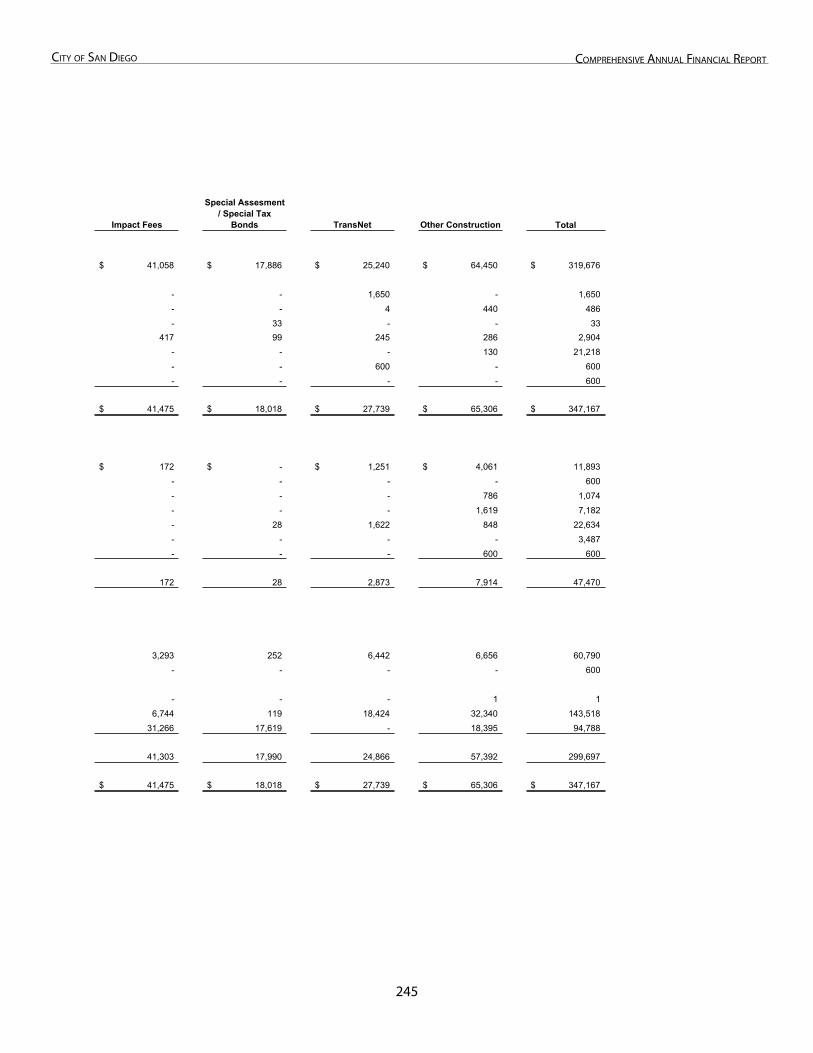
2��
City of San Diego ComprehenSive annual finanCial report
Impact Fees
Special Assesment / Special Tax
Bonds TransNet Other Construction Total
41,058$ 17,886$ 25,240$ 64,450$ 319,676$
- - 1,650 - 1,650 - - 4 440 486 - 33 - - 33
417 99 245 286 2,904 - - - 130 21,218 - - 600 - 600 - - - - 600
41,475$ 18,018$ 27,739$ 65,306$ 347,167$
172$ -$ 1,251$ 4,061$ 11,893 - - - - 600 - - - 786 1,074 - - - 1,619 7,182 - 28 1,622 848 22,634 - - - - 3,487 - - - 600 600
172 28 2,873 7,914 47,470
3,293 252 6,442 6,656 60,790 - - - - 600
- - - 1 1 6,744 119 18,424 32,340 143,518
31,266 17,619 - 18,395 94,788
41,303 17,990 24,866 57,392 299,697
41,475$ 18,018$ 27,739$ 65,306$ 347,167$
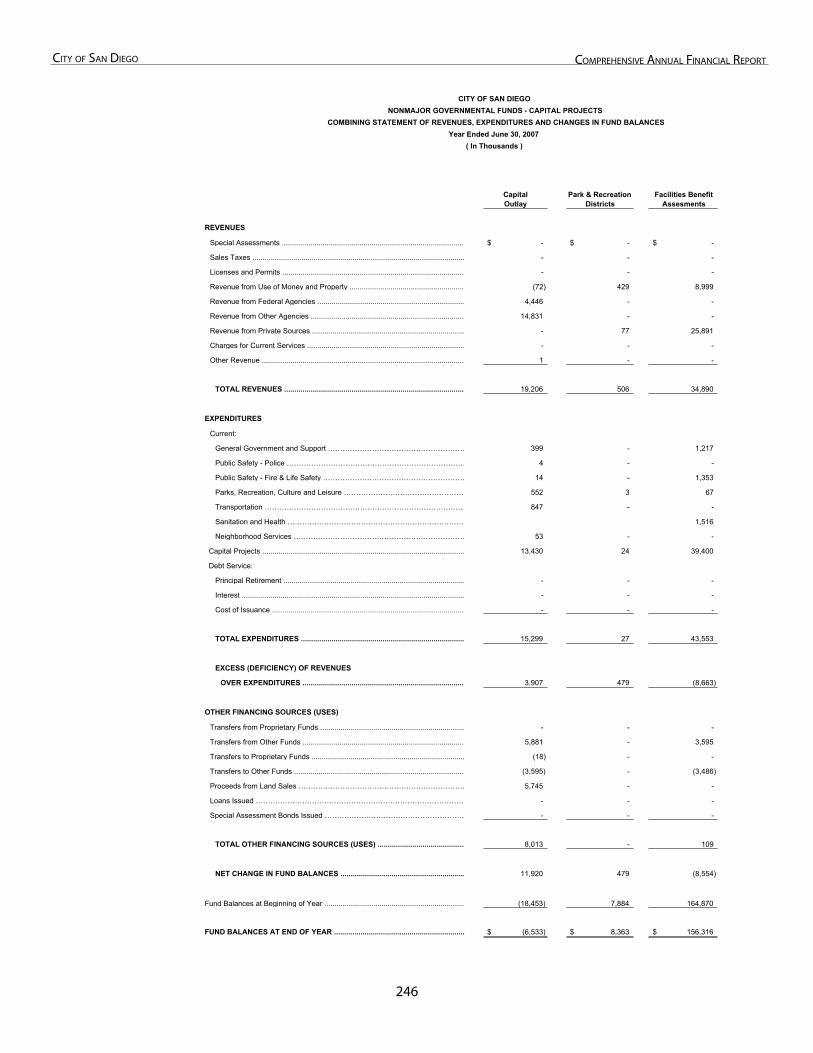
2��
City of San Diego ComprehenSive annual finanCial report
CapitalOutlay
Park & Recreation Districts
Facilities Benefit Assesments
REVENUES
Special Assessments .......................................................................................... -$ -$ -$
Sales Taxes ........................................................................................................ - - -
Licenses and Permits ......................................................................................... - - -
Revenue from Use of Money and Property ........................................................ (72) 429 8,999
Revenue from Federal Agencies ........................................................................ 4,446 - -
Revenue from Other Agencies ........................................................................... 14,831 - -
Revenue from Private Sources ........................................................................... - 77 25,891
Charges for Current Services ............................................................................. - - -
Other Revenue ................................................................................................... 1 - -
TOTAL REVENUES ........................................................................................ 19,206 506 34,890
EXPENDITURES
Current:
General Government and Support ………………………………………………… 399 - 1,217
Public Safety - Police ………………………………………………………………… 4 - -
Public Safety - Fire & Life Safety …………………………………………………… 14 - 1,353
Parks, Recreation, Culture and Leisure …………………………………………… 552 3 67
Transportation ………………………………………………………………………… 847 - -
Sanitation and Health ……………………………………………………………… 1,516
Neighborhood Services ……………………………………………………………… 53 - -
Capital Projects ................................................................................................... 13,430 24 39,400
Debt Service:
Principal Retirement ......................................................................................... - - -
Interest ............................................................................................................. - - -
Cost of Issuance .............................................................................................. - - -
TOTAL EXPENDITURES ................................................................................ 15,299 27 43,553
EXCESS (DEFICIENCY) OF REVENUES
OVER EXPENDITURES ............................................................................... 3,907 479 (8,663)
OTHER FINANCING SOURCES (USES)
Transfers from Proprietary Funds ....................................................................... - - -
Transfers from Other Funds ............................................................................... 5,881 - 3,595
Transfers to Proprietary Funds ........................................................................... (18) - -
Transfers to Other Funds .................................................................................... (3,595) - (3,486)
Proceeds from Land Sales …………………………………………………………… 5,745 - -
Loans Issued …………………………………………………………………………… - - -
Special Assessment Bonds Issued ………………………………………………… - - -
TOTAL OTHER FINANCING SOURCES (USES) ........................................... 8,013 - 109
NET CHANGE IN FUND BALANCES ............................................................. 11,920 479 (8,554)
Fund Balances at Beginning of Year ..................................................................... (18,453) 7,884 164,870
FUND BALANCES AT END OF YEAR ................................................................ (6,533)$ 8,363$ 156,316$
( In Thousands )
CITY OF SAN DIEGONONMAJOR GOVERNMENTAL FUNDS - CAPITAL PROJECTS
COMBINING STATEMENT OF REVENUES, EXPENDITURES AND CHANGES IN FUND BALANCESYear Ended June 30, 2007
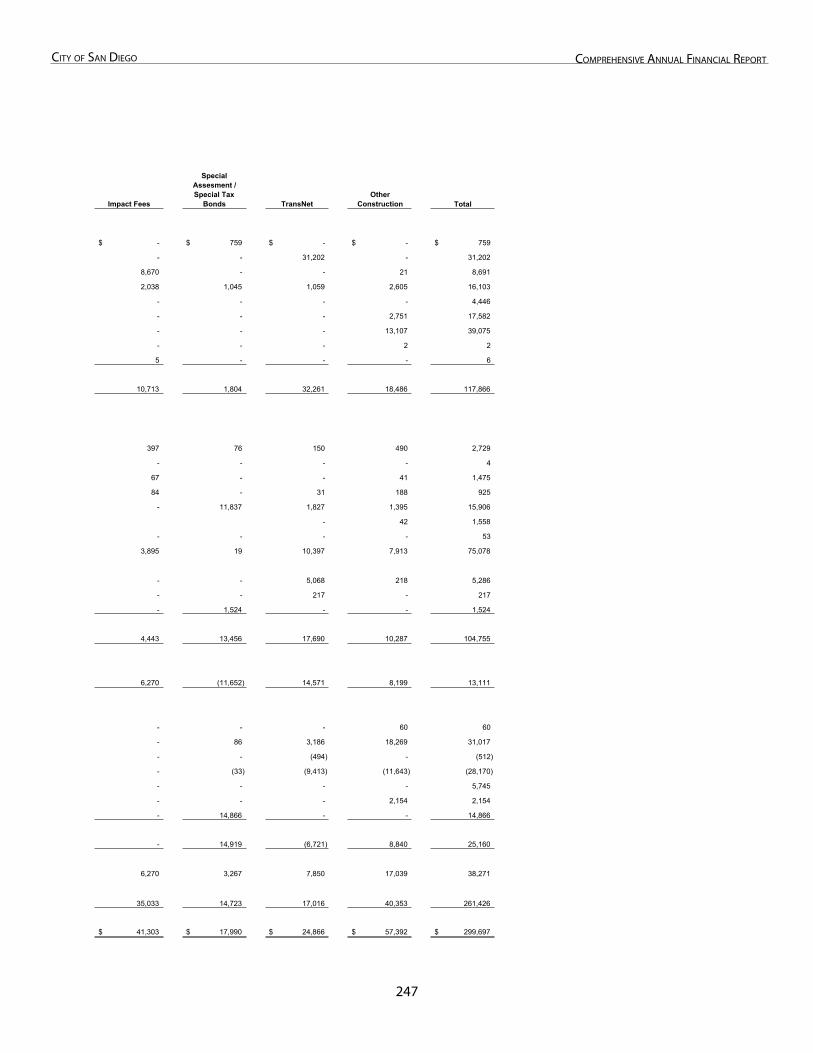
2�7
City of San Diego ComprehenSive annual finanCial report
Impact Fees
SpecialAssesment / Special Tax
Bonds TransNetOther
Construction Total
-$ 759$ -$ -$ 759$
- - 31,202 - 31,202
8,670 - - 21 8,691
2,038 1,045 1,059 2,605 16,103
- - - - 4,446
- - - 2,751 17,582
- - - 13,107 39,075
- - - 2 2
5 - - - 6
10,713 1,804 32,261 18,486 117,866
397 76 150 490 2,729
- - - - 4
67 - - 41 1,475
84 - 31 188 925
- 11,837 1,827 1,395 15,906
- 42 1,558
- - - - 53
3,895 19 10,397 7,913 75,078
- - 5,068 218 5,286
- - 217 - 217
- 1,524 - - 1,524
4,443 13,456 17,690 10,287 104,755
6,270 (11,652) 14,571 8,199 13,111
- - - 60 60
- 86 3,186 18,269 31,017
- - (494) - (512)
- (33) (9,413) (11,643) (28,170)
- - - - 5,745
- - - 2,154 2,154
- 14,866 - - 14,866
- 14,919 (6,721) 8,840 25,160
6,270 3,267 7,850 17,039 38,271
35,033 14,723 17,016 40,353 261,426
41,303$ 17,990$ 24,866$ 57,392$ 299,697$
This Page Left Intentionally Blank
2�8

non-major governmental funDS - permanent
Permanent

This Page Left Intentionally Blank - Back of Divider Page
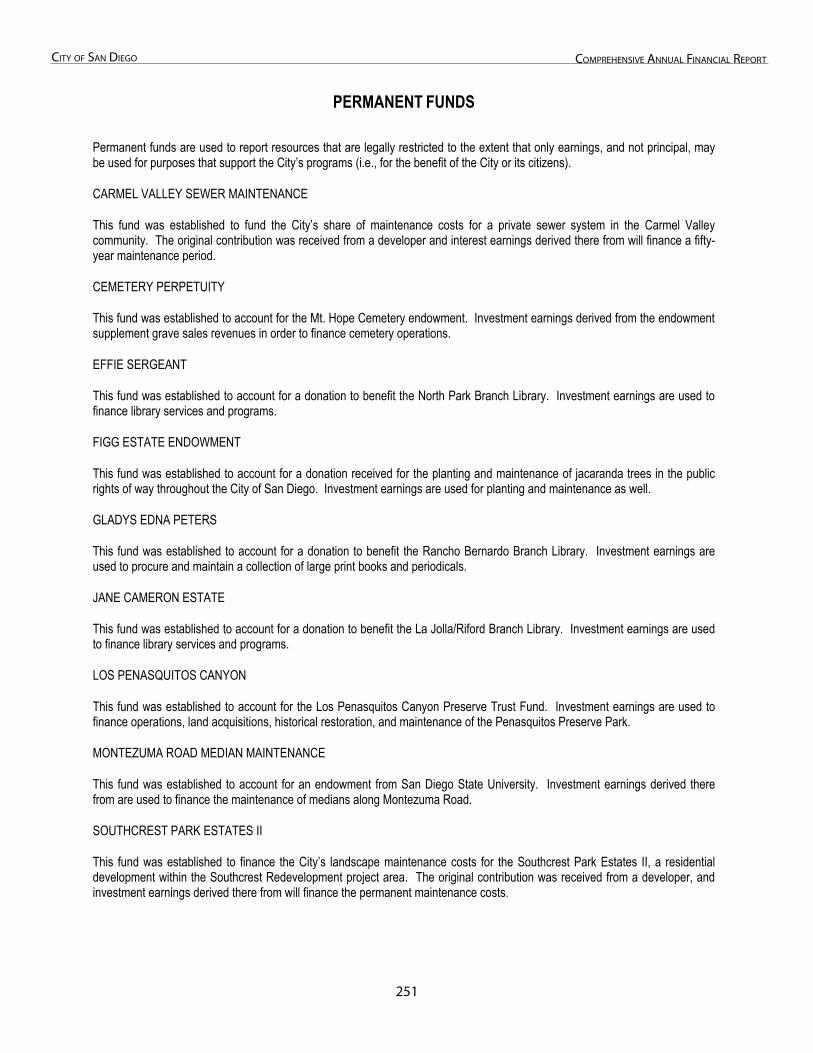
2�1
City of San Diego ComprehenSive annual finanCial report
PERMANENT FUNDS
Permanent funds are used to report resources that are legally restricted to the extent that only earnings, and not principal, maybe used for purposes that support the City’s programs (i.e., for the benefit of the City or its citizens).
CARMEL VALLEY SEWER MAINTENANCE
This fund was established to fund the City’s share of maintenance costs for a private sewer system in the Carmel Valley community. The original contribution was received from a developer and interest earnings derived there from will finance a fifty-year maintenance period.
CEMETERY PERPETUITY
This fund was established to account for the Mt. Hope Cemetery endowment. Investment earnings derived from the endowment supplement grave sales revenues in order to finance cemetery operations.
EFFIE SERGEANT
This fund was established to account for a donation to benefit the North Park Branch Library. Investment earnings are used to finance library services and programs.
FIGG ESTATE ENDOWMENT
This fund was established to account for a donation received for the planting and maintenance of jacaranda trees in the public rights of way throughout the City of San Diego. Investment earnings are used for planting and maintenance as well.
GLADYS EDNA PETERS
This fund was established to account for a donation to benefit the Rancho Bernardo Branch Library. Investment earnings are used to procure and maintain a collection of large print books and periodicals.
JANE CAMERON ESTATE
This fund was established to account for a donation to benefit the La Jolla/Riford Branch Library. Investment earnings are usedto finance library services and programs.
LOS PENASQUITOS CANYON
This fund was established to account for the Los Penasquitos Canyon Preserve Trust Fund. Investment earnings are used to finance operations, land acquisitions, historical restoration, and maintenance of the Penasquitos Preserve Park.
MONTEZUMA ROAD MEDIAN MAINTENANCE
This fund was established to account for an endowment from San Diego State University. Investment earnings derived there from are used to finance the maintenance of medians along Montezuma Road.
SOUTHCREST PARK ESTATES II
This fund was established to finance the City’s landscape maintenance costs for the Southcrest Park Estates II, a residential development within the Southcrest Redevelopment project area. The original contribution was received from a developer, and investment earnings derived there from will finance the permanent maintenance costs.
2�2
City of San Diego ComprehenSive annual finanCial report
SYCAMORE ESTATES
This fund was established to account for an endowment agreement between the City and Sycamore Estates, LLC. Investment earnings from the endowment shall be used exclusively for the long-term maintenance of conserved property within Sycamore Estates.
ZOOLOGICAL SOCIETY – MISSION TRAILS
This fund was established to account for the Fortuna Mountain Conservation Bank endowment. Investment earnings derived from the endowment shall be used to fund the permanent management of the Fortuna Mountain Conservation Bank within Mission Trails Regional Park.

This Page Left Intentionally Blank
2�3
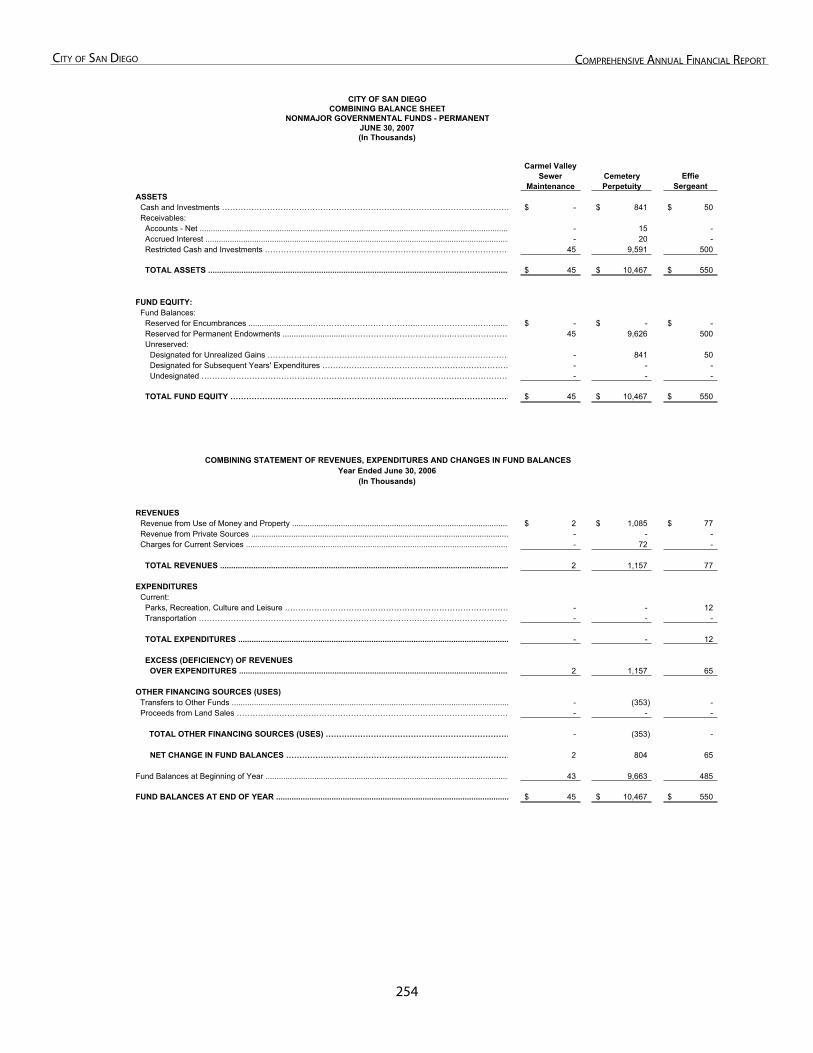
2��
City of San Diego ComprehenSive annual finanCial report
CITY OF SAN DIEGOCOMBINING BALANCE SHEET
NONMAJOR GOVERNMENTAL FUNDS - PERMANENTJUNE 30, 2007(In Thousands)
Carmel Valley Sewer
MaintenanceCemeteryPerpetuity
ASSETSCash and Investments ……………………………………………………………………………………………… -$ 841$ 50$ Receivables:
Accounts - Net ........................................................................................................................................... - 15 - Accrued Interest ......................................................................................................................................... - 20 - Restricted Cash and Investments ………………………………………………………………………………… 45 9,591 500
TOTAL ASSETS ........................................................................................................................................ 45$ 10,467$ 550$
FUND EQUITY:Fund Balances:
Reserved for Encumbrances .............................……………..…………………..…………………..……....... -$ -$ -$ Reserved for Permanent Endowments .............................……………..…………………..…………………. 45 9,626 500 Unreserved:
Designated for Unrealized Gains ………………………………………………………………………………… - 841 50 Designated for Subsequent Years' Expenditures ……………………………………………………………… - - - Undesignated ……………………………………………………………………………………………………… - - -
TOTAL FUND EQUITY …………………………………..…………………..…………………..………………… 45$ 10,467$ 550$
COMBINING STATEMENT OF REVENUES, EXPENDITURES AND CHANGES IN FUND BALANCESYear Ended June 30, 2006
(In Thousands)
REVENUESRevenue from Use of Money and Property .................................................................................................. 2$ 1,085$ 77$ Revenue from Private Sources .................................................................................................................... - - - Charges for Current Services ....................................................................................................................... - 72 -
TOTAL REVENUES .................................................................................................................................. 2 1,157 77
EXPENDITURESCurrent:
Parks, Recreation, Culture and Leisure ………………………………………………………………………… - - 12 Transportation ……………………………………………………………………………………………………… - - -
TOTAL EXPENDITURES .......................................................................................................................... - - 12
EXCESS (DEFICIENCY) OF REVENUES OVER EXPENDITURES .......................................................................................................................... 2 1,157 65
OTHER FINANCING SOURCES (USES)Transfers to Other Funds ............................................................................................................................. - (353) - Proceeds from Land Sales ………………………………………………………………………………………… - - -
TOTAL OTHER FINANCING SOURCES (USES) …………………………………………………………… - (353) -
NET CHANGE IN FUND BALANCES ………………………………………………………………………… 2 804 65
Fund Balances at Beginning of Year .............................................................................................................. 43 9,663 485
FUND BALANCES AT END OF YEAR ......................................................................................................... 45$ 10,467$ 550$
EffieSergeant
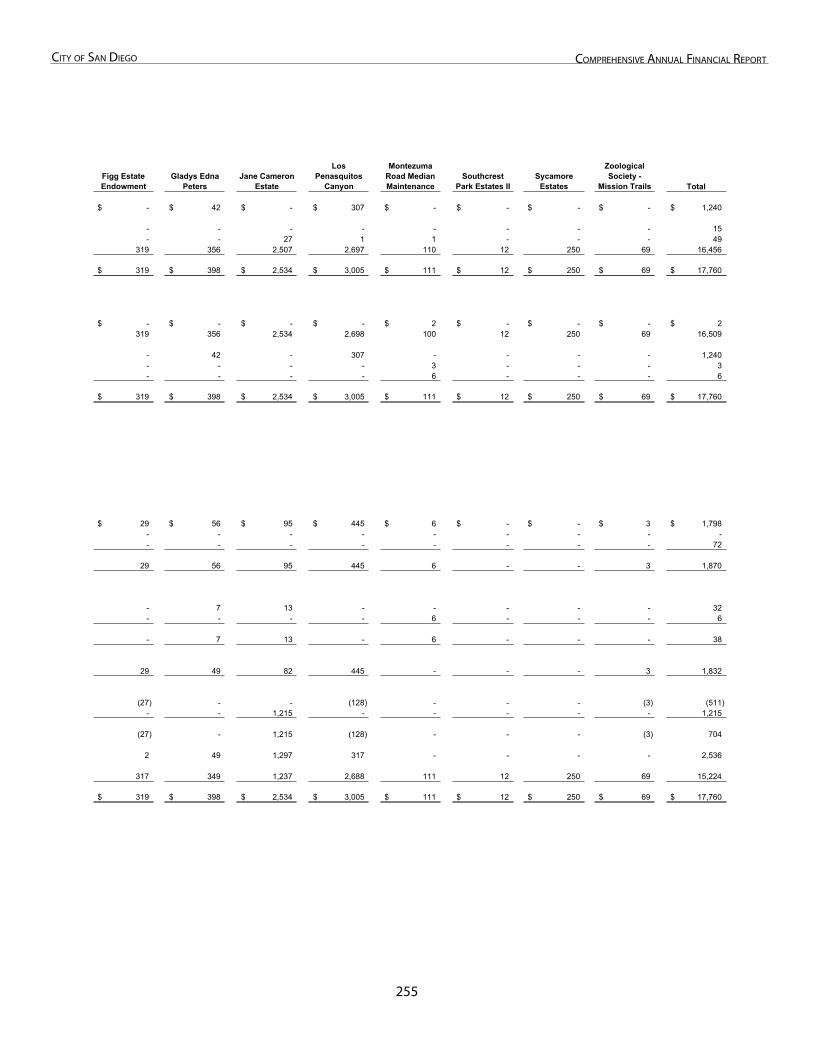
2��
City of San Diego ComprehenSive annual finanCial report
Total
-$ 42$ -$ 307$ -$ -$ -$ -$ 1,240$
- - - - - - - - 15 - - 27 1 1 - - - 49
319 356 2,507 2,697 110 12 250 69 16,456
319$ 398$ 2,534$ 3,005$ 111$ 12$ 250$ 69$ 17,760$
-$ -$ -$ -$ 2$ -$ -$ -$ 2$ 319 356 2,534 2,698 100 12 250 69 16,509
- 42 - 307 - - - - 1,240 - - - - 3 - - - 3 - - - - 6 - - - 6
319$ 398$ 2,534$ 3,005$ 111$ 12$ 250$ 69$ 17,760$
29$ 56$ 95$ 445$ 6$ -$ -$ 3$ 1,798$ - - - - - - - - - - - - - - - - - 72
29 56 95 445 6 - - 3 1,870
- 7 13 - - - - - 32 - - - - 6 - - - 6
- 7 13 - 6 - - - 38
29 49 82 445 - - - 3 1,832
(27) - - (128) - - - (3) (511) - - 1,215 - - - - - 1,215
(27) - 1,215 (128) - - - (3) 704
2 49 1,297 317 - - - - 2,536
317 349 1,237 2,688 111 12 250 69 15,224
319$ 398$ 2,534$ 3,005$ 111$ 12$ 250$ 69$ 17,760$
Gladys Edna Peters
ZoologicalSociety -
Mission TrailsSycamore
Estates
LosPenasquitos
CanyonSouthcrest
Park Estates II
MontezumaRoad Median Maintenance
Jane Cameron Estate
Figg Estate Endowment

This Page Left Intentionally Blank
2��
non-major BuSineSS-type funDS - enterpriSe
Non-Major Business-Type Funds - Enterprise

This Page Left Intentionally Blank - Back of Divider Page
2��
City of San Diego ComprehenSive annual finanCial report
ENTERPRISE FUNDS
Enterprise funds are used to account for any activity for which a fee is charged to external users for goods or services. Thesefunds use full accrual accounting.
CITY OF SAN DIEGO
AIRPORTS
This fund was established to account for the operation, maintenance and development of both City-owned airports--Montgomery and Brown Fields. Airports fund revenues are derived from such sources as rent/lease revenue, usage fees, earnings on investments and aid from other governmental agencies.
CITY STORE
This fund was established to account for activities of the City's entrepreneurial program. This program operates retail store outlets for the purpose of selling surplus city materials and other items promoting the City of San Diego.
DEVELOPMENT SERVICES
This fund was established to account for construction management, development project review, permitting, and inspection services for the City.
ENVIRONMENTAL SERVICES
This fund was established to account for refuse disposal, collection, energy conservation, resource management, and other environmental programs.
GOLF COURSE
This fund was established to operate, maintain, and improve physical conditions and initiate capital improvement programs for Torrey Pines and Balboa golf courses. Revenues are derived from green fees and leases.
RECYCLING
This fund was established to account for the planning, implementation, operation and management of City recycling and waste diversion programs. Revenues are derived from the recycling fee on all waste generated in the City or disposed of at the City landfill.
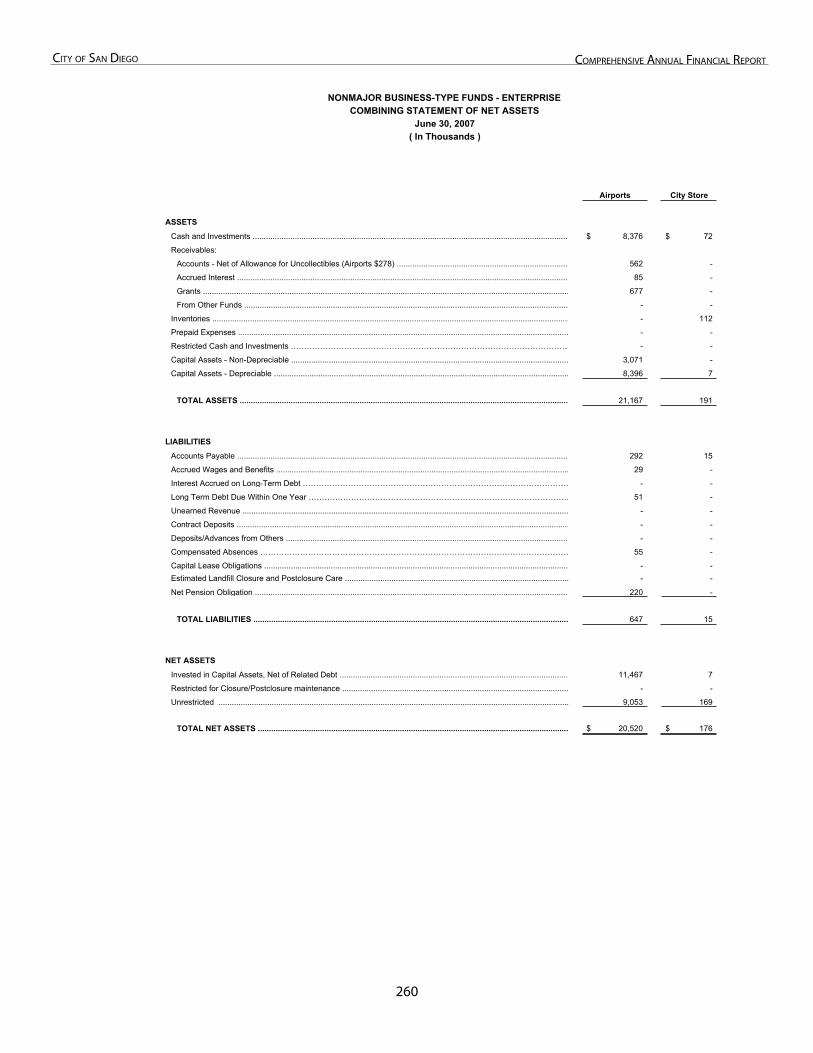
2�0
City of San Diego ComprehenSive annual finanCial report
Airports City Store
ASSETS
Cash and Investments ............................................................................................................................................... 8,376$ 72$
Receivables:
Accounts - Net of Allowance for Uncollectibles (Airports $278) .............................................................................. 562 -
Accrued Interest ...................................................................................................................................................... 85 -
Grants ..................................................................................................................................................................... 677 -
From Other Funds .................................................................................................................................................. - -
Inventories ................................................................................................................................................................. - 112
Prepaid Expenses ..................................................................................................................................................... - -
Restricted Cash and Investments …………………………………………………………………………………………… - -
Capital Assets - Non-Depreciable ............................................................................................................................. 3,071 -
Capital Assets - Depreciable ..................................................................................................................................... 8,396 7
TOTAL ASSETS .................................................................................................................................................... 21,167 191
LIABILITIES
Accounts Payable ...................................................................................................................................................... 292 15
Accrued Wages and Benefits .................................................................................................................................... 29 -
Interest Accrued on Long-Term Debt ………………………………………………………………………………………… - -
Long Term Debt Due Within One Year ……………………………………………………………………………………… 51 -
Unearned Revenue ................................................................................................................................................... - -
Contract Deposits ...................................................................................................................................................... - -
Deposits/Advances from Others ................................................................................................................................ - -
Compensated Absences ……………………………………………………………………………………………………… 55 -
Capital Lease Obligations ......................................................................................................................................... - - Estimated Landfill Closure and Postclosure Care ..................................................................................................... - -
Net Pension Obligation .............................................................................................................................................. 220 -
TOTAL LIABILITIES .............................................................................................................................................. 647 15
NET ASSETS
Invested in Capital Assets, Net of Related Debt ....................................................................................................... 11,467 7
Restricted for Closure/Postclosure maintenance ...................................................................................................... - -
Unrestricted .............................................................................................................................................................. 9,053 169
TOTAL NET ASSETS ............................................................................................................................................ 20,520$ 176$
( In Thousands )
NONMAJOR BUSINESS-TYPE FUNDS - ENTERPRISECOMBINING STATEMENT OF NET ASSETS
June 30, 2007
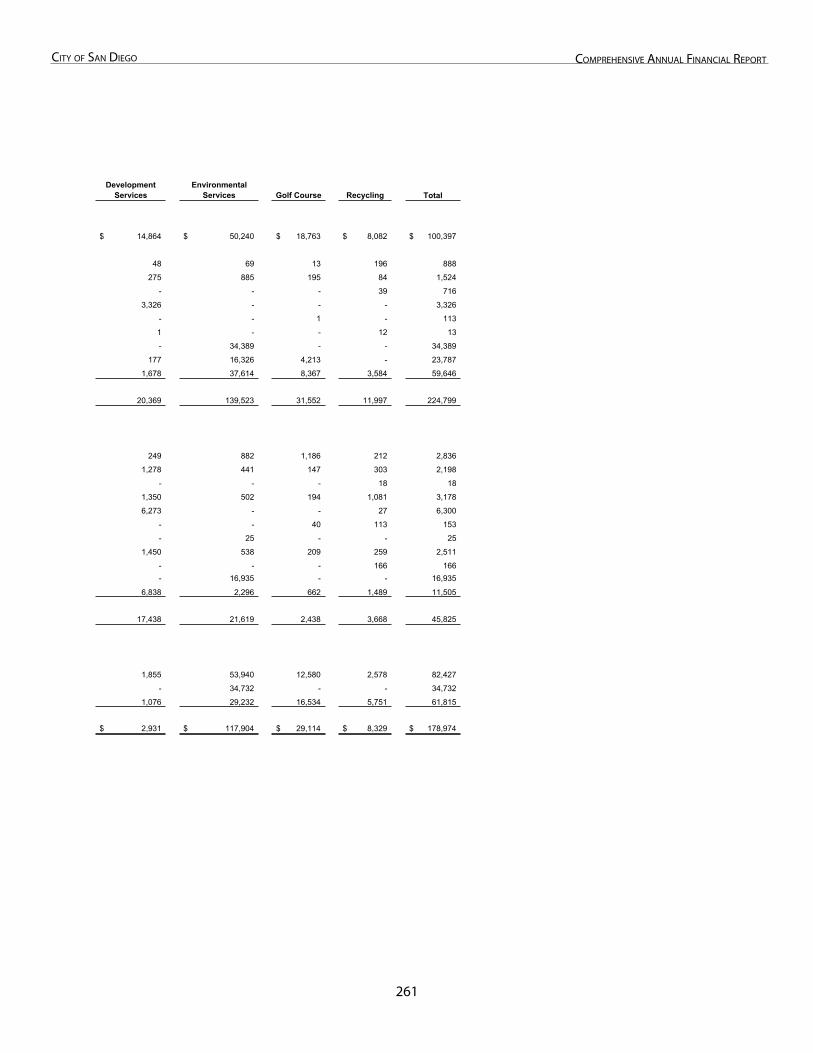
2�1
City of San Diego ComprehenSive annual finanCial report
DevelopmentServices
EnvironmentalServices Golf Course Recycling Total
14,864$ 50,240$ 18,763$ 8,082$ 100,397$
48 69 13 196 888
275 885 195 84 1,524
- - - 39 716
3,326 - - - 3,326
- - 1 - 113
1 - - 12 13
- 34,389 - - 34,389
177 16,326 4,213 - 23,787
1,678 37,614 8,367 3,584 59,646
20,369 139,523 31,552 11,997 224,799
249 882 1,186 212 2,836
1,278 441 147 303 2,198
- - - 18 18
1,350 502 194 1,081 3,178
6,273 - - 27 6,300
- - 40 113 153
- 25 - - 25
1,450 538 209 259 2,511
- - - 166 166 - 16,935 - - 16,935
6,838 2,296 662 1,489 11,505
17,438 21,619 2,438 3,668 45,825
1,855 53,940 12,580 2,578 82,427
- 34,732 - - 34,732
1,076 29,232 16,534 5,751 61,815
2,931$ 117,904$ 29,114$ 8,329$ 178,974$
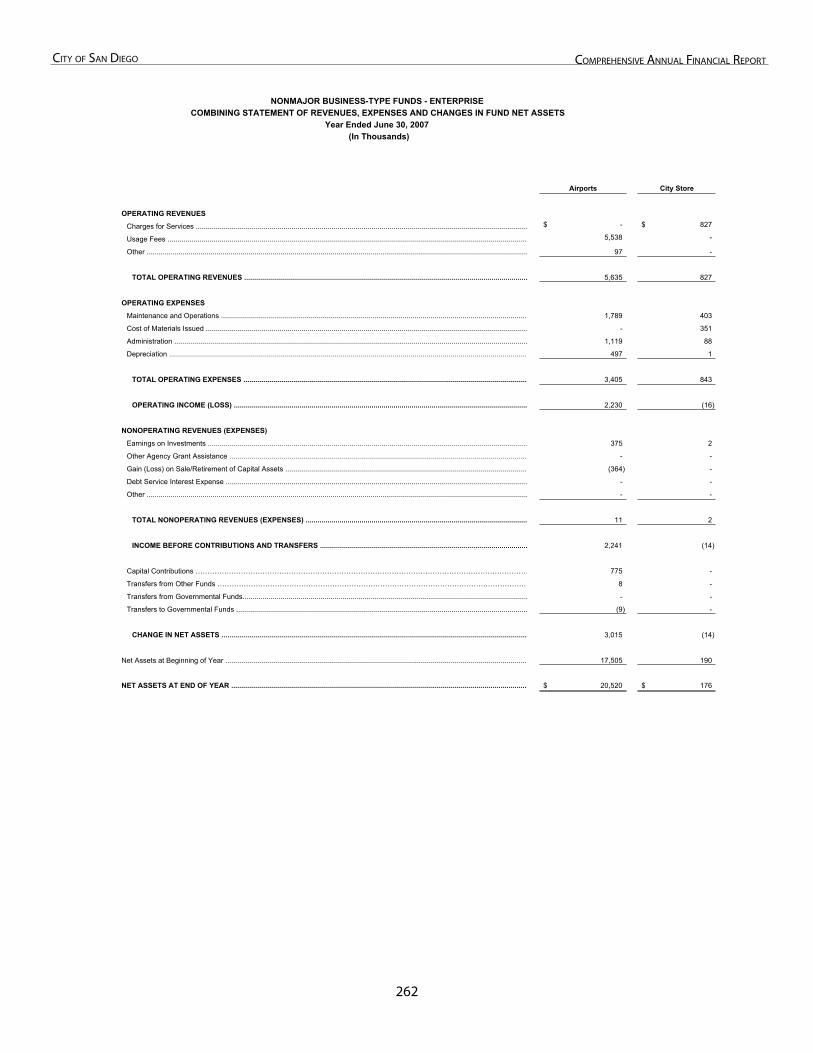
2�2
City of San Diego ComprehenSive annual finanCial report
Airports City Store
OPERATING REVENUES
Charges for Services ...................................................................................................................................................................... -$ 827$
Usage Fees .................................................................................................................................................................................... 5,538 -
Other ............................................................................................................................................................................................... 97 -
TOTAL OPERATING REVENUES .............................................................................................................................................. 5,635 827
OPERATING EXPENSES
Maintenance and Operations ......................................................................................................................................................... 1,789 403
Cost of Materials Issued ................................................................................................................................................................. - 351
Administration ................................................................................................................................................................................. 1,119 88
Depreciation ................................................................................................................................................................................... 497 1
TOTAL OPERATING EXPENSES .............................................................................................................................................. 3,405 843
OPERATING INCOME (LOSS) ................................................................................................................................................... 2,230 (16)
NONOPERATING REVENUES (EXPENSES)
Earnings on Investments ................................................................................................................................................................ 375 2
Other Agency Grant Assistance ..................................................................................................................................................... - -
Gain (Loss) on Sale/Retirement of Capital Assets ......................................................................................................................... (364) -
Debt Service Interest Expense ....................................................................................................................................................... - -
Other ............................................................................................................................................................................................... - -
TOTAL NONOPERATING REVENUES (EXPENSES) ............................................................................................................... 11 2
INCOME BEFORE CONTRIBUTIONS AND TRANSFERS ........................................................................................................ 2,241 (14)
Capital Contributions …………………………………………………………………………………………………………………………… 775 -
Transfers from Other Funds ………………………………………………………………………………………………………………… 8 -
Transfers from Governmental Funds............................................................................................................................................... - -
Transfers to Governmental Funds .................................................................................................................................................. (9) -
CHANGE IN NET ASSETS ......................................................................................................................................................... 3,015 (14)
Net Assets at Beginning of Year ....................................................................................................................................................... 17,505 190
NET ASSETS AT END OF YEAR .................................................................................................................................................... 20,520$ 176$
(In Thousands)
NONMAJOR BUSINESS-TYPE FUNDS - ENTERPRISECOMBINING STATEMENT OF REVENUES, EXPENSES AND CHANGES IN FUND NET ASSETS
Year Ended June 30, 2007
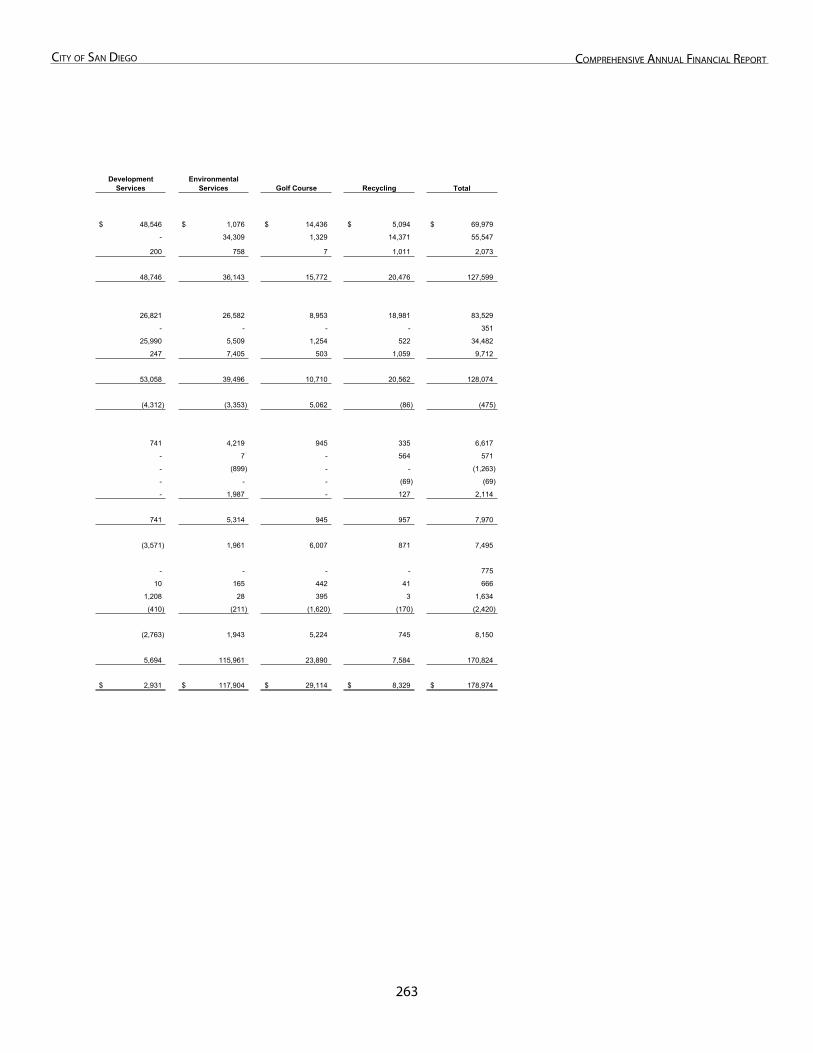
2�3
City of San Diego ComprehenSive annual finanCial report
DevelopmentServices
EnvironmentalServices Golf Course Recycling Total
48,546$ 1,076$ 14,436$ 5,094$ 69,979$
- 34,309 1,329 14,371 55,547
200 758 7 1,011 2,073
48,746 36,143 15,772 20,476 127,599
26,821 26,582 8,953 18,981 83,529
- - - - 351
25,990 5,509 1,254 522 34,482
247 7,405 503 1,059 9,712
53,058 39,496 10,710 20,562 128,074
(4,312) (3,353) 5,062 (86) (475)
741 4,219 945 335 6,617
- 7 - 564 571
- (899) - - (1,263)
- - - (69) (69)
- 1,987 - 127 2,114
741 5,314 945 957 7,970
(3,571) 1,961 6,007 871 7,495
- - - - 775
10 165 442 41 666
1,208 28 395 3 1,634
(410) (211) (1,620) (170) (2,420)
(2,763) 1,943 5,224 745 8,150
5,694 115,961 23,890 7,584 170,824
2,931$ 117,904$ 29,114$ 8,329$ 178,974$
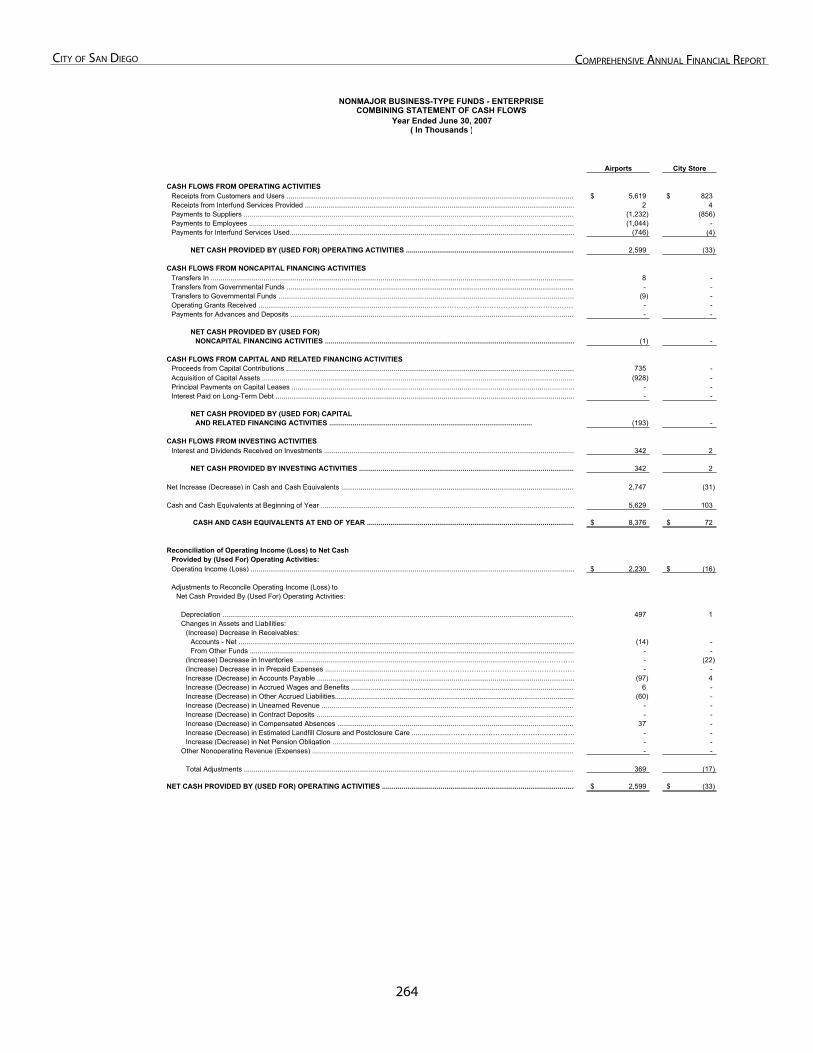
2��
City of San Diego ComprehenSive annual finanCial report
Airports City Store
CASH FLOWS FROM OPERATING ACTIVITIESReceipts from Customers and Users .................................................................................................................................................... 5,619$ 823$ Receipts from Interfund Services Provided .......................................................................................................................................... 2 4 Payments to Suppliers .......................................................................................................................................................................... (1,232) (856) Payments to Employees ....................................................................................................................................................................... (1,044) - Payments for Interfund Services Used.................................................................................................................................................. (746) (4)
NET CASH PROVIDED BY (USED FOR) OPERATING ACTIVITIES ...................................................................................... 2,599 (33)
CASH FLOWS FROM NONCAPITAL FINANCING ACTIVITIESTransfers In .......................................................................................................................................................................................... 8 - Transfers from Governmental Funds .................................................................................................................................................... - - Transfers to Governmental Funds ........................................................................................................................................................ (9) - Operating Grants Received .......................................................................................……………………………………………………… - - Payments for Advances and Deposits .................................................................................................................................................. - -
NET CASH PROVIDED BY (USED FOR)NONCAPITAL FINANCING ACTIVITIES ................................................................................................................................ (1) -
CASH FLOWS FROM CAPITAL AND RELATED FINANCING ACTIVITIESProceeds from Capital Contributions .................................................................................................................................................... 735 - Acquisition of Capital Assets ................................................................................................................................................................ (928) - Principal Payments on Capital Leases ................................................................................................................................................. - - Interest Paid on Long-Term Debt ......................................................................................................................................................... - -
NET CASH PROVIDED BY (USED FOR) CAPITALAND RELATED FINANCING ACTIVITIES ........................................................................................................ (193) -
CASH FLOWS FROM INVESTING ACTIVITIESInterest and Dividends Received on Investments ................................................................................................................................ 342 2
NET CASH PROVIDED BY INVESTING ACTIVITIES .............................................................................................................. 342 2
Net Increase (Decrease) in Cash and Cash Equivalents ........................................................................................................................ 2,747 (31)
Cash and Cash Equivalents at Beginning of Year .................................................................................................................................. 5,629 103
CASH AND CASH EQUIVALENTS AT END OF YEAR .......................................................................................................... 8,376$ 72$
Reconciliation of Operating Income (Loss) to Net CashProvided by (Used For) Operating Activities:Operating Income (Loss) ...................................................................................................................................................................... 2,230$ (16)$
Adjustments to Reconcile Operating Income (Loss) toNet Cash Provided By (Used For) Operating Activities:
Depreciation .................................................................................................................................................................................... 497 1 Changes in Assets and Liabilities:
(Increase) Decrease in Receivables:Accounts - Net ............................................................................................................................................................................ (14) - From Other Funds ...................................................................................................................................................................... - -
(Increase) Decrease in Inventories ...........................................................................................................................……………… - (22) (Increase) Decrease in in Prepaid Expenses .............................................…………………………………………………………… - - Increase (Decrease) in Accounts Payable .................................................................................................................................... (97) 4 Increase (Decrease) in Accrued Wages and Benefits .................................................................................................................. 6 - Increase (Decrease) in Other Accrued Liabilities........................................................................................................................... (60) - Increase (Decrease) in Unearned Revenue .................................................................................................................................. - - Increase (Decrease) in Contract Deposits .................................................................................................................................... - - Increase (Decrease) in Compensated Absences .......................................................................................................................... 37 - Increase (Decrease) in Estimated Landfill Closure and Postclosure Care ....................……………………………………………… - - Increase (Decrease) in Net Pension Obligation ............................................................................................................................ - -
Other Nonoperating Revenue (Expenses) ...................................................................................................................................... - -
Total Adjustments ......................................................................................................................................................................... 369 (17)
NET CASH PROVIDED BY (USED FOR) OPERATING ACTIVITIES ................................................................................................... 2,599$ (33)$
( In Thousands )
NONMAJOR BUSINESS-TYPE FUNDS - ENTERPRISECOMBINING STATEMENT OF CASH FLOWS
Year Ended June 30, 2007
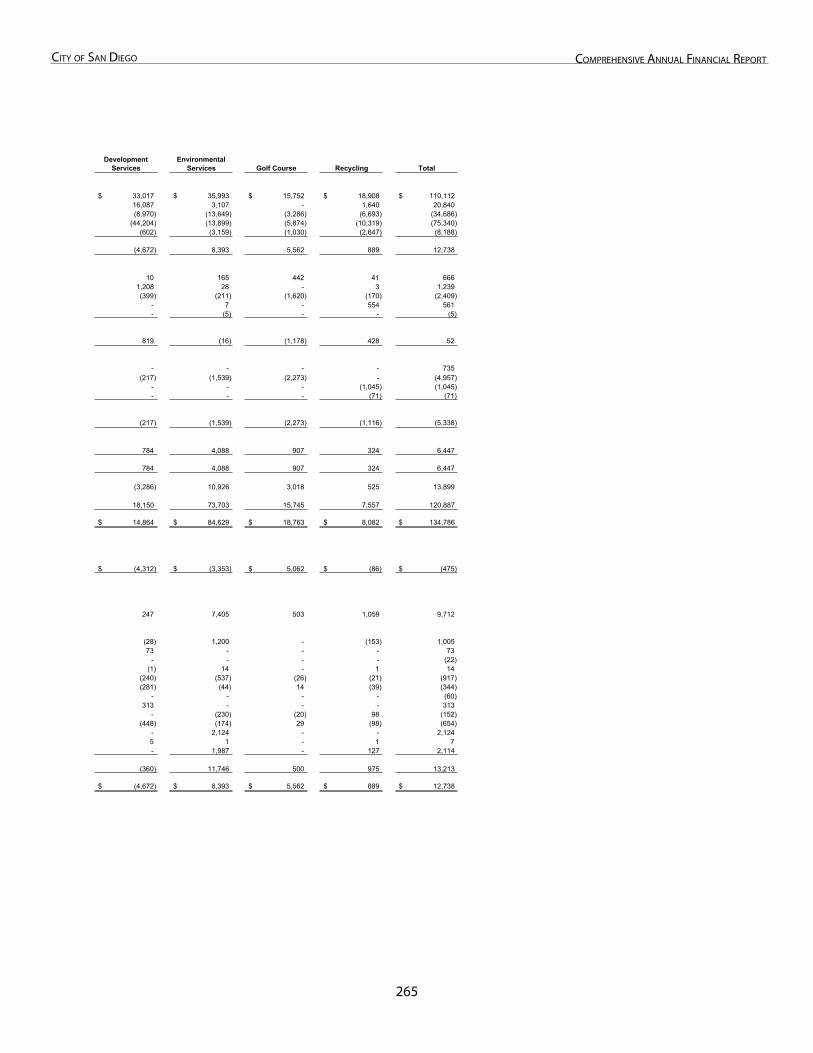
2��
City of San Diego ComprehenSive annual finanCial report
DevelopmentServices
EnvironmentalServices Golf Course Recycling Total
33,017$ 35,993$ 15,752$ 18,908$ 110,112$ 16,087 3,107 - 1,640 20,840 (8,970) (13,649) (3,286) (6,693) (34,686)
(44,204) (13,899) (5,874) (10,319) (75,340) (602) (3,159) (1,030) (2,647) (8,188)
(4,672) 8,393 5,562 889 12,738
10 165 442 41 666 1,208 28 - 3 1,239 (399) (211) (1,620) (170) (2,409)
- 7 - 554 561 - (5) - - (5)
819 (16) (1,178) 428 52
- - - - 735 (217) (1,539) (2,273) - (4,957)
- - - (1,045) (1,045) - - - (71) (71)
(217) (1,539) (2,273) (1,116) (5,338)
784 4,088 907 324 6,447
784 4,088 907 324 6,447
(3,286) 10,926 3,018 525 13,899
18,150 73,703 15,745 7,557 120,887
14,864$ 84,629$ 18,763$ 8,082$ 134,786$
(4,312)$ (3,353)$ 5,062$ (86)$ (475)$
247 7,405 503 1,059 9,712
(28) 1,200 - (153) 1,005 73 - - - 73
- - - - (22) (1) 14 - 1 14
(240) (537) (26) (21) (917) (281) (44) 14 (39) (344)
- - - - (60) 313 - - - 313
- (230) (20) 98 (152) (448) (174) 29 (98) (654)
- 2,124 - - 2,124 5 1 - 1 7 - 1,987 - 127 2,114
(360) 11,746 500 975 13,213
(4,672)$ 8,393$ 5,562$ 889$ 12,738$

This Page Left Intentionally Blank
2��

internal ServiCe funDS
Internal Service Funds

This Page Left Intentionally Blank - Back of Divider Page
2��
City of San Diego ComprehenSive annual finanCial report
INTERNAL SERVICE FUNDS
Internal service funds are used to account for the financing of goods or services provided by one department or agency to otherdepartments or agencies of the City, or to other governmental units and/or funds.
CITY OF SAN DIEGO
CENTRAL GARAGE AND MACHINE SHOP
This fund was established to account for the acquisition, replacement, maintenance and fueling of the City's motive equipment (excluding fire and police vehicles).
CENTRAL STORES
This fund was established to provide centralized storeroom services to all City departments.
PUBLISHING SERVICES
This fund was established to provide printing and reproduction services to all City departments.
SELF INSURANCE
This fund was established to account for self insurance activities, including worker's compensation and long-term disability programs for employees. Revenues are derived from rates charged to departments as a percentage of payroll. This fund also accounts for the public liability reserve, which was established for the purpose of paying claims in excess of annual appropriations.
SPECIAL ENGINEERING
This fund was established to provide project planning, design, engineering systems management and support, and construction management and inspection services for water and wastewater capital improvements.
MISCELLANEOUS INTERNAL SERVICE
This fund accounts for various administrative activities including risk management administration, administration and operation of various employee related programs such as unused compensatory time, unused sick leave and unemployment insurance, and citywide training. Revenues are derived from rates or fees charged to the departments for specific services rendered.
BLENDED COMPONENT UNIT
SAN DIEGO DATA PROCESSING CORPORATION
This fund accounts for the operations of the San Diego Data Processing Corporation, Inc. (SDDPC). SDDPC was formed for the purpose of providing data processing services to public agencies, primarily the City of San Diego, which is the sole member of SDDPC. SDDPC also provides telecommunication services to the City. Rates are charged for the various services provided as per operating agreements and are subject to change each year.
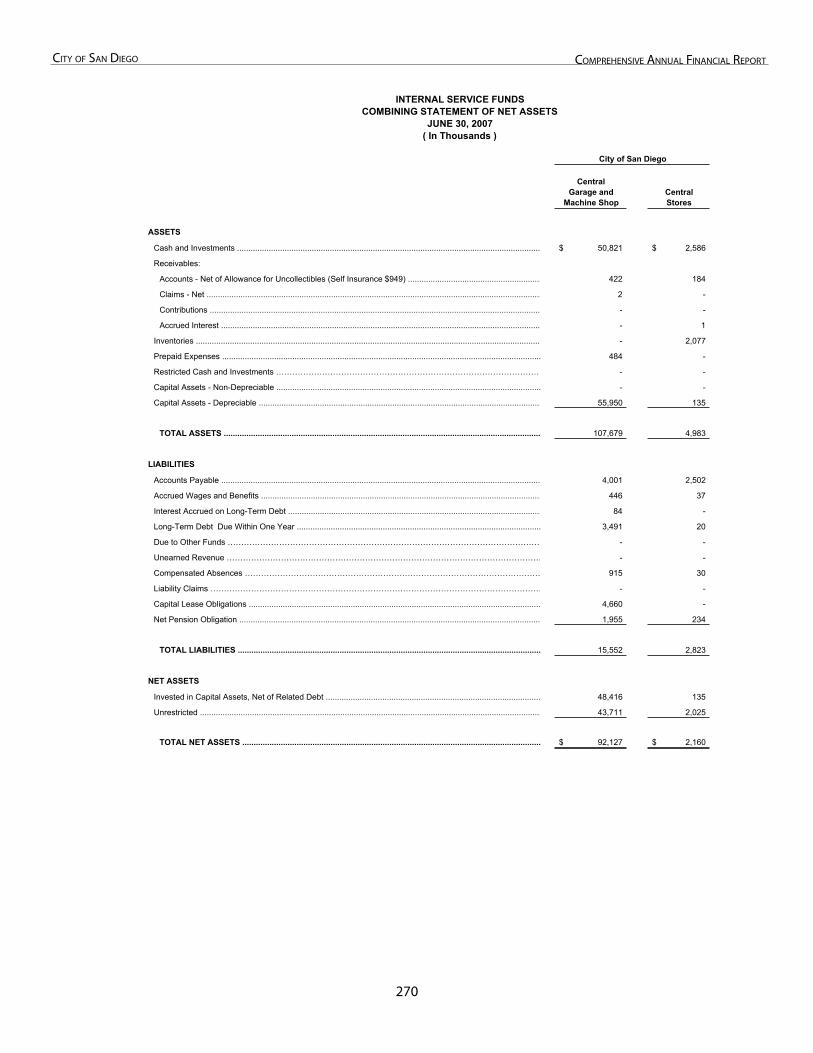
270
City of San Diego ComprehenSive annual finanCial report
INTERNAL SERVICE FUNDSCOMBINING STATEMENT OF NET ASSETS
JUNE 30, 2007( In Thousands )
City of San Diego
CentralGarage and
Machine ShopCentralStores
ASSETS
Cash and Investments ...................................................................................................................................... 50,821$ 2,586$
Receivables:
Accounts - Net of Allowance for Uncollectibles (Self Insurance $949) ........................................................... 422 184
Claims - Net .................................................................................................................................................... 2 -
Contributions .................................................................................................................................................. - -
Accrued Interest ............................................................................................................................................. - 1
Inventories ........................................................................................................................................................ - 2,077
Prepaid Expenses ............................................................................................................................................. 484 -
Restricted Cash and Investments ……………………………………………………………………………………… - -
Capital Assets - Non-Depreciable ..................................................................................................................... - -
Capital Assets - Depreciable ............................................................................................................................. 55,950 135
TOTAL ASSETS ............................................................................................................................................ 107,679 4,983
LIABILITIES
Accounts Payable ............................................................................................................................................. 4,001 2,502
Accrued Wages and Benefits ............................................................................................................................ 446 37
Interest Accrued on Long-Term Debt ................................................................................................................ 84 -
Long-Term Debt Due Within One Year ............................................................................................................ 3,491 20
Due to Other Funds ……………………………………………………………………………………………………… - -
Unearned Revenue ……………………………………………………………………………………………………… - -
Compensated Absences ………………………………………………………………………………………………… 915 30
Liability Claims …………………………………………………………………………………………………………… - -
Capital Lease Obligations ................................................................................................................................. 4,660 -
Net Pension Obligation ..................................................................................................................................... 1,955 234
TOTAL LIABILITIES ...................................................................................................................................... 15,552 2,823
NET ASSETS
Invested in Capital Assets, Net of Related Debt ............................................................................................... 48,416 135
Unrestricted ....................................................................................................................................................... 43,711 2,025
TOTAL NET ASSETS .................................................................................................................................... 92,127$ 2,160$
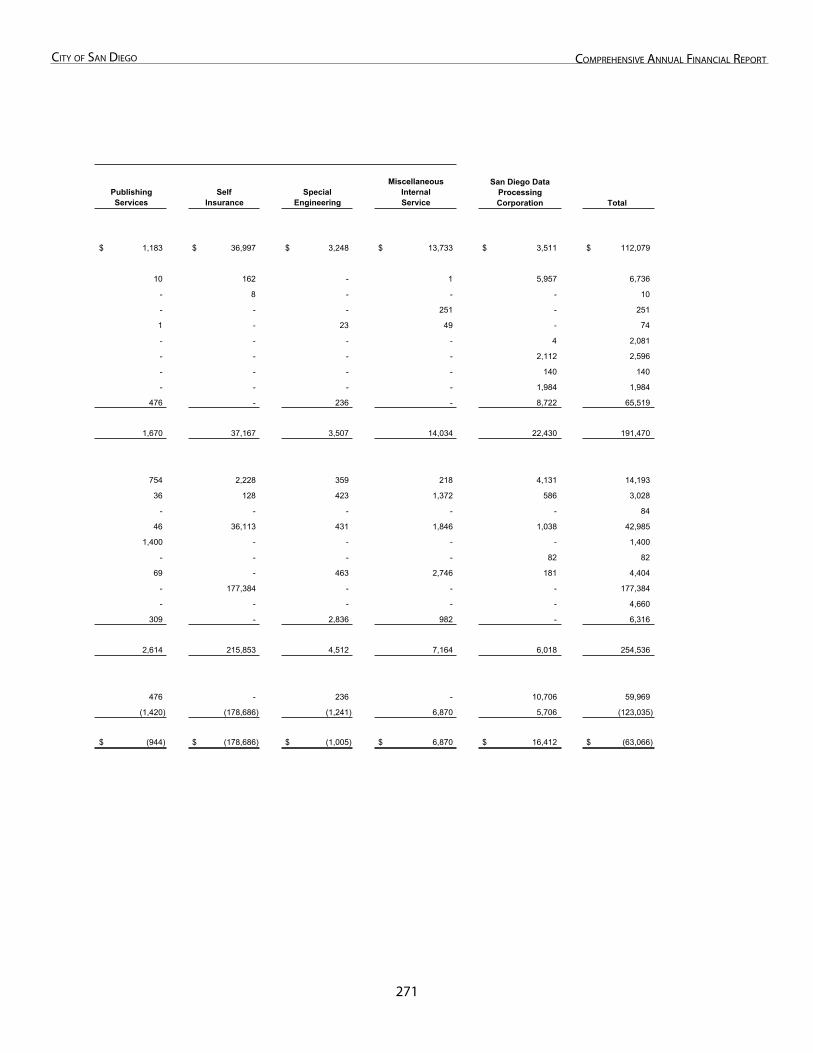
271
City of San Diego ComprehenSive annual finanCial report
PublishingServices
SelfInsurance
SpecialEngineering
MiscellaneousInternalService Total
1,183$ 36,997$ 3,248$ 13,733$ 3,511$ 112,079$
10 162 - 1 5,957 6,736
- 8 - - - 10
- - - 251 - 251
1 - 23 49 - 74
- - - - 4 2,081
- - - - 2,112 2,596
- - - - 140 140
- - - - 1,984 1,984
476 - 236 - 8,722 65,519
1,670 37,167 3,507 14,034 22,430 191,470
754 2,228 359 218 4,131 14,193
36 128 423 1,372 586 3,028
- - - - - 84
46 36,113 431 1,846 1,038 42,985
1,400 - - - - 1,400
- - - - 82 82
69 - 463 2,746 181 4,404
- 177,384 - - - 177,384
- - - - - 4,660
309 - 2,836 982 - 6,316
2,614 215,853 4,512 7,164 6,018 254,536
476 - 236 - 10,706 59,969
(1,420) (178,686) (1,241) 6,870 5,706 (123,035)
(944)$ (178,686)$ (1,005)$ 6,870$ 16,412$ (63,066)$
San Diego Data ProcessingCorporation
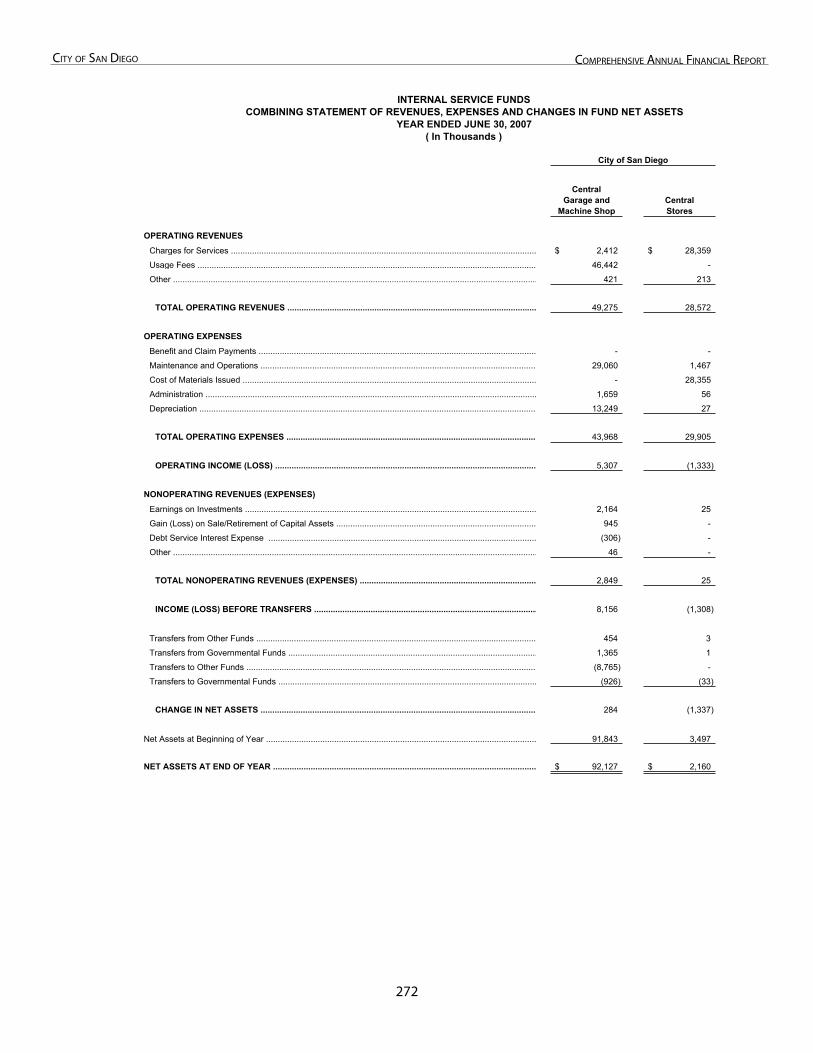
272
City of San Diego ComprehenSive annual finanCial report
INTERNAL SERVICE FUNDSCOMBINING STATEMENT OF REVENUES, EXPENSES AND CHANGES IN FUND NET ASSETS
YEAR ENDED JUNE 30, 2007( In Thousands )
City of San Diego
CentralGarage and
Machine ShopCentralStores
OPERATING REVENUES
Charges for Services .................................................................................................................................. 2,412$ 28,359$
Usage Fees ................................................................................................................................................ 46,442 -
Other ........................................................................................................................................................... 421 213
TOTAL OPERATING REVENUES .......................................................................................................... 49,275 28,572
OPERATING EXPENSES
Benefit and Claim Payments ...................................................................................................................... - -
Maintenance and Operations ..................................................................................................................... 29,060 1,467
Cost of Materials Issued ............................................................................................................................. - 28,355
Administration ............................................................................................................................................. 1,659 56
Depreciation ............................................................................................................................................... 13,249 27
TOTAL OPERATING EXPENSES .......................................................................................................... 43,968 29,905
OPERATING INCOME (LOSS) ............................................................................................................... 5,307 (1,333)
NONOPERATING REVENUES (EXPENSES)
Earnings on Investments ............................................................................................................................ 2,164 25
Gain (Loss) on Sale/Retirement of Capital Assets ..................................................................................... 945 -
Debt Service Interest Expense .................................................................................................................. (306) -
Other ........................................................................................................................................................... 46 -
TOTAL NONOPERATING REVENUES (EXPENSES) ........................................................................... 2,849 25
INCOME (LOSS) BEFORE TRANSFERS ............................................................................................... 8,156 (1,308)
Transfers from Other Funds ....................................................................................................................... 454 3
Transfers from Governmental Funds .......................................................................................................... 1,365 1
Transfers to Other Funds ........................................................................................................................... (8,765) -
Transfers to Governmental Funds .............................................................................................................. (926) (33)
CHANGE IN NET ASSETS ..................................................................................................................... 284 (1,337)
Net Assets at Beginning of Year ................................................................................................................... 91,843 3,497
NET ASSETS AT END OF YEAR ................................................................................................................ 92,127$ 2,160$
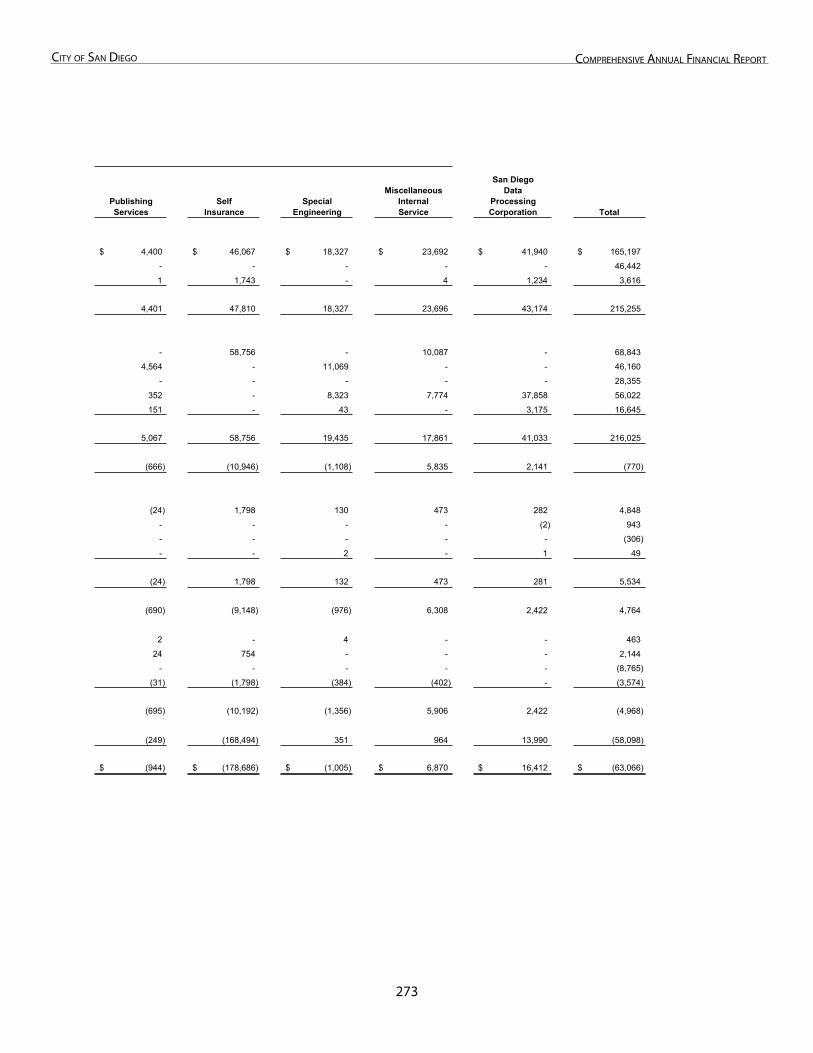
273
City of San Diego ComprehenSive annual finanCial report
PublishingServices
SelfInsurance
SpecialEngineering
MiscellaneousInternalService
San DiegoData
ProcessingCorporation Total
4,400$ 46,067$ 18,327$ 23,692$ 41,940$ 165,197$
- - - - - 46,442
1 1,743 - 4 1,234 3,616
4,401 47,810 18,327 23,696 43,174 215,255
- 58,756 - 10,087 - 68,843
4,564 - 11,069 - - 46,160
- - - - - 28,355
352 - 8,323 7,774 37,858 56,022
151 - 43 - 3,175 16,645
5,067 58,756 19,435 17,861 41,033 216,025
(666) (10,946) (1,108) 5,835 2,141 (770)
(24) 1,798 130 473 282 4,848
- - - - (2) 943
- - - - - (306)
- - 2 - 1 49
(24) 1,798 132 473 281 5,534
(690) (9,148) (976) 6,308 2,422 4,764
2 - 4 - - 463
24 754 - - - 2,144
- - - - - (8,765)
(31) (1,798) (384) (402) - (3,574)
(695) (10,192) (1,356) 5,906 2,422 (4,968)
(249) (168,494) 351 964 13,990 (58,098)
(944)$ (178,686)$ (1,005)$ 6,870$ 16,412$ (63,066)$
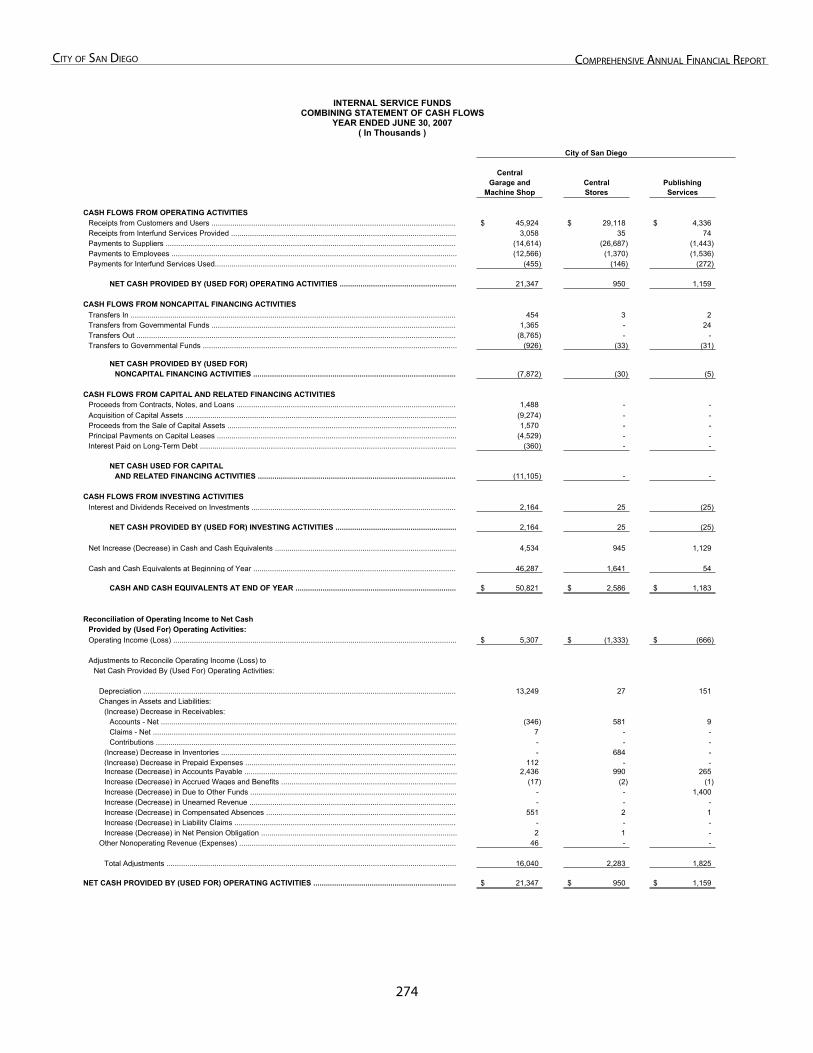
27�
City of San Diego ComprehenSive annual finanCial report
INTERNAL SERVICE FUNDSCOMBINING STATEMENT OF CASH FLOWS
YEAR ENDED JUNE 30, 2007( In Thousands )
CentralGarage and Central Publishing
Machine Shop Stores Services
CASH FLOWS FROM OPERATING ACTIVITIESReceipts from Customers and Users ...................................................................................................................... 45,924$ 29,118$ 4,336$ Receipts from Interfund Services Provided ............................................................................................................ 3,058 35 74 Payments to Suppliers ............................................................................................................................................ (14,614) (26,687) (1,443) Payments to Employees ......................................................................................................................................... (12,566) (1,370) (1,536) Payments for Interfund Services Used.................................................................................................................... (455) (146) (272)
NET CASH PROVIDED BY (USED FOR) OPERATING ACTIVITIES ........................................................ 21,347 950 1,159
CASH FLOWS FROM NONCAPITAL FINANCING ACTIVITIESTransfers In ............................................................................................................................................................ 454 3 2 Transfers from Governmental Funds ...................................................................................................................... 1,365 - 24 Transfers Out .......................................................................................................................................................... (8,765) - - Transfers to Governmental Funds .......................................................................................................................... (926) (33) (31)
NET CASH PROVIDED BY (USED FOR)NONCAPITAL FINANCING ACTIVITIES .................................................................................................. (7,872) (30) (5)
CASH FLOWS FROM CAPITAL AND RELATED FINANCING ACTIVITIESProceeds from Contracts, Notes, and Loans .......................................................................................................... 1,488 - - Acquisition of Capital Assets .................................................................................................................................. (9,274) - - Proceeds from the Sale of Capital Assets .............................................................................................................. 1,570 - - Principal Payments on Capital Leases ................................................................................................................... (4,529) - - Interest Paid on Long-Term Debt ........................................................................................................................... (360) - -
NET CASH USED FOR CAPITALAND RELATED FINANCING ACTIVITIES ................................................................................................ (11,105) - -
CASH FLOWS FROM INVESTING ACTIVITIESInterest and Dividends Received on Investments .................................................................................................. 2,164 25 (25)
NET CASH PROVIDED BY (USED FOR) INVESTING ACTIVITIES .......................................................... 2,164 25 (25)
Net Increase (Decrease) in Cash and Cash Equivalents ....................................................................................... 4,534 945 1,129
Cash and Cash Equivalents at Beginning of Year .................................................................................................. 46,287 1,641 54
CASH AND CASH EQUIVALENTS AT END OF YEAR ............................................................................. 50,821$ 2,586$ 1,183$
Reconciliation of Operating Income to Net CashProvided by (Used For) Operating Activities:Operating Income (Loss) ........................................................................................................................................ 5,307$ (1,333)$ (666)$
Adjustments to Reconcile Operating Income (Loss) toNet Cash Provided By (Used For) Operating Activities:
Depreciation ...................................................................................................................................................... 13,249 27 151 Changes in Assets and Liabilities:
(Increase) Decrease in Receivables:Accounts - Net .............................................................................................................................................. (346) 581 9 Claims - Net .................................................................................................................................................. 7 - - Contributions ................................................................................................................................................ - - -
(Increase) Decrease in Inventories ................................................................................................................. - 684 - (Increase) Decrease in Prepaid Expenses ..................................................................................................... 112 - - Increase (Decrease) in Accounts Payable ...................................................................................................... 2,436 990 265 Increase (Decrease) in Accrued Wages and Benefits .................................................................................... (17) (2) (1) Increase (Decrease) in Due to Other Funds ................................................................................................... - - 1,400 Increase (Decrease) in Unearned Revenue ................................................................................................... - - - Increase (Decrease) in Compensated Absences ........................................................................................... 551 2 1 Increase (Decrease) in Liability Claims ........................................................................................................... - - - Increase (Decrease) in Net Pension Obligation .............................................................................................. 2 1 -
Other Nonoperating Revenue (Expenses) ........................................................................................................ 46 - -
Total Adjustments ........................................................................................................................................... 16,040 2,283 1,825
NET CASH PROVIDED BY (USED FOR) OPERATING ACTIVITIES ..................................................................... 21,347$ 950$ 1,159$
City of San Diego
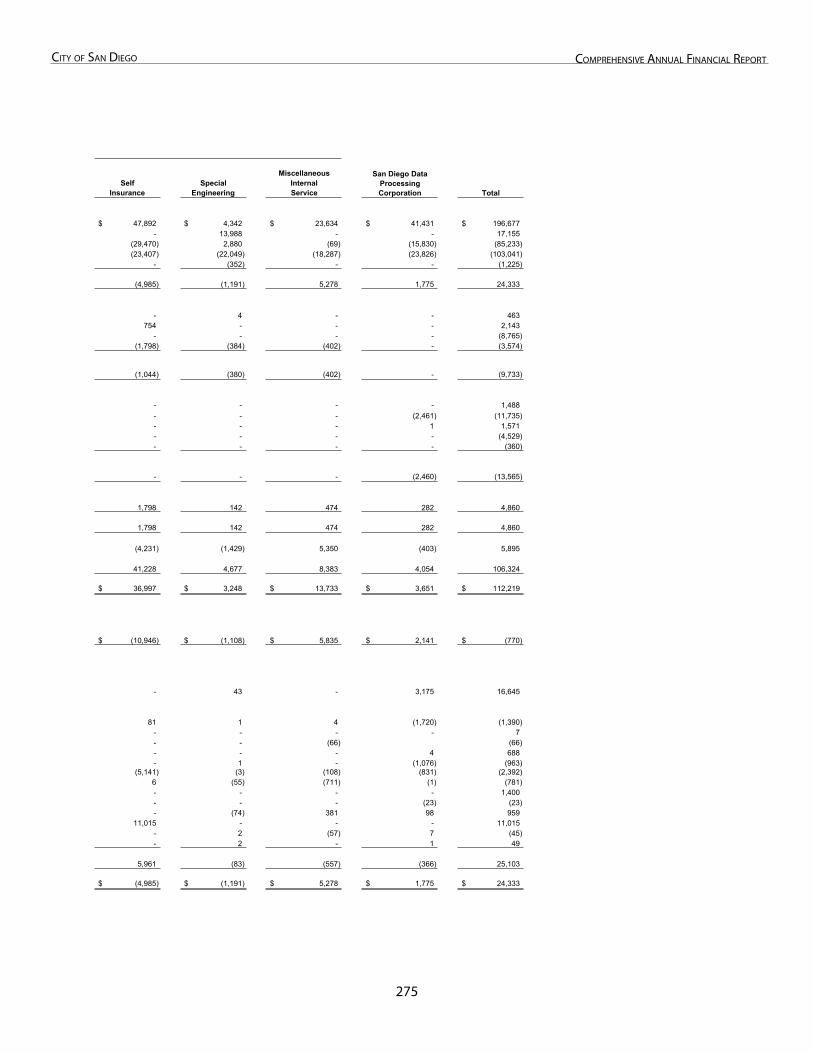
27�
City of San Diego ComprehenSive annual finanCial report
MiscellaneousSelf Special Internal
Insurance Engineering Service Total
47,892$ 4,342$ 23,634$ 41,431$ 196,677$ - 13,988 - - 17,155
(29,470) 2,880 (69) (15,830) (85,233) (23,407) (22,049) (18,287) (23,826) (103,041)
- (352) - - (1,225)
(4,985) (1,191) 5,278 1,775 24,333
- 4 - - 463 754 - - - 2,143
- - - - (8,765) (1,798) (384) (402) - (3,574)
(1,044) (380) (402) - (9,733)
- - - - 1,488 - - - (2,461) (11,735) - - - 1 1,571 - - - - (4,529) - - - - (360)
- - - (2,460) (13,565)
1,798 142 474 282 4,860
1,798 142 474 282 4,860
(4,231) (1,429) 5,350 (403) 5,895
41,228 4,677 8,383 4,054 106,324
36,997$ 3,248$ 13,733$ 3,651$ 112,219$
(10,946)$ (1,108)$ 5,835$ 2,141$ (770)$
- 43 - 3,175 16,645
81 1 4 (1,720) (1,390) - - - - 7 - - (66) (66) - - - 4 688 - 1 - (1,076) (963)
(5,141) (3) (108) (831) (2,392) 6 (55) (711) (1) (781) - - - - 1,400 - - - (23) (23) - (74) 381 98 959
11,015 - - - 11,015 - 2 (57) 7 (45) - 2 - 1 49
5,961 (83) (557) (366) 25,103
(4,985)$ (1,191)$ 5,278$ 1,775$ 24,333$
San Diego Data ProcessingCorporation

This Page Left Intentionally Blank
27�
fiDuCiary funDS
Fiduciary Funds
This Page Left Intentionally Blank - Back of Divider Page
27�
City of San Diego ComprehenSive annual finanCial report
FIDUCIARY FUNDS
Fiduciary funds are used to account for resources held for the benefit of parties outside the government.
The resources of fiduciary funds are not available to support the City’s programs. The accounting used for fiduciary funds is much like that used for proprietary funds.
PENSION AND EMPLOYEE SAVINGS TRUST FUNDS
CITY EMPLOYEES' RETIREMENT SYSTEM
The City Employees' Retirement System ("CERS") fund is under the control of the Retirement Board of Administration. It is a defined benefit plan, whereby funds are accumulated from contributions from both the City and employees, plus earnings from fund investments. Disbursements are made for retirements, disability and death benefit payments, and refunds.
RETIREE HEALTH INSURANCE TRUST FUND
Retiree Health Insurance Trust fund is a separate trust fund used solely for providing retiree health benefits. It is maintained by the Retirement Board of Administration to reflect all amounts the City and retirees contribute to pay retiree health benefits.
SUPPLEMENTAL PENSION SAVINGS PLAN
The Supplemental Pension Savings Plan Fund is a defined contribution plan, where benefits depend solely on amounts contributed to the plan by both the City and employees, plus investment earnings. Disbursements are made from the fund for terminations, retirements, allowable yearly withdrawals, and loans.
401(k) PLAN
The City’s 401(k) Plan Fund is a defined contribution plan, where benefits depend solely on amounts contributed to the plan by City employees, plus investment earnings. Disbursements are made from the fund for terminations, retirements, allowable yearlywithdrawals, and loans.
AGENCY FUNDS
These funds were established to account for assets held by the City as an agent for individuals, private organizations, other governments and/or funds, including federal and state income taxes withheld from employees, parking citation revenues, and employee benefit plans.
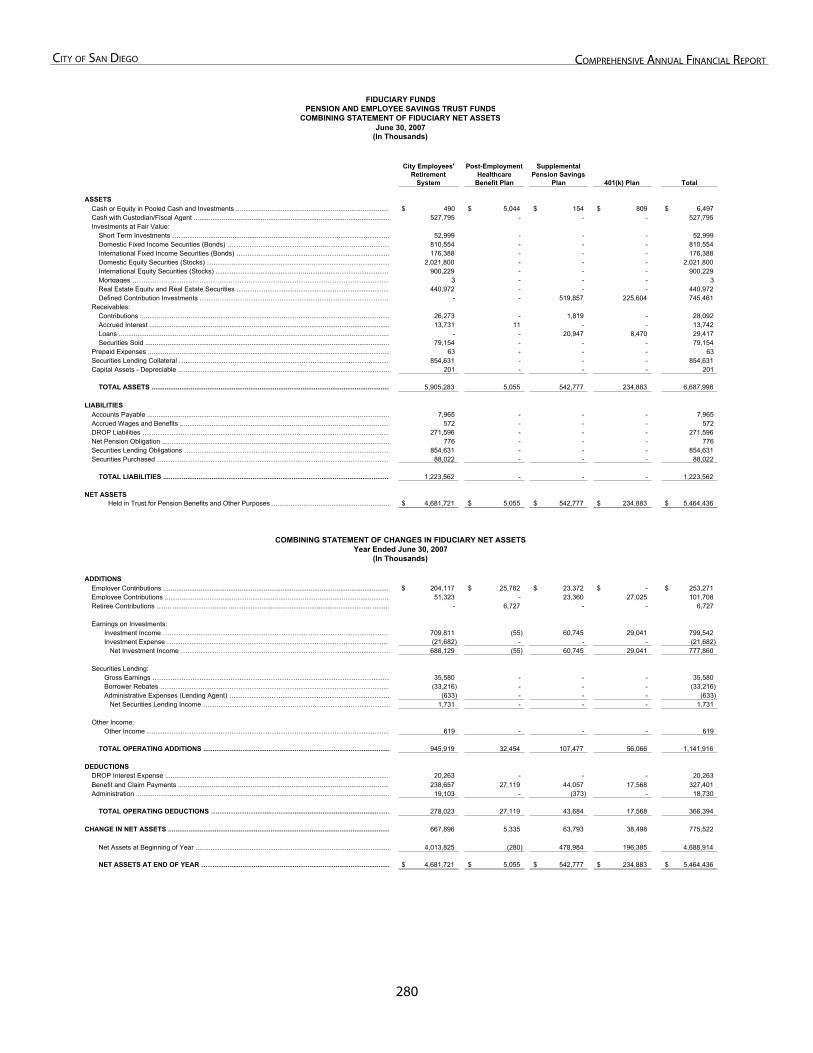
280
City of San Diego ComprehenSive annual finanCial report
June 30, 2007
Total
ASSETSCash or Equity in Pooled Cash and Investments .................................................................................. 490$ 5,044$ 154$ 809$ 6,497$ Cash with Custodian/Fiscal Agent ......................................................................................................... 527,795 - - - 527,795 Investments at Fair Value:
Short Term Investments …………...............................................................…………………………… 52,999 - - - 52,999 Domestic Fixed Income Securities (Bonds) ……………………………………...………………………… 810,554 - - - 810,554 International Fixed Income Securities (Bonds) ……………………………….…………………………… 176,388 - - - 176,388 Domestic Equity Securities (Stocks) ……………………………………….……………………………… 2,021,800 - - - 2,021,800 International Equity Securities (Stocks) …………………………………...……………………………… 900,229 - - - 900,229 Mortgages …………………………………………………………...………………………………………… 3 - - - 3 Real Estate Equity and Real Estate Securities …………………….……………………………………… 440,972 - - - 440,972 Defined Contribution Investments …………………………..……………………………………………… - - 519,857 225,604 745,461
Receivables:Contributions ...................................................................................................................................... 26,273 - 1,819 - 28,092 Accrued Interest ................................................................................................................................. 13,731 11 - - 13,742 Loans ................................................................................................................................................. - - 20,947 8,470 29,417 Securities Sold ................................................................................................................................... 79,154 - - - 79,154
Prepaid Expenses .................................................................................................................................. 63 - - - 63 Securities Lending Collateral ……………………………….………………………………………………… 854,631 - - - 854,631 Capital Assets - Depreciable ...........................................................................................………………… 201 - - - 201
TOTAL ASSETS ................................................................................................................................ 5,905,283 5,055 542,777 234,883 6,687,998
LIABILITIESAccounts Payable .................................................................................................................................. 7,965 - - - 7,965 Accrued Wages and Benefits ................................................................................................................ 572 - - - 572 DROP Liabilities ………………………………………………………………………………………………… 271,596 - - - 271,596 Net Pension Obligation .......................................................................................................................... 776 - - - 776 Securities Lending Obligations ………………………………………………...……………………………… 854,631 - - - 854,631 Securities Purchased ………………………………………………………………..………………………… 88,022 - - - 88,022
TOTAL LIABILITIES .......................................................................................................................... 1,223,562 - - - 1,223,562
NET ASSETSHeld in Trust for Pension Benefits and Other Purposes ............................................................... 4,681,721$ 5,055$ 542,777$ 234,883$ 5,464,436$
ADDITIONSEmployer Contributions .......................................................................................................................... 204,117$ 25,782$ 23,372$ -$ 253,271$ Employee Contributions ......................................................................................................................... 51,323 - 23,360 27,025 101,708 Retiree Contributions ………………………………………………...………………………………………… - 6,727 - - 6,727
Earnings on Investments: Investment Income ………………………………………………………………………………………… 709,811 (55) 60,745 29,041 799,542 Investment Expense ………………………………………………………………………………………… (21,682) - - - (21,682) Net Investment Income ………………………………………………………………………………… 688,129 (55) 60,745 29,041 777,860
Securities Lending: Gross Earnings ……………………………………………………………………………………………… 35,580 - - - 35,580 Borrower Rebates …………………………………………………………………………………………… (33,216) - - - (33,216) Administrative Expenses (Lending Agent) ……………………………………………………………… (633) - - - (633) Net Securities Lending Income ………………………………………………………………………… 1,731 - - - 1,731
Other Income: Other Income ………………………………………………………………………………………………… 619 - - - 619
TOTAL OPERATING ADDITIONS .................................................................................................... 945,919 32,454 107,477 56,066 1,141,916
DEDUCTIONS DROP Interest Expense ......................................................................................................................... 20,263 - - - 20,263 Benefit and Claim Payments .................................................................................................................. 238,657 27,119 44,057 17,568 327,401 Administration .......................................................................................................................................… 19,103 - (373) - 18,730
TOTAL OPERATING DEDUCTIONS ……………………....…….................................................…… 278,023 27,119 43,684 17,568 366,394
CHANGE IN NET ASSETS ....................................................................................................................... 667,896 5,335 63,793 38,498 775,522
Net Assets at Beginning of Year ........................................................................................................ 4,013,825 (280) 478,984 196,385 4,688,914
NET ASSETS AT END OF YEAR …….............................................................................................. 4,681,721$ 5,055$ 542,777$ 234,883$ 5,464,436$
City Employees' Retirement
System
(In Thousands)
COMBINING STATEMENT OF CHANGES IN FIDUCIARY NET ASSETSYear Ended June 30, 2007
SupplementalPension Savings
Plan 401(k) Plan
Post-EmploymentHealthcare
Benefit Plan
COMBINING STATEMENT OF FIDUCIARY NET ASSETS
FIDUCIARY FUNDS
(In Thousands)
PENSION AND EMPLOYEE SAVINGS TRUST FUNDS
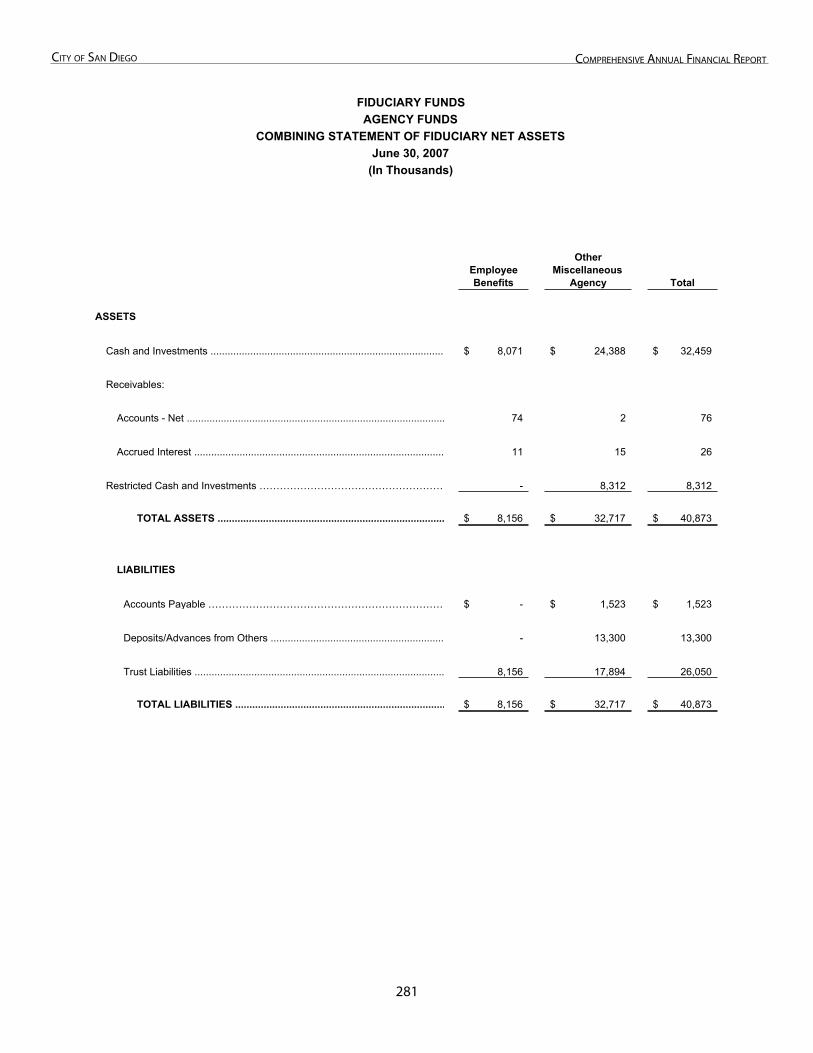
281
City of San Diego ComprehenSive annual finanCial report
Total
ASSETS
Cash and Investments .................................................................................. 8,071$ 24,388$ 32,459$
Receivables:
Accounts - Net ........................................................................................... 74 2 76
Accrued Interest ........................................................................................ 11 15 26
Restricted Cash and Investments ……………………………………………… - 8,312 8,312
TOTAL ASSETS ................................................................................ 8,156$ 32,717$ 40,873$
LIABILITIES
Accounts Payable …………………………………………………………… -$ 1,523$ 1,523$
Deposits/Advances from Others ............................................................. - 13,300 13,300
Trust Liabilities ........................................................................................ 8,156 17,894 26,050
TOTAL LIABILITIES .......................................................................... 8,156$ 32,717$ 40,873$
FIDUCIARY FUNDS
June 30, 2007(In Thousands)
COMBINING STATEMENT OF FIDUCIARY NET ASSETSAGENCY FUNDS
OtherMiscellaneous
AgencyEmployeeBenefits
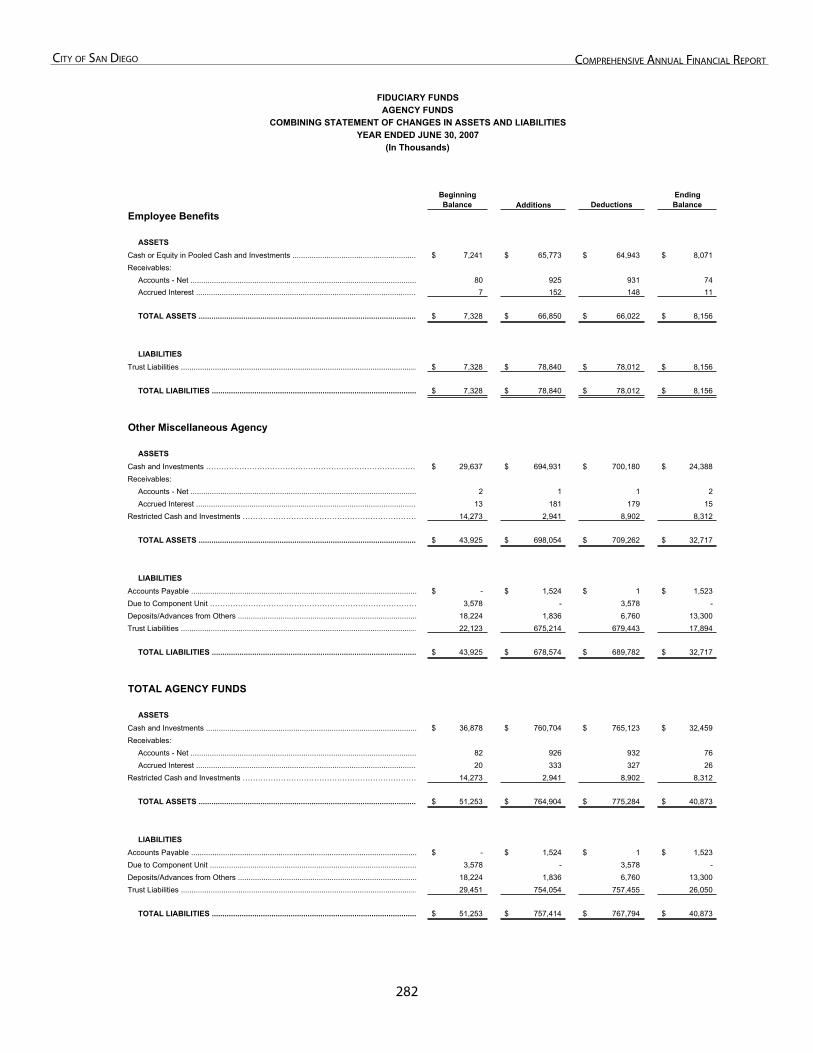
282
City of San Diego ComprehenSive annual finanCial report
BeginningBalance Additions Deductions
EndingBalance
Employee Benefits
ASSETSCash or Equity in Pooled Cash and Investments .......................................................... 7,241$ 65,773$ 64,943$ 8,071$ Receivables:
Accounts - Net .......................................................................................................... 80 925 931 74 Accrued Interest ........................................................................................................ 7 152 148 11
TOTAL ASSETS ....................................................................................................... 7,328$ 66,850$ 66,022$ 8,156$
LIABILITIESTrust Liabilities ............................................................................................................... 7,328$ 78,840$ 78,012$ 8,156$
TOTAL LIABILITIES ................................................................................................ 7,328$ 78,840$ 78,012$ 8,156$
Other Miscellaneous Agency
ASSETSCash and Investments ………………………………………………………………………… 29,637$ 694,931$ 700,180$ 24,388$ Receivables:
Accounts - Net .......................................................................................................... 2 1 1 2 Accrued Interest ........................................................................................................ 13 181 179 15
Restricted Cash and Investments …………………………………………………………… 14,273 2,941 8,902 8,312
TOTAL ASSETS ....................................................................................................... 43,925$ 698,054$ 709,262$ 32,717$
LIABILITIESAccounts Payable .......................................................................................................... -$ 1,524$ 1$ 1,523$ Due to Component Unit ……………………………………………………………………… 3,578 - 3,578 - Deposits/Advances from Others .................................................................................... 18,224 1,836 6,760 13,300 Trust Liabilities ............................................................................................................... 22,123 675,214 679,443 17,894
TOTAL LIABILITIES ................................................................................................ 43,925$ 678,574$ 689,782$ 32,717$
TOTAL AGENCY FUNDS
ASSETSCash and Investments ................................................................................................... 36,878$ 760,704$ 765,123$ 32,459$ Receivables:
Accounts - Net .......................................................................................................... 82 926 932 76 Accrued Interest ........................................................................................................ 20 333 327 26
Restricted Cash and Investments …………………………………………………………… 14,273 2,941 8,902 8,312
TOTAL ASSETS ....................................................................................................... 51,253$ 764,904$ 775,284$ 40,873$
LIABILITIESAccounts Payable .......................................................................................................... -$ 1,524$ 1$ 1,523$ Due to Component Unit ................................................................................................. 3,578 - 3,578 - Deposits/Advances from Others .................................................................................... 18,224 1,836 6,760 13,300 Trust Liabilities ............................................................................................................... 29,451 754,054 757,455 26,050
TOTAL LIABILITIES ................................................................................................ 51,253$ 757,414$ 767,794$ 40,873$
FIDUCIARY FUNDS
YEAR ENDED JUNE 30, 2007COMBINING STATEMENT OF CHANGES IN ASSETS AND LIABILITIES
(In Thousands)
AGENCY FUNDS

StatiStiCal SeCtion [not auDiteD]
StatIStIcal SectIon

This Page Left Intentionally Blank - Back of Divider Page
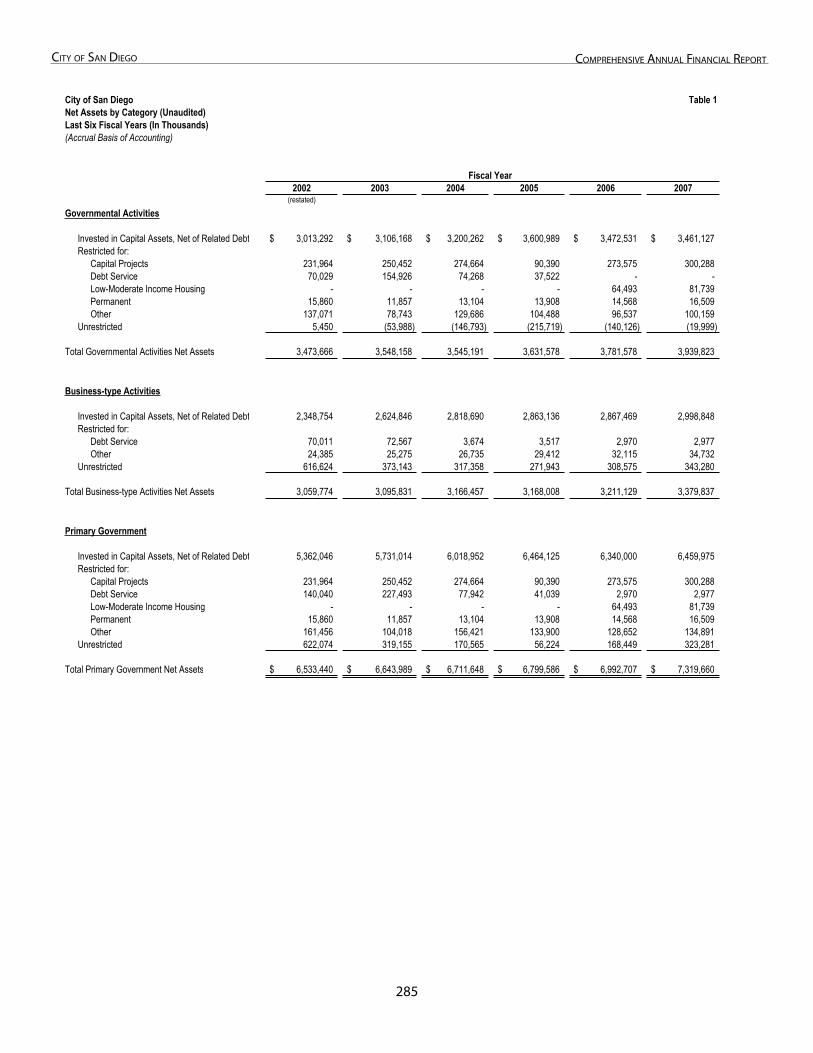
28�
City of San Diego ComprehenSive annual finanCial report
Table 1: Net Assets by Category
City of San Diego Table 1Net Assets by Category (Unaudited)Last Six Fiscal Years (In Thousands)(Accrual Basis of Accounting)
2002 2003 2004 2005 2006 2007(restated)
Governmental Activities
Invested in Capital Assets, Net of Related Debt 3,013,292$ 3,106,168$ 3,200,262$ 3,600,989$ 3,472,531$ 3,461,127$Restricted for:
Capital Projects 231,964 250,452 274,664 90,390 273,575 300,288Debt Service 70,029 154,926 74,268 37,522 - -Low-Moderate Income Housing - - - - 64,493 81,739Permanent 15,860 11,857 13,104 13,908 14,568 16,509Other 137,071 78,743 129,686 104,488 96,537 100,159
Unrestricted 5,450 (53,988) (146,793) (215,719) (140,126) (19,999)
Total Governmental Activities Net Assets 3,473,666 3,548,158 3,545,191 3,631,578 3,781,578 3,939,823
Business-type Activities
Invested in Capital Assets, Net of Related Debt 2,348,754 2,624,846 2,818,690 2,863,136 2,867,469 2,998,848Restricted for:
Debt Service 70,011 72,567 3,674 3,517 2,970 2,977Other 24,385 25,275 26,735 29,412 32,115 34,732
Unrestricted 616,624 373,143 317,358 271,943 308,575 343,280
Total Business-type Activities Net Assets 3,059,774 3,095,831 3,166,457 3,168,008 3,211,129 3,379,837
Primary Government
Invested in Capital Assets, Net of Related Debt 5,362,046 5,731,014 6,018,952 6,464,125 6,340,000 6,459,975Restricted for:
Capital Projects 231,964 250,452 274,664 90,390 273,575 300,288Debt Service 140,040 227,493 77,942 41,039 2,970 2,977Low-Moderate Income Housing - - - - 64,493 81,739Permanent 15,860 11,857 13,104 13,908 14,568 16,509Other 161,456 104,018 156,421 133,900 128,652 134,891
Unrestricted 622,074 319,155 170,565 56,224 168,449 323,281
Total Primary Government Net Assets 6,533,440$ 6,643,989$ 6,711,648$ 6,799,586$ 6,992,707$ 7,319,660$
Fiscal Year
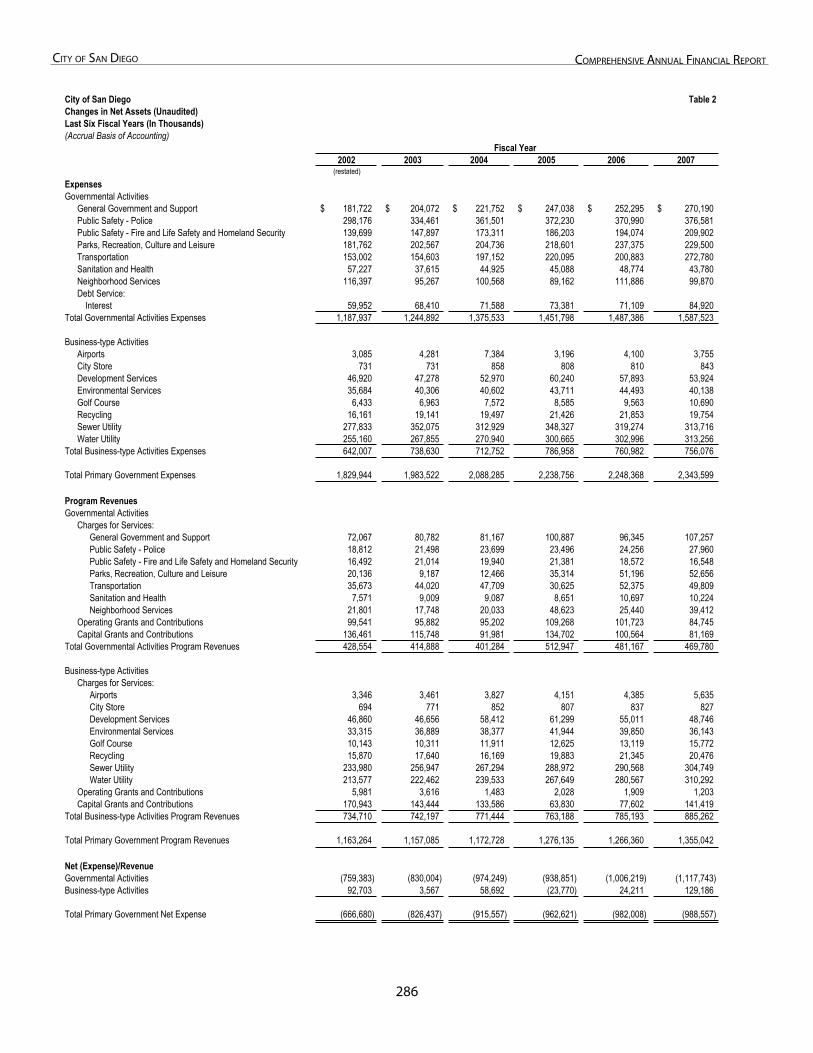
28�
City of San Diego ComprehenSive annual finanCial report
Table 2: Changes in Net Assets
City of San Diego Table 2Changes in Net Assets (Unaudited)Last Six Fiscal Years (In Thousands)(Accrual Basis of Accounting)
2002 2003 2004 2005 2006 2007(restated)
ExpensesGovernmental Activities
General Government and Support 181,722$ 204,072$ 221,752$ 247,038$ 252,295$ 270,190$Public Safety - Police 298,176 334,461 361,501 372,230 370,990 376,581Public Safety - Fire and Life Safety and Homeland Security 139,699 147,897 173,311 186,203 194,074 209,902Parks, Recreation, Culture and Leisure 181,762 202,567 204,736 218,601 237,375 229,500Transportation 153,002 154,603 197,152 220,095 200,883 272,780Sanitation and Health 57,227 37,615 44,925 45,088 48,774 43,780Neighborhood Services 116,397 95,267 100,568 89,162 111,886 99,870Debt Service:
Interest 59,952 68,410 71,588 73,381 71,109 84,920Total Governmental Activities Expenses 1,187,937 1,244,892 1,375,533 1,451,798 1,487,386 1,587,523
Business-type ActivitiesAirports 3,085 4,281 7,384 3,196 4,100 3,755City Store 731 731 858 808 810 843Development Services 46,920 47,278 52,970 60,240 57,893 53,924Environmental Services 35,684 40,306 40,602 43,711 44,493 40,138Golf Course 6,433 6,963 7,572 8,585 9,563 10,690Recycling 16,161 19,141 19,497 21,426 21,853 19,754Sewer Utility 277,833 352,075 312,929 348,327 319,274 313,716Water Utility 255,160 267,855 270,940 300,665 302,996 313,256
Total Business-type Activities Expenses 642,007 738,630 712,752 786,958 760,982 756,076
Total Primary Government Expenses 1,829,944 1,983,522 2,088,285 2,238,756 2,248,368 2,343,599
Program RevenuesGovernmental Activities
Charges for Services:General Government and Support 72,067 80,782 81,167 100,887 96,345 107,257Public Safety - Police 18,812 21,498 23,699 23,496 24,256 27,960Public Safety - Fire and Life Safety and Homeland Security 16,492 21,014 19,940 21,381 18,572 16,548Parks, Recreation, Culture and Leisure 20,136 9,187 12,466 35,314 51,196 52,656Transportation 35,673 44,020 47,709 30,625 52,375 49,809Sanitation and Health 7,571 9,009 9,087 8,651 10,697 10,224Neighborhood Services 21,801 17,748 20,033 48,623 25,440 39,412
Operating Grants and Contributions 99,541 95,882 95,202 109,268 101,723 84,745Capital Grants and Contributions 136,461 115,748 91,981 134,702 100,564 81,169
Total Governmental Activities Program Revenues 428,554 414,888 401,284 512,947 481,167 469,780
Business-type ActivitiesCharges for Services:
Airports 3,346 3,461 3,827 4,151 4,385 5,635City Store 694 771 852 807 837 827Development Services 46,860 46,656 58,412 61,299 55,011 48,746Environmental Services 33,315 36,889 38,377 41,944 39,850 36,143Golf Course 10,143 10,311 11,911 12,625 13,119 15,772Recycling 15,870 17,640 16,169 19,883 21,345 20,476Sewer Utility 233,980 256,947 267,294 288,972 290,568 304,749Water Utility 213,577 222,462 239,533 267,649 280,567 310,292
Operating Grants and Contributions 5,981 3,616 1,483 2,028 1,909 1,203Capital Grants and Contributions 170,943 143,444 133,586 63,830 77,602 141,419
Total Business-type Activities Program Revenues 734,710 742,197 771,444 763,188 785,193 885,262
Total Primary Government Program Revenues 1,163,264 1,157,085 1,172,728 1,276,135 1,266,360 1,355,042
Net (Expense)/RevenueGovernmental Activities (759,383) (830,004) (974,249) (938,851) (1,006,219) (1,117,743)Business-type Activities 92,703 3,567 58,692 (23,770) 24,211 129,186
Total Primary Government Net Expense (666,680) (826,437) (915,557) (962,621) (982,008) (988,557)
Fiscal Year
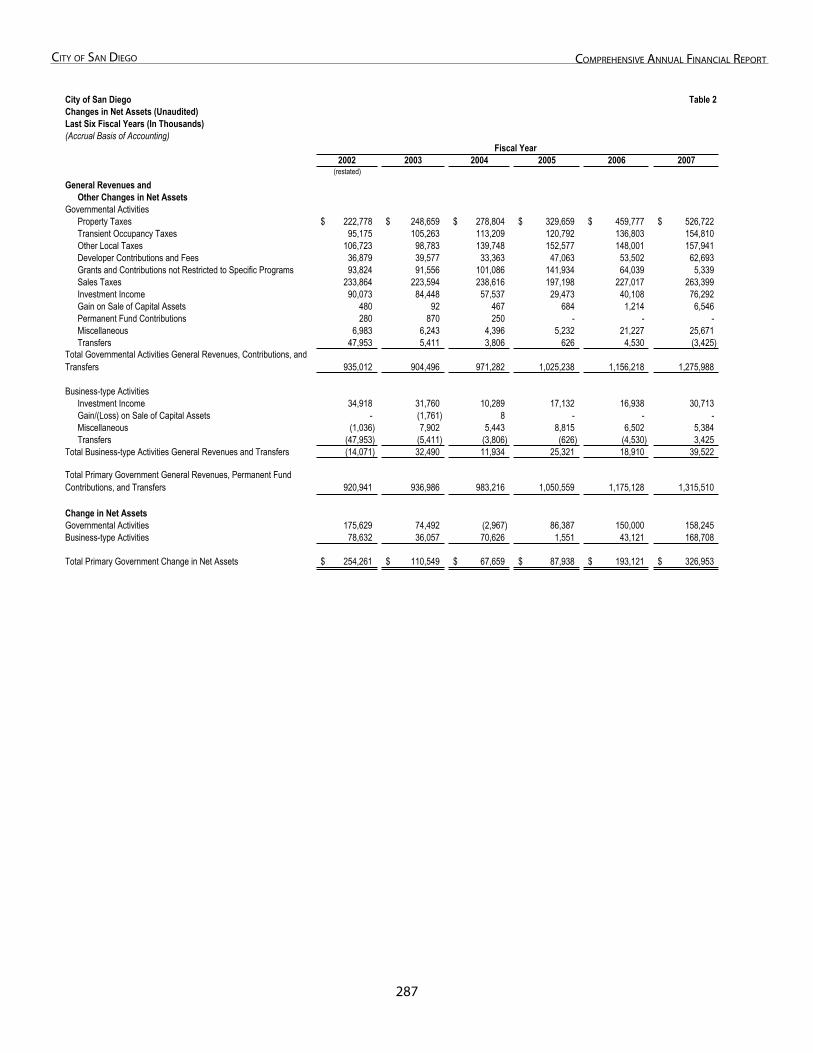
287
City of San Diego ComprehenSive annual finanCial report
City of San Diego Table 2Changes in Net Assets (Unaudited)Last Six Fiscal Years (In Thousands)(Accrual Basis of Accounting)
2002 2003 2004 2005 2006 2007(restated)
Fiscal Year
General Revenues andOther Changes in Net Assets
Governmental ActivitiesProperty Taxes 222,778$ 248,659$ 278,804$ 329,659$ 459,777$ 526,722$Transient Occupancy Taxes 95,175 105,263 113,209 120,792 136,803 154,810Other Local Taxes 106,723 98,783 139,748 152,577 148,001 157,941Developer Contributions and Fees 36,879 39,577 33,363 47,063 53,502 62,693Grants and Contributions not Restricted to Specific Programs 93,824 91,556 101,086 141,934 64,039 5,339Sales Taxes 233,864 223,594 238,616 197,198 227,017 263,399Investment Income 90,073 84,448 57,537 29,473 40,108 76,292Gain on Sale of Capital Assets 480 92 467 684 1,214 6,546Permanent Fund Contributions 280 870 250 - - -Miscellaneous 6,983 6,243 4,396 5,232 21,227 25,671Transfers 47,953 5,411 3,806 626 4,530 (3,425)
935,012 904,496 971,282 1,025,238 1,156,218 1,275,988
Business-type ActivitiesInvestment Income 34,918 31,760 10,289 17,132 16,938 30,713Gain/(Loss) on Sale of Capital Assets - (1,761) 8 - - -Miscellaneous (1,036) 7,902 5,443 8,815 6,502 5,384Transfers (47,953) (5,411) (3,806) (626) (4,530) 3,425
Total Business-type Activities General Revenues and Transfers (14,071) 32,490 11,934 25,321 18,910 39,522
920,941 936,986 983,216 1,050,559 1,175,128 1,315,510
Change in Net AssetsGovernmental Activities 175,629 74,492 (2,967) 86,387 150,000 158,245Business-type Activities 78,632 36,057 70,626 1,551 43,121 168,708
Total Primary Government Change in Net Assets 254,261$ 110,549$ 67,659$ 87,938$ 193,121$ 326,953$
Total Governmental Activities General Revenues, Contributions, and Transfers
Total Primary Government General Revenues, Permanent Fund Contributions, and Transfers
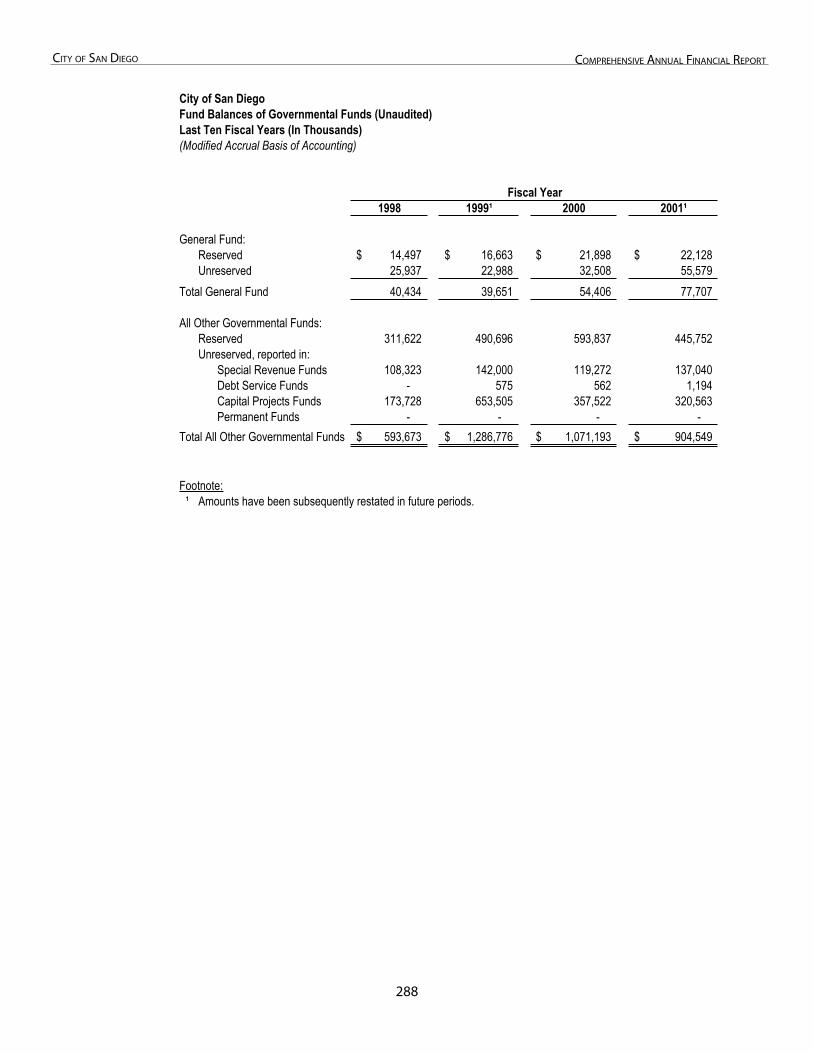
288
City of San Diego ComprehenSive annual finanCial report
Table 3: Fund Balances of Governmental Funds
City of San DiegoFund Balances of Governmental Funds (Unaudited)Last Ten Fiscal Years (In Thousands)(Modified Accrual Basis of Accounting)
1998 1999¹ 2000 2001¹
General Fund:Reserved 14,497$ 16,663$ 21,898$ 22,128$Unreserved 25,937 22,988 32,508 55,579
Total General Fund 40,434 39,651 54,406 77,707
All Other Governmental Funds:Reserved 311,622 490,696 593,837 445,752Unreserved, reported in:
Special Revenue Funds 108,323 142,000 119,272 137,040Debt Service Funds - 575 562 1,194Capital Projects Funds 173,728 653,505 357,522 320,563Permanent Funds - - - -
Total All Other Governmental Funds 593,673$ 1,286,776$ 1,071,193$ 904,549$
Footnote:¹ Amounts have been subsequently restated in future periods.
Fiscal Year
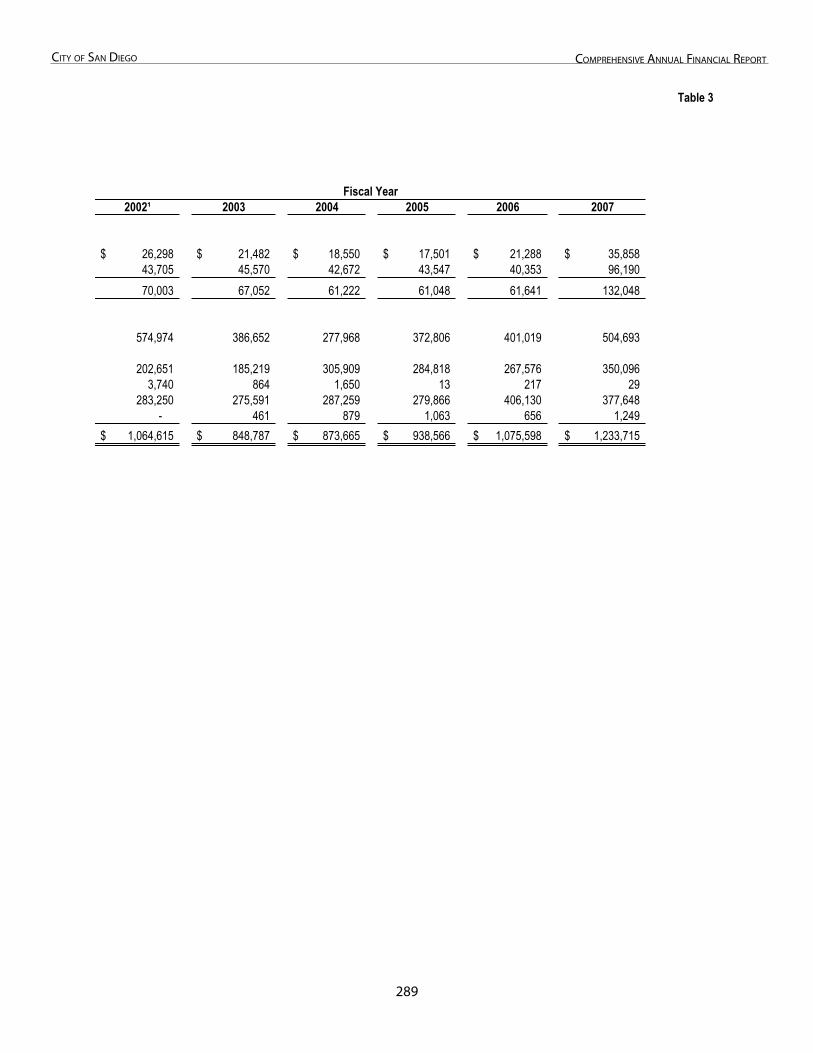
28�
City of San Diego ComprehenSive annual finanCial report
Table 3
2002¹ 2003 2004 2005 2006 2007
26,298$ 21,482$ 18,550$ 17,501$ 21,288$ 35,858$43,705 45,570 42,672 43,547 40,353 96,19070,003 67,052 61,222 61,048 61,641 132,048
574,974 386,652 277,968 372,806 401,019 504,693
202,651 185,219 305,909 284,818 267,576 350,0963,740 864 1,650 13 217 29
283,250 275,591 287,259 279,866 406,130 377,648- 461 879 1,063 656 1,249
1,064,615$ 848,787$ 873,665$ 938,566$ 1,075,598$ 1,233,715$
Fiscal Year
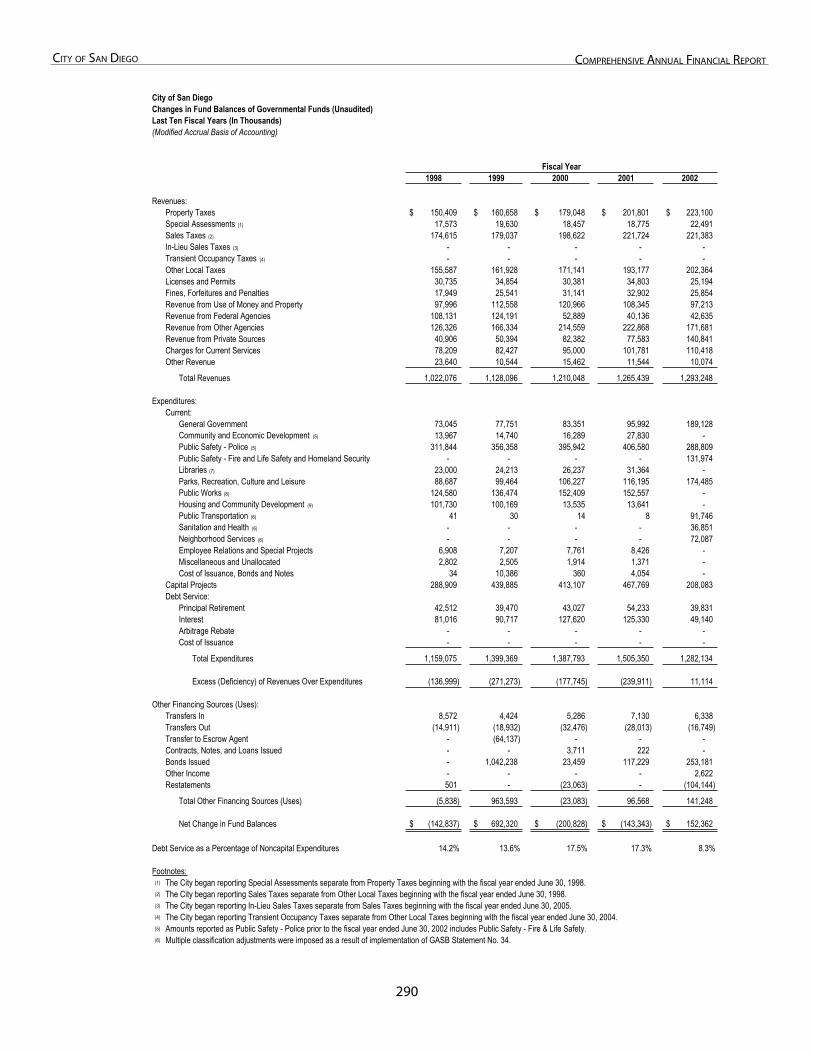
2�0
City of San Diego ComprehenSive annual finanCial report
Table 4: Changes in Fund Balances of Governmental Funds
City of San DiegoChanges in Fund Balances of Governmental Funds (Unaudited)Last Ten Fiscal Years (In Thousands)(Modified Accrual Basis of Accounting)
1998 1999 2000 2001 2002
Revenues:Property Taxes 150,409$ 160,658$ 179,048$ 201,801$ 223,100$ Special Assessments (1) 17,573 19,630 18,457 18,775 22,491 Sales Taxes (2) 174,615 179,037 198,622 221,724 221,383 In-Lieu Sales Taxes (3) - - - - - Transient Occupancy Taxes (4) - - - - - Other Local Taxes 155,587 161,928 171,141 193,177 202,364 Licenses and Permits 30,735 34,854 30,381 34,803 25,194 Fines, Forfeitures and Penalties 17,949 25,541 31,141 32,902 25,854 Revenue from Use of Money and Property 97,996 112,558 120,966 108,345 97,213 Revenue from Federal Agencies 108,131 124,191 52,889 40,136 42,635 Revenue from Other Agencies 126,326 166,334 214,559 222,868 171,681 Revenue from Private Sources 40,906 50,394 82,382 77,583 140,841 Charges for Current Services 78,209 82,427 95,000 101,781 110,418 Other Revenue 23,640 10,544 15,462 11,544 10,074
Total Revenues 1,022,076 1,128,096 1,210,048 1,265,439 1,293,248
Expenditures:Current:
General Government 73,045 77,751 83,351 95,992 189,128 Community and Economic Development (5) 13,967 14,740 16,289 27,830 - Public Safety - Police (5) 311,844 356,358 395,942 406,580 288,809 Public Safety - Fire and Life Safety and Homeland Security - - - - 131,974 Libraries (7) 23,000 24,213 26,237 31,364 - Parks, Recreation, Culture and Leisure 88,687 99,464 106,227 116,195 174,485 Public Works (8) 124,580 136,474 152,409 152,557 - Housing and Community Development (9) 101,730 100,169 13,535 13,641 - Public Transportation (6) 41 30 14 8 91,746 Sanitation and Health (6) - - - - 36,851 Neighborhood Services (6) - - - - 72,087 Employee Relations and Special Projects 6,908 7,207 7,761 8,426 - Miscellaneous and Unallocated 2,802 2,505 1,914 1,371 - Cost of Issuance, Bonds and Notes 34 10,386 360 4,054 -
Capital Projects 288,909 439,885 413,107 467,769 208,083 Debt Service:
Principal Retirement 42,512 39,470 43,027 54,233 39,831 Interest 81,016 90,717 127,620 125,330 49,140 Arbitrage Rebate - - - - - Cost of Issuance - - - - -
Total Expenditures 1,159,075 1,399,369 1,387,793 1,505,350 1,282,134
Excess (Deficiency) of Revenues Over Expenditures (136,999) (271,273) (177,745) (239,911) 11,114
Other Financing Sources (Uses):Transfers In 8,572 4,424 5,286 7,130 6,338 Transfers Out (14,911) (18,932) (32,476) (28,013) (16,749) Transfer to Escrow Agent - (64,137) - - - Contracts, Notes, and Loans Issued - - 3,711 222 - Bonds Issued - 1,042,238 23,459 117,229 253,181 Other Income - - - - 2,622 Restatements 501 - (23,063) - (104,144)
Total Other Financing Sources (Uses) (5,838) 963,593 (23,083) 96,568 141,248
Net Change in Fund Balances (142,837)$ 692,320$ (200,828)$ (143,343)$ 152,362$
Debt Service as a Percentage of Noncapital Expenditures 14.2% 13.6% 17.5% 17.3% 8.3%
Footnotes:(1) The City began reporting Special Assessments separate from Property Taxes beginning with the fiscal year ended June 30, 1998.(2) The City began reporting Sales Taxes separate from Other Local Taxes beginning with the fiscal year ended June 30, 1998.(3) The City began reporting In-Lieu Sales Taxes separate from Sales Taxes beginning with the fiscal year ended June 30, 2005.(4) The City began reporting Transient Occupancy Taxes separate from Other Local Taxes beginning with the fiscal year ended June 30, 2004.(5) Amounts reported as Public Safety - Police prior to the fiscal year ended June 30, 2002 includes Public Safety - Fire & Life Safety.(6) Multiple classification adjustments were imposed as a result of implementation of GASB Statement No. 34.
Fiscal Year
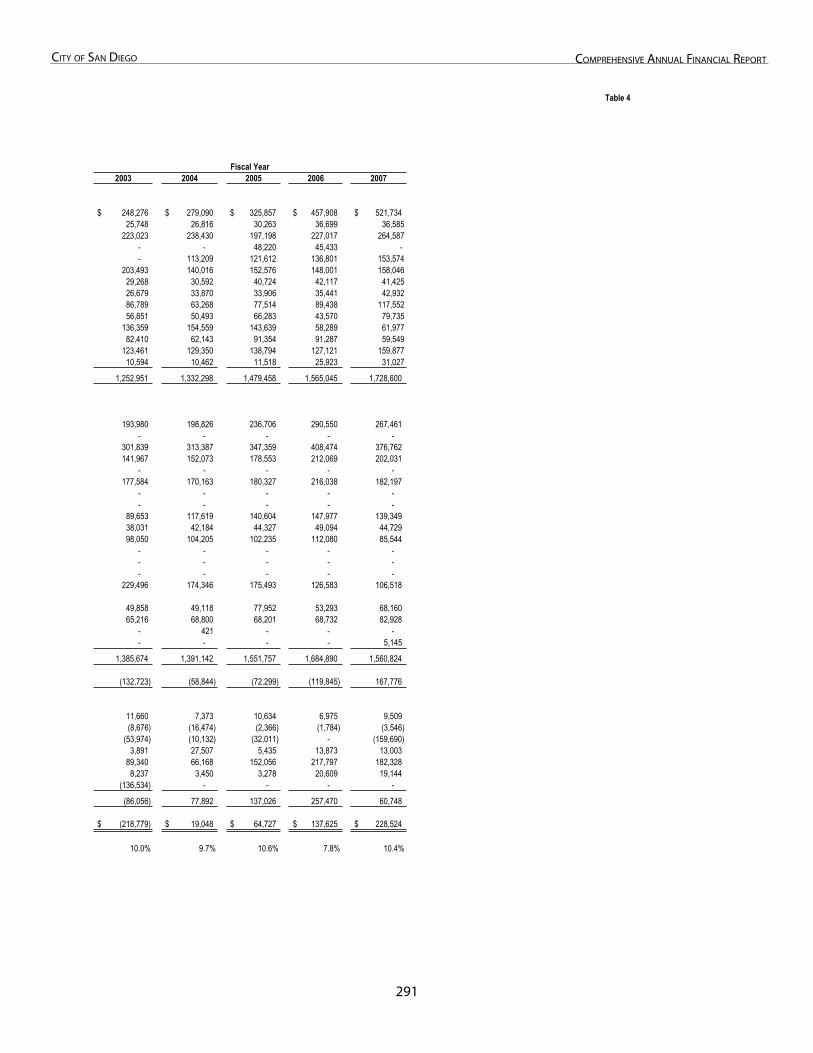
2�1
City of San Diego ComprehenSive annual finanCial report
Table 4
2003 2004 2005 2006 2007
248,276$ 279,090$ 325,857$ 457,908$ 521,734$ 25,748 26,816 30,263 36,699 36,585
223,023 238,430 197,198 227,017 264,587- - 48,220 45,433 - - 113,209 121,612 136,801 153,574
203,493 140,016 152,576 148,001 158,04629,268 30,592 40,724 42,117 41,42526,679 33,870 33,906 35,441 42,93286,789 63,268 77,514 89,438 117,55256,851 50,493 66,283 43,570 79,735
136,359 154,559 143,639 58,289 61,97782,410 62,143 91,354 91,287 59,549
123,461 129,350 138,794 127,121 159,87710,594 10,462 11,518 25,923 31,027
1,252,951 1,332,298 1,479,458 1,565,045 1,728,600
193,980 198,826 236,706 290,550 267,461 - - - - -
301,839 313,387 347,359 408,474 376,762 141,967 152,073 178,553 212,069 202,031
- - - - - 177,584 170,163 180,327 216,038 182,197
- - - - - - - - - -
89,653 117,619 140,604 147,977 139,349 38,031 42,184 44,327 49,094 44,729 98,050 104,205 102,235 112,080 85,544
- - - - - - - - - - - - - - -
229,496 174,346 175,493 126,583 106,518
49,858 49,118 77,952 53,293 68,160 65,216 68,800 68,201 68,732 82,928
- 421 - - - - - - - 5,145
1,385,674 1,391,142 1,551,757 1,684,890 1,560,824
(132,723) (58,844) (72,299) (119,845) 167,776
11,660 7,373 10,634 6,975 9,509 (8,676) (16,474) (2,366) (1,784) (3,546)
(53,974) (10,132) (32,011) - (159,690) 3,891 27,507 5,435 13,873 13,003
89,340 66,168 152,056 217,797 182,328 8,237 3,450 3,278 20,609 19,144
(136,534) - - - -
(86,056) 77,892 137,026 257,470 60,748
(218,779)$ 19,048$ 64,727$ 137,625$ 228,524$
10.0% 9.7% 10.6% 7.8% 10.4%
Fiscal Year
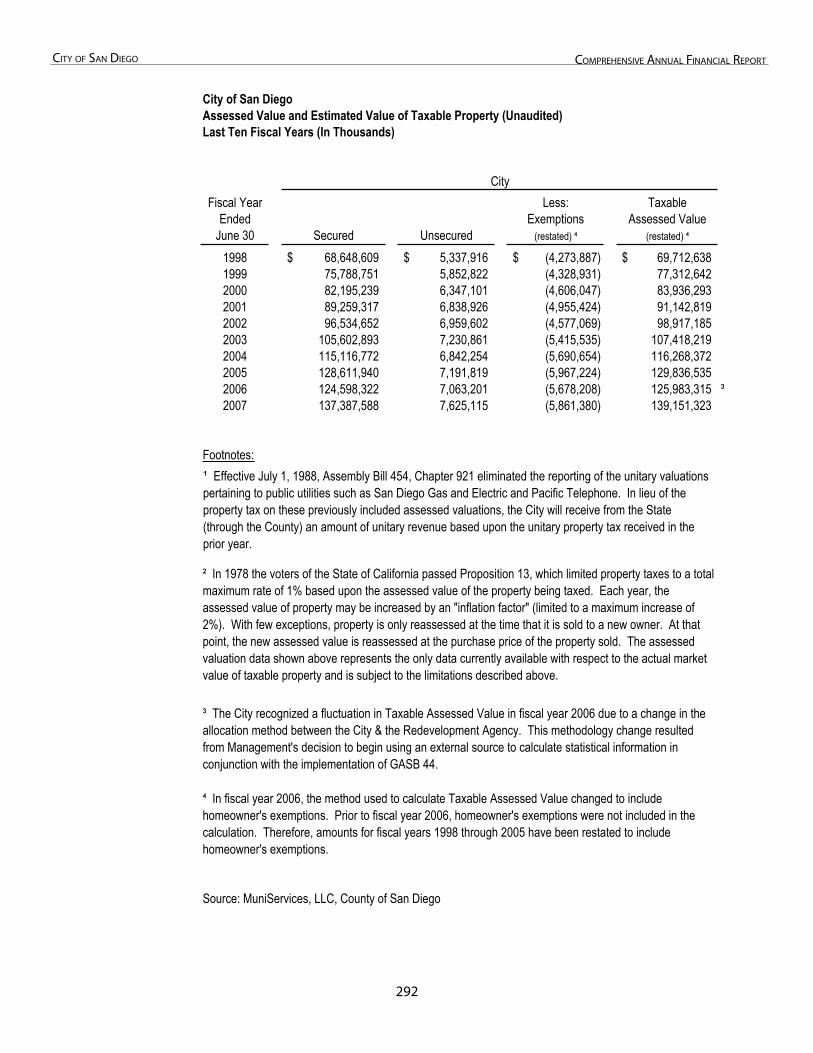
2�2
City of San Diego ComprehenSive annual finanCial report
Table 5: Assessed Value and Estimated Actual Value of Taxable Property
City of San DiegoAssessed Value and Estimated Value of Taxable Property (Unaudited)Last Ten Fiscal Years (In Thousands)
Fiscal Year Less: TaxableEnded Exemptions Assessed Value
June 30 Secured Unsecured (restated) (restated)
1998 68,648,609$ 5,337,916$ (4,273,887)$ 69,712,638$ 1999 75,788,751 5,852,822 (4,328,931) 77,312,6422000 82,195,239 6,347,101 (4,606,047) 83,936,2932001 89,259,317 6,838,926 (4,955,424) 91,142,8192002 96,534,652 6,959,602 (4,577,069) 98,917,1852003 105,602,893 7,230,861 (5,415,535) 107,418,2192004 115,116,772 6,842,254 (5,690,654) 116,268,3722005 128,611,940 7,191,819 (5,967,224) 129,836,5352006 124,598,322 7,063,201 (5,678,208) 125,983,315 ³2007 137,387,588 7,625,115 (5,861,380) 139,151,323
Footnotes:
Source: MuniServices, LLC, County of San Diego
City
In fiscal year 2006, the method used to calculate Taxable Assessed Value changed to include homeowner's exemptions. Prior to fiscal year 2006, homeowner's exemptions were not included in the calculation. Therefore, amounts for fiscal years 1998 through 2005 have been restated to include homeowner's exemptions.
³ The City recognized a fluctuation in Taxable Assessed Value in fiscal year 2006 due to a change in the allocation method between the City & the Redevelopment Agency. This methodology change resulted from Management's decision to begin using an external source to calculate statistical information in conjunction with the implementation of GASB 44.
² In 1978 the voters of the State of California passed Proposition 13, which limited property taxes to a total maximum rate of 1% based upon the assessed value of the property being taxed. Each year, the assessed value of property may be increased by an "inflation factor" (limited to a maximum increase of 2%). With few exceptions, property is only reassessed at the time that it is sold to a new owner. At that point, the new assessed value is reassessed at the purchase price of the property sold. The assessed valuation data shown above represents the only data currently available with respect to the actual market value of taxable property and is subject to the limitations described above.
¹ Effective July 1, 1988, Assembly Bill 454, Chapter 921 eliminated the reporting of the unitary valuations pertaining to public utilities such as San Diego Gas and Electric and Pacific Telephone. In lieu of the property tax on these previously included assessed valuations, the City will receive from the State (through the County) an amount of unitary revenue based upon the unitary property tax received in the prior year.
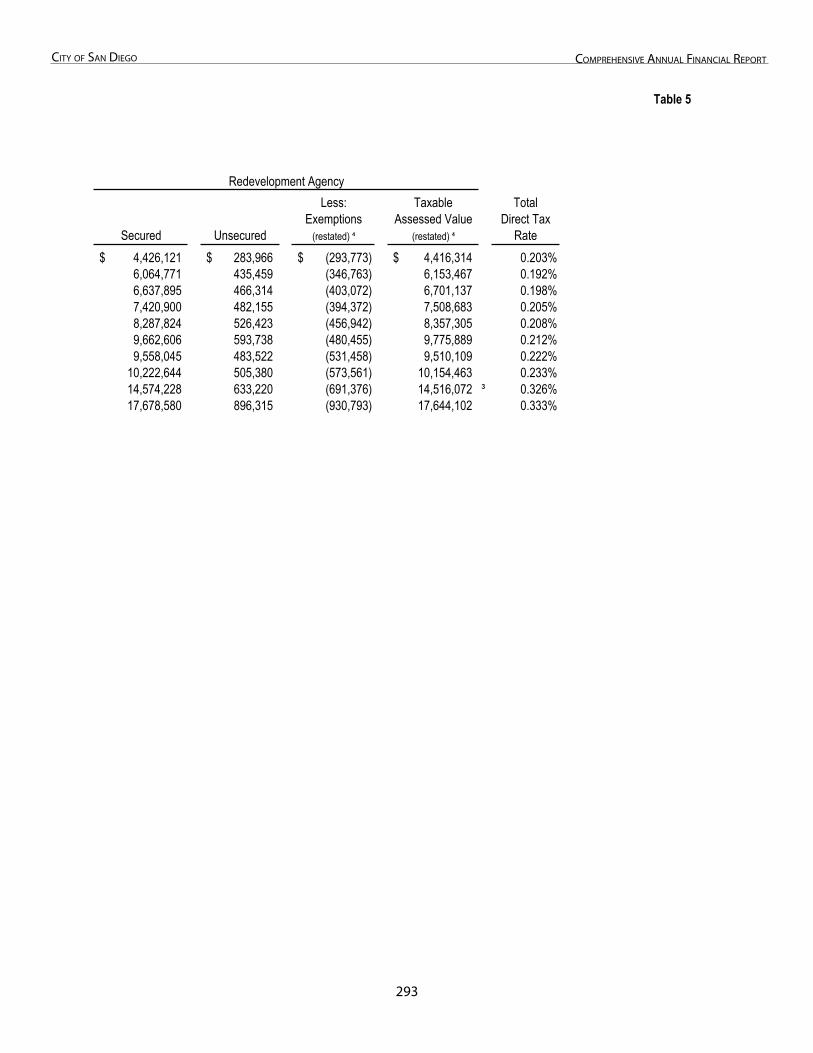
2�3
City of San Diego ComprehenSive annual finanCial report
Table 5
Less: Taxable TotalExemptions Assessed Value Direct Tax
Secured Unsecured (restated) (restated) Rate4,426,121$ 283,966$ (293,773)$ 4,416,314$ 0.203%6,064,771 435,459 (346,763) 6,153,467 0.192%6,637,895 466,314 (403,072) 6,701,137 0.198%7,420,900 482,155 (394,372) 7,508,683 0.205%8,287,824 526,423 (456,942) 8,357,305 0.208%9,662,606 593,738 (480,455) 9,775,889 0.212%9,558,045 483,522 (531,458) 9,510,109 0.222%
10,222,644 505,380 (573,561) 10,154,463 0.233%14,574,228 633,220 (691,376) 14,516,072 ³ 0.326%17,678,580 896,315 (930,793) 17,644,102 0.333%
Redevelopment Agency
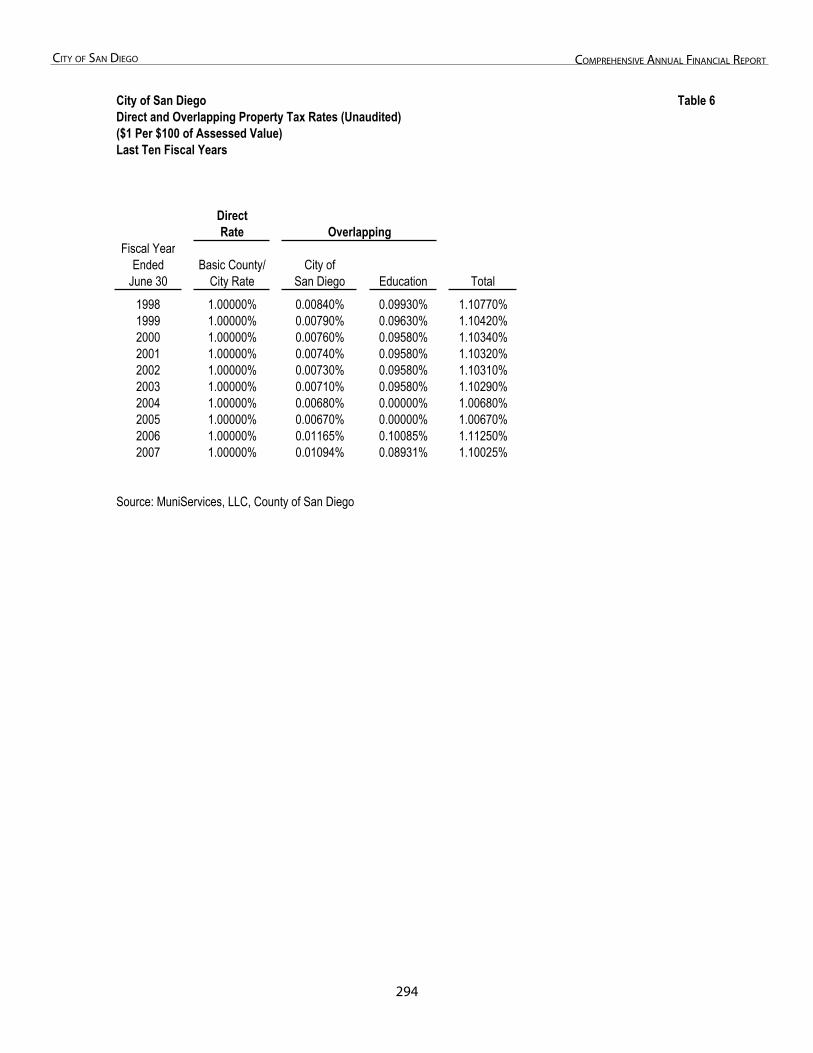
2��
City of San Diego ComprehenSive annual finanCial report
Table 6: Direct and Overlapping Property Tax Rates
City of San Diego Table 6Direct and Overlapping Property Tax Rates (Unaudited)($1 Per $100 of Assessed Value)Last Ten Fiscal Years
DirectRate
Fiscal YearEnded Basic County/ City of
June 30 City Rate San Diego Education Total
1998 1.00000% 0.00840% 0.09930% 1.10770%1999 1.00000% 0.00790% 0.09630% 1.10420%2000 1.00000% 0.00760% 0.09580% 1.10340%2001 1.00000% 0.00740% 0.09580% 1.10320%2002 1.00000% 0.00730% 0.09580% 1.10310%2003 1.00000% 0.00710% 0.09580% 1.10290%2004 1.00000% 0.00680% 0.00000% 1.00680%2005 1.00000% 0.00670% 0.00000% 1.00670%2006 1.00000% 0.01165% 0.10085% 1.11250%2007 1.00000% 0.01094% 0.08931% 1.10025%
Source: MuniServices, LLC, County of San Diego
Overlapping
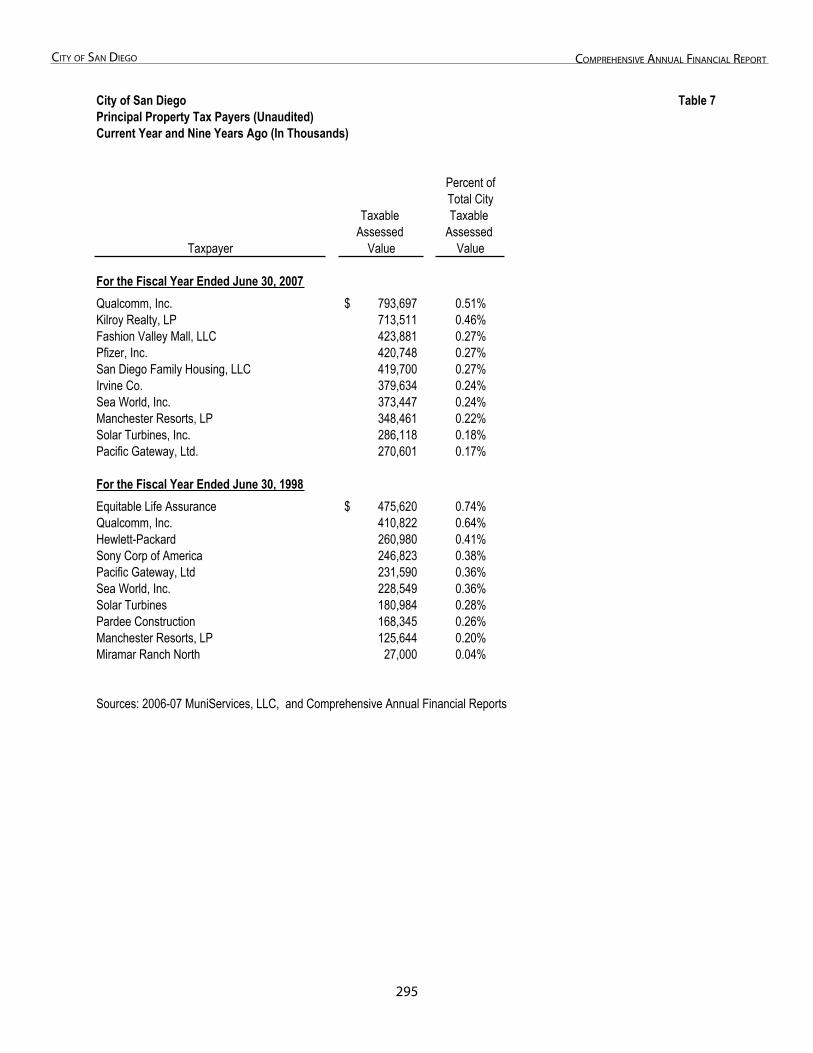
2��
City of San Diego ComprehenSive annual finanCial report
Table 7: Principal Property Tax Payers
City of San Diego Table 7Principal Property Tax Payers (Unaudited)Current Year and Nine Years Ago (In Thousands)
Percent ofTotal City
Taxable Taxable Assessed Assessed
Taxpayer Value Value
For the Fiscal Year Ended June 30, 2007Qualcomm, Inc. 793,697$ 0.51%Kilroy Realty, LP 713,511 0.46%Fashion Valley Mall, LLC 423,881 0.27%Pfizer, Inc. 420,748 0.27%San Diego Family Housing, LLC 419,700 0.27%Irvine Co. 379,634 0.24%Sea World, Inc. 373,447 0.24%Manchester Resorts, LP 348,461 0.22%Solar Turbines, Inc. 286,118 0.18%Pacific Gateway, Ltd. 270,601 0.17%
For the Fiscal Year Ended June 30, 1998Equitable Life Assurance 475,620$ 0.74%Qualcomm, Inc. 410,822 0.64%Hewlett-Packard 260,980 0.41%Sony Corp of America 246,823 0.38%Pacific Gateway, Ltd 231,590 0.36%Sea World, Inc. 228,549 0.36%Solar Turbines 180,984 0.28%Pardee Construction 168,345 0.26%Manchester Resorts, LP 125,644 0.20%Miramar Ranch North 27,000 0.04%
Sources: 2006-07 MuniServices, LLC, and Comprehensive Annual Financial Reports
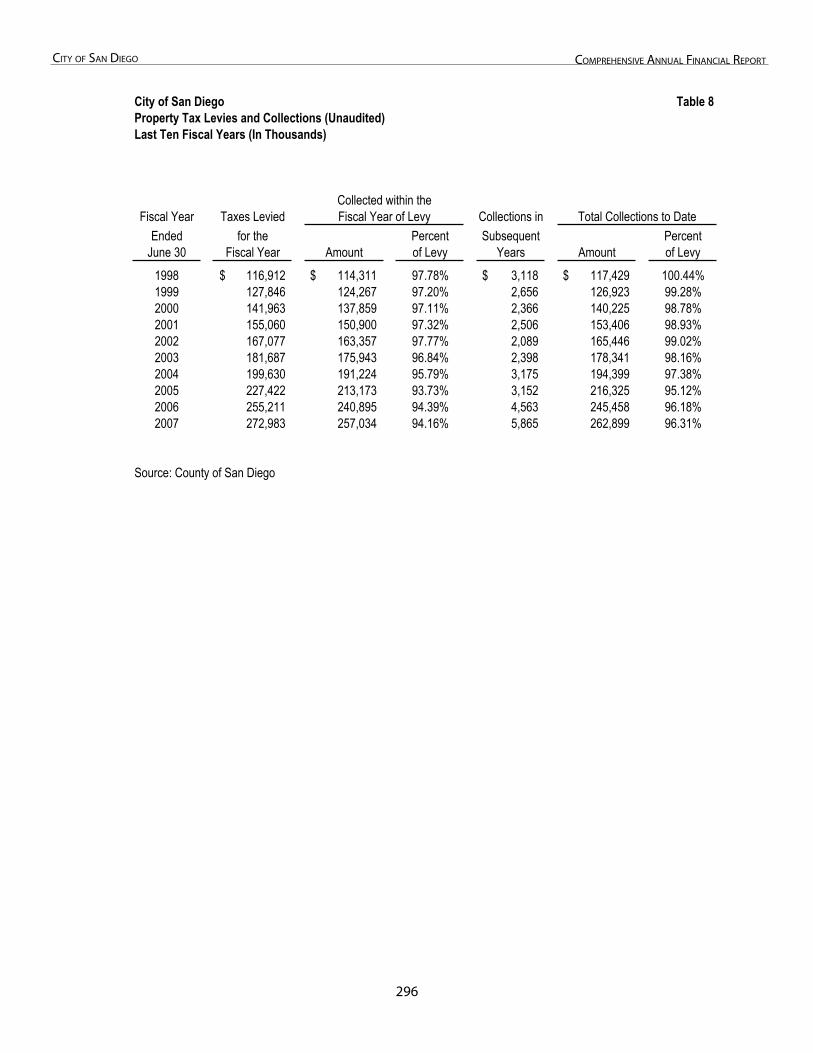
2��
City of San Diego ComprehenSive annual finanCial report
Table 8: Property Tax Levies and Collections
City of San Diego Table 8Property Tax Levies and Collections (Unaudited)Last Ten Fiscal Years (In Thousands)
Fiscal Year Taxes Levied Collections inEnded for the Percent Subsequent Percent
June 30 Fiscal Year Amount of Levy Years Amount of Levy
1998 116,912$ 114,311$ 97.78% 3,118$ 117,429$ 100.44%1999 127,846 124,267 97.20% 2,656 126,923 99.28%2000 141,963 137,859 97.11% 2,366 140,225 98.78%2001 155,060 150,900 97.32% 2,506 153,406 98.93%2002 167,077 163,357 97.77% 2,089 165,446 99.02%2003 181,687 175,943 96.84% 2,398 178,341 98.16%2004 199,630 191,224 95.79% 3,175 194,399 97.38%2005 227,422 213,173 93.73% 3,152 216,325 95.12%2006 255,211 240,895 94.39% 4,563 245,458 96.18%2007 272,983 257,034 94.16% 5,865 262,899 96.31%
Source: County of San Diego
Collected within theFiscal Year of Levy Total Collections to Date

This Page Left Intentionally Blank
2�7
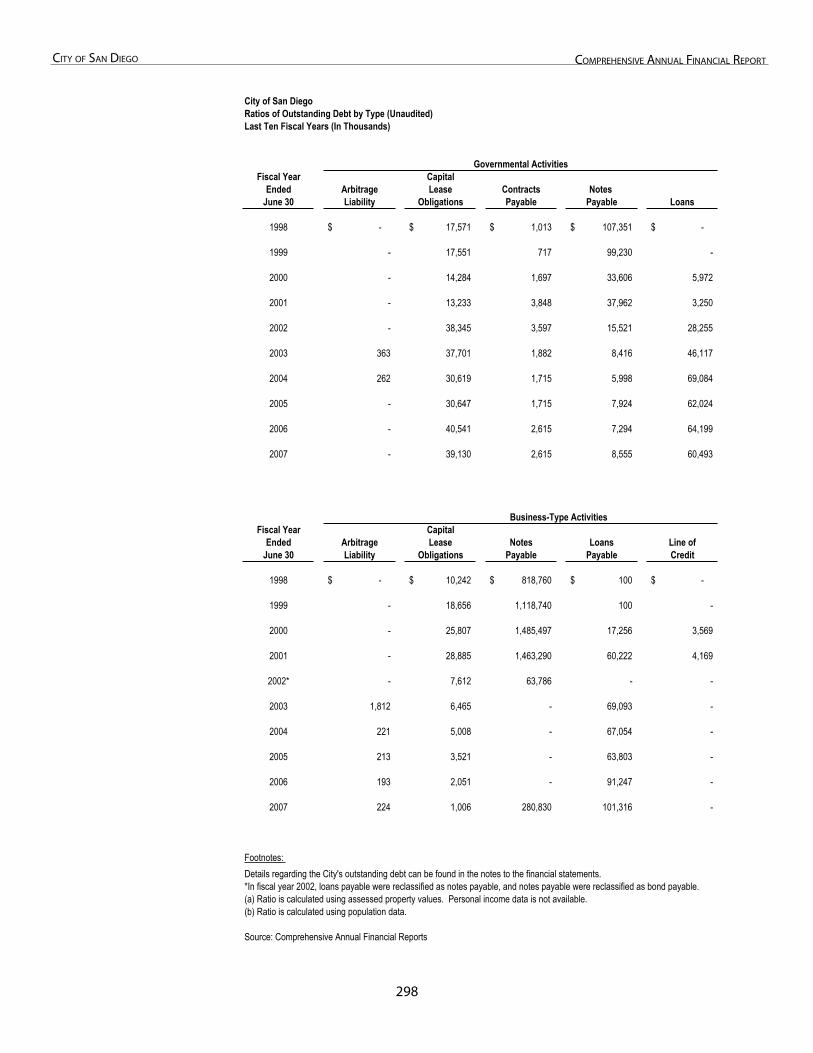
2�8
City of San Diego ComprehenSive annual finanCial report
Table 9: Ratios of Outstanding Debt by Type
City of San DiegoRatios of Outstanding Debt by Type (Unaudited)Last Ten Fiscal Years (In Thousands)
Fiscal Year CapitalEnded Arbitrage Lease Contracts Notes
June 30 Liability Obligations Payable Payable Loans
1998 -$ 17,571$ 1,013$ 107,351$ -$
1999 - 17,551 717 99,230 -
2000 - 14,284 1,697 33,606 5,972
2001 - 13,233 3,848 37,962 3,250
2002 - 38,345 3,597 15,521 28,255
2003 363 37,701 1,882 8,416 46,117
2004 262 30,619 1,715 5,998 69,084
2005 - 30,647 1,715 7,924 62,024
2006 - 40,541 2,615 7,294 64,199
2007 - 39,130 2,615 8,555 60,493
Business-Type ActivitiesFiscal Year Capital
Ended Arbitrage Lease Notes Loans Line ofJune 30 Liability Obligations Payable Payable Credit
1998 -$ 10,242$ 818,760$ 100$ -$
1999 - 18,656 1,118,740 100 -
2000 - 25,807 1,485,497 17,256 3,569
2001 - 28,885 1,463,290 60,222 4,169
2002* - 7,612 63,786 - -
2003 1,812 6,465 - 69,093 -
2004 221 5,008 - 67,054 -
2005 213 3,521 - 63,803 -
2006 193 2,051 - 91,247 -
2007 224 1,006 280,830 101,316 -
Footnotes:Details regarding the City's outstanding debt can be found in the notes to the financial statements.*In fiscal year 2002, loans payable were reclassified as notes payable, and notes payable were reclassified as bond payable.(a) Ratio is calculated using assessed property values. Personal income data is not available.(b) Ratio is calculated using population data.
Source: Comprehensive Annual Financial Reports
Governmental Activities
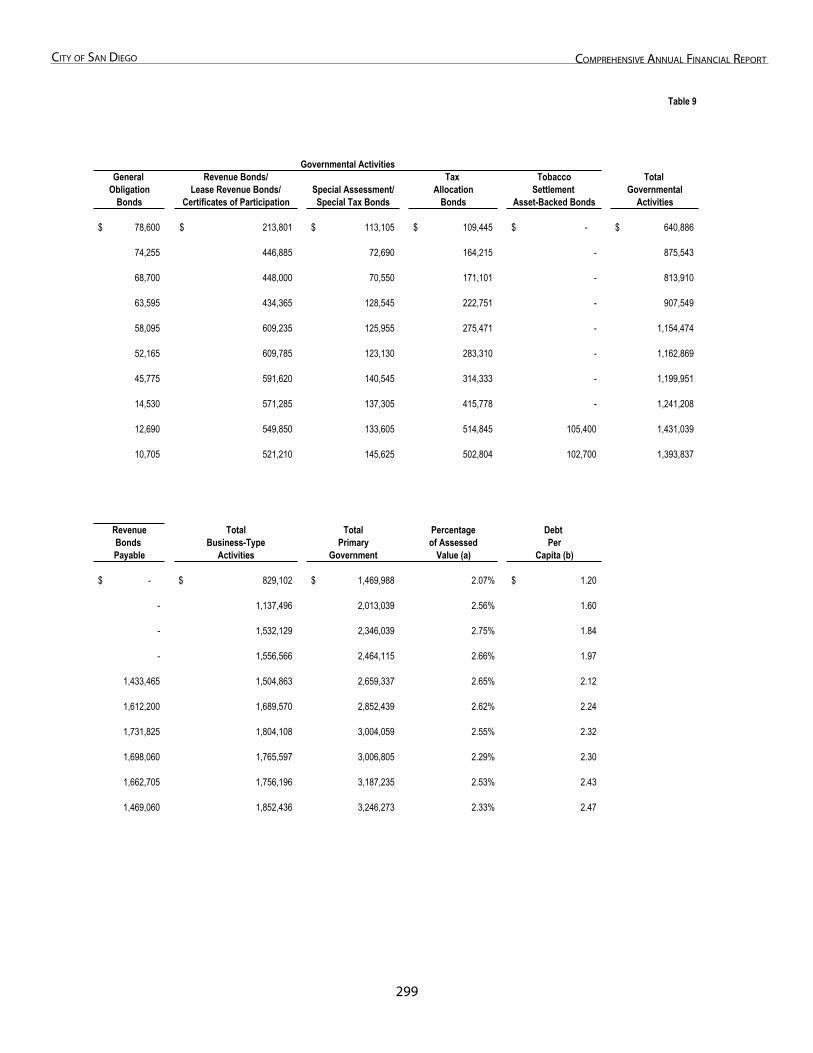
2��
City of San Diego ComprehenSive annual finanCial report
Table 9
Governmental ActivitiesGeneral Revenue Bonds/ Tax Tobacco Total
Obligation Lease Revenue Bonds/ Special Assessment/ Allocation Settlement GovernmentalBonds Certificates of Participation Special Tax Bonds Bonds Asset-Backed Bonds Activities
78,600$ 213,801$ 113,105$ 109,445$ -$ 640,886$
74,255 446,885 72,690 164,215 - 875,543
68,700 448,000 70,550 171,101 - 813,910
63,595 434,365 128,545 222,751 - 907,549
58,095 609,235 125,955 275,471 - 1,154,474
52,165 609,785 123,130 283,310 - 1,162,869
45,775 591,620 140,545 314,333 - 1,199,951
14,530 571,285 137,305 415,778 - 1,241,208
12,690 549,850 133,605 514,845 105,400 1,431,039
10,705 521,210 145,625 502,804 102,700 1,393,837
Revenue Total Total Percentage Debt Bonds Business-Type Primary of Assessed PerPayable Activities Government Value (a) Capita (b)
-$ 829,102$ 1,469,988$ 2.07% 1.20$
- 1,137,496 2,013,039 2.56% 1.60
- 1,532,129 2,346,039 2.75% 1.84
- 1,556,566 2,464,115 2.66% 1.97
1,433,465 1,504,863 2,659,337 2.65% 2.12
1,612,200 1,689,570 2,852,439 2.62% 2.24
1,731,825 1,804,108 3,004,059 2.55% 2.32
1,698,060 1,765,597 3,006,805 2.29% 2.30
1,662,705 1,756,196 3,187,235 2.53% 2.43
1,469,060 1,852,436 3,246,273 2.33% 2.47
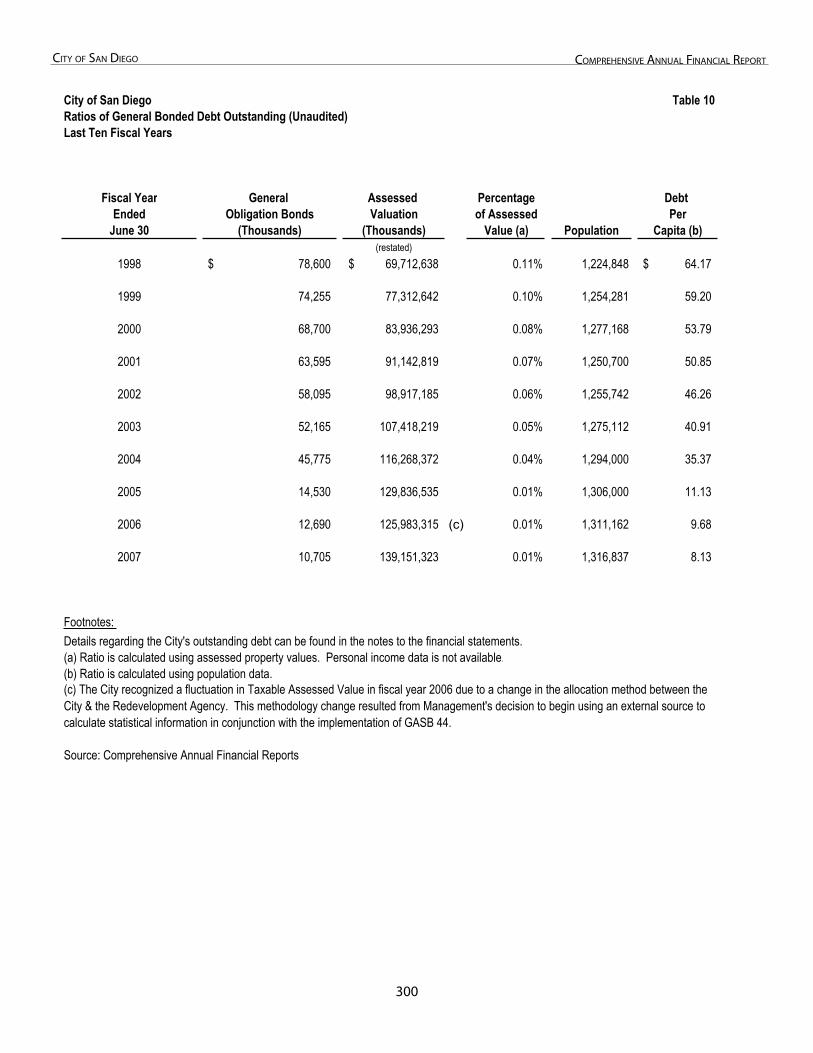
300
City of San Diego ComprehenSive annual finanCial report
Table 10: Ratios of General Bonded Debt Outstanding
City of San Diego Table 10Ratios of General Bonded Debt Outstanding (Unaudited)Last Ten Fiscal Years
Fiscal Year General Assessed Percentage Debt Ended Obligation Bonds Valuation of Assessed Per
June 30 (Thousands) (Thousands) Value (a) Population Capita (b)(restated)
1998 78,600$ 69,712,638$ 0.11% 1,224,848 64.17$
1999 74,255 77,312,642 0.10% 1,254,281 59.20
2000 68,700 83,936,293 0.08% 1,277,168 53.79
2001 63,595 91,142,819 0.07% 1,250,700 50.85
2002 58,095 98,917,185 0.06% 1,255,742 46.26
2003 52,165 107,418,219 0.05% 1,275,112 40.91
2004 45,775 116,268,372 0.04% 1,294,000 35.37
2005 14,530 129,836,535 0.01% 1,306,000 11.13
2006 12,690 125,983,315 (c) 0.01% 1,311,162 9.68
2007 10,705 139,151,323 0.01% 1,316,837 8.13
Footnotes:Details regarding the City's outstanding debt can be found in the notes to the financial statements.(a) Ratio is calculated using assessed property values. Personal income data is not available.(b) Ratio is calculated using population data.
Source: Comprehensive Annual Financial Reports
(c) The City recognized a fluctuation in Taxable Assessed Value in fiscal year 2006 due to a change in the allocation method between theCity & the Redevelopment Agency. This methodology change resulted from Management's decision to begin using an external source to calculate statistical information in conjunction with the implementation of GASB 44.

This Page Left Intentionally Blank
301
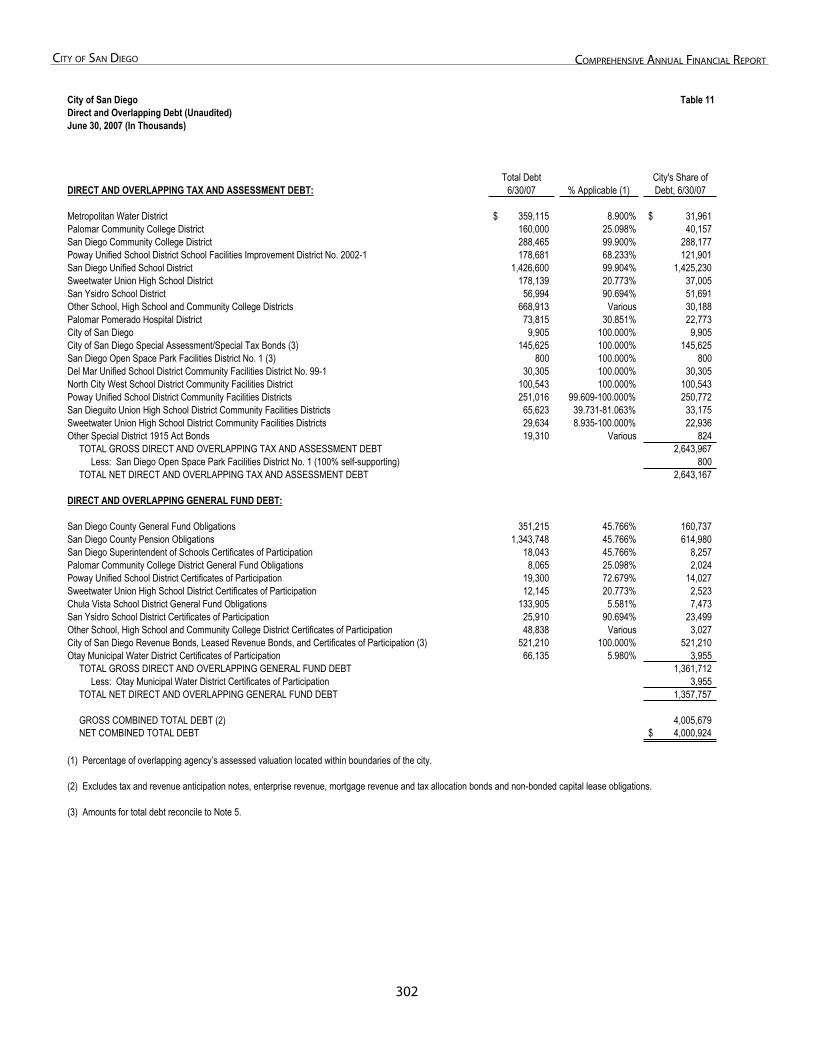
302
City of San Diego ComprehenSive annual finanCial report
Table 11: Direct and Overlapping Debt
City of San Diego Table 11Direct and Overlapping Debt (Unaudited)June 30, 2007 (In Thousands)
Total Debt City's Share ofDIRECT AND OVERLAPPING TAX AND ASSESSMENT DEBT: 6/30/07 % Applicable (1) Debt, 6/30/07
Metropolitan Water District 359,115$ 8.900% 31,961$Palomar Community College District 160,000 25.098% 40,157San Diego Community College District 288,465 99.900% 288,177Poway Unified School District School Facilities Improvement District No. 2002-1 178,681 68.233% 121,901San Diego Unified School District 1,426,600 99.904% 1,425,230Sweetwater Union High School District 178,139 20.773% 37,005San Ysidro School District 56,994 90.694% 51,691Other School, High School and Community College Districts 668,913 Various 30,188Palomar Pomerado Hospital District 73,815 30.851% 22,773City of San Diego 9,905 100.000% 9,905City of San Diego Special Assessment/Special Tax Bonds (3) 145,625 100.000% 145,625San Diego Open Space Park Facilities District No. 1 (3) 800 100.000% 800Del Mar Unified School District Community Facilities District No. 99-1 30,305 100.000% 30,305North City West School District Community Facilities District 100,543 100.000% 100,543Poway Unified School District Community Facilities Districts 251,016 99.609-100.000% 250,772San Dieguito Union High School District Community Facilities Districts 65,623 39.731-81.063% 33,175Sweetwater Union High School District Community Facilities Districts 29,634 8.935-100.000% 22,936Other Special District 1915 Act Bonds 19,310 Various 824 TOTAL GROSS DIRECT AND OVERLAPPING TAX AND ASSESSMENT DEBT 2,643,967 Less: San Diego Open Space Park Facilities District No. 1 (100% self-supporting) 800 TOTAL NET DIRECT AND OVERLAPPING TAX AND ASSESSMENT DEBT 2,643,167
DIRECT AND OVERLAPPING GENERAL FUND DEBT:
San Diego County General Fund Obligations 351,215 45.766% 160,737San Diego County Pension Obligations 1,343,748 45.766% 614,980San Diego Superintendent of Schools Certificates of Participation 18,043 45.766% 8,257Palomar Community College District General Fund Obligations 8,065 25.098% 2,024Poway Unified School District Certificates of Participation 19,300 72.679% 14,027Sweetwater Union High School District Certificates of Participation 12,145 20.773% 2,523Chula Vista School District General Fund Obligations 133,905 5.581% 7,473San Ysidro School District Certificates of Participation 25,910 90.694% 23,499Other School, High School and Community College District Certificates of Participation 48,838 Various 3,027City of San Diego Revenue Bonds, Leased Revenue Bonds, and Certificates of Participation (3) 521,210 100.000% 521,210Otay Municipal Water District Certificates of Participation 66,135 5.980% 3,955 TOTAL GROSS DIRECT AND OVERLAPPING GENERAL FUND DEBT 1,361,712 Less: Otay Municipal Water District Certificates of Participation 3,955 TOTAL NET DIRECT AND OVERLAPPING GENERAL FUND DEBT 1,357,757
GROSS COMBINED TOTAL DEBT (2) 4,005,679 NET COMBINED TOTAL DEBT 4,000,924$
(1) Percentage of overlapping agency’s assessed valuation located within boundaries of the city.
(3) Amounts for total debt reconcile to Note 5.
(2) Excludes tax and revenue anticipation notes, enterprise revenue, mortgage revenue and tax allocation bonds and non-bonded capital lease obligations.
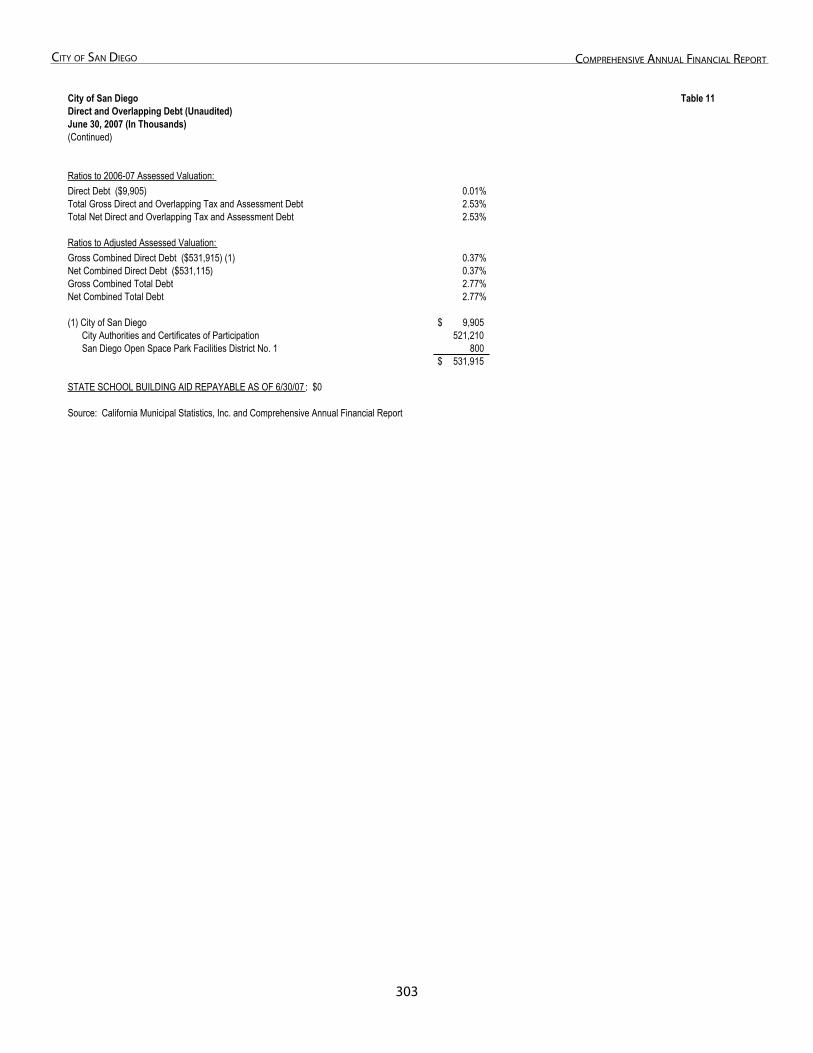
303
City of San Diego ComprehenSive annual finanCial report
City of San Diego Table 11Direct and Overlapping Debt (Unaudited)June 30, 2007 (In Thousands)(Continued)
Ratios to 2006-07 Assessed Valuation:Direct Debt ($9,905) 0.01%Total Gross Direct and Overlapping Tax and Assessment Debt 2.53%Total Net Direct and Overlapping Tax and Assessment Debt 2.53%
Ratios to Adjusted Assessed Valuation:Gross Combined Direct Debt ($531,915) (1) 0.37%Net Combined Direct Debt ($531,115) 0.37%Gross Combined Total Debt 2.77%Net Combined Total Debt 2.77%
(1) City of San Diego 9,905$ City Authorities and Certificates of Participation 521,210 San Diego Open Space Park Facilities District No. 1 800
531,915$
STATE SCHOOL BUILDING AID REPAYABLE AS OF 6/30/07 : $0
Source: California Municipal Statistics, Inc. and Comprehensive Annual Financial Report
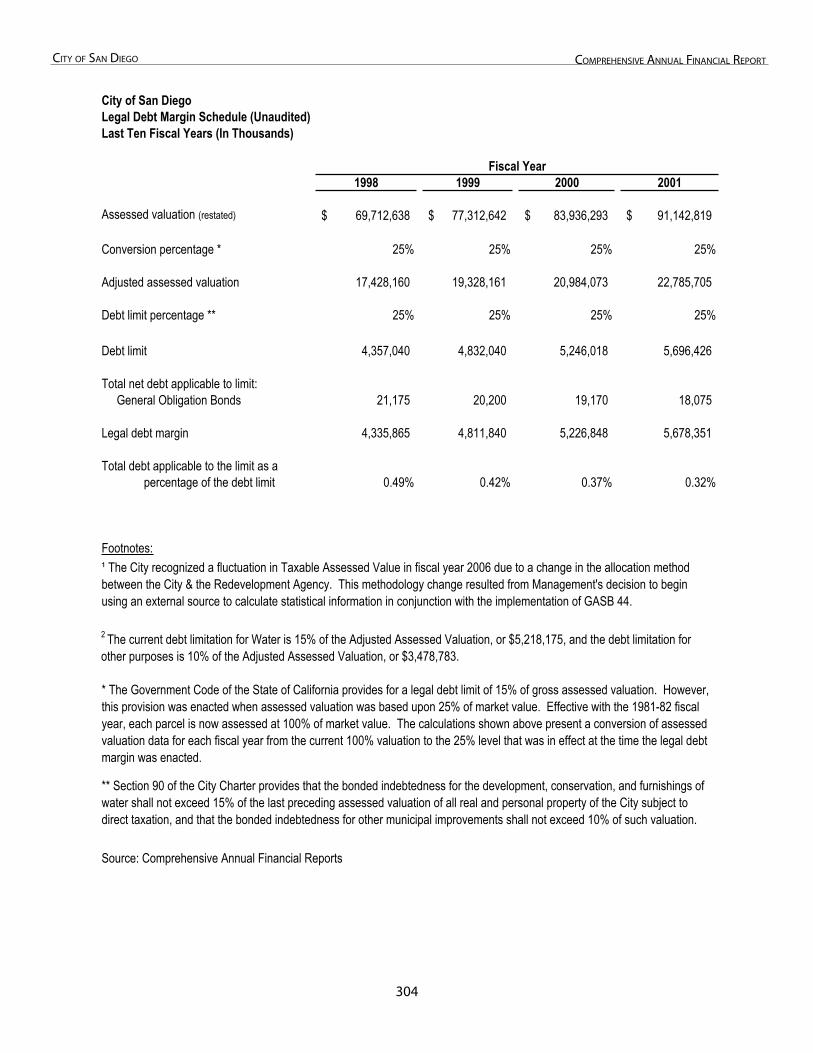
30�
City of San Diego ComprehenSive annual finanCial report
Table 12: Legal Debt Margin Schedule
City of San DiegoLegal Debt Margin Schedule (Unaudited)Last Ten Fiscal Years (In Thousands)
1998 1999 2000 2001
Assessed valuation (restated) 69,712,638$ 77,312,642$ 83,936,293$ 91,142,819$
Conversion percentage * 25% 25% 25% 25%
Adjusted assessed valuation 17,428,160 19,328,161 20,984,073 22,785,705
Debt limit percentage ** 25% 25% 25% 25%
Debt limit 4,357,040 4,832,040 5,246,018 5,696,426
Total net debt applicable to limit: General Obligation Bonds 21,175 20,200 19,170 18,075
Legal debt margin 4,335,865 4,811,840 5,226,848 5,678,351
Total debt applicable to the limit as a percentage of the debt limit 0.49% 0.42% 0.37% 0.32%
Footnotes:
Source: Comprehensive Annual Financial Reports
Fiscal Year
** Section 90 of the City Charter provides that the bonded indebtedness for the development, conservation, and furnishings of water shall not exceed 15% of the last preceding assessed valuation of all real and personal property of the City subject to direct taxation, and that the bonded indebtedness for other municipal improvements shall not exceed 10% of such valuation.
* The Government Code of the State of California provides for a legal debt limit of 15% of gross assessed valuation. However, this provision was enacted when assessed valuation was based upon 25% of market value. Effective with the 1981-82 fiscal year, each parcel is now assessed at 100% of market value. The calculations shown above present a conversion of assessed valuation data for each fiscal year from the current 100% valuation to the 25% level that was in effect at the time the legal debtmargin was enacted.
¹ The City recognized a fluctuation in Taxable Assessed Value in fiscal year 2006 due to a change in the allocation method between the City & the Redevelopment Agency. This methodology change resulted from Management's decision to begin using an external source to calculate statistical information in conjunction with the implementation of GASB 44.
2 The current debt limitation for Water is 15% of the Adjusted Assessed Valuation, or $5,218,175, and the debt limitation for other purposes is 10% of the Adjusted Assessed Valuation, or $3,478,783.
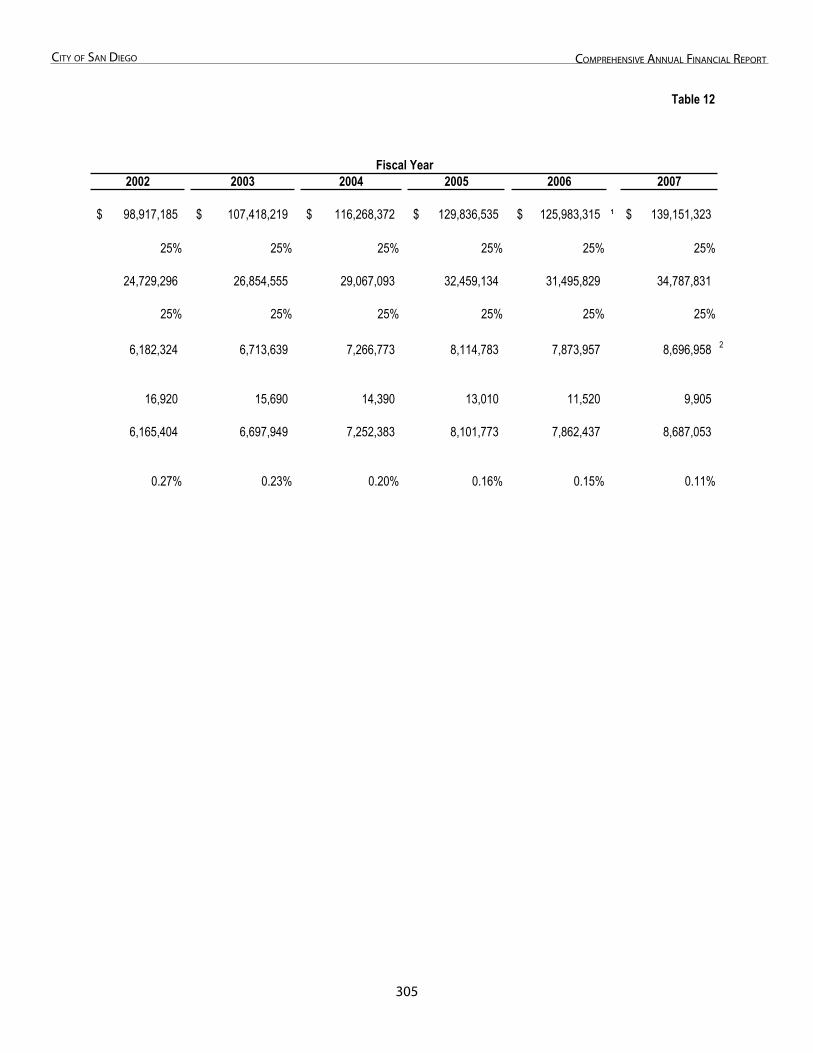
30�
City of San Diego ComprehenSive annual finanCial report
Table 12
2002 2003 2004 2005 2006 2007
98,917,185$ 107,418,219$ 116,268,372$ 129,836,535$ 125,983,315$ ¹ 139,151,323$
25% 25% 25% 25% 25% 25%
24,729,296 26,854,555 29,067,093 32,459,134 31,495,829 34,787,831
25% 25% 25% 25% 25% 25%
6,182,324 6,713,639 7,266,773 8,114,783 7,873,957 8,696,958 2
16,920 15,690 14,390 13,010 11,520 9,905
6,165,404 6,697,949 7,252,383 8,101,773 7,862,437 8,687,053
0.27% 0.23% 0.20% 0.16% 0.15% 0.11%
Fiscal Year
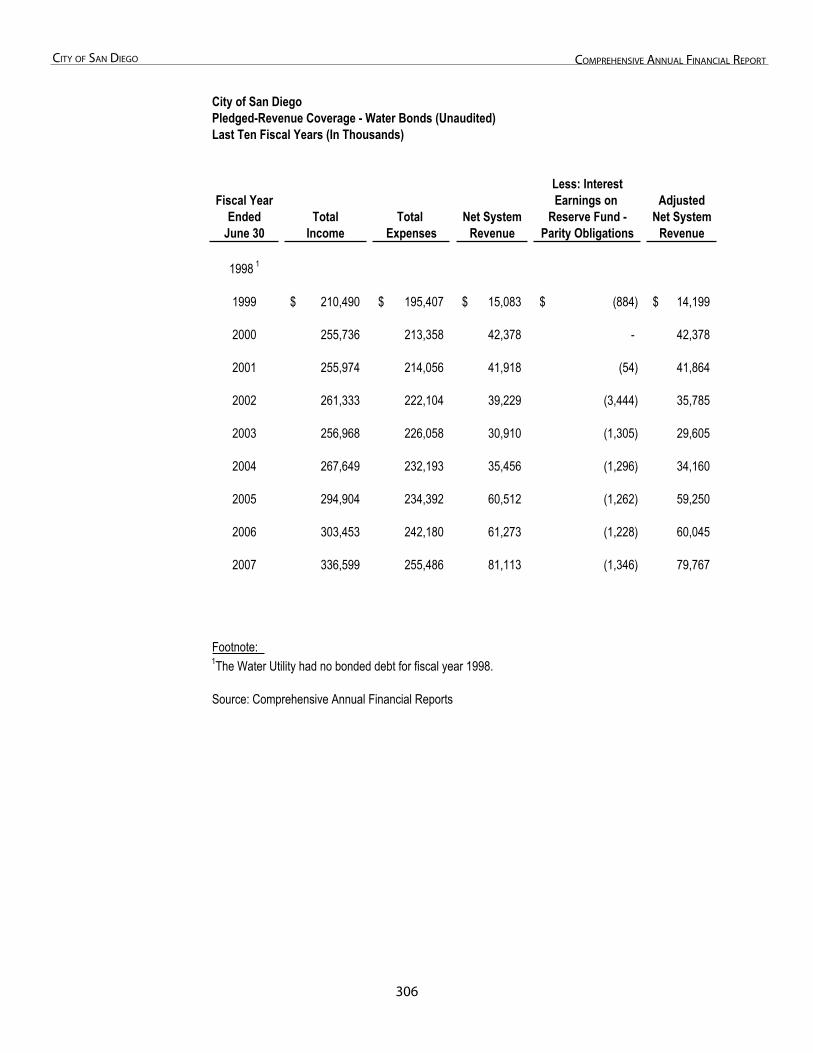
30�
City of San Diego ComprehenSive annual finanCial report
Table 13-1: Pledged-Revenue Coverage - Water Bonds
City of San DiegoPledged-Revenue Coverage - Water Bonds (Unaudited)Last Ten Fiscal Years (In Thousands)
Less: InterestFiscal Year Earnings on Adjusted
Ended Total Total Net System Reserve Fund - Net SystemJune 30 Income Expenses Revenue Parity Obligations Revenue
1998 1
1999 210,490$ 195,407$ 15,083$ (884)$ 14,199$
2000 255,736 213,358 42,378 - 42,378
2001 255,974 214,056 41,918 (54) 41,864
2002 261,333 222,104 39,229 (3,444) 35,785
2003 256,968 226,058 30,910 (1,305) 29,605
2004 267,649 232,193 35,456 (1,296) 34,160
2005 294,904 234,392 60,512 (1,262) 59,250
2006 303,453 242,180 61,273 (1,228) 60,045
2007 336,599 255,486 81,113 (1,346) 79,767
Footnote:1The Water Utility had no bonded debt for fiscal year 1998.
Source: Comprehensive Annual Financial Reports
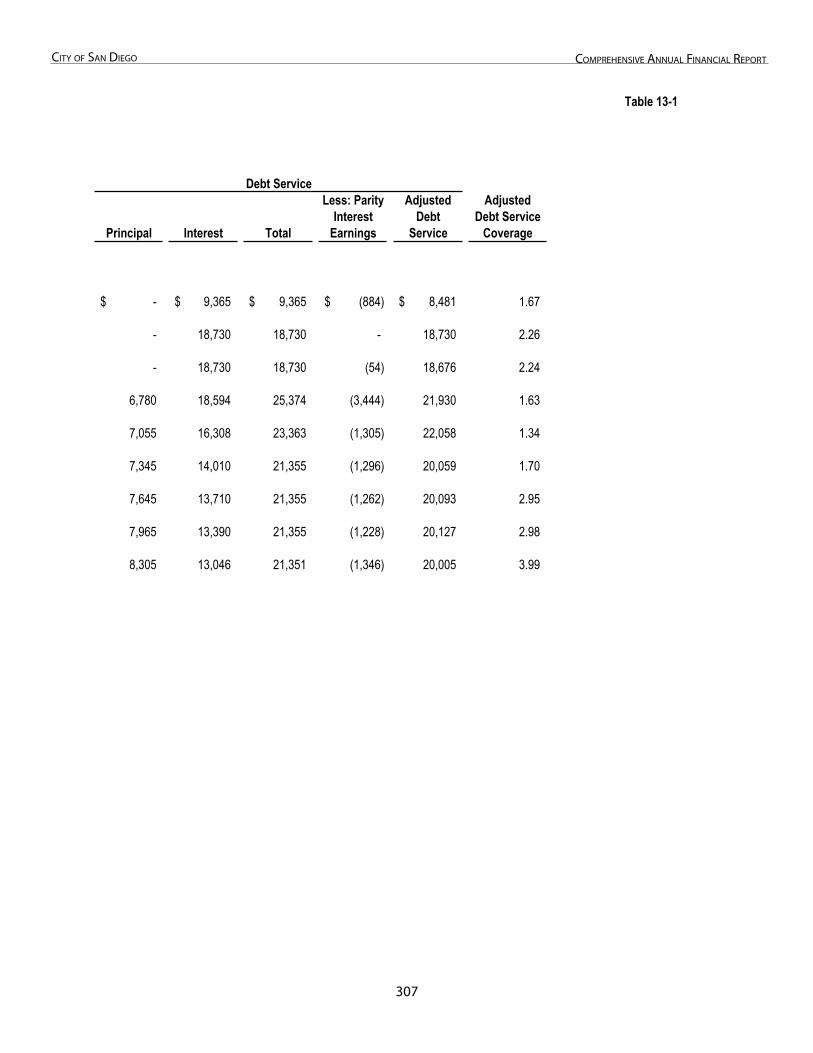
307
City of San Diego ComprehenSive annual finanCial report
Table 13-1
Less: Parity Adjusted AdjustedInterest Debt Debt Service
Principal Interest Total Earnings Service Coverage
-$ 9,365$ 9,365$ (884)$ 8,481$ 1.67
- 18,730 18,730 - 18,730 2.26
- 18,730 18,730 (54) 18,676 2.24
6,780 18,594 25,374 (3,444) 21,930 1.63
7,055 16,308 23,363 (1,305) 22,058 1.34
7,345 14,010 21,355 (1,296) 20,059 1.70
7,645 13,710 21,355 (1,262) 20,093 2.95
7,965 13,390 21,355 (1,228) 20,127 2.98
8,305 13,046 21,351 (1,346) 20,005 3.99
Debt Service
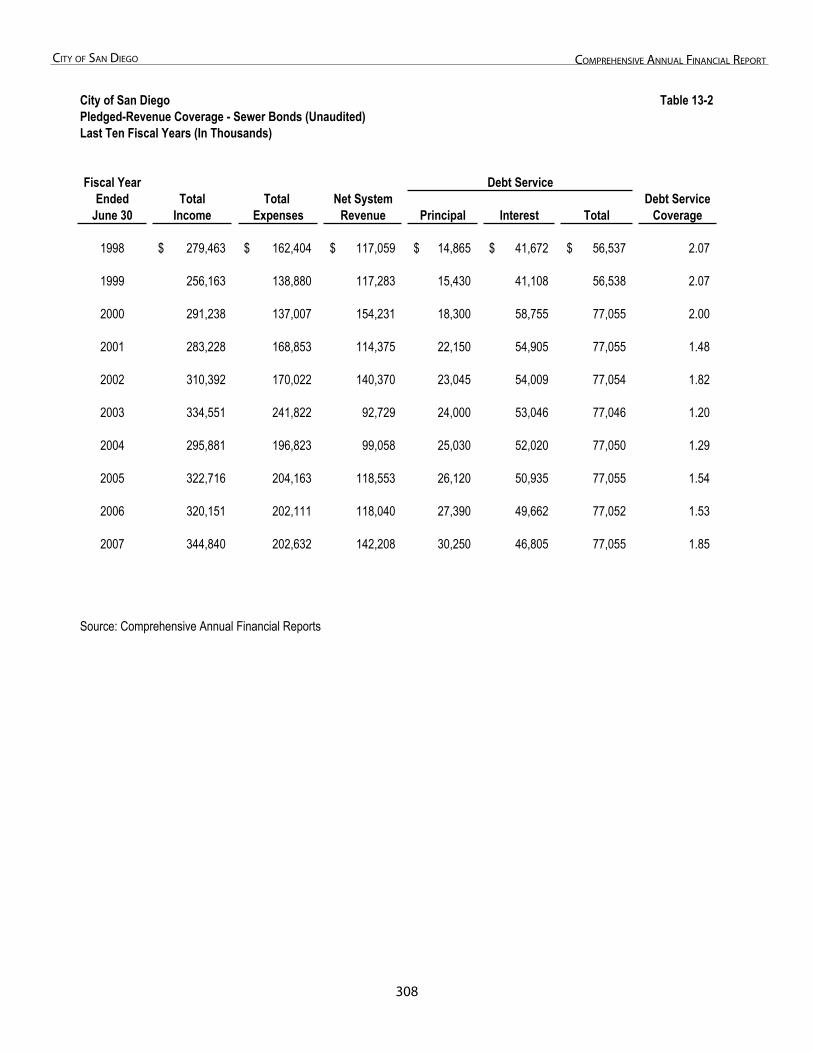
308
City of San Diego ComprehenSive annual finanCial report
Table 13-2: Pledged-Revenue Coverage - Sewer Bonds
City of San Diego Table 13-2Pledged-Revenue Coverage - Sewer Bonds (Unaudited)Last Ten Fiscal Years (In Thousands)
Fiscal Year Debt ServiceEnded Total Total Net System Debt Service
June 30 Income Expenses Revenue Principal Interest Total Coverage
1998 279,463$ 162,404$ 117,059$ 14,865$ 41,672$ 56,537$ 2.07
1999 256,163 138,880 117,283 15,430 41,108 56,538 2.07
2000 291,238 137,007 154,231 18,300 58,755 77,055 2.00
2001 283,228 168,853 114,375 22,150 54,905 77,055 1.48
2002 310,392 170,022 140,370 23,045 54,009 77,054 1.82
2003 334,551 241,822 92,729 24,000 53,046 77,046 1.20
2004 295,881 196,823 99,058 25,030 52,020 77,050 1.29
2005 322,716 204,163 118,553 26,120 50,935 77,055 1.54
2006 320,151 202,111 118,040 27,390 49,662 77,052 1.53
2007 344,840 202,632 142,208 30,250 46,805 77,055 1.85
Source: Comprehensive Annual Financial Reports
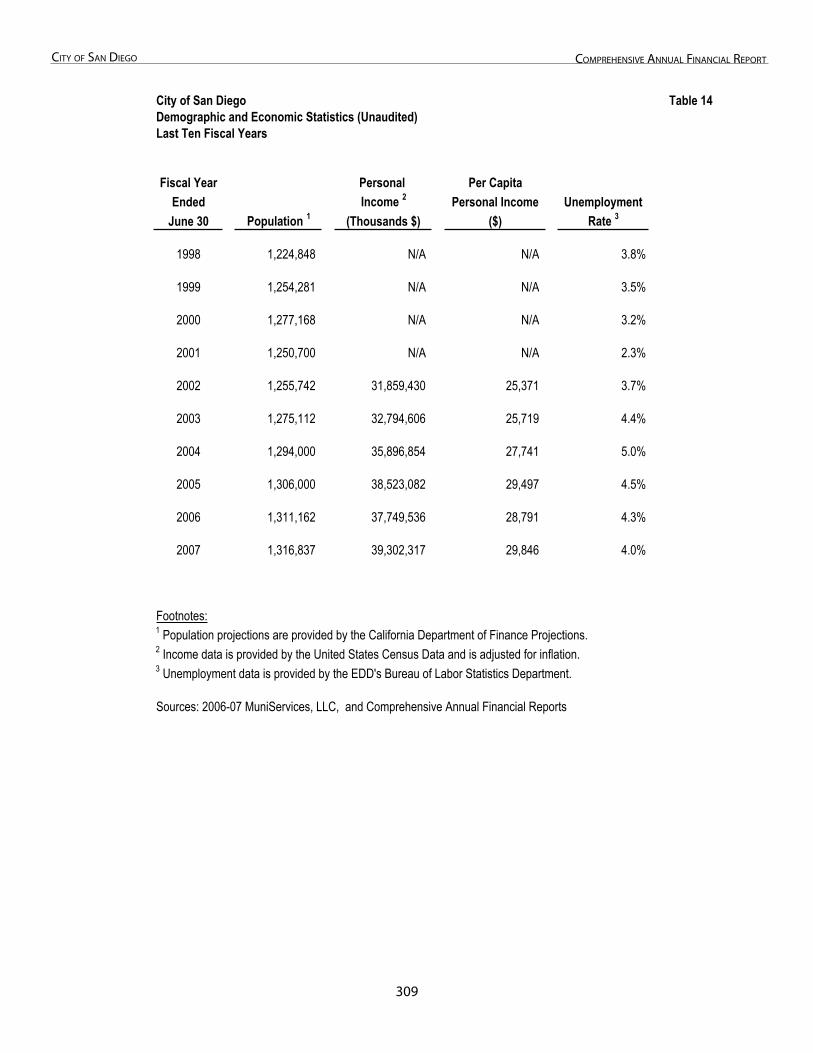
30�
City of San Diego ComprehenSive annual finanCial report
Table 14: Demographic and Economic Statistics
City of San Diego Table 14Demographic and Economic Statistics (Unaudited)Last Ten Fiscal Years
Fiscal Year Personal Per CapitaEnded Income 2 Personal Income Unemployment
June 30 Population 1 (Thousands $) ($) Rate 3
1998 1,224,848 N/A N/A 3.8%
1999 1,254,281 N/A N/A 3.5%
2000 1,277,168 N/A N/A 3.2%
2001 1,250,700 N/A N/A 2.3%
2002 1,255,742 31,859,430 25,371 3.7%
2003 1,275,112 32,794,606 25,719 4.4%
2004 1,294,000 35,896,854 27,741 5.0%
2005 1,306,000 38,523,082 29,497 4.5%
2006 1,311,162 37,749,536 28,791 4.3%
2007 1,316,837 39,302,317 29,846 4.0%
Footnotes:1 Population projections are provided by the California Department of Finance Projections.2 Income data is provided by the United States Census Data and is adjusted for inflation.3 Unemployment data is provided by the EDD's Bureau of Labor Statistics Department.
Sources: 2006-07 MuniServices, LLC, and Comprehensive Annual Financial Reports
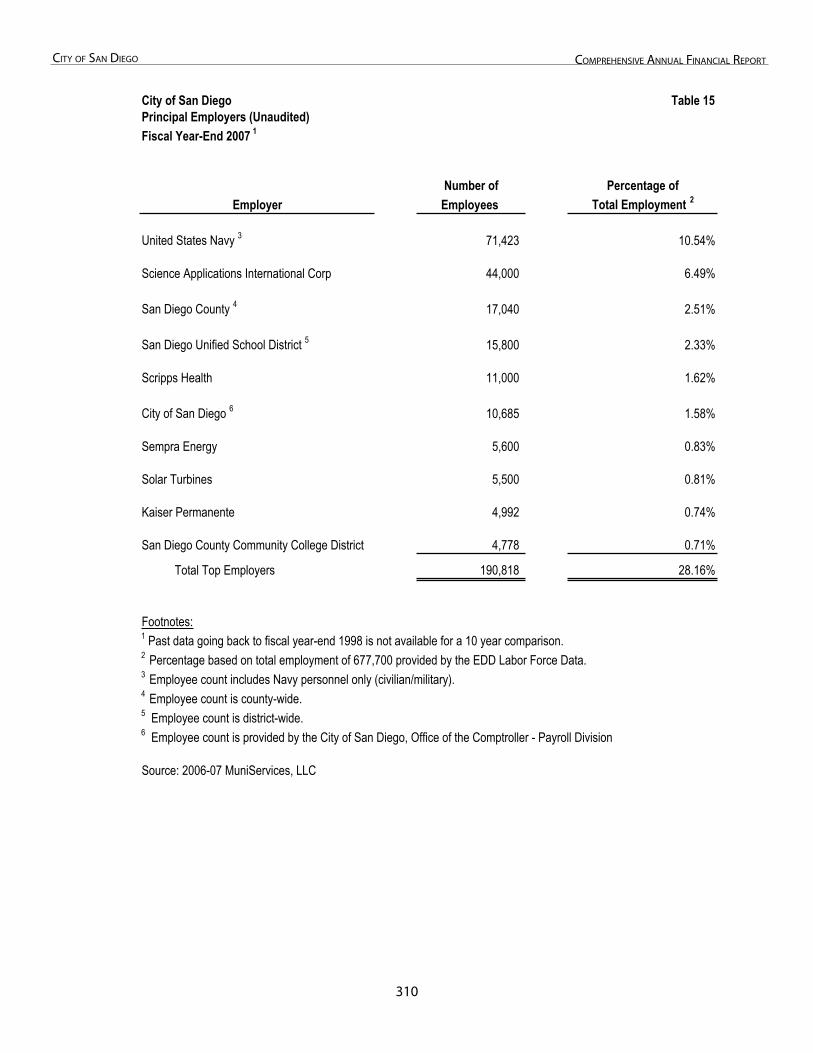
310
City of San Diego ComprehenSive annual finanCial report
Table 15: Principal Employers
City of San Diego Table 15Principal Employers (Unaudited)Fiscal Year-End 2007 1
Number of Percentage ofEmployer Employees Total Employment 2
United States Navy 3 71,423 10.54%
Science Applications International Corp 44,000 6.49%
San Diego County 4 17,040 2.51%
San Diego Unified School District 5 15,800 2.33%
Scripps Health 11,000 1.62%
City of San Diego 6 10,685 1.58%
Sempra Energy 5,600 0.83%
Solar Turbines 5,500 0.81%
Kaiser Permanente 4,992 0.74%
San Diego County Community College District 4,778 0.71%
Total Top Employers 190,818 28.16%
Footnotes:1 Past data going back to fiscal year-end 1998 is not available for a 10 year comparison.2 Percentage based on total employment of 677,700 provided by the EDD Labor Force Data.3 Employee count includes Navy personnel only (civilian/military).4 Employee count is county-wide.5 Employee count is district-wide.6 Employee count is provided by the City of San Diego, Office of the Comptroller - Payroll Division
Source: 2006-07 MuniServices, LLC
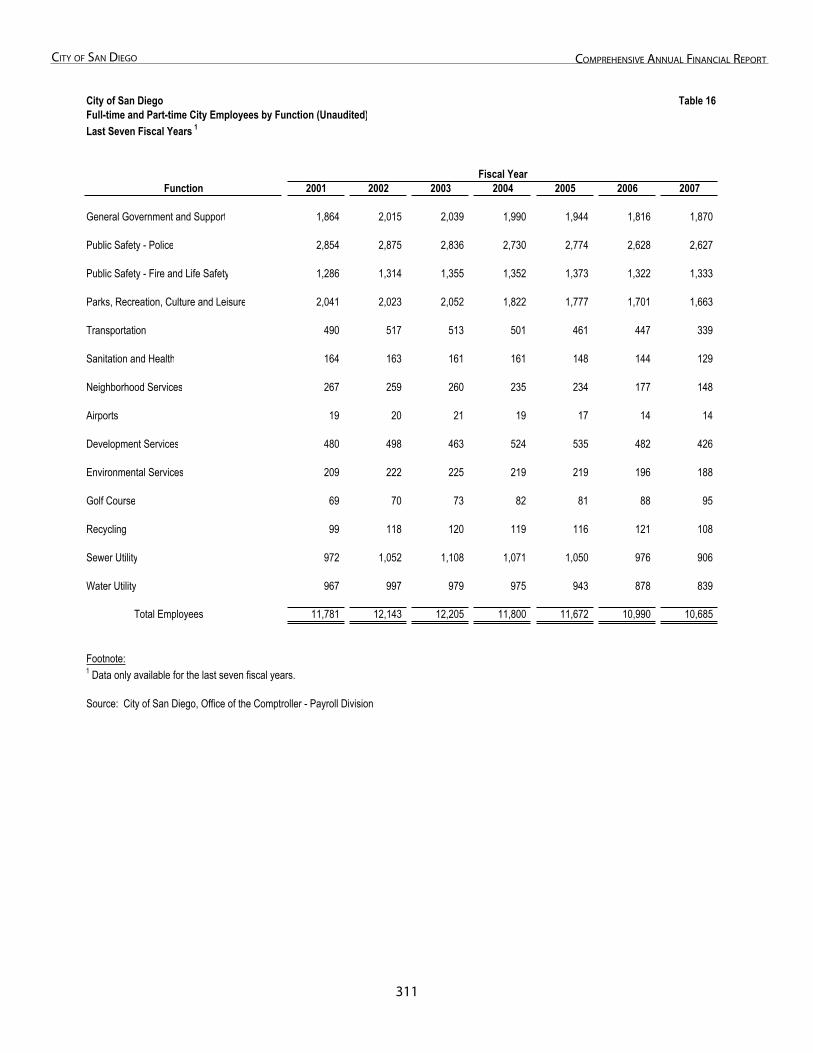
311
City of San Diego ComprehenSive annual finanCial report
Table 16: Full-time and Part-time City Employees by Function
City of San Diego Table 16Full-time and Part-time City Employees by Function (Unaudited)Last Seven Fiscal Years 1
Fiscal YearFunction 2001 2002 2003 2004 2005 2006 2007
General Government and Support 1,864 2,015 2,039 1,990 1,944 1,816 1,870
Public Safety - Police 2,854 2,875 2,836 2,730 2,774 2,628 2,627
Public Safety - Fire and Life Safety 1,286 1,314 1,355 1,352 1,373 1,322 1,333
Parks, Recreation, Culture and Leisure 2,041 2,023 2,052 1,822 1,777 1,701 1,663
Transportation 490 517 513 501 461 447 339
Sanitation and Health 164 163 161 161 148 144 129
Neighborhood Services 267 259 260 235 234 177 148
Airports 19 20 21 19 17 14 14
Development Services 480 498 463 524 535 482 426
Environmental Services 209 222 225 219 219 196 188
Golf Course 69 70 73 82 81 88 95
Recycling 99 118 120 119 116 121 108
Sewer Utility 972 1,052 1,108 1,071 1,050 976 906
Water Utility 967 997 979 975 943 878 839
Total Employees 11,781 12,143 12,205 11,800 11,672 10,990 10,685
Footnote:1 Data only available for the last seven fiscal years.
Source: City of San Diego, Office of the Comptroller - Payroll Division
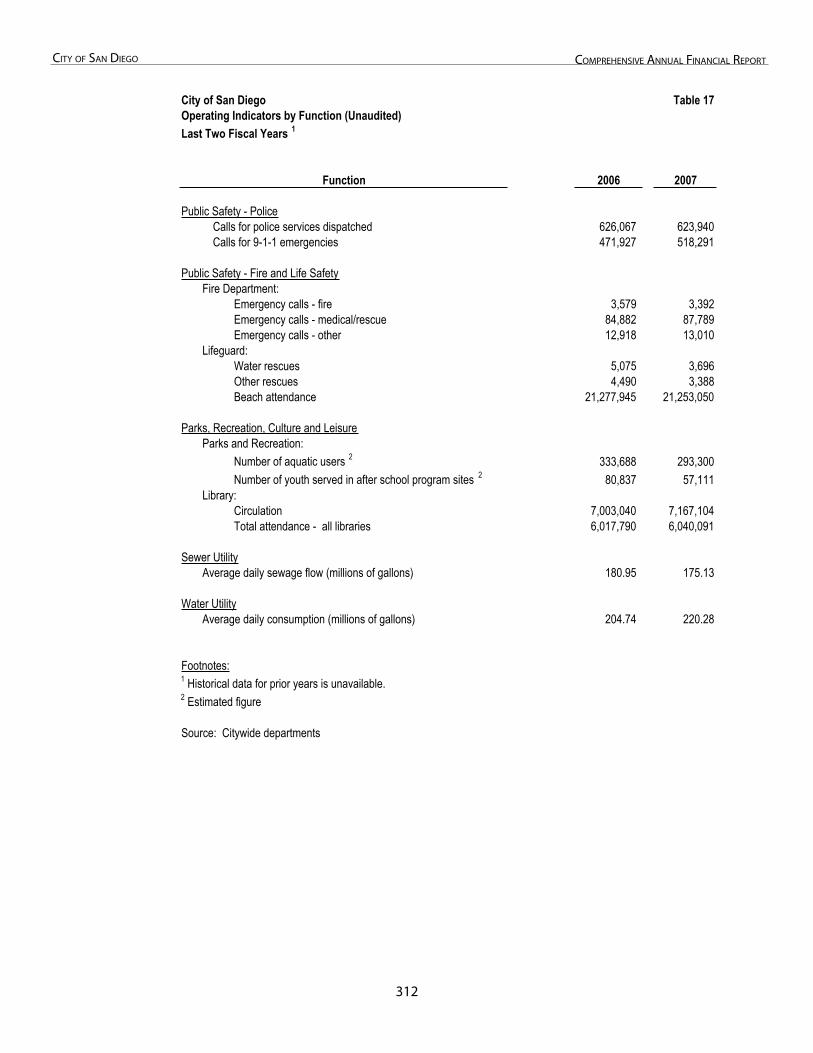
312
City of San Diego ComprehenSive annual finanCial report
Table 17: Operating Indicators by Function
City of San Diego Table 17Operating Indicators by Function (Unaudited)Last Two Fiscal Years 1
Function 2006 2007
Public Safety - PoliceCalls for police services dispatched 626,067 623,940Calls for 9-1-1 emergencies 471,927 518,291
Public Safety - Fire and Life SafetyFire Department:
Emergency calls - fire 3,579 3,392Emergency calls - medical/rescue 84,882 87,789Emergency calls - other 12,918 13,010
Lifeguard:Water rescues 5,075 3,696Other rescues 4,490 3,388Beach attendance 21,277,945 21,253,050
Parks, Recreation, Culture and LeisureParks and Recreation:
Number of aquatic users 2 333,688 293,300Number of youth served in after school program sites 2 80,837 57,111
Library:Circulation 7,003,040 7,167,104Total attendance - all libraries 6,017,790 6,040,091
Sewer UtilityAverage daily sewage flow (millions of gallons) 180.95 175.13
Water UtilityAverage daily consumption (millions of gallons) 204.74 220.28
Footnotes:1 Historical data for prior years is unavailable.2 Estimated figure
Source: Citywide departments
This Page Left Intentionally Blank
313
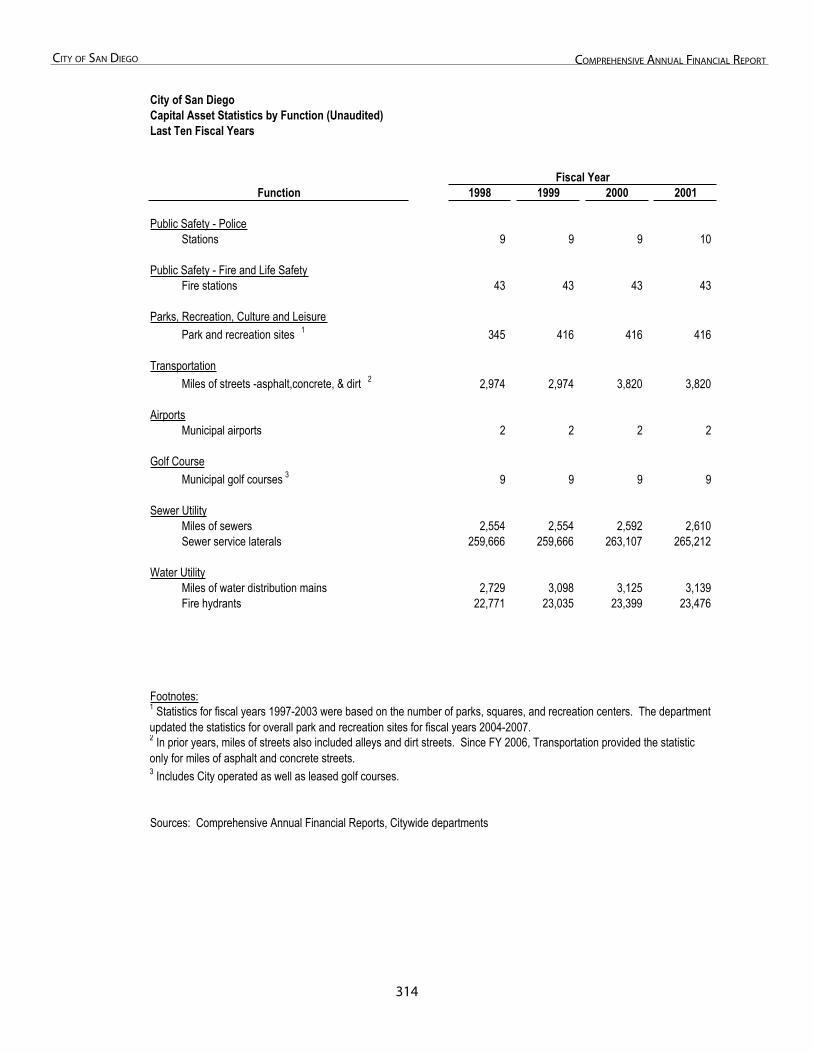
31�
City of San Diego ComprehenSive annual finanCial report
Table 18: Capital Asset Statistics by Function
City of San DiegoCapital Asset Statistics by Function (Unaudited)Last Ten Fiscal Years
Function 1998 1999 2000 2001
Public Safety - PoliceStations 9 9 9 10
Public Safety - Fire and Life SafetyFire stations 43 43 43 43
Parks, Recreation, Culture and LeisurePark and recreation sites 1 345 416 416 416
TransportationMiles of streets -asphalt,concrete, & dirt 2 2,974 2,974 3,820 3,820
AirportsMunicipal airports 2 2 2 2
Golf CourseMunicipal golf courses 3 9 9 9 9
Sewer UtilityMiles of sewers 2,554 2,554 2,592 2,610 Sewer service laterals 259,666 259,666 263,107 265,212
Water UtilityMiles of water distribution mains 2,729 3,098 3,125 3,139 Fire hydrants 22,771 23,035 23,399 23,476
Footnotes:
3 Includes City operated as well as leased golf courses.
Sources: Comprehensive Annual Financial Reports, Citywide departments
Fiscal Year
1 Statistics for fiscal years 1997-2003 were based on the number of parks, squares, and recreation centers. The department updated the statistics for overall park and recreation sites for fiscal years 2004-2007.2 In prior years, miles of streets also included alleys and dirt streets. Since FY 2006, Transportation provided the statistic only for miles of asphalt and concrete streets.
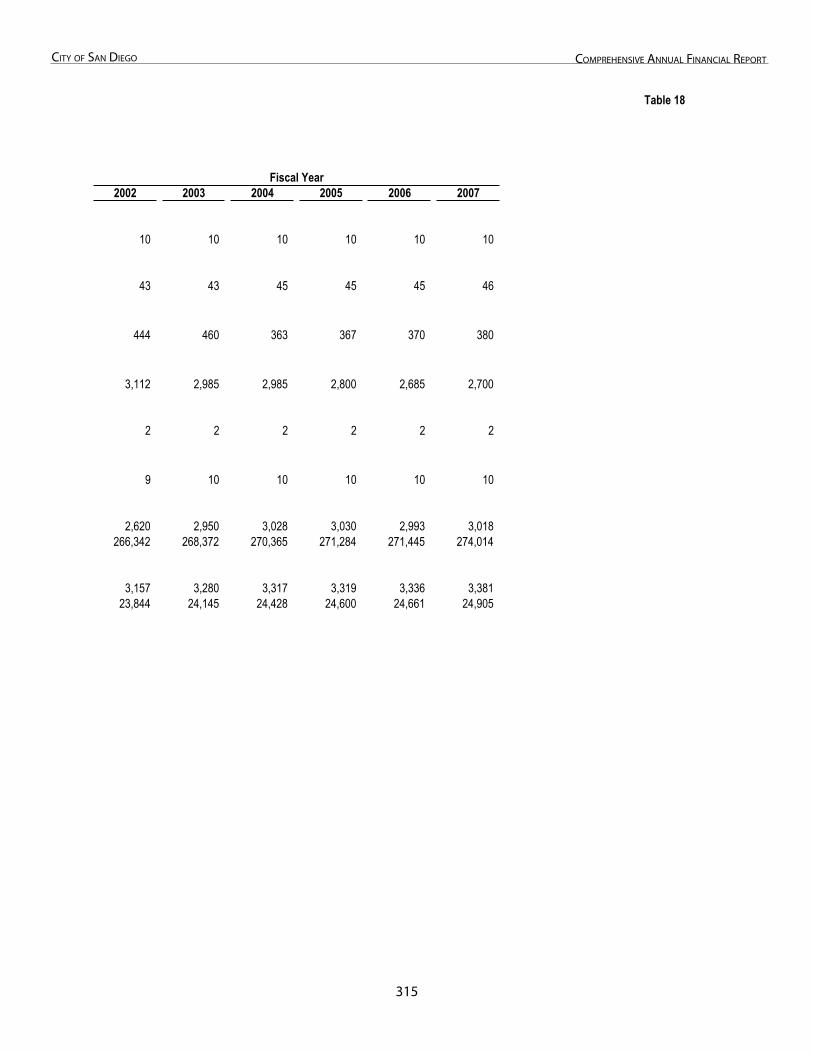
31�
City of San Diego ComprehenSive annual finanCial report
Table 18
2002 2003 2004 2005 2006 2007
10 10 10 10 10 10
43 43 45 45 45 46
444 460 363 367 370 380
3,112 2,985 2,985 2,800 2,685 2,700
2 2 2 2 2 2
9 10 10 10 10 10
2,620 2,950 3,028 3,030 2,993 3,018266,342 268,372 270,365 271,284 271,445 274,014
3,157 3,280 3,317 3,319 3,336 3,38123,844 24,145 24,428 24,600 24,661 24,905
Fiscal Year

BACK COVER OF BOOK