Embed Size (px)
Citation preview

MUNICIPAL FINANCIAL VIABILITY
Municipal Managers Network
28 February 2011

• State of municipal finances presented to 2009 Budget Forum
• 2010 Budget Forum submissions− Review of the LG Fiscal Framework− Understanding Outstanding Municipal Debtors− Local Business Tax
• 2011 Division of Revenue Act• Other matters of interest
Overview

• The outcome of this session is to confirm the challenges, provide evidence and guide the process for resolution of these issues
Objective

State of Municipal Finances
Background
• SALGA developed own database containing data on municipal AFS, AO, service delivery and economic profiles, information on CFOs.
• Analysis of 2007 and 2008 financial performance and service delivery presented to the 2009 Budget Forum focused on the following criteria:Criteria Basis of Assessment
Service Delivery
Settlement characteristics Extent of backlogs for key services Identification of whether additional financial
resources are required
Finances
Sufficiency of own revenue sources Sufficiency of government grants Efficiency of expenditure Key financial ratios
Financial Management
Audit report findings Capacitation assessment

Cat. Municipal Sub-categories Included Typical Attributes
S1 A (metros) and aspirant metros Dominated by a large urban (city) centre
S2 Secondary cities, large regional town and small towns
Larger and smaller towns typically surrounded by commercial farm land
S3 Mostly rural with no significant urban centre
Mostly tradition rural areas, with little formal urban economy
S4 Districts which are not water services authorities
The districts for the S1s (non metropolitan), S2 and S3s
S5 C2 districts which are water services authorities The districts for the S3s
In enabling comparisons to be made it was important that certain common classifications had to be made and utilised
The above categorisation was used commonly throughout the exercise and was also used the emphasis the differentiation between the municipalities and provinces
State of Municipal Finances
Background

Municipalities that have a small number of households but the formal urban component is relatively small face viability challenges
Conversely municipalities with high number of rural households and/or informal settlements tend to have high levels of poverty and high backlogs of services
Rural municipalities have limited revenue raising opportunities because of the level of backlogs. Unable to generate revenue from the rendering of services
Lack of densification in a rural environment impacts on economies of scale in delivering services
It is unlikely that backlogs can be eliminated in the short-term with finances available to municipalities
Settlement characteristics have a significant impact on municipal finances
Service delivery challenges have a significant impact on municipal finances
State of Municipal Finances
Service Delivery
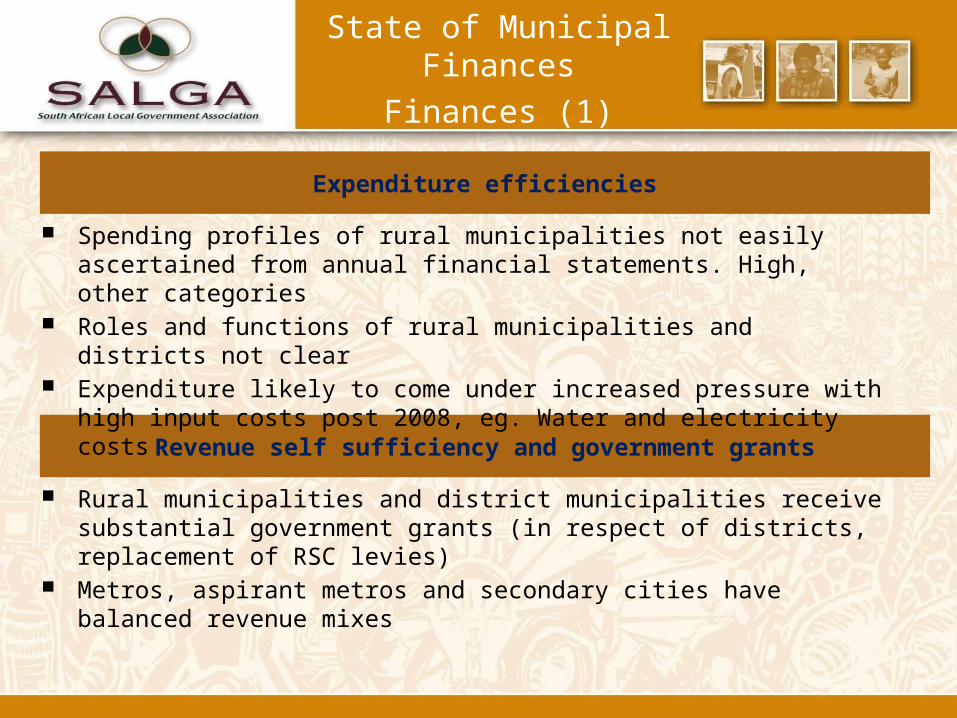
Rural municipalities and district municipalities receive substantial government grants (in respect of districts, replacement of RSC levies)
Metros, aspirant metros and secondary cities have balanced revenue mixes
Revenue self sufficiency and government grants
Spending profiles of rural municipalities not easily ascertained from annual financial statements. High, other categories
Roles and functions of rural municipalities and districts not clear Expenditure likely to come under increased pressure with high input costs
post 2008, eg. Water and electricity costs
Expenditure efficiencies
State of Municipal Finances
Finances (1)

Criteria Large and aspirant metropolitan cities
Secondary cities, large regional and peri-urban towns
Rural municipalities
District municipalities for the peri-urban municipalities
District municipalities for the rural municipalities
Average rates revenue per household
R2 612 R1 160 R128 Not applicable Not applicable
Average revenue self-sufficiency
84% 75% 28% 31% 20%
Government grants to total operating revenue
21% 25% 68% 62% 79%
Operating revenue per household
R14 349 R7 743 R2 017 Not applicable Not applicable
Operating expenditure per household
R13 034 R7 060 R2 014 Not applicable Not applicable
Outcomes of revenue self sufficiency and grants
State of Municipal Finances
Finances (2)

Generally financial position is strong 18 municipalities technically insolvent Significant financial variances in the rural municipalities
Borrowing levels generally low but secondary cities and rural municipalities have the potential to borrow (assessment done on an individual basis) to supplement capital financing
Generally cash flow strong
Financial ratios characteristics
State of Municipal Finances
Financial Management
Financial management issues
National issues to take into account: - Depth of audit reporting – recommend improvements to assist better
understanding of underlying causes GRAP accounting standards simplification – particularly around fair valuing and
complex issues Better understanding of the linkage between financial viability and audit
qualifications Municipalities to consider leadership, local SCOPA and governance

SALGA made submissions to the Budget Forum with the objective of engaging national and provincial stakeholders on the following areas:
– The Review of the LG Fiscal Framework • Need for differentiation between municipalities• The Expenditure assignment of LG• The Revenue assignment of LG• LG’s share of nationally raised revenue (Vertical Division of Revenue)• The Local Government Equitable Share• Infrastructure Funding and Borrowing• Conditional Grants to LG
– Understanding Outstanding Municipal Debtors• Nature and extent of debt owed to municipalities• Why debt has grown over the last 6 years?• What proportion of the debt is realistically recoverable?
– Local Business Tax• Work-in-progress towards application to Minister of Finance
2010 Budget ForumBackground

Differentiation• A commonly accepted categorization of municipalities should be developed and be
used to review roles and functions of certain categories of municipalities, in amending the Local Government Equitable Share formula and in targeting certain conditional grants.
Expenditure Assignment• Finalisation of the Provincial and Local Government Policy review, initiated by
COGTA in July 2007, restructuring of the electricity distribution industry.• Housing accreditation.• Funding arrangements for the National Land Transport Act.• The local government fiscal review should ensure that issues around unfunded
mandates are resolved. Some unfunded mandates have already been costed (such as library services in the Western Cape and Ethekwini). Others should still be quantified. FFC research currently.
• Studies should be conducted into the accurate long term costs of municipal service delivery, which can vary substantially across municipalities in different service delivery contexts.
LG Fiscal Framework Review (1)

Revenue Assignment• Ways should be explored to extend the general fuel level sharing approach across more
municipalities beyond just the metros, exploring the viability of also utilising other bases such as transfer duties
• Implementation of a Local Business Tax should be expedited. • Replacement of RSC levy replacement grant for district municipalities by a suitable revenue-
raising instrument
• Implementation of good practice municipal taxes and surcharges
Classification Average GVA per capita Average rates revenue per household
Metros 39,686 2,612 Secondary cities 22,854 1,189 Rural municipalities 4,184 157
Disparity in Fiscal Capacity - GVA (2004)
LG Fiscal Framework Review (2)

Vertical Division of Revenue
• There should be a systematic review of baselines to ensure that:– revenue allocations to local government as a whole are congruent with its full
range of developmental and service delivery responsibilities – and the vertical share of local government meets the increasing demand for
municipal services• This should be coupled with efforts to build the capacity of weaker municipalities to
spend efficiently and effectively
Division of nationally raised revenue, 2007/08 - 2013/142007/08 2008/09 2009/10 2010/11 2011/12 2012/13 2013/14
Outcome Revised Medium-term estimatesR million estimates Division of revenue between spheres National departments 242 580 289 236 345 366 359 120 380 154 408 439 439 049 Provinces 207 504 246 836 293 164 323 080 357 929 380 450 404 251 Local Government 38 482 45 487 51 537 61 152 70 171 77 029 82 317 Total 488 566 581 559 690 067 743 352 808 254 865 918 925 617Percentage share National departments 49.7% 49.7% 50.0% 48.3% 47.0% 47.2% 47.4% Provinces 42.5% 42.4% 42.5% 43.5% 44.3% 43.9% 43.7% Local Government 7.9% 7.8% 7.5% 8.2% 8.7% 8.9% 8.9%
LG Fiscal Framework Review (3)

Local Government Equitable Share• Increase institutional capacity support to smaller and mainly rural municipalities• Activate the development component of the LGES formula should be reviewed• The Basic Services component needs to be expanded to include other services• Review the poverty line that is currently at R800 total monthly household incomeInfrastructure funding and borrowing• The extent of rehabilitation backlogs should be quantified. • Funding should be set aside for refurbishment and upgrade of existing
infrastructure. • Own-revenue sources (e.g. Local Business Tax) is essential to allow borrowingConditional Grants• There is no reporting on non-financial achievements and limited awareness of
grants• SALGA concerned that review of grant baselines are not informed by proper
research. The FFC has made various important recommendations to government in 2010.
• Capacity development programs should be aligned to each stage of the developmental transition of municipalities – more effective use and to be more consultative
LG Fiscal Framework Review (4)

SALGA recommendations to the Budget Forum: • Supports the rapid implementation of a more comprehensive review
of all the elements of the municipal fiscal framework over the medium term.
• Brings speedily to closure a number of protracted national processes – Policy review– Electricity distribution restructuring (post EDI dissolution)– Single public service– Housing accreditation of municipalities and the funding of the new Land
Transport Act• Appoints an independent commission to arrive at long term solutions,
ensuring maximum stakeholder participation and transparency
LG Fiscal Framework Review (5)

• The objective of this submission to the Budget Forum was to present to the Minister of finance the complexity of municipal debt and proposals to address it
• The submission covered the following:
1. Nature and extent of debt owed to municipalitiesWhat is the composition of the debt?Why has debt grown from approx R30bn to R56bn over 6 years?What portion of debt is realistically recoverable?
2. Proposals to address Challenges How to contain the growth in DebtorsWhat can National Treasury and other stakeholders do
3. Concluding commentsIssues to be agreed between SALGA & National Treasury for action
Understanding Municipal Debtors (1)

Composition of debt - Debtor’s by Income Source
Revenue Source 2005 2010
R % R %
Water Tariffs 7 658 506 26 15 634 639 28
Electricity Tariffs 3 378 774 12 7 956 664 14
Rates (Property Rates) 6 781 355 23 12 026 853 21
Sewerage / Sanitation Tariffs 1 344 497 5 3 957 851 7
Refuse Removal Tariffs 1 749 875 6 3 612 737 6
Housing (Rental Income) 986 365 3 1 096 094 2
RSC Levies 377 016 1 137 237 0
Other 6 719 936 23 11 972 952 21
Total by Revenue Source 28 996 324 100 56 395 025 100
Understanding Municipal Debtors (2)

Composition of Debt - Debtors Profile by Customer Type
Debtors Profiles 2005 2010
R % R %
Government 600 995 2 3 002 355 5
Business 3 099 456 11 6 583 555 12
Households 12 517 870 45 31 688 354 56
Other 11 481 080 41 15 120 761 27
Total 27 699 402 100 56 395 025 100
Understanding Municipal Debtors (3)

Nature and Extent of debt owed to municipalities
• Focus on metros and secondary cities will address 75% of total debt and medium and small towns should also get some focused attention (proportionally)
• Household and Other debt customer types require more focus• Water, Other and property rates are the income sources that require
most focus• Insufficient detailed data and non-uniformity of data parameters leaves
gaps in analysis of debt • Interest component is complex and unclear• Inconsistent reporting (some only report from 120 days or less)• Most municipalities (using IAS 36/39) recognise revenue for
indigents and FBS – resulting in this increasing debtors provisions (non implementation of Grap 9)
Understanding Municipal Debtors (3)

Different accounting treatments for indigents (fbs)
Rates and services rendered on credit
Not impaired – revenue and debtor recognised in full
Only where there is an indigent consumer
IAS 36/39: Recognise revenue/debtors at transactional value. Impair through a provision
Don’t recognise the revenue as it is not probable that Municipality will receive revenue (GRAP 9)
Impact on debtors – debtors’ high but provision for bad debts also high
Impact on debtors – no debtor recognised
Debtors RXXXXProvision -(RXX)Net debtors RXXX
Increases debtors’ balances outstanding as provision ignored
Understanding Municipal Debtors (5)

Property
Municipal Billing System
Line Department
National Provincial
Department of Public works
National Provincial
Understanding Municipal Debtors (4)
Government Property Rates Accounts

Why has debt grown from R30-R56bn over 6 years?
1. 100% collection rate not possible because services provided to the poor and other practicalities (eg. national policies of providing services to all, business liquidations). Debtors’ balances will grow annually as a result
2. Challenges to data integrity and incorrect billing remains a problems3. Accounting treatment and reporting not uniform … treatment of equitable
share – reported debt may be growing4. Balance sheet impact of debt – manifests ito surpluses but not realisable
as cash therefore contributing to cash flow crisis (paper surplus)5. Insufficient and insignificant bad debt write-off 6. Interest on debt is growing – adding interest to irrecoverable balances
merely increases the amount outstanding
Understanding Municipal Debtors (6)

1. That the Budget Forum mandates NT to:
a) Include revenue recognition in the Budget Reforms
b) Use Net Debtors (instead of Gross) for reporting purposes because the financial effect is more realistic. (R56bn vs R33bn)
c) Implement GRAP 9 (revenue recognition on services to the poor as well as raising interest) to ensure that revenue that will not be recovered is not recognized at all
d) Encourage implementation of accounting standards on debtors’ impairments
e) Provide guidelines to outline writing off irrecoverable debt
2. That the Budget Forum encourage support be given to municipalities for better debtors’ and customer profiling
3. That NT and Public Works establish a task team to simplify billing and payments for government-owned properties (government debt) and update asset registers.
Recommendations to Budget Forum
Understanding Municipal Debtors (7)

• SALGA submitted a proposal to introduce a local business tax as a second general tax revenue source for local governments to the Budget Forum in October 2009.
• Several Metro Councils in partnership with SALGA have initiated a project to prepare formal applications in terms of the Municipal Fiscal Powers & Functions Act (2007) (MFPFA) to introduce a local business tax for economic infrastructure and services.
• SALGA presented work-in-progress on the application to the 2010 Budget Forum.
• It is envisaged that a formal application will be submitted to the Minister of Finance later this year.
2010 Budget ForumLocal Business Tax

• LG’s share of nationally raised revenue increased slightly to 8.7% from 8.2% in 2010/11.• Tight fiscus reduced growth in LGES to 8.3% p.a. over 2011 MTEF (9.3%, 2008 MTEF)
− Concern as bulk prices and number of indigents have increased − However, smaller municipalities receive more for institutional capacity
• Infrastructure transfers increase 9.7% p.a. over 2011 MTEF (8%, 2008 MTEF) Higher growth in infrastructure transfers than LGES imply more pressure on repairs and
maintenance Faster growth mainly result of Urban Settlements Development Grant (Housing + MIG
(Cities) allocations) Other Concerns:
Neighbourhood Development Grant reduction - poses challenges to some cities that have already planned certain projects;
Electricity Demand-side Management Grant reaches final year in 2011/12 and SALGA will work together with DoE to motivate for extension
An unallocated Municipal Disaster Grant is a new grant to make funding immediately available following disasters. It will be administered by the National Disaster Management Centre in CoGTA
The Rural Transport and Infrastructure Grant has been increased to improve data collection on the condition of rural roads to inform better planning and delivery of projects
2011 DoRA
Transfers to LG (1)

2011 DoRA
Transfers to LG

SALGA are involved in other areas in municipal finance, including:• Accounting Standards
– Assess cost and capacity for compliance (esp Grap 17) - lobby for differentiated accounting standards
• Budget Weeks – SALGA workshops on financial management and sharing of good practices on revenue management and audit improvements
• Councillor Training – develop targeted training for Mayors, MMC: Finance, MPACs and ordinary councillors.
• Municipal Property Rates Act Amendment – Develop a position paper and engage the parliamentary processes
• Budgeting and payment of audit fees – Municipalities urged to cost audit fees with approved audit plan and if amount exceeds 1% to
expenditure apply to NT
• Policy and Legislation review – Credit control and debt management policies– MFMA review – future focus
Other matters of interest

Audit Outcomes 2008/09 (1)
• Overall improvement in audit outcomes, however:– Disclaimers and Adverse opinions have decline from 41% to 29% and 6% to 3%
respectively.– While there is improvement there remain a high number of unqualified audits with matters
of emphasis. – Audits outcomes however do not address:
The adequacy of the funding of the municipal budget; The allocative efficiency of the municipality’s spending priorities; The quality of the municipality’s revenue management capabilities; The effectiveness of municipal spending; and The sustainability of the municipality’s capital budget and debt burden.
2008/09 2007/2008 2006/2007 2005/2006 2004/2005
UNQUALIFIED 39% 33% 19% 18% 23%
QUALIFIED 17% 19% 25% 22% 27%
DISCLAIMER 29% 33% 39% 45% 41%
ADVERSE 3% 4% 9% 9% 6%
AUDIT NOT FINALISED 13% 12% 8% 6% 4%
100% 100% 100% 100% 100%

Audit Outcomes 2008/09 (3)
• SALGA will support further improvements in line with AG recommendations:– Encourage training of Councillors and senior municipal officials to
establish adequate leadership and oversight;– Assist with establishment of effective governance arrangements
through support of MPACs and DAFFs;– Continuous engagement with national stakeholders to make
available appropriate financial resources, personnel and systems for municipalities to improve audit outcomes.

2010 LG projects:• Measuring the efficiency of local government expenditures: an FDH analysis of a
sample of South African municipalities• Estimating the factors that influence municipal expenditures• Municipal consumer debt in South Africa• Estimating the economic and fiscal costs of inappropriate land use patterns• Climate change and environmental sustainability in urban areas• Budget and spending performance of local government
Possible 2011 projects:• Estimating municipal fiscal capacity• Gender dynamics in local government• Environmental sustainability in rural areas• Exploring service delivery options and strategies for local government• Deriving cost functions to inform subsidies in the LGES formula• Assessing the human capital constraints in local government• Developing indices to assess municipal budgets
FFC Research