Embed Size (px)
Citation preview

Municipal Excess Liability Joint Insurance Fund Parsippany. New Jersey
Comprehensive Annual Financial Report For the Years Ended December 31. 2012 and 2011

MUNICIPAL EXCESS LIABILITY JOINT INSURANCE FUND TABLE OF CONTENTS
INTRODUCTORY SECTION (Unaudited)
Letter of Transmittal Roster of Officials and Consultants Organizational Chatt Membership Listing
FINANCIAL SECTION
Independent Auditors' RepOlt
DECEMBER3!. 2012
Management's Discussion and Analysis (Unaudited)
Basic Financial Statements: Statement of Net Position Statement of Revenue, Expenses and Changes in Net Position Statement of Cash Flows Notes to Financial Statements
Required Supplementary Information: (Unaudited) Comparative Reconciliation of Claims Liabilities by Fund Ten-Year Claims Development Information
Combining Supplementary Schedules: Combining Schedule of Net Position Combining Schedule of Operations and Changes in Net Position
Supplementary Data: (Unaudited) Historical Operating Results Analysis (Schedule A) Historical Balance Sheet (Schedule B) Fund Year Operating Results Analysis (Schedule C) Fund Year Account Operating Results Analysis (Schedule D) Fund Year Claims Analysis (Schedule E) Fund Year Expense Analysis (Schedule F) Program Summary (Schedule G) Analysis of Cash and Investments Analysis of Excess Insurance Receivable Analysis of Assessments Receivable Analysis of Other Receivables Analysis of Prepaid Expense Analysis of Excess Insurance Expenses Payable Analysis of Administrative Expenses Payable Analysis of Miscellaneous Liabilities
RepOlt Pursuant to Governmental Auditing Standards: RepOlt on Internal Control Over Financial Reporting and on Compliance and Other Matters Based on an Audit of Financial Statements Performed in Accordance with Government Auditing Standards
Page
1-3 4-5
6 7
8-10 11-12
13 14 15 16
17-26
27 28 29
30 31 32
33 34 35
36-40 41-44 45-48 49-52
53 54 54 55 55 56 56 57 57
58
59-60

MUNICIPAL EXCESS LIABILITY JOINT INSURANCE FUND TABLE OF CONTENTS
DECEMBER 31, 2012
STATISTICAL SECTION (Unaudited)
Schedule of Net Position by Component Schedule of Change in Net Position Member Growth Analysis - by Fund Year Reported Loss History - by Fund Year Reported Claim Activity - by Fund Year
(Continued)
61
62 63 64 65 66

INTRODUCTORY SECTION

Municipal Excess Liability Joint Insurance Fund
April 15,2013
Executive Committee Municipal Excess Liability Joint Insurance Fund 9 Campus Drive, Suite 16 Parsippany, NJ 07054
Dear Executive Committee Members:
9 Campus Drive, Suite 16 Parsippany, New Jersey 07054 Tel (201) 881-7632 Fax (201) 881-7633
1
The Comprehensive Annual Financial Report (CAFR) of the Municipal Excess Liability Joint Insurance Fund (MEL) for the year ended December 31,2012 is hereby respectfully submitted. Responsibility for the accuracy of the presented data and the completeness and fairness of the presentation, including all disclosures, rests with the MEL. We believe the data, as presented, are accurate in all material respects; that they are presented in a manner designed to fairly set forth the financial position and results of the operations of the MEL as measured by the financial activity of its various membership years; and that all disclosures necessary to enable the reader to gain the maximum understanding of the MEL's financial affairs have been included ..
The CAFR is presented in three sections: introductory, financial, and statistical. The introductory section contains this transmittal letter, substantive highlights of the year, a list of the MEL's members, a list of the MEL's officers and an organizational chart. The financial section includes a management discussion and analysis of the financial activities, the basic financial statements, as well as the independent auditors' opinion on the basic financial statements. State schedules are provided pursuant to the specifications of the NJ Department of Banking and Insurance, which, along with the Department of Community Affairs, exercises regulatory control over the MEL. The statistical section includes selected data covering the years that the MEL has been operational.
The MEL was fonned under State statutes which authorize local government entities to pool resources to meet risk management needs. Specifically, along with local joint insurance funds, the MEL administers a program of self funding and commercial insurance, and reinsurance that provides protection to members in the areas of workers' compensation, and automobile, general and professional liability. The MEL also purchases excess property insurance for its affiliated JIPs under a cooperative purchasing arrangement. The MEL perfonns a number of tasks in accomplishing this mission, including contracting for support services such as claims and litigation management, loss control services and training, financial management and reporting, actuarial services, and general management.
Economic Conditions and Outlook
The MEL's economic condition and its outlook continue to be strong. The MEL has provided its members with stable assessments, a long history of dividends, comprehensive insurance, and responsive service. These factors have resulted in steady growth. While the MEL is not expected to continue to grow at its historic rate because its market share is now so large, marginal growth or at least membership stability is expected.

2 MEL Initiatives
2012 marks the 25th Anniversary of the Municipal Excess Liability Joint Insurance Fund.
The MEL's Investment Committee reviewed Asset Management options received following its combined Joint Insurance Fund and Health Insurance Fund Request for Proposals. Committee worked with counsel to develop a Unitized Investment Trust. Effort has continued into 2013.
The MEL held its second annual all-day educational seminar for commissioners, municipal personnel, risk managers and vendor personnel. This seminar is eligible for continuing educational credits for: CFO/CMFO, Public Works, Clerks and insurance producers. The agenda includes the organization and operation of joint insurance fund, the latest trends in claims, and governmental ethics.
The MEL joined with Munich Re, the League of Municipalities, the NJ Association of Chiefs of Police and various other insurance companies to participate in a non-profit organization known as the Safety Institute of New Jersey. The Safety Institute's mission will be to build a culture of safety through legislative advocacy and by mobilizing and educating citizens to take ownership of safety programs in their communities.
The MEL Safety Training Institute (MSI), which began offering regionally scheduled safety training programs in 2003 has begun the process of adding on-line and webinar training. The development of these programs began in 2012 with a targeted operational date in 2013.
The MEL JIP updated its webpage to comply with the latest state informational requirements that had a February 2013 compliance deadline.
Financial Management and Control
The financial statements have been prepared in conformity with generally accepted accounting principles as promulgated by the Governmental Accounting Standards Board and necessarily include amounts based upon reliable estimates and judgments. The MEL's books are maintained on a full accrual basis. A summary of significant accounting policies is discussed in more detail in the notes to the financial statements found in the financial section. The MEL's financial statements differ from the State schedules listed in the supplementary data section as Schedules A through F, as discussed in Note 11 to the financial statements.
Internal Acconnting Structnre
The MEL's accounting system is organized so that each membership year, and line of coverage within each year, can be evaluated separately. The assets, liabilities, revenues, and expenses of each year and line of coverage are reported separately on a full accrual basis. This practice is necessary because the composition of the MEL's membership, and the extent of participation within each line of coverage, varies from year to year.
The MEL's management is responsible for establishing and maintaining an internal control structure designed to ensure that assets are protected from loss, theft, or misuse and to ensure that adequate accounting data are compiled to allow for the preparation of financial statements in conformity with generally accepted accounting principles. Internal accounting controls are designed to provide reasonable assurance that these objectives are being met. The concept of reasonable assurance recognizes that the cost of a control should not exceed the benefits likely to be derived and that the evaluation of costs and benefits requires estimates and judgments by management. All internal control decisions are made within the above framework. Management believes that the MEL's internal accounting controls adequately safeguard assets and provide reasonable assurance of proper recording of financial transactions.

3
Investment Management
MEL investments are made in. accordance with the Local Fiscal Affairs Law and the Fund's Cash and Investment Management Plan. Investments for the year were limited to US Treasury Securities, agency issues, deposits in banks covered by the Governmental Unit Depository Act, and deposits in the New Jersey Cash Management Plan, which is administered by the State of New Jersey's Division of Investments. In planning and executing investments, the MEL emphasizes liquidity and safety. After these objectives are met, the MEL seeks to optimize investment income. The MEL protects itself from realization of capital losses by maintaining the ability to hold all investment. to maturity. Investments with maturities of longer than six months are made by a professional asset manager from the trust department of TD Bank, which is overseen by the Fund Treasurer and the Investment Committee. Short term investments are usually limited to bank deposits and the New Jersey Cash Management Fund, and are undertaken by the Fund Treasurer. Agency issues with a maturity longer than 12 months are purchased in cooperation with the NJ Division ofInvestment.
As of December 31,2012, the MEL's portfolio consisted of the following:
Percentage of Amount Total
Checking Accounts $ 15,046,167 20.49% New Jersey Cash Management 1,067,291 1.45% Investments 57,320,850 78.06%
$ 73,434,308 100.00%
Independent Audit
Nisivoccia LLP, independent accountants, provide an independent, objective review of the fairness of the MEL's reported financial position and results of operations. Their audit includes procedures they deem necessary to express an opinion as to the fairness of the financial statements. Their opinion is included in the financial section of this report.
Acknowledgments
Our sincere appreciation is expressed to the members of the MEL Audit Committee for the leadership they provided in the expansion and improvement of the MEL's financial reporting format.
Our appreciation is also extended to each MEL commissioner, and particularly to Executive and Advisory Committee members, for their commitment to risk management and intergovernmental risk pooling.
Respectfully submitted,
'Dauid 1t C)ut& David N. Grubb, Executive Director

MUNICIPAL EXCESS LIABILITY JOINT INSURANCE FUND ROSTER OF OFFICIALS AND CONSULTANTS
DECEMBER 31, 2012
Joseph Wolk Thomas Nolan MeghanJack Christopher Marion Paul Shives Robert Landolfi Richard Hirsch Gary La Venia Jon Rheinhardt Carol Byrne Charles Cuccia David Johnson Mauro Tucci Andrew Brannen Joseph D' Arco John Salvatore William Cottman Anthony Vangeli Roger Butler
Perma Risk Management Services David N. Grubb James J. Kickham
Michael Zambito Dorsey& Semrau, Esqs. Russell Huntington, Esq. Nisivoccia LLP Actuarial Advantage
CB Botta & Associates Qual-Lynx Qual-Lynx Qual-Lynx
Qualcare
Conner StronglBuckelew
Arthur J Gallagher Risk Management Svcs, Inc.
Parente Beard
Carr Riggs & Ingram
TD Bank Wealth Advisors
Fund Chairman Fund Secretary Fund Commissioner Fund Commissioner Fund Commissioner Fund Commissioner Fund Commissioner Fund Commissioner Fund Commissioner Fund Commissioner Fund Commissioner Fund Commissioner Fund Commissioner Fund Commissioner Fund Commissioner Fund Commissioner Fund Commissioner Fund Commissioner Fund Commissioner
Administrator Executive Director Deputy Executive Director
Treasurer Attorney Deputy Attorney Auditor Actuary
Claims Administrators - Excess Liability Claims Administrators - Public OfficiallEPL Claims Administrators - Excess Property Claims Administrators - Worker's Compensation
Managed Care Provider
Underwriting Manager
Producer
Internal Auditor - Insurance Component
Internal Auditor - Financial Component
Asset Manager
4

MUNICIPAL EXCESS LIABll.JTY JOINT INSURANCE FUND ROSTER OF OFFICIALS AND CONSULTANTS
DECEMBER 31. 2012
R.Bent
Kathleen Wilkinson, Esq.
JA Montgomery Risk Control
La Mendola Associates
EFitz Art
New Tech
Lobbyist
Technical Writer
Safety Consultant and MSI Training
Independent Strategic Planner & Communication Consultant
Graphic Designer
Website - Monthly Hosting
5

Commissioners Appt b Members
Executive Dlr/Adm PERMA
Technical Writer K. Wilkinson
Lobbyist R. Bent
Underwriting
MUNICIPAL EXCESS LIABILITY JOINT INSURANCE FUND 2012 ORGANIZATIONAL CHART
I
Board of Fund Commissioners
I H I I Attorney I Deputy Attorney
F. Semrau /J. Dorsey R. Huntington H I I
I I Treasurer l Defense H I L M. Zambito Attorneys
I J Claims POL H I I Qual-Lynx
Claims Excess H I Qual-Lynx Conner Strona/Buckelew I CB Botta & Associates
H Actuary ~ Actuarial Advantage Safety Consultant
- JA Montgomery Risk Control H
Asset Manager
~ TO Bank
Long Range Planner/ --1 Producer
Arthur J. Gallagher RMS H Internal Auditor -Parente Beard and
Carr Riggs & Ingram H ---i Managed Care Qualcare
Strategic Planner r-La Mendola Associates H --1 Graphic Designer I Efitz Art
Y
6
Auditor I NisivQccia LLP
Strategic I Planning
Coverage I Committee
Audit
J Committee
Investment I Committee
Legislative I Committee
Rules and I Contracts
Nominating I Committee
Member/Marketing I Committee
Safety &
J Training
Police I Accreditation
Claims I Review Committee

MUNICIPAL EXCESS LIABILITY JOINT INSURANCE FUND MEMBERSHIP LISTING
AS OF DECEMBER 31. 2012
Atlantic County Municipal Joint Insurance Fund (42 Municipalities)
Bergen County Municipal Joint Insurance Fund (38 Municipalities)
Burlington County Municipal Joint Insurance Fund (25 Municipalities)
Camden County Municipal Joint Insurance Fund (34 Members)
Central Jersey Joint Insurance Fund (8 Municipalities)
GloucesterlSalemlCumberiand Counties Municipalities Joint Insurance Fund (36 Municipalities)
Mid Jersey Municipal Joint Insurance Fund (13 Municipalities)
Monmouth Municipal Joint Insurance Fund (37 Municipalities)
Morris County Municipal Joint Insurance Fund (39 Municipalities)
New Jersey First Responders Joint Insurance Fund (24 Districts)
New Jersey Public Housing Authorities Joint Insurance Fund (89 Authorities)
New Jersey Self Insurers' Joint Insurance Fund (8 Municipalities and 1 Regional Fire and Rescue Squad)
New Jersey Utility Authorities Joint Insurance Fund (73 Authorities)
Ocean County Municipal Joint Insurance Fund (31 Municipalities)
Professional Municipal Management Joint Insurance Fund (4 Municipalities)
Public Alliance Insurance Coverage Fund (26 Municipalities, 1 Authority and 1 County)
South Bergen Municipal Joint Insurance Fund (23 Municipalities)
Suburban Essex Municipal Joint Insurance Fund (11 Member Entities)
Suburban Municipal Joint Insurance Fund (10 Municipalities)
7

FINANCIAL SECTION

8
ONISIVOCCIAup Certified Public Accountants & Advisors Mount Arlington Corporate Center
200 Valley Road, Suite 300 Mt. Arlington, NJ 07856
973-328-1825[973-328-0507 Fax
Independent Auditors' Report
The Honorable Chairperson and Members of the Board of Fund Commissioners Municipal Excess Liability Joint Insurance Fund Parsippany, New Jersey
Report on the Financial Statements
Lawrence Business Center 11 Lawrence Road Newton, NJ 07860
973-383-66991973-383-6555 Fax
We have audited the accompanying financial statements of the Municipal Excess Liability Joint Insurance Fund (the "Fund") as of and for the years ended December 31,2012 and 2011, and the related notes to the financial statements, which collectively comprise the Fund's basic financial statements as listed in the table of contents.
Management's Responsibility for the Financial Statements
Management is responsible for the preparation and fair presentation of these financial statements in accordance with accounting principles generally accepted in the United States of America; this includes the design, implementation, and maintenance of internal control relevant to the preparation and fair presentation of financial statements that are free from material misstatement, whether due to fraud or error.
Auditor's Responsibility
Our responsibility is to express opinions on these financial statements based on our audit. We conducted our audit in accordance with auditing standards generally accepted in the United States of America, audit requirements prescribed by the Division of Local Government Services, Department of Community Affairs, State of New Jersey, and the standards applicable to financial audits contained in Government Auditing Standards. issued by the Comptroller General of the United States. Those standards require that we plan and perform the audit to obtain reasonable assurance about whether the financial statements are free from material misstatement.
An audit involves performing procedures to obtain audit evidence about the amounts and disclosures in the financial statements. The procedures selected depend on the auditor's judgment, including the assessment of the risks of material misstatement of the financial statements, whether due to fraud or error. In making those risk assessments, the auditor considers internal control relevant to the entity's preparation and fair presentation of the financial statements in order to design audit procedures that are appropriate in the circumstances, but not for the purpose of expressing an opinion on the effectiveness of the entity's internal control. Accordingly, we express no such opinion. An audit also includes evaluating the appropriateness of accounting policies used and the reasonableness of significant accounting estimates made by management, as well as evaluating the overall presentation of the financial statements.
www.nisivoccia.com Independent Member of BKR International

The Honorable Chairperson and Members of the Board of Fund Commissioners
Municipal Excess Liability Joint Insurance Fund Page 2
We believe that the audit evidence we have obtained is sufficient and appropriate to provide a basis for our audit opinions.
Opinions
In our opinion, the financial statements referred to above present fairly, in all material respects, the financial position of the Fund as of December 31,2012 and 2011, and the changes in financial position and cash flows thereof for the years then ended in accordance with accounting principles generally accepted in the United States of America.
Other Matters
Required Supplementary Information
Accounting principles generally accepted in the United States of America require that the Management's Discussion and Analysis and the accompanying Comparative Reconciliation of Claims Liabilities by Fund and Ten-Year Claims Development Information Schedules be presented to supplement the basic financial statements. Such information, although not a part of the basic financial statements, is required by the Governmental Accounting Standards Board who considers it to be an essential part of financial reporting for placing the basic financial statements in an appropriate operational, economic, or historical context. We have applied certain limited procedures to the required supplementary information in accordance with auditing standards generally accepted in the United States of America, which consisted of inquiries of management about the methods of preparing the information and comparing the information for consistency with management's responses to our inquiries, the basic financial statements, and other knowledge we obtained during our audit of the basic financial statements. We do not express an opinion or provide any assurance on the information because the limited procedures do not provide us with sufficient evidence to express an opinion or provide any assurance.
Supplementary and Other Information
Our audit was conducted for the purpose of forming opinions on the financial statements that collectively comprise the Fund's basic financial statements. The introductory section, supplementary data, combining supplementary schedules, and statistical section are presented for purposes of additional analysis and are not a required part of the basic financial statements.
The combining supplementary schedules are the responsibility of management and were derived from and relate directly to the underlying accounting and other records used to prepare the basic financial statements. Such information has been subjected to the auditing procedures applied in the audit of the basic financial statements and certain additional procedures, including comparing and reconciling such information directly to the underlying accounting and other records used to prepare the basic financial statements or to the basic financial statements themselves, and other additional procedures in accordance with aUditing standards generally accepted in the United States of America. In our opinion, the combining supplementary schedules are fairly stated, in all material respects, in relation to the basic financial statements as a whole.
The introductory section, supplementary data, and statistical section have not been subjected to the auditing procedures applied in the audit of the basic financial statements, and accordingly, we do not express an opinion or provide any assurance on it.
9

The Honorable Chairperson and Members of the Board of Fund Commissioners
Municipal Excess Liability Joint Insurance Fund Page 3
Other Reporting Required by Government Auditing Standards
In accordance with Government Auditing Standards, we have also issued our report dated April 15, 2013 on our consideration of the Fund's internal control over financial reporting and on our tests of its compliance with certain provisions of laws, regulations, contracts, and grant agreements and other matters. The purpose of that report is to describe the scope of our testing of internal control over financial reporting and compliance and the results of that testing, and not to provide an opinion on internal control over financial reporting or on compliance. That report is an integral part of an audit performed in accordance with Government Auditing Standards in considering Fund's internal control over financial reporting and compliance.
Mount Arlington, New Jersey April 15, 2013
/1/~l..C/1 NISIVOCClA LLP
10

MUNICIPAL EXCESS LIABILITY JOINT INSURANCE FUND Management Discnssion and Analysis
(Unaudited)
11
This section of the annual financial report of the Fund presents a discussion and analysis of the financial performance of the Fund for the year ended December 31, 2012. Please read it in conjunction with the basic financial statements, the notes, and supplementary schedules that follow this section.
Overview of Basic Financial Statements
The Fund's basic financial statements are prepared on the basis of accounting principles generally accepted in the United States of America for governmental entities and insurance enterprises where applicable. The primary purpose of the Fund is to provide excess property and casualty insurance for joint insurance funds that are members of the Fund. The Fund maintains separate enterprise funds by incurred years and line of coverage. The basic financial statements are presented on an accrual basis of accounting. The three basic financial statements presented are as follows:
Statement of Net Position - This statement presents information reflecting the Fund's assets, liabilities, and net position. Net position represents the amount of total assets less total liabilities.
Statement of Revenue, Expenses, and Changes in Net Position - This statement reflects the Fund's operating revenues and expenses, as well as non-operating items during the reporting period. The change in net position for an enterprise fund is similar to net profit or loss for any other insurance company.
Statement of Cash Flows - The statement of cash flows is presented on the direct method of reporting, which reflects cash flows from operating and investing activities. Cash collections and payments are reflected in this statement to arrive at the net increase or decrease in cash for the fiscal year.
Financial Highlights
The following tables summarize the financial position and results of operations for the Fund as of and for the years ended December 31,2012,2011 and 2010.
SUMMARY OF STATEMENT OF NET POSITION 11/12 10111 Percent Percent
2012 2011 Change 2010 Change ASSETS:
Cash and Cash Equivalents, Investments and Accrued Interest Receivable $ 73,556,074 $ 80,966,575 -9.15% $ 76,194,467 6.26%
Assessments Receivable 2,065,710 10,872,986 -81.00% 14,233,002 -23.61% Investment in Joint Venture 899,714 1,083,646 -16.97% 1,306,723 -17.07% Other Assets 3,635,456 3,043,031 19.47% 5,559,541 -45.26%
Total 80,156,954 95,966,238 -16.47% 97,293,733 -1.36%
LIABILITIES: Loss Reserves 57,104,193 71,371,105 -19.99% 77,839,198 -8.31 % Other Liabilities and Reserves 2,176,705 2,943,192 -26.04% 742,042 296.63%
Total 59,280,898 74,314,297 -20.23% 78,581,240 -5.43%
NET POSITION $ 20,876,056 $ 21,651,941 -3.58% $ 18,712,493 15.71 %

12
SUMMARY OF STATEMENT OF REVENUE, EXPENSES, AND CHANGES IN NET POSITION 11/12 10/11
Percent Percent 2012 2011 Change 2010 Change
Operating Revenue: Assessments and Other Income $43,245,446 $43,756,127 -1.17% $57,156,175 -23.44%
Operating Expenses: Provision for Claims & Claims Expense 6,999,622 9,291.311 -24.66% 27,208,859 -65.85% Assessment for Participation in RCF 16,384,865 11,781,164 39.08% 9,933,817 18.60% Insurance Premiums 15,709,983 16,184,424 -2.93% 16,599,145 -2.50% Administrative and Operating Expenses 5,361,882 5,029,169 6.62% 5,378,891 -6.50%
Total Operating Expenses 44,456,352 42,286,068 5.13% 59,120,712 -28.48%
Operating Income/(Loss) (1,210,906) 1,470,059 -182.37% (1,964,537) 174.83%
Non-Operating Income/(Expenses): Change in Investment in Joint Venture (183,932) (223,077) 17.55% (59,956) -272.07% Investment Income 618,953 1,692,466 -63.43% 655,152 158.33%
Increase/(Decrease) in Net Position $ (775,885) $ 2,939,448 -126.40% $ (1,369,341) 314.66%
The MEL's asset base decreased by 16.47% during the reporting period and cash and investments decreased by 9.15%. The "Investment in Joint Venture" represents the MEL's share of net assets in the Municipal Excess Liability Residual Claims Fund. The value of this asset decreased by 16.97% reflecting a decrease in equity retained by that entity.
The MEL's liabilities decreased by 20.23% primarily due to an 19.99% decrease in loss reserves.
For 2012 assessments decreased slightly by 1.17%.
For 2011 assessments decreased by 23.44%, due the fact that effective 111111 the MEL transferred public official and employment practices liability coverage to the commercial market.
The provision for claims and claims expense decreased by 24.66%. Insurance premiums decreased by 2.93%, while administrative and operating expenses increased by 6.62%.
Investment income decreased by 63.43% due to the low interest rate environment.
For 2012, the MEL continued the policy started in 2004 of not issuing dividends. The MEL emphasized capital accumulation over continuity of dividends for the members.
The MEL's combined net position for all years is $20,876,056 in 2012 compared to $21,651,941 at the end of 2011; a decrease of 3.58%. Net position values for both reporting periods include the cumulative effect of the discounting of loss reserves.
The future financial position of the MEL will be impacted by medical costs trends that impact upon workers compensation costs. To address this cost area, the MEL continues to reevaluate its managed care contracts and procedures and closely monitor claims.
The MEL and its members were increasingly affected by the development of employment practice laws in 2010 and prior years. To address this problem, the MEL and its sub-committees pursued various options to control these costs and decided to transfer the coverage to the commercial market for 2011. XL Specialty Insurance Company agreed to provide the coverage based on the 2010 pricing and agreed to a two-year commitment.

13
BASIC FINANCIAL STATEMENTS

MUNICIPAL EXCESS LIABILITY JOINT INSURANCE FUND
STATEMENT OF NET POSITION
December 31 2012
ASSETS:
Current Assets: Cash and Cash Equivalents $ 16,113,458
Investments 57,320,850
Assessments Receivable 2,065,710
Accounts Receivable Notes Receivable 237,251 Accrued Interest Receivable 121,766
Insurance Receivables 1,426,443 Due from Municipal Excess Liability Residual Claims Fund 906,296
Prepaid Expenses 92,217 Investment in Joint Venture 899,714
Total Current Assets 79,183,705
Long-Term Assets:
Notes Receivable 973,249 Total Long-Term Assets 973,249
Total Assets 80,156,954
LIABILITIES:
Loss Reserves 57,104,193 Accounts Payable - Vendors 111,964
Other Liabilities 2,064,741
Total Liabilities 59,280,898
NET POSITION:
Unrestricted 20,876,056
Total Net Position $ 20,876,056
THE ACCOMPANYING NOTES TO FINANCIAL STATEMENTS ARE AN INTEGRAL PART OF THIS STATEMENT
2011
$ 10,127,882 70,602,344 10,872,986
12,652 56,000
236,349 2,175,504
628,754
1,083,646 95,796,117
170,121 170,121
95,966,238
71,371,105 265,636
2,677,556
74,314,297
21,651,941
$ 21,651,941
14

MUNICIPAL EXCESS LIABILITY JOINT INSURANCE FUND STATEMENT OF REVENUE, EXPENSES, AND CHANGES IN NET POSITION
Year Ended December 31 2012
Operating Revenue: Assessments from Participating Members $ 43,245,446
Total Operating Revenue 43,245,446
Operating Expenses: Provision for Claims and Claim Adjustment Expense (Net of Reinsurance
of $5,500,803 and $8,895,080 for 2012 and 2011, respectively) 6,999,622 Assessment for Participation in Municipal Excess Liability
Residual Claims Fund 16,384,865 Insurance Premiums 15,709,983 Claims Administration 1,093,718 Other Contractual Services 2,445,527 Non-Contractual Expenses 87,923 Administration 918,536 Insurance Brokerage Expense 469,749 Risk Management Fees 346,429
Total Operating Expenses 44,456,352
Operating Income/(Loss) (1,210,906)
Non-Operating Income/(Expenses): Change in Investment in Joint Venture (183,932) Investment Income 618,953
Change in Net Position (775,885)
Net Position - Beginning of Year 21,651,941
Net Position - End of Year $ 20,876,056
THE ACCOMPANYING NOTES TO FINANCIAL STATEMENTS ARE AN INTEGRAL PART OF THIS STATEMENT
2011
$ 43,756,127
43,756,127
9,291,311
11,781,164 16,184,424
1,075,156 2,176,048
77,853 899,573 460,538 340,001
42,286,068
1,470,059
(223,077) 1,692,466
2,939,448
18,712,493
$ 21,651,941
15

MUNICIPAL EXCESS LIABILITY JOINT INSURANCE FUND STATEMENT OF CASH FLOWS
Year Ended December 31 2012
Cash Flows from Operating Activities: Assessments Collected $ 52,052,722 Refunds 15,672,264 Claims Expense (36,938,798) Professional and Administrative Expenses (7,192,313) Insurance Premiums (14,960,922) Municipal Excess Liability Residual Claims Fund (16,662,407)
Net Cash Provided/(Used) by Operating Activities (8,029,454)
Cash Flows from Investing Activities: Purchase of Investment Securities (59,813,349) Proceeds from Sales and Maturities of Investment Securities 73,028,349 Investment Income 800,030
Net Cash Provided/(Used) by Investing Activities 14,015,030
Net Increase/(Decrease) in Cash and Cash Equivalents 5,985,576
Cash and Cash Equivalents, January 1 10,127,882
Cash and Cash Equivalents, December 31 $ 16,113,458
Reconciliation of Operating Income/(Loss) to Net Cash Provided/(Used) by Operating Activities:
Operating Income/(Loss) $ (1,210,906) Adjustments to Reconcile Operating Income/(Loss) to Net Cash Provided/(Used) by Operating Activities:
Changes in Assets and Liabilities: (Increase)lDecrease in Assets:
Assessments Receivable 8,807,276 Insurance Receivables 749,061 Due from Municipal Excess Liability Residual Claims Fund (277,542) Accounts Receivable 12,652 Prepaid Expense (92,217) Notes Receivable (984,379)
Increase/(Decrease) in Liabilities: Loss Reserves (14,266,912) Accounts Payable (153,672) Other Liabilities (612,815)
Net Cash Provided/(Used) by Operating Activities $ (8,029,454)
THE ACCOMPANYING NOTES TO FINANCIAL STATEMENTS ARE AN INTEGRAL PART OF THIS STATEMENT
2011
$ 47,116,143 4,300,899
(20,060,303) (2,786,792)
(15,734,844) (9,755,461)
3,079,642
(72,782,150) 59,813,500
834,784
(12,133,866)
(9,054,224)
19,182,106
$ 10,127,882
$ 1,470,059
3,360,016 449,580
2,025,703 (12,652)
53,879
(6,468,093) 37,898
2,163,252
$ 3,079,642
16

MUNICIPAL EXCESS LIABILITY JOINT INSURANCE FUND NOTES TO FINANCIAL STATEMENTS
DECEMBER 31, 2012
NOTE I: NATURE OF OPERATIONS
The Municipal Excess Liability Joint Insurance Fund (the "Fund") was created on December 16, 1986, in accordance with PL 1983, C.372, entitled "An act concerning joint insurance funds for local units of government, and supplementing Chapter 10 of Title 40A of the New Jersey statutes". The Fund is both an insured and self-administered group of joint insurance funds established for the purpose of providing low-cost insurance coverage for the members in order to keep local property taxes and fees at a minimum for the municipalities and authorities who form the membership of the joint insurance funds. The participating joint insurance funds must be able to prove satisfactorily to the Fund their compliance with funding and underlying coverage criteria as annually agreed and approved by the Fund. The Fund has 19 members. The following coverages are offered by the Fund to its members:
a) Excess Workers' Compensation and Employers' Liability b) Excess Liability Other than Motor Vehicles c) Excess Motor Vehicle d) Public Officials'lEmployment Practices Liability (For Fund Years 2009 and 2010 only) e) Excess Property t) Volunteer Directors and Officers Liability
Fund members are subject to supplemental assessments in the event of deficiencies. If the assets of the Fund were to be exhausted, members would be responsible for the Fund's liabilities. The Fund considers anticipated investment income when determining if a deficiency exists.
A participating member must remain in the Fund for the full term of membership unless terminated earlier by a majority vote of the Fund Commissioners or a two-thirds vote of the Executive Committee for nonpayment of assessments or continued noncompliance after written notice to comply with the bylaws or other obligations. Termination may occur only after proper notice has been given, in accordance with the Fund's bylaws.
The Executive Director and Administrator are responsible for the overall administration of the Fund. Fees paid to the Executive Director and Administrator encompasses all administrative duties which are performed at their offices. Accordingly, the Fund does not maintain any capital assets or incur any payroll expense.
NOTE 2: SUMMARY OF SIGNIFICANT ACCOUNTING POLICIES
The Governmental Accounting Standards Board (GASB) is the accepted standard-setting body for establishing government accounting and financial reporting principles. The more significant of the Fund's accounting policies are described on the next page.
17

MUNICIPAL EXCESS LIABILITY JOINT INSURANCE FUND NOTES TO FINANCIAL STATEMENTS
DECEMBER 31, 2012 (Continued)
NOTE 2: SUMMARY OF SIGNIFICANT ACCOUNTING POLICIES (Cont'd)
Reporting Entity
Government Accounting Standards Board publication Codification of Government Accounting and Financial Reporting Standards, Section 2100, "Defining the Financial Reporting Entity" establishes standards to determine whether a governmental component unit should be included in the financial reporting entity. The basic criterion for inclusion or exclusion from the financial reporting entity is the exercise of oversight responsibility over agencies, boards and commissions by the primary government and financial accountability. The exercise of oversight responsibility includes financial interdependency and a resulting financial benefit or burden relationship, selection of governing authority, designation of management, ability to significantly influence operations, and accountability for fiscal matters. In addition, certain legally separate, tax-exempt entities that meet specific criteria (i.e. benefit of economic resources, access/entitlement to economic resources, and significance) should be included in the financial reporting entity. The combined financial statements include all funds of the Fund over which the Fund exercises operating control. There were no additional entities required to be included in the reporting entity under the criteria as described above, in the current fiscal year. Furthermore, the Fund is not includable in any other reporting entity on the basis of such criteria.
Basis of Accounting
The Fund utilizes the accrual basis of accounting whereby revenue is recorded as earned and expenses are reflected as the liability is incurred. The Fund utilizes total economic resources as the measurement focus. Operating revenue, such as charges for services, result from exchange transactions associated with the principal activity of the Fund. Exchange transactions are those in which each party receives and gives up essentially equal value. Nonoperating revenue, such as subsidies and investment earnings, results from nonexchange transactions or ancillary activities. Nonexchange transactions, in which the Fund gives or receives value without directly receiving or giving equal value in exchange, generally do not occur, with the exception of investment earnings and the changes in joint ventures.
Investments
The Fund generally records certain investments at fair value and records the unrealized gains and losses as a part of investment income. Fair value is the amount at which an investment could be exchanged in a current transaction between willing parties.
Income Taxes
The Fund is a tax-exempt organization and is not subject to either federal or state income taxes.
18

MUNICIPAL EXCESS LIABILITY JOINT INSURANCE FUND NOTES TO FINANCIAL STATEMENTS
DECEMBER 31, 2012 (Continued)
NOTE 2: SUMMARY OF SIGNIFICANT ACCOUNTING POLICIES (Cont'd)
Assessments
The gross claim fund assessment is detennined by the actuary and, when combined with expense and premium projections, constitutes the Fund's budget. Assessments for participating joint insurance funds are detennined by underwriting criteria established by the Board of Commissioners.
Unpaid Claims Liabilities
The Fund establishes claims liabilities based on estimates of the ultimate cost of claims that have been reported but not settled, and of claims that have been incurred but not reported. The length of time for which such costs must be estimated varies depending on the coverage involved. Estimated amounts of salvage and subrogation and reinsurance recoverable on unpaid claims are deducted from the liability for unpaid claims. Because actual claims costs depend on such complex factors as inflation, changes in doctrines of legal liability, and damage awards, the process used in computing claims liabilities does not necessarily result in an exact amount, particularly for coverages such as general liability. Claims liabilities are recomputed periodically using a variety of actuarial and statistical techniques to produce current estimates that reflect recent settlements, claim frequency, and other economic and social factors. A provision for inflation in the calculation of estimated future claims costs is implicit in the calculation because reliance is placed both on actual historical data that reflect past inflation and on other factors that are considered to be appropriate modifiers of past experience. The Fund discounts claim liabilities for financial reporting purposes. Adjustments to claims liabilities are charged or credited to expense in the periods in which they are made.
Reinsurance
The Fund uses reinsurance agreements to reduce its exposure to large losses on certain types of insured events. Reinsurance pennits recovery of a portion of losses from reinsurers, although it does not discharge the primary liability of the Fund as direct insurer of the risks reinsured. The Fund does not report reinsured risks as liabilities unless it is probable that those risks will not be covered by reinsurers. Reinsurance premiums amounted to $15,709,983, and $16,184,424 for the years ended December 31,2012 and 2011, respectively. Premiums were reduced for financial reporting purposes by experience refunds from the reinsurer of $-0- for 2012 and 2011, respectively. The amount deducted from claims liabilities for reinsurance was $11,886,205 and $3,108,793 at December 31,2012 and 2011, respectively.
Management Estimates
The preparation of financial statements in conformity with GAAP requires management to make estimates and assumptions that affect the reported amounts of revenue and expenses during the reporting period. Actual results could differ from those estimates.
19

MUNICIPAL EXCESS LIABILITY JOINT INSURANCE FUND NOTES TO FINANCIAL STATEMENTS
DECEMBER 31. 2012 (Continued)
NOTE 3: LOSS RESERVES
The liability for unpaid losses and loss adjustment expenses represents an estimate of the ultimate net cost of all losses and loss adjustment expenses incurred but not yet paid as of December 31,2012. This estimate is based on the estimated ultimate cost of settling the claims considering the historical experience of the Fund, various other industry statistics, including the effects of inflation and other societal or economic factors. Management believes that the liability for unpaid losses is adequate to cover the ultimate cost of reported and unreported claims incurred but not yet paid. However, the ultimate cost may be more or less than the estimated liability. The unpaid losses are stated net of any recoveries from excess loss insurance and reinsurance coverages. The Fund has created a loss reserve for any reported and potential unreported losses which have taken place but in which the Fund has not received notices or reports oflosses.
Loss reserves, at December 31, 2012 and 2011, which have been estimated by the Fund's Actuary and Servicing Agents, are as follows:
2012 2011
Case Reserves $ 18,705,982 $ 28,885,071 Losses Incurred but not Reported 38,398,211 42,486,034
Total Loss Reserves $ 57,104,193 $ 71,371,105
The following represents changes in the aggregate reserves for the Fund:
2012 2011
Unpaid Claims and Claim Adjustment Expenses, Beginning of Year $ 71,371,105 $ 77,839,198
Incurred Claims and Claim Adjustment Expenses: Provision for Insured Events of the Current Period 16,926,886 17,829,061 (Decrease)lIncrease in Provision for Insured Events of Prior Years (9,927,264) (8,537,750)
Total Incurred Claims and Claim Adjustment Expenses 6,999,622 9,291,311
Payments: Claims and Claim Adjustment Expenses Attributable to Insured Events of the Current Period 1,496,244 1,499,370
Claims and Claim Adjustment Expenses Attributable to Insured Events of Prior Years 19,770,290 14,260,034
Total Payments 21,266,534 15,759,404
Total Unpaid Claims and Claim Adjustment Expenses, End of Year $ 57,104,193 $ 71,371,105
20

MUNICIPAL EXCESS LIABILITY JOINT INSURANCE FUND NOTES TO FINANCIAL STATEMENTS
DECEMBER 31. 2012 (Continued)
NOTE 3: LOSS RESERVES (Cont'd)
In accordance with the method allowed by GASB Statement No. 10, the Fund elected to discount its loss reserves beginning with the year ended December 31, 2003. The Fund believes that the discounting of loss reserves presents a more accurate presentation of the current loss reserves to be paid in future periods.
At December 31,2012, $64,103,491 of unpaid claims and claim adjustment expenses are presented at their net present value of $57,104,193. These claims are discounted at an annual rate of 3%.
At December 31, 2011, $79,869,222 of unpaid claims and claim adjustment expenses are presented at their net present value of $71,371,105. These claims are discounted at an annual rate of3%.
The Fund maintains contracts for insurance including excess insurance covering losses in excess of an amount established between the Fund and the insurer up to the limits of coverage set forth in the contract on a specific occurrence, or per accident or annual aggregate basis. The Fund also maintains a contract for reinsurance for Liability other than motor vehicle covering losses in excess of an amount established between the Fund and the Reinsurer up to the limits of coverage set forth in the contract on a specific occurrence or aggregate basis.
A contingent liability exists with respect to insurance coverage which would become an actual liability in the event the insuring companies, or any of them, might be unable to meet their obligations to the Fund under existing reinsurance agreements.
NOTE 4: CASH AND CASH EOUIV ALENTS
Cash and cash equivalents include amounts in deposits, money market accounts, short-term investments with original maturities of three months or less.
GASB Statement No. 40, Governmental Accounting Standards Deposit and Investment Risk Disclosures, requires disclosure of the level of custodial credit risk assumed by the Fund in its cash, cash equivalents and investments, if those items are uninsured or unregistered. Custodial risk is the risk that in the event of bank failure, the government's deposits may not be returned.
Interest Rate Risk - In accordance with its cash management plan, the Fund ensures that any deposit or investments matures within the time period that approximates the prospective need for the funds, deposited or invested, so that there is not a risk to the market value of such deposits or investments.
Credit Risk - The Fund limits its investments to those authorized in its cash management plan which are permitted under state statutes as detailed below.
New Jersey statutes permit the deposit of public funds in institutions located in New Jersey, which are insured by the Federal Deposit Insurance Corporation (FDIC) or by any other agencies of the United States that insure deposits or the State of New Jersey Cash Management Fund.
21

MUNICIPAL EXCESS LIABILITY JOINT INSURANCE FUND NOTES TO FINANCIAL STATEMENTS
DECEMBER 31, 2012 (Continued)
NOTE 4: CASH AND CASH EOUIV ALENTS (Cont'd)
New Jersey statutes require public depositories to maintain collateral deposits or public funds that exceed insurance limits as follows:
The market value of the collateral must equal 5% of the average daily balance of public funds; and
If the public funds deposited exceed 75% of the capital funds of the depository, the depository must provide collateral having a market value equal to 100% of the amount exceeding 75%.
All collateral must be deposited with the Federal Reserve Bank, the Federal Home Loan Bank Board or a banking institution that is a member of the federal reserve system and has capital funds of not less than $25,000,000.
As of December 31, 2012 and 2011, cash and cash equivalents of the Fund consisted of the following:
Checking Accounts Cash Management Funds
Dec. 31, 2012 $ 15,046,167
1,067,291
$ 16,113,458
Dec. 31, 2011 $ 9,061,192
1,066,690
$ 10,127,882
The carrying amount of the Fund's cash at cost as of December 31, 2012 and 2011 was $16,113,458 and $10,127,882 respectively. The bank balances as of December 31, 2012 and 2011 were $21,854,749 and $10,767,160, respectively. The $1,067,291 and $1,066,690 invested with the State of New Jersey Cash Management Fund is uninsured and unregistered.
NOTE 5: INVESTMENTS
New Jersey statutes permit the Fund to purchase the following types of investments:
(I) Bonds or other obligations of the United States of America or obligations guaranteed by the United States of America;
(2) Government money market mutual funds;
(3) Any obligation that a federal agency or a federal instrumentality has issued in accordance with an act of Congress, which security has a maturity date not greater than 397 days from the date of purchase, provided that such obligations bears a fixed rate of interest not dependent on any index or other external factor;
(4) Bonds or other obligations of local units or bonds or other obligations of school districts of which the local units are part or within which the school district is located;
22

MUNICIPAL EXCESS LIABILITY JOINT INSURANCE FUND NOTES TO FINANCIAL STATEMENTS
DECEMBER 31. 2012 (Continued)
NOTE 5: INVESTMENTS (Cont'd)
23
(5) Bonds or other obligations, having a maturity date not more than 397 days from the date of purchase, approved by the Division of Investment of the Department of the Treasury for investment by local units;
(6) Local government investment pools;
(7) Deposits with the State of New Jersey Cash Management Fund; or
(8) Agreements for the repurchase of fully collateralized securities if:
(a) the underlying securities are permitted investments pursuant to paragraph (1) and (3) above;
(b) the custody of collateral is transferred to a third party;
(c) the maturity of the agreement is not more than 30 days;
(d) the underlying securities are purchased through a public depository as defined in statute; and
(e) a master repurchase agreement providing for the custody and security of collateral is executed.
(9) Debt obligations of federal agencies or government corporations with maturities not to exceed 10 years from the date of purchase, excluding mortgage backed or derivative obligations, provided that the investments are purchased through the State Division of Investment and are invested consistent with the rules and regulations of the State Investment Council.
All of the Fund's investments are recorded at fair value based on quoted market prices. The investments are held by the Fund's custodial bank trust department in the Fund's name. The bank's trust department is also its agent in purchasing and selling the securities. The investments are uninsured and unregistered. All of the funds held by the custodial bank are held in a fiduciary account, in the Fund's name, and are backed by the full faith and credit of the U.S. Government. As such, they are protected in the event of bankruptcy of the bank. Investments at December 31, 2012 and 2011 consisted of the following:
Weighted Weighted Average Average
Balance Maturity Balance Maturity Dec. 31, 2012 in Months Dec. 31, 2011 in Months
United States Government Obligations $ 202,164 37.00
Federal Home Loan Bank $ 20,010,400 26.25 20,069,650 43.00
Federal National Mortage Association 30,288,680 48.09 30,239,630 50.60
Federal Home Loan Mortage Corporation 7,021,770 39.44 20,090,900 48.26
$ 57,320,850 39.41 $ 70,602,344 47.74

MUNICIPAL EXCESS LIABILITY JOINT INSURANCE FUND NOTES TO FINANCIAL STATEMENTS
DECEMBER 31. 2012 (Continued)
NOTE 6: NET POSITION
The State of New Jersey has no statutory minimum net position requirements.
The Fund had statutory basis accumulated deficit net position accounts as follows:
Fund Year 2009 - Public Officials'lEmployment Practices Fund Year 2009 - Faithful Performance Bond Fund Year 2010 - Liability Fund Year 2010 - Public Officials'lEmployment Practices Fund Year 2010 - Faithful Performance Bond Fund Year 2011 - Public Officials'lEmployment Practices Fund Year 2012 - Property Fund Year 2012 - Liability
$ 6,617,509 773,431 900,360 261,360 73,969 57,968
1,035,739 455,963
In addition to the above individual deficits, the Aggregate Excess Loss Fund Contingency also had an overall deficit of $1,953,868 at December 31, 2012. The Fund has no current plans to assess the membership to eliminate deficit balances.
NOTE 7: INSURANCE RECEIVABLES
Insurance receivables consist of funds due from an insurance company for claim reimbursements.
NOTE 8: MEMBERSHIP IN JOINT INSURANCE FUND
In 1995, the Fund became a member of the Municipal Excess Liability Residual Claims Fund (the "Residual Fund"). The Residual Fund is a risk-sharing public entity risk pool that is a selfadministered group of joint insurance funds established for the purpose of assuming and discharging the liabilities associated with loss reserves of participating members. The transfer of these loss reserves to the Residual Fund results in the closing of those fund years and the unencumbering of the net assets related to those closed fund years. Each member appoints an official to represent their respective joint insurance fund for the purpose of creating a governing body from which officers for the Residual Fund are elected.
As a member of the Residual Fund, the Fund could be subject to supplemental assessments in the event of deficiencies. If the assets of the Residual Fund were to be exhausted, members would become jointly and severally liable for the Residual Fund's liabilities.
The Residual Fund can declare and distribute dividends to members upon approval of the State of New Jersey Department of Banking and Insurance. These distributions are divided among the members in the same ratio as their individual assessments are related to the total assessment of the membership for that fund year.
During 2012, the Residual Fund assumed the obligation for discharging the Fund's liabilities for claims and losses for the 2008 Fund Year. Loss reserves totaling $16,384,865 at June 30, 2012, were assumed as of June 30, 2012 in exchange for the Fund's assessment for participation in the Residual Fund of $16,384,865.
24

MUNICIPAL EXCESS LIABILITY JOINT INSURANCE FUND NOTES TO FINANCIAL STATEMENTS
DECEMBER 31. 2012 (Continued)
NOTE 8: MEMBERSHIP IN JOINT INSURANCE FUND (Cont'd)
During 2011, the Residual Fund assumed the obligation for discharging the Fund's liabilities for claims and losses for the 2007 Fund Year. Loss reserves totaling $11,781,164 at June 30,2011, were assumed as of June 30, 2011 in exchange for the Fund's assessment for participation in the Residual Fund of $11,781,164.
Selected, summarized financial information for the Residual Fund as of December 31, 2011 is as follows:
Municipal Excess Liability
Residual Cl aims Fund
Total Assets $ 67,482,281
Net Position $ 3,099,500
Total Revenue $ 24,735,438
Total Expenses $ 24,502,626
Change in Net Position $ 232,812
Member Dividends $ 400,000
The Fund's equity interest in the Residual Fund was $899,714 and $1,083,646 as of December 31,2012 and 2011, respectively.
Financial statements for the Residual Fund are available at the office of the Residual Fund's Executive Director:
PERMA Risk Management Services 9 Campus Drive, Suite 16 Parsippany, New Jersey, 07054 (201) 881-7632
NOTE 9: CONTINGENCIES
In the normal course of its operations, the Fund has a number of lawsuits filed by claimants in various stages. Although estimated loss reserves have been established by the Fund, a number of these cases may possibly be settled for amounts in excess of the Fund's loss reserves. No provision for these contingencies has been included in the financial statements since the amounts are not reasonably estimable.
25

MUNICIPAL EXCESS LIABILITY JOINT INSURANCE FUND NOTES TO FINANCIAL STATEMENTS
DECEMBER 31, 2012 (Continued)
NOTE 10: NOTES RECEIVABLE
The Fund entered into a Promissory Note agreement with the Township of Robbinsville dated July 13, 2010 to fund the Township's portion of a claim settlement. The total amount of the settlement was $280,000. The Township has agreed to pay the Fund over five years at 2.3% interest. The payments of $56,000 commenced on January 2, 2011,
In 2012 the Fund entered into three additional Promissory Notes with the Township of Fairfield, the Township of Bloomfield, and the Borough of Fair Lawn. The total amounts of the settlements were $712,250, $55,000 and $275,000 respectively. The Township of Fairfield agreed to pay the Fund in installments of $71,250 over ten years. The Township of Bloomfield agreed to pay three installments on January 1,2013,2014, and 2015, in the amount of $18,334, $18,333, and $18,333 respectively. The Borough of Fair Lawn agreed to pay the Fund in installments of $91,666.66 over the next three years.
NOTE 11: RELATIONSHIP WITH STATE SCHEDULES
The information in the Fund's financial statements differs from the State Schedules listed in the supplementary data section as Schedules A through F. Specifically, the Schedules present historical information from the inception of each fund year. In addition, the financial statements reflect the Fund's equity interest in a joint venture and the discounting of loss reserves at the financial statement date. The Supplementary Schedules do not reflect the equity interest in a joint venture and the discounting of loss reserves.
26

27
REQUIRED SUPPLEMENTARY INFORMATION

Property 20[2 20[[
Unpaid claims and claim adjustment expenses at beginning of year $ [,109,838 $ 875,284
Incurred claims and claim adjustment expenses: Provision for insured events of
the current period 3,5[3,22[ 3,045,848 Increases/(decreases) in provision
for insured events of prior year.; (665,024) 0,220,407)
Total incurred claims and claim adjustment expenses 2,848,197 1.825,441
Payments: Claims and claim adjustment expenses attributable to insured events of the current period [,368,5[7 1,450.059
Claims and claim adjustment expenses attributable to insured events of the current period 1.037,775 [40,828
Total payments 2,406,292 [,590,887
Unpaid claims and claim adjustment expenses at end of year $ 1,551,743 $ 1,109,838
MUNICIPAL EXCESS LIABILITY JOINT INSURANCE FUND COMPARATIVE RECONCILIATION OF CLAIMS LIABILITIES BY FUND
FOR THE YEARS ENDED DECEMBER 31 2012 AND 2011
Liability Faithful Petfonnance Bond Worker's Compensation 20[2 2011 20[2 2011 20[2 2011
$ [8,780,082 $ [7,7[4,399 $ 690,806 $ 5[8,542 $ 27,895,645 $ 27,487,830
6,051,120 6,006,5[[ 7,362,545 8,589,055
(2,632,[79) (2,6[6,992) 460,402 286,163 (11,024,332) (5,4[9,053)
3,418,941 3,389,5[9 460,402 286,163 ~66[,787) 3.170,002
[27,727 45,73[
4,654,204 2,323,836 832,68[ 113,899 2,463,685 2,7[6,456
4,654.204 2,323,836 832,681 [[3,899 2,59[,4[2 2,762,187
$[7,544,8[9 $ 18,780,082 $ 318,527 $ 690,806 $2[,642,446 $27,895,645
Public Officials'/ Employment Practices 20[2 2011
$ 22,894,734 $3[,243,[43
187.647
3,933,869 432,539
3,933,869 620,[86
3,580
10,78[,945 8,965,0[5
10,78[,945 8,968,595
$ [6,046,658 $22,894,734
Totals 20[2
$7[,37[,[05
[6,926,886
(9,927,264)
6,999,622
[,496,244
[9,770,290
2[,266,534
$57,[04,[93
2011
$ 77,839,[98
17.829.061
(8,537,750)
9.291,311
[,499,370
14,260.034
[5,759,404
$7[,37[,105
'" (X)

MUNICIPAL EXCESS LIABILITY JOINT INSURANCE FUND TEN-YEAR CLAIMS DEVELOPMENT INFORMATION
Fiscal Period Ended December 31,2012 and Policy Period Ended December 31, 2003 2004 2005 2006 2007 2008 2009 2010 2011 2012
Required contribution and investment revenue:
Earned $ 35,979,137 $ 41,883,251 $ 45,950,444 $ 48,995,359 $ 52,370,052 $ 55,952,520 $ 56,831,012 $ 57,891,042 $ 43,996,834 $ 43,401,023 Ceded 13,499,654 15,452,240 15,444,162 18,286,578 16,461,478 15,914,456 16,565,698 16,428,516 15,926,686 16,051,969
22,479,483 26,431,011 30,506,282 30,708,781 35,908,574 40,038,064 40,265,314 41,462,526 28,070,148 27,349,054
Unallocated expenses 3,348,552 3,561,698 4,450,051 4,345,056 4,730,526 5,027,496 ~419,816 5,426,618 5,014,018 5,118,544
Estimated claims and expenses, end of policy year:
Incurred 15,356,261 15,985,079 15,802,759 18,800,966 22,047,820 26,171,277 26,586,532 26,597,577 20,481,518 27,880,350 Ceded 177,134 66,276 5,054 59,968 2,652,457 10,953,464 Net Incurred 15,179,127 15,985,079 15,802,759 18,800,966 22,047,820 26,105,001 26,581,478 26,537,609 17,829,061 16,926,886
Paid (cumulative) as of: End of policy year 1,674,551 1,348,708 1,075,029 2,113,155 1,266,553 2,724,964 1,803,382 3,185,765 1,499,370 1,496,244 One year later 5,128,677 5,559,469 4,359,007 5,509,264 6,473,414 6,562,159 5,772,692 6,774,613 2,730,660 Two years later 8,262,517 9,313,827 8,008,612 8,011,974 15,709,789 12,805,334 10,446,895 13,761,525 Three years later 11,206,046 12,282,176 13,482,131 14,497,811 21,883,494 17,189,204 18,245,500 Four years later 12,170,477 13,358,811 15,441.568 16,816,278 23,496,607 20,942,687 Five years later 12,170,477 13,358,811 17,401,005 16,816,278 23,496,607 Six years later 12,170,477 13,358,811 17,401,005 16,816,278 Seven years later 12,170,477 13,358,811 17,401,005 Eight years later 12,170,477 13,358,811 Nine years later 12,170,477
Reestimated ceded claims and expenses 8,521,017 9,413,237 11,233,172 9,933,817 11,781,164 18,217,742 362,746 709,515 1,423,472 10,953,464
Reestimated incurred claims and expense:
End of policy year 15,179,127 15,985,079 15,802,759 ,
18,800,966 22,047,820 26,105,001 26,581,478 26,537,609 17,829,061 16,926,886 One year later 15,888,736 19,422,231 18,540,391 20,319,336 27,146,776 28,791,814 28,731,045 25,131,425 15,622,139 Two years later 17,522,778 20,468,013 19,165,944 20,518,928 31,213,869 32,860,267 29,687,807 28,183,952 Three years later 19,284,058 21,313,655 23,433,499 24,506,741 33,357,562 34,632,894 32,605,145 Four years later 12,170,477 13,358,811 15,441,568 16,816,278 23,496,607 20,942,687 Five years later 12,170,477 13,358,811 17,401.005 16,816,278 23,496,607 Six years later 12,170,477 13,358,811 17,401,005 16,816,278 Seven years later 12,170,477 13,358,811 17,401,005 Eight years later 12,170,477 13,358,811 Nine years later 12,170,477
IncreaseJ(decrease) in estimated incurred claims and expense from end of policy year $ (3,008,650) $ (2.626,268) $ 1,598,246 $ (1.984,688) $ 1.448,787 $ (5.162.314l, $ 6,023.667 $ 1.646,343 $ (2,206,922) $ -O-
N (J:J
30
COMBINING SUPPLEMENTARY SCHEDULES

MUNICIPAL EXCESS LIABILITY JOINT INSURANCE FUND COMBINING SCHEDULE OF NET POSITION
DECEMBER 31, 2012
Fund Year MEL
Aggregate Excess Loss Fund
ASSETS Contingency 2009 2010 2011 2012 Total
Cash and Cash Equivalents $ (1,019,812) $ 3,447,000 $ 4,802,914 $ 4,539,386 $ 4,343,970 $ 16,113,458 Investments (3,627,804) 12,262,107 17,085,539 16,148,083 15,452,925 57,320,850 Assessments Receivable 2,065,710 2,065,710 Prepaid Expense 92,217 92,217 Notes Receivable 443,000 767,500 1,210,500 Accrued Interest Receivable 285 25,901 32,003 27,223 36,354 121,766 Insurance Receivables 945,352 102,732 378,359 1,426,443 Due from Municipal Excess Liability
Residual Claims Fund 906,296 906,296 Investment in Joint Venture 899,714 899,714
Total Assets (1,452,969) 16,605,240 22,298,815 20,714,692 21,991,176 80,156,954
LIABILITIES
Loss Reserves 14,359,646 14,422,425 12,891,479 15,430,643 57,104,193 Accounts Payable 4,744 24,433 312 82,475 111,964 Other Liabilities 500,899 498 388,910 1,174,434 2,064,741
Total Liabilities 500,899 14,364,888 14,446,858 13,280,701 16,687,552 59,280,898
NET POSITION
Unrestrictedl(Deficit) (1,953,868) 2,240,352 7,851,957 7,433,991 5,303,624 20,876,056
Total Net Position $ (1,953,868~ $ 2,240,352 $ 7,851,957 $ 7,433,991 $ 5,303,624 $ 20,876,056
w ~

MUNICIPAL EXCESS LIABILITY JOINT INSURANCE FUND COMBINING SCHEDULE OF REVENUE, EXPENSES AND CHANGES IN NET POSITION
FOR THE YEAR ENDED DECEMBER 31, 2012
Fund Year MEL
Aggregate Excess Loss Fund
Contingency 2009 2010 2011
Operating Revenue: Assessments from Participating Members $ 14,081 $ (5,568) $ (5,737)
Total Operating Revenue 14,081 (5,568) (5,737)
Operating Expenses: Provision for Claims and Claim Adjustment Expense (13,690,206) $ 2,917,338 3,052,524 (2,206,921) Assessment for Participation in Municipal Excess Liability
Residual Claims Fund 16,384,865 Insurance Premiums (316,212) (25,436) (338) Claims Administration Other Contractual Services 120,102 113,345 (4,069) Non-Contractual Expenses 12,960 Administration Insurance Brokerage Expense Risk Management Fees 1,000
Total Operating Expenses 2,391,407 3,012,004 3,165,531 (2,209,990)
Operating Income/(Loss) (2,377,326) (3,012,004) (3,l7l ,099) 2,204,253
Non-Operating Income/(Expenses): Change in Investment in Joint Venture (183,932) Investment Income 108 145,620 183,335 131,536
Change in Net Position (2,561,150) (2,866,384) (2,987,764) 2,335,789
Net Position - Beginning of Year 607,282 5,106,736 10,839,721 5,098,202
Net Position - End of Year $ (1,953,868) $ 2,240,352 $ 7,851,957 $ 7,433,991
2012
$ 43,242,670
43,242,670
16,926,887
16,051,969 1,093,718 2,216,149
74,963 918,536 469,749 345,429
38,097,400
5,145,270
158,354
5,303,624
$ 5,303,624
Total
$ 43,245,446
43,245,446
6,999,622
16,384,865 15,709,983 1,093,718 2,445,527
87,923 918,536 469,749 346,429
44,456,352
(1,210,906)
(183,932) 618,953
(775,885)
21,651,941
$ 20,876,056
'" N
33
SUPPLEMENTARY DATA

34
Schedule A MUNICIPAL EXCESS LIABILITY JOINT INSURANCE FUND
HISTORICAL OPERATING RESULTS ANALYSIS
ALL FUND YEARS
DECEMBER 31, 2012
(Unaudited)
1. Underwriting Income:
Regular Contributions (earned) $ 735,664,918
Supplemental Contributions 862,606
Other Income (except investments) 186,209
Total Income $ 736,713,733
2. Incurred Liabilities:
Claims:
Paid 232,658,242
Case Reserves 37,591,485
IBNR Reserve 38,398,211
Subtotal $ 308,647,938 Less Excess Insurance:
Received 18,354,291
Receivable 1,426,443
Recoverable 11,886,205
Subtotal 31,666,939 Limited Incurred Claims (claims-excess) 276,980,999
Expenses:
Excess Insurance Premiums 377,250,297
Administrative 80,411,175
Worker's Compensation 1,836,505
Property Grant 268,908
Subtotal Expenses 459,766,885 Total Incurred Liabilities
(limited claims and expenses) 736,747,884
3. Underwriting Surplus/(Deficitl = 1-2 (34,151)
4. Investment Income <Earned) 57,276,781
5. Gross Operating SurpluslCDeficitl = 3+4 57,242,630
6. Return of Surplus:
Paid 44,265,586
Authorized and Unpaid
Subtotal Return of Surplus 44,265,586
7. Net Current Sumlusl(Deficitl - 5-6 $ 12,977,044

MUNICIPAL EXCESS LIABILITY JOINT INSURANCE FUND
HISTORICAL BALANCE SHEET
ALL FUND YEARS
DECEMBER 31. 2012
(Unaudited)
1. Assets:
Cash and Investments (1) $ 73,434,308
Receivables (1 ):
Excess Insurance 1,426,443
Assessments 2,065,710
Other 2,238,562
Total Receivables
Prepaid Expenses (1)
Other Assets (1)
Total Assets
2. Liabilities:
Claims:
Case Reserves 25,705,280
IBNR Reserve (2) 38,398,211
Subtotal Claims
Expenses (unpaid) (1):
Excess Insurance 29,177
Administrative 82,787
Subtotal Expenses
Other Liabilities:
Unearned Contributions
Authorized Return of Surplus
Miscellaneous Liabilities (1) 2,064,741
Subtotal
Total Liabilities
NET CURRENT SURPLUS/(DEFICIT) = 1-2
Notes: (1) attach schedule itemizing these categories
(2) attach an opinion from the actuary
$ 73,434,308
5,730,715
92,217
64,103,491
111,964
2,064,741
$
$
35
Schedule B
79,257,240
66,280,196
12,977,044

1.
2.
3.
4.
MUNICIPAL EXCESS LIABILITY JOINT INSURANCE FUND FUND YEAR OPERATING RESULTS ANALYSIS
FUND YEAR - MEL AGGREGATE EXCESS LOSS FUND CONTINGENCY DECEMBER 31. 2012
(Unaudited)
Underwriting Income: Regular Contributions (earned) $ 535,720,335
Supplemental Contributions 862,606 Other Income (except investments) 186,209
Total Income
Incurred Liabilities: Claims:
Paid 194,861,321 Case Reserves IBNR Reserve
Subtotal $ 194,861,321 Less Excess Insurance:
Received 17,272,390 Receivable 945,352 Recoverable Subtotal 18,217,742
Limited Incurred Claims (claims-excess) 176,643,579
Expenses: Excess Insurance Premiums 312,277,428 Administrative 61,537,592
Subtotal Expenses 373,815,020 Total Incurred Liabilities
(limited claims and expenses)
Underwriting Surplus/(Deficitl - 1-2
Investment Income (Earnedl
4a. Transfer
5. Gross Operating Surplus/CDeficitl - 3+4
6. Retum of Surplus:
Paid 44,265,586
Authorized and Unpaid Subtotal Return of Surplus
7. Net Current Sumlusl(Deficit) = 5-6
36
Schedule C
$ 536,769,150
550,458,599
(13,689,449)
55,101,453
41,412,004
44,265,586
$ (2,853,582)
I,
2.
3.
4.
5.
6.
7.
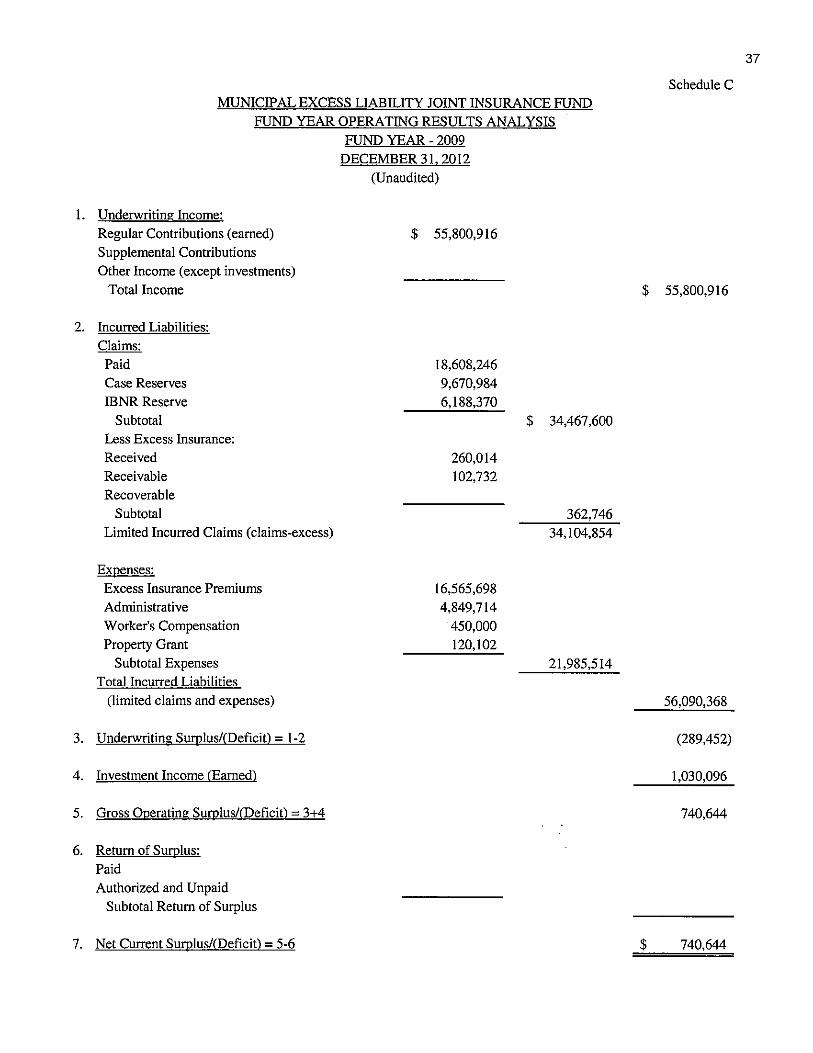
MUNICIPAL EXCESS LIABILITY JOINT INSURANCE FUND FUND YEAR OPERATING RESULTS ANALYSIS
FUND YEAR - 2009
Underwriting Income: Regular Contributions (earned) Supplemental Contributions Other Income (except investments)
Total Income
Incurred Liabilities: Claims: Paid Case Reserves IBNR Reserve
Subtotal Less Excess Insurance: Received Receivable Recoverable
Subtotal Limited Incurred Claims (claims-excess)
Expenses:
Excess Insurance Premiums Administrative Worker's Compensation Property Grant
Subtotal Expenses Total Incurred Liabilities
(limited claims and expenses)
Underwriting Surplus/(Deficit) - 1-2
Investment Income (Earned)
Gross Operating SurpluslCDeficitl - 3+4
Return of Surplus:
Paid Authorized and Unpaid
Subtotal Return of Surplus
Net Current Sumlusl(Deficit) = 5-6
DECEMBER 31, 20\2 (Unaudited)
$ 55,800,916
18,608,246 9,670,984 6,188,370
260,014 102,732
16,565,698 4,849,714
450,000 120,102
$ 34,467,600
362,746 34,104,854
21,985,514
37
Schedule C
$ 55,800,916
56,090,368
(289,452)
1,Q30,096
740,644
$ 740,644

I.
2.
3.
4.
5.
6.
7.
MUNICIPAL EXCESS LIABILITY JOINT INSURANCE FUND FUND YEAR OPERATING RESULTS ANALYSIS
FUND YEAR - 2010
Underwriting Income: Regular Contributions (earned) Supplemental Contributions Other Income (except investments)
Total Income
Incurred Liabilities: Claims:
Paid Case Reserves IBNR Reserve
Subtotal Less Excess Insurance: Received Receivable Recoverable
Subtotal Limited Incurred Claims (claims-excess)
Expenses: Excess Insurance Premiums Administrative Workers' Compensation
Property Grant Subtotal Expenses
Total Incurred Liabilities (limited claims and expenses)
Underwriting Sumlus/<Deficitl - 1-2
Investment Income <Earned)
Gross Operating Sumlus/<Deficitl - 3+4
Return of Sum Ius:
Paid Authorized and Unpaid
Subtotal Return of Surplus
Net Current Sumlus/(Deficitl = 5-6
DECEMBER 31, 2012
(Unaudited)
$ 57,150,605
14,416,039 7,652,010 8,184,926
276,155 378,359
55,001
16,428,516 4,848,474
459,325 118,819
$ 30,252,975
709,515 29,543,460
21,855,134
38
Schedule C
$ 57,150,605
51,398,594
5,752,011
740,437
6,492,448
$ 6,492,448

MUNICIPAL EXCESS LIABILITY JOINT INSURANCE FUND
FUND YEAR OPERATING RESULTS ANALYSIS FUND YEAR - 2011
I. Underwriting Income:
2.
3.
4.
Regular Contributions (earned) Supplemental Contributions Other Income (except investments)
Total Income
Incurred Liabilities: Claims:
Paid Case Reserves IBNR Reserve
Subtotal Less Excess Insurance: Received Receivable Recoverable
Subtotal Limited Incurred Claims (claims-excess)
Expenses: Excess Insurance Premiums Administrative Worker's Compensation Property Grant
Subtotal Expenses Total Incurred Liabilities
(limited claims and expenses)
Underwriting Surolus/CDeficitl - 1-2
Investment Income (Earned)
5. Gross Operating SurolusHDeficit) = 3+4
6. Return of Surolus: Paid Authorized and Unpaid
7. Net Current Surolus/CDeficit) - 5-6
DECEMBER 31. 2012 (Unaudited)
$ 43,750,392
3,276,392 6,604,216 8,989,428
545,732
877,740
15,926,686 4,555,018
459,000
$ 18,870,036
1,423,472 17,446,564
20,940,704
39
Schedule C
$ 43,750,392
38,387,268
5,363,124
246,442
5,609,566
$ 5,609,566

40
Schedule C MUNICIPAL EXCESS LIABILITY JOINT INSURANCE FUND
FUND YEAR OPERATING RESULTS ANALYSIS FUND YEAR - 2012
DECEMBER 31, 2012 (Unaudited)
I. Underwriting Income: Regular Contributions (earned) $ 43,242,670 Supplemental Contributions Other Income (except investments)
Total Income $ 43,242,670
2. Incurred Liabilities: Claims:
Paid 1,496,244 Case Reserves 13,664,275 IBNR Reserve 15,035,487
Subtotal $ 30,196,006 Less Excess Insurance: Received Receivable Recoverable 10,953,464
Subtotal 10,953,464 Limited Incurred Claims (claims-excess) 19,242,542
Expenses: Excess Insurance Premiums 16,051,969 Administrative 4,620,377 Workers Compensation 468,180 Property Grant 29,987
Subtotal Expenses 21,170,513 Total Incurred Liabilities
(limited claims and expenses) 40,413,055
3. Underwriting Surplusf(Deficit) - 1-2 2,829,615
4. Investment Income <Earned) 158,353
4a. Transfer
5. Gross Operating Surplus/(Deficitl = 3+4 2,987,968
6. Return of Surplus:
Paid Authorized and Unpaid
Subtotal Return of Surplus
7. Net Current Surplus/(Deficit) - 5-6 $ 2,987,968

ScheduleD
MUNICIPAL EXCESS LIABILITY JOINT INSURANCE FUND FUND YEAR ACCOUNT OPERATING RESULTS ANALYSIS
FUND YEAR - 2009 DECEMBER 31. 2012
(Unaudited)
Coverages and Other Accounts Public Officials'! Faithful
Worker's Employment Performance General and Property Liability Compensation Practices Bond Contingency Administrative Total
I. Underwriting Income Regular Contributions (earned) $ 8,062,906 $ 13,557,243 $ 16,919,244 $ 11,345,146 $ 238,474 $ 446,751 $ 5,231,152 $ 55,800,916 Supplemental Contributions Other Income (except investments) Total Income 8,062,906 13,557,243 16,919,244 11,345,146 238,474 446,751 5,231,152 55,800,916
2. Incurred Liabilities Claims (limited incurred) 943,217 4,832,435 9,983,921 17,326,643 1,018,638 34,104,854 Expenses 5,294,094 7,635,335 3,388,741 872,566 4,794,778 21,985,514 Total Liabilities 6,237,311 12,467,770 13,372,662 18,199,209 1,018,638 4,794,778 56,090,368
3. Underwriting Surplus!(Deficit) 1,825,595 1,089,473 3,546,582 (6,854,063) (780,164) 446,751 436,374 __ (289,452)
4. Adjustments Investment Income 69,393 205,385 493,450 236,554 6,733 18,581 1,030,096 Transfers Total Adjustments 69,393 205,385 493,450 236,554 6,733 18,581 1,030,096
5. Gross Operating Surplus 1,894,988 1,294,858 4,040,032 (6,617,509) (773,431) 446,751 454,955 740,644
6. Return of Surplus
7. Net Current Surplus $ 1,894,988 $ 1,294,858 $ 4,040,032 $ (6,617,509) $ (773,431) $ 446,751 $ 454,955 $ 740,644
..,. ~

Schedule D MUNICIPAL EXCESS LIABILITY JOINT INSURANCE FUND FUND YEAR ACCOUNT OPERATING RESULTS ANALYSIS
FUND YEAR - 2010 DECEMBER 31, 2012
(Unaudited)
Coverages and Other Accounts Public Officials'! Faithful Loss
Worker's Employment Perfonnance Fund General and Property Liability Compensation Practices Bond Contingency Administrative Total
I. Underwriting Income
Regular Contributions (earned) $ 7,856,196 $ 13,243,899 $ 15,470,894 $ 13,910,910 $ 241,898 $ 1,240,486 $ 5,186,322 $ 57,150,605 Supplemental Contributions Other Income (except investments) Total Income 7,856,196 13,243,899 15,470,894 13,910,910 241,898 1,240,486 5,186,322 ~150,605
2. Incurred Liabilities Claims (limited incurred) 1,564,999 6,849,999 7,212,670 13,590,836 324,956 29,543,460 Expenses 5,477,921 7,438,203 3,250,482 840,054 4,848,474 21,855,134 Total Liabilities 7,042,920 14,288,202 10,463,152 14,430,890 324,956 4,848,474 51,398,594
3. Underwriting SumlusHDeficit) 813,276 (1,044,303) 5,007,742 (519,980) (83,058) 1,240,486 337,848 5,752,011
4. Adjustments Investment Income 26,088 143,943 290,252 258,620 9,089 1,307 11,138 740,437 Transfers Total Adjustments 26,088 143,943 290,252 258,620 9,089 1,307 11,138 740,437
5. Gross Operating Surplus 839,364 (900,360) 5,297,994 (261,360) (73,969) 1,241,793 348,986 6,492,448
6. Return of Surplus
7. Net Current Surplus $ 839,364 $ (900,360) $ 5,297,994 $ (261,360) $ (73,969) $ 1,241,793 $ 348,986 $ 6,492,448
i'J

MUNICIPAL EXCESS LIABILITY
JOINT INSURANCE FUND FUND YEAR ACCOUNT OPERATING RESULTS ANALYSIS
FUND YEAR - 2011 DECEMBER 31, 2012
(Unaudited)
Coverages and Other Accounts Public Officials'/ Faithful
Worker's Employment Perfonnance Property Liability Compensation Practices Bond
I, Underwriting Income Regular Contributions (earned) $ 7,969,794 $ 13,806,768 $ 15,194,253 $ 1,012,025 $ 228,260 Supplemental Contributions Other Income (except investments) Total Income 7,969,794 13,806,768 15,194,253 1,012,025 228,260
2, Incurred Liabilities Claims (limited incurred) 2,527,352 5,711,328 9,000,001 207,883 Expenses 5,329,724 6,946,722 3,246,520 862,830 Total Liabilities 7,857,076 12,658,050 12,246,521 1,070,713
3. Underwriting Surpius/{Deficit) 112,718 1,148,718 2,947,732 (58,688) 228,260
4. Adjustments Investment Income 4,054 75,001 159,722 720 4,496 Transfers Total Adjustments 4,054 75,001 159,722 720 4,496
5. Gross Operating Surplus 116,772 1,223,719 3,107,454 (57,968) 232,756
6. Return of Surplus
7. Net Current Surplus $ 116,772 $ 1,223,719 $ 3,107,454 $ (57,968) $ 232,756
General and Contingency Administrative
$ 445,762 $ 5,093,530
445,762 5,093,530
4,554,908 4,554,908
445,762 538,622
1,084 1,365
1,084 1,365
446,846 539,987
$ 446,846 $ 539,987
ScheduleD
Total
$ 43,750,392
43,750,392
17,446,564 20,940,704 38,387,268
5,363,124
246,442
246,442
5,609,566
$ 5,609,566
'" w

MUNICIPAL EXCESS LIABILITY JOINT INSURANCE FUND
JOINT INSURANCE FUND FUND YEAR ACCOUNT OPERATING RESULTS ANALYSIS
FUND YEAR - 2012 DECEMBER 31, 2012
(Unaudited)
Coverages and Other Accounts Public Officials'/ Faithful
Worker's Employment Performance Property Liability Compensation Practices Bond
I. Underwriting Income Regular Contributions (earned) $ 8,456,401 $ 12,933,587 $ 15,427,982 $ 825,655 $ 217,287 Supplemental Contributions Other Income (except investments) Total Income 8,456,401 12,933,587 15,427,982 825,655 217,287
2. Incurred Liabilities Claims (limited incurred) 3,586,000 6,656,543 8,999,999 Expenses 5,910,306 6,763,117 3,056,273 820,440 Total Liabilities 9,496,306 13,419,660 12,056,272 820,440
3. Underwriting Surplus/rDeficit) (1,039,905) (486,073) 3,371,710 5,215 217,287
4. Adjustments Investment Income 4,166 30,110 112,466 1,345 1,341 Transfers Total Adjustments 4,166 30,110 112,466 1,345 1,341
5. Gross Operating Surplus (1,035,739) (455,963) 3,484,176 6,560 218,628
6. Return of Surplus
7. Net Current Surplus $ (1,035,739) $ (455,963) $ 3,484,176 $ 6,560 $ 218,628
General and Contingency Administrative
$ 340,487 $ 5,041,271
340,487 5,041,271
4,620,377 4,620,377
340,487 420,894
(152) 9,077
(152) 9,077
340,335 429,971
$ 340,335 $ 429,971
ScheduleD
Total
$ 43,242,670
$
43,242,670
19,242,542 21,170,513 40,413,055
2,829,615
158,353
158,353
2,987,968
2,987,968
... ...

45
Schedule E MUNICIPAL EXCESS LIABILITY JOINT INSURANCE FUND
FUND YEAR CLAIMS ANALYSIS FUND YEAR - 2009
DECEMBER 31, 2012 (Unaudited)
Coverages Public Officials'
Worker's Faithful Employment Property Liability Compensation Performance Practice Total
Paid Claims $ 1,087,325 $ 1,272,417 $ 2,596,594 $ 685,538 $ 12,966,372 $ 18,608,246
Case Reserves 871,927 5,353,001 333,100 3,1l2,956 9,670,984
IBNR Reserve 2,688,091 2,034,326 1,465,953 6,188,370
Subtotal 1,087,325 4,832,435 9,983,921 1,018,638 17,545,281 34,467,600
Excess Insurance
Received 144,108 115,906 260,014
Receivable 102,732 102,732
Recoverable
Subtotal 144,108 218,638 362,746
Incurred Claims 943,217 4,832,435 9,983,921 1,018,638 17,326,643 $ 34,104,854
Number of Claims 27 355 226 2 441
CostiClaim $ 34,934 $ 13,612 $ 44,177 $ 509,319 $ 39,289

46
ScheduleE MUNICIPAL EXCESS LIABILITY JOINT INSURANCE FUND
FUND YEAR CLAIMS ANALYSIS FUND YEAR - 2010
DECEMBER 31,2012 (Unaudited)
Coverages Public Officials'
Worker's Faithful Employment Property Liability Compensation Performance Practice Total
Paid Claims $ 2,007,366 $ 2,334,308 $ 1,634,561 $ 304,956 $ 8,134,848 $ 14,416,039
Case Reserves 63,622 1,157,601 2,695,978 20,000 3,714,809 7,652,010
ffiNRReserve (13,794) 3,358,090 2,887,694 1,952,936 8,184,926
Subtotal 2,057,194 6,849,999 7,218,233 324,956 13,802,593 30,252,975
Excess Insurance
Received 150,000 5,563 120,592 276,155
Receivable 287,194 91,165 378,359
Recoverable 55,001 55,001
Subtotal 492,195 5,563 211,757 709,515
Incurred Claims 1,564,999 6,849,999 7,212,670 324,956 13,590,836 $ 29,543,460
Number of Claims 39 341 167 3 459
Cost/Claim $ 40,128 $ 20,088 $ 43,190 $ 108,319 $ 29,610

47
ScheduleE MUNICIPAL EXCESS LIABILITY
JOINT INSURANCE FUND FUND YEAR CLAIMS ANALYSIS
FUND YEAR - 2011 DECEMBER 31, 2012
(Unaudited)
Coverages Public Officials'
Worker's Faithful Employment Property Liability Compensation Performance Practice Total
Paid Claims $ 2,966,687 $ 182,499 $ 127,206 $ 3,276,392
Case Reserves 996,045 $ 700,000 4,884,510 23,661 6,604,216
IBNR Reserve (11,908) 5,011,328 3,932,992 57,016 8,989,428
Subtotal 3,950,824 5,711,328 9,000,001 207,883 18,870,036
Excess Insurance
Received 545,732 545,732
Receivable
Recoverable 877,740 877,740
Subtotal 1,423,472 1,423,472
Incurred Claims 2,527,352 5,711,328 9,000,001 207,883 $ 17,446,564
Number of Claims 90 249 146 5
Cost/Claim $ 28,082 $ 22,937 $ 61,644 $ -0- $ 41,577

48 ScheduleE
MUNICIPAL EXCESS LIABILITY JOINT INSURANCE FUND FUND YEAR CLAIMS ANALYSIS
FUND YEAR - 2012 DECEMBER 31, 2012
(Unaudited)
Covera~es
Public Officials' Worker's Faithful Employment
Property Liability Compensation Performance Practice Total
Paid Claims $ 1,368,517 $ 127,727 $ 1,496,244
Case Reserves 13,043,774 $ 300,000 320,501 13,664,275
IBNR Reserve 77,173 6,406,543 8,551,771 15,035,487
Subtotal 14,489,464 6,706,543 8,999,999 30,196,006
Excess Insurance
Received
Receivable
Recoverable 10,903,464 50,000 10,953,464
Subtotal 10,903,464 50,000 10,953,464
Incurred Claims 3,586,000 6,656,543 8,999,999 $ 19,242,542
Number of Claims 207 168 62
Cost/Claim $ 17,324 $ 39,622 $ 145,161 $ -0- $ -0-

1.
2.
3.
4.
MUNICIPAL EXCESS LIABILITY JOINT INSURANCE FUND FUND YEAR EXPENSE ANALYSIS
FUND YEAR - 2009 DECEMBER 31. 2012
(Unaudited)
Paid Unpaid Excess Insurance (itemize)
Insurance Premiums:
Property $ 5,173,992 Liability 7,635,335 Worker's Compensation 2,938,741
Public Officials Liability 817,630
Legal Expense: Public Officials Liability 50,193 $ 4,743
Subtotal Excess 16,615,891 4,743
Administrative Expenses
Claims Administration 1,058,104
Safety and Education 1,354,604
Administration 881,786
Actuary 42,773
Attorney 40,273
Auditor 25,250 Treasurer 21,475
Public Relations 63,141
Other Consultants 30,380
Reinsurance Manager 260,728 Internal Audit 38,133 Brokerage Expense 451,508
Non-Contracted Expenses 97,015 Risk Management Consultant 429,608
Subtotal Administrative 4,794,778
Worker's Compensation
Managed Care 450,000 Subtotal Worker's Compensation 450,000
Property
Property Grant 120,102
Subtotal Property 120,102
Total Expenses = 1 +2+3+4 $ 21,980,771 $ 4,743
49
Schedule F
Total
$ 5,173,992 7,635,335 2,938,741
817,630
54,936
16,620,634
1,058,104 1,354,604
881,786 42,773 40,273 25,250 21,475 63,141 30,380
260,728 38,133
451,508 97,015
429,608
4,794,778
450,000
450,000
120,102
120,102
$ 21,985,514

50
Schedule F MUNICIPAL EXCESS LIABILITY JOINT INSURA!::lCE FUND
FUND YEAR EXPENSE ANALYSIS FUND YEAR - 2010
DECEMBER 31, 2012 (Unaudited)
Paid Unpaid Total 1. Excess Insurance (itemize)
Insurance Premiums: Property $ 5,359,102 $ 5,359,102 Liability 7,438,203 7,438,203 Worker's Compensation 2,791,157 2,791,157 Public Officials'lEmployment Practice 820,839 820,839
Legal Expense: Public Officials'lEmployment Practice (5,217) $ 24,432 19,215
Subtotal Excess 16,404,084 24,432 16,428,516
2. Administrative Expenses
Claims Administration 1,072,265 1,072,265 Safety and Education 1,346,472 1,346,472 Administration 899,276 899,276 Actuary 43,628 43,628 Attorney 40,378 40,378 Auditor 26,128 26,128 Treasurer 21,904 21,904 Public Relations 55,034 55,034 Other Consultants 46,074 46,074 Reinsurance Manager 265,943 265,943 Internal Audit 40,583 40,583 Brokerage Expense 460,538 460,538 Non-Contracted Expenses 100,082 100,082 Risk Management Consultant 430,169 430,169
Subtotal Administrative 4,848,474 4,848,474
3. Worker's Compensation
Managed Care 459,000 459,000 Non-Contracted Expenses 325 325
Subtotal Worker's Compensation 459,325 459,325
4. Property Grant 118,819 118,819 Subtotal Property Grant 118,819 118,819
Total Expenses = 1+2+3+4 $ 21,830,702 $ 24,432 $ 21,855,134

51
Schedule F MUNICIPAL EXCESS LIABILITY
JOINT INSURANCE FUND FUND YEAR EXPENSE ANALYSIS
FUND YEAR - 2011 DECEMBER 31. 2012
(Unaudited)
Paid Unpaid Total I. Excess Insurance (itemize)
Insurance Premiums: Property $ 5,329,724 $ 5,329,724 Liability 6,946,722 6,946,722 Worker's Compensation 2,787,520 2,787,520 Public Officials'lEmployment Practice 862,720 862,720
Legal Expense: Public Officials'lEmployment Practice 110 110
Subtotal Excess 15,926,796 15,926,796
2. Administrative Expenses
Claims Administration 1,066,047 1,066,047 Safety and Education 1,165,182 1,165,182 Administration 899,573 899,573 Actuary 43,628 43,628 Attorney 39,982 39,982 Auditor 26,128 26,128 Treasurer 21,904 21,904 Public Relations 69,189 69,189 Reinsurance Manager 265,943 265,943 Other Consultants 42,827 42,827 Internal Audit 42,191 42,191 Brokerage Expense 460,538 460,538 Non-Contracted Expenses 70,463 $ 312 70,775 Risk Management Consultant 341,001 341,001
Subtotal Administrative 4,554,596 312 4,554,908
3. Worker's Compensation
Managed Care 459,000 459,000
Subtotal Worker's Compensation 459,000 459,000
Total Expenses = 1+2+3 $ 20,940,392 $ 312 $ 20,940,704

52
Schedule F MUNICIPAL EXCESS LIABILITY JOINT INSURANCE FUND
FUND YEAR EXPENSE ANALYSIS FUND YEAR - 2012
DECEMBER 31, 2012 (Unaudited)
Paid Unpaid Total I. Excess Insurance (itemize)
Insurance Premiums: Property $ 5,880,319 $ 5,880,319 Liability 6,763,117 6,763,117 Worker's Compensation 2,588,093 2,588,093 Public Officials Liability 820,440 820,440
Subtotal Excess 16,051,969 16,051,969
2. Administrative Expenses
Claims Administration 1,062,806 $ 30,912 1,093,718 Safety and Education 1,180,840 1,180,840 Administration 918,536 918,536 Actuary 44,501 44,501 Attorney 40,782 40,782 Auditor 25,630 25,630 Treasurer 22,342 22,342 Public Relations 44,156 44,156 Other Consultants 11,708 23,310 35,018 Internal Audit 53,451 53,451 Reinsurance Manager 271,262 271,262 Brokerage Expense 469,749 469,749 Non-Contracted Expenses 72,340 2,623 74,963 Risk Management Consultant 345,429 345,429
Subtotal Administrative 4,537,902 82,475 4,620,377
3. Worker's Compensation
Managed Care 468,180 468,180
Subtotal Workers's Compensation 468,180 468,180
4. Property
Property Grant 29,987 29,987
Subtotal Property 29,987 29,987
Total Expenses = 1+2+3+4 $ 21,088,038 $ 82,475 $ 21,170,513

1. Limits
2. Fund Retemioll Specific
3. Excess Insurers (list all insurers and amount insured)
4. Number of Participants
5. Incurred Liabilities
6. Exposure Units (population or students) (A)
7. LiabilitieslUnit
Liability
$5,000,000 CSL for general liability, automotive liability, and police professional. $5,000,000 combined annual aggregate for general liability and police professional per municipality. Automotive liability is unaggregated. An optional $2,000,000, $5,000,000, $10,000,000 or $15,000,000 per occurrence and $2,000,000, $5,000,000, $10,000,000 or $15,000,000 aggregate is also available.
The difference between the underlying limits from $100,000 to $500,000 per occurrence and $1,500,000.
General Reinsurance $3,500,000 x of $1,250,000. Munich Re optionallimils up to $15,000,000 excess of$5,ooO,OOO
19
$13,419,660
4,874,582 Popnlation
$2.70
MUNICIPAL EXCESS LIABILITY JOINT INSURANCE FUND PROGRAM SUMMARY
FUND YEAR - 2012 DECEMBER 31 2012
COVERAGES
Worker's Compensation
Cov. A - Statutory Cov. B - $5,000,000
$1,250,000 excess of JIF $250,000 (local retention may vary)
Safety Mutual provides statutory as above over a $2,000,000 self insured retention and $5,000,000 for employers liability.
19
$12,056,272
$2,801,787,698 Payroll
$0.01
Property
$100 million per occurrence
$250,000 excess of JIF $50,000
Zurich Insurance
19
$9,496,306
11,335,937,691 Property Value
$0.01
Crime
1,000,000.00 per loss
Statutory Positions Covered By Endorsement, subject to application & approval process
$950,000 excess of JIF Self insured retention of $50,000 JIF SIR does not provide coverage for statutory positions
None
19
$0
35,825 Full time Employees
Schedule G
Public Officials" Employment Practices
optional limits of$I,DOO,DOO $2,000,000, $3,000,000, $4,000,000 or $8,000,000 are available excess of XL Insurance Policies issued to members by the affliated local Joint Insurance Fund
None
General Reinsurance
18
$820,440
4,494,960 Population
$4.05
Ul
'"

MUNICIPAL EXCESS LIABILITY JOINT INSURANCE FUND
STATE REOUIRED SUPPORTING
SCHEDULE - ANNUAL REPORT
ANALYSIS OF CASH AND INVESTMENTS
DECEMBER 31. 2012
(Unaudited)
Bank
Account or
Investment Number
TDBank
TDBank
TDBank TDBank
TDBank
TDBank
TDBank
Federal Home Loan Banks
FHLMC
FNMANotes
New Jersey Cash Management Fund
Less: Outstanding Checks
3450014161
3450015281
3450014188 3450014145
3450014218
3450014153
3450014196
171 000068306
ANALYSIS OF EXCESS INSURANCE RECEIVABLE
DECEMBER 31. 2012
(Unaudited)
Amount Due From Reinsurance Company:
Fund Year - MEL - Aggregate Excess Loss Fund Contingency
Fund Year 2010
Amount Due From Underlying Joint Insurance Funds:
Fund Year - MEL - Aggregate Excess Loss Fund Contingency
Fund Year 2009
Fund Year 2010
$
$
$
$
Amount
367,411
3,932,121
161,278 26,775
119,566
11,108,873
5,071,435
20,010,400
7,021,770
30,288,680
1,067,291
79,175,600
5,741,292
73,434,308
398,127
287,194
547,225
102,732
91,165
1,426,443
54

Fund Year 2012
MUNICIPAL EXCESS LIABILITY JOINT INSURANCE FUND
STATE REOUIRED SUPPORTING
SCHEDULE - ANNUAL REPORT
ANALYSIS OF ASSESSMENTS RECEIVABLE
DECEMBER 31. 2012
(Unaudited)
ANALYSIS OF OTHER RECEIVABLES
DECEMBER 31. 2012
(Unaudited)
Accrued Interest Receivable
Notes Receivable Borough of Fair Lawn
Notes Receivable Township of Bloomfield
Notes Receivable Township of Fairfield
Notes Receivable Township of Robbinsville
Due from Municipal Excess Liability Residual Claims Fund
$
$
$
2,065,710
121,766
275,000
55,000
712,500
168,000
906,296
2,238,562
55

MUNICIPAL EXCESS LIABILITY JOINT INSURANCE FUND
STATE REOUIRED SUPPORTING
SCHEDULE - ANNUAL REPORT
ANALYSIS OF PREPAID EXPENSES
DECEMBER 31. 2012
(Unaudited)
Prepaid Safety Services
Fund Year 2009:
ANALYSIS OF EXCESS INSURANCE EXPENSES PAYABLE
DECEMBER 31. 2012
(Unaudited)
Public Officials'lEmployment Practices Legal Expense
Fund Year 2010:
Public Officials'lEmployment Practices Legal Expense
56
$ 92,217
$ 4,744
24,433
$ 29,177

MUNICIPAL EXCESS LIABILITY JOINT INSURANCE FUND
STATE REOUIRED SUPPORTING
SCHEDULE - ANNUAL REPORT
ANALYSIS OF ADMINISTRATIVE EXPENSES PAYABLE
DECEMBER 31. 2012
Fund Year 2011:
Non-Contracted Expenses
Fund Year 2012:
Claims Administration
External Auditor
Other Consultants
Non-Contracted Expenses
(Unaudited)
$
ANALYSIS OF MISCELLANEOUS LIABILITIES
DECEMBER 31. 2012
(Unaudited)
Claim Recoverable - Due to Underlying Joint Insurance Funds
Aggregate Excess Loss Fund Contingency
Fund Year 2011
Due to Reinsurance - Advance
Fund Year 2011
Fund Year 2012
Due to Atlantic Joint Insurance Fund
30,912
25,630
23,310
2,623
57
$ 312
82,475
$ 82,787
$ 500,899
313,045
813,944
75,865
1,174,434
498
$ 2,064,741

58
REPORT PURSUANT TO GOVERNMENT AUDITING STANDARDS

59
ON I S I VOL L I A UP Certified Public Accountants & Advisors
Mount Arlington Corporate Center 200 Valley Road, Suite 300
Mt. Arlington, NJ 07856 973-328-18251973-328-0507 Fax
lawrence Business Center 11 Lawrence Road Newton, NJ 07860
973-383-6699 I 973-383-6555 Fax
Report on Internal Control Over Financial Reporting and on Compliance and Other Matters Based on an Audit of Financial Statements Performed in Accordance with Government Auditing Standards
Independent Auditors' Report
The Honorable Chairperson and Members of the Board of Fund Commissioners
Municipal Excess Liability Joint Insurance Fund Parsippany, New Jersey
We have audited, in accordance with the auditing standards generally accepted in the United States of America, audit requirements prescribed by the Division of Local Government Services, Department of Community Affairs, State of New Jersey, and the standards applicable to financial audits contained in Government Auditing Standards issued by the Comptroller General of the United States, the financial statements of the Municipal Excess Liability Joint Insurance Fund (the "Fund") as of and for the years ended December 31,2012 and 2011, and the related notes to the financial statements, which collectively comprise the Fund's basic financial statements, and have issued our report thereon dated April 15, 2013.
Internal Control Over Financial Reporting
In planning and performing our audit of the financial statements, we considered the Fund's internal control over financial reporting to determine the audit procedures that are appropriate in the circumstances for the purpose of expressing our opinions on the financial statements, but not for the purpose of expressing an opinion on the effectiveness of the Fund's internal control. Accordingly, we do not express an opinion on the effectiveness of the Fund's internal control.
A deficiency in internal control exists when the design or operation of a control does not allow management or employees, in the normal course of performing their assigned functions, to prevent, or detect and correct, misstatements on a timely basis. A material weakness is a deficiency, or a combination of deficiencies, in internal control, such that there is a reasonable possibility that a material misstatement of the Fund's financial statements will not be prevented, or detected and corrected on a timely basis. A significant deficiency is a deficiency, or a combination of deficiencies, in internal control that is less severe than a material weakness, yet important enough to merit attention by those charged with governance.
Our consideration of internal control was for the limited purpose described in the first paragraph of this section and was not designed to identify all deficiencies in internal control that might be material weaknesses or significant deficiencies. Given these limitations, during our audit we did not identify any deficiencies in internal control that we consider to be material weaknesses. However, material weaknesses may exist that have not been identified.
www.nisivoccia.com Independent Member of BKR International

The Honorable Chairperson and Members of the Board of Fund Commissioners
Municipal Excess Liability Joint Insurance Fund Page 2
Compliance and Other Matters
As part of obtaining reasonable assurance about whether the Fund's financial statements are free from material misstatement, we performed tests of its compliance with certain provisions of laws, regulations, contracts, and grant agreements, noncompliance with which could have a direct and material effect on the determination of financial statement amounts. However, providing an opinion on compliance with those provisions was not an objective of our audit, and accordingly, we do not express such an opinion. The results of our tests disclosed no instances of noncompliance or other matters that are required to be reported under Government Auditing Standards. However, we noted certain matters that we reported to management in the Auditors' Management Report on Administrative Findings - Financial Compliance and Performance dated April 15, 2013.
Purpose of this Report
The purpose of this report is solely to describe the scope of our testing of internal control and compliance and the results of that testing, and not to provide an opinion on the effectiveness of the entity's internal control or on compliance. This report is an integral part of an audit performed in accordance with Government Auditing Standards in considering the entity's internal control and compliance. Accordingly, this communication is not suitable for any other purpose.
Mount Arlington, New Jersey April 15, 2013 NISIVOCCIA LLP
60

STATISTICAL SECTION
This part of the Fund's comprehensive annual financial report presents detailed information as
a context for understanding what the information in the financial satements, note disclosures and required
supplementary information says about the Fund's overall financial health.
Contents
Financial Trends These schedules contain trend information to help the reader understand how the Fund's
financial performance and well-being have changed over time.
Revenue Capacity (Not Applicable)
These schedules contain information to help the reader assess the factors affecting the Fund's
ability to generate its revenue.
Debt Capacity (Not Applicable) These schedules present information to help the reader assess the affordability of the Fund's
current levels of outstanding debt and the Fund's ability to issue additional debt in the future.
Demographic aud Economic Information
These schedules offer demographic and economic indicators to help the reader understand the
environment within which the Fund's financial activities take place and to help make
comparisons over time and with other governments.
Operating Information These schedules contain information about the Fund's operations and resources to help the
reader understand how the Fund's financial information relates to the services the Fund
provides and the activities it performs.
61

2005 Business-Type Activities
Unrestricted $ 21,184,176
Total Business-Type Activities Net Position $ 21,184,176
MUNICIPAL EXCESS LIABILITY JOINT INSURANCE FUND NET POSITION BY COMPONENT
LAST EIGHT YEARS (Unaudited)
Year Ending December 31, 2006 2007 2008 2009
$ 20,947,473 $ 27,102,482 $ 26,141,202 $ 20,081,834
$ 20,947,473 $ 27,102,482 $ 26,141,202 $ 20,081,834
This schedule does not contain ten years of information as GASB #44 was implemented during the year ended December 31, 2006.
Source - Insurance Fund Financial Records.
2010
$ 18,712,493
$ 18,712,493
2011 2012
$ 21,651,941 $ 20,876,056
$ 21,651,941 $ 20,876,056
0) tv

MUNICIPAL EXCESS LIABILITY JOINT INSURANCE FUND
SCHEDULE OF CHANGE IN NET POSITION
LAST EIGHT YEARS
(Unaudited)
2005 2006 2007 2008 Revenue:
Assessments from Participating Members $ 43,480,700 $ 46,843,768 $ 50,636,167 $ 54,654,528 Investment Income 1,335,575 2,456,986 3,478,002 2,691,069 Change in Investment in Joint Venture (752,762) (105,194) (285,481) (346,431)
Total Revenue 44,063,513 49,195,560 53,828,688 56,999,166
Expenses: Provision for Claims and Claim Adjustment Expense 14,934,616 18,520,714 17,923,804 27,716,260 Assessment for Participation in Municipal Excess
Liability Residual Claims Fund 7,424,620 7,967,278 8,521,017 9,413,237 Insurance Premiums 15,787,254 18,719,237 16,345,493 15,781,178 Claims Administration 692,242 922,659 931,440 1,025,146 Other Contractual Services 1,046,309 1,552,441 1,765,584 2,143,771 Non-Contractual Expenses 126,927 128,555 401,149 179,726 Administration 796,784 816,701 837,282 858,049 Insurance BrOkerage Expense 441,006 463,281 578,707 439,424 Risk Management Fees 323,794 341,397 369,203 403,655
Total Expenses 41,573,552 49,432,263 47,673,679 57,960,446
Change in Net Position $ 2,489,961 $ (236,703) $ 6,155,009 $ (961,280)
This schedule does not contain ten years of information as GASB #44 was implemented during the year ended December 31, 2006.
Source - Insurance Fund Financial Records.
2009 2010
$ 55,811,911 $ 57,156,175
1,202,163 655,152
(493,063) (59,956)
56,521,011 57,751,371
29,331,266 27,208,859
11,233,172 9,933,817
16,521,667 16,599,145 1,051,947 1,066,103 2,600,113 2,421,972
79,312 100,833
881,786 899,276
451,508 460,538
429,608 430,169
62,580,379 59,120,712
$ (6,059,368) $ (1,369,341)
2011
$ 43,756,127
1,692,466 (223,077)
45,225,516
9,291,311
11,824,698
16,140,890
1,075,156 2,176,048
75,844
901,582
460,538 340,001
42,286,068
$ 2,939,448
2012
$ 43,245,446
$
618,953
(183,932)
43,680,467
6,999,622
16,384,865
15,709,983
1,093,718
2,445,527
87,923
918,536
469,749
346,429
44,456,352
(775,885)
0) w

2003 2004 2005
Total number of members 17 18 18
Total employees 32,113 33,869 36,205
Total annual payrolls $ 1,841,809,795 $ 1,967,622,175 $ 2,197,930,081
Total member assessments $ 34,575,836 $ 40,266,616 $ 4,348,945,660
Total number of claims 793 949 849
Total reported losses $ 18,342,572 $ 19,099,577 $ 21,044,435
Note - Reported losses have not been discounted.
MUNICIPAL EXCESS LIABILITY JOINT INSURANCE FUND
MEMBER GROWTH ANALYSIS - BY FUND YEAR
FOR THE TEN-YEAR PERIOD ENDED DECEMBER 31. 2012
(Unaudited)
2006 2007 2008
18 18 18
38,005 39,552 38,236
$ 2,197,930,081 $ 2,461,081,424 $ 2,655,980,661
$ 46,811,585 $ 50,629,314 $ 54,672,772
1,089 1,050 999
$ 22,507,374 $ 30,367,257 $ 26,200,606
Source - Joint Insurance Fund - Executive Director's Office and Third Party Claims Administrator
2009 2010
19 19
39,164 39,942
$ 2,757,613,822 $ 2,840,076,088 $
$ 55,800,916 $ 57,150,605 $
1,051 1,009
$ 27,916,484 $ 21,358,534 $
2011
19
37,425
2,927,920,398
43,750,392
491
8,457,136
2012
19
35,826
$ 2,801,787,698
$
$
43,242,670
437
4,207,055
0> .."

MUNICIPAL EXCESS LIABILITY JOINT INSURANCE FUND
REPORTED LOSS HISTORY - BY FUND YEAR FOR THE TEN-YEAR PERIOD ENDED DECEMBER 31. 2012
(Unaudited)
During its years of existence, the Fund has incurred the following reported losses (paid claims plus case reserves from claims incurred by Fund members). The claims reflect both the impact of increase in membership, the delay in claims reaching the Fund's coverages, and the changes in the average cost per claim. These amounts do not include incurred but DOt reported ("IBNR") claim estimates.
2003 2004 2005 2006 2007
Property $ 1,658,875 $ 776,757 $ 851,382 $ 1,052,463 $ 1,694,448
Liability 2,561,818 3,060,193 6,628,118 6,870,920 3,714,117
Workers' Compensation 6,643,386 6,986,089 5,816,955 6,731,940 10,937,509
Faithful Perfonnance Bond 193,334 117,068 217,855
Public Officials' Liability 7,285,159 8,276,538 7,747,980 7,734,983 -.!.1803,328
Total $ 18,342,572 $19,099,577 $ 21,044,435 $ 22,507,374 $ 30,367,257
Total number of claims 793 949 849 1,089 1,050
Average cost per claim $ 23,131 $ 20,126 $ 24,787 $ 20,668 $ 28,921
Note ~ Reported losses have not been discounted.
Source - Joint Insurance Fund- Third Party Claims Administrator
2008 2009 2010
$ 1,374,085 $ 943,217 $ 1,578,793
5,592,201 2,144,344 3,491,909
12,278,147 7,949,595 4,324,976
1,100,000 1,018,638 324,956
11,548,237 15,860,690 11,637,900
$ 31,892,670 $ 27,916,484 $ 21,358,534
999 1,051 1,009
$ 31,925 $ 26,562 $ 21,168
2011
$ 2,539,260 $
700,000
5,067,009
150,867
$ 8,457,136 $
491
$ 17,224 $
2012
3,508,827
250,000
448,228
4,207,055
437
9,627
Q) ()1

2003
Property 34
Liability 235
Workers' Compensation 172
Faithful Performance Bond 1
Public Officials' Liability 351
Total 793
Claims settled in full 793
Claims pending
Total 793
MUNICIPAL EXCESS LIABILITY JOINT INSURANCE FUND REPORTED CLAIM ACTIVITY - BY FUND YEAR
FOR THE TEN-YEAR PERIOD ENDED DECEMBER 31, 2012 (Unaudited)
2004 2005 2006 2007 2008
37 34 31 107 38
256 246 386 275 293
218 157 177 230 195
1 3 1
438 412 494 435 472
949 849 1,089 1,050 999
949 707 952 840 820
142 137 210 179
949 849 1,089 1,050 999
Source - Joint Insurance Fund - Third Party Claims Administrator
2009 2010
27 39
355 341
226 167
2 3
441 459
1,051 1,009
871 776
180 233
1,051 1,009
2011
90
249
146
1
5
491
293
198
491
2012
207
168
62
437
94
343
437
(J) (J)