Embed Size (px)
Citation preview

MUNICIPAL EMPLOYEES' RETIREMENT SYSTEM OF MICHIGAN APPENDIX TO THE ANNUAL ACTUARIAL VALUATION REPORT DECEMBER 31, 2016
Summary of Plan Provisions, Actuarial Assumptions and Actuarial Funding Method as of December 31, 2016

CBIZ Retirement Plan Services / Powerscourt Building, Suite 405, 17199 Laurel Park North, Livonia, MI 48152 / http://retirement.cbiz.com
Page 2 of 31
Introduction
An actuarial valuation is the mathematical process that estimates plan liabilities and employer contribution requirements for
purposes of funding the individual employer plans within MERS. This process is repeated annually to update the liabilities
and contribution requirements for changes in member census and plan features, and to reflect actual plan experience in
the process. The valuation reflects the present provisions of the MERS Plan Document (as revised). The specific benefit
provisions in effect for each municipality are listed in Table 2 in the municipality’s actuarial report.
In addition to using current membership and financial data, an actuarial valuation requires the use of a series of
assumptions regarding uncertain future events. The assumptions and methods used in the December 31, 2016 Actuarial
Valuation are those adopted by the Retirement Board. The most recent study of plan experience covered the period from
December 31, 2008 through December 31, 2013 and was completed in 2015. The December 31, 2016 Assumptions are
based on the results of this experience study. Generally, an experience study is performed every 5 years.
There have been no changes in the funding method, adopted by the Retirement Board beginning with the December 31,
1993 valuations. The basic funding method is entry age normal and employer contribution amounts are developed as a
level percentage of projected payroll for employee divisions that are open to new employees.
The actuarial valuation computations were made by or under the supervision of a Member of the American Academy of
Actuaries (MAAA).
Details on MERS plan provisions, actuarial assumptions, and actuarial methodology follow this section.

CBIZ Retirement Plan Services / Powerscourt Building, Suite 405, 17199 Laurel Park North, Livonia, MI 48152 / http://retirement.cbiz.com
Page 3 of 31
Summary of Plan Provisions — Defined Benefit Plan1
The benefits summarized in this section are intended only as general information regarding the Municipal Employees’
Retirement System of Michigan. They are not a substitute for PA 220 of 1996, and the MERS Plan Document (as revised).
If any conflict occurs between the information in this summary and PA 220 of 1996or the MERS Plan Document (as
revised), the provisions of PA 220 and the MERS Plan Document govern.
Eligibility for Retirement
MERS members are eligible to retire at:
Age T, where T is between ages 60 and 70, with enough credited service to be vested (see below).
Age T minus 5, with 15 or more years of credited service.
Age T minus 10, with 25 or more years of credited service.
The retirement allowance is reduced for each complete month that the retirement date precedes T, up to a maximum
reduction of 60%. The monthly reduction factors for various ages T are shown in the following table:
Monthly Early Retirement Reduction Factor by Age T
60 61 62 63 64 65 66 67 68 69 70
0.50% 0.65% 0.66% 0.67% 0.68% 0.69% 0.70% 0.71% 0.72% 0.73% 0.74%
The reduction may be partially or fully waived by adopting the early retirement provisions outlined below.
Optional Retirement Programs (Unreduced Benefits)
FA(R), where A is an age from 50 to 54, and R is between 25 and 30 years of credited service.
FA(R), where A is an age from 55 to 65, and R is between 15 and 30 years of credited service.
FA(R), where A is any age, and R is 20, 21, 22, 23, 24, 25, 26, 27, 28, 29 or 30 years of credited service.
S Points, where S is between 70 and 90, and S is the sum of the member or former member’s attained age and
years of credited service.
Mandatory Retirement
None.
Deferred Retirement (Vesting) Retirement can be deferred if membership is terminated before age T other than by retirement or death, after becoming
vested (10 years of credited service is required for vesting; adopting 5, 6, 7, 8 or 9 year vesting is optional). The retirement
allowance begins when the application is filed with MERS and eligibility requirements for retirement are met. The deferred
retirement allowance is computed in the same manner as a service retirement allowance, based on the benefit program in
effect as of the date of termination of membership.
1 Please see the description of the Hybrid Plan beginning on page 9.

CBIZ Retirement Plan Services / Powerscourt Building, Suite 405, 17199 Laurel Park North, Livonia, MI 48152 / http://retirement.cbiz.com
Page 4 of 31
Rights to an allowance are forfeited if the member’s accumulated contributions are refunded after termination of
employment.
Final Average Compensation (FAC)
MERS Plan benefits are based on a member's FAC, subject to the dollar compensation limits under Section 401(a)(17) of
the Internal Revenue Code, as applicable. For this purpose, FAC means one-fifth of the aggregate amount of
compensation paid to a member and earned during the period of 5 consecutive years of the member’s credited service in
which the aggregate compensation paid is highest. The employer may optionally adopt an FAC averaged over 3 or more
years, instead of 5 years.
Service Retirement Allowance Credited service at time of termination of membership is multiplied by one of the following options:
1.00% of FAC to 2.50% of FAC, in increments of 0.05% of FAC, the “lifetime multiplier” as adopted by the
employer, with a maximum benefit of 80% of FAC.
Supplemental Multiplier (in addition to the above lifetime multiplier): 0.05% of FAC to 1.50% of FAC, in
increments of 0.05% of FAC, as adopted by the employer and payable only until attainment of the age at which
unreduced Social Security benefits are available (currently age 66 for normal retirement, gradually increasing to
age 67). When this age is reached, the benefit reverts to the above lifetime multiplier. The combined lifetime and
supplemental multipliers may not exceed 2.5%, and the combined benefit may not exceed 80% of FAC.
Bridged Benefit: For service prior to the Bridged Benefit date, one of the Benefit Program multiplier percentages
of FAC (FAC may be frozen at the Bridged Benefit Date, or may be calculated at termination of membership). For
service after the Bridged Benefit date, one of the Benefit Program multiplier percentages of FAC (at termination of
membership). The combined benefit may not exceed the larger of:
(i) the above benefit based on service prior to the Bridged Benefit date; and
(ii) 80% of FAC at termination of employment.
Frozen Benefit: For service prior to the Frozen Benefit Date, one of the Benefit Program Multiplier Percentages
applies.
The following legacy benefit formula options were previously included in the MERS Plan Document:
1.0% of FAC (no 80% of FAC maximum).
1.3% of FAC (no 80% of FAC maximum).
Sum of 1.0% times the first $4,200 of FAC, plus 1.5% times the portion of FAC over $4,200. No 80% of FAC
maximum. May not be adopted after January 2, 1986.
1.5% of FAC (no 80% of FAC maximum).
Sum of 1.2% times the first $4,200 of FAC, plus 1.7% times the portion of FAC over $4,200. No 80% of FAC
maximum. May not be adopted after January 2, 1986.
1.7% of FAC (no 80% of FAC maximum).
2.0% of FAC, payable until attainment of the age at which unreduced Social Security benefits are available
(currently age 66 for normal retirement, gradually increasing to age 67). When this age is reached, the benefit
reverts to between 1.0% of FAC and 1.7% of FAC adopted by the employer. No 80% of FAC maximum. May not
be adopted after January 2, 1986.
2.0% of FAC (no 80% of FAC maximum).

CBIZ Retirement Plan Services / Powerscourt Building, Suite 405, 17199 Laurel Park North, Livonia, MI 48152 / http://retirement.cbiz.com
Page 5 of 31
Maximum Benefit Payable by MERS The maximum benefit that may be paid by MERS is governed by Section 415 of the Internal Revenue Code. Benefits in
excess of the maximum benefit will be paid by the MERS Excess Benefit Plan.
Act 88 (Reciprocal Retirement Act, 1961 P.A. 88)
If the municipality has elected to come under the provision of Act 88 (see Table 2 in your municipality’s actuarial report),
service with former and future public employers in Michigan may be used to satisfy the service eligibility conditions of
MERS. MERS maintains a statewide Act 88 adoption list:
https://employerportal.mersofmich.com/SharepointFormsService/Default.aspx?FormName=form_77.pdf
Disability Retirement Allowance
Total and permanent disability while employed by a participating municipality and after meeting the vesting requirement of
the benefit program. The service requirement is waived if the disability is the duty-related, as set forth in Section 31(4) of
the MERS Plan Document.
The allowance is computed in the same manner as a service retirement allowance, except that the reduction for retirement
before age 60 is not applied.
If disability is duty-related, the amount of the retirement allowance shall not be less than 25% of the member’s FAC.
Adoption of optional Benefit Program D-2 provides a retirement allowance for a duty-related disability that is the greater of:
(i) 25% of the member's FAC; or (ii) A benefit based on 10 years of credited service in addition to the member's actual period of service, provided
the total years of service do not exceed the greater of 30 years or the member's actual period of service.
Non-Duty Death Allowance If a member or vested former member with the minimum years of service required to be vested dies before retirement, a
monthly survivor allowance may be payable.
If the member is married, the spouse is the automatic beneficiary unless the spouse, in writing, waives the benefit in favor
of another named beneficiary.
A contingent survivor beneficiary (named in an Option II Contingent Beneficiary Designation form filed with MERS) will
receive a retirement allowance computed in the same manner as a service retirement allowance, based on service and
FAC at death, but reduced to reflect an Option II (100% joint and survivor) election. The reduction for retirement before age
60 is not applied. Payment of a retirement allowance to the contingent survivor beneficiary of a deceased member
commences immediately. Payment of a retirement allowance to the contingent survivor beneficiary of a deceased vested
former member commences on the date the member would have first satisfied eligibility for retirement with an unreduced
service retirement allowance.
If there is no named beneficiary and the member leaves a spouse, the spouse will receive an Option II survivor allowance.
Payment of a retirement allowance to the surviving spouse of a deceased member commences immediately. Payment of a
retirement allowance to the surviving spouse of a deceased vested former member commences on the date the member
would have first satisfied eligibility for retirement for an unreduced service retirement allowance. The amount of a surviving
spouse's retirement allowance shall be 85% of the deceased member's or deceased vested former member's accrued

CBIZ Retirement Plan Services / Powerscourt Building, Suite 405, 17199 Laurel Park North, Livonia, MI 48152 / http://retirement.cbiz.com
Page 6 of 31
retirement allowance computed in the same manner as a service retirement allowance, based on service and FAC at time
of death.
The amount of a surviving spouse's benefit is always the larger of:
(i) the benefit computed as a contingent survivor beneficiary; and
(ii) the 85% of accrued retirement allowance benefit described above.
If there is no named beneficiary and no retirement allowance being paid to a surviving spouse, unmarried children under
age 21 will be paid an equal share of 50% of the deceased member's or deceased vested former member's accrued
retirement allowance. The reduction for retirement before age 60 is not applied.
If no retirement allowance becomes payable at death, the member's accumulated contributions, if any, are paid to the
beneficiary or to the decedent's estate.
Duty-Connected Death Allowance
A duty death allowance, computed in the same manner as a non-duty death allowance, may be payable to a spouse or
child(ren) if death occurs as the natural and proximate result of performance of duty with a participating municipality, as
described in Section 34 of the MERS Plan Document. In such a case, the vesting requirement is waived, and the minimum
benefit is 25% of the deceased member’s FAC.
Adoption of optional Benefit Program D-2 provides a retirement allowance for a duty-connected death that is the greater of:
(i) 25% of the member's FAC; or
(ii) A benefit based on 10 years of credited service in addition to the member's actual period of service, provided the total years of service do not exceed the greater of 30 years or the member's actual period of service.
Member Contributions Each member contributes a percent of annual compensation, as selected by the municipality, on the member's annual
compensation up to the compensation limit under Section 401(a)(17) of the Internal Revenue Code, as applicable. Any
percentage from 0% to 10% (in 0.1% increments) may be selected. A 3%/5% contribution program was available prior to
1985 and may be continued (until any new benefit programs are adopted), but not adopted, after 1984. Under this program
they contribute 3% of the first $4,200 of annual compensation and 5% of portions of annual compensation over $4,200.
Interest is credited to accumulated member contributions each December 31 (and reflected in the Annual Member
Statement provided to each member) at a rate determined by MERS, currently the one-year U.S. Treasury Bill rate
determined as of each December 31. The interest rate credited for the 12-month period ending on the valuation date was
0.85%.
If a member leaves the employ of the municipality or dies without a retirement allowance or other benefit payable on their
account, the member’s accumulated contributions plus interest (as described above) are refunded with spousal consent, to
the member, if living, or to the member’s surviving spouse, if any, or to a named beneficiary (after spousal consent, if
applicable).
Note for MERS' Defined Contribution Plan: The Annual Actuarial Valuation addresses assets and liabilities for
participation under the MERS Defined Benefit Plan and Hybrid Plan. The MERS Defined Contribution Plan, which first
became available for adoption in late 1997, is not addressed in the valuation results as it is not a defined benefit plan.

CBIZ Retirement Plan Services / Powerscourt Building, Suite 405, 17199 Laurel Park North, Livonia, MI 48152 / http://retirement.cbiz.com
Page 7 of 31
Post-Retirement Adjustments Employers may adopt post-retirement cost-of-living adjustments (COLA):
One-Time COLA for present retirees and beneficiaries. The amount of the increase is equal to the number of years since
the later of retirement or the date specified in the adopting resolution times either:
(i) a fixed percentage of the present benefit; or
(ii) a fixed dollar amount.
This COLA may be readopted from time to time.
Annual COLA – provides automatic annual benefit increases. The COLA may apply to either:
(i) retirees (and their beneficiaries) retired before the effective date of the COLA; or
(ii) retirees (and their beneficiaries) retired on or after the effective date of the COLA.
The amount of the annual increase may be either:
(i) a percentage of the original (base) retirement benefit (non-compounded COLA); or
(ii) a percentage of the present retirement benefit (compounded COLA); or
(iii) a fixed dollar amount.
Such increases are further limited to increases in the Consumer Price Index (CPI) if the COLA was adopted before January
1, 1999. For all adoptions or readoptions after that date, the increase is not limited by the CPI increase.
Death-After-Retirement Surviving Spouse Benefit
A retiring member electing the Straight Life (highest) form of retirement payment is normally paid a lifetime retirement
allowance, with payments terminating at death. The retiring member could provide benefits to a surviving spouse or
another named beneficiary by electing Option II (100% continuation to beneficiary) or Option II-A (75% continuation to
beneficiary) or Option III (50% continuation to beneficiary). A surviving spouse is automatically the beneficiary to an Option
II, IIA or III allowance unless the spouse, in writing, relinquishes the benefit to the member electing a Straight Life
allowance or to another named beneficiary. Electing these alternate forms of payment would lower the retiring member’s
retirement allowance.
If Benefit Program RS50% is adopted, a member retiring on or after the effective date of Benefit RS50% may elect the
Straight Life form of retirement payment and still provide a 50% survivor benefit to their spouse. To be eligible for a
surviving spouse benefit, the retiring member and spouse must have been married to each other both at the time of death
and during the full one-year period just before retirement.
Delayed Retirement Option Partial Lump Sum (DROP+)
Any member who is eligible to retire with full, immediate retirement benefits has the option to:
(i) Retire immediately and receive a monthly benefit payable immediately; or
(ii) Delay their retirement date and continue to work.
If the member is covered by DROP+ and they retire at least 12 months after first becoming eligible for unreduced benefits,
at actual retirement the member has the option to receive a partial lump sum and a reduced monthly benefit:
(i) The member can elect a lump sum equal to 12, 24, 36, 48, or 60 times the their monthly accrued benefit (if they have delayed retirement at least that many months).
(ii) For each 12 months included in the lump sum, the member's lifetime benefit is reduced by the DROP+ percentage adopted by the employer. The employer can adopt any of the following DROP+ reduction percentages: 6%, 7%, 8%, 9% or 10%.
DROP+ may not be adopted after June 30, 2013.

CBIZ Retirement Plan Services / Powerscourt Building, Suite 405, 17199 Laurel Park North, Livonia, MI 48152 / http://retirement.cbiz.com
Page 8 of 31
Annuity Withdrawal An employer may adopt the Annuity Withdrawal Program (AWP). Under the AWP a retiring member may elect to receive
a refund of their accumulated member contributions with interest in a lump sum at retirement. The member’s monthly
pension would then be reduced by the actuarial equivalent of the lump sum payment. The employer has two options for
the interest discount rate used to compute the actuarial equivalent reduction:
(i) The current investment return assumption used in the annual actuarial valuations (currently 7.75%); or
(ii) The most recent December 31 interest rate used for crediting interest on member contributions (0.85% as of
December 31, 2016).
Deferred Retirement Option Program (DROP)
If a participant is covered by the Benefit Program DROP and is eligible for retirement, they have the option to elect a
specified DROP period in which they will cease to accrue any additional retirement benefits, but remain employed by the
participating municipality or court. The participant must elect a DROP end date at least six months after the beginning date,
but no more than sixty months after the beginning date, in one-month increments
Upon the participant’s election of DROP and the receipt of an application to enroll in DROP, MERS will calculate the
participant’s service retirement and benefit payment as of the beginning date. The Retirement System also shall calculate
any age differential between the participant and the participant's beneficiary as of the calendar year of the DROP exit date
in accordance with Treas. Reg. § 1.401(a)(9)-6. Upon the beginning date of the DROP period, the participant shall be
responsible to continue employee contributions, if any.
On the next available benefit payment date after processing is complete, and monthly thereafter, an amount equal to 100%
of the monthly service retirement benefit payment the participant would have received if he or she had retired as of the
DROP beginning date will be credited to a notional account for the benefit of the participant. Funds in the DROP account
are credited with interest in the amount of 3% annually, or prorated in the event of a DROP period that is less than twelve
months.
Upon the end date, the participant shall receive a lump-sum distribution of the participant's DROP account and on the first
day of the calendar month following end date, the participant will begin receiving monthly service retirement benefit
payments.
Non-Standard Benefit Provisions Some municipalities have collectively bargained benefit provisions that differ from the benefit provisions described in this
section, and MERS has agreed to administer such provisions. Such benefit provisions, if any, are listed in Table 2 of a
municipality’s annual actuarial valuation report, or are reflected in the actuarial assumptions that are specific to a
municipality and are listed on the last page of a municipality’s annual actuarial valuation report.
Frozen Benefit Provisions
If a division has a Frozen Defined Benefit plan as described on page 4 of this appendix, the provisions of the frozen defined
benefit plan formula continue to apply for ancillary (non-retirement) benefits; alternatively, should the members of the
Frozen Defined Benefit plan be enrolled in the Hybrid Plan, the terms of the defined benefit component of the Hybrid Plan
shall apply.

CBIZ Retirement Plan Services / Powerscourt Building, Suite 405, 17199 Laurel Park North, Livonia, MI 48152 / http://retirement.cbiz.com
Page 9 of 31
Summary of Plan Provisions – Hybrid Plan1
The benefits summarized in this section are intended only as general information regarding the Municipal Employees’
Retirement System of Michigan. They are not a substitute for PA 220 of 1996, and the MERS Plan Document. If any
conflict occurs between the information in this summary and PA 220, or the MERS Plan Document, the provisions of PA
220 and the MERS Plan Document govern.
Hybrid Plan Part I — Defined Benefit Portion
Eligibility for Retirement
Members are eligible to retire at an age between 60 and 70, as selected by the participating municipality, with 6 or more
years of service.
Optional Retirement Programs (Unreduced Benefits)
An age between 55 and 65 as selected by the participating municipality, with credited service of 25 years.
Mandatory Retirement None.
Deferred Retirement (Vesting)
Retirement can be deferred if membership is terminated before the applicable retirement age other than by retirement or
death, after becoming vested (6 years of credited service is required for vesting). The retirement allowance begins when
the application is filed with MERS and eligibility requirements for retirement are met. The deferred retirement allowance is
computed in the same manner as a service retirement allowance, based on the final average compensation and years of
service at termination of membership.
Final Average Compensation (FAC) Benefits are based on a member's FAC, subject to the dollar compensation limits under Section 401(a)(17) of the Internal
Revenue Code, as applicable. For this purpose, FAC means one-third of the aggregate amount of compensation paid to a
member and earned during the period of 3 consecutive years of the member’s credited service in which the aggregate
compensation paid is highest.
Act 88 (Reciprocal Retirement Act, 1961 P.A. 88) If the municipality has elected to come under the provision of Act 88 (see Table 2 in your municipality’s actuarial report),
service with former and future public employers in Michigan may be used to satisfy the service eligibility conditions of
MERS. MERS maintains a statewide Act 88 adoption list:
https://employerportal.mersofmich.com/SharepointFormsService/Default.aspx?FormName=form_77.pdf
1 Please see the description of the Defined Benefit Plan beginning on page 3.

CBIZ Retirement Plan Services / Powerscourt Building, Suite 405, 17199 Laurel Park North, Livonia, MI 48152 / http://retirement.cbiz.com
Page 10 of 31
Service Retirement Allowance Credited service at time of termination of membership is multiplied by one of the following options:
Hybrid 1.0% 1.0% of a member's FAC
Hybrid 1.25% 1.25% of FAC
Hybrid 1.5% 1.5% of FAC
Hybrid 1.75% 1 1.75% of FAC
Hybrid 2.0% 1 2.0% of FAC
1 Available to those without social security coverage.
Maximum Benefit Payable by MERS
The maximum benefit that may be paid by MERS is governed by Section 415 of the Internal Revenue Code. Benefits in
excess of the maximum benefit will be paid by the MERS Excess Benefit Plan.
Disability Retirement Allowance
Benefits are the same as under the Defined Benefit Plan, except that optional Benefit Program D-2 does not apply.
Non-Duty Death Allowance Benefits are the same as under the Defined Benefit Plan.
Duty-Related Death Allowance
Benefits are the same as under the Defined Benefit Plan, except that optional Benefit Program D-2 does not apply.
Member Contributions None, unless required to comply with a state statute that places restrictions on employer contributions to retirement plans. Each municipality’s actuarial valuation reflects the member contribution provisions reported by MERS.
Post-Retirement Adjustments Not available.
Death-After-Retirement Surviving Spouse Benefit The same optional forms of payment are available as under the Defined Benefit Plan, except that the optional Benefit
Program RS50% does not apply.
Delayed Retirement Option Partial Lump Sum (DROP+)
Not available.
Annuity Withdrawal
Not available.
Deferred Retirement Option Program (DROP)
Not available.

CBIZ Retirement Plan Services / Powerscourt Building, Suite 405, 17199 Laurel Park North, Livonia, MI 48152 / http://retirement.cbiz.com
Page 11 of 31
Hybrid Plan Part II - Defined Contribution Portion
Employer Contributions and Vesting
The employer contribution amount is any percentage of compensation allowed by federal law.
The vesting schedule for employer contributions is one of the following schedules, as adopted by the employer:
(i) Immediate vesting upon participation; or
(ii) 100% vesting after stated years (participant is 100% vested after not to exceed maximum 5 years of service ("cliff" vesting)); or
(iii) Graded vesting percentages per year of service, not to exceed maximum 6 years of service for 100% vesting, nor be less than certain stated minimums.
Member Contributions and Vesting The member contribution amount is any amount allowed by federal law and subject to procedures established by the
Retirement Board.
The vesting schedule for member contributions is 100% immediate vesting.
Note: The Annual Actuarial Valuation addresses assets and liabilities for participation under the MERS Defined Benefit
Plan and the Defined Benefit portion of the Hybrid Plan. The Defined Contribution portion of the Hybrid Plan is not
addressed in the valuation results.

CBIZ Retirement Plan Services / Powerscourt Building, Suite 405, 17199 Laurel Park North, Livonia, MI 48152 / http://retirement.cbiz.com
Page 12 of 31
Municipal Employees' Retirement System of Michigan
IRC Section 415(b)(1)(A) Benefit Dollar Limits — 2017
The limits are based on the retiree’s age at retirement. The limit at ages 62-65 is indexed with inflation, in $5,000
increments. The limits at earlier ages are then increased proportionately. The limit applies to the retiree’s or beneficiary’s
employer-financed straight life benefit, except in the case of an Option II, IIA, or III election with the retiree’s spouse as
named beneficiary, in which case the limit applies to the employer-financed portion of the reduced joint and survivor
benefit.
Age at Retirement General Employees Police and Fire Members1
35 39,562 215,000
36 41,800 215,000
37 44,179 215,000
38 46,709 215,000
39 49,402 215,000
40 52,271 215,000
41 55,329 215,000
42 58,591 215,000
43 62,074 215,000
44 65,797 215,000
45 69,779 215,000
46 74,044 215,000
47 78,616 215,000
48 83,523 215,000
49 88,797 215,000
50 94,472 215,000
51 100,588 215,000
52 107,189 215,000
53 114,326 215,000
54 122,053 215,000
55 130,436 215,000
56 139,547 215,000
57 149,466 215,000
58 160,288 215,000
59 172,119 215,000
60 185,083 215,000
61 199,322 215,000
62 215,000 215,000
63 215,000 215,000
64 215,000 215,000
65 & older 215,000 215,000
1 Requires that the member have at least 15 years of police, fire, and/or armed forces
service as defined in IRC regulations. Otherwise use the limits for general members.
IRC Section 401(a)(17) Compensation Limit — 2017 For 2017, the IRC Section 401(a)(17) limit is $270,000. This limit is indexed with inflation in $5,000 increments.

CBIZ Retirement Plan Services / Powerscourt Building, Suite 405, 17199 Laurel Park North, Livonia, MI 48152 / http://retirement.cbiz.com
Page 13 of 31
Actuarial Assumptions
To calculate MERS contribution requirements, assumptions are made about future events that could affect the amount and
timing of benefits to be paid and the assets to be accumulated. The economic and demographic assumptions include:
An assumed rate of investment return that is used to discount liabilities and project what plan assets will earn.
A mortality table projecting the number of members who will die before retirement and the duration of benefit
payments after retirement.
Assumed retirement rates projecting when members will retire and commence receiving retirement benefits.
A set of withdrawal and disability rates to estimate the number of members who will leave the work force
before retirement.
Assumed rates of pay increase to project member compensation in future years.
The actuarial assumptions used in connection with this December 31, 2016 Actuarial Valuation are unchanged from those
used in the December 31, 2015 Actuarial Valuation. The actuarial assumptions currently used are summarized below and
on the following pages.
Interest Rate Funding plan benefits involves the accumulation of assets to pay benefits in the future. These assets are invested and the
net rate of investment earnings is a significant factor in determining the contributions required to support the ultimate cost
of benefits. For the 2016 actuarial valuation, the long-term investment yield is assumed to be 7.75% annually, net of
administrative and investment expenses. This assumption was first used for the December 31, 2015 actuarial valuations.
Please note that, given that the actuarial value of assets is currently 8% higher than the market value, meeting the actuarial
assumption in the next few years will require average annual market returns that exceed the 7.75% investment return
assumption.
Please see the Comments on Asset Smoothing in your municipality’s Annual Actuarial Valuation Report.

CBIZ Retirement Plan Services / Powerscourt Building, Suite 405, 17199 Laurel Park North, Livonia, MI 48152 / http://retirement.cbiz.com
Page 14 of 31
Pay Increases
Because benefits are based on a member’s final average compensation (FAC), it is necessary to make an assumption with
respect to each member’s estimated pay progression. The pay increase assumption used in the actuarial valuation projects
annual pay increases of 3.75% in the long term plus a percentage based on an age-related scale to reflect merit, longevity
and promotional pay increases.
The pay increase assumption for selected ages is shown below. The 3.75% long-term wage inflation assumption was first
used for the December 31, 2015 actuarial valuations. The merit and longevity pay increase assumption was first used for
the December 31, 2015 actuarial valuations.
Base Merit and Total Percentage
Age (Wage Inflation) Longevity Increase in Pay
20 3.75% 11.00% 14.75%
25 3.75 7.20 10.95
30 3.75 3.10 6.85
35 3.75 1.90 5.65
40 3.75 1.20 4.95
45 3.75 0.81 4.56
50 3.75 0.52 4.27
55 3.75 0.30 4.05
60 3.75 0.00 3.75
Inflation Although no explicit price inflation assumption is used in this valuation, the long-term annual rate of price inflation implicit in
the 3.75% base wage inflation is 2.5%.
Payroll Growth
For divisions that are open to new hires, the number of active members is projected to remain constant, and the total
payroll is projected to increase 3.75% annually. This assumption was first used for the December 31, 2015 actuarial
valuations.

CBIZ Retirement Plan Services / Powerscourt Building, Suite 405, 17199 Laurel Park North, Livonia, MI 48152 / http://retirement.cbiz.com
Page 15 of 31
Increase in Final Average Compensation (FAC)
The 2009-2013 and two previous experience studies determined that for some retirees of some municipalities, the actual
FAC at retirement was larger than would be expected based on reported annual pays and FAC's for the years just before
retirement. Some possible sources for the differences are:
Lump sum payments for unused paid time off. Unused sick leave payouts have been excluded from FAC since
the mid-1970s. However, since that time it has become popular to combine sick and vacation time into paid
time off, which is included in the FAC. Consequently, the lump sums that are includible in FAC have grown
over the years.
Extra overtime pay during the final year of employment. Our studies only reflect any increase in overtime
during the final year, not any increase that occurs during the full 3 or more year averaging period.
We analyzed the variation among municipalities. The amount of unexpected FAC increase varies quite a bit between
municipalities. Some municipalities show no sign of FAC loading, while other municipalities show increases above the
average increase. This is presumably the result of different personnel policies among municipalities.
The Retirement Board adopted new FAC assumptions that were first used for the December 31, 2015 annual actuarial
valuations. These assumptions reflect an FAC load of 0% to 12% for each municipality, based on the municipality's
experience in the 2009-2013 and earlier experience studies (it is anticipated that these assumptions will be updated after
every 5 year experience study). The FAC increase assumption(s) for your municipality are shown in your annual actuarial
valuation report. Note that for divisions that adopted Sick Leave in FAC (SLIF), the assumption is developed individually for
each division, based on the specific SLIF provision and/or past experience.

CBIZ Retirement Plan Services / Powerscourt Building, Suite 405, 17199 Laurel Park North, Livonia, MI 48152 / http://retirement.cbiz.com
Page 16 of 31
Withdrawal Rates The withdrawal rates are used to estimate the number of employees at each age that are expected to terminate
employment before qualifying for retirement benefits. The withdrawal rates do not apply to members eligible to retire, and
do not include separation on account of death or disability. The assumed rates of withdrawal applied in the current
valuation are based on years of service, and scaled up or down according to each division's experience.
Sample rates of withdrawal from active employment, before application of the scaling factor, are shown below. These rates
were first used for the December 31, 2015 actuarial valuations.
The base withdrawal rates (see the table below) are multiplied by the scaling factor to obtain the assumed withdrawal rates.
The scaling factor for each division is shown in your actuarial valuation report.
Sample Years % of Active Members Withdrawing
of Service Within the Next Year
0 19.60%
1 16.30
2 13.30
3 10.50
4 8.60
5 6.90
10 4.60
15 3.40
20 2.60
25 2.20
30 and over 2.20

CBIZ Retirement Plan Services / Powerscourt Building, Suite 405, 17199 Laurel Park North, Livonia, MI 48152 / http://retirement.cbiz.com
Page 17 of 31
Retirement Rates A schedule of retirement rates is used to measure the probability of eligible members retiring during the next year. The
retirement rates for Normal Retirement are determined by each member's replacement index at the time of retirement. The
replacement index is defined as the approximate percentage of the member's pay (after reducing for their member
contributions) that will be replaced by the member's benefit at retirement. The index is calculated as:
Replacement Index = 100 x Accrued Benefit divided by [Pay less Member Contributions]
The assumed retirement percentage is 100% at the later of age 70 or a member’s age on the valuation date.
Retirement rates for Early (reduced) Retirement are determined by the member's age at early retirement.
The Normal Retirement rates below were first used for the December 31, 2015 actuarial valuations. The Early Retirement
rates were first used for the December 31, 2015 actuarial valuations.
Normal Retirement Early Retirement – Reduced Benefit
Percent of Eligible Percent of Eligible
Sample Active Members Active Members
Replacement Retiring Within Retiring Within
Index the Next Year Age the Next Year
5 8.0% 50 2.0%
10 12.0 51 2.0
15 16.0 52 3.3
20 19.0 53 3.8
25 19.5 54 5.6
30 19.5 55 4.3
35 19.5 56 4.2
40 20.0 57 4.1
45 21.0 58 5.0
50 21.0 59 6.2
55 21.0
60 24.0
65 24.0
70 25.0
75 28.0
80 33.0
85 36.0
90 41.0
95 46.0
100+ 50.0

CBIZ Retirement Plan Services / Powerscourt Building, Suite 405, 17199 Laurel Park North, Livonia, MI 48152 / http://retirement.cbiz.com
Page 18 of 31
Disability Rates Disability rates are used in the valuation to estimate the incidence of member disability in future years.
The assumed rates of disablement at various ages are shown below. These rates were first used for the December 31,
2015 actuarial valuations.
Percent Becoming Disabled
Sample Ages Within the Next Year
20 0.02%
25 0.02
30 0.02
35 0.05
40 0.08
45 0.20
50 0.29
55 0.38
60 0.39
65 0.39
Eighty percent (80%) of the disabilities are assumed to be non-duty and 20% of the disabilities are assumed to be duty
related. For those plans which have adopted disability provision D-2, 40% of the disabilities are assumed to be non-duty
and 60% are assumed to be duty related.

CBIZ Retirement Plan Services / Powerscourt Building, Suite 405, 17199 Laurel Park North, Livonia, MI 48152 / http://retirement.cbiz.com
Page 19 of 31
Mortality Table In estimating the amount of the reserves required at the time of retirement to pay a member’s benefit for the remainder of
their lifetime, it is necessary to make an assumption with respect to the probability of surviving to retirement and the life
expectancy after retirement.
The mortality table used to project the mortality experience of non-disabled plan members is a 50% Male - 50% Female
blend of the following tables:
1. The RP-2014 Healthy Annuitant Mortality Tables, with rates multiplied by 105%
2. The RP-2014 Employee Mortality Tables
3. The RP-2014 Juvenile Mortality Tables
For ages 0-17 we use the rates in Table 3; for ages 18-49 we use the rates in Table 2; for ages 70 and older we use the
rates in Table 1; and for ages 50-69 we blend Table 2 and Table 1 as follows:
a. Age 50, use 60% of Table 2 and 40% of Table 1
b. Age 51, use 57% of Table 2 and 43% of Table 1
c. Etc. …
d. Age 69, use 3% of Table 2 and 97% of Table 1
The mortality table used to project the mortality experience of disabled plan members is a 50% Male - 50% Female blend of
the RP-2014 Disabled Retiree Mortality Tables.
These mortality tables were first used for the December 31, 2015 actuarial valuations.
Ninety percent (90%) of active member deaths are assumed to be non-duty deaths and 10% of the deaths are assumed to
be duty related.
Possible future mortality improvements are reflected in the mortality assumption. The mortality assumptions include a
10% margin for future mortality improvements, relative to the actual mortality experience seen in the 2009-2013
Experience Study.

CBIZ Retirement Plan Services / Powerscourt Building, Suite 405, 17199 Laurel Park North, Livonia, MI 48152 / http://retirement.cbiz.com
Page 20 of 31
The life expectancies and mortality rates projected for non-disabled members are shown below for selected ages:
Expected Years
Age of Life Remaining Mortality Rates
20 63.06 0.03%
25 58.15 0.03
30 53.24 0.03
35 48.33 0.04
40 43.43 0.05
45 38.56 0.08
50 33.74 0.23
55 29.18 0.37
60 24.79 0.58
65 20.59 0.94
70 16.66 1.56
75 13.07 2.51
80 9.85 4.18
The life expectancies and mortality rates projected for disabled members are shown below for selected ages:
Expected Years
Age of Life Remaining Mortality Rates
20 46.95 0.47%
25 43.14 0.54
30 39.24 0.55
35 35.33 0.65
40 31.52 0.82
45 27.98 1.30
50 24.87 1.62
55 21.91 1.89
60 18.97 2.18
65 16.04 2.63
70 13.19 3.43
75 10.54 4.77
80 8.18 6.88

CBIZ Retirement Plan Services / Powerscourt Building, Suite 405, 17199 Laurel Park North, Livonia, MI 48152 / http://retirement.cbiz.com
Page 21 of 31
Miscellaneous and Technical Assumptions
Loads - Vesting liabilities are increased by 2% to reflect the value of the potential
survivor benefit payable in case of death during the benefit deferral period.
Marriage Assumptions - Seventy percent (70%) of males and 70% of females are assumed to be
married for purposes of death-in-service benefits. Male spouses are
assumed to be three years older than female spouses.
Pay Increase Timing - Beginning of valuation year. This is equivalent to assuming that reported
pays represent amounts paid to members during the year ended on the
valuation date.
Pay Adjustment - None.
Decrement Timing - Decrements of all types are assumed to occur mid-year.
Future Service - Members are assumed to earn 1.0 years of service in each future year.
Eligibility Testing - Eligibility for benefits is determined based upon the age nearest birthday
and service nearest whole year on the date the decrement is assumed to
occur.
Benefit Service - Exact fractional service is used to determine the amount of benefit payable.
Benefit service is the service used in the benefit formula.
Eligibility Service - The larger of reported Eligibility Service and reported Vesting Service was
used as eligibility service in the valuation. Eligibility service is the service
used to meet the conditions for retirement, and is generally equal to or
larger than benefit service.
Decrement Relativity - Decrement rates are used directly from the experience study, without
adjustment for multiple decrement table effects.
Decrement Operation - Disability and withdrawal do not operate during retirement eligibility.
Normal Form of Payment - Future retiring members are assumed to elect the Straight Life form of
payment (see page 7 regarding death-after-retirement benefits).
Incidence of Contributions - Contributions are assumed to be received continuously throughout the year
based upon the computed percent of payroll shown in this report, and the
actual payroll payable at the time contributions are made. New entrant
normal cost contributions are applied to the funding of new entrant benefits.
CBIZ Retirement Plan Services / Powerscourt Building, Suite 405, 17199 Laurel Park North, Livonia, MI 48152 / http://retirement.cbiz.com
Page 22 of 31
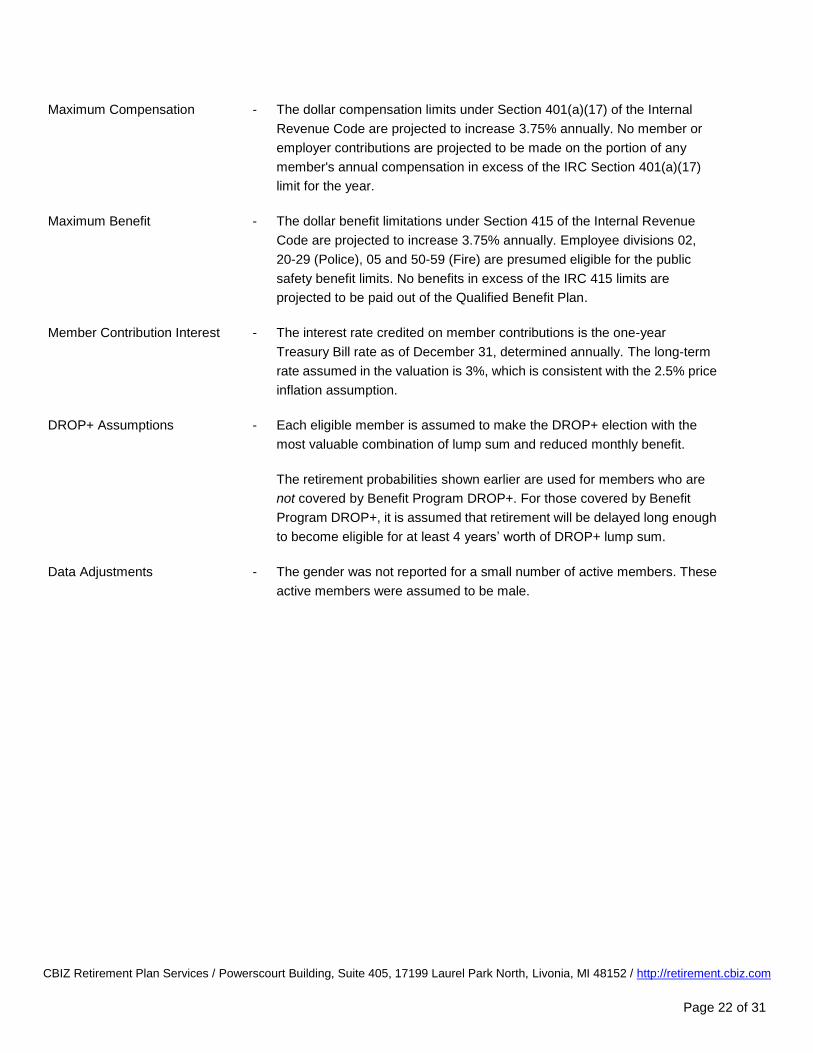
Maximum Compensation - The dollar compensation limits under Section 401(a)(17) of the Internal
Revenue Code are projected to increase 3.75% annually. No member or
employer contributions are projected to be made on the portion of any
member's annual compensation in excess of the IRC Section 401(a)(17)
limit for the year.
Maximum Benefit - The dollar benefit limitations under Section 415 of the Internal Revenue
Code are projected to increase 3.75% annually. Employee divisions 02,
20-29 (Police), 05 and 50-59 (Fire) are presumed eligible for the public
safety benefit limits. No benefits in excess of the IRC 415 limits are
projected to be paid out of the Qualified Benefit Plan.
Member Contribution Interest - The interest rate credited on member contributions is the one-year
Treasury Bill rate as of December 31, determined annually. The long-term
rate assumed in the valuation is 3%, which is consistent with the 2.5% price
inflation assumption.
DROP+ Assumptions - Each eligible member is assumed to make the DROP+ election with the
most valuable combination of lump sum and reduced monthly benefit.
The retirement probabilities shown earlier are used for members who are
not covered by Benefit Program DROP+. For those covered by Benefit
Program DROP+, it is assumed that retirement will be delayed long enough
to become eligible for at least 4 years’ worth of DROP+ lump sum.
Data Adjustments - The gender was not reported for a small number of active members. These
active members were assumed to be male.

CBIZ Retirement Plan Services / Powerscourt Building, Suite 405, 17199 Laurel Park North, Livonia, MI 48152 / http://retirement.cbiz.com
Page 23 of 31
Actuarial Funding Method
The Retirement Board has adopted funding methodology for the Retirement System to achieve the following major
objectives:
Develop level required contribution rates as a percentage of payroll (for divisions that are open to new hires);
Finance benefits earned by present employees on a current basis;
Accumulate assets to enhance members’ benefit security;
Produce investment earnings on accumulated assets to help meet future benefit costs;
Make it possible to estimate the long-term actuarial cost of proposed amendments to System provisions; and
Assist in maintaining the Retirement System’s long-term financial viability.
The basic funding objective is a level pattern of cost as a percentage of pay throughout each member’s working lifetime.
The funding method used in this actuarial valuation – the entry age normal cost method – was first used for the December
31, 1993 actuarial valuations and is intended to:
(i) Meet this funding objective; and
(ii) Result in a relatively level long-term contribution requirement as a percentage of pay.
Under the entry age normal cost method, the total actuarially-determined contribution requirement is equal to the sum of
the normal cost plus the payment required to fund the unfunded actuarial accrued liability over a period of years. Funding
or amortizing the unfunded actuarial accrued liability includes a payment toward the liability (principal) plus a payment to
reflect the time value of money (interest).
Normal Cost
In general terms, the normal cost is the cost of benefit rights accruing on the basis of current service. Technically, the
normal cost rate is the level percentage-of-pay contribution required each year, with respect to each member, to
accumulate over their projected working lifetime the reserves needed to meet the cost of earned benefits. The normal cost
represents the ultimate cost of the Retirement System, if the unfunded liability is paid up and the actual experience of the
System conforms to the assumptions.
Actuarial Accrued Liability
The total actuarial present value of future benefits is computed using the valuation’s actuarial assumptions. Subtracting the
present value of future normal costs results in the actuarial accrued liability.
The total actuarial accrued liability essentially represents the amount that would have been accumulated as of a given
valuation date, if:
(i) Contributions sufficient to meet the normal costs of the Retirement System had been made each year in the past;
(ii) Benefit provisions had always been the same as current benefit provisions; and
(iii) Actual past experience had always conformed to current actuarial assumptions.
If assets equaled the total accrued liability, there would be no unfunded liability and future contribution requirements would
consist solely of the calculated normal cost rates.

CBIZ Retirement Plan Services / Powerscourt Building, Suite 405, 17199 Laurel Park North, Livonia, MI 48152 / http://retirement.cbiz.com
Page 24 of 31
Amortization of Unfunded Actuarial Accrued Liability The unfunded accrued liability (UAL) as of December 31, 2016 (see Table 10 of your municipality’s annual actuarial
valuation report) is projected to the beginning of the fiscal year for which employer contributions are being calculated (fiscal
year beginning in 2018). This allows the 2016 valuation to take into account the expected future contributions that are
based on past valuations. This projection process will result in more stable computed contribution rates, and was first used
for the December 31, 2004 actuarial valuations.
For valuation years through 2015, the projected total unfunded accrued liability was then amortized over the appropriate
period for each division (see Table 1 of your municipality’s annual actuarial valuation report) to determine the amortization
payment. For divisions that will have no new hires this was the dollar amortization payment. For divisions that are open to
new hires this payment was divided by the projected fiscal year payroll to determine the amortization payment as a
percentage of active member payroll. The resulting amortization contributions were displayed in Table 1 for each division.
For purposes of determining the amortization payment, payments are projected to increase 3.75% a year.
For the December 31, 2016 Annual Valuation, the remaining December 31, 2015 UAL is maintained separately (herein
after called the “initial UAL”) from newly emerging UAL and will be amortized over the remaining years. Newly emerging
UAL is amortized separately as discussed below. Dollar and percentage contributions are determined as above for each
piece (layer) of UAL.
The standard amortization period to fund the initial UAL for open divisions is 22 years for positive unfunded in the 2016
valuation. This period decreases by 1 each year until the initial UAL is paid off. Section 20m of Act No. 314 of the Public
Acts of 1965 as amended (MCL 38.1140m) requires that the amortization period not exceed 30 years.
The standard amortization period for negative initial UAL is 10 years, with the 10 year period reestablished with each
annual actuarial valuation.
For divisions that closed to new hires prior to 2016, with new hires not covered by MERS Defined Benefit Plan or Hybrid
Plan provisions (in a linked division), the amortization period was shortened in order to ensure adequate funding of the
closed division. The employer had two amortization options. Under the Accelerated to 5 Year Option, the otherwise
applicable MERS-wide standard amortization period for positive unfunded liabilities in effect in the valuation year in which
the division is closed is decreased annually by 2 years until the period reaches 6 or 5 years. Each year thereafter the
amortization period decreases one year each valuation year until the unfunded liability is paid off. Under the Accelerated
to 15 Year Option, the amortization period is decreased annually by 2 years until the period reaches 16 or 15 years. Each
year thereafter the amortization period decreases one year each valuation year until the unfunded liability is paid off. An
employer that elected the Accelerated to 5 Year Option may later change to the Accelerated to 15 Year Option. Note that
beginning in 2016 the Accelerated to 15 Option is the default amortization policy for closed divisions. Beginning in 2017,
the default amortization policy for newly closing division is the same as for open divisions unless the actuary determines
that a shorter period is necessary to ensure a reasonable level of benefit security is maintained. This is called the
“Non-Accelerated Option”.
Amortization periods that are shorter than the above standard periods may be elected by a municipality (but not shorter
than 5 years for negative unfunded liabilities), and some municipalities have done so.
The minimum contribution requirement is equal to the excess of three years of projected annual retiree benefit payments
over the projected market value of assets. For open divisions this minimum first applied beginning with the December 31,
2015 annual valuations.
CBIZ Retirement Plan Services / Powerscourt Building, Suite 405, 17199 Laurel Park North, Livonia, MI 48152 / http://retirement.cbiz.com
Page 25 of 31
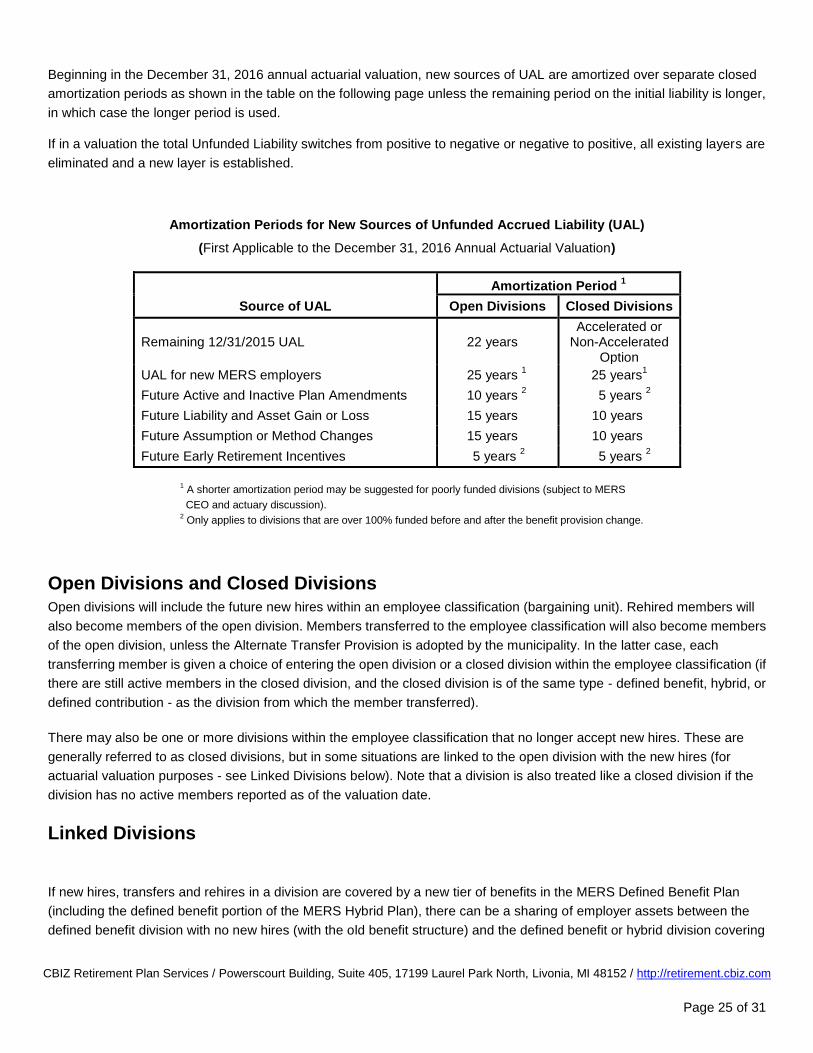
Beginning in the December 31, 2016 annual actuarial valuation, new sources of UAL are amortized over separate closed
amortization periods as shown in the table on the following page unless the remaining period on the initial liability is longer,
in which case the longer period is used.
If in a valuation the total Unfunded Liability switches from positive to negative or negative to positive, all existing layers are
eliminated and a new layer is established.
Amortization Periods for New Sources of Unfunded Accrued Liability (UAL)
(First Applicable to the December 31, 2016 Annual Actuarial Valuation)
Amortization Period 1
Source of UAL Open Divisions Closed Divisions
Remaining 12/31/2015 UAL 22 years Accelerated or
Non-Accelerated Option
UAL for new MERS employers 25 years 1 25 years
1
Future Active and Inactive Plan Amendments 10 years 2 5 years
2
Future Liability and Asset Gain or Loss 15 years 10 years
Future Assumption or Method Changes 15 years 10 years
Future Early Retirement Incentives 5 years 2 5 years
2
1 A shorter amortization period may be suggested for poorly funded divisions (subject to MERS
CEO and actuary discussion). 2 Only applies to divisions that are over 100% funded before and after the benefit provision change.
Open Divisions and Closed Divisions Open divisions will include the future new hires within an employee classification (bargaining unit). Rehired members will
also become members of the open division. Members transferred to the employee classification will also become members
of the open division, unless the Alternate Transfer Provision is adopted by the municipality. In the latter case, each
transferring member is given a choice of entering the open division or a closed division within the employee classification (if
there are still active members in the closed division, and the closed division is of the same type - defined benefit, hybrid, or
defined contribution - as the division from which the member transferred).
There may also be one or more divisions within the employee classification that no longer accept new hires. These are
generally referred to as closed divisions, but in some situations are linked to the open division with the new hires (for
actuarial valuation purposes - see Linked Divisions below). Note that a division is also treated like a closed division if the
division has no active members reported as of the valuation date.
Linked Divisions
If new hires, transfers and rehires in a division are covered by a new tier of benefits in the MERS Defined Benefit Plan
(including the defined benefit portion of the MERS Hybrid Plan), there can be a sharing of employer assets between the
defined benefit division with no new hires (with the old benefit structure) and the defined benefit or hybrid division covering

CBIZ Retirement Plan Services / Powerscourt Building, Suite 405, 17199 Laurel Park North, Livonia, MI 48152 / http://retirement.cbiz.com
Page 26 of 31
the new hires within the same employee classification. (Note that assets cannot be shared if the new tier of benefits is a
defined contribution plan.) This allows multiple divisions to be “linked” and financed as if they were one division.
If a division with no new hires is “linked” to an open MERS Defined Benefit Plan or MERS Hybrid Plan division, this is
indicated in Table 2 of your municipality’s annual actuarial valuation report. Both of the linked divisions will use the
standard open division funding policy.

CBIZ Retirement Plan Services / Powerscourt Building, Suite 405, 17199 Laurel Park North, Livonia, MI 48152 / http://retirement.cbiz.com
Page 27 of 31
Asset Valuation Method
The actuarial value of assets is determined on the basis of a method that calculates expected investment income at the
valuation rate of return and adds a portion of the difference between the expected investment income and actual
investment income earned on a market value basis. For the December 31, 2016 valuation the difference in investment
income between expected return and market return is recognized over a 5-year period at the rate of 20% per year. This
asset valuation method was first adopted for the December 31, 2016 valuation, and is applied as follows:
Actuarial Value equals:
(i) Actuarial value of assets from the previous actuarial valuation; plus
(ii) Aggregate employer and member contributions since the last valuation; minus
(iii) Benefit payments and refunds of member contributions since the last valuation; plus
(iv) Estimated investment income at the 7.75% valuation interest rate; plus
(v) Portion of gain (loss) recognized in the current valuation.
For the above purpose, gain (loss) is defined as the excess during the period of the investment return on the market value
of assets over the expected investment income. The portion recognized in the valuation is 20% of the current year's gain
(loss) plus 20% of the gain (loss) from each of the 4 preceding years. This is a change from the 2015 and prior valuations
where a 10 year smoothing period was used. For purposes of transitioning from the 10 year to the 5 year method, the
entirety of prior unrecognized gains and losses at December 31, 2016 is combined into a single item and will be recognized
over the next four years.
During 2016, the approximate net investment return on average total assets at actuarial value (determined as the actuarial
value of investment income divided by the average actuarial value of assets during the year) was 5.14%. The
corresponding amounts for 2015, 2014, 2013 and 2012 were 5.21%, 5.90%, 6.04%, and 5.42%, respectively.
For the December 31, 2016 valuation, the actuarial value of assets is equal to 107.71% of market value (compared to
113.54%, 105.99%, 106.18%, and 114.36% in 2015, 2014, 2013 and 2012, respectively). This percentage is applied to
each division's reported market value of assets to estimate the actuarial value of assets for the division. The tables on the
following pages provide the details of the derivation of the actuarial value of assets for the retirement system in the
aggregate.
Note that, given that the actuarial value of assets is currently 8% higher than the market value, meeting the actuarial
assumption in the next few years will require average annual market returns that exceed the 7.75% investment return
assumption.
Please see the Comments on Asset Smoothing in your municipality’s annual actuarial valuation report.

CBIZ Retirement Plan Services / Powerscourt Building, Suite 405, 17199 Laurel Park North, Livonia, MI 48152 / http://retirement.cbiz.com
Page 28 of 31
Municipal Employees’ Retirement System of Michigan Derivation of Actuarial Value of Assets
Valuation Date December 31 2001 2002 2003 2004 2005
1 . Beg inn ing o f Year Assets
a ) Market Va lue $3,788,886,471 $3,647,820,869 $3,285,304,333 $4,071,997,180 $4,619,201,287 b) Va luat ion Assets 3 ,791,423,339 4 ,034,377,419 4 ,134,404,645 4 ,459,492,020 4 ,732,208,229
2 . End o f Year Market Va lue
Assets 3 ,647,820,869 3 ,285,304,333 4 ,071,997,180 4 ,619,201,287 4 ,906,288,690
3 . Net Add i t ions to Market
Va lue
a ) Net Contr ibu t ions 154,103,475 167,427,558 223,450,393 223,057,268 277,589,524 b) Net Investment Income
= (3d) – (3a) – (3c) (93,269,286) (324,926,459) 792,139,959 577,562,751 288,223,418
c) Benef i t Payments (201,899,791) (205,017,635) (228,897,505) (253,415,912) (278,725,539)
d) Tota l Add i t ions to Market Va lue = (2) - (1a)
(141,065,602) (362,516,536) 786,692,847 547,204,107 287,087,403
4 . Average Va luat ion Assets
= (1b) + .5x[ (3a)+(3c)] 3 ,767,525,181 4 ,015,582,381 4 ,131,681,089 4 ,444,312,698 4 ,731,640,222
5 . Expected Income at
Va luat ion Rate = 8% x (4) 301,402,014 321,246,590 330,534,487 355,545,016 378,531,218
6 . Ga in (Loss) = (3b) - (5 ) (394,671,300) (646,173,049) 461,605,472 222,017,735 (90,307,800) 7 . Phased-In Recogni t ion o f
Investment Return
a ) Current Year: 0 .2 x (6) (78,934,260) (129,234,610) 44,403,547 (18,061,560) b) F i rs t Pr io r Year (79,670,266) (78,934,260) 44 ,403,547 c) Second Pr ior Year 63,981,441 (79,670,266) d ) Th i rd Pr ior Year 40,228,410 63,981,441 e ) Fourth Pr ior Year 43,743,057 40,228,408 f ) 1999-2003 Years
Combined N/A N/A 0 (96,873,710) (96,873,710)
g) Tota l Recognized Investment Gain (Loss)
(10,651,618) (183,629,287) 0 (52,470,163) (70,531,723)
8 . Change in Va luat ion
Assets (3a) + (3c) + (5) + (7g)
242,954,080 100,027,226 325,087,375 272,716,209 306,863,480
9 . End o f Year Assets
a ) Market Va lue = (2) 3 ,647,820,869 3 ,285,304,333 4 ,071,997,180 4 ,619,201,287 4 ,906,288,690 b) Va luat ion Assets =
(1b) + (8) 4 ,034,377,419 4 ,134,404,645 4 ,459,492,020 4 ,732,208,229 5 ,039,071,709
c) D i f fe rence Between Market & Va luat ion Assets
(386,556,550) (849,100,312) (387,494,840) (113,006,942) (132,783,019)
10 . Recognized Rate o f Return
= [ (5) + (7g)] / (4 ) 7 .72% 3.43% 8.00% 6.82% 6.51%
11 . Market Rate o f Return (2 .48%) (8 .95%) 24.13% 14.24% 6.24% 12 . Va luat ion Asset
Ad justment Factor = (9b) / (9a)
1 .105969 1 .258454 1 .095161 1 .024465 1 .027064

CBIZ Retirement Plan Services / Powerscourt Building, Suite 405, 17199 Laurel Park North, Livonia, MI 48152 / http://retirement.cbiz.com
Page 29 of 31
Municipal Employees’ Retirement System of Michigan Derivation of Actuarial Value of Assets (Cont.)
Valuation Date December 31 2006 2007 2008 2009 2010
1 . Beg inn ing o f Year Assets
a ) Market Va lue $4,906,288,690 $5,590,042,317 $6,071,046,914 $4,512,260,955 $5,276,645,338 b) Va luat ion Assets 5 ,039,071,709 5 ,512,924,466 6 ,001,040,078 6 ,278,731,673 6 ,604,608,397
2 . End o f Year Market Va lue
Assets 5 ,590,042,317 6 ,071,046,914 4 ,512,260,955 5 ,276,645,338 5 ,971,593,444
3 . Net Add i t ions to Market
Va lue
a ) Net Contr ibu t ions 371,505,157 386,942,952 374,214,134 413,354,720 423,489,032 b) Net Investment Income
= (3d) – (3a) – (3c) 622,409,716 442,377,206 (1 ,553,001,917) 771,066,207 733,059,352
c) Benef i t Payments (310,161,246) (348,315,561) (379,998,176) (420,036,544) (461,600,278)
d) Tota l Add i t ions to Market Va lue = (2) - (1a)
683,753,627 481,004,597 (1 ,558,785,959) 764,384,383 694,948,106
4 . Average Va luat ion Assets
= (1b) + .5x[ (3a)+(3c)] 5 ,069,743,665 5 ,532,238,162 5 ,998,148,057 6 ,275,390,761 6 ,585,552,774
5 . Expected Income at
Va luat ion Rate = 8% x (4) 405,579,493 442,579,053 479,851,845 502,031,261 526,844,222
6 . Ga in (Loss) = (3b) - (5 ) 216,830,223 (201,847) (2 ,032,853,762) 269,034,946 206,215,130 7 . Phased-In Recogni t ion o f
Investment Return
a ) Current Year: 0 .1 x (6) 21,683,022 (20,185) (203,285,376) 26,903,495 20,621,513 b) F i rs t Pr io r Year (14,753,669) 21,683,022 (20,185) (203,285,376) 26,903,495 c) Second Pr ior Year (14,753,669) 21,683,022 (20,185) (203,285,376) d) Th i rd Pr ior Year (14,753,669) 21,683,022 (20,185) e) Fourth Pr ior Year (14,753,669) 21,683,022 f ) F i f th Pr io r Year (14 ,753,669) g) S ixth Pr ior Year h ) Seventh Pr ior Year i ) E ighth Pr ior Year j ) N in th Pr ior Year k) Tota l Recognized
Investment Gain (Loss)
6 ,929,353 6 ,909,168 (196,376,208 ) (169,472,713) (148,851,200)
8 . Change in Va luat io n
Assets (3a) + (3c) + (5) + (7k)
473,852,757 488,115,612 277,691,595 325,876,724 339,881,776
9 . End o f Year Assets
a ) Market Va lue = (2) 5 ,590,042,317 6 ,071,046,914 4 ,512,260,955 5 ,276,645,338 5 ,971,593,444 b) Va luat ion Assets =
(1b) + (8) 5 ,512,924,466 6 ,001,040,078 6 ,278,731,673 6 ,604,608,397 6 ,944,490,173
c) D i f fe rence Between Market & Va luat ion Assets
77,117,851 70,006,836 (1 ,766,470,718) (1 ,327,963,059) (972,896,729)
10 . Recognized Rate o f Re turn
= [ (5) + (7k ) ] / (4 ) 8 .14% 8.12% 4.73% 5.30% 5.74%
11 . Market Rate o f Return 12.61% 7.89% (25.59%) 17.10% 13.94% 12 .Va luat ion Asset Ad justment
Factor = (9b ) / (9a) 0 .986204 0 .988469 1 .391482 1 .251668 1 .162921

CBIZ Retirement Plan Services / Powerscourt Building, Suite 405, 17199 Laurel Park North, Livonia, MI 48152 / http://retirement.cbiz.com
Page 30 of 31
Municipal Employees’ Retirement System of Michigan Derivation of Actuarial Value of Assets (Cont.)
Valuation Date December 31 2011 2012 2013 2014 2015
1 . Beg inn ing o f Year Assets
a ) Market Va lue $5,971,593,444 $5,935,528,263 $6,858,525,416 $7,651,705,376 $8,063,083,723 b) Va luat ion Assets 6 ,944,490,173 7 ,157,148,344 7 ,843,152,666 8 ,124,887,439 8 ,546,363,754
2 . End o f Year Market Va lue
Assets 5 ,935,528,263 6 ,858,525,416 7 ,651,705,376 8 ,063,083,723 7 ,886,133,448
3 . Net Add i t ions to Market
Va lue
a ) Net Contr ibu t ions 362,710,568 856,171,348 476,725,412 651,265,712 717,870,630 b) Net Investment Income
= (3d) – (3a) – (3c) 108,045,293 633,022,713 979,236,854 467,398,803 (139,840,580)
c) Benef i t Payments (506,821,042 ) (566,196,908 ) (662,782,306) (707,286,168) (754,980,325 )
d) Tota l Add i t ions to Market Va lue = (2) - (1a)
(36,065,181) 922,997,153 793,179,960 411,378,347 (176,950,275)
4 . Average Va luat ion Assets
= (1b) + .5x[ (3a)+(3c)] 6 ,872,434,936 7 ,302,135,564 7 ,750,124,219 8 ,096,877,211 8 ,527,808,907
5 . Expected Income at
Va luat ion Rate = 8% x (4) 549,794,795 584,170,845 620,009,938 647,750,177 682,224,713
6 . Ga in (Loss) = (3b) - (5 ) (441,749,502) 48,851,868 359,226,916 (180,351,374) (822,065,293 ) 7 . Phased-In Recogni t ion o f
Investment Return
a ) Current Year: 0 .1 x (6) (44,174,950) 4 ,885,187 35,922,692 (18,035,137) (82,206,529 ) b) F i rs t Pr io r Year 20,621,513 (44,174,950) 4 ,885,187 35,922,692 (18,035,137) c) Second Pr ior Year 26,903,495 20,621,513 (44,174,950) 4 ,885,187 35,922,692 d) Th i rd Pr ior Year (203,285,376) 26,903,495 20,621,513 (44,174,950) 4 ,885,187 e) Fourth Pr ior Year (20,185) (203,285,376) 26,903,495 20,621,513 (44,174,950) f ) F i f th Pr io r Year 21,683,022 (20,185) (203,285,376) 26,903,495 20,621,513 g) S ixth Pr ior Year (14,753,669) 21,683,022 (20,185) (203,285,376) 26,903,495 h) Seventh Pr ior Year (14,753,669) 21,683,022 (20,185) (203,285,376) i ) E ighth Pr ior Year (14,753,669) 21,683,022 (20,185) j ) N in th Pr ior Year k) Tota l Recognized
Investment Gain (Loss)
(14,753,667) 21,683,025
(193,026,150 ) (188,140,963 ) (152,218,271) (170,253,406) (237,706,265 )
8 . Change in Va luat io n
Assets (3a) + (3c) + (5) + (7k)
212,658,171 686,004,322 281,734,773 421,476,315 407,408,753
9 . End o f Year Assets
a ) Market Va lue = (2) 5 ,935,528,263 6 ,858,525,416 7 ,651,705,376 8 ,063,083,723 7 ,886,133,448 b) Va luat ion Assets =
(1b) + (8) 7 ,157,148,344 7 ,843,152,666 8 ,124,887,439 8 ,546,363,754 8 ,953,772,507
c) D i f fe rence Between Market & Va luat ion Assets
(1 ,221,620,081 ) (984,627,250 ) (473,182,063) (483,280,031) (1 ,067,639,059 )
10 . Recognized Rate o f Re turn
= [ (5) + (7k ) ] / (4 ) 5 .19% 5.42% 6.04% 5.90% 5.21%
11 . Market Rate o f Return 1 .83% 10.41% 14.47% 6.13% (1 .74%) 12 .Va luat ion Asset Ad justment
Factor = (9b ) / (9a) 1 .205815 1 .143563 1 .061840 1 .059937 1 .135382

CBIZ Retirement Plan Services / Powerscourt Building, Suite 405, 17199 Laurel Park North, Livonia, MI 48152 / http://retirement.cbiz.com
Page 31 of 31
Municipal Employees’ Retirement System of Michigan Derivation of Actuarial Value of Assets (Cont.)
Valuation Date December 31 2016 2017 2018 2019 2020
1 . Beg inn ing o f Year Assets
a ) Market Va lue $7,886,133,448 b ) Va luat ion Assets 8 ,953,772,507
2 . End o f Year Market Va lue
Assets 8 ,490,200,180
3 . Net Add i t ions to Market
Va lue
a ) Net Contr ibu t ions 654,676,753 b ) Net Investment Income =
(3d) – (3a) – (3c) 866,474,132
c) Benef i t Payments (917,084,153)
d ) Tota l Add i t ions to Market Va lue = (2) - (1a)
604,066,732
4 . Average Va luat ion Assets =
(1b) + .5x[ (3a)+(3c)] 8 ,822,568,807
5 . Expected Income at
Va luat ion Rate=7.75% x (4) 683,749,083
6 . Ga in (Loss) = (3b) - (5 ) 182,725,049 7 . Phased-In Recogni t ion o f
Investment Return
a ) Current Year: 0 .2 x (6) 36,545,010 b ) F i rs t Pr io r Year (266,909,765 ) 36,545,010 c) Second Pr ior Year (266,909,765 ) 36,545,010 d ) Th i rd Pr ior Year (266,909,765 ) 36,545,010 e) Fourth Pr ior Year f ) Tota l Recognized
Investment Gain (Loss)
(266,909,764 ) 36,545,010
(230,364,755 ) (230,364,755 ) (230,364,755 ) (230,364,755 ) 36,545,010
8 . Change in Va luat io n Assets
(3a) + (3c) + (5) + (7 f ) 190,976,928
9 . End o f Year Assets
a ) Market Va lue = (2) 8 ,490,200,180 b ) Va luat ion Assets = (1b)
+ (8) 9 ,144,749,435
c) D i f fe rence Between Market & Va luat ion Assets
(654,549,255)
10 . Recognized Rate o f Re turn
= [ (5) + (7 f ) ] / (4 ) 5 .14%
11 . Market Rate o f Return 11.17% 12 .Va luat ion Asset Ad justment
Factor = (9b ) / (9a) 1 .077095