Embed Size (px)
Citation preview
California Debt and Advisory Commission
Accessing the Market: Marketing and Pricing
Day Three Session Three
February 14, 2019
Municipal Debt Essentials
Presentation by:
David Officer, Managing Director, Mesirow Financial
Victor Andrade, Director, Head of California Education Finance, Citigroup Global Markets, Inc.
What This Session Teaches 1
• In this session you will learn the basic concepts and processes
associated with selling bonds in the primary market
• This material can be grouped into five broad categories
1. Interest rates
2. Spreads to benchmarks
3. Setting your bond price
4. Identifying investors
5. The sale process
Day Three - Session Three
1
Marketing and Pricing
Interest Rates
Day Three - Session Three
2
• We will focus on fixed rate, current interest bonds
• We’ll consider big picture items that drive interest rates:
1. Yield Curve
2. Coupons
3. Yields
4. Prices
5. Early Redemption
• We’re going to walk through how this information is used to
price bonds in the primary market
2
Marketing and Pricing
Yield Curve
Day Three - Session Three
3
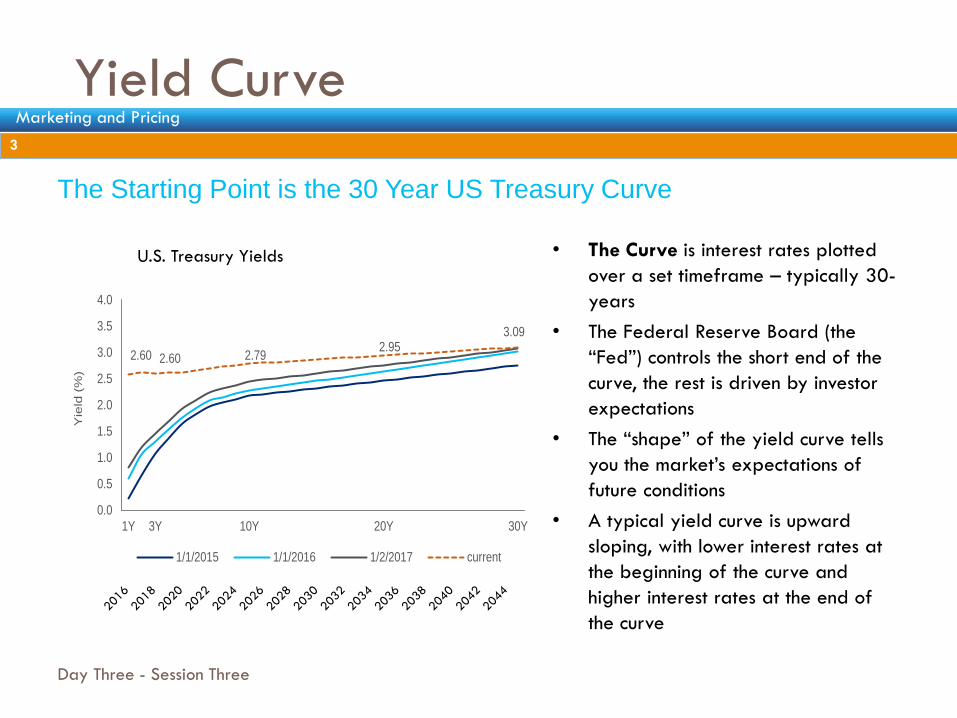
The Starting Point is the 30 Year US Treasury Curve
0.00%
0.50%
1.00%
1.50%
2.00%
2.50%
3.00%
3.50%
US Treasury Yield Curve
2.60 2.60 2.79 2.95
3.09
0.0
0.5
1.0
1.5
2.0
2.5
3.0
3.5
4.0
1Y 3Y 10Y 20Y 30Y
Yie
ld (
%)
1/1/2015 1/1/2016 1/2/2017 current
• The Curve is interest rates plotted
over a set timeframe – typically 30-
years
• The Federal Reserve Board (the
“Fed”) controls the short end of the
curve, the rest is driven by investor
expectations
• The “shape” of the yield curve tells
you the market’s expectations of
future conditions
• A typical yield curve is upward
sloping, with lower interest rates at
the beginning of the curve and
higher interest rates at the end of
the curve
3
Marketing and Pricing
U.S. Treasury Yields

Municipal Market Data (MMD) Yield Curve
Day Three - Session Three
4
The Thomson Reuters MMD AAA Curve is an index of AAA rated general obligation
bonds that acts as a proxy for treasuries in the tax-exempt market
• The municipal market benchmark is MMD, a tax exempt yield curve which translates muni
yields into a percentage of Treasuries
• It’s an opinion of value on which municipal new issues can be priced and compared
• Published each afternoon, subscription based
4
Marketing and Pricing
1. Thomson Reuters and Bloomberg, rates as of January 18, 2019.
AAA G.O. MMD Yields (June 1, 1986 – January 18, 2019)
1.0
2.0
3.0
4.0
5.0
6.0
7.0
8.0
9.0
1986 1991 1995 2000 2005 2009 2014 2019
MM
D Y
ield
(%
)
10 Year 20 Year 30 Year
MMD to Treasury Ratio
Day Three - Session Three
5
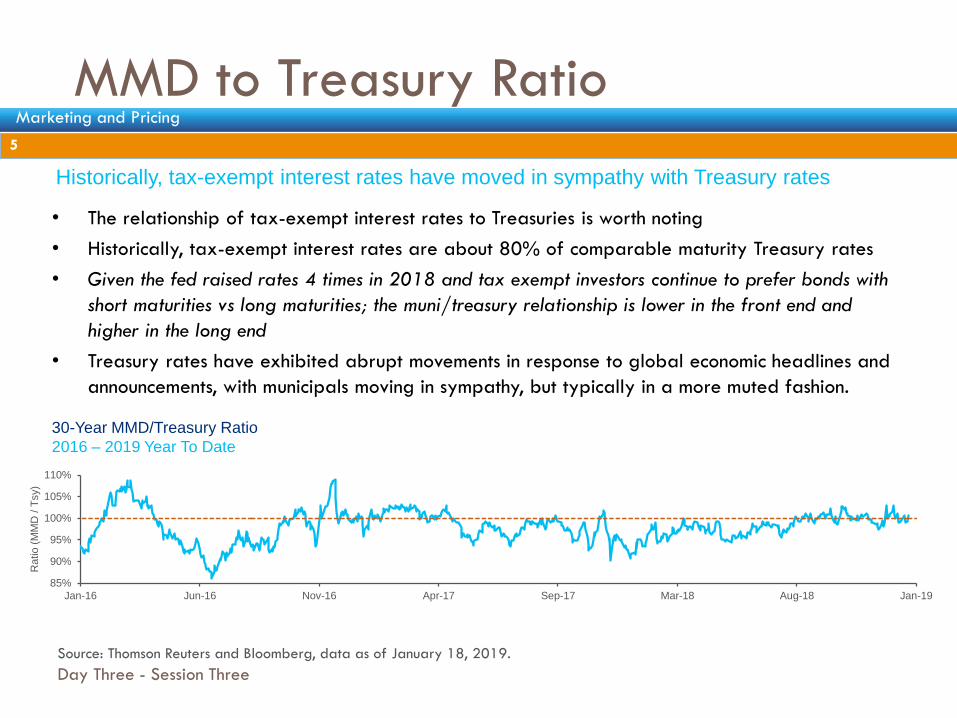
Historically, tax-exempt interest rates have moved in sympathy with Treasury rates
• The relationship of tax-exempt interest rates to Treasuries is worth noting
• Historically, tax-exempt interest rates are about 80% of comparable maturity Treasury rates
• Given the fed raised rates 4 times in 2018 and tax exempt investors continue to prefer bonds with
short maturities vs long maturities; the muni/treasury relationship is lower in the front end and
higher in the long end
• Treasury rates have exhibited abrupt movements in response to global economic headlines and
announcements, with municipals moving in sympathy, but typically in a more muted fashion.
30-Year MMD/Treasury Ratio
2016 – 2019 Year To Date
5
Marketing and Pricing
85%
90%
95%
100%
105%
110%
Jan-16 Jun-16 Nov-16 Apr-17 Sep-17 Mar-18 Aug-18 Jan-19
Ratio
(M
MD
/ T
sy)
Source: Thomson Reuters and Bloomberg, data as of January 18, 2019.
Current Market Context
Day Three - Session Three
6
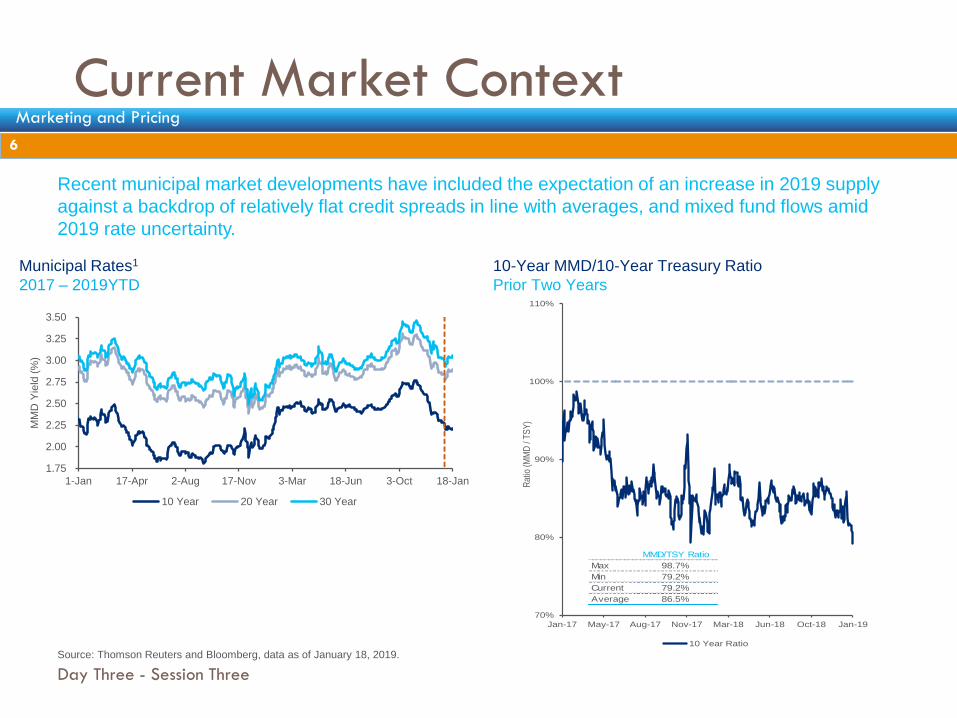
Recent municipal market developments have included the expectation of an increase in 2019 supply
against a backdrop of relatively flat credit spreads in line with averages, and mixed fund flows amid
2019 rate uncertainty.
6
Marketing and Pricing
1.75
2.00
2.25
2.50
2.75
3.00
3.25
3.50
1-Jan 17-Apr 2-Aug 17-Nov 3-Mar 18-Jun 3-Oct 18-Jan
MM
D Y
ield
(%
)
10 Year 20 Year 30 Year
Municipal Rates1
2017 – 2019YTD
70%
80%
90%
100%
110%
Jan-17 May-17 Aug-17 Nov-17 Mar-18 Jun-18 Oct-18 Jan-19
Rat
io (
MM
D /
TS
Y)
10 Year Ratio
MMD/TSY Ratio
Max 98.7%
Min 79.2%
Current 79.2%
Average 86.5%
10-Year MMD/10-Year Treasury Ratio
Prior Two Years
Source: Thomson Reuters and Bloomberg, data as of January 18, 2019.
Factors Influencing Treasury and Tax Exempt Yields
Day Three - Session Three
7
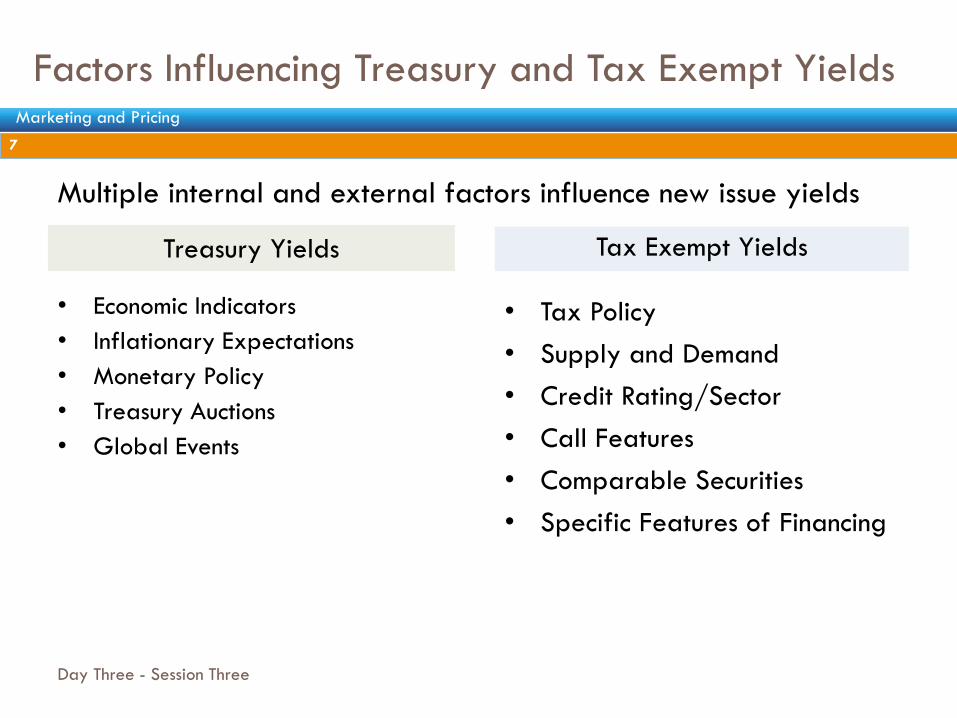
Multiple internal and external factors influence new issue yields
Tax Exempt Yields Treasury Yields
• Tax Policy
• Supply and Demand
• Credit Rating/Sector
• Call Features
• Comparable Securities
• Specific Features of Financing
• Economic Indicators
• Inflationary Expectations
• Monetary Policy
• Treasury Auctions
• Global Events
7
Marketing and Pricing
1.8
2.2
2.6
3
3.4
3.8
4.2
(2.0)
(1.5)
(1.0)
(0.5)
0.0
0.5
1.0
Jan-14 May-14 Oct-14 Feb-15 Jul-15 Dec-15 Apr-16 Sep-16 Jan-17 Jun-17 Nov-17 Mar-18 Aug-18 Dec-18
MM
D Y
ield
(%)
Munic
ipal B
ond F
und F
low
s($
billions)
Fund Flows 30 Year MMD
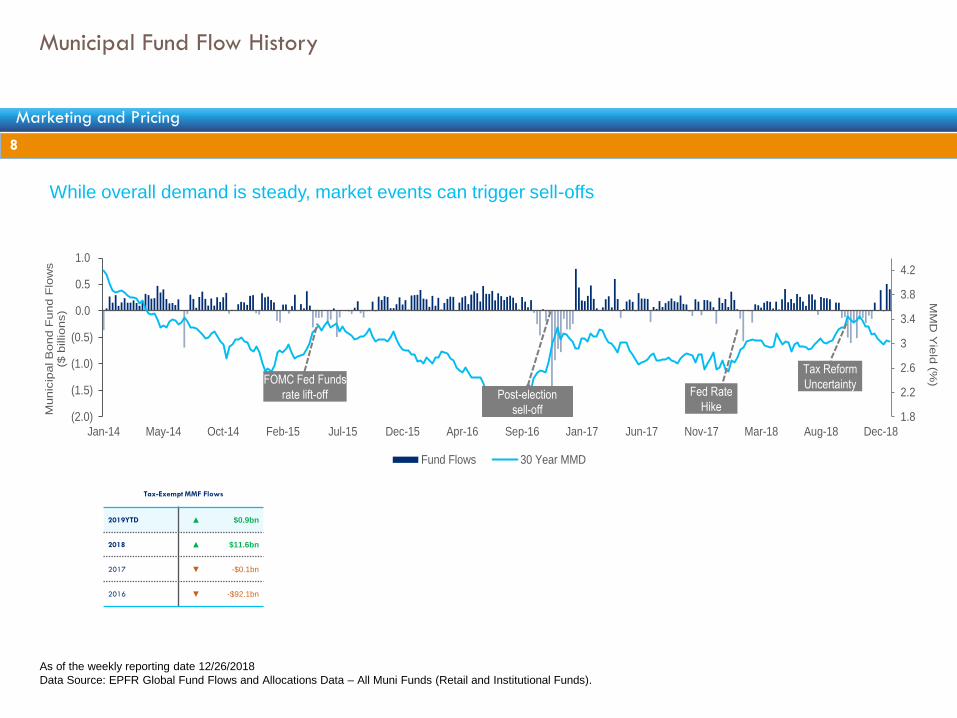
Municipal Fund Flow History
As of the weekly reporting date 12/26/2018
Data Source: EPFR Global Fund Flows and Allocations Data – All Muni Funds (Retail and Institutional Funds).
FOMC Fed Funds
rate lift-off Post-election
sell-off
Tax Reform
Uncertainty Fed Rate
Hike
8
Marketing and Pricing
Tax-Exempt MMF Flows
2019YTD ▲ $0.9bn
2018 ▲ $11.6bn
2017 ▼ -$0.1bn
2016 ▼ -$92.1bn
While overall demand is steady, market events can trigger sell-offs
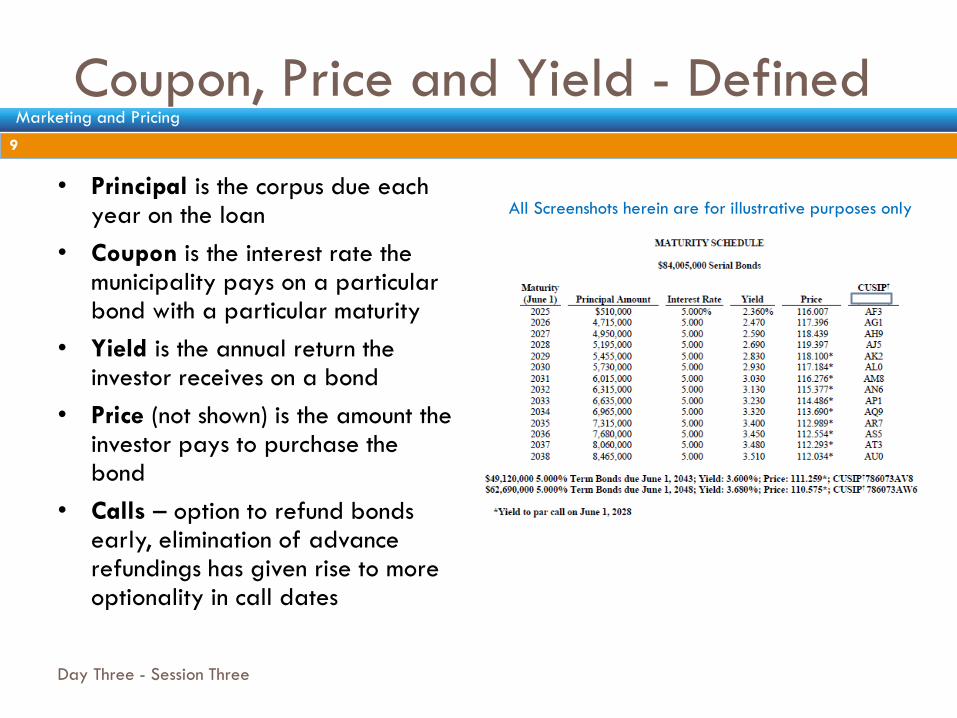
Coupon, Price and Yield - Defined
Day Three - Session Three
9
• Principal is the corpus due each year on the loan
• Coupon is the interest rate the municipality pays on a particular bond with a particular maturity
• Yield is the annual return the investor receives on a bond
• Price (not shown) is the amount the investor pays to purchase the bond
• Calls – option to refund bonds early, elimination of advance refundings has given rise to more optionality in call dates
9
Marketing and Pricing
All Screenshots herein are for illustrative purposes only

Coupon, Price and Yield - Impact
Day Three - Session Three
10
premium bond
par bond
discount bond
Examples:
Maturity Principal Coupon Yield Price
2026 $215,000 4.000% 2.590% 113.444%
2027 $225,000 3.000% 3.000% 100.000%
2028 $230,000 3.000% 3.044% 99.500%
Price X Principal = Amount Investor Pays and Amount Municipality Receives
Examples:
Maturity Principal Price Dollar Price
2026 $215,000 113.444% $243,904.60
2027 $225,000 100.000% $225,000.00
2028 $230,000 99.500% $228,850.00
To a large degree,
investor demand will
determine how a
particular financing is
couponed
10
Marketing and Pricing
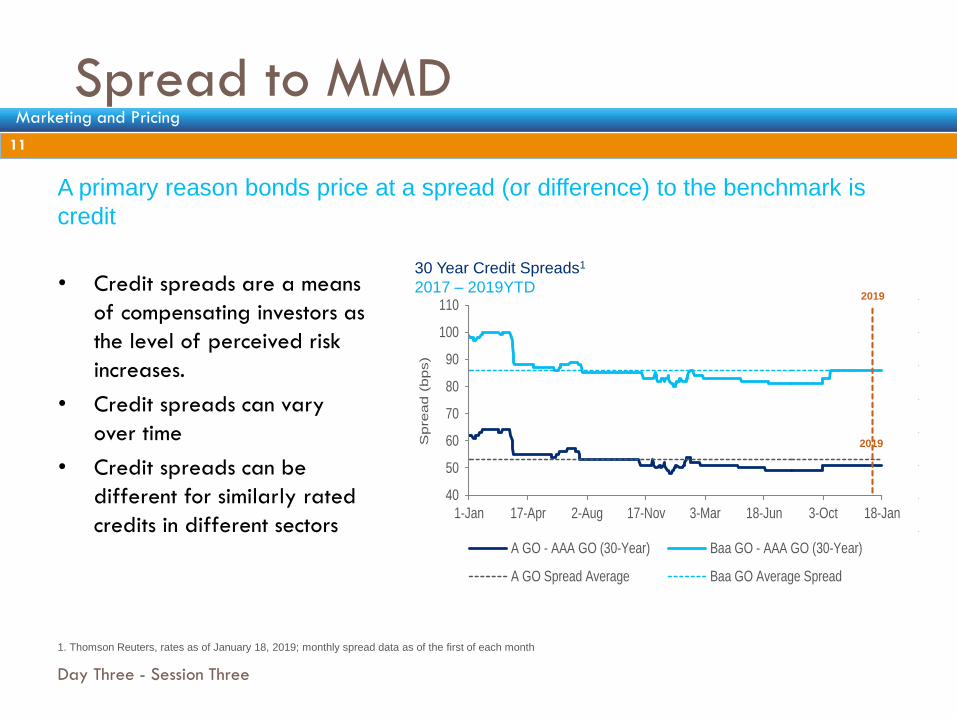
Spread to MMD
Day Three - Session Three
11
A primary reason bonds price at a spread (or difference) to the benchmark is
credit
• Credit spreads are a means
of compensating investors as
the level of perceived risk
increases.
• Credit spreads can vary
over time
• Credit spreads can be
different for similarly rated
credits in different sectors
0.00%
0.50%
1.00%
1.50%
2.00%
2.50%
3.00%
3.50%
AAA AA A BBB
40
50
60
70
80
90
100
110
1-Jan 17-Apr 2-Aug 17-Nov 3-Mar 18-Jun 3-Oct 18-Jan
Spre
ad (
bps)
A GO - AAA GO (30-Year) Baa GO - AAA GO (30-Year)
A GO Spread Average Baa GO Average Spread
30 Year Credit Spreads1
2017 – 2019YTD
2019
2019
11
Marketing and Pricing
1. Thomson Reuters, rates as of January 18, 2019; monthly spread data as of the first of each month
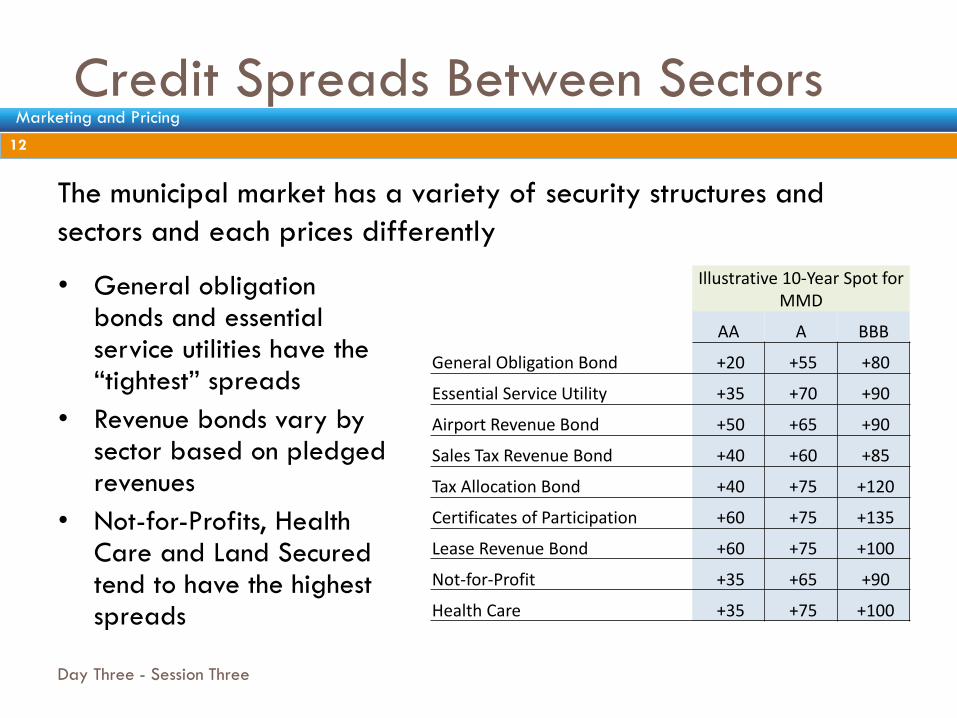
Credit Spreads Between Sectors
Day Three - Session Three
12
The municipal market has a variety of security structures and
sectors and each prices differently
• General obligation bonds and essential service utilities have the “tightest” spreads
• Revenue bonds vary by sector based on pledged revenues
• Not-for-Profits, Health Care and Land Secured tend to have the highest spreads
Illustrative 10-Year Spot for MMD
AA A BBB
General Obligation Bond +20 +55 +80
Essential Service Utility +35 +70 +90
Airport Revenue Bond +50 +65 +90
Sales Tax Revenue Bond +40 +60 +85
Tax Allocation Bond +40 +75 +120
Certificates of Participation +60 +75 +135
Lease Revenue Bond +60 +75 +100
Not-for-Profit +35 +65 +90
Health Care +35 +75 +100
12
Marketing and Pricing
Comparables 13
• A “comparable” is a similarly rated, often similarly secured
transaction that has been recently priced in the primary market
• Due to scarcity and granularity in the municipal market, it is
difficult to find a “perfect” comparable, although with certain
security structures, such as general obligation bonds issued by
California school districts, one can come close
• The more comparables one can find, the better to tell the
pricing “story”
• The more “unique” a particular credit is, the more difficult it will
be to find comparable securities
13
Marketing and Pricing
Comparable 14
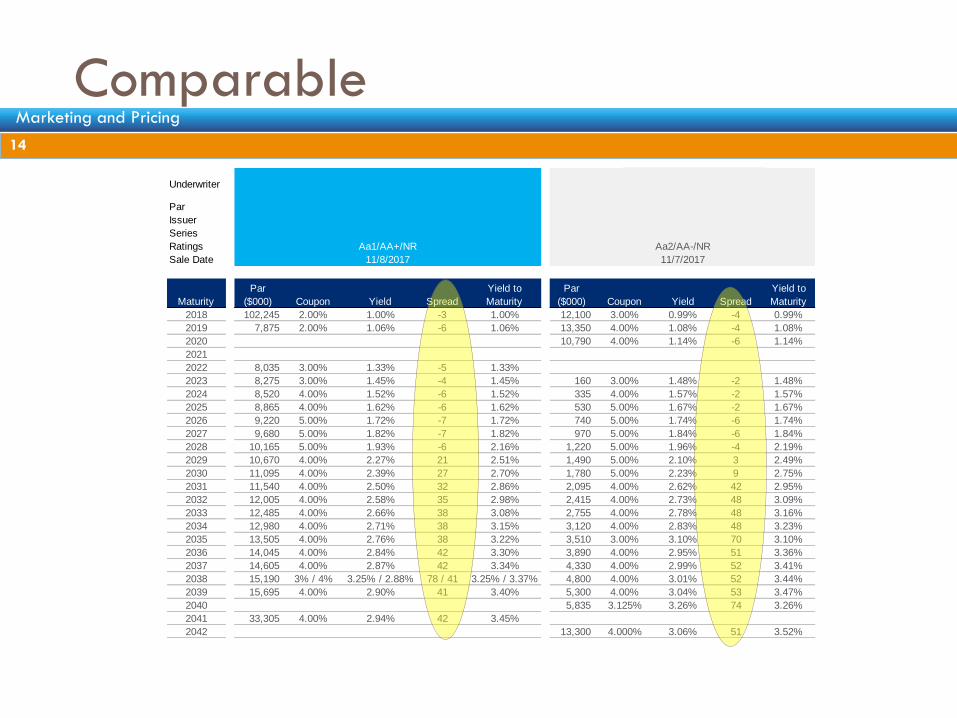
Underwriter Piper JaffrayMorgan Stanley
Par $350,000,000 $140,000,000
Issuer Los Angeles CCD Southwestern CCD Santa Barbara USD
Series 2017 Series J & A-1 Series 2017A 2017 Series A&B
Ratings Aa1/AA+/NR Aa2/AA-/NR Aa2/AA-/NR
Sale Date 11/8/2017 11/7/2017
Maturity
Par
($000) Coupon Yield Spread
Yield to
Maturity
Par
($000) Coupon Yield Spread
Yield to
Maturity
2018 102,245 2.00% 1.00% -3 1.00% 12,100 3.00% 0.99% -4 0.99%
2019 7,875 2.00% 1.06% -6 1.06% 13,350 4.00% 1.08% -4 1.08%
2020 10,790 4.00% 1.14% -6 1.14%
2021
2022 8,035 3.00% 1.33% -5 1.33%
2023 8,275 3.00% 1.45% -4 1.45% 160 3.00% 1.48% -2 1.48%
2024 8,520 4.00% 1.52% -6 1.52% 335 4.00% 1.57% -2 1.57%
2025 8,865 4.00% 1.62% -6 1.62% 530 5.00% 1.67% -2 1.67%
2026 9,220 5.00% 1.72% -7 1.72% 740 5.00% 1.74% -6 1.74%
2027 9,680 5.00% 1.82% -7 1.82% 970 5.00% 1.84% -6 1.84%
2028 10,165 5.00% 1.93% -6 2.16% 1,220 5.00% 1.96% -4 2.19%
2029 10,670 4.00% 2.27% 21 2.51% 1,490 5.00% 2.10% 3 2.49%
2030 11,095 4.00% 2.39% 27 2.70% 1,780 5.00% 2.23% 9 2.75%
2031 11,540 4.00% 2.50% 32 2.86% 2,095 4.00% 2.62% 42 2.95%
2032 12,005 4.00% 2.58% 35 2.98% 2,415 4.00% 2.73% 48 3.09%
2033 12,485 4.00% 2.66% 38 3.08% 2,755 4.00% 2.78% 48 3.16%
2034 12,980 4.00% 2.71% 38 3.15% 3,120 4.00% 2.83% 48 3.23%
2035 13,505 4.00% 2.76% 38 3.22% 3,510 3.00% 3.10% 70 3.10%
2036 14,045 4.00% 2.84% 42 3.30% 3,890 4.00% 2.95% 51 3.36%
2037 14,605 4.00% 2.87% 42 3.34% 4,330 4.00% 2.99% 52 3.41%
2038 15,190 3% / 4% 3.25% / 2.88% 78 / 41 3.25% / 3.37% 4,800 4.00% 3.01% 52 3.44%
2039 15,695 4.00% 2.90% 41 3.40% 5,300 4.00% 3.04% 53 3.47%
2040 5,835 3.125% 3.26% 74 3.26%
2041 33,305 4.00% 2.94% 42 3.45%
2042 13,300 4.000% 3.06% 51 3.52%
14
Marketing and Pricing
Pricing a Bond Issue
Day Three - Session Three
15
Recap of things covered so far…
• We covered interest rates and yield curve
• We covered coupon, price and yield
• We covered credit spreads
• We’ve covered comparables
Next we’re going to walk through the process of a negotiated
bond sale in the public markets…
15
Marketing and Pricing
What the Underwriter Considers
Day Three - Session Three
16
When pricing a transaction, the underwriter considers a variety of factors
intended to generate the most demand and best prices for the bonds
• Credit quality
• The size of the transaction and the individual maturities
• The final maturity relative to the shape of the yield curve
• Redemption features
• Yields for comparable securities
• Likely investors in the bonds
• Attractive coupon structure for investors
• Feedback from syndicate co-managers
• Other transactions in the market at the same time
16
Marketing and Pricing
Investors and Investor Classes
Day Three - Session Three
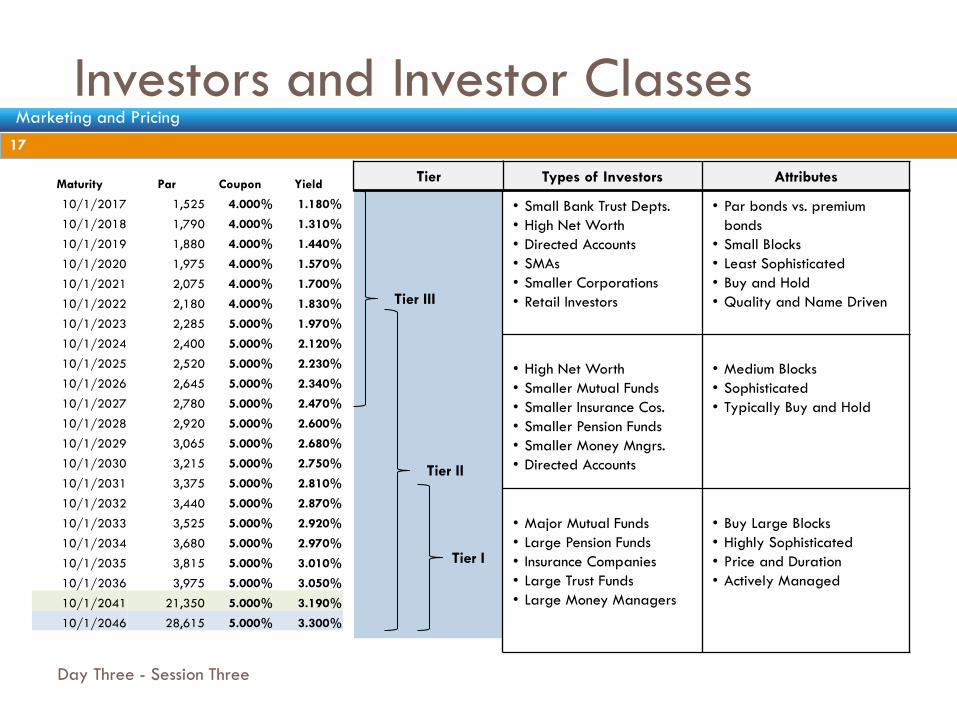
17
Types of Investors Attributes
• Small Bank Trust Depts.
• High Net Worth
• Directed Accounts
• SMAs
• Smaller Corporations
• Retail Investors
• Par bonds vs. premium
bonds
• Small Blocks
• Least Sophisticated
• Buy and Hold
• Quality and Name Driven
• High Net Worth
• Smaller Mutual Funds
• Smaller Insurance Cos.
• Smaller Pension Funds
• Smaller Money Mngrs.
• Directed Accounts
• Medium Blocks
• Sophisticated
• Typically Buy and Hold
• Major Mutual Funds
• Large Pension Funds
• Insurance Companies
• Large Trust Funds
• Large Money Managers
• Buy Large Blocks
• Highly Sophisticated
• Price and Duration
• Actively Managed
Tier
Tier III
Tier II
Tier I
Maturity Par Coupon Yield
10/1/2017 1,525 4.000% 1.180%
10/1/2018 1,790 4.000% 1.310%
10/1/2019 1,880 4.000% 1.440%
10/1/2020 1,975 4.000% 1.570%
10/1/2021 2,075 4.000% 1.700%
10/1/2022 2,180 4.000% 1.830%
10/1/2023 2,285 5.000% 1.970%
10/1/2024 2,400 5.000% 2.120%
10/1/2025 2,520 5.000% 2.230%
10/1/2026 2,645 5.000% 2.340%
10/1/2027 2,780 5.000% 2.470%
10/1/2028 2,920 5.000% 2.600%
10/1/2029 3,065 5.000% 2.680%
10/1/2030 3,215 5.000% 2.750%
10/1/2031 3,375 5.000% 2.810%
10/1/2032 3,440 5.000% 2.870%
10/1/2033 3,525 5.000% 2.920%
10/1/2034 3,680 5.000% 2.970%
10/1/2035 3,815 5.000% 3.010%
10/1/2036 3,975 5.000% 3.050%
10/1/2041 21,350 5.000% 3.190%
10/1/2046 28,615 5.000% 3.300%
17
Marketing and Pricing
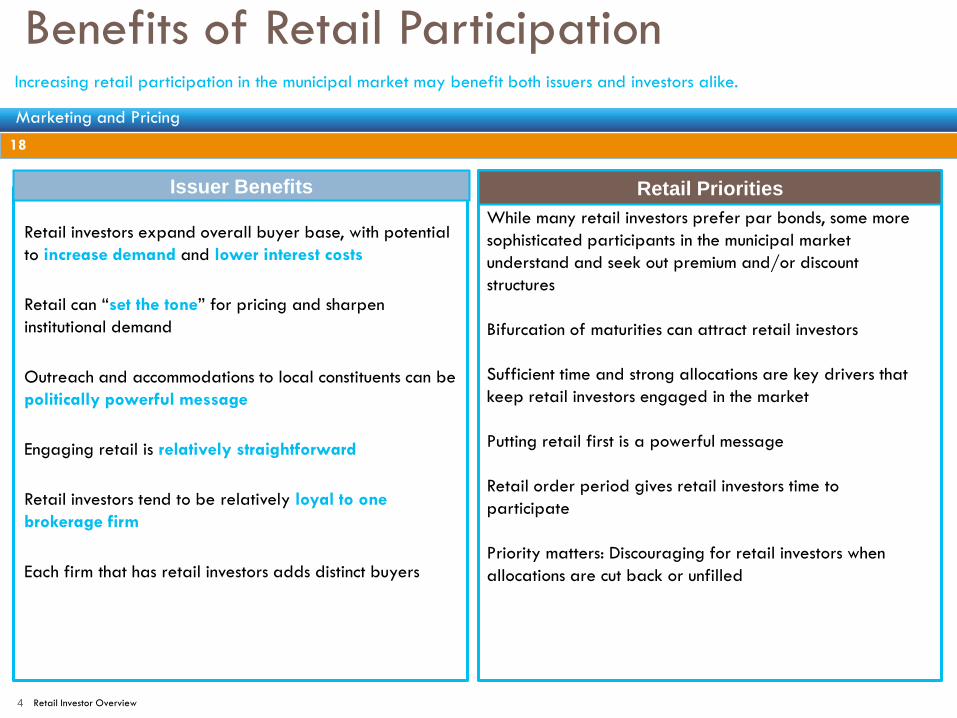
Benefits of Retail Participation
Issuer Benefits
Retail investors expand overall buyer base, with potential
to increase demand and lower interest costs
Retail can “set the tone” for pricing and sharpen
institutional demand
Outreach and accommodations to local constituents can be
politically powerful message
Engaging retail is relatively straightforward
Retail investors tend to be relatively loyal to one
brokerage firm
Each firm that has retail investors adds distinct buyers
Retail Priorities
While many retail investors prefer par bonds, some more
sophisticated participants in the municipal market
understand and seek out premium and/or discount
structures
Bifurcation of maturities can attract retail investors
Sufficient time and strong allocations are key drivers that
keep retail investors engaged in the market
Putting retail first is a powerful message
Retail order period gives retail investors time to
participate
Priority matters: Discouraging for retail investors when
allocations are cut back or unfilled
Increasing retail participation in the municipal market may benefit both issuers and investors alike.
Retail Investor Overview 4
18
Marketing and Pricing
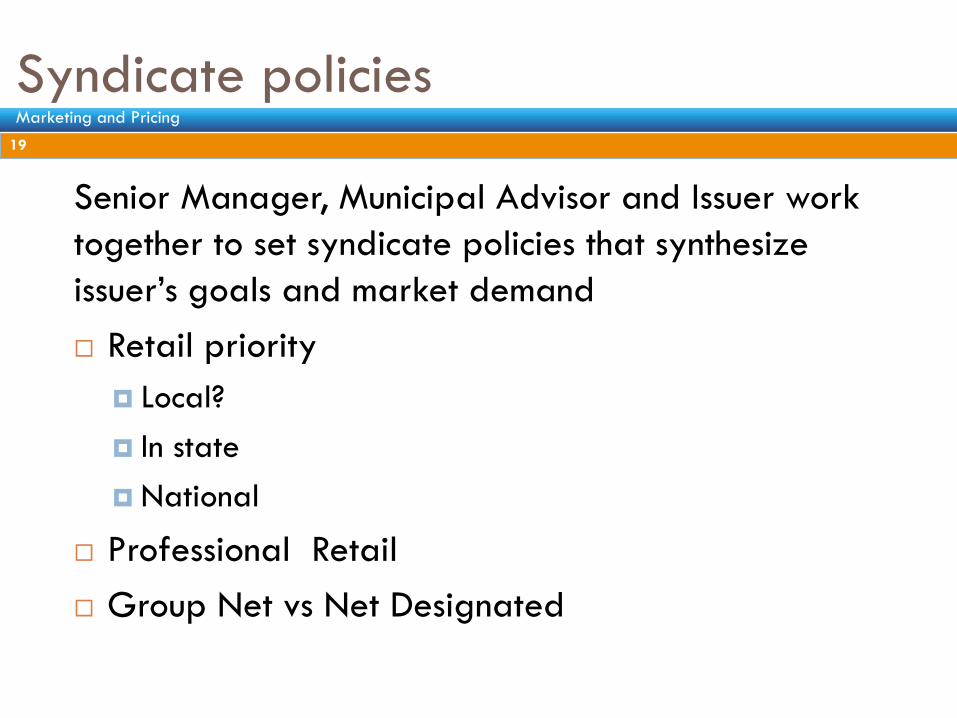
Syndicate policies 19
Senior Manager, Municipal Advisor and Issuer work
together to set syndicate policies that synthesize
issuer’s goals and market demand
Retail priority
Local?
In state
National
Professional Retail
Group Net vs Net Designated
19
Marketing and Pricing

Pre-Marketing: Structure Wire
Day Three - Session Three
20
• Three or four days prior to the
sale date, the underwriter will
put out a “structure wire”
• The primary purpose is to give
the market a sense of maturity
structure, rating and call
features
• The wire goes out electronically
to all other underwriters on the
transaction as well as investors
20
Marketing and Pricing
Retail Wire/Pre-Marketing Scale
Day Three - Session Three
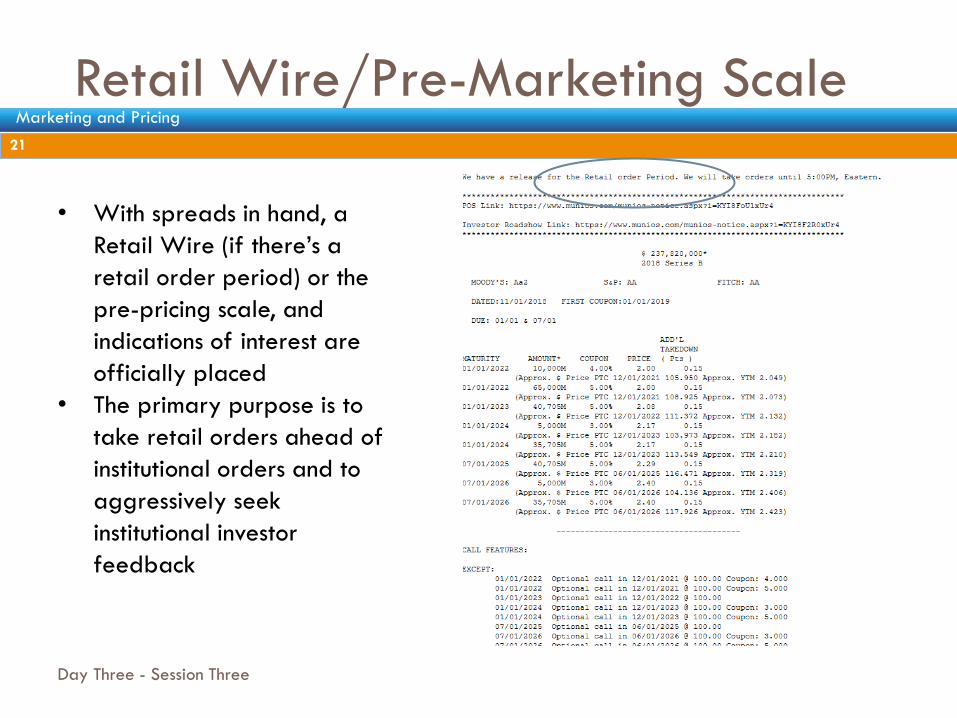
21
• With spreads in hand, a
Retail Wire (if there’s a
retail order period) or the
pre-pricing scale, and
indications of interest are
officially placed
• The primary purpose is to
take retail orders ahead of
institutional orders and to
aggressively seek
institutional investor
feedback
21
Marketing and Pricing
Preliminary Pricing Wire
Day Three - Session Three
22
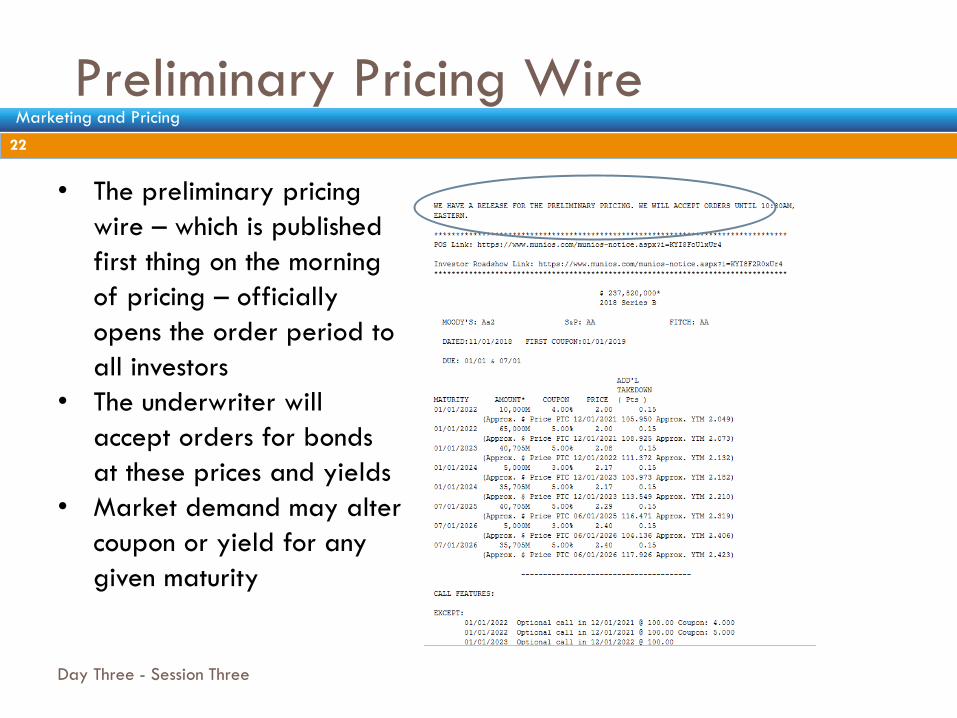
• The preliminary pricing
wire – which is published
first thing on the morning
of pricing – officially
opens the order period to
all investors
• The underwriter will
accept orders for bonds
at these prices and yields
• Market demand may alter
coupon or yield for any
given maturity
22
Marketing and Pricing
Order Monitor
Day Three - Session Three
23
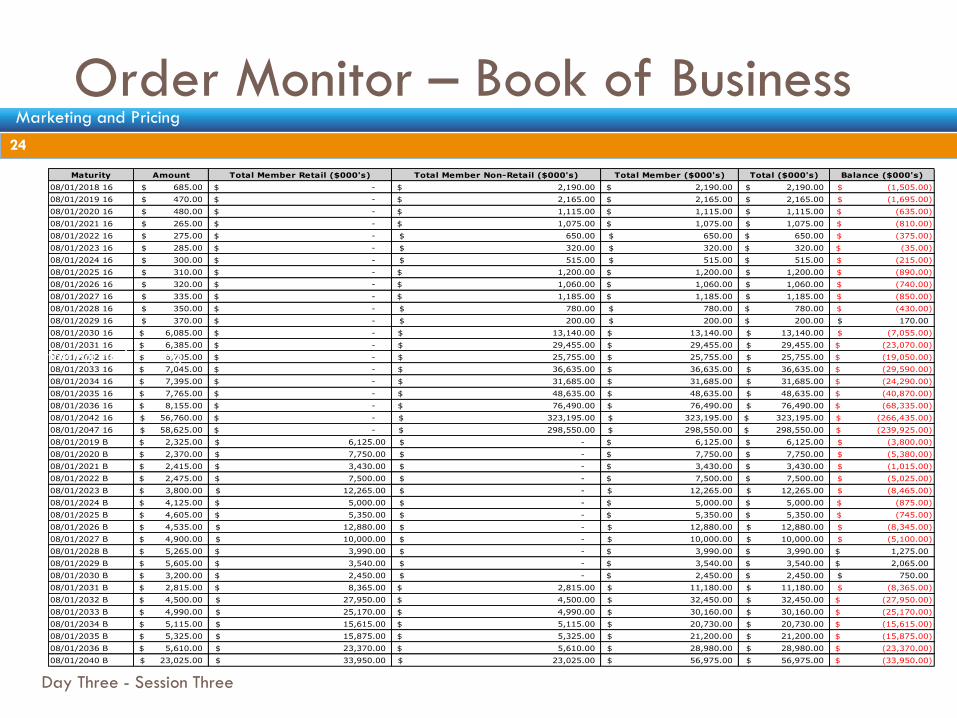
• Most underwriting firms subscribe to Ipreo, an electronic securities
platform providing a number of tools for the capital markets
• Underwriters will use Ipreo to accept and monitor orders, among
other things
• Issuers gain access to the platform on the internet through their
underwriter, allowing them and their advisors to monitor the book of
business as it’s developing throughout the pricing
23
Marketing and Pricing
Order Monitor – Book of Business
Day Three - Session Three
24
Maturity Amount Total Member Retail ($000's) Total Member Non-Retail ($000's) Total Member ($000's) Total ($000's) Balance ($000's)
08/01/2018 16 685.00$ -$ 2,190.00$ 2,190.00$ 2,190.00$ (1,505.00)$
08/01/2019 16 470.00$ -$ 2,165.00$ 2,165.00$ 2,165.00$ (1,695.00)$
08/01/2020 16 480.00$ -$ 1,115.00$ 1,115.00$ 1,115.00$ (635.00)$
08/01/2021 16 265.00$ -$ 1,075.00$ 1,075.00$ 1,075.00$ (810.00)$
08/01/2022 16 275.00$ -$ 650.00$ 650.00$ 650.00$ (375.00)$
08/01/2023 16 285.00$ -$ 320.00$ 320.00$ 320.00$ (35.00)$
08/01/2024 16 300.00$ -$ 515.00$ 515.00$ 515.00$ (215.00)$
08/01/2025 16 310.00$ -$ 1,200.00$ 1,200.00$ 1,200.00$ (890.00)$
08/01/2026 16 320.00$ -$ 1,060.00$ 1,060.00$ 1,060.00$ (740.00)$
08/01/2027 16 335.00$ -$ 1,185.00$ 1,185.00$ 1,185.00$ (850.00)$
08/01/2028 16 350.00$ -$ 780.00$ 780.00$ 780.00$ (430.00)$
08/01/2029 16 370.00$ -$ 200.00$ 200.00$ 200.00$ 170.00$
08/01/2030 16 6,085.00$ -$ 13,140.00$ 13,140.00$ 13,140.00$ (7,055.00)$
08/01/2031 16 6,385.00$ -$ 29,455.00$ 29,455.00$ 29,455.00$ (23,070.00)$
08/01/2032 16 6,705.00$ -$ 25,755.00$ 25,755.00$ 25,755.00$ (19,050.00)$
08/01/2033 16 7,045.00$ -$ 36,635.00$ 36,635.00$ 36,635.00$ (29,590.00)$
08/01/2034 16 7,395.00$ -$ 31,685.00$ 31,685.00$ 31,685.00$ (24,290.00)$
08/01/2035 16 7,765.00$ -$ 48,635.00$ 48,635.00$ 48,635.00$ (40,870.00)$
08/01/2036 16 8,155.00$ -$ 76,490.00$ 76,490.00$ 76,490.00$ (68,335.00)$
08/01/2042 16 56,760.00$ -$ 323,195.00$ 323,195.00$ 323,195.00$ (266,435.00)$
08/01/2047 16 58,625.00$ -$ 298,550.00$ 298,550.00$ 298,550.00$ (239,925.00)$
08/01/2019 B 2,325.00$ 6,125.00$ -$ 6,125.00$ 6,125.00$ (3,800.00)$
08/01/2020 B 2,370.00$ 7,750.00$ -$ 7,750.00$ 7,750.00$ (5,380.00)$
08/01/2021 B 2,415.00$ 3,430.00$ -$ 3,430.00$ 3,430.00$ (1,015.00)$
08/01/2022 B 2,475.00$ 7,500.00$ -$ 7,500.00$ 7,500.00$ (5,025.00)$
08/01/2023 B 3,800.00$ 12,265.00$ -$ 12,265.00$ 12,265.00$ (8,465.00)$
08/01/2024 B 4,125.00$ 5,000.00$ -$ 5,000.00$ 5,000.00$ (875.00)$
08/01/2025 B 4,605.00$ 5,350.00$ -$ 5,350.00$ 5,350.00$ (745.00)$
08/01/2026 B 4,535.00$ 12,880.00$ -$ 12,880.00$ 12,880.00$ (8,345.00)$
08/01/2027 B 4,900.00$ 10,000.00$ -$ 10,000.00$ 10,000.00$ (5,100.00)$
08/01/2028 B 5,265.00$ 3,990.00$ -$ 3,990.00$ 3,990.00$ 1,275.00$
08/01/2029 B 5,605.00$ 3,540.00$ -$ 3,540.00$ 3,540.00$ 2,065.00$
08/01/2030 B 3,200.00$ 2,450.00$ -$ 2,450.00$ 2,450.00$ 750.00$
08/01/2031 B 2,815.00$ 8,365.00$ 2,815.00$ 11,180.00$ 11,180.00$ (8,365.00)$
08/01/2032 B 4,500.00$ 27,950.00$ 4,500.00$ 32,450.00$ 32,450.00$ (27,950.00)$
08/01/2033 B 4,990.00$ 25,170.00$ 4,990.00$ 30,160.00$ 30,160.00$ (25,170.00)$
08/01/2034 B 5,115.00$ 15,615.00$ 5,115.00$ 20,730.00$ 20,730.00$ (15,615.00)$
08/01/2035 B 5,325.00$ 15,875.00$ 5,325.00$ 21,200.00$ 21,200.00$ (15,875.00)$
08/01/2036 B 5,610.00$ 23,370.00$ 5,610.00$ 28,980.00$ 28,980.00$ (23,370.00)$
08/01/2040 B 23,025.00$ 33,950.00$ 23,025.00$ 56,975.00$ 56,975.00$ (33,950.00)$
Marketing and Pricing
24
Marketing and Pricing
Price Adjustments Before Award
Day Three - Session Three
25
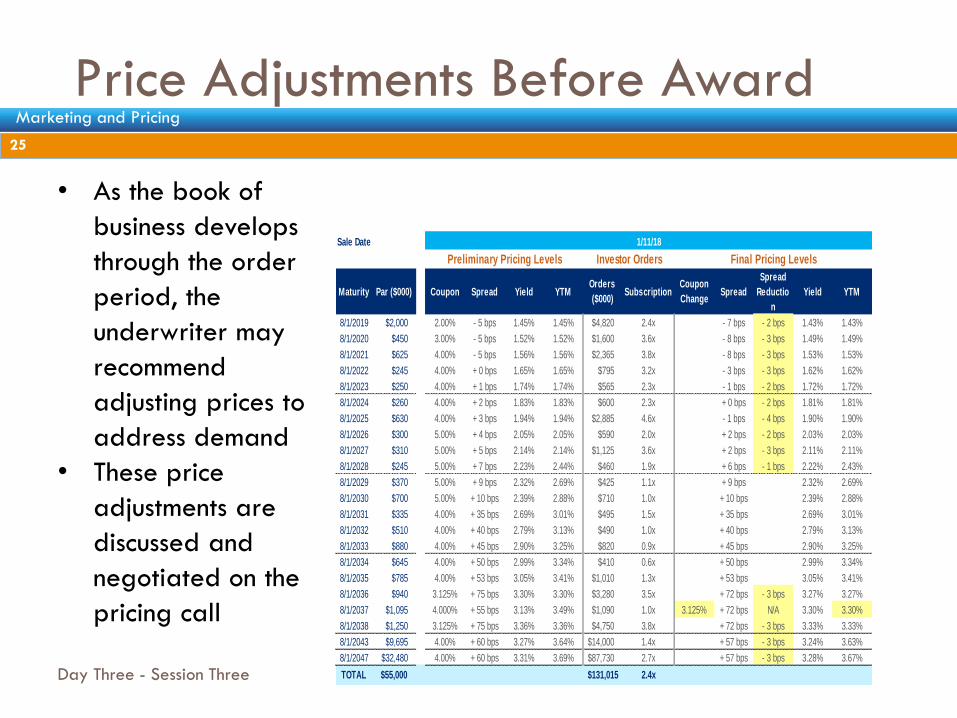
• As the book of
business develops
through the order
period, the
underwriter may
recommend
adjusting prices to
address demand
• These price
adjustments are
discussed and
negotiated on the
pricing call
Senior Manager
Par Amount $55,000,000
Issuer Escondido Union School District
Series Election of 2014, General Obligation Bonds, Series B
Ratings Aa2/AAA
Sale Date 1/11/18
Preliminary Pricing Levels Investor Orders Final Pricing Levels
Maturity Par ($000) Coupon Spread Yield YTMOrders
($000)Subscription
Coupon
ChangeSpread
Spread
Reductio
n
Yield YTM
8/1/2019 $2,000 2.00% - 5 bps 1.45% 1.45% $4,820 2.4x - 7 bps - 2 bps 1.43% 1.43%
8/1/2020 $450 3.00% - 5 bps 1.52% 1.52% $1,600 3.6x - 8 bps - 3 bps 1.49% 1.49%
8/1/2021 $625 4.00% - 5 bps 1.56% 1.56% $2,365 3.8x - 8 bps - 3 bps 1.53% 1.53%
8/1/2022 $245 4.00% + 0 bps 1.65% 1.65% $795 3.2x - 3 bps - 3 bps 1.62% 1.62%
8/1/2023 $250 4.00% + 1 bps 1.74% 1.74% $565 2.3x - 1 bps - 2 bps 1.72% 1.72%
8/1/2024 $260 4.00% + 2 bps 1.83% 1.83% $600 2.3x + 0 bps - 2 bps 1.81% 1.81%
8/1/2025 $630 4.00% + 3 bps 1.94% 1.94% $2,885 4.6x - 1 bps - 4 bps 1.90% 1.90%
8/1/2026 $300 5.00% + 4 bps 2.05% 2.05% $590 2.0x + 2 bps - 2 bps 2.03% 2.03%
8/1/2027 $310 5.00% + 5 bps 2.14% 2.14% $1,125 3.6x + 2 bps - 3 bps 2.11% 2.11%
8/1/2028 $245 5.00% + 7 bps 2.23% 2.44% $460 1.9x + 6 bps - 1 bps 2.22% 2.43%
8/1/2029 $370 5.00% + 9 bps 2.32% 2.69% $425 1.1x + 9 bps 2.32% 2.69%
8/1/2030 $700 5.00% + 10 bps 2.39% 2.88% $710 1.0x + 10 bps 2.39% 2.88%
8/1/2031 $335 4.00% + 35 bps 2.69% 3.01% $495 1.5x + 35 bps 2.69% 3.01%
8/1/2032 $510 4.00% + 40 bps 2.79% 3.13% $490 1.0x + 40 bps 2.79% 3.13%
8/1/2033 $880 4.00% + 45 bps 2.90% 3.25% $820 0.9x + 45 bps 2.90% 3.25%
8/1/2034 $645 4.00% + 50 bps 2.99% 3.34% $410 0.6x + 50 bps 2.99% 3.34%
8/1/2035 $785 4.00% + 53 bps 3.05% 3.41% $1,010 1.3x + 53 bps 3.05% 3.41%
8/1/2036 $940 3.125% + 75 bps 3.30% 3.30% $3,280 3.5x + 72 bps - 3 bps 3.27% 3.27%
8/1/2037 $1,095 4.000% + 55 bps 3.13% 3.49% $1,090 1.0x 3.125% + 72 bps N/A 3.30% 3.30%
8/1/2038 $1,250 3.125% + 75 bps 3.36% 3.36% $4,750 3.8x + 72 bps - 3 bps 3.33% 3.33%
8/1/2043 $9,695 4.00% + 60 bps 3.27% 3.64% $14,000 1.4x + 57 bps - 3 bps 3.24% 3.63%
8/1/2047 $32,480 4.00% + 60 bps 3.31% 3.69% $87,730 2.7x + 57 bps - 3 bps 3.28% 3.67%
TOTAL $55,000 $131,015 2.4x
25
Marketing and Pricing
Final/Commitment Wire
Day Three - Session Three
26
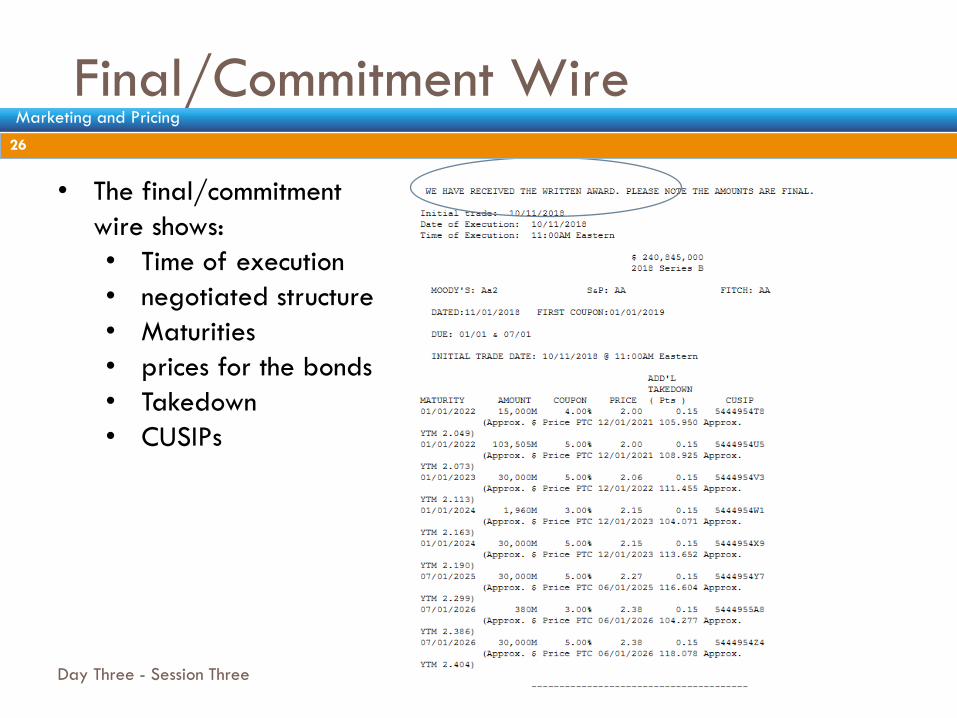
• The final/commitment
wire shows:
• Time of execution
• negotiated structure
• Maturities
• prices for the bonds
• Takedown
• CUSIPs
26
Marketing and Pricing
Conclusion
Day Three - Session Three
27
• We covered a lot of ground
Yield Curves
Coupons
Yields
Prices
Factors Influencing Prices
Credit Spreads
MMD and Comparables
Marketing Process
Order Books and Investors
27
Marketing and Pricing

Investment Management Capital Markets Consulting Visit us on the Web at mesirowfinancial.com
David Officer
212-530-7654
Citi
Citigroup Public Finance Department
Victor Andrade, Director, Head of California Education Finance(213) 486-7144
Citigroup is providing the information contained in this document for discussion purposes only in anticipation of serving as underwriter.
The primary role of Citigroup, as an underwriter, is to purchase securities, for resale to investors, in an arm’s-length commercial
transaction between the Issuer and Citigroup. Citigroup has financial and other interests that differ from those of the Issuer. Citigroup is
not acting as a municipal advisor, financial advisor or fiduciary to the Issuer or any other person or entity. The information provided is not
intended to be and should not be construed as “advice” within the meaning of Section 15B of the Securities Exchange Act of 1934. The
Issuer should consult with its own financial and/or municipal, legal, accounting, tax and other advisors, as applicable, to the extent it
deems appropriate. The Issuer should consider whether to engage an advisor to act in a fiduciary capacity on its behalf in connection
with this transaction.
Citigroup Inc.
Headquarters: New York, New York
Founded: 1812
Employees: 209,000
Customers: 200 million
Countries: 160
Assets: $1.8 trillion
Type: Public (NYSE: C)
CITIGROUP GLOBAL MARKETS INC.