Embed Size (px)
Citation preview
MPRAMunich Personal RePEc Archive
Measurement of passengers servicequality in public transportation: servqualanalysis
K S Muthupandian and Dr. C Vijayakumar
The Institute of Cost and Works Accountants of India
12. January 2012
Online at https://mpra.ub.uni-muenchen.de/38584/MPRA Paper No. 38584, posted 5. May 2012 14:43 UTC
1
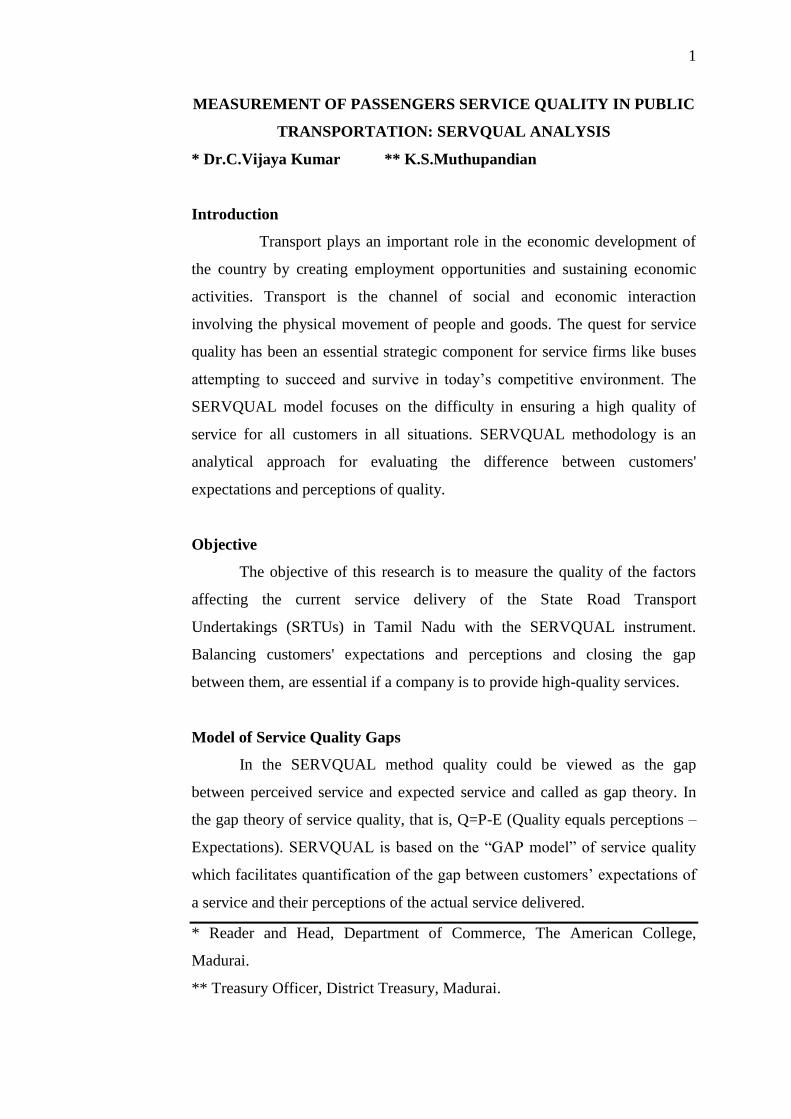
MEASUREMENT OF PASSENGERS SERVICE QUALITY IN PUBLIC
TRANSPORTATION: SERVQUAL ANALYSIS
* Dr.C.Vijaya Kumar ** K.S.Muthupandian
Introduction
Transport plays an important role in the economic development of
the country by creating employment opportunities and sustaining economic
activities. Transport is the channel of social and economic interaction
involving the physical movement of people and goods. The quest for service
quality has been an essential strategic component for service firms like buses
attempting to succeed and survive in today’s competitive environment. The
SERVQUAL model focuses on the difficulty in ensuring a high quality of
service for all customers in all situations. SERVQUAL methodology is an
analytical approach for evaluating the difference between customers'
expectations and perceptions of quality.
Objective
The objective of this research is to measure the quality of the factors
affecting the current service delivery of the State Road Transport
Undertakings (SRTUs) in Tamil Nadu with the SERVQUAL instrument.
Balancing customers' expectations and perceptions and closing the gap
between them, are essential if a company is to provide high-quality services.
Model of Service Quality Gaps
In the SERVQUAL method quality could be viewed as the gap
between perceived service and expected service and called as gap theory. In
the gap theory of service quality, that is, Q=P-E (Quality equals perceptions –
Expectations). SERVQUAL is based on the “GAP model” of service quality
which facilitates quantification of the gap between customers’ expectations of
a service and their perceptions of the actual service delivered.
* Reader and Head, Department of Commerce, The American College,
Madurai.
** Treasury Officer, District Treasury, Madurai.
2
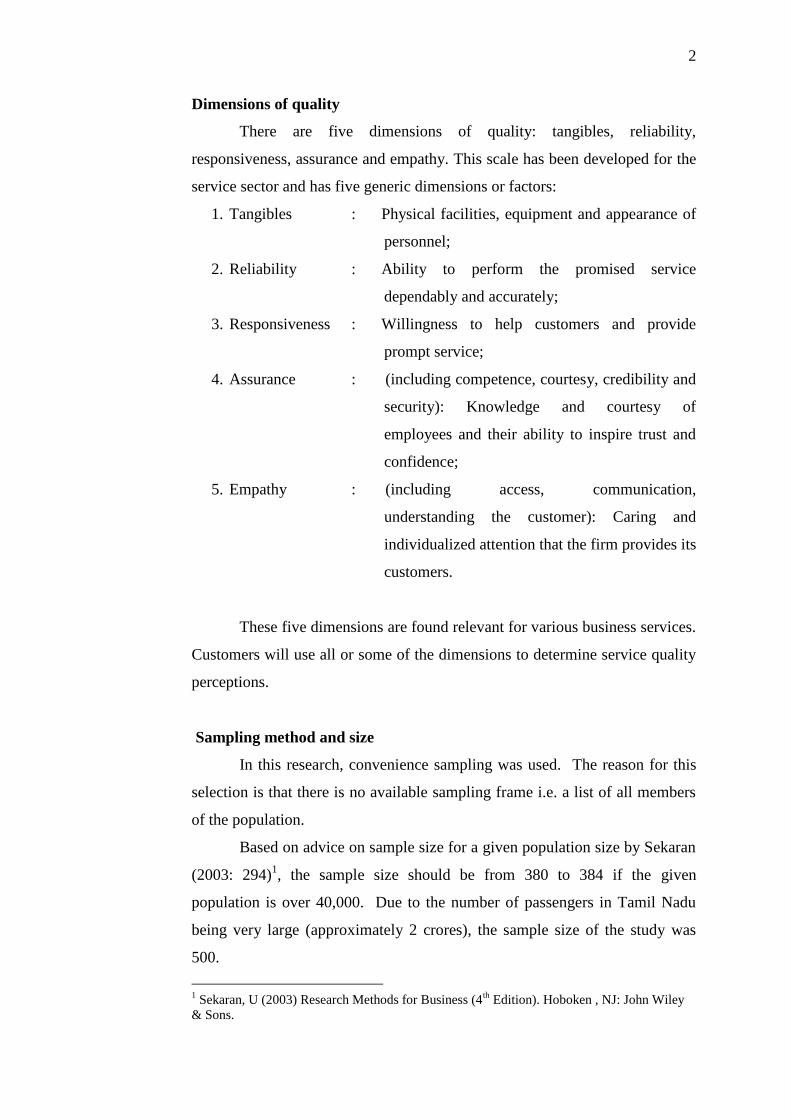
Dimensions of quality
There are five dimensions of quality: tangibles, reliability,
responsiveness, assurance and empathy. This scale has been developed for the
service sector and has five generic dimensions or factors:
1. Tangibles : Physical facilities, equipment and appearance of
personnel;
2. Reliability : Ability to perform the promised service
dependably and accurately;
3. Responsiveness : Willingness to help customers and provide
prompt service;
4. Assurance : (including competence, courtesy, credibility and
security): Knowledge and courtesy of
employees and their ability to inspire trust and
confidence;
5. Empathy : (including access, communication,
understanding the customer): Caring and
individualized attention that the firm provides its
customers.
These five dimensions are found relevant for various business services.
Customers will use all or some of the dimensions to determine service quality
perceptions.
Sampling method and size
In this research, convenience sampling was used. The reason for this
selection is that there is no available sampling frame i.e. a list of all members
of the population.
Based on advice on sample size for a given population size by Sekaran
(2003: 294)1, the sample size should be from 380 to 384 if the given
population is over 40,000. Due to the number of passengers in Tamil Nadu
being very large (approximately 2 crores), the sample size of the study was
500.
1 Sekaran, U (2003) Research Methods for Business (4
th Edition). Hoboken , NJ: John Wiley
& Sons.
3
Data collection
All the data were collected from 500 passengers who alighted and
entered in buses of SRTUs at a specific place, the “Mattuthavani Integrated
Bus Stand” in Madurai City, Tamil Nadu. This venue is suitable for selection
as passengers from other towns and cities enter and leave at this place. Data
have been collected from January 1, 2011 to February 27, 2011. These
collected data were analysed to identify the critical factors in the service
delivery process of the SRTUs in Tamil Nadu.
Questionnaire
A questionnaire was used in this research. It consists of fifty questions
from the modified version of SERVQUAL (Zeithaml and Bitner, 2000: 41)2
instrument (the same 25 questions were used to assess expectations and
perceptions).
The questionnaire was divided into three parts. The first part of the
questionnaire consisted of two demographic questions (Gender and Age). The
second part was designed to measure the respondents’ expectations regarding
service quality in the SRTUs in Tamil Nadu. The third part of the
questionnaire was designed to examine the respondents’ perceptions of service
quality actually provided by SRTUs in Tamil Nadu.
The five-point Likert scale is the most widely used form of scaled
items where the respondent chooses a point on a scale that best represents
his/her view. Scoring for the scale was follows: (1) strongly disagree, (2)
disagree, (3) neutral, (4) agree and (5) strongly agree.
By comparing each value difference between all 25 expectations and
perceptions, the level of quality can be concluded. For example, if the
perception value is higher than the expectation value, it can be concluded that
the service is satisfactory or ideal. However, if the expectation value is lower
than the perception value, the service quality level can be regarded as
unsatisfactory or even unacceptable.
2 Zeithaml, Valarie A. and Mary Jo Bitner (2000), "Services Marketing," New York: McGraw
Hill, second edition. ISBN 0-07-1169946
4
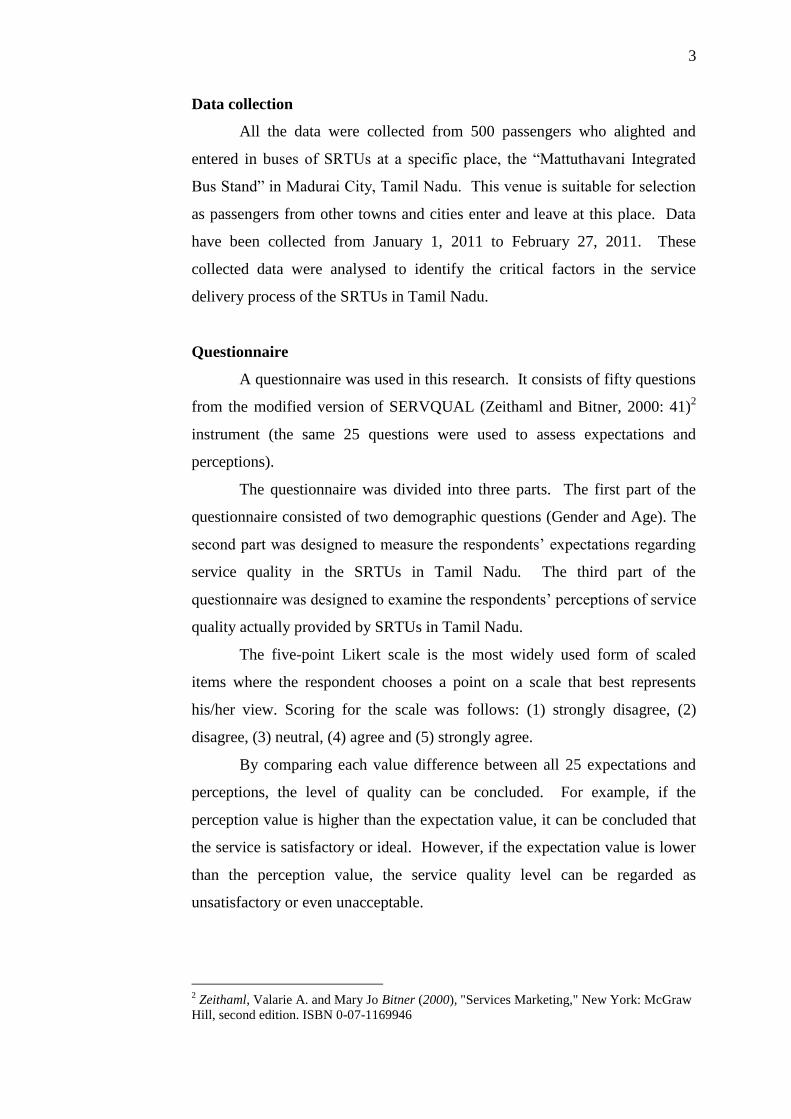
Data Analysis
The total number of respondents who participated in our survey was
500
Gender: 43.6% (218) were female and 56.4% (282) were male.
Age: The age distribution of respondents ranged from 21 to 65 years
(44 years being the difference between the maximum and the minimum age).
The break up of the ages of the respondents was given in the following Table.
Table 1
Age Distribution of Respondents
Age Respondents
Below 20 Nil
21-30 84
31-40 218
41-50 127
51-60 47
Above 60 24
Comprehensive Statistics of Statements
The research on measuring service quality has focused primarily on
meeting or exceeding customers’ expectations. The following sections are
comprehensive statistics of the original 25 statements with reference to
passenger service.
Statement 1: The bus stand is attractive
The data reflected in Table 2.1 reveal the expectations and perceptions
of respondents in this study in terms of the attractiveness of bus stands.
Table 2.1
Score Expectation Responses Perception Responses
Strongly Disagree 66 49
Disagree 75 70
Undecided 135 180
Agree 170 150
Strongly Agree 54 51
Total 500 500
5
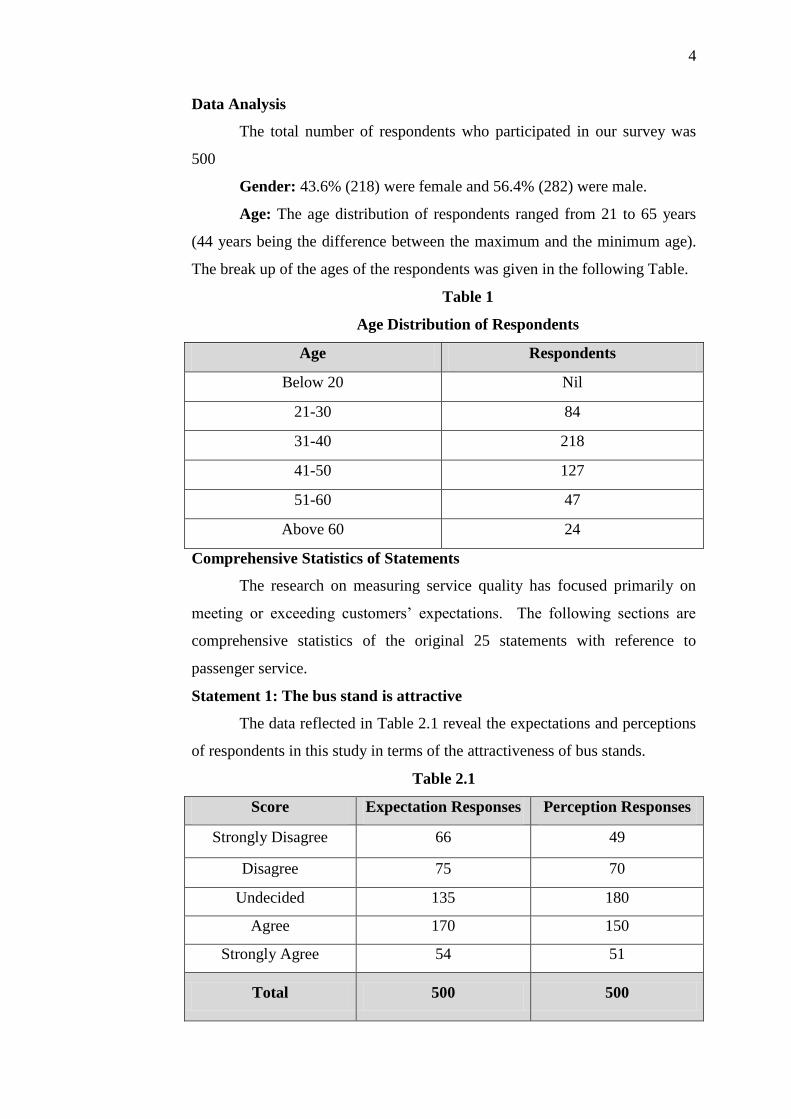
Statement 2: Bus companies are equipped with modern technology
The aim of statement 2 is to gain the customers’ perceptions of the
modernity of those bus companies’ equipment.
Table 2.2
Score Expectation Responses Perception Responses
Strongly Disagree 52 74
Disagree 78 75
Undecided 159 140
Agree 115 110
Strongly Agree 96 101
Total 500 500
Statement 3: The bus stand has adequate resource and capacity
The aim of statement 3 is to determine the customer’s perceptions of
the physical resources.
Table 2.3
Score Expectation Responses Perception Responses
Strongly Disagree 19 71
Disagree 70 30
Undecided 161 160
Agree 130 54
Strongly Agree 120 185
Total 500 500
6
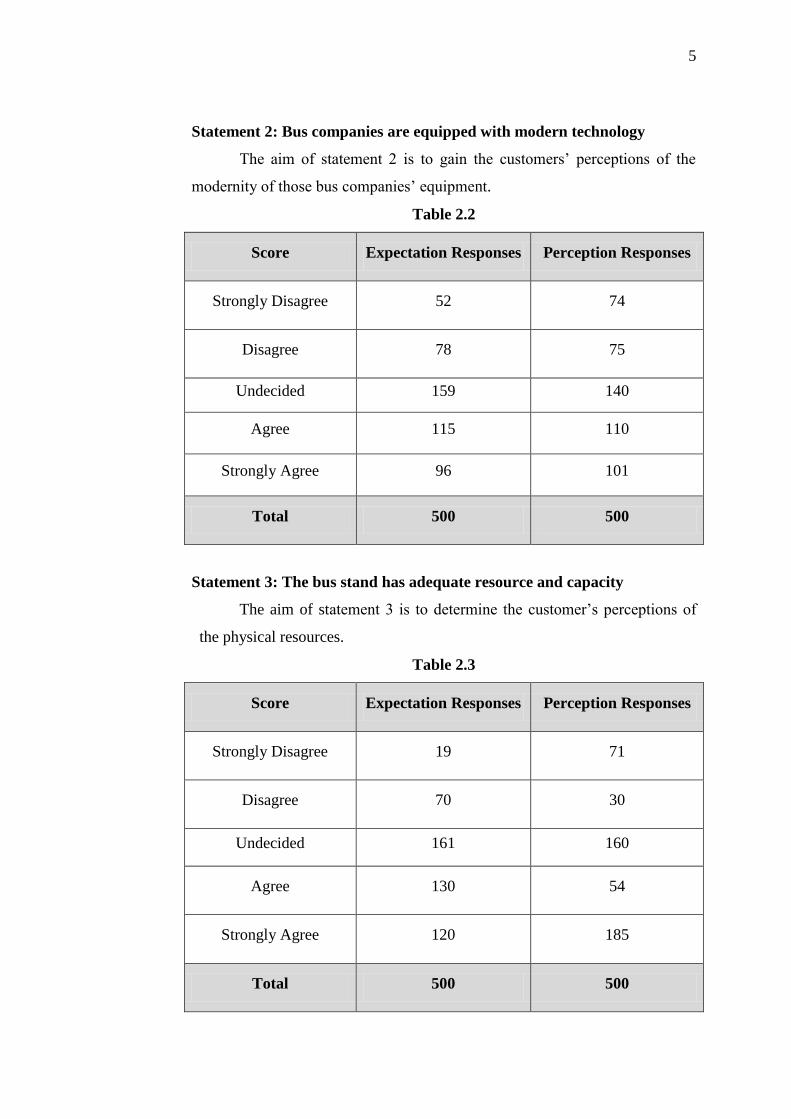
Statement 4: Bus companies have a professional appearance
Statement 4 aims to assess the appearance of these SRTUs that provide
service to their customers.
Table 2.4
Score Expectation Responses Perception Responses
Strongly Disagree 31 29
Disagree 60 60
Undecided 140 150
Agree 49 61
Strongly Agree 220 200
Total 500 500
Statement 5: The dress of staff is neat and smart
Statement 5 aims the assessment of the neat appearance of employees.
Table 2.5
Score Expectation Responses Perception Responses
Strongly Disagree 19 26
Disagree 70 60
Undecided 151 140
Agree 60 79
Strongly Agree 200 195
Total 500 500
7
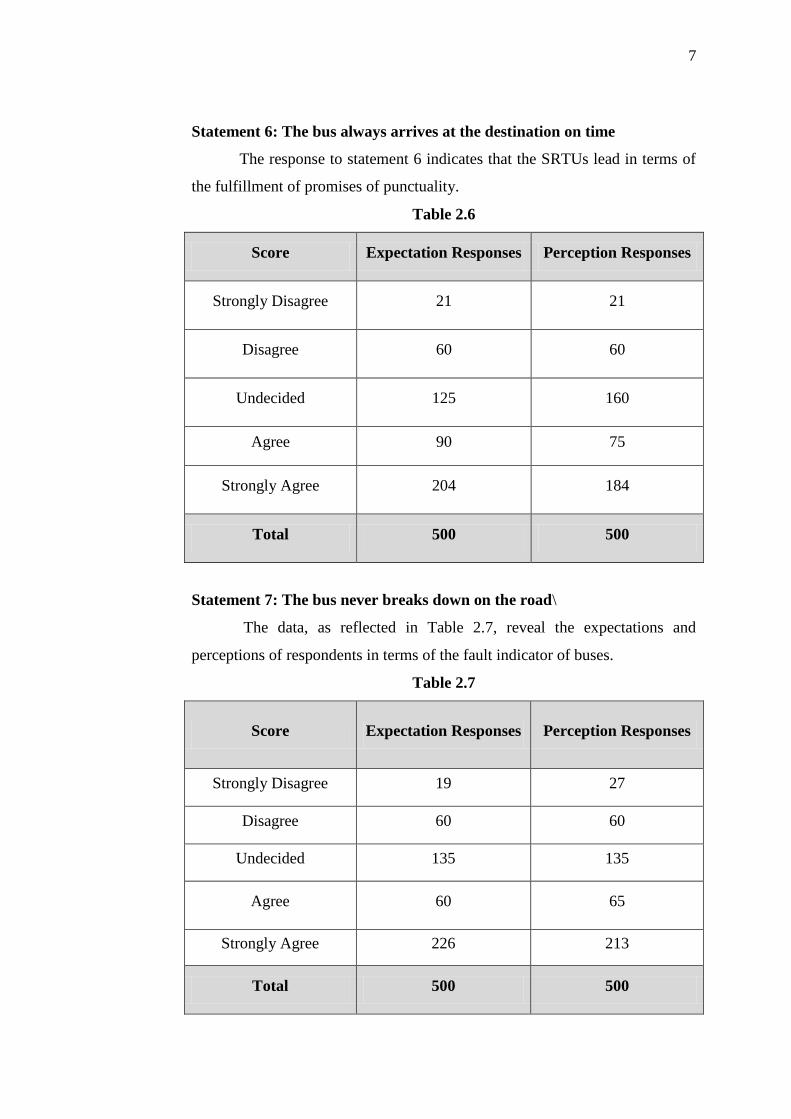
Statement 6: The bus always arrives at the destination on time
The response to statement 6 indicates that the SRTUs lead in terms of
the fulfillment of promises of punctuality.
Table 2.6
Score Expectation Responses Perception Responses
Strongly Disagree 21 21
Disagree 60 60
Undecided 125 160
Agree 90 75
Strongly Agree 204 184
Total 500 500
Statement 7: The bus never breaks down on the road\
The data, as reflected in Table 2.7, reveal the expectations and
perceptions of respondents in terms of the fault indicator of buses.
Table 2.7
Score Expectation Responses Perception Responses
Strongly Disagree 19 27
Disagree 60 60
Undecided 135 135
Agree 60 65
Strongly Agree 226 213
Total 500 500
8
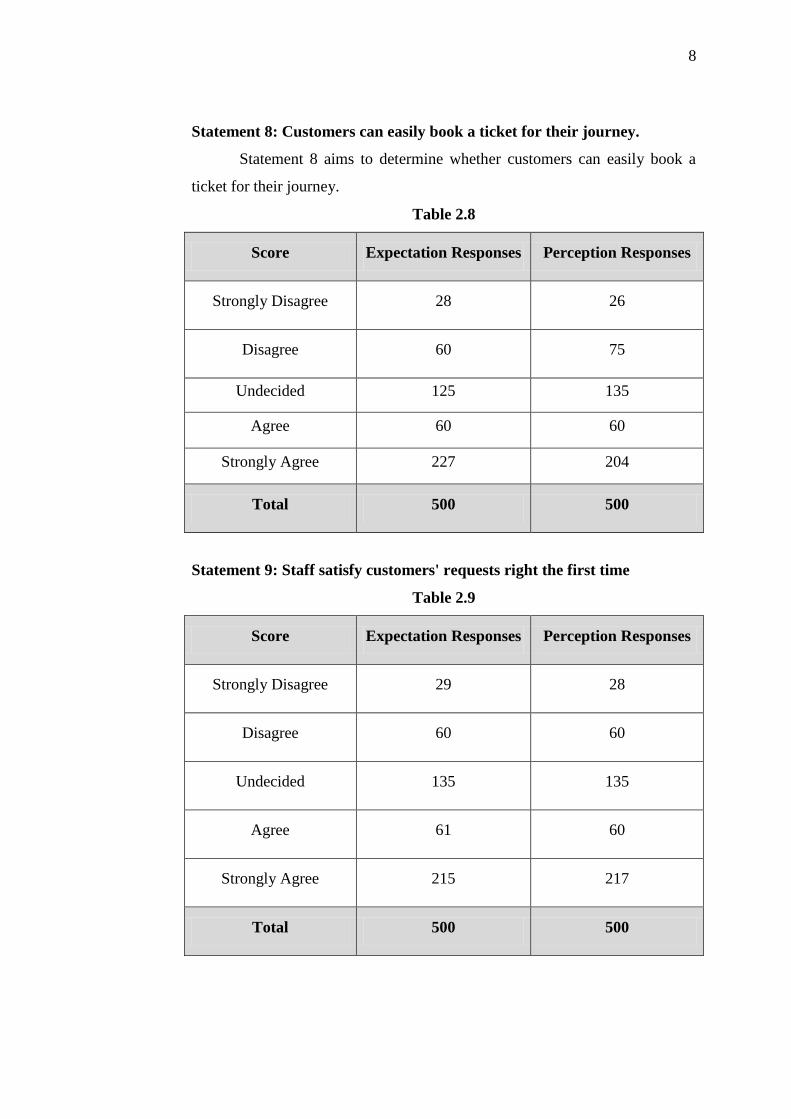
Statement 8: Customers can easily book a ticket for their journey.
Statement 8 aims to determine whether customers can easily book a
ticket for their journey.
Table 2.8
Score Expectation Responses Perception Responses
Strongly Disagree 28 26
Disagree 60 75
Undecided 125 135
Agree 60 60
Strongly Agree 227 204
Total 500 500
Statement 9: Staff satisfy customers' requests right the first time
Table 2.9
Score Expectation Responses Perception Responses
Strongly Disagree 29 28
Disagree 60 60
Undecided 135 135
Agree 61 60
Strongly Agree 215 217
Total 500 500
9
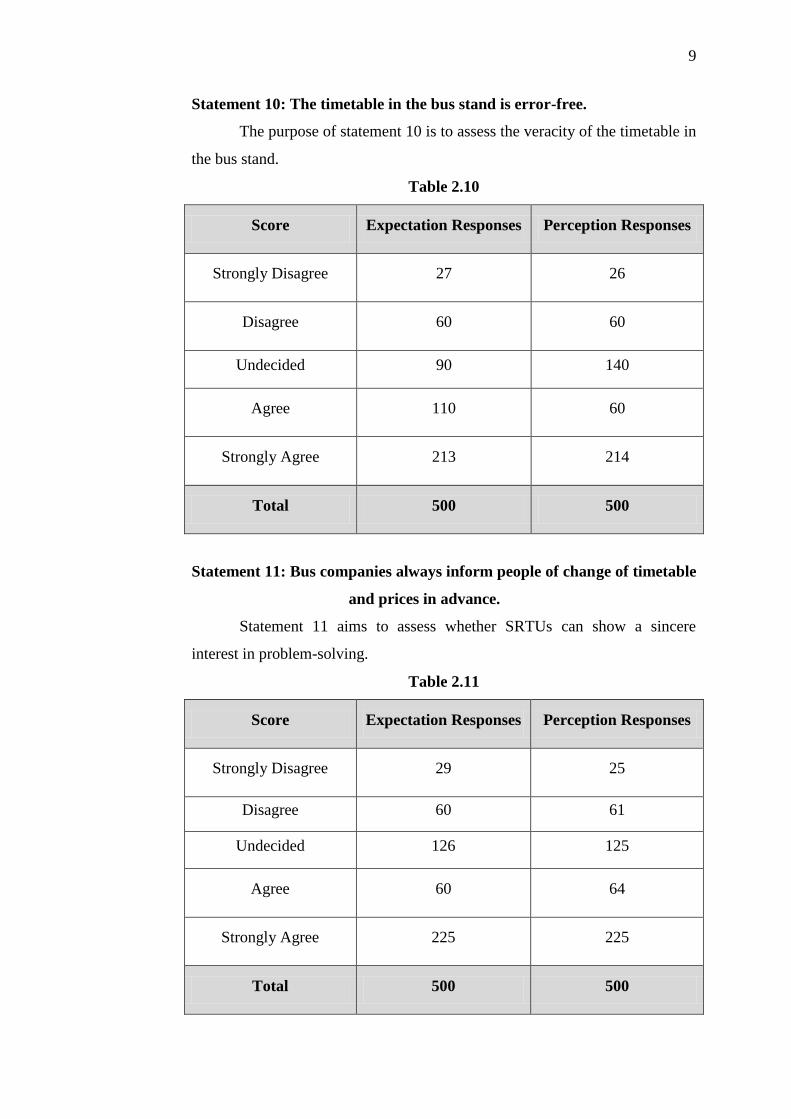
Statement 10: The timetable in the bus stand is error-free.
The purpose of statement 10 is to assess the veracity of the timetable in
the bus stand.
Table 2.10
Score Expectation Responses Perception Responses
Strongly Disagree 27 26
Disagree 60 60
Undecided 90 140
Agree 110 60
Strongly Agree 213 214
Total 500 500
Statement 11: Bus companies always inform people of change of timetable
and prices in advance.
Statement 11 aims to assess whether SRTUs can show a sincere
interest in problem-solving.
Table 2.11
Score Expectation Responses Perception Responses
Strongly Disagree 29 25
Disagree 60 61
Undecided 126 125
Agree 60 64
Strongly Agree 225 225
Total 500 500
10
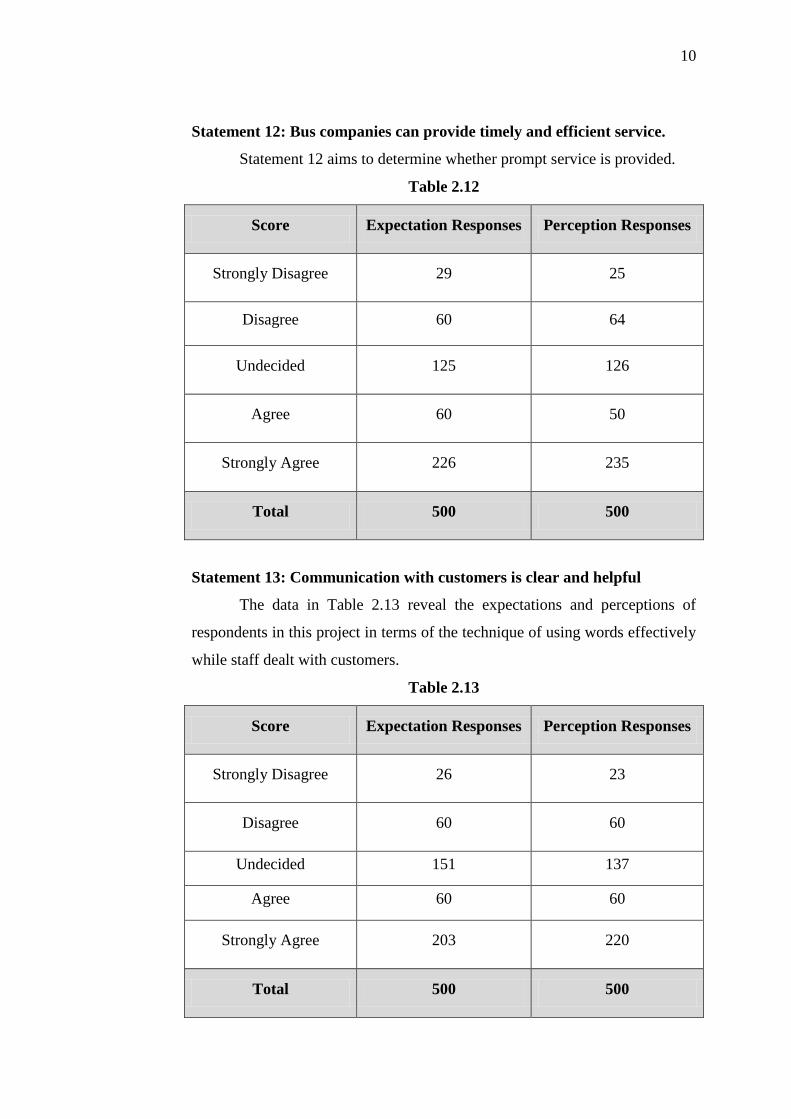
Statement 12: Bus companies can provide timely and efficient service.
Statement 12 aims to determine whether prompt service is provided.
Table 2.12
Score Expectation Responses Perception Responses
Strongly Disagree 29 25
Disagree 60 64
Undecided 125 126
Agree 60 50
Strongly Agree 226 235
Total 500 500
Statement 13: Communication with customers is clear and helpful
The data in Table 2.13 reveal the expectations and perceptions of
respondents in this project in terms of the technique of using words effectively
while staff dealt with customers.
Table 2.13
Score Expectation Responses Perception Responses
Strongly Disagree 26 23
Disagree 60 60
Undecided 151 137
Agree 60 60
Strongly Agree 203 220
Total 500 500
11
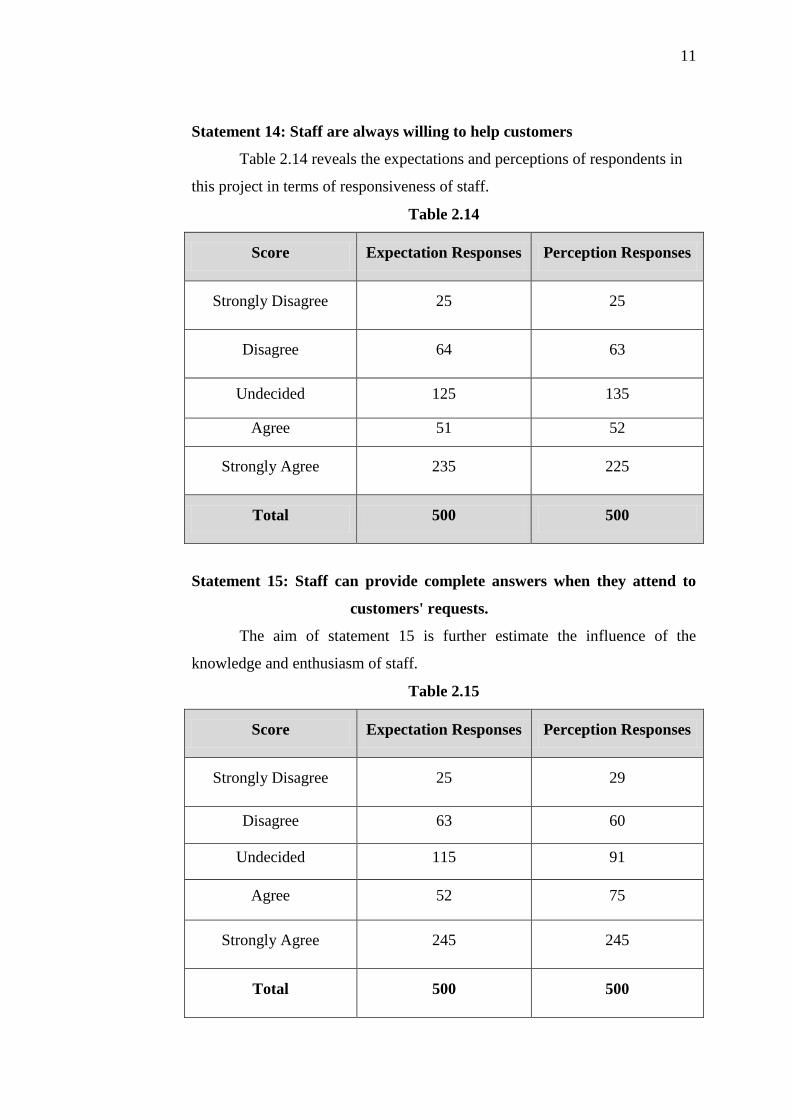
Statement 14: Staff are always willing to help customers
Table 2.14 reveals the expectations and perceptions of respondents in
this project in terms of responsiveness of staff.
Table 2.14
Score Expectation Responses Perception Responses
Strongly Disagree 25 25
Disagree 64 63
Undecided 125 135
Agree 51 52
Strongly Agree 235 225
Total 500 500
Statement 15: Staff can provide complete answers when they attend to
customers' requests.
The aim of statement 15 is further estimate the influence of the
knowledge and enthusiasm of staff.
Table 2.15
Score Expectation Responses Perception Responses
Strongly Disagree 25 29
Disagree 63 60
Undecided 115 91
Agree 52 75
Strongly Agree 245 245
Total 500 500
12
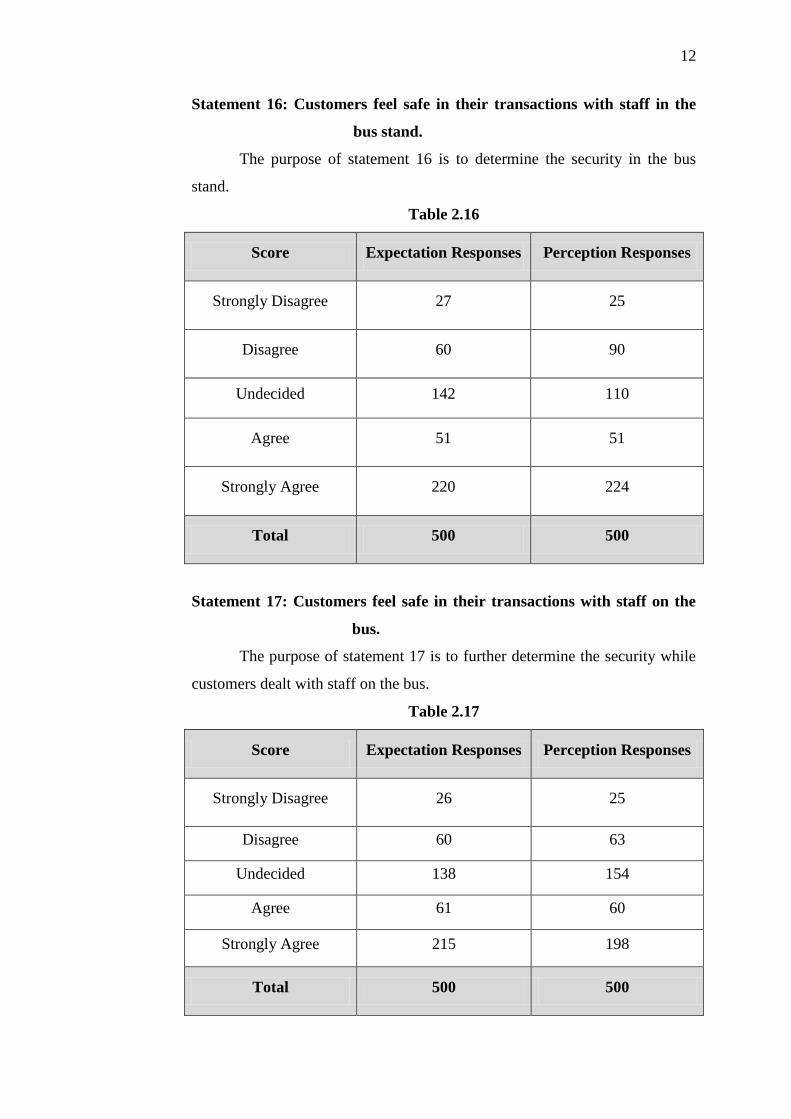
Statement 16: Customers feel safe in their transactions with staff in the
bus stand.
The purpose of statement 16 is to determine the security in the bus
stand.
Table 2.16
Score Expectation Responses Perception Responses
Strongly Disagree 27 25
Disagree 60 90
Undecided 142 110
Agree 51 51
Strongly Agree 220 224
Total 500 500
Statement 17: Customers feel safe in their transactions with staff on the
bus.
The purpose of statement 17 is to further determine the security while
customers dealt with staff on the bus.
Table 2.17
Score Expectation Responses Perception Responses
Strongly Disagree 26 25
Disagree 60 63
Undecided 138 154
Agree 61 60
Strongly Agree 215 198
Total 500 500
13
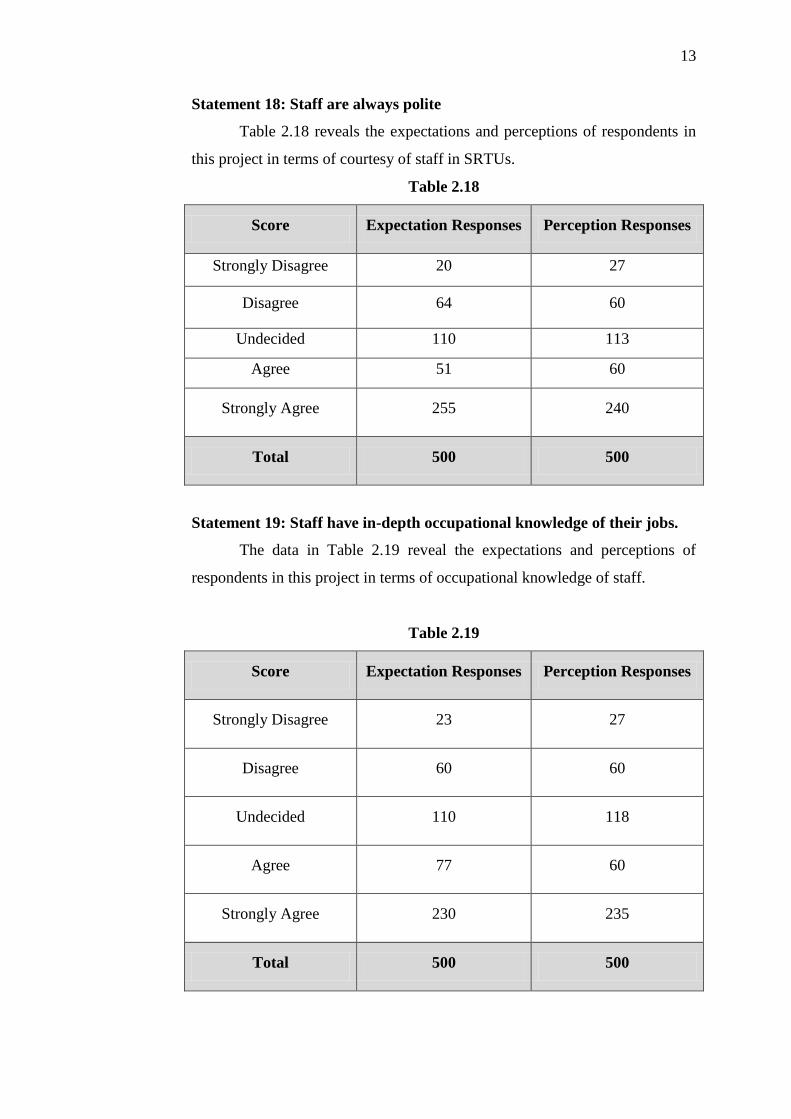
Statement 18: Staff are always polite
Table 2.18 reveals the expectations and perceptions of respondents in
this project in terms of courtesy of staff in SRTUs.
Table 2.18
Score Expectation Responses Perception Responses
Strongly Disagree 20 27
Disagree 64 60
Undecided 110 113
Agree 51 60
Strongly Agree 255 240
Total 500 500
Statement 19: Staff have in-depth occupational knowledge of their jobs.
The data in Table 2.19 reveal the expectations and perceptions of
respondents in this project in terms of occupational knowledge of staff.
Table 2.19
Score Expectation Responses Perception Responses
Strongly Disagree 23 27
Disagree 60 60
Undecided 110 118
Agree 77 60
Strongly Agree 230 235
Total 500 500
14
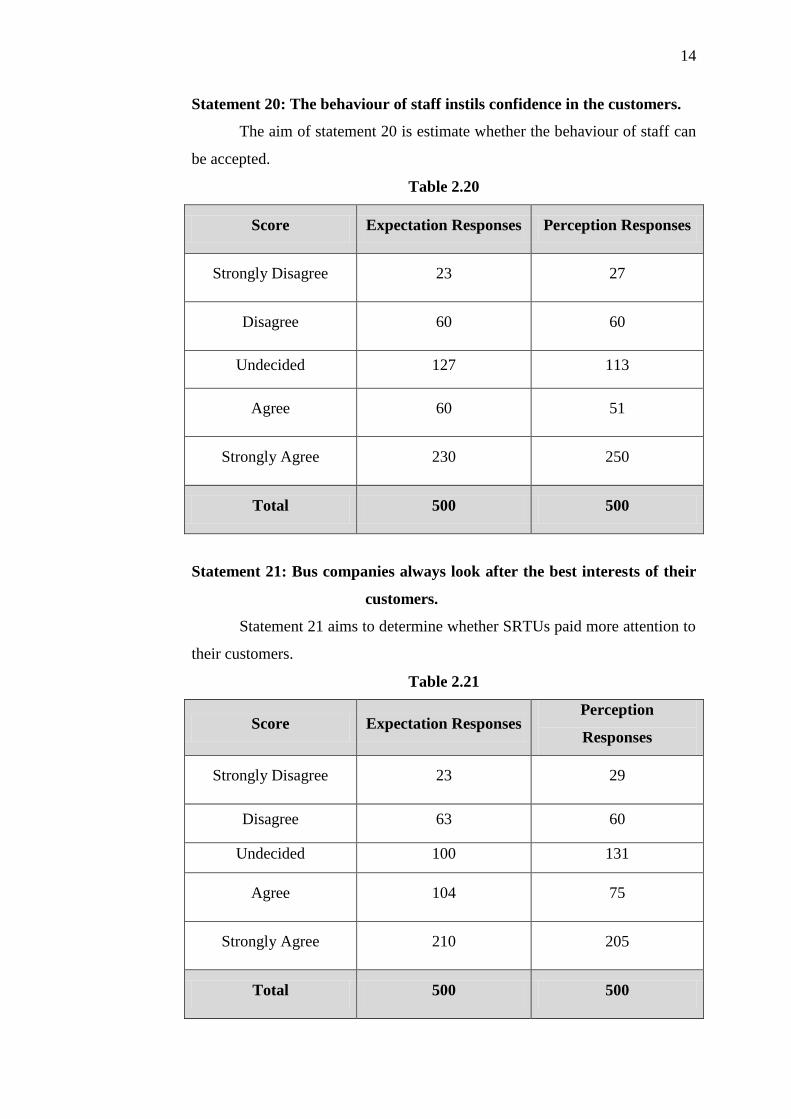
Statement 20: The behaviour of staff instils confidence in the customers.
The aim of statement 20 is estimate whether the behaviour of staff can
be accepted.
Table 2.20
Score Expectation Responses Perception Responses
Strongly Disagree 23 27
Disagree 60 60
Undecided 127 113
Agree 60 51
Strongly Agree 230 250
Total 500 500
Statement 21: Bus companies always look after the best interests of their
customers.
Statement 21 aims to determine whether SRTUs paid more attention to
their customers.
Table 2.21
Score Expectation Responses Perception
Responses
Strongly Disagree 23 29
Disagree 63 60
Undecided 100 131
Agree 104 75
Strongly Agree 210 205
Total 500 500
15
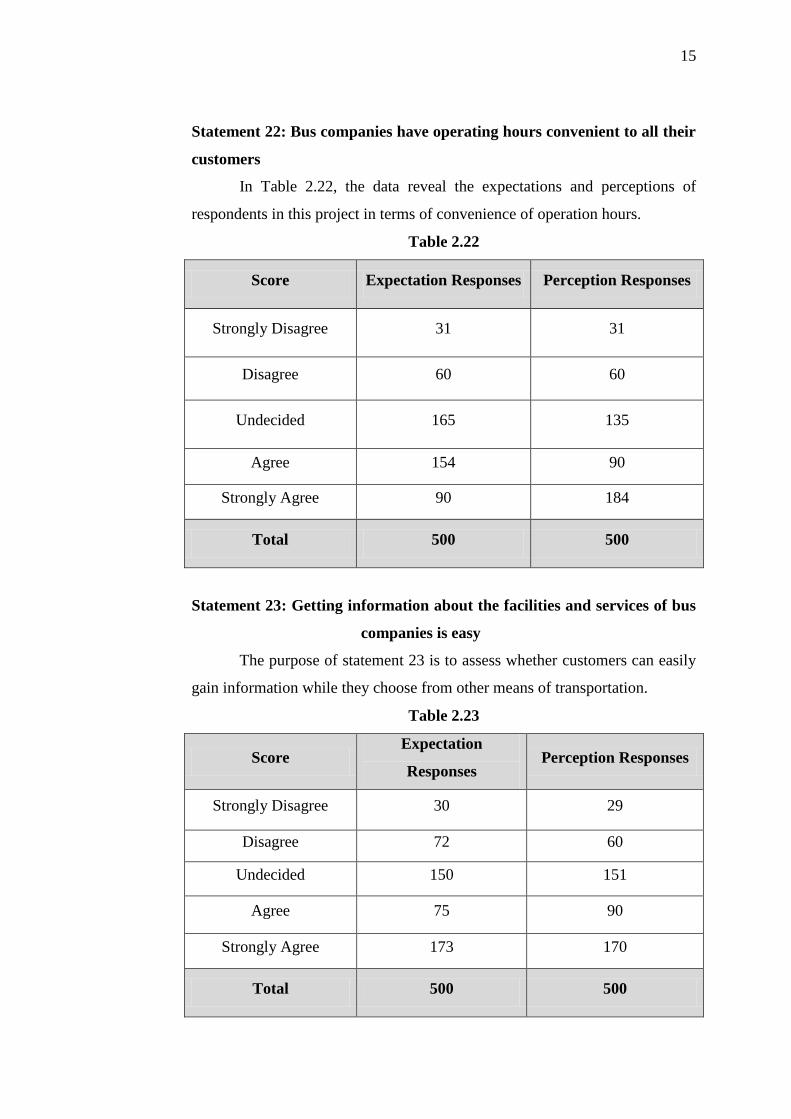
Statement 22: Bus companies have operating hours convenient to all their
customers
In Table 2.22, the data reveal the expectations and perceptions of
respondents in this project in terms of convenience of operation hours.
Table 2.22
Score Expectation Responses Perception Responses
Strongly Disagree 31 31
Disagree 60 60
Undecided 165 135
Agree 154 90
Strongly Agree 90 184
Total 500 500
Statement 23: Getting information about the facilities and services of bus
companies is easy
The purpose of statement 23 is to assess whether customers can easily
gain information while they choose from other means of transportation.
Table 2.23
Score Expectation
Responses Perception Responses
Strongly Disagree 30 29
Disagree 72 60
Undecided 150 151
Agree 75 90
Strongly Agree 173 170
Total 500 500
16
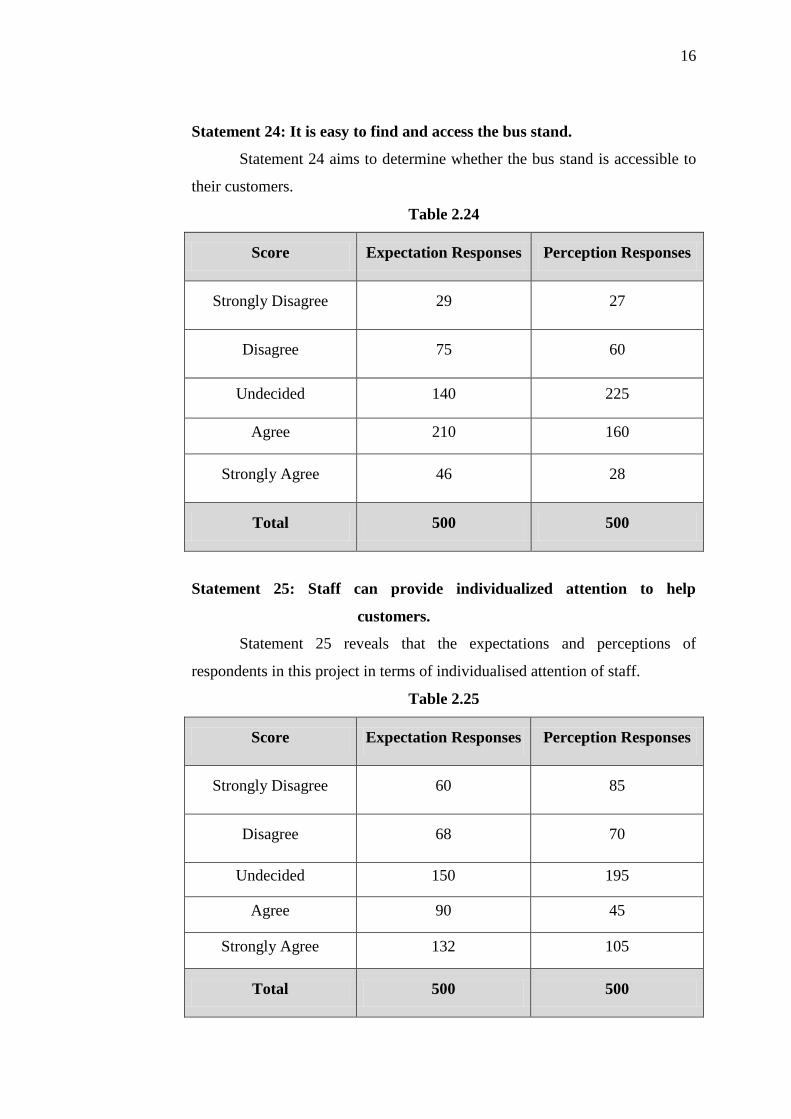
Statement 24: It is easy to find and access the bus stand.
Statement 24 aims to determine whether the bus stand is accessible to
their customers.
Table 2.24
Score Expectation Responses Perception Responses
Strongly Disagree 29 27
Disagree 75 60
Undecided 140 225
Agree 210 160
Strongly Agree 46 28
Total 500 500
Statement 25: Staff can provide individualized attention to help
customers.
Statement 25 reveals that the expectations and perceptions of
respondents in this project in terms of individualised attention of staff.
Table 2.25
Score Expectation Responses Perception Responses
Strongly Disagree 60 85
Disagree 68 70
Undecided 150 195
Agree 90 45
Strongly Agree 132 105
Total 500 500
17
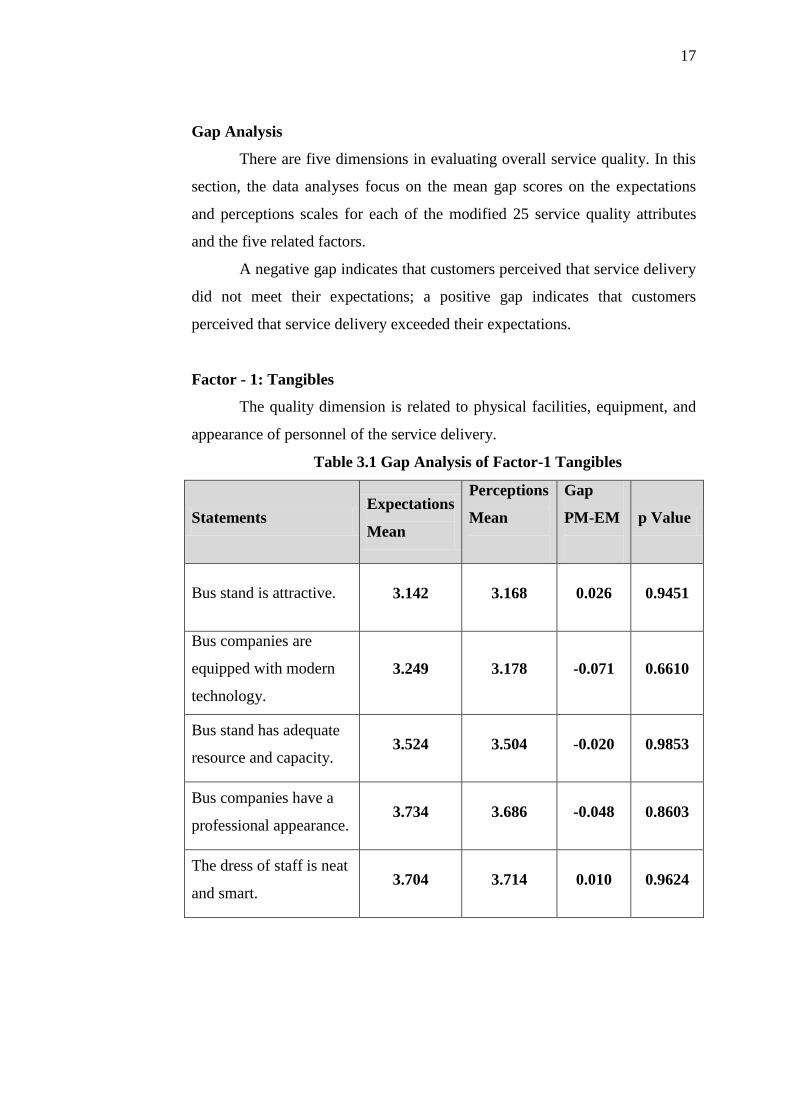
Gap Analysis
There are five dimensions in evaluating overall service quality. In this
section, the data analyses focus on the mean gap scores on the expectations
and perceptions scales for each of the modified 25 service quality attributes
and the five related factors.
A negative gap indicates that customers perceived that service delivery
did not meet their expectations; a positive gap indicates that customers
perceived that service delivery exceeded their expectations.
Factor - 1: Tangibles
The quality dimension is related to physical facilities, equipment, and
appearance of personnel of the service delivery.
Table 3.1 Gap Analysis of Factor-1 Tangibles
Statements Expectations
Mean
Perceptions
Mean
Gap
PM-EM
p Value
Bus stand is attractive. 3.142 3.168 0.026 0.9451
Bus companies are
equipped with modern
technology.
3.249 3.178 -0.071 0.6610
Bus stand has adequate
resource and capacity. 3.524 3.504 -0.020 0.9853
Bus companies have a
professional appearance. 3.734 3.686 -0.048 0.8603
The dress of staff is neat
and smart. 3.704 3.714 0.010 0.9624
18
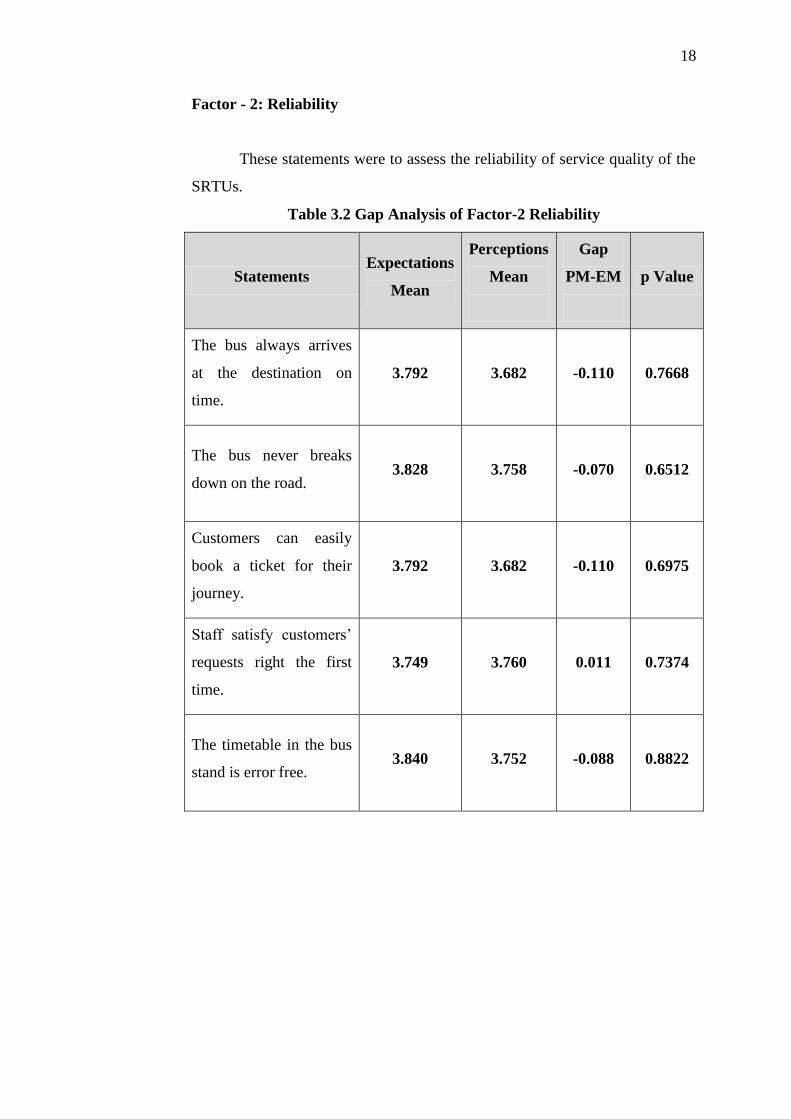
Factor - 2: Reliability
These statements were to assess the reliability of service quality of the
SRTUs.
Table 3.2 Gap Analysis of Factor-2 Reliability
Statements Expectations
Mean
Perceptions
Mean
Gap
PM-EM
p Value
The bus always arrives
at the destination on
time.
3.792 3.682 -0.110 0.7668
The bus never breaks
down on the road. 3.828 3.758 -0.070 0.6512
Customers can easily
book a ticket for their
journey.
3.792 3.682 -0.110 0.6975
Staff satisfy customers’
requests right the first
time.
3.749 3.760 0.011 0.7374
The timetable in the bus
stand is error free. 3.840 3.752 -0.088 0.8822

19
Factor - 3: Responsiveness
Statements in this factor primarily described the willingness of the
SRTUs to help customers and provide prompt service, as well as the
employees’ skills and abilities to interact with people.
Table 3.3 Gap Analysis of Factor-3 Responsiveness
Statements
Expectations
Mean
Perceptions
Mean
Gap
PM-EM
p value
Bus companies always
inform people of change
of timetable and prices in
advance.
3.786 3.804 0.018 0.6172
Bus companies can
provide timely and
efficient service.
3.792 3.813 0.021 0.8810
Communication with
customers is clear and
helpful.
3.708 3.790 0.082 0.7118
Staff are always willing
to help customers.
3.816 3.780 -0.036 0.7948
Staff can provide
complete answers when
they attend to customers’
requests.
3.860 3.894 0.034 0.9014
20
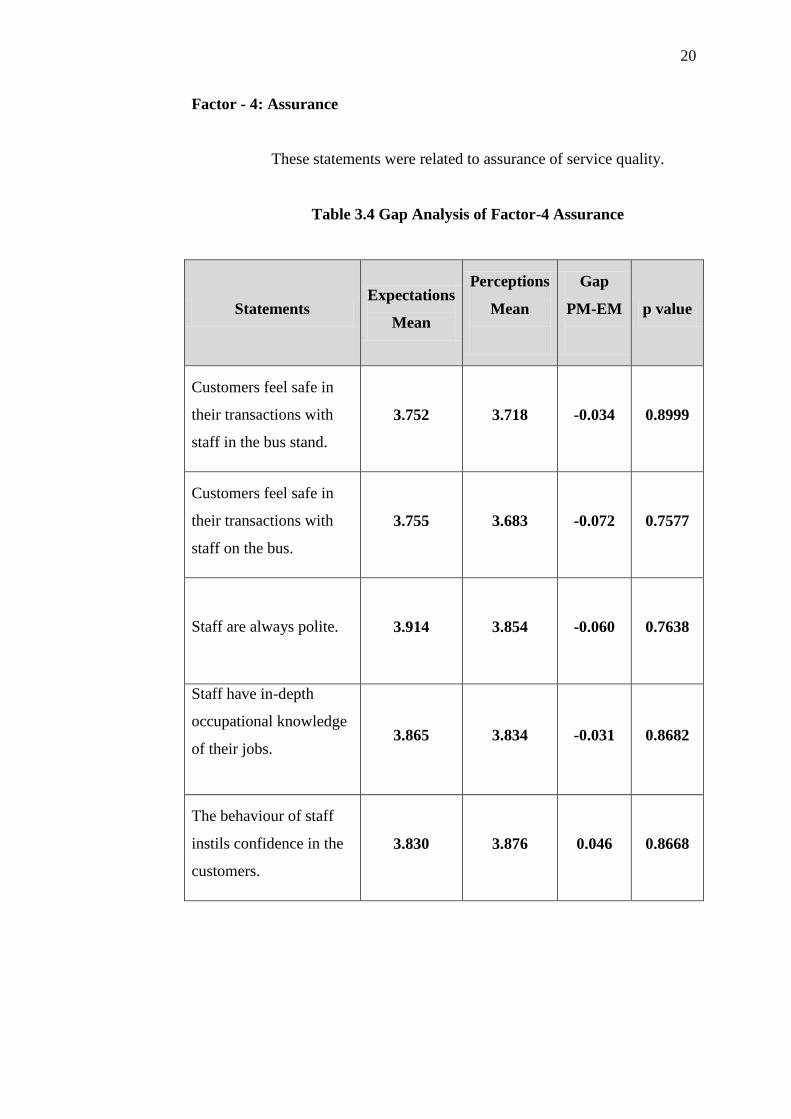
Factor - 4: Assurance
These statements were related to assurance of service quality.
Table 3.4 Gap Analysis of Factor-4 Assurance
Statements Expectations
Mean
Perceptions
Mean
Gap
PM-EM
p value
Customers feel safe in
their transactions with
staff in the bus stand.
3.752 3.718 -0.034 0.8999
Customers feel safe in
their transactions with
staff on the bus.
3.755 3.683 -0.072 0.7577
Staff are always polite. 3.914 3.854 -0.060 0.7638
Staff have in-depth
occupational knowledge
of their jobs.
3.865 3.834 -0.031 0.8682
The behaviour of staff
instils confidence in the
customers.
3.830 3.876 0.046 0.8668
21
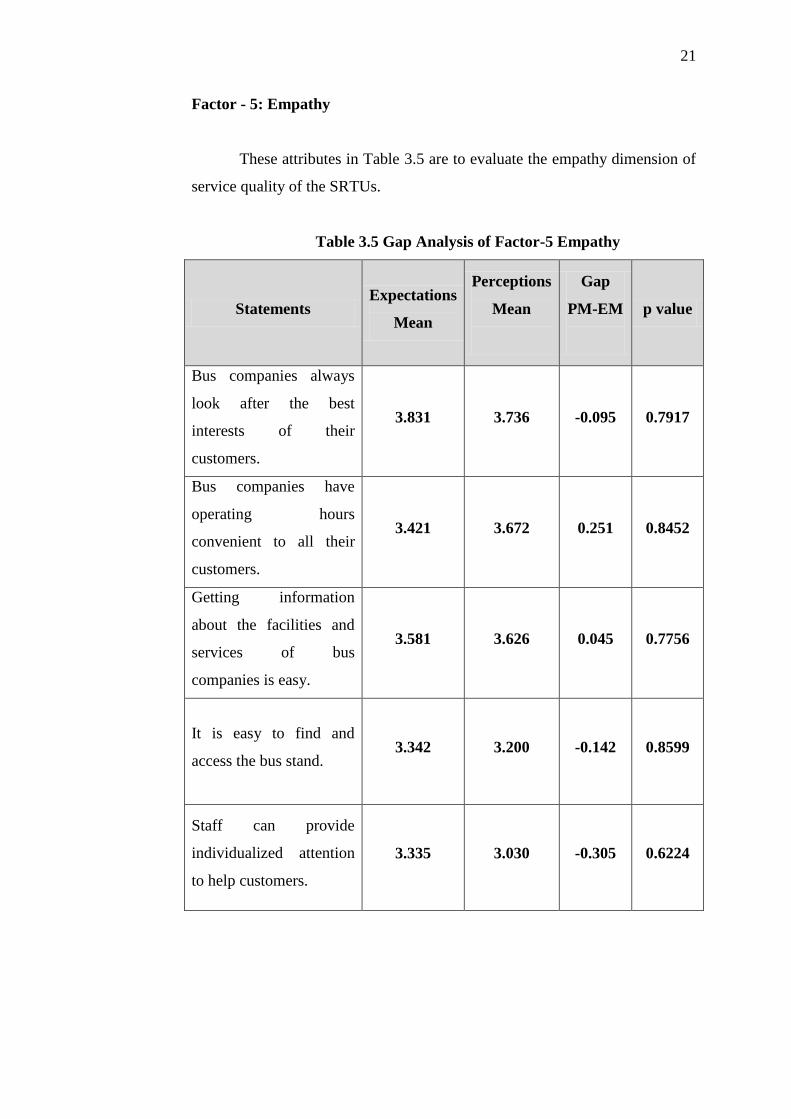
Factor - 5: Empathy
These attributes in Table 3.5 are to evaluate the empathy dimension of
service quality of the SRTUs.
Table 3.5 Gap Analysis of Factor-5 Empathy
Statements Expectations
Mean
Perceptions
Mean
Gap
PM-EM
p value
Bus companies always
look after the best
interests of their
customers.
3.831 3.736 -0.095 0.7917
Bus companies have
operating hours
convenient to all their
customers.
3.421 3.672 0.251 0.8452
Getting information
about the facilities and
services of bus
companies is easy.
3.581 3.626 0.045 0.7756
It is easy to find and
access the bus stand. 3.342 3.200 -0.142 0.8599
Staff can provide
individualized attention
to help customers.
3.335 3.030 -0.305 0.6224
22
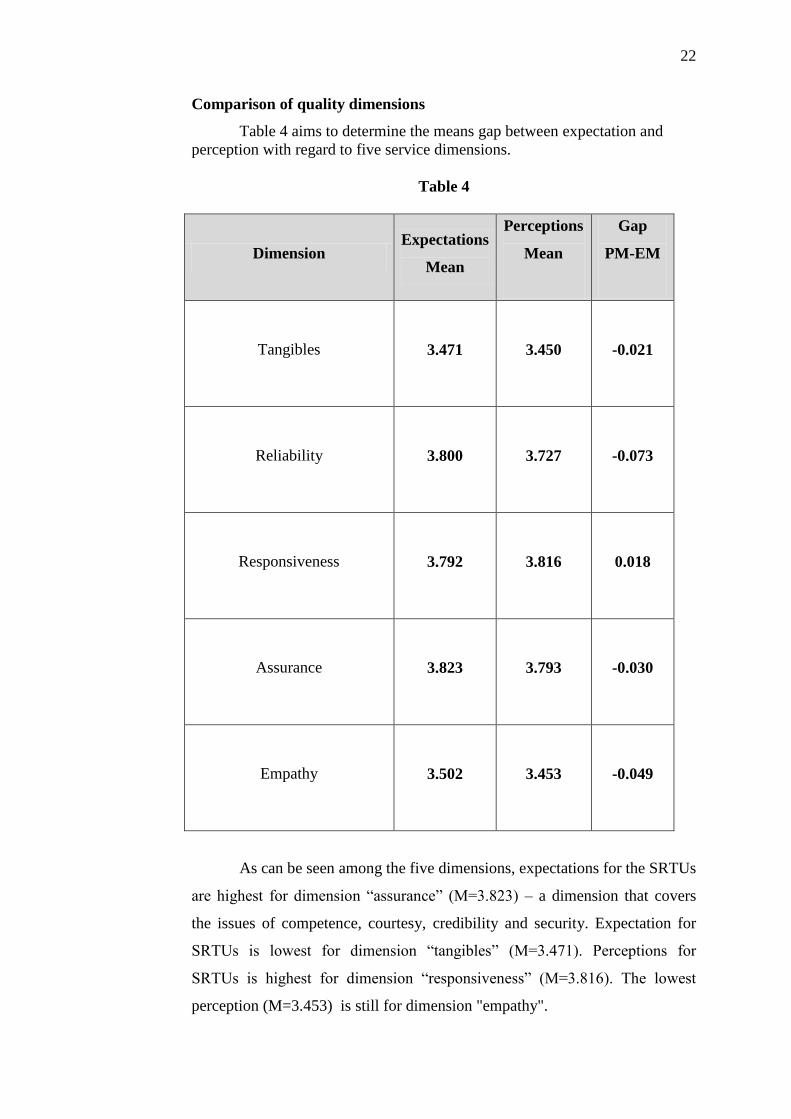
Comparison of quality dimensions
Table 4 aims to determine the means gap between expectation and
perception with regard to five service dimensions.
Table 4
Dimension Expectations
Mean
Perceptions
Mean
Gap
PM-EM
Tangibles 3.471 3.450 -0.021
Reliability 3.800 3.727 -0.073
Responsiveness 3.792 3.816 0.018
Assurance 3.823 3.793 -0.030
Empathy 3.502 3.453 -0.049
As can be seen among the five dimensions, expectations for the SRTUs
are highest for dimension “assurance” (M=3.823) – a dimension that covers
the issues of competence, courtesy, credibility and security. Expectation for
SRTUs is lowest for dimension “tangibles” (M=3.471). Perceptions for
SRTUs is highest for dimension “responsiveness” (M=3.816). The lowest
perception (M=3.453) is still for dimension "empathy".
23
T-Test
The t-test is used to see if there are any significant differences in the
means for two groups in the variable of interest. In this study, the paired t-test
was carried out to test the significant difference between the two means of
expectations and perceptions.
Hypothesis Testing and Results
H1O: There is no significant difference in the gap between passengers’
perceptions and expectations in service quality of SRTUs in Tamil Nadu.
H2O: There is significant difference in the gap between passengers’
perceptions and expectations in service quality of SRTUs in Tamil Nadu.
Interpreting the p-value
The p-value is a numerical estimate of the reliability of assumption that
the difference in means on pre and post surveys is real and not due to chance.
A p-value of .10 or less is statistically significant, which means that we
are 90% sure that the result we see (the difference in means for each question)
is not due to chance.
A t-test for independent samples was conducted to examine hypothesis
H20.
This hypothesis was examined by t-test. There is no significant
difference was found (p = .000, two-tailed). The results demonstrate that
insignificant differences in passengers’ perceived service quality of SRTUs
are found.
In this study, the p-value of all the items is above .10. Therefore, t-test
confirms that the change on all the items in SERVQUAL Questionnaire were
“not significant at a p<.10 level.”
This result indicated that respondents found no gap between
expectations and perceptions of service quality in SRTUs.
24
Limitations
As with all empirical studies, the present research had certain
limitations.
• Firstly, the data were gathered in a specific geographic area of Madurai. As
a result, the study may have contained some information and
results that can be specific only for the city Madurai. Hence, the
results of this study cannot be generalised.
• Secondly, the results of this study may not have been representative of the
whole population, due to the face that a convenience sampling
method was used to collect the data.
• Thirdly, the demographic information of the respondents was not linked into
the expectations and perceptions.
Conclusion
A comparison of passengers’ perceptions of service quality with their
expectations, using paired t-test, showed a statistically not significant
difference on all of the 25 attributes examined in this study.
********************

25