Embed Size (px)
Citation preview

MPRAMunich Personal RePEc Archive
Stock Market Development andEconomic growth in India: An EmpiricalAnalysis
Srinivasan P.
Xavier Institute of Management & Entrepreneurship ElectronicsCity, Phase II, Hosur Road, Bangalore 560 100, Karnataka, India
1. May 2014
Online at http://mpra.ub.uni-muenchen.de/55657/MPRA Paper No. 55657, posted 1. May 2014 07:05 UTC

1
Stock Market Development and Economic growth in India: An Empirical Analysis
Dr. Srinivasan P.Assistant Professor
Xavier Institute of Management & EntrepreneurshipElectronics City, Phase II, Hosur Road,
Bangalore 560 100, Karnataka, IndiaTel: +91-9611273853
E-mail: [email protected]
AbstractThe link between stock market development and economic activity has always been the subject of
considerable debate in the field of economics and it raises empirical question whether stock market
development influences economic activity or whether it is a consequence of increased economic
activity. This study attempts to investigate the direction of causality between stock market
development and economic growth in the Indian context. Using the cointegration and causality tests
for the period June 1991 to June 2013, the study confirms a well defined long-run equilibrium
relationship between the stock market development indicators and economic growth in India. The
empirical results show bidirectional causality between market capitalisation and economic growth
and unidirectional causality from turnover ratio to economic growth in the long-run and short-run.
By and large, it can be inferred that the stock market development indicators viz. market
capitalisation and turnover ratio have a positive influence on economic growth in India.
Key Words: Stock Market Development, Cointegration, Granger Causality, Economic Growth
JEL Classification: C22, E44, O16
2
Stock Market Development and Economic growth in India: An Empirical Analysis
I. Introduction
The Indian financial sector has undergone a significant structural transformation since the
initiation of the economic reforms in 1990’s. Financial sector reforms mainly entailed reforms of the
banking system and the capital market. As a result of reforms since 1991, the financial markets
have transited to a regime of market-determined interest and exchange rates, current account
convertibility, phased capital account liberalization and an auction based system in the government
securities market. Policy initiatives have tried to ensure financial stability, curbing excessive
fluctuations and volatility in interest rates, exchange rates and hence moderating inflation without
choking credit to productive sectors, thus mitigating risks arising out of deregulation and
globalization of financial markets and helping in the efficient allocation of resources in the real
sectors of the economy. Most importantly, the capital market reform was an integral part of the
agenda of financial sector reforms in India. Gupta (2002) has rightly pointed out that improving
stock market efficiency, enhancing transparency, checking unfair trade practices and bringing the
Indian capital market up to a certain international standard are some of the major objectives of the
capital market reforms. Due to this reforming process, the Securities and Exchange Board of India
(SEBI) was formed as the apex regulator of the capital market. The new regulatory framework laid
down by SEBI sought to strengthen investor protection by ensuring disclosure and transparency
rather than through direct controls. The SEBI has apparently made progress in achieving its major
objectives such as to protect the interests of investors in securities and to promote the development
of, and to regulate, the securities market and for matters connected therewith or incidental thereto.
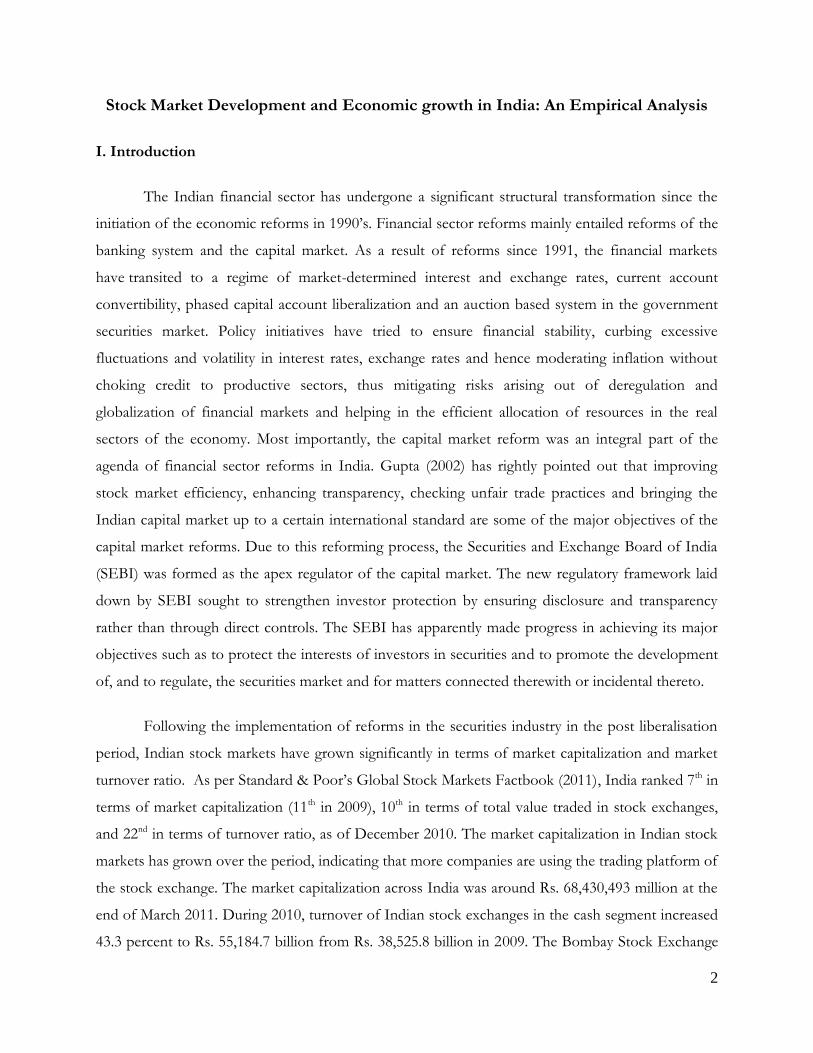
Following the implementation of reforms in the securities industry in the post liberalisation
period, Indian stock markets have grown significantly in terms of market capitalization and market
turnover ratio. As per Standard & Poor’s Global Stock Markets Factbook (2011), India ranked 7th in
terms of market capitalization (11th in 2009), 10th in terms of total value traded in stock exchanges,
and 22nd in terms of turnover ratio, as of December 2010. The market capitalization in Indian stock
markets has grown over the period, indicating that more companies are using the trading platform of
the stock exchange. The market capitalization across India was around Rs. 68,430,493 million at the
end of March 2011. During 2010, turnover of Indian stock exchanges in the cash segment increased
43.3 percent to Rs. 55,184.7 billion from Rs. 38,525.8 billion in 2009. The Bombay Stock Exchange

3
(BSE) and National Stock Exchange (NSE) together contributed 99.9 percent of the turnover. Of
this, the NSE accounted for 74.9 percent of the total turnover in the cash market whereas the BSE
accounted for 24.9 percent to the total. During 2012-13, Indian equity markets staged a slow
recovery followed by significant turnaround amidst strong headwinds caused due to strains in global
financial markets coupled with lingering domestic economic woes. Markets recovered in the
backdrop of strong revitalizing policy announcement and reforms which induced investor optimism
and energized the investment milieu. The much needed liquidity for the markets was delivered by
the enhanced foreign capital flows in search of higher returns. In spite of the macroeconomic stress,
investor confidence and market sentiment remained firm on the expectations of further
improvement in the domestic economic scenario.
Despite the substantial growth in India’s financial sector, the trend of economic growth is
seems to be positive over the last two decades. The growth rate is almost 6.2 percent per annum
during 1994-95. The trend was slightly decelerated to 3.8 percent in 2002 and then increased to 9.7
percent in 2006-07. However, the year 2009 saw a significant slowdown in India’s GDP growth rate
to 6.7 percent (Economic Survey, 2008-09). This is probably due to global financial crisis in 2007-
2008. The deceleration of growth in 2008-09 was spread across all sectors except mining, quarrying,
community, social and personal services. This could be concluded that the performance of
economic growth depends upon the growth of financial sectors in the economy.
Most importantly, it is widely recognized that the development of the stock market is
considered crucial to national economic growth as it: (a) provides an additional channel for
encouraging and mobilising domestic savings; (b) ensures improvements in the productivity of
investment through allocation of capital/resources; and (c) increases managerial discipline through
the market for corporate control. The stock market positively influences national savings, allocation
of capital/resources, financing funds and incentives for corporates, and finally paves the way to
economic growth. Taking into account the importance of stock market in the process of economic
development, the stock market development has a causal influence on economic growth. That is,
deliberate creation of financial institutions and markets increases the supply of financial services.
The capital market increases savings, and allocates them to more productive investments. Thereby
stock market development can stimulate economic growth. This is known as ‘supply leading’
hypothesis. For example, findings in McKinnon (1973), Shaw (1973), and King and Levine (1993a,
1993b) support this hypothesis.

4
On the other hand, there exists a causal relationship from economic growth to stock market
development, i.e., ‘demand following’ hypothesis. In this view, stock market development appears as
a consequence of the economic development. Continual economic expansion requires more
financial services and new instruments. The financial system adapts itself to the financing needs of
the real sector and fits in with its autonomous development. Therefore, this type of stock market
development plays a rather passive role in the growth process. For example, Gurley and Shaw
(1967), Goldsmith (1969) and Jung (1986) show that, economic growth propels financial
development, supporting the ‘demand following’ hypothesis.
Moreover, the third view stresses the reciprocal relationship between stock market
development and economic growth. Economic growth makes the development of financial
intermediation system profitable, and the establishment of an efficient capital market system permits
faster economic growth. By specializing in fund pooling, risk diversification and liquidity
management, the capital market system improves the efficiency of capital allocation and increases
the productive capacity of the real sector. At the same time, the technological efficiency of the stock
markets increases with its size, because economies of scale and learning-by-doing effects are present
in financial intermediation activities. As a result, the real sector can exert a positive externality on the
capital market through the volume of savings. Therefore, stock market development and economic
growth positively influence each other in the process of development.
The above theoretical arguments primarily revolved around two major empirical questions:
first whether there is a casual relationship between development of stock market and economic
growth. Second, what could be the nature and direction of the causal relationship between stock
market development and economic growth? Various researchers and policy makers alike have
focused to understand the various ways in which economic growth can be enhanced. The relevance
of policy implications pertaining to stock market development and growth nexus becomes an
important substance among academics, policy makers and economists in India. If the Indian stock
market acts as an engine for economic growth, then the market regulators and economic policy
makers should focus their attention towards establishing and sustaining a dynamic capital market in
order to foster a sound and continued economic growth. On the other hand, if economic growth
leads to capital market development, then much concentration to be needed towards countries’
sustained growth performance in order to enhance the development of capital markets in the
economy. In this backdrop, the present study attempts to examine the causal linkage between the

5
stock market development and economic growth in India. The remainder of this paper is organized
as follows: section 2 provides the review of literature. Section 3 presents methodology of the study.
The empirical results and discussion are provided in section 4 and section 5 presents concluding
remarks.
II. Review of Literature
The debate on whether or not financial markets promote economic growth has been an
interesting topic that has prompted tremendous empirical studies to be carried out on this subject.
Pardy (1992) in his seminal work has argued that in less developed countries capital markets are able
to mobilize domestic savings and allocate funds more efficiently. Spears (1991) reported that in the
early stages of development, financial intermediation induced economic growth. Similarly, Atje and
Jovanic (1993) concluded that stock markets have long-run impacts on economic growth and it was
also found that stock markets manipulate economic growth through a number of channels that are
liquidity, risk diversifications, acquisition of information about firms, corporate governance and
savings mobilization. Demirguc-Kunt (1994) and Levine and Zervos (1996) have supported the view
that stock markets promote economic growth. With well-functional financial sector or banking
sector, stock markets can give a big boost to economic development (Rousseau and Wachtel 2000,
Beck and Levine, 2004). Levine and Zervos (1998) measured stock markets development along with
different magnitude and have suggested a strong statistically significant relationship between initial
stock market development and subsequent economic growth for forty-seven emerging economies.
Filer et al. (1999) examined stock market-growth nexus and exhibited significant causal relationship
going from stock market development to economic growth, particularly for less developed
countries. Chen and Wong (2004) elaborated that the nexus between stock returns and output
growth and found that the rate of stock returns is a leading indicator of output growth in the case of
four East Asian Countries. Similarly, Caporale et al. (2005) examined the dynamic interactions
between investment, stock market development and economic growth in Chile, Korea, Malaysia and
the Philippines and found stock market development promotes economic growth in the long run.
Adjasi and Biekpe (2005) found a significant positive impact of stock market development on
economic growth in countries, classified as upper middle-income economies. Moreover, Vazakidis
and Adamopoulos (2011) inferred that stock market development has larger effect on economic
growth in the United Kingdom. Recently, Ikikii and Nzomoi (2013) found that stock markets
development have had positive effect on economic growth in Kenya.

6
On the other hand, Singh (1997) focused his research on developing countries and
investigated the role of stock markets towards long run economic growth in the 1980s and 1990s.
He concluded that in developing countries, long run economic growth does not show dependency
towards the stock market. A study by Harris (1997) on forty-nine countries for the period 1980-
1991, found out that there is no significant relationship between stock market and economic growth.
Recently, Boubakari and Jin (2010) proposed a positive links between the stock market and
economic growth for some countries for which the stock market is liquid and highly active.
However, the causality relationship is rejected for the countries in which the stock market is small
and less liquid. Okoye and Nwisienyi (2013) found that the capital market in Nigeria has the
potentials for growth inducing but has not contributed meaningfully to the economic growth of
Nigeria.
Moreover, the empirical studies showed that causality runs in both the directions i.e.
economic growth causes the stock market development and vice versa (Arestis et al. 2001,
Demetriades and Hussein, 1996, Luintel and Khan, 1999). Tuncer and Alovsat (2000) investigated
the causal nexus between stock markets and economic growth for twenty countries and showed the
bi-directional causation between stock market development and economic growth for the selected
nations. Further, Shahbaz et al. (2008) confirmed the long-run bi-directional causality between stock
market development and economic growth in Pakistan. As regards to the research concerning India,
Kamaiah and Biswal (2000) attempted to assess the empirical relationship between stock market
development indicators and economic growth in India. They found stock market size was positively
associated with economic growth. However, there was no support for the association between stock
market liquidity and economic growth in India. Biswal and Veerashekharappa (2002) found that
stock market development plays a significant role in the economic growth process in India.
Agrawala and Tuteja (2007) confirmed a stable long run equilibrium relationship between stock
market developments and economic growth. Chakraborty (2007) revealed the causality runs from
growth rate of real GDP to stock market capitalization. Padhan (2007) and Paramati and Gupta
(2011) exposed the bidirectional relationship between stock market development indicators and
economic activity. Deb and Mukherjee (2008) and Acharya et al. (2009) observed a strong causality
runs from the stock market development to economic growth. Recently, Sahoo (2013) revealed that
market-based indicators of financial depth have positive impact on economic development in India.
7
However, he found no evidence of causality between market capitalization and economic
development.
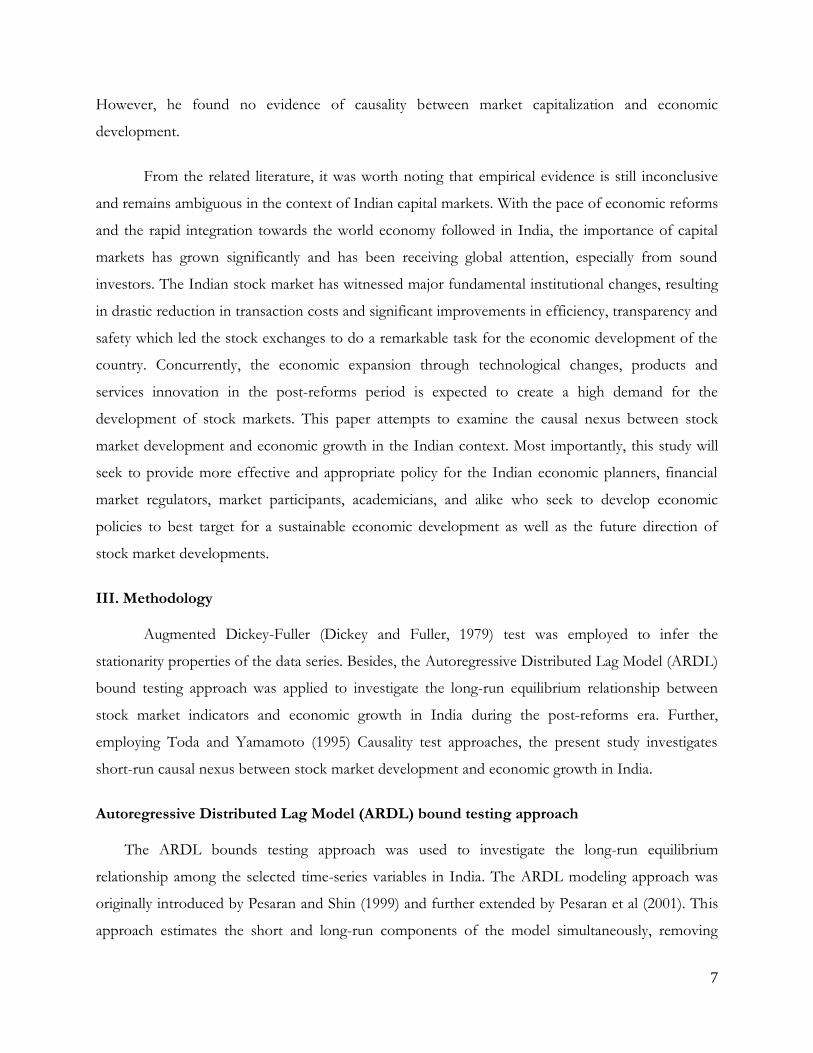
From the related literature, it was worth noting that empirical evidence is still inconclusive
and remains ambiguous in the context of Indian capital markets. With the pace of economic reforms
and the rapid integration towards the world economy followed in India, the importance of capital
markets has grown significantly and has been receiving global attention, especially from sound
investors. The Indian stock market has witnessed major fundamental institutional changes, resulting
in drastic reduction in transaction costs and significant improvements in efficiency, transparency and
safety which led the stock exchanges to do a remarkable task for the economic development of the
country. Concurrently, the economic expansion through technological changes, products and
services innovation in the post-reforms period is expected to create a high demand for the
development of stock markets. This paper attempts to examine the causal nexus between stock
market development and economic growth in the Indian context. Most importantly, this study will
seek to provide more effective and appropriate policy for the Indian economic planners, financial
market regulators, market participants, academicians, and alike who seek to develop economic
policies to best target for a sustainable economic development as well as the future direction of
stock market developments.
III. Methodology
Augmented Dickey-Fuller (Dickey and Fuller, 1979) test was employed to infer the
stationarity properties of the data series. Besides, the Autoregressive Distributed Lag Model (ARDL)
bound testing approach was applied to investigate the long-run equilibrium relationship between
stock market indicators and economic growth in India during the post-reforms era. Further,
employing Toda and Yamamoto (1995) Causality test approaches, the present study investigates
short-run causal nexus between stock market development and economic growth in India.
Autoregressive Distributed Lag Model (ARDL) bound testing approach
The ARDL bounds testing approach was used to investigate the long-run equilibrium
relationship among the selected time-series variables in India. The ARDL modeling approach was
originally introduced by Pesaran and Shin (1999) and further extended by Pesaran et al (2001). This
approach estimates the short and long-run components of the model simultaneously, removing
8
problems associated with omitted variables and autocorrelation. Besides, the standard Wald or F-
statistics used in the bounds test has a non-standard distribution under the null hypothesis of no-
cointegration relationship between the examined variables, irrespective whether the underlying
variables are I(0), I(1) or fractionally integrated. Moreover, once the orders of the lags in the ARDL
model have been appropriately selected, we can estimate the cointegration relationship using a
simple Ordinary Least Square (OLS) method. The ARDL-Unrestricted error correction model used
in the present study has the following form as expressed in Equations (1-3):
tititit
m
i
n
i
p
iititit InYInYInYInYInYInYInY
332211
1 1 113322101 (1)
m
i
n
i
p
ititititititit InYInYInYInYInYInYInY
1 1 123321123321102 (2)
m
i
n
i
p
ititititititit InYInYInYInYInYInYInY
1 1 133221133221103 (3)
where, Y1, Y2 and Y3 represents selected time series variables for the study such as Stock Market
Capitalisation (MC), Stock Market Turnover Ratio (TR) and Index of Industrial Production (IIP),
respectively. t is the time dimension and ∆ denotes a first difference operator; β0 is an intercept and
εt is a white noise error term.
The first step in the ARDL bounds testing approach is to estimate Equations (1-4) using
ordinary least squares method in order to test for existence of a long-run relationship among the
variables by conducting an F-test for the joint significance of the coefficients of the lagged level
variables, i.e., H0: β1= β2= β3= 0 against the alternative H1: β1 β2 β3 0, which normalize on Y1 by
F(Y1/Y2, Y3), Y2 by F(Y2/Y1, Y3) and Y3 by F(Y3/Y1, Y2), respectively. Two sets of critical value
bounds for the F-statistic are generated by Pesaran et al (2001). If the computed F-statistic falls
below the lower bound critical value, the null hypothesis of no cointegration cannot be rejected.
Contrary, if the computed F-statistic lies above the upper bound critical value; the null hypothesis is
rejected, implying that there is a long-run cointegration relationship amongst the variables in the
model. Nevertheless, if the calculated value falls within the bounds, inference is inconclusive.
Vector Error Correction ModelThe Vector Error Correction Model (VECM) was employed to investigate the temporal
causality between stock market development and economic growth in India during the post-reforms
period. The Granger Representation Theorem (Engle and Granger, 1987) states that if a set of

9
variables is cointegrated, then there exists a valid error correction representation of the data, in
which the short-term dynamics of the variables in this system are influenced by the deviation from
long-term equilibrium. In a VECM, short-term causal effects are indicated by changes in other
differenced explanatory variables and the long-term relationship is implied by the level of
disequilibrium in the cointegration relationship, i.e., the lagged error correction term (ECT). Hence,
the Vector Error Correction model is useful for detecting short- and long-term Granger causality
tests (Granger, 1969). The causal nexus between selected time-series variables was investigated by
estimating the following Vector Error Correction Model (VECM) (Johansen, 1988 and Johansen
and Juselius, 1990):
ΔY1t = µ1 + γ1zt-1 +
1p
1i
θ1iΔY1t-i +
1p
1i
Ʊ1iΔY2t-i + ε1t (4)
ΔY2t = µ2 + γ2zt-1 +
1p
1i
θ2iΔY1t-i +
1p
1i
Ʊ2iΔY2t-i + ε1t (5)
where, Y1 and Y2 represents the stock market development indicators, viz. market capitalization and
stock market turnover ratio and index of industrial production, respectively. γ’szt-1 is the error
correction term derived from the cointegrating vector. θ and Ʊ are the short-run parameters to be
estimated, p is the lag length, and εt are assumed to be stationary random processes with a mean of
zero and constant variance.
For each equation in the VEC Model, we employ short-term Granger causality to test
whether endogenous variables can be treated as exogenous by the joint significance of the
coefficients of each of the other lagged endogenous variables in that equation. The short-term
significance of sum of the each lagged explanatory variables (θ’s and Ʊ’s) can be exposed either
through joint F or Wald χ2 test. Besides, the long-term causality is implied by the significance of the
t-tests of the lagged error correction term (zt-1(ECTt-1)). However, the non-significance of both the t-
statistics and joint F or Wald χ2 tests in the Vector Error Correction Model indicates econometric
exogeneity of the dependent variable.
Toda and Yamamoto Version of Granger CausalityTurning to methodology, we note that causality is meant in the Granger (1969) sense; that is,
the purpose is to find out whether one variable precedes another variable. For this purpose, the
following vector autoregressive model of order p, VAR(p), is utilized:

10
tptptt yAyAvy 11 (6)
with ty being the integrated and possible cointegrated variables, v the vector of intercepts, iA the
vector parameter for lag i ( pi ,,1 ) and t the vector of error terms. It is well known in the
econometric literature that if the variables are integrated, asymptotical distributions cannot be used
to test for restrictions in the VAR. In particular, Wald tests for Granger causality are known to result
in non-standard limiting distributions depending on the cointegration properties of the system and,
possibly, in nuisance parameters (see Toda and Phillips, 1993). In order to find a solution to this
problem, Toda and Yamamoto (1995) and Dolado and Lütkepohl (1996) proposed the following
augmented VAR models in order to test causality if the variables are integrated and if the
assumption of normality of the error term vector is fulfilled.
tdptdpptptt yAyAyAvy 11 (7)
where d is equal to the integration order of the variables involved in the VAR system. The k th
element of ty does not Granger-cause the jth element of ty if the following hypothesis is not
rejected at a given level of significance;
H0: the row j, column k element in iA equals zero for pi ,,1
Hence, the Toda and Yamamoto Distributed Lag (TYDL) procedure consists on over-fit a level
VAR specification with a total of p=(k+dmax) lags where k is the lag-length chosen by using some
information criteria and dmax is the maximal order of integration for the time series data involved in
the system. The asymptotic chi-squared distributed MWALD test proposed is applied to the first k
VAR coefficient matrix while the coefficient matrices of the last dmax lagged vectors in the model
are ignored. More precisely, the underlying intuition of this approach to Granger causality is that
whenever the elements in at least one of the coefficient matrices iA are not restricted at all under
the null hypothesis (for instance, the non causality restriction which is involved in a VAR modelling
elements from all iA , ki ,,1 ) it is enough to add extra and redundant lags in estimating the
parameters of the structure to ensure the standard asymptotic properties of the Wald statistic which
maintains its usual limiting 2 distribution. The test has to be performed on the iA , ki ,,1 only
with the last redundant lags ignored. Therefore, the TYDL procedure enables the proposed
MWALD statistic to test linear or nonlinear restrictions on these k coefficient matrices using the
standard asymptotic theory. At this point it is essential to note that the TYDL procedure does not
call for pre-testing unit roots and cointegration before causality, testing avoiding results that may

11
suffer from size distortions and inference biases leading to an over-rejection of the non-causal null
hypothesis. Of course, there may be a loss of power due to over-specifying the lag length. The loss
in power may not be substantial if the true order p is large and the dimension k is small or moderate
because of the relative reduction in the estimation precision due to one extra lag.
The Toda and Yamamoto (1995) augmented Granger causality test has been obtained in the
present study by estimating the following VAR model:
(8)uLIIPcLSDbaLSD 1
n
1jjt1jjt
n
1j1j1t t
(9)uLSDcIIPbaLIIP 2
n
1jjt2jjt
n
1j2j2t t
where, LSD and LIIP represents the log of stock market development indicators, viz. market
capitalization and stock market turnover ratio and log of index of industrial production (IIP),
respectively.
Impulse Response FunctionFinally, the study applied Impulse Response Functions (IRFs) to produce the time path of
the dependent variables in the VAR, to shocks from all the explanatory variables. If the system of
equations is stable any shock should decline to zero, an unstable system would produce an explosive
time path. Impulse response analysis traces out the responsiveness of the dependent variable in VAR
to shocks to each of the other explanatory variables over the period of time. A shock to a variable in
a VAR framework not only directly affects that variable, but also transmits its effect to all other
endogenous variables in the system.
The present study depends on monthly data that ranges from June 1991 to June 2013. The
data on stock market development was measured by two proxies, viz. market capitalization as a
percent of IIP and turnover ratio, which is the value of total traded shares expressed as a percentage
of total market capitalization. The former variable shows the overall size of the stock market as a
percentage of IIP at constant price. Market capitalization equals the value of listed domestic shares
on domestic exchanges divided by IIP. The assumption behind this measure is that overall market
size is positively correlated with the ability to mobilize capital and diversify risk on an economy-wide
basis (Levine and Zervos, 1996). The latter variable i.e. turnover ratio was used as a measure of
liquidity. It equals the value of total domestic shares traded on domestic exchanges divided by the
market capitalization. A high value for total value traded may result from high trading activity in

12
certain active stocks, while there may also be a significant number of relatively inactive shares listed
on the same stock exchange. In this case, a better indicator of stock market activity is the turnover
ratio. Specifically, turnover measures the volume of domestic equities traded on domestic exchanges
relative to the size of the market. And finally the economic growth was measured by IIP i.e. Index of
Industrial Production (as a proxy variable for economic growth). All the necessary information for
the study was collected from Handbook of statistics on the Indian Economy, Reserve Bank of India,
Mumbai.
IV. Estimation resultsTo set the stage for the cointegration test, the order of integration of the variables is initially
determined using the Augmented Dickey-Fuller (ADF) test. The testing procedures are based on the
null hypothesis that a unit root exists in the autoregressive representation of the series. The unit root
test results reported in Table 1 shows that index of industrial production and market capitalisation
variables are non-stationary at levels and are stationary after first differencing, implying the first
order of integration, I(1). The market turnover ratio series is found to be stationary at the level and
the order of integration is zero, I(0).
Table 1 Augmented Dickey-Fuller (ADF) Test
Variables ADF Teststatistics( levels)
ADF Test statistics( 1st difference)
IIP -0.917 -2.588***MC -0.864 -16.602*TR -6.952* -
Notes: * and *** denotes that the null hypothesis that the variableconcerned is non-stationary can be rejected at one percent and tenpercent significance level, respectively. IIP, MC and TR representsIndex of Industrial Production, Market Capitalisation and Turnoverratio, respectively.
Since the order of the stationary is I(0) and I(1), the ARDL Bounds test approach for
Cointegration relationship based on equations (1-3) is applied for finding the long-run equilibrium
relationship between the variables and its results are depicted in Table 2. The appropriate lag length
was selected on the basis of Akaike Information Criterion (AIC) for the bounds testing approach
because of its best performance in small sample (Lütkepohl, 1991). The empirical results reveal that
calculated F-statistics are found to be higher than the upper bound critical value at one percent level
of significance when IIP is regressed on market capitalisation and vice versa, indicating there is a

13
stable long-run cointegration relationship between market capitalisation and IIP. Similarly, the
calculated F-statistics for turnover ratio and IIP suggests that the null hypotheses of no cointegrating
relationship are rejected at one percent levels, implying the existence of a level relationship (a long-
run relationship) between turnover ratio and IIP and vice versa. By and large, the ARDL
Cointegration test confirms a well defined long-run equilibrium relationship among the stock market
development indicators and economic growth in India.
Table 2 ARDL Cointegration Bound Testing Approach
Stock Market Capitalisation and Economic GrowthModel Specification F-statistics Inference
FMC(MC/IIP) 6.844* CointegrationFIIP(IIP/MC) 7.490* Cointegration
Stock Market Turnover Ratio and Economic GrowthFTR(TR/IIP) 8.307* CointegrationFIIP(IIP/TR) 7.075* Cointegration
Notes: * indicates computed statistic falls above the upper bound value. Asymptotic criticalvalue bounds are obtained from Pesaran et al. 2001, p. 300; Case III: Unrestricted intercept andno trend for k=2. Lower bound I(0) = 4.85 and Upper bound I(1) = 6.36 at one percentsignificance level. IIP, MC and TR represents Index of Industrial Production, MarketCapitalisation and Turnover ratio, respectively.
Having established the long-run relationship, the next step is to estimate a Granger causality
test based on vector error correction model (VECM) and the results are presented in Table 3. The
coefficients of lagged error correction term measures how the dependent variable adjusts to the
previous period’s deviation from long-run equilibrium. In the table result, it is clear that the estimate
of lagged error correction term (ECT) of IIP equation has the expected negative sign and it is
statistically significant at one percent level, with the speed of convergence to equilibrium of 11
percent, implying that the market capitalisation influences the IIP in the long-term. Besides, the
error correction coefficient of market capitalisation equation is found to be statistically significant at
one percent level, suggesting IIP influences the market capitalisation in the long-term. Moreover, the
empirical results pertaining to the turnover ratio and IIP reveal that error correction coefficient of
IIP is found to be negative and significant at one percent level, implying turnover ratio leads to IIP
in the long-run. By and large, the error correction coefficients of the VECM confirm bidirectional
causality between market capitalisation and economic growth and unidirectional causation runs from
turnover ratio to economic growth in the long-run. For the short-run, the Wald-F test results
suggest bidirectional relationship between market capitalisation and IIP and the one-way causality
runs from market turnover ratio to IIP in India.

14
Table 3 Granger Causality test results based on VECM
DependentVariables
Stock Market Capitalisation and Economic GrowthShort-run Lagged Differences based on Wald-F statistics
ΔIIP ΔMC Lagged ECTΔIIP -- 35.081*
(0.000)-0.112*[-3.702] MC↔IIP
ΔMC 27.885*(0.000)
-- 0.455*[7.669]
Stock Market Turnover Ratio and Economic GrowthΔIIP ΔTR Lagged ECT
ΔIIP -- 3.712(0.715)
-0.352*[-6.880] MTR→IIP
ΔTR 49.538*(0.000)
-- -0.020[-0.320]
Notes: * denotes significant at 1% level. [ ] and ( ) indicates the t-value and p-value, respectively. IIP, MCand TR represents Index of Industrial Production, Market Capitalisation and Turnover ratio, respectively.
Further the study employed the Toda-Yamamoto (1995) procedure to examine the causal
nexus between stock market development and economic growth in India and its result are presented
in Table 4. The result of causality Modified WALD test obtained from the SUR estimation of the
level VAR model suggests that the null hypotheses of ‘MC does not Granger causes IIP’ and IIP
does not Granger causes MC’ were rejected at five and one percent level, respectively. This shows
the existence of reciprocal relationship between market capitalization and IIP in India. Besides, the
null hypothesis of ‘TR does not Granger Cause IIP’ is rejected at one percent level, implying that
turnover ratio do Granger causes IIP in India. This result is consistent with the earlier findings of
vector error correction model.
Table 4 Granger-Causality based on Toda and Yamamoto Modified Wald test
EquationsStock Market Capitalisation and Economic Growth
Wald-χ2
StatisticProbability
ValueInference
H0: MC does not Granger Cause IIPH0: IIP does not Granger Cause MC
19.467** 0.012 MC↔IIP38.457* 0.000
Stock Market Turnover Ratio and Economic GrowthH0: TR does not Granger Cause IIP 26.931* 0.000 TR→IIPH0: IIP does not Granger Cause TR 6.077 0.530
Notes: The underlying model for the two equation system is a Seemingly Unrelated Regression (SUR) modeland the lag order is selected based on Akaike Information Criterion (AIC). * and ** denotes significant at 1%and 5% confidence level, respectively.
15
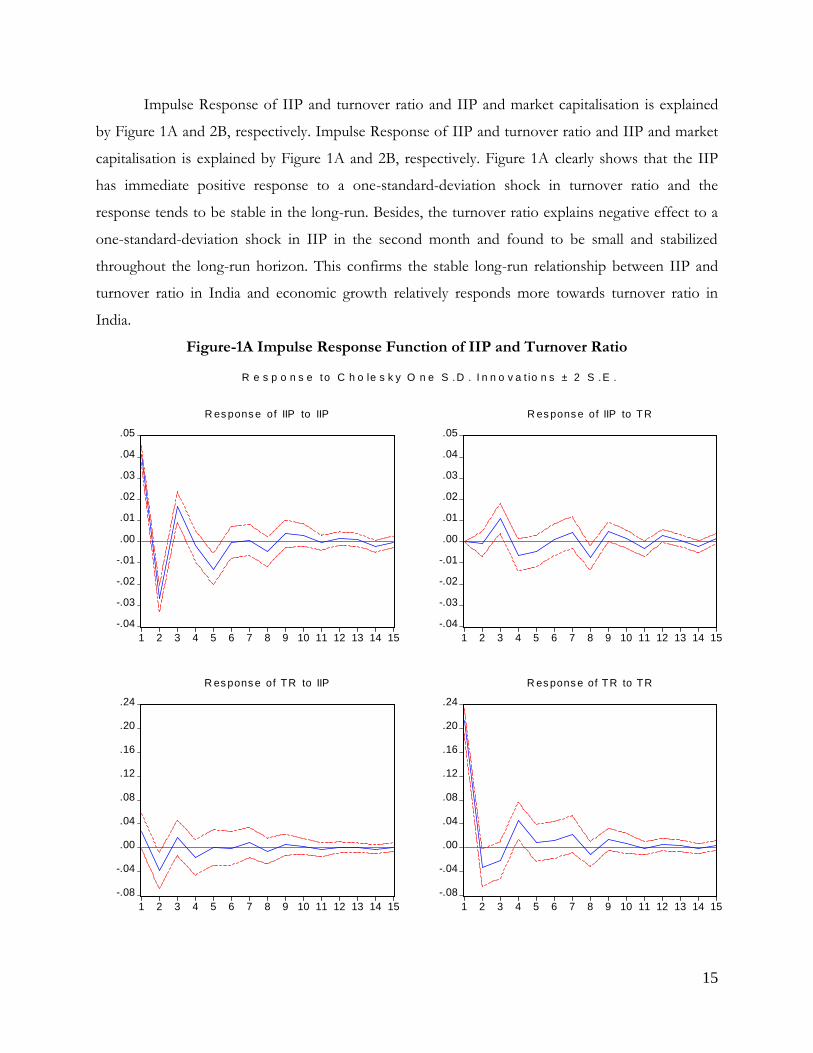
Impulse Response of IIP and turnover ratio and IIP and market capitalisation is explained
by Figure 1A and 2B, respectively. Impulse Response of IIP and turnover ratio and IIP and market
capitalisation is explained by Figure 1A and 2B, respectively. Figure 1A clearly shows that the IIP
has immediate positive response to a one-standard-deviation shock in turnover ratio and the
response tends to be stable in the long-run. Besides, the turnover ratio explains negative effect to a
one-standard-deviation shock in IIP in the second month and found to be small and stabilized
throughout the long-run horizon. This confirms the stable long-run relationship between IIP and
turnover ratio in India and economic growth relatively responds more towards turnover ratio in
India.
Figure-1A Impulse Response Function of IIP and Turnover Ratio
-.04
-.03
-.02
-.01
.00
.01
.02
.03
.04
.05
1 2 3 4 5 6 7 8 9 10 11 12 13 14 15
R es pons e of IIP to IIP
-.04
-.03
-.02
-.01
.00
.01
.02
.03
.04
.05
1 2 3 4 5 6 7 8 9 10 11 12 13 14 15
R es pons e of IIP to TR
-.08
-.04
.00
.04
.08
.12
.16
.20
.24
1 2 3 4 5 6 7 8 9 10 11 12 13 14 15
R es pons e of TR to IIP
-.08
-.04
.00
.04
.08
.12
.16
.20
.24
1 2 3 4 5 6 7 8 9 10 11 12 13 14 15
R es pons e of TR to TR
R e s p o n s e to C h o le s k y O n e S .D . I n n o v a t io n s ± 2 S .E .

16
Figure 1B depicts that the response of IIP to market capitalisation seem to be negative in the
third month and then becomes stable throughout the time period. Besides, the market capitalisation
has immediate negative response to a one-standard deviation shock in IIP and tends to show
positive and stable effect throughout the proceeding months. It can be inferred that IIP and market
capitalisation has a long-term relations in India. By and large, the results obtained from Figures 1A
and 1B appear to be consistent with the results obtained from the cointegraton and causality tests.
Figure-1B Impulse Response Function of IIP and Market Capitalisation
By and large, the Granger-Causality based on VECM and Toda and Yamamoto Modified
Wald tests result confirms bidirectional causality between market capitalization and economic
growth and unidirectional causation runs from market turnover ratio and economic growth in India.
-.04
-.03
-.02
-.01
.00
.01
.02
.03
.04
.05
1 2 3 4 5 6 7 8 9 10 11 12 13 14 15
R es pons e of IIP to IIP
-.04
-.03
-.02
-.01
.00
.01
.02
.03
.04
.05
1 2 3 4 5 6 7 8 9 10 11 12 13 14 15
R es pons e of IIP to MC
-.08
-.04
.00
.04
.08
.12
1 2 3 4 5 6 7 8 9 10 11 12 13 14 15
R es pons e of MC to IIP
-.08
-.04
.00
.04
.08
.12
1 2 3 4 5 6 7 8 9 10 11 12 13 14 15
R es pons e of MC to MC
R e s p o n s e to C h o le s k y O n e S .D . I n n o v a t io n s ± 2 S .E .
17
It can be inferred that the stock market development indicators viz. market capitalisation and
turnover ratio have a positive influence on economic growth in India. Therefore, the present study
recommends that the capital market regulators should implement effective policy frameworks
towards the development of Indian stock market in order to substantially enhance the size, depth
and liquidity of the Indian stock market which in turn leads to increased economic activities.
Further, the government should prioritize the development of the stock market through relaxing
laws and of listing requirements for investors so as to encourage more market participants on the
stock exchange and thus increases competition and quality of securities investments resulting in a
significant influence on economic growth in India.
V. ConclusionOne of the most enduring debates in economics is whether stock market development
causes economic growth or whether it is a consequence of increased economic activity. The present
study investigates the direction of causality between stock market development and economic
growth in the Indian context. Using the cointegration and causality tests for the period June 1991 to
June 2013, the study confirms a well defined long-run equilibrium relationship among the stock
market development indicators and economic growth in India. Besides, the empirical results shows
bidirectional causality between market capitalisation and economic growth and unidirectional
causation runs from turnover ratio to economic growth in the long-run and short-run. By and large,
it can be inferred that the stock market development indicators viz. market capitalisation and
turnover ratio have a positive influence on economic growth in India. Therefore, the present study
recommends that the capital market regulators should implement effective policy frameworks
towards the development of Indian stock market in order to substantially enhance the size, depth
and liquidity of the Indian stock market which in turn leads to increased economic activities.
Further, the government should prioritize the development of the stock market through relaxing
laws and of listing requirements for investors so as to encourage more market participants on the
stock exchange and thus increases competition and quality of securities investments resulting in a
significant influence on economic growth in India.

18
References
Acharya, D., Amanulla, S. and Joy, S. (2009). ‘Financial Development and Economic Growth inIndian States: An Examination’, International Research Journal of Finance and Economics,Issue 24, 117-130.
Adjasi, C. K. D. and Biekpe, N. B. (2006), ‘Stock Market Development and Economic Growth: TheCase of Selected African Countries’, African Development Review, 18 (1), pp.144–161.
Agrawalla, R. K. and Tuteja, S. K. (2007), ‘Causality between Stock Market Development andEconomic Growth: A Case Study of India’, Journal of Management Research, 7(3), pp.158-168.
Arestis, P., Demetriades, P. O. and Luintel, K. B. (2001), ‘Financial Development and EconomicGrowth: The Role of Stock Markets’, Journal of Money, Credit and Banking, 33(1), pp.16-41.
Atje, R. and Jovanovic, B. (1993), ‘Stock Markets and Development’, European Economic Review,37, pp.632 -640.
Beck , T. and Levine, T. (2004), ‘Stock markets, banks, and growth: Panel evidence’,Journal of Banking and Finance, 28(3), pp.423-442.
Biswal, P. C. and Kamaiah, B., (2000), ‘On Stock Market Development, Banks and EconomicGrowth in India’, Working Paper No.69, Institute for Social and Economic Change,Bangalore.
Biswal, P. C. and Veerashekarappa (2002), ‘Stock Market Development and Economic Growth inIndia’, Indian Journal of Economics, 82(327), pp.34-47.
Boubakari, A. A. and Jin, D. (2010), ‘The Role of Stock Market Development in Economic Growth:Evidence from Some Euro next Countries’, 1(1), pp.14-20.
Caporale, G. M., Howells, P. and Soliman, A. M. (2005), ‘Endogenous Growth Models and StockMarket Development: Evidence from Four Countries’, Review of Development Economics,9(2), pp.166-176.
Chakraborty (2007), ‘Does Financial Development cause Economic Growth? The Case of India’,Occasional Paper No. 9, Institute of Development Studies, Kolkata.
Chen, L. and Wong, A. (2004), ‘Is Rate of Stock Returns a Leading Indicator of Output Growth? Incase of Four East Asian Countries’, Unpublished. In: M. Shahbaz, N. Ahmed and L. Ali(2008), ‘Stock Market Development and Economic Growth: ARDL Causality in Pakistan’,International Journal of Finance and Economics, 14, pp.182-195.
Deb S. G. and Mukherjee J. (2008), ‘Does Stock Market Development Cause Economic Growth? ATime Series Analysis for Indian Economy’, International Research Journal of Finance andEconomics, 21, pp.142-149.

19
Demetriades, P. O. and Hussein, K. A. (1996), ‘Does Financial Development Cause EconomicGrowth? Time-series Evidence from 16 Countries’, Journal of Development Economics,51(2), pp.387-411.
Demirguc-Kunt, A. (1994), ‘Developing Country Capital Structure and Emerging Stock Markets’,Policy Research Working Papers (Financial Policy and Systems) No. 933, World Bank,Washington, D.C.
Dickey, D. A. and Fuller, W. A. (1979), ‘Distribution of the Estimators for Autoregressive TimeSeries with a Unit Root’, Journal of the American Statistical Association, 74(36), pp. 427-431.
Dolado, J. J., Lütkepohl, H. (1996), ‘Making Wald tests work for cointegrated VAR systems’,Econometric Review, 15, pp.369-386.
Economic Survey (2008-09), Government of India, Ministry of Finance, New Delhi.
Engle, R. F. and C.W.J. Granger (1987), ‘Cointegration and Error-Correction: Representation,Estimation, and Testing’, Econometrica, 55, pp. 251-276.
Filer, R. K., Hanousek, J. and Campos, N. F. (1999), ‘Do Stock Markets Promote EconomicGrowth’, William Davidson Institute Working Papers Series 267, William Davidson Instituteat the University of Michigan.
Goldsmith, R. W. (1969), ‘Financial structure and development’. New Haven, CT: Yale UniversityPress.
Granger, C. W. J. (1969), ‘Investigating causal relations by econometric models and cross- spectralmethods’, Econometrica, 37, pp.424-438.
Gupta, O. P. (2002), ‘Effect of Introduction of Index Futures on Stock Market Volatility: TheIndian Evidence’, Sixth Capital Market Conference 2002, UTIICM, Mumbai.
Gurley, J., & Shaw, E. (1967), ‘Financial structure and economic development’, EconomicDevelopment and Cultural Change, 15, pp.257–268.
Harris, R. (1997), ‘Stock market and development: A re-assessment’, European Economic Review,41(1), pp.139-146.
Ikikii, M. S. and Nzomoi, N. J. (2013), ‘An Analysis of the Effects of Stock Market Development onEconomic Growth in Kenya’, International Journal of Economics and Finance, 5(11),pp.145-151.
Johansen, S. (1988), ‘Statistical Analysis and Cointegrating Vectors’, Journal of Economic Dynamicsand Control, 12(4), pp.231-254.

20
Johansen, S. and Juselius, K. (1990), ‘Maximum Likelihood Estimation and Inference on Co-integration with Applications for the Demand for Money’, Oxford Bulletin of Economicsand Statistics, 52(2), pp.169-210.
Jung, W. S. (1986), ‘Financial Development and Economic Growth: International Evidence’,Economic Development and Cultural Change, 34, pp.336–346.
King, R. and Levine, R. (1993a), ‘Finance and Growth: Schumpeter Might be Right’, QuarterlyJournal of Economics, 108(3), pp.717-737.
King, R. and Levine, R., (1993b), ‘Finance Entrepreneurship and Growth’, Journal of MonetaryEconomics, 32, pp.513-542.
Levine, R., and Zervos, S. (1996), ‘Stock Market Development and Long Run Growth’, The WorldBank Economic Review, 10(2), pp.323-339.
Levine, R. and Zervos, A. (1998), ‘Stock Markets, Banks, and Economic Growth’,American Economic Review, 88(3), pp. 537-558.
Luintel, K. B. and Khan, M. (1999), ‘A Quantitative Reassessment of the Finance-Growth Nexus:Evidence from a Multivariate VAR’, Journal of Development Economics, 60(2), pp.381-405.
McKinnon, R. I. (1973), ‘Money and Capital in Economic Development’, Washington, D.C.:Brookings Institution, pp.177.
Okoye O. V. and Nwisienyi J. K. (2013), ‘The capital market contributions towards economicgrowth and development; the Nigerian experience’, Global Advanced Research Journal ofManagement and Business Studies, 2(2), pp.120-125.
Padhan, P. C. (2007), ‘The Nexus between Stock Market and Economic Activity: An EmpiricalAnalysis for India’, International Journal of Social Economics, 34(10), pp.741-753.
Paramati, S. R. and Gupta, R. (2011), ‘An Empirical Analysis of Stock Market Performance andEconomic Growth: Evidence from India’, International Research Journal of Finance andEconomics, 73, pp.133-149.
Pardy, R, (1992), ‘Institutional Reform in Emerging Securities Markets’, Policy Research WorkingPapers (Financial Policy and Systems) No. 907, World Bank, Washington, D.C.
Pesaran, M. H. and Shin Y. (1999), An Autoregressive Distributed Lag Modeling Approach toCointegration Analysis. in Storm, S. (Ed). “Econometrics and Economic Theory in the 20th
Century”, The Ragnar Frish Centennial Symposium, Cambridge University Press.
Pesaran, M. H., Shin, Y. and Smith, R. J. (2001), ‘Bound Testing Approaches to the Analysis ofLevel Relationships’, Journal of Applied Econometrics, 16, 289-326.

21
Rousseau P. L. and Wachtel, P. (2000), ‘Equity markets and growth: Cross country evidence ontiming and outcomes’, Journal of Banking and Finance, 24, pp.1933-1957.
Sahoo, S. (2013), ‘Financial Structures and Economic Development in India: An EmpiricalEvaluation’, RBI Working Paper No.02, Department of Economic and Policy Research,Reserve Bank of India, Mumbai.
Shahbaz, M., Ahmed M., and Ali, L., (2008), ‘Stock Market Development and Economic Growth:ARDL Causality in Pakistan’, International Research Journal of Finance and Economics, 14,pp.182-195.
Shaw, E. (1973), ‘Financial Deepening in Economic Development’, New York: Oxford UniversityPress.
Singh, A. (1997), ‘Financial Liberalization, Stock Markets and Economic development’, TheEconomic Journal, 107(442), pp.771-782.
Spears, A. (1991), ‘Financial Development and Economic Growth-Causality Tests’, AtlanticEconomic Journal, 19, pp.66-74.
Standard and Poor’s Global Stock Markets Fact book (2011), Standard & Poor's Financial ServicesLLC (S&P), New York, United States.
Toda, H. Y. and Phillips, P. C. B. (1993), ‘Vector Autoregressions and Causality’, Econometrica,61(6), pp.1367-1393.
Toda, H. Y., and Yamamoto, T. (1995), ‘Statistical inference in vector autoregressive with possiblyintegrated processes’, Journal of Econometrics, 66(1-2), pp.225-250.
Tuncer, G. C. and Alovsat, M. (2000), ‘Stock markets and economic growth: A causality test’, DoğuşUniversity Journal, 1(2), pp.124-131.
Vazakidis, A. and Adamopoulos, A. (2010), ‘The effect of stock and credit market development oneconomic growth: an empirical analysis for Italy’, International Research Journal of Financeand Economics, 41, pp.33-42.