Embed Size (px)
Citation preview

MPRAMunich Personal RePEc Archive
A partial equilibrium analysis of India’sagricultural export to GCC: lookingbeyond the status quo(2009-2015)
Salahuddin Ayyub and Prerana Manral
Indian Institute of Foreign Trade, Centre for WTO Studies
July 2017
Online at https://mpra.ub.uni-muenchen.de/84365/MPRA Paper No. 84365, posted 7 February 2018 10:04 UTC
1
A Partial Equilibrium Analysis of India’s Agricultural Export to
GCC: Looking Beyond the Status Quo (2009-2015)
Salahuddin Ayyub* & Prerana Manral1**
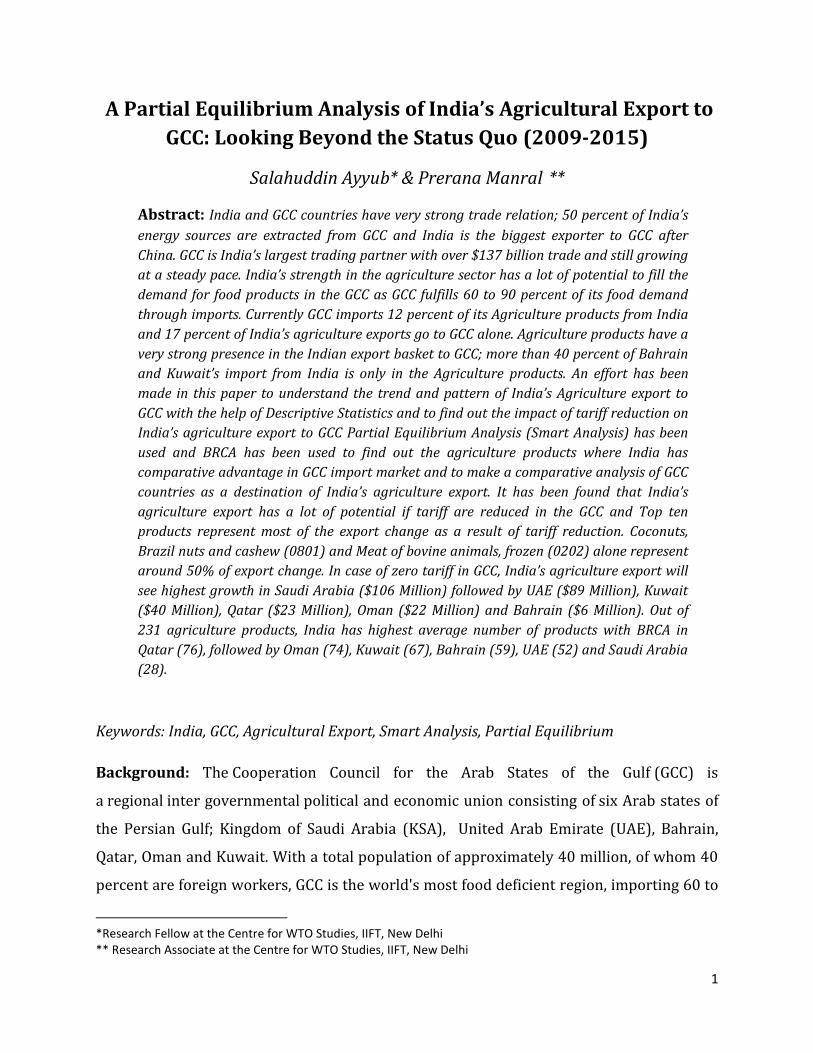
Abstract: India and GCC countries have very strong trade relation; 50 percent of India’s
energy sources are extracted from GCC and India is the biggest exporter to GCC after
China. GCC is India’s largest trading partner with over $137 billion trade and still growing
at a steady pace. India’s strength in the agriculture sector has a lot of potential to fill the
demand for food products in the GCC as GCC fulfills 60 to 90 percent of its food demand
through imports. Currently GCC imports 12 percent of its Agriculture products from India
and 17 percent of India’s agriculture exports go to GCC alone. Agriculture products have a
very strong presence in the Indian export basket to GCC; more than 40 percent of Bahrain
and Kuwait’s import from India is only in the Agriculture products. An effort has been
made in this paper to understand the trend and pattern of India’s Agriculture export to
GCC with the help of Descriptive Statistics and to find out the impact of tariff reduction on
India’s agriculture export to GCC Partial Equilibrium Analysis (Smart Analysis) has been
used and BRCA has been used to find out the agriculture products where India has
comparative advantage in GCC import market and to make a comparative analysis of GCC
countries as a destination of India’s agriculture export. It has been found that India’s
agriculture export has a lot of potential if tariff are reduced in the GCC and Top ten
products represent most of the export change as a result of tariff reduction. Coconuts,
Brazil nuts and cashew (0801) and Meat of bovine animals, frozen (0202) alone represent
around 50% of export change. In case of zero tariff in GCC, India’s agriculture export will
see highest growth in Saudi Arabia ($106 Million) followed by UAE ($89 Million), Kuwait
($40 Million), Qatar ($23 Million), Oman ($22 Million) and Bahrain ($6 Million). Out of
231 agriculture products, India has highest average number of products with BRCA in
Qatar (76), followed by Oman (74), Kuwait (67), Bahrain (59), UAE (52) and Saudi Arabia
(28).
Keywords: India, GCC, Agricultural Export, Smart Analysis, Partial Equilibrium
Background: The Cooperation Council for the Arab States of the Gulf (GCC) is
a regional inter governmental political and economic union consisting of six Arab states of
the Persian Gulf; Kingdom of Saudi Arabia (KSA), United Arab Emirate (UAE), Bahrain,
Qatar, Oman and Kuwait. With a total population of approximately 40 million, of whom 40
percent are foreign workers, GCC is the world's most food deficient region, importing 60 to
*Research Fellow at the Centre for WTO Studies, IIFT, New Delhi ** Research Associate at the Centre for WTO Studies, IIFT, New Delhi

2
90 percent of their food requirements. On the other hand, GCC is endowed with oil and gas
reserves estimated at some USD 35 trillion2 and happened to be among the countries with
highest per capita income.
India is as a major agricultural exporter, with exports rising from just over $5 billion in
2003 to a record of more than $30 billion in 2015. India had become the world’s seventh-
largest exporter of agricultural products in 2013 after touching the figure of $40 billion,
surpassing Australia.
India-GCC relationship has been intensifying since decades. The scope for interaction
between the people of India and GCC started when they crossed Arabian Sea for trade and
commerce. From the historical era both countries enjoy a continuous bond. The movement
of people led to the spread of culture and language. This played underpinning for strong
India-GCC relationship. India’s growing demand for energy for the industrialization and
GCC’s demand for food and human resources led to the strong economic relations and
prepared grounds for further bilateral trade and investment. Today GCC is India’s largest
trading partner with over $137 billion trade and still growing at a steady pace. GCC imports
12 percent (2015) of its Agriculture products from India and 17 percent (2015) of India’s
agriculture exports go to GCC alone. Agriculture products have a very strong presence in
the Indian export basket to GCC; more than 40 percent of Bahrain and Kuwait’s import
from India is only in the Agriculture products. Moreover, ongoing infrastructure
developments in GCC are employing more Indians and giving India more opportunity to go
for economic enhancement. There is an absolute mushrooming of Indian Diasporas in the
GCC. Around 7 million Indians are living in the GCC countries. There is an increase in
remittances from India Diaspora to about $38 billion out of total 70$ billion.3
While India has a substantial importance for the domestic agriculture, GCC has its focus on
uninterrupted food supplies. Indian government advocates both for production and
2 Shah, Mahendra. (2010) “Gulf Cooperation Council food security: balancing the equation”, Springer Nature, Macmillan Publishers Limited, Published online 25 April 2010. 3 ibid

3
exports for agricultural products.4 In the recent years the gap between the agricultural
production and consumption of GCC has widened. There is technological challenge to
increase its agricultural production due to shortage of land and water resources. India has
its large population dependent on agriculture which can enhance gains through increased
foreign exchange earnings by exporting agricultural goods to GCC.
The India-GCC alliance has been extended to political, economic, strategic and cultural
gravity. India pertain traditional and friendly bond with all the GCC countries. Now, their
relation stands on a bigger platform where GCC countries are moving ahead with economic
integration and promoting potential for cooperation in trade, investment, energy,
manpower etc. There is huge potential in the field of investment through FII and FDI. India
extracts it’s 50 per cent crude oil import demand from GCC. Oil blocks in Qatar and Oman
has been bid by India which is giving synergy to economic growth and energy security.
There is tremendous cooperation in the realm petrochemicals, fertilizers and energy
intensive industries. In the last few years many agreements and MoUs have been signed
which have given pace to intensified engagement between the two.
India has been pushing for stronger economic ties between India and GCC countries for
decades now; former Indian Prime Minister, Dr. Manmohan Singh stated on September 26,
2003 while chairing the Trade & Economic Relations Committee at UNGA, “The Gulf region,
like South-East and South Asia, is part of our natural economic hinterland. We must pursue
closer economic relations with all our neighbours in our wider Asian neighborhood”.
Recently, Indian External Affairs Minister, Ms. Sushma Swaraj held talks with her
counterparts from the Gulf Cooperation Council (GCC) in October, 2015 whose nations she
said were “an extended part of our neighbourhood”5. Ms. Sawaraj also called for early
finalization of the India-GCC Free Trade Agreement and operationalising the India-GCC
Framework Agreement.
The first India-GCC Industrial Conference comprising ministerial and business delegations
from the six member states of the GCC and India was held in Mumbai in February 2004. The 4 International Agricultural Trade Report, August 2014, Foreign Agriculture Service, United States Department of Agriculture. 5 The Hindu, Oct 1, 2015

4
conference issued a ‘Mumbai Declaration’ and focused on trade, investment, industrial and
technological cooperation. In March 2006, second India-GCC Industrial Conference took
place in Muscat-Oman and in May 2007, third conference took place in Mumbai with a
focus on two way investment. This conference was concluded by giving room for further
cooperation in field of industry and investment by conducting Senior Officials Meeting
(SOM) regularly. A Framework on Economic Cooperation was signed between India-GCC on
August 25, 2004 to explore possibility for free trade. There were negotiations by a three
member committee towards a FTA and non-tariff barriers that will affect exports to GCC by
India. In January 2009 at Riyadh third round of negotiations was held. The second India-
Arab investments project conclave was organized by FICCI from 8-9 February 2010 at New
Delhi where Nine Trade and Industry Ministers and over 280 delegates from 21 GCC and
Arab countries and Iraq comprising Government officials, business leaders and investment
houses participated. The idea behind this conclave was to enhance investment and
business relations between India and GCC.
India is considered to be the most important player in the GCC after China. Currently China
is paving its trade ties with GCC on the lines of FTA agreement which is scheduled to be
finalized by end of 2016. India should gain momentum in chasing the FTA route to maintain
its position and harness its trade potential with GCC in future.
Literature Review:
Many of the research papers dealt with the India-GCC trade potential and concluded that
there is tremendous potential in increasing food and agricultural exports to GCC countries
(Pradhan 2010, Woertz, 2010 and Intini, et al. 2012). Growing demand for agriculture
product in the GCC market has also been explained by some studies; in the recent year’s
food gap in the GCC has increased due to growing populations (Pradhan, 2010). Food
imports has reached to 60-90 per cent of food consumption in the GCC and by 2020
population is expected to reach 53.4 million by making at least one fifth of the people in
Bahrain, Oman, Qatar and Saudi Arabia food insecure (Intini et al. 2012).
There are some studies which analysed the nature of India-GCC trade; import basket of GCC
is highly diversified and not concentrated on fewer goods. Meat & edible offal of poultry

5
meat cereals such as rice and barley, cane or beet sugar and processed tobacco products
such as cigars, cheroots, cigarillos & cigarettes are the major agricultural product groups.
More than 50 percent of the imports are contributed to diverse range of products (Houcine
Boughanmi, Sarath Kodithuwakku and Jeevika Weerahewa, 2014).
RCA Analysis shows that at one digit level India has a revealed comparative advantage, but
they are relatively weak with RCA values of less than 3. India has a strong RCA in products
such as Rice, and Gold / Silverware / Jewellery. The analysis evince that despite India
having enormous export potential, it has not achieved the desired results. Feasible export
products are identified which are not exported to Gulf region. The paper concludes that
there are diversified potential exports sectors on which India should focus to enhance its
trade reach. India and the Gulf countries can benefit from each other by specializing from
bilateral trade liberalization. (Das & Pradhan, 2014).
Using Gravity Model it was found that coefficient per capita income of the trade partner is
quite low among the top ten world oil exporters, Saudi Arabia, Kuwait and the UAE which
signifies that the exporting commodities has an inelastic demand and are not affected by
income fluctuations in the importing country. Distance Variable is used in the analysis and
it states that there is a negative relation with trade. This is also influenced by the
geographical conditions and the characteristics of the main commodities. The export focus
is on relatively richer countries like Japan, South Korea, and the US, where the
transportation cost and distance criteria are not taken into consideration. GCC import
basket mainly consists of high-tech commodities like machinery and mechanical appliances
vehicles, electrical machinery and equipment, are imported from the developed countries,
such as the US, Japan, EU, S. Korea, as well as from the developing countries, namely China,
India, Thailand (Aysu İnsel and Mahmut Tekçe, 2009).
One of the major factors influencing India-GCC trade relation is that around 6.5 million
South Asians residing in GCC countries that is 17 per cent of the total resident population of
GCC. The structural changes in the food consumption patterns and increase in food demand
from GCC is greatly influenced by the immigrants from India. Those immigrants have a
significant effect on the trade relations between India and GCC (Karayil, 2007).

6
Bilateral trade and mutual interdependence between India and GCC has increased. But
Bahrain and Oman shows lower trade patterns (RigiLadez & Khan, 2014). The main
suppliers of rice, wheat, sugar, and live animals to the GCC region are countries like India,
Pakistan, Bangladesh, and Sri Lanka (Pradhan, 2010).
In contrast to the above positive findings supporting India-GCC trade relations there are
certain impediments to the growing trade relations. The trade scenario is focused on
consumption patterns and import basket serving to the South Asian expatriates living in
the GCC and GCC's energy exports to the subcontinent (Pradhan, 2010 and Karayil, 2007).
Further, GCC experience structural barriers while exporting to South Asia in general and
India in particular while exports from South Asia face a nominal duty of 5 percent and in
many cases a lower rate ranging from 1.5 percent to 2 percent in the GCC (Pradhan, 2010).
Literature is either dealing with the reasoning of high trade volumes, nature of trade,
potential of overall trade, and trade barriers. There are very few studies on India-GCC trade
relations specifically for agriculture sector and no study could be found which deals with
the effects of reduced tariffs on exports. The objectives of this paper are;
• To understand the trend and pattern of India’s Agriculture export to GCC
• To find out the impact of tariff reduction on India’s agriculture export to GCC
• To find out the agriculture products where India has comparative advantage in GCC
import market
• To make a comparative analysis of GCC countries as a destination of India’s
agriculture export
Pattern of India’s Total Exports to GCC:
Out of India’s total exports to the world, quite stable share of 15 to 18 percent is destined
just for the GCC countries during the period 2009-2015 as may be seen in the Table No.1
UAE has the largest share of India’s total exports to GCC with 64 percent to 81 percent.
India’s second destination in the GCC is Kingdom of Saudi Arabia (KSA) as it has a good
presence in the KSA’s import market with around 10 to 25 percent share in the total
imports of the kingdom. India’s share in the KSA’s total imports has grown in recent years

7
from 12 percent in the year 2009 to 25 percent in the year 2014 and then a sharp drop in
the next year to 17%. India’s share in the rest of the four GCC countries’ imports is below
5% with lowest in Bahrain at around 1 percent and highest in Oman at around 5 percent in
the recent years as depicted in the Figure No. 1 UAE’s dominance in the India’s exports
basket to the GCC is mainly due to the fact that most of India’s exports to the UAE is re-
exported to other destinations in the Middle Eastern and African countries. According to
Shayah & Qifeng, (2015), “The UAE is the world’s third-largest re-export market (trailing
only Hong Kong and Singapore)”6.
Table-1: GCC's Share in India's Total Exports
2009 2010 2011 2012 2013 2014 2015
GCC 18% 16% 15% 17% 16% 16% 16%
RoW 82% 84% 85% 83% 84% 84% 84%
Source: UN Comtrade (WITS), analysis by authors
6 Shayah M. Hazem, & Qifeng, Yang (2015) “Development of Free Zones in United Arab Emirates”, International Review of Research in Emerging Markets and the Global Economy (ISSN: 2311-3200), Vol: 1 Issue 2286.

8
Source: UN Comtrade (WITS), analysis by authors
Table-2: India's Share in GCC's Total Imports
2009 2010 2011 2012 2013 2014 2015
GCC 12% 12% 13% 11% 10% 10% 10%
RoW 88% 88% 87% 89% 90% 90% 90%
Source: UN Comtrade (WITS), analysis by authors
If we see the GCC’s import market, India happened to be one of the leading players with 10
to 13 percent share in the GCC’s total imports from the world in recent years. This share
has been quite stable during the period of study, with small variation of one to two percent.
Especially during the last three years, it has been constant at 10 percent as may be seen in
the Table No. 2. Among GCC countries, India has the strongest presence in the UAE and
India has been the second largest exporter to UAE after China. In terms of share in the total
imports, India has maintained its share in the UAE market between 14 to 19 percent during
the period 2009-2015; it was constant at 19 percent from 2009 to 2011 then fell to 17
12% 13%11%
17%
24% 25%
17%
80% 77% 81% 73%65% 64% 72%
2%
1%
2%1% 1%
2% 2%
1%
2%
1%
1% 1%
1%
1%
2%
5%
3%
2% 2%
2% 3%3%3%
3%
5%6%
5% 5%
0%
7%
100%
2009 2010 2011 2012 2013 2014 2015
Figure-1: Country-wise share in India's Total Exports to GCC
KSA
UAE
Qatar
Bahrain
Kuwait
Oman

9
percent in 2012 and now it is again stable at 14 percent since 2013. In terms of share, India
has a very good presence in Oman’s import market too as around 10 percent of the Oman’s
total imports originates from India. India’s presence in the imports of rest of the four GCC
countries, namely KSA, Qatar, Bahrain, and Kuwait is below 10 percent in terms of share as
may be seen in Figure No. 2.
Source: UN Comtrade (WITS), analysis by authors
5% 5% 5%
6%
7% 8%
5%
19% 19%19%
17%
14%14% 14%
3%2%
4%
3% 3%4% 4%
4%
8%
5% 5%6%
4%
5%5%
9%
7%
4% 4%4%
5%
9%
7%7%
10%
12%
9%
10%
0%
5%
10%
15%
20%
25%
2009 2010 2011 2012 2013 2014 2015
Figure-2: India's Share in GCC's Total Imports(Country-wise)
KSA
UAE
Qatar
Bahrain
Kuwait
Oman

10
Source: UN Comtrade (WITS), analysis by authors
Pattern of India’s Agriculture Exports to GCC:
Pattern and trend of India’s Agriculture exports to GCC is a bit different from the overall
exports. Kingdom of Saudi Arabia (KSA) has the highest share of India’s Agriculture export
to GCC followed by UAE in 2015. While in terms of total exports, KSA’s share in India’s total
exports to GCC is almost less than half of UAE’s share. It has also been observed that during
the period studied (2009-2015), UAE’s share in GCC is falling and KSA’s share is rising and
this is not because of falling imports of UAE but mainly because of the fact that KSA’s
agriculture import from India is rising every year. It has also been observed that 75 to 80
percent of India’s agriculture export to GCC is destined to KSA and UAE. Among the
remaining four countries of GCC, Kuwait is the biggest importer of India’s agriculture
exports with almost 10 to 12 percent share of India’s agriculture exports to GCC. Bahrain
and Qatar have the lowest share as may be seen in Figure No. 3.
34% 35%31%
33%
39% 40%37%
47% 46% 47%44%
38%34%
37%
2%2%
2%5%
4%6%
4%2%
2%
2% 2% 2% 2%5%
12% 12% 12%9% 10% 10% 10%
4% 4% 5%7% 8% 7% 6%
2009 2010 2011 2012 2013 2014 2015
Figure-3: Country-wise share in India's Agriculture Exports to GCC
KSA UAE Qatar Bahrain Kuwait Oman

11
Table-3: GCC's Share in India's Agriculture Exports
2009 2010 2011 2012 2013 2014 2015
GCC 20% 16% 14% 11% 12% 15% 17%
RoW 80% 84% 86% 89% 88% 85% 83%
Source: UN Comtrade (WITS), analysis by authors
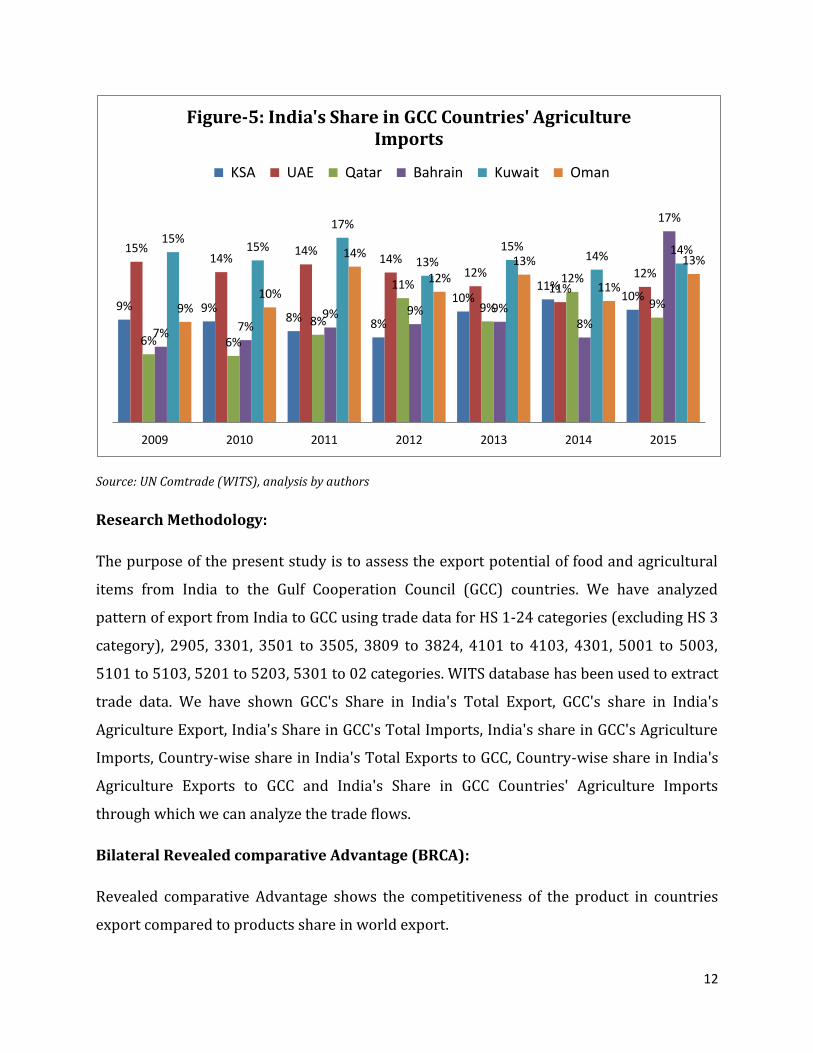
GCC has a good share of India’s agriculture exports. 20 percent of India’s agriculture
exports were for GCC in the year 2009, it has gone slightly down to 17 percent in 2015 as
may be seen in Table No.3. According to some studies, around 60 to 90 percent of the food
consumption in the GCC is out of imported food. A very good amount of these imports are
from India. Trade data reveals that GCC countries import 11 to 12 percent of their
agriculture products from India alone as may be seen in Table No. 4. At the country level,
India’s share of 11 to 12 percent in the GCC’s agriculture imports is quite evenly distributed
across countries with a bit higher shares in the Kingdom of Saudi Arabia followed by UAE
as may be seen in Figure No. 5.
Table-4: India's Share in GCC's Agriculture Imports
2009 2010 2011 2012 2013 2014 2015
GCC 12% 11% 12% 11% 11% 11% 12%
RoW 88% 89% 88% 89% 89% 89% 88%
Source: UN Comtrade (WITS), analysis by authors
12
Source: UN Comtrade (WITS), analysis by authors
Research Methodology:
The purpose of the present study is to assess the export potential of food and agricultural
items from India to the Gulf Cooperation Council (GCC) countries. We have analyzed
pattern of export from India to GCC using trade data for HS 1-24 categories (excluding HS 3
category), 2905, 3301, 3501 to 3505, 3809 to 3824, 4101 to 4103, 4301, 5001 to 5003,
5101 to 5103, 5201 to 5203, 5301 to 02 categories. WITS database has been used to extract
trade data. We have shown GCC's Share in India's Total Export, GCC's share in India's
Agriculture Export, India's Share in GCC's Total Imports, India's share in GCC's Agriculture
Imports, Country-wise share in India's Total Exports to GCC, Country-wise share in India's
Agriculture Exports to GCC and India's Share in GCC Countries' Agriculture Imports
through which we can analyze the trade flows.
Bilateral Revealed comparative Advantage (BRCA):
Revealed comparative Advantage shows the competitiveness of the product in countries
export compared to products share in world export.
9% 9%8% 8%
10%11%
10%
15%14%
14%14%
12%11%
12%
6% 6%
8%
11%
9%
12%
9%
7% 7%9% 9% 9%
8%
17%
15%15%
17%
13%15%
14% 14%
9%10%
14%
12%
13%
11%
13%
2009 2010 2011 2012 2013 2014 2015
Figure-5: India's Share in GCC Countries' Agriculture Imports
KSA UAE Qatar Bahrain Kuwait Oman

13
Bilateral RCA: Competitiveness of country i in a specific market
BRCA𝑖𝑗k = (
𝑥𝑖𝑗𝑘
𝑋𝑖𝑗) / (
𝑥𝑤𝑗𝑘
𝑋𝑤𝑗)
Normalized RCA = (RCA-1)/ (RCA+1)
Revealed comparative advantage indices reveals which industries a country has a
comparative advantage in producing goods from. The revealed comparative advantage
index developed by Balassa (Balassa, 1967) assumes that a country’s comparative
advantage is revealed by its exports to the world. Comparative advantage depends on pre-
trade relative prices. Principal determinants of these unobservable relative prices are
resource and factor endowments, stages of industrialization (that is level of technology),
and demand (Ariff, Mohamed and Tan EuChye, 1992).Difference in these determinants
across countries lead to differences in autarky relative prices across countries. When
countries trade, they export the goods in which they have comparative advantage and
import those in which they have comparative disadvantage.
The index of revealed comparative advantage (RCAij) can be interpreted “If it takes a value
greater than unity, the country has a revealed comparative advantage in that product.”
We have used Normalized RCA analysis to show number of commodities with advantage
and disadvantage with only advantage, with only disadvantage; both advantage and
disadvantage.
An index of less than zero suggests a revealed comparative disadvantage in a given
product, and an index of greater than suggests a revealed comparative advantage in the
product. The normalization means the index is suitable for cross country, cross sector and
cross time comparisons.

14
Partial Equilibrium Analysis (Smart Analysis):
SMART is a partial equilibrium modeling tool included in WITS that is used for market
analysis. It focuses on one importing market and its exporting partners and assesses the
impact of a tariff change scenario by estimating new values for a set of variables
Single Market Partial Equilibrium Simulation Tool (Smart analysis) from WITS is used to
show Change in India's Total Exports to GCC in case of FTA (Zero Tariff)
Data and Data Sources:
World Integrated Trade Solution WITS gives access to international trade and protection
related data and offers built-in analytical tools allowing users to assess the impact of tariff
changes. WITS is a software developed by the World Bank in close collaboration and
consultation with UNCTAD, ITC, UNSD and WTO. It includes several databases provided by
partner international organizations and other sources. This combination of various data
sources within unique software makes data retrieval and analysis easy and more
comprehensive.
The Harmonized Commodity Description and Coding System is a multipurpose
international nomenclature for the classification of products developed by the World
Customs Organization. It is generally referred to as Harmonized System (HS). The HS
arranged in 99 chapters, in which first HS 1-24 are agriculture products including animal
and animal products, vegetable products and foodstuffs. At the international level, the
Harmonized System (HS) for classifying goods is disaggregated at different levels such as 2-
digit, 4-digit and 6-digit levels.
HS chapters HS 1-24 categories (excluding HS 3 category), 2905, 3301, 3501 to 3505, 3809
to 3824, 4101 to 4103, 4301, 5001 to 5003, 5101 to 5103, 5201 to 5203, 5301 to 02
categories were obtained from WITS from 2009 to 2015.
Current tariff structure data between India and GCC has been extracted from Tariff analysis
online.

15
Results and Discussion:
Smart Analysis:
Out of the 231 products that have been analyzed in this study as agriculture products, tariff
rates of only 227 could be found in the database of Tariff Analysis Online (TAO), WTO. The
tariff structure in the GCC for the agriculture products is such that out of those 227
products, tariff rates for around 50 products are zero in all the GCC countries with slight
difference of product selection.
Average tariff rate for agriculture products in the GCC was 3.84 percent according to the
data collected for the year 2014 if the tariff line for HS-2403 (Other manufactured tobacco
and manufactured tobacco substitutes; “homogenized” or “reconstituted” tobacco; tobacco
extracts and essences) is excluded as it has 100 percent tariff rate. The average tariff goes
up to 4.19 percent for GCC if the tariff line for the product HS-2403 is included.
Smart Analysis has been used with the single scenario of zero tariff rates for each
agriculture product and for each trade lane between India and GCC countries and it has
been found that if GCC reduces its tariff rates to zero, the overall increase in India’s exports
to GCC in terms of value will be around 288 Million US Dollar. At the country level, India’s
exports of agriculture products will increase by 106 Million US Dollar for Kingdom of Saudi
Arabia (KSA), 89 Million US Dollar for United Arab Emirates (UAE), 40 Million US Dollar for
Kuwait, 23 Million US Dollar for Qatar, 22 Million US Dollar for Oman and 6 Million US
Dollar for Bahrain.
Export of commodity categories like Coconuts, Brazil nuts and cashew (HS-0801) and Meat
of bovine animals, frozen (HS-0202) have the highest advantage of zero tariff rates in the
GCC market as these commodities have the highest export change in almost each country,
with 116 Million US Dollar (40% of GCC total) for Coconuts, Brazil nuts and cashew (HS-
0801) and 24 Million US Dollar (8% of GCC total) for Meat of bovine animals, frozen (HS-
0202). Currently these commodities face 5 percent tariff rate across GCC countries.

16
Table-5: Change in India's Total Exports to GCC in case of FTA (Zero Tariff )
Country Tariff Rate Change in Exports ('000' US Dollar)
Saudi Arabia 0 106,002.21
United Arab Emirate 0 89,969.44
Bahrain 0 6,611.17
Oman 0 21,867.67
Qatar 0 23,336.12
Kuwait 0 40,436.94
GCC 288,223.55 Source: WITS, analysis by authors
Saudi Arabia: The export change in the agriculture products from India to Saudi Arabia, as
a result of reduction in the tariff rates to zero, is highly concentrated. Top ten commodities
represent 81 percent of the total export change of 106 Million US Dollar. ‘Coconuts, Brazil
nuts and cashew’ (HS-0801) and ‘Meat of bovine animals, frozen’ (HS- 202) have the
highest advantage.
UAE: The export change in the agriculture products from India to United Arab Emirate, as a
result of reduction in the tariff rates to zero, is comparatively less concentrated. Top ten
commodities represent 56 percent of the total export change of 89 Million US Dollar.
‘Coconuts, Brazil nuts and cashew’ (HS-0801) and ‘Meat of bovine animals, frozen’ (HS-
202) have the highest advantage.
Bahrain: The export change in the agriculture products from India to Bahrain, as a result of
reduction in the tariff rates to zero, is quite concentrated. Top ten commodities represent
66 percent of the total export change of 66 Million US Dollar. ‘Coconuts, Brazil nuts and
cashew’ (HS-0801) and ‘Meat of bovine animals, frozen’ (HS-0202) have the highest
advantage.
Oman: The export change in the agriculture products from India to Oman, as a result of
reduction in the tariff rates to zero, is highly concentrated. Top ten commodities represent
77 percent of the total export change of 21 Million US Dollar. ‘Undenatured ethyl alcohol of an

17
alc’ (HS-2208), ‘Coconuts, Brazil nuts and cashew’ (HS-0801) and ‘Meat of bovine animals,
frozen’ (HS-0202) have the highest advantage.
Qatar: The export change in the agriculture products from India to Qatar, as a result of
reduction in the tariff rates to zero, is highly concentrated. Top ten commodities represent
82 percent of the total export change of 23 Million US Dollar. ‘Coconuts, Brazil nuts and
cashew’ (HS-0801) and ‘Acyclic alcohols and their halogena’ (HS-2905) have the highest
advantage.
Kuwait: The export change in the agriculture products from India to Kuwait, as a result of
reduction in the tariff rates to zero, is highly concentrated. Top ten commodities represent
88 percent of the total export change of 40 Million US Dollar. ‘Coconuts, Brazil nuts and
cashew’ (HS-0801) and ‘Meat of bovine animals, frozen’ (HS-0202) have the highest advantage.

18
Table-6: Top ten commodities with highest Exports Change in case of ‘0’ Tariff
Saudi Arabia Oman
1. Coconuts, Brazil nuts and cashew (0801) 1. Undenatured ethyl alcohol (2208)
2. Meat of bovine animals, frozen. (0202) 2. Coconuts, Brazil nuts and cashew (0801)
3. Milk and cream, concentrated or con (0402) 3. Meat of bovine animals, frozen. (0202)
4. Other manufactured tobacco (2403) 4. Oil-cake and other solid residues (2306)
5. Fruit juices (including grape must)(2009) 5. Birds' eggs, in shell, fresh (0407)
6. Vegetables (uncooked or cooked by s (0710) 6. Flours, meals and pellets, of meat (2301)
7. Meat of sheep or goats, fresh (0204) 7. Meat of swine, fresh, chilled (0203)
8. Prepared binders for foundry moulds (3824) 8. Ginger, saffron, turmeric (0910)
9. Ginger, saffron, turmeric (curcuma)(0910) 9. Dextrin and other modified starches (3505)
10. Coconut (copra), palm kernel (1513) 10. Meat and edible offal, of the poultry (0207)
United Arab Emirate Qatar
1. Coconuts, Brazil nuts and cashew (0801) 1. Coconuts, Brazil nuts and cashew (0801)
2. Meat of bovine animals, frozen (0202) 2. Acyclic alcohols and their halogena (2905)
3. Coconut (copra), palm kernel (1513) 3. Flour, meal and powder of the dried (1106)
4. Flours and meals of oil seeds (1208) 4. Meat of bovine animals, frozen. (0202)
5. Plants and parts of plants (1211) 5. Meat of sheep or goats, fresh (0204)
6. Prepared binders for foundry moulds (3824) 6. Ginger, saffron, turmeric (0910)
7. Milk and cream, concentrated (0402) 7. Flours and meals of oil seeds (1208)
8. Food preparations not elsewhere (2106) 8. Vegetable materials and vegetable (2308)
9. Other manufactured tobacco (2403) 9. Bread, pastry, cakes, biscuits (1905)
10. Chocolate and other food preparation (1806) 10. Cereal grains otherwise worked (1104)
Bahrain Kuwait
1. Coconuts, Brazil nuts and cashew (0801) 1. Coconuts, Brazil nuts and cashew (0801)
2. Meat of bovine animals, frozen (0202) 2. Meat of bovine animals, frozen (0202)
3. Cereal grains otherwise worked (1104) 3. Coconut (copra), palm kernel (1513)
4. Meat and edible offal, of the poultry (0207) 4. Chocolate and other food preparations (1806)
5. Cotton, not carded or combed (5201) 5. Ginger, saffron, turmeric (0910)
6. Ginger, saffron, turmeric (0910) 6. Anti-knock preparations, oxidation (3811)
7. Birds' eggs, in shell, fresh (0407) 7. Cereal grains otherwise worked (1104)
8. Bread, pastry, cakes, biscuits (1905) 8. Prepared binders for foundry moulds (3824)
9. Chocolate and other food preparations (1806) 9. Bread, pastry, cakes, biscuits (1905)
10. Prepared binders for foundry moulds (3824) 10. Pepper of the genus Piper; dried (0904) Source: WITS, analysis by authors

19
Bilateral Revealed Comparative Advantage:
India’s agriculture export that is covered under 231 products at HS 4 digit level, has been
analyzed separately for each GCC country with the help of Bilateral Revealed Comparative
Advantage for the period 2009-2015. It has been found that the commodities where India
faces disadvantage in the GCC market are much higher in numbers than the commodities
where it has Revealed Comparative Advantage. The lowest number of products with
advantage is in the Kingdom of Saudi Arabia market, followed by United Arab Emirate
having average number of products with advantage around 28 and 52 respectively out of
231 products that were analyzed. The markets where Indian agriculture exports have the
highest advantage are Qatar and Oman, followed by Kuwait and Bahrain.
The number of products with Advantage or Disadvantage does not vary much for any GCC
country during the period 2009-2015.
Table-7: India's Agriculture Exports to GCC (BRCA Results)
Number of commodities with Advantage Number of commodities with Disadvantage
Year KSA UAE Bahrain Oman Qatar Kuwait KSA UAE Bahrain Oman Qatar Kuwait
2009 27 50 74 78 78 66 203 181 157 153 153 165
2010 32 54 57 76 80 57 199 177 174 155 151 174
2011 30 52 73 88 70 63 201 179 158 143 161 168
2012 26 55 66 69 78 72 205 176 165 162 153 159
2013 22 47 69 59 86 69 209 184 162 172 145 162
2014 18 55 77 65 63 78 213 176 154 166 168 153
2015 38 52 - 80 80 66 193 179 - 151 151 165
Average 28 52 59 74 76 67 203 179 139 157 155 164
Source: UN Comtrade (WITS), analysis by authors
The products in the Indian export basket to GCC that have advantage are not same for each
year. Most of the products change from the category of having advantage to disadvantage.

20
There are only 11 products out of 231 that have advantage across years for Saudi Arabia,
25 for UAE, 34 for Oman, 37 for Bahrain, 43 for Qatar, 34 for Kuwait.
Table-8: India's Agriculture Exports to GCC-BRCA (2009-2015)
Country
Number of commodities with only Advantage
Number of commodities with only Disadvantage
Number of commodities with both AD & DI
Saudi Arabia 11 177 43
United Arab Emirate 25 138 68
Oman 34 107 90
Bahrain 37 117 77
Qatar 43 113 75
Kuwait 34 112 85 Source: UN Comtrade (WITS), analysis by authors
Conclusion:
GCC is not just an important origin for India to receive energy resources and have
movement of natural persons, it’s an attractive destination too for our exports and India’s
agriculture exports suggest that India should move forward and sign a Free Trade
Agreement with GCC as a region or bilaterally with GCC countries. India has a lot to gain in
its agriculture sector if tariffs are removed in the GCC market. China has already realized
the importance of having strong trade ties with the region and they are at the final stage of
signing a China-GCC Free Trade Agreement soon which was scheduled to be signed by
2016. Since India is the second largest player in the GCC after China, it should also
strengthen its ties with GCC if it has to maintain its position in the market. India may gain
the benefit of 288 Million US Dollar only in the agriculture sector if an FTA is signed
between India and GCC.
If India has to negotiate with the GCC on tariff reduction, India should press for zero tariff
rate at least for the products, Coconuts, Brazil nuts and cashew (HS-0801) and Meat of
bovine animals, frozen (HS-0202) as around half of the benefit of tariff cut has to come in

21
these two product categories. The products which may see the highest export growth are
Coconuts, Brazil nuts and cashew (HS-0801) and Meat of bovine animals, frozen (HS-0202)
as 48% of the Export change is in these two product categories. In case of zero tariff in GCC,
India’s agriculture export will see highest growth in Saudi Arabia ($106 Million) followed
by UAE ($89 Million), Kuwait ($40 Million), Qatar ($23 Million), Oman ($22 Million) and
Bahrain ($6 Million). Out of 231 agriculture products, India has highest average number of
products with BRCA in Qatar (76), followed by Oman (74), Kuwait (67), Bahrain (59), UAE
(52) and Saudi Arabia (28).
References:
1. Shah, Mahendra. (2010) “Gulf Cooperation Council food security: balancing the
equation”, Springer Nature, Macmillan Publishers Limited, Published online 25 April
2010.
2. Biswajit Mohapatra, “India and GCC Relations – New Horizons”, Diplomatist, Special
Report, INDIA-GCC: Partners in Growth, July 2016, pp.8 - 9, published by Diplomatist
Magazine, Delhi in association with the Gulf Division, Ministry of External Affairs,
Govt of India
3. International Agricultural Trade Report, August 2014, Foreign Agriculture Service,
United States Department of Agriculture.
4. The Hindu, Oct 1, 2015
5. Shayah M. Hazem, & Qifeng, Yang (2015) “Development of Free Zones in United
Arab Emirates”, International Review of Research in Emerging Markets and the
Global Economy (ISSN: 2311-3200), Vol: 1 Issue 2286.
6. Woertz Eckart (2010) “Arab Food, Water and the Big Gulf Landgrab that Wasn’t”
The Brown Journal of World Affairs.
7. RigiLadez Saeed & Khan Mohd Asef (2014) “Trade relations between India and Gulf
cooperation council countries- An Empirical Study”, IRJBM (www.irjbm.org ),
Volume No. VII, November, 2014 Issue-11.
8. Prasanta Kumar Pradhan (2010) India and Gulf Cooperation Council: Time to Look
Beyond Business, Strategic Analysis, 34:3, 409-419, DOI:
10.1080/09700161003659103
9. Karayil Sajitha Beevi (2007) “Does Migration Matter in Trade? A Study of India's
Exports to the GCC Countries” South Asia Economic Journal January 2007 vol. 8 no. 1
1-20 DOI: 10.1177/139156140600800101
10. Pradhan, Samir Ranjan (2006), India‟s Export Potential to the GCC Countries”,
UNESCAP research paper, Bangkok, Thailand.

22
11. Das Prasann Kumar & Pradhan Samir Ranjan (2014), “India-Gulf Trade Relations” ,
IOSR Journal of Economics and Finance (IOSR-JEF) e-ISSN: 2321-5933, p-ISSN:
2321-5925.Volume 4, Issue 1. (May-Jun. 2014), PP 31-41 www.iosrjournals.org
12. “FTA to boost India’s links with UAE and GCC” (2016),
http://www.emirates247.com/business/economyfinance/
ftatoboostindiaslinkswithuaeandgcc201602091.620406? ot=ot.PrintPageLayout
13. Hawke Hlinda Brady “ India Published and produced by Diplomatist Magazine an
imprint of L.B. Associates (Pvt) Ltd in collaboration with Ministry of External Affairs,
Govt. of India”
14. Shah Mahendra (2010) “Gulf Cooperation Council food security: balancing the
equation”, doi:10.1038/nmiddleeast.2010.141; Published online 25 April 2010
Commentary
15. Abotorabiardestani Zahra “The GCC States and India Relations”, IMPACT:
International Journal of Research in Applied, Natural and Social Sciences (IMPACT:
IJRANSS) ISSN(E): 2321-8851; ISSN(P): 2347-4580 Vol. 3, Issue 6, Jun 2015, 1-8
16. Insel Aysu and Tekce Mahmut “Bilateral Trade flows of the Gulf Cooperation council
Countries: A New Approach to Gravity Model”
17. UN Comtrade Database
18. WITS, World Bank

23
Appendix
Table-9: Average Tariff Rate on Agricultural Products (227 Products) in GCC-2014
Country Excluding '2403' Including '2403'
Saudi Arabia 3.99 4.43
UAE 3.79 3.79
Bahrain 3.79 4.23
Kuwait 3.79 4.23
Qatar 3.79 4.23
Oman 3.79 4.23
GCC 3.84 4.19
Note: HS Code-2403 is Other manufactured tobacco and manufactured tobacco substitutes;“homogenized” or “reconstituted” tobacco ; tobacco
extracts and essences Source: UN Comtrade (WITS), analysis by authors
Table-10: Agricultural Products with Zero Tariff Rates in GCC-2014
Country Number of Products with Zero Tariff
Total Number of Products
Saudi Arabia 50 227
UAE 52 227
Bahrain 51 227
Kuwait 51 227
Qatar 51 227
Oman 51 227
Note: Out of 231 agricultural products, tariff rates of only 227 products could be found from Tariff Analysis Online (TAO), WTO

24
Source: UN Comtrade (WITS), analysis by authors
Table-11: Top ten commodities with highest Exports change in case of Zero Tariff - Saudi Arabia
S.N. HS Code
Commodity Name Export Change
('000 $)
1 801 Coconuts, Brazil nuts and cashew nu 49440.62
2 202 Meat of bovine animals, frozen. 13482.85
3 402 Milk and cream, concentrated or con 5824.87
4 2403 Other manufactured tobacco and manu 4647.70
5 2009 Fruit juices (including grape must) 2730.05
6 710 Vegetables (uncooked or cooked by s 2361.64
7 204 Meat of sheep or goats, fresh, chil 2207.49
8 3824 Prepared binders for foundry moulds 2040.06
9 910 Ginger, saffron, turmeric (curcuma) 1635.55
10 1513 Coconut (copra), palm kernel or bab 1555.37
Sub total 85926.20
Total 106002.21
Share of top ten in total Export Change 81.06 % Source: UN Comtrade (WITS), analysis by authors
Table-12: Top ten commodities with highest Exports change in case of Zero Tariff- United Arab Emirate
S.N. HS Code Commodity Name
Export Change
('000 $)
1 801 Coconuts, Brazil nuts and cashew nu 18440.15
2 202 Meat of bovine animals, frozen. 5971.02
3 1513 Coconut (copra), palm kernel or bab 5270.7
4 1208 Flours and meals of oil seeds or ol 4991.18
5 1211 Plants and parts of plants (includi 3422.44
6 3824 Prepared binders for foundry moulds 3198.48
7 402 Milk and cream, concentrated or con 2607.37
8 2106 Food preparations not elsewhere spe 2408.23
9 2403 Other manufactured tobacco and manu 2373.75
10 1806 Chocolate and other food preparation 2087.42
Sub total 50770.72
Total 89969.44
Share of top ten in total Export Change 56.43% Source: UN Comtrade (WITS), analysis by authors

25
Table-13: Top ten commodities with highest Exports change in case of Zero Tariff- Bahrain
S.N. HS Code
Commodity Name Export Change
('000 $)
1 801 Coconuts, Brazil nuts and cashew nu 921.25
2 202 Meat of bovine animals, frozen. 840.44
3 1104 Cereal grains otherwise worked (for 627.35
4 207 Meat and edible offal, of the poultry 602.78
5 5201 Cotton, not carded or combed. 389.81
6 910 Ginger, saffron, turmeric (curcuma) 238.73
7 407 Birds' eggs, in shell, fresh, prese 215.05
8 1905 Bread, pastry, cakes, biscuits and 196.73
9 1806 Chocolate and other food preparations 193.21
10 3824 Prepared binders for foundry moulds 160.32
Sub total 4385.67
Total 6611.17
Share of top ten in total Export Change 66.34% Source: UN Comtrade (WITS), analysis by authors
Table-14: Top ten commodities with highest Exports change in case of Zero Tariff- Oman
S.N. HS Code Commodity Name
Export Change
('000 $)
1 2208 Undenatured ethyl alcohol of an alc 5054.00
2 801 Coconuts, Brazil nuts and cashew nu 5044.37
3 202 Meat of bovine animals, frozen. 1794.08
4 2306 Oil-cake and other solid residues, 1389.56
5 407 Birds' eggs, in shell, fresh, prese 950.32
6 2301 Flours, meals and pellets, of meat 724.96
7 203 Meat of swine, fresh, chilled or fr 642.59
8 910 Ginger, saffron, turmeric (curcuma) 480.15
9 3505 Dextrins and other modified starche 433.82
10 207 Meat and edible offal, of the poult 408.37
Sub total 16922.21
Total 21867.67
Share of top ten in total Export Change 77.38% Source: UN Comtrade (WITS), analysis by authors

26
Table-15: Top ten commodities with highest Exports change in case of Zero Tariff- Qatar
S.N. HS Code
Commodity Name Export Change
('000 $)
1 801 Coconuts, Brazil nuts and cashew nu 11457.65
2 2905 Acyclic alcohols and their halogena 3220.99
3 1106 Flour, meal and powder of the dried 782.56
4 202 Meat of bovine animals, frozen 753.34
5 204 Meat of sheep or goats, fresh 737.23
6 910 Ginger, saffron, turmeric (curcuma) 575.90
7 1208 Flours and meals of oil seeds 491.17
8 2308 Vegetable materials and vegetable 453.13
9 1905 Bread, pastry, cakes, biscuits 382.93
10 1104 Cereal grains otherwise worked 330.41
Sub total 19185.31
Total 23336.12
Share of top ten in total Export Change 82.21 % Source: UN Comtrade (WITS), analysis by authors
Table-16: Top ten commodities with highest Exports change in case of Zero Tariff - Kuwait
S.N. HS Code
Commodity Name Export Change
('000 $)
1 801 Coconuts, Brazil nuts and cashew 30867.33
2 202 Meat of bovine animals, frozen 1595.23
3 1513 Coconut (copra), palm kernel 861.39
4 1806 Chocolate and other food 559.47
5 910 Ginger, saffron, turmeric (curcuma) 483.86
6 3811 Anti-knock preparations, oxidation 384.90
7 1104 Cereal grains otherwise worked 265.93
8 3824 Prepared binders for foundry moulds 265.31
9 1905 Bread, pastry, cakes, biscuits 226.07
10 904 Pepper of the genus Piper; dried 222.10
Sub total 35731.60
Total 40436.94
Share of top ten in total Export Change 88.36 % Source: UN Comtrade (WITS), analysis by authors