Embed Size (px)
Citation preview
MPRAMunich Personal RePEc Archive
A Preliminary Contemporary Panel DataAnalysis of the Consumption Impact ofCigarette Taxation
Richard Cebula
Jacksonville University
17. April 2010
Online at http://mpra.ub.uni-muenchen.de/49201/MPRA Paper No. 49201, posted 21. August 2013 19:59 UTC

A Preliminary Contemporary Panel DataAnalysis of the Consumption Impact
of Cigarette Taxation
Abstract – The adverse health effects from cigarette smoking account for an estimated400,000 deaths annually in the U.S. Given this circumstance, the present study has twoobjectives. First, using a panel data set for a very recent time frame, it seeks to investigate theimpact of federal plus state cigarette excise taxes (along with the influence of other factors) onthe aggregate consumption of cigarettes. The study adopts a five-year state-level panel dataseries spanning the period 2002 through 2006. Consistent with certain previous studies, theestimates in this study find that the higher the cigarette excise tax, the lower the aggregatevolume of cigarettes consumed. However, this outcome does not address the practical problemof the substitution of high nicotine cigarettes for low nicotine cigarettes in light of a significantcigarette tax hike. This circumstance leads to the second objective of this study, namely, toformally propose a general form/template for a cigarette excise tax that is tied directly to eachcigarette brand’s nicotine and tar content.
Keywords –Cigarette smoking per capita, cigarette excise taxation, nicotine and tar-based tax sys-tem
JEL classification codes – I18, H20, H70
Introduction
The use of cigarette excise taxes as a source of revenue for state and localgovernments remains a pertinent issue [WHITE, 2010]. This is especially thecase during recent years when the poorly performing economy has cut intothe flows of tax collections needed to finance government outlays. Indeed,New York has increased its cigarette excise tax to the highest in the nation[WHITE, 2010, p. 1007], raising the question «Will high taxes makes smok-
Richard J. Cebula*Walker/Wells Fargo Endowed Professor in Finance, Jacksonville University, Davis College of Business,Jacksonville, Florida 32211 – USA
Journal of Public Finance and Public Choice (PFPC) / Economia delle scelte pubbliche, Vol. XXVIII,N. 1, 2010http://www.jpfpc.org
* E-mail:[email protected]; fax: +904 2567467; tel: +904 3798086The author is indebted to Phil DeCicca, Bill Evans, Matt Farrelly, Diana Lien, and Mike
Lovernheim.
IMP Da Empoli 1-2010.qxd:IMP Da Empoli fabio.qxd 23-12-2011 11:07 Pagina 39
ers quit?» [COX, 2010, p. 1005]. At some level, since the tax increase in NewYork «…was part of an emergency budget measure to help plug a $ 9.2 bil-lion deficit» [WHITE, 2010, p. 1007], elected officials presumably hope not.Moreover, cigarette smoking, cigarette excise taxes, and the impact of the lat-ter on the former remain a major public policy issue because the adversehealth effects resulting from cigarette smoking account for in excess of400,000 deaths in the U.S. annually [CENTERS FOR DISEASE CONTROL ANDPREVENTION, 2008; 2009]; moreover, cigarette smoking is linked to a hostof other adverse health effects [U.S. Department of Health andHuman Ser-vices, 2001, 2004].The impact of excise taxes on cigarette consumption has been studied ex-
tensively. The usual finding is that higher taxation of cigarettes leads to a re-duction in the number of packs of cigarettes consumed [KOCH – CEBULA,1992; EVANS – FARRELLY, 1998; SHOWALTER 1998, CHALOUPKA – WARN-ER, 2000; FORSTER – JONES, 2001; FARRELLY, et al, 2004; LIEN – EVANS,2005; ADDA – CORNAGLIA, 2006; WHITE, 2010; CEBULA, SMITH – ALEXAN-DER, 2010]. Typically, it is argued that the higher price on cigarettes in lightof higher cigarette taxation acts as a deterrent to smoking. It in fact has beenargued that hikes in this excise tax can for some persons make cigarettes ‘toocostly’, such that it reduces consumption by certain current smokers on theone hand while acting as a deterrent to at least some would-be or actual ‘new’smokers on the other hand. Oftentimes, when studies find higher excise tax-es on cigarettes to reduce the aggregate amount/volume of cigarette con-sumption, it is also suggested/speculated that such taxation yields social ben-efits in terms of improving the health status of the population. In this light,cigarette excise taxation takes on relevance not only as a ‘sin tax’ but also ap-pears to assume the role of a valuable tool to deter smoking in adults as wellas young people and thereby improve public health (while simultaneouslygenerating tax revenues for states and other governmental units).This preliminary panel data study has two objectives. First, it seeks to in-
vestigate, using a recent data set, the impact of cigarette excise taxes (feder-al plus state combined and, alternatively, state-level only) on aggregate cig-arette consumption within a context that allows for the influence of a num-ber of other, i.e., non-excise-tax, factors on cigarette smoking as well. Thestudy adopts a five-year state-level panel data series spanning the period 2002through 2006. Thus, the empirical evidence is relatively current/contem-porary. Not surprisingly, consistent with most previous related studies, theempirical evidence in this study (in the form of a variety of specifications)finds that the higher the cigarette excise tax (whether state plus federal orjust state), the lower the aggregate volume of cigarettes consumed. This find-ing, which does not address the practical problem of increased smoking inten-sity in the form of substitution of higher nicotine cigarettes for lower nicotine
40 Richard J. Cebula
IMP Da Empoli 1-2010.qxd:IMP Da Empoli fabio.qxd 23-12-2011 11:07 Pagina 40
cigarettes in light of a significant cigarette tax hike [EVANS – FARRELLY, 1998;FARRELLY, et al., 2004]. This phenomenon leads to the second objective ofthis study, namely, to offer an explicit, practical proposal for a cigarette ex-cise tax that is tied directly to each cigarette brand’s nicotine and tar con-tent. Of course, to what extent such a nicotine and tar-based tax, referred tohere as an SSET (selective supplementary excise tax) would address the prob-lem of increased smoking intensity in its other form, i.e., increased smoking in-tensity resulting from increased nicotine consumption from each cigarette smoked[ADDA – CORNAGLIA, 2006] remains to be seen, although it logically shouldhelp to address the phenomenon of substituting higher nicotine for lowernicotine cigarettes in the event of a large increase in the cigarette excise tax.
Background
A number of studies have explored determinants of cigarette consumption;a few are briefly considered here. For instance, Anderson andMellor [2008]find that risk aversion is significantly associated with cigarette smoking,heavy drinking, being overweight or obese, and seat belt non-use, as well aswith several summary measures of risky behavior. The results in the Ander-son and Mellor [2008] study suggest, among other things, that individualsin many cases tend to be risk-averse when it comes to cigarette smoking andtheir health.Raising cigarette excise taxes is commonly regarded as one of the most ef-
fective prevention and control strategies for reducing and/or limiting ag-gregate cigarette consumption; indeed, it has been thusly regarded for manyyears [DRAYTON, 1972]. In a study by Lien – Evans [2005], reductions insmoking by pregnant women and subsequent improvements in birth weightoccur almost immediately after a large cigarette tax hike has been imple-mented. A study by Forster – Jones [2001] measures tax elasticities of ciga-rette consumption. Elasticity estimates are all within the range of -.4 to -.7,indicating that, for example, an increase in the cigarette tax of 10% wouldlead to a decrease in the smoking population of between 4% and 7%.A more recent study by Cebula, Smith and Alexander [2010] provides a
log-log estimate focusing only on state-level cigarette excise taxation inwhich the excise tax elasticity of cigarette smoking is found to be negative (-0.228). In this study, there is evidence that states as a whole can raise state cig-arette excise taxes and find said policy to be a fruitful revenue source. Similarresults are found in Meier and Licari [1997], Showalter [1998], Lovenheim[1998], Evans and Farrelly [1998], Forster and Jones [2001], Farrelly, et al.[2004], and Lien and Evans [2005].The Koch and Cebula [1992], Anderson and Mellor (2008), and Cebula,
A Preliminary Contemporary Panel Data Analysis of the Consumption Impact of Cigarette Taxation 41
IMP Da Empoli 1-2010.qxd:IMP Da Empoli fabio.qxd 23-12-2011 11:07 Pagina 41
Smith, and Alexander [2010] studies also find that the inclination towardscigarette smoking is an increasing function of the age of the population,whereas Koch and Cebula [1992], and Cebula, Smith, and Alexander [2010]argue and find that cigarette consumption is an increasing function of alco-hol consumption and unemployment. It is also argued and/or found by Kochand Cebula [1992], Forster and Jones [2001], Anderson and Mellor [2008],Cebula, Smith, and Alexander [2010], and others that the greater the aver-age educational attainment level among the adult population and the high-er the per capita income level, the lower the aggregate consumption rate ofcigarettes. Naturally, it is expected, based both on micro-economic theoryand a number of empirical studies that cigarette consumption is a decreas-ing function of the price per pack of cigarettes, ceteris paribus. Next, there isa potential role of ‘moral hazard’ in cigarette smoking behaviors, as suggestedin effect in the studies by Koch – Cebula [1992], Anderson – Mellor [2008]and Cebula, Smith, and Alexander [2010]. In particular, health insurancepartly insulates individuals from the health problems smoking can create byreducing the risk associated with smoking through allowing access to health-care and mitigating the individual smoker’s financial burden from any smok-ing-related illness or illnesses. Consequently, health insurance coveragemight potentially increase the likelihood of a risk-averse individual’s smok-ing, ceteris paribus; alternatively, in theory, the absence of health insurancemay act to discourage smoking among risk-averse individuals. Indeed, theCebula, Smith, and Alexander [2010] study finds preliminary evidence of thishypothesis, namely, that the higher the percentage of the population with-out health insurance, the lower the percentage of the population that doesnot smoke.Other studies have also found a significant reduction in the total quantity
of cigarettes consumed in response to higher cigarette excise taxes; howev-er, according to certain of these studies, smokers often-times respond to thehigher cigarette tax by increasing ‘smoking intensity’. For example, recentstudies by Evans and Farrelly [1998] and Farrelly, et al. [2004] find cigarettesmokers switching to cigarettes with a higher tar and nicotine content; thisis one form of increased smoking intensity. A more recent study by Adda andCornaglia [2006] finds that smokers compensate for increases in cigarette ex-cise taxes in two ways, both of which are detrimental to the smoker’s health.First, many smokers adjust by reducing the number of packs of cigarettessmoked in the aggregate and then substituting smaller volumes of cigarettesthat are higher in nicotine (and typically higher in tar), which is consistent withEvans and Farrelly [1998] and Farrelly, et al. [2004]. Second, Adda and Cor-naglia [2006] find that in the face of higher cigarette excise taxes, there is al-so a serious health problem resulting from increased smoking intensity result-ing from increased nicotine consumption from each cigarette smoked. In other
42 Richard J. Cebula
IMP Da Empoli 1-2010.qxd:IMP Da Empoli fabio.qxd 23-12-2011 11:07 Pagina 42

words, Adda and Cornaglia [2006] find that in response to higher cigarettetaxation, many smokers also smoke cigarettes with greater intensity by in-creasing their intake of nicotine per cigarette through ‘smoking down’ thehigher nicotine (and tar) cigarettes they do smoke. Smoking down a cigaretteinvolves smoking the cigarette until the maximum amount of tobacco in thecigarette has been consumed; ergo, the latter behavior becomes a de facto sec-ond form of increased smoking intensity. Thus, understandably, Adda and Cor-naglia [2006, p. 1025] logically «…question the usefulness of excise taxes asa tool to regulate smoking intake, especially as the medical literature hasshown that increasing the intensity of smoking is detrimental to health[THUN, et al., 1997]».Based on the studies by Anderson andMellor (2008), Adda and Cornaglia
[2006], Cebula, Smith, and Alexander [2010], Chaloupka andWarner [2000],Forster and Jones [2001], Koch and Cebula [1992], and Lien and Evans[2005], it is expected that, in theory, smoking is negatively impacted by theabsence of health insurance, by higher cigarette excise tax levels, by higher cig-arette price levels per pack, by higher income levels, and by a higher level offormal education. It is also expected from the studies summarized above thatsmoking (along with alcohol consumption) is a ‘coping mechanism’ for theunemployed and therefore that smoking is more likely to be directly/posi-tively associated with both unemployment and alcohol consumption. Fur-thermore, smokers who are older on average tend to have a longer historyof smoking and thus are likely to be more strongly ‘addicted’ to cigarettesmoking (nicotine) than younger smokers, so that the higher the age of a giv-en population cohort member, the greater the likelihood that said person isa smoker [KOCH – CEBULA, 1992; ANDERSON – MELLOR, 2008; CEBULA,SMITH, AND ALEXANDER, 2010].
An Eclectic Model
Based on studies cited and/or briefly summarized above, namely, Ander-son and Mellor [2008], Adda and Cornaglia [2006], Cebula, Smith, andAlexander [2010], Chaloupka and Warner [2000], Kenkel, and Mathios[2002], Evans and Farrelly [1998], Farrelly et al. [2004], Forster and Jones[2001], Koch and Cebula [1992], and Lien and Evans [2005], this studyadopts an eclectic model of cigarette consumption in which the determina-tion of the annual per capita cigarette consumption in year t in state j is mod-eled as:
log CONStj = a0 + a1ALCtj + a2 INCOMEtj + a3NOINSURANCEtj+ a4TAXtj + a5UNEMPLOYtj + a6AGEtj + a7 HSEDUtj + a8CIGPRtj+ t [1]
A Preliminary Contemporary Panel Data Analysis of the Consumption Impact of Cigarette Taxation 43
IMP Da Empoli 1-2010.qxd:IMP Da Empoli fabio.qxd 23-12-2011 11:07 Pagina 43

44 Richard J. Cebula
wherelog CONStj= the natural log of cigarette consumption in year t in state j, mea-sured as the number of packs of cigarettes purchased annually per capita;a0 = constant term;ALCtj = the number of gallons of alcohol purchased annually per capita (fordrinking purposes) in year t in state j;INCOMEtj = per capita income in year t in state j;NOINSURANCEtj = percent of the population without health insurance inyear t in state j;TAXtj = average total federal plus state cigarette excise tax per pack in year tin state j;UNEMPLOYtj= average percentage unemployment rate of the civilian laborforce in year t in state j;AGEtj = median age of the population in year t in state j;HSEDUtj = percent of the population in year t in state j over age 25 that hascompleted at least a high school degree;CIGPRtj = the average price of cigarettes in year t in state j; and εt = stochasticerror term.For the interested reader, descriptive statistics are provided in Table 1,
whereas the correlation matrix among the explanatory variables in equation[1] is provided in Table 2. As shown in Table 2, overall there is no evidenceof serious multicollinearity.In the eclectic model above, it is expected that:
a1 >0, a2 <0, a3 <0, a4 <0, a5 >0, a6 >0, a7 <0 [2]
The study uses state-level panel data for all 50 states over the period 2002through 2006, where 2006 is the most recent year for which data for all ofthe explanatory variables are available. Data were collected for the UnitedStates’ 50 states (excluding Washington, D.C). The panel least squares(PLS) model was first estimated using the Fixed Effects Model and then esti-mated using the Random Effects Model. Performing the Hausman Test [pht-est (fixed, random)] revealed a p-value = 0.0855, so that the study adoptedthe Random Effects Model, i.e., Panel EGLS (cross-section random effects) es-timations [KENNEDY, 2003, pp. 305-307], White [1980] are provided. Themodel is initially expressed in semi-log form rather than in linear form in or-der to simplify interpretation. The data sources are, as follows:CONSwas obtained from an online version of the 2008 release ofTax Bur-
den on Tobacco, Table 11, which can be found at http://www.tobaccois-sues.com/getobject.aspx?folder=root/tobaccoissues/excisetaxes&name=Taxburden_2008_vol_43.pdfThe ALC data were obtained from the National Institute on Alcohol
IMP Da Empoli 1-2010.qxd:IMP Da Empoli fabio.qxd 23-12-2011 11:07 Pagina 44

A Preliminary Contemporary Panel Data Analysis of the Consumption Impact of Cigarette Taxation 45
Variable
Mean
StandardDeviation
CONS
74.82
29.65
ALC
2.28
0.43
INCOME
23,323
3,453
INSU
RANCE
14.999
4.219
TAX
104.81
52.43
STTAX
66.88
51.86
UNEMPLOY
5.078
1.092
AGE
36.688
2.158
HSEDU
84.12
9.96
CIGPR
3.04
0.53
ALC
INCOME
NOINSU
RANCE
TAX
UNEMPLOY
AGE
EDU
CIGPR
ALC
1.0
INCOME
0.336
1.0
NOINSU
RANCE
-0.083
-0.307
1.0
TAX
0.105
0.454
-0.229
1.0
UNEMPLOY
-0.200
-0.190
0.235
-0.004
1.0
AGE
0.326
0.223
-0.296
0.182
-0.283
1.0
EDU
0.151
0.162
-0.177
0.092
-0.126
0.097
1.0
CIGPR
0.306
0.565
-0.381
0.610
-0.002
0.228
0.067
1.0
Tab.1–DescriptiveStatistics.
Tab.2–CorrelationMatrixam
ongExplanatoryVariablesinEquation[3]
IMP Da Empoli 1-2010.qxd:IMP Da Empoli fabio.qxd 23-12-2011 11:07 Pagina 45

Abuse and Alcoholism (NIAAA) at http://www.niaaa.nih.gov/Resources/DatabaseResources/QuickFacts/AlcoholSales/consum03.htmData for the variable INCOME were obtained from the yearly American
Community Survey (ACS) data on Table B19301 at http://factfinder.cen-sus.gov/servlet/DatasetMainPageServlet?_program=ACS&_submenuId=&_lang=en&_ts=The nominal per capita income provided was adjusted to reflect inflation
using the GDP deflator from the US Department of Commerce: Bureau ofEconomic Analysis (BEA), Table 1.1.9. «Implicit Price Deflators for GrossDomestic Product» at http://www.bea.gov/national/nipaweb/Select-Table.asp?Selected=NThe data for theNOINSURANCE variable were obtained from the CDC’s
Behavioral Risk Factor Surveillance System at http://www.cdc.gov/brfss/maps/gis_data.htm from the question «Do you have any kind of health carecoverage?»The variable TAX was obtained from the Center for Disease Control
(CDC) STATE system using fourth quarter data for each year in the studyat http://apps.nccd.cdc.gov/StateSystem/stateSystem.aspx?selectedTopic=602&selectedMeasure=10005&dir=leg_report&ucName=uclegsmk-freesummaryexcisetax&year=2006_4&excel=htmlTable&submitBk=yThe nominal excise tax (TAX) was adjusted to reflect inflation using the
GDP deflator from the BEA, Table 1.1.9. «Implicit Price Deflators forGross Domestic Product» at http://www.bea.gov/national/nipaweb/Select-Table.asp?Selected=NIt should be observed that the variable TAX is the sum of the federal cig-
arette excise tax and the state excise tax. Adding these two excise taxes re-flects the finding in Showalter [1998, p. 1118] that «Federal excise taxes perse do not appear to be more effective than state excise taxes in terms of re-ducing cigarette smoking». Thus, we do not differentiate between a pennyof federal tax on cigarettes and a penny of state taxes in terms of aggregatecigarette consumption per se.UNEMPLOY was obtained from the yearly ACS data on Table C23001
at http://factfinder.census.gov/servlet/DatasetMainPageServlet?_pro-gram=ACS&_submenuId=&_lang=en&_ts=AGE and CIGPR were obtained from the yearly ACS data on Table
B01002 athttp://factfinder.census.gov/servlet/DatasetMainPageServlet?_program=ACS&_submenuId=&_lang=en&_ts=HSEDU was obtained from the yearly ACS data on Table C15002 at
http://factfinder.census.gov/servlet/DatasetMainPageServlet?_program=ACS&_submenuId=&_lang=en&_ts=.HSEDUwas divided by each state’s pop-ulation to obtain a percentage.
46 Richard J. Cebula
IMP Da Empoli 1-2010.qxd:IMP Da Empoli fabio.qxd 23-12-2011 11:07 Pagina 46

Initial Empirical Findings
The Panel EGLS (cross-section random effects) estimation of equation[1] yields:
log CONStj = 4.34+ 0.209 ALCtj – 0.00002 INCOMEtj – 0.012 NOINSURANCEtj
(+5.02) (-15.49) (-3.38)– 0.00253 TAXtj
(-10.27)
+ 0.0096 UNEMPLOYtj + 0.0297 AGEtj– 0.0009 HSEDUtj - 0.007 CIGPRtj
(+0.94) (+5.48) (-7.67) (-3.48)
R2 = 0.64, adjusted R2 =0.62, F = 52.49 [3]
where terms in parentheses are t-values. All eight of these estimated coeffi-cients on the explanatory variables exhibit the expected signs; seven of theexplanatory variables are statistically significant beyond the one percent lev-el, whereas one (for the unemployment rate) fails to be statistically signifi-cant at the ten percent level. The F-statistic (52.49) is statistically significantat far beyond the one percent level and attests to the robustness of the mod-el. The coefficient of determination (R2) and adjusted R2 indicates that themodel explains more than three-fifths of the variation in the dependent vari-able.The estimated coefficient on consumption of alcohol (ALC) variable is
positive and significant at the one percent level, implying that greater alco-hol consumption induces increased cigarette consumption per capita; indeed,this finding could be interpreted as indicating that cigarette smoking and al-cohol consumption are complementary goods (Anderson andMellor, 2008).The coefficient on the real per capita income variable (INCOME) is nega-tive and statistically significant at the one percent level, implying that as in-come increases, people are less prone to cigarette consumption; thus, ciga-rettes do not appear to be a ‘normal good’ because individuals with higherincomes are, on average, less inclined to smoke. The coefficient on the per-cent of the population with no health insurance variable (NOINSURANCE)is negative and statistically significant at the one percent level. This resultcan probably be attributed to ‘moral hazard’: those without health insuranceare less likely to smoke because they cannot afford the pecuniary costs of thehealth complications smoking implies.The coefficient on the unemployment rate variable (UNEMPLOY) is pos-
itive but not statistically significant at the ten percent level. This result is con-trary to our expectations, which were for a positive and significant coefficient,
A Preliminary Contemporary Panel Data Analysis of the Consumption Impact of Cigarette Taxation 47
IMP Da Empoli 1-2010.qxd:IMP Da Empoli fabio.qxd 23-12-2011 11:07 Pagina 47
48 Richard J. Cebula
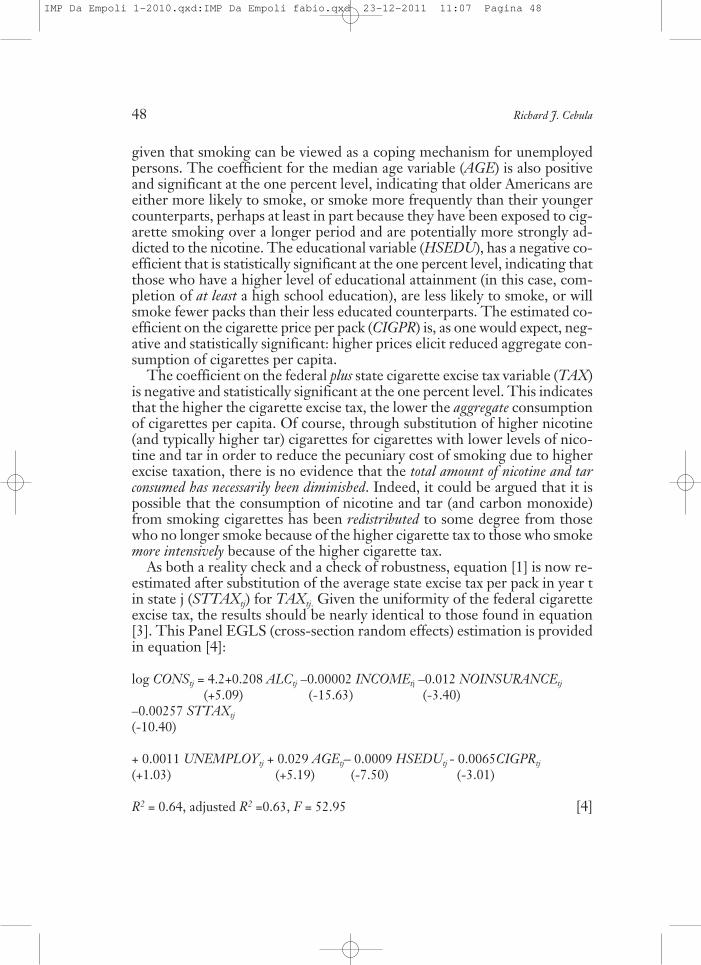
given that smoking can be viewed as a coping mechanism for unemployedpersons. The coefficient for the median age variable (AGE) is also positiveand significant at the one percent level, indicating that older Americans areeither more likely to smoke, or smoke more frequently than their youngercounterparts, perhaps at least in part because they have been exposed to cig-arette smoking over a longer period and are potentially more strongly ad-dicted to the nicotine. The educational variable (HSEDU), has a negative co-efficient that is statistically significant at the one percent level, indicating thatthose who have a higher level of educational attainment (in this case, com-pletion of at least a high school education), are less likely to smoke, or willsmoke fewer packs than their less educated counterparts. The estimated co-efficient on the cigarette price per pack (CIGPR) is, as one would expect, neg-ative and statistically significant: higher prices elicit reduced aggregate con-sumption of cigarettes per capita.The coefficient on the federal plus state cigarette excise tax variable (TAX)
is negative and statistically significant at the one percent level. This indicatesthat the higher the cigarette excise tax, the lower the aggregate consumptionof cigarettes per capita. Of course, through substitution of higher nicotine(and typically higher tar) cigarettes for cigarettes with lower levels of nico-tine and tar in order to reduce the pecuniary cost of smoking due to higherexcise taxation, there is no evidence that the total amount of nicotine and tarconsumed has necessarily been diminished. Indeed, it could be argued that it ispossible that the consumption of nicotine and tar (and carbon monoxide)from smoking cigarettes has been redistributed to some degree from thosewho no longer smoke because of the higher cigarette tax to those who smokemore intensively because of the higher cigarette tax.As both a reality check and a check of robustness, equation [1] is now re-
estimated after substitution of the average state excise tax per pack in year tin state j (STTAXtj) for TAXtj. Given the uniformity of the federal cigaretteexcise tax, the results should be nearly identical to those found in equation[3]. This Panel EGLS (cross-section random effects) estimation is providedin equation [4]:
log CONStj = 4.2+0.208 ALCtj –0.00002 INCOMEtj –0.012 NOINSURANCEtj
(+5.09) (-15.63) (-3.40)–0.00257 STTAXtj
(-10.40)
+ 0.0011 UNEMPLOYtj + 0.029 AGEtj– 0.0009 HSEDUtj - 0.0065CIGPRtj
(+1.03) (+5.19) (-7.50) (-3.01)
R2 = 0.64, adjusted R2 =0.63, F = 52.95 [4]
IMP Da Empoli 1-2010.qxd:IMP Da Empoli fabio.qxd 23-12-2011 11:07 Pagina 48

A Preliminary Contemporary Panel Data Analysis of the Consumption Impact of Cigarette Taxation 49
The results in the estimation in [4] are nearly identical to those in the es-timation in [3] above. Thus, all of the estimated coefficients exhibit the ex-pected signs, with all statistically significant with the expected signs at theone percent level, except (once again) for the unemployment rate, which failsto be statistically significant at even the ten percent level. Thus, the aggre-gate consumption of cigarettes per capita is once again found to be positivelya function of alcohol consumption and age, while being a decreasing func-tion of income, the absence of health insurance, educational attainment, cig-arette prices, and of course cigarette excise taxation. Of greatest relevance isthe latter, i.e., the result for the state tax cigarette excise tax variable, whichis nearly identical is magnitude to that for the total cigarette excise tax perpack (state plus federal) and also is again statistically significant at far beyondthe one percent level. Cigarette excise taxes appear to reduce aggregate cig-arette consumption. Based on the results in equations [3] and [4], a one centcigarette excise tax appears to reduce the aggregate number of cigarettes con-sumed per capita by 0.25-0.26 percent.
Additional Empirical Findings
This section of the study has two components. The first consists of addi-tional Panel EGLS (cross-section random effects) estimates to verify the con-sistency and robustness of the results in the model. The second consists ofPanel Two Stage EGLS (cross-section random effects) estimates that allowfor the possible simultaneity bias that may result from the contemporane-ousness of the dependent variable (cigarette consumption per capita) and theprice per pack of cigarettes.
Additional Panel EGLS (Cross-Section Random Effects) Estimates
Estimating the basic model specified in equation [1] in linear form yieldsresults that are qualitatively compatible with those shown in the semi-log es-timates in equations [3] and [4]. This Panel EGLS (cross-section random ef-fects) estimate is provided in column (a) of Table 3. As shown in this esti-mation, all of the estimated coefficients exhibit the expected signs; further-more, six of the aforementioned coefficients are statistically significant at theone percent level and one is statistically significant at the five percent level,with the coefficient for variable UNEMPLOY once again failing to be sig-nificant at the ten percent level. Of greatest relevance to the present studyis the negative and statistically significant coefficient on the TAXtj variable:it is negative and statistically significant at far beyond the one percent level,
IMP Da Empoli 1-2010.qxd:IMP Da Empoli fabio.qxd 23-12-2011 11:07 Pagina 49
50 Richard J. Cebula
affirming our results in equations [3] and [4], albeit that the model is esti-mated in a different, i.e., linear, form. In addition to this specific confirma-tion of our findings above, the findings for the remaining variables are alsoconsistent with those above.As further tests of the basic model, two additional estimates are provided;
these can be found in columns (b) and (c) of Table 3. In all cases, the resultsare completely compatible with those in equations [3] and [4] above. In sum,then, this contemporary panel data set yields Panel EGLS (cross-section ran-dom effects) results that imply consistently that: one the one hand, the percapita consumption of cigarettes in the U.S. is inversely related to income,the absence of health insurance, the price per pack of cigarettes (withoutcounting taxes thereupon), the level of educational attainment, and the lev-el of the cigarette taxation; on the hand, the aggregate per capita consump-tion of cigarettes in the U.S. is directly related to age and per capita alcoholconsumption.Taken in conjunction with the findings provided in equations [3] and [4],
the results shown in columns (a), (b, and c) indicate a robust pattern of re-lationships between per capita cigarette consumption and a variety of eco-nomic and non-economic variables. Among these Panel EGLS (cross-sec-tion random effects) results, that which is most pertinent is the negative re-lationship between cigarette consumption per capita and total federal plusstate cigarette excise tax levels, where the estimated coefficient remains re-markably consistent in magnitude (and statistical significance) across sever-al specifications.
Panel Two Stage EGLS (Cross-Section Random Effects) Estimates
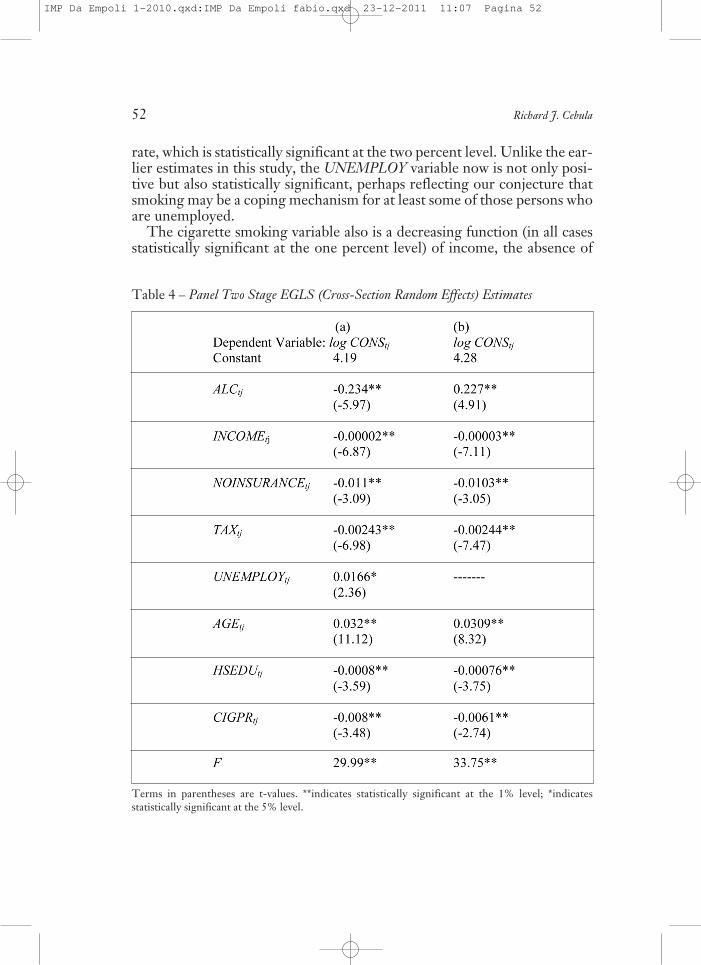
In the model as developed thus far, the dependent variable (cigarette con-sumption per capita) and the explanatory variable CIGPR (the average priceper pack of cigarettes) are treated as contemporaneous. This situation im-plies the possibility of simultaneity bias in the estimates provided above[KENNEDY, 2003, Ch. 10]. To address this possible problem, the analysis nextprovides Panel Two Stage EGLS (cross-section random effects) estimates.The instrumental variable for the variable CIGPRtj is POVt-1j, the one yearlag of the percent of the population in state j that was classified as being at125 percent of the poverty level or below. The choice of instrument is basedon the finding that log (CIGtj) and POVt-1j are highly correlated with oneanother whereas POVt-1j is uncorrelated with the error terms in the system.The Panel Two Stage EGLS (cross-section random effects) estimate of
the full model is provided in column (a) of Table 4. In column (a), all eightof the estimated coefficients exhibit the expected signs, with seven being sta-
IMP Da Empoli 1-2010.qxd:IMP Da Empoli fabio.qxd 23-12-2011 11:07 Pagina 50

A Preliminary Contemporary Panel Data Analysis of the Consumption Impact of Cigarette Taxation 51
tistically significant at the one percent level and one statistically significantat the two percent level. The F-ratio (29.99) is statistically significant at theone percent level, attesting to the overall strength of the model.As these results show, the cigarette smoking per capita variable is an in-
creasing function of the alcohol consumption and age variables, which areboth statistically significant at the one percent level, and the unemployment
Terms in parentheses are t-values. **indicates statistically significant at the 1% level; *indicatesstatistically significant at the 5% level.
Table 3 – Additonal Estimates.
IMP Da Empoli 1-2010.qxd:IMP Da Empoli fabio.qxd 23-12-2011 11:07 Pagina 51
52 Richard J. Cebula
Table 4 – Panel Two Stage EGLS (Cross-Section Random Effects) Estimates
rate, which is statistically significant at the two percent level. Unlike the ear-lier estimates in this study, the UNEMPLOY variable now is not only posi-tive but also statistically significant, perhaps reflecting our conjecture thatsmoking may be a coping mechanism for at least some of those persons whoare unemployed.The cigarette smoking variable also is a decreasing function (in all cases
statistically significant at the one percent level) of income, the absence of
Terms in parentheses are t-values. **indicates statistically significant at the 1% level; *indicatesstatistically significant at the 5% level.
IMP Da Empoli 1-2010.qxd:IMP Da Empoli fabio.qxd 23-12-2011 11:07 Pagina 52
A Preliminary Contemporary Panel Data Analysis of the Consumption Impact of Cigarette Taxation 53
health insurance, the price per pack of cigarettes (without counting taxesthereupon), the level of educational attainment, and the level of the cigarettetaxation. Regarding the magnitude of the cigarette tax effect, the estimatedcoefficient is -0.00243, which is nearly identical to the Panel EGLS (cross-section random effects) estimate results discussed earlier in this study.Finally, as a test of robustness of the results in column (a) of Table 4, a
second estimate is now provided. In this estimate [Table 4, column (b)], theunemployment rate has been dropped from the system; this action is basedon the notion that the unemployment rate was not statistically significant inthe Panel EGLS (cross-section random effects) estimates. Clearly, the find-ings revealed by the Panel Two Stage EGLS (cross-section random effects)estimate in column (b) are entirely consistent with the results in column (a).Thus, the evidence for robust and consistent results is very strong.
Summary and Perspective
This study in part effectively provides updated confirmation of a number ofearlier studies that had found cigarette consumption to be negatively a func-tion of the level of cigarette excise taxation. In particular, using a state-lev-el panel data series for the period 2002-2006, the estimations in this studyconsistently find an inverse relationship between the number of packs of cig-arettes consumed per capita and the level of federal plus state cigarette ex-cise taxes.But how strong is this effect? In the semi-log estimates in this study, the
average value for the estimated coefficient on the cigarette excise tax vari-able is -0.0025. Thus, it would appear that a one cent tax increase would pre-sumably reduce total cigarette consumption by about 0.25%. Observe, then,that if politicians were truly serious about reducing cigarette consumptionin the aggregate, imposing an across-the board (all states) uniform simultaneousincrease in the excise tax on cigarettes (or, arguably, such a tax increase im-posed by the federal government) of $1.00 per pack could potentially createa scenario in which aggregate cigarette consumption could be approximate-ly reduced [in theory] by one-fourth, i.e., by 25%1. Thus, large [by histori-cal standards] cigarette excise tax increases can accomplish both significantreductions in total cigarette consumption while adding to the coffers of thegovernmental unit or units imposing the increased excise tax.
1 To put this $1.00 tax hike in perspective, some years ago Evans and Farrelly [1998, p.578] had noted that «…different proposals have called for federal tax hikes of up to $2.00 perpack».
IMP Da Empoli 1-2010.qxd:IMP Da Empoli fabio.qxd 23-12-2011 11:07 Pagina 53

Consider now in more detail the effect implied by the empirical findingsin this study, based on recent data, namely, that raising cigarette taxes reducesper capita cigarette consumption in the aggregate, a finding consistent with stud-ies of earlier periods and other types of data-sets [MEIER – LICARI, 1997;SHOWALTER, 1998; LOVENHEIM, 1998; EVANS – FARRELLY, 1998; FORSTER– JONES, 2001; FARRELLY, et al., 2004; LIEN – EVANS, 2005]. Consider in par-ticular that, in response to a significant increase in the cigarette excise tax,there undoubtedly would be a reduction in smoking by some current smok-ers, as well as a likely reduction in the growth rate of potential new (oftenyouth) smokers. Presumably, many of the aforementioned would substituteother commodities and/or increased saving for cigarette consumption.However, by contrast, consider the extent to which many smokers con-
tinue to smoke but respond to the tax hike by engaging in more smoking in-tensive behaviors such as ‘smoking cigarettes down’, i.e., increased smoking in-tensity resulting from increased nicotine consumption from each cigarette smoked,resulting from smoking down to the very last accessible tobacco in each cig-arette smoked [ADDA – CORNAGLIA, 2006]. Alternatively, consider thosewho, although they may smoke fewer cigarettes numerically speaking, re-spond to higher cigarette taxation by changing smoking behavior to one of sub-stituting cigarettes with higher nicotine (and, typically, higher tar) for ciga-rettes with lower nicotine (and typically lower tar), in effect, increasing smok-ing intensity in a different way. Such behaviors imply that the net health ben-efits to society of significantly across-the-board increased excise taxes on cig-arettes will not be so great as they may seem at first glance [EVANS – FAR-RELLY, 1998; ADDA – CORNAGLIA, 2006]. Indeed, the net public health ef-fect of increasing the cigarette excise tax could conceivably even be zero ornegative [EVANS – FARRELLY, 1998].
A Nicotine and Tar Based Cigarette Tax
Given these conclusions, this study now explicitly provides an explicit taxpolicy proposal/ recommendation that may help to offset the shifts smokersmake to higher nicotine cigarettes and to more smoking intensive behaviors.In particular, as an alternative to simply levying a large, uniform cigaretteexcise tax increase on all cigarette brands, this study proposes that policy-makers could choose to also target the higher nicotine and higher tar ciga-rettes by imposing a selective supplementary excise tax (or simply SSET) in ad-dition to a large flat excise tax per pack, which is consistent with the obser-vation by Evans – Farrelly [1998, p. 578] that a useful cigarette «…tax mightbe based on the tar and nicotine content of cigarettes». Plausible forms ofsuch a tax are provided below, in equations [5] and [6]. Before considering
54 Richard J. Cebula
IMP Da Empoli 1-2010.qxd:IMP Da Empoli fabio.qxd 23-12-2011 11:07 Pagina 54

A Preliminary Contemporary Panel Data Analysis of the Consumption Impact of Cigarette Taxation 55
said tax proposals, the issue of what level of government should impose thetax warrants a few observations.For example, assume a reasonable alternative to the present system of cig-
arette excise taxes is deemed potentially very beneficial in reducing not onlycigarette consumption but also in promoting public health, i.e., in addressingthe smoking intensity issues. Assume next that it is left to the states to admin-ister such a tax system (SSET). If some states were to resist raising cigaretteexcise taxes in the form of the SSET or were to resist raising the cigarette ex-cise tax in the same way and to the same extent, due either to the influence oftobacco producers, tobacco lobbyists, and/or tobacco growers organizationsand/or due to some other reason, whereas other states raised the taxes by ful-ly adopting the optimal SSET, the benefits for the policy would be less exten-sive, particularly in those cases where cigarette purchases could be made on alarge scale across state lines without significant transaction costs [CHILES –SOLLARS, 1993; LOVENHEIM, 2008]. Interestingly, on this very issue, Loven-heim [2008, p. 7] estimates that 13-25 percent of consumers purchase cigarettesin border localities. Thus, as Lovenheim [2008, p. 7] suggests, cross-bordersmuggling would confound much of the potential health as well as revenuebenefits from increased cigarette excise taxes imposed by state governments un-less all of the states agreed to adopt the exact same SSET at the very same time.That is, for the cigarette excise tax at the state level to yield large public healthbenefits, a very significant degree of co-operation and co-ordination betweenstates on cigarette excise tax policy would be necessary in order to get themall to adopt not only an SSET but the same SSET. Given that historically therehas been and continues to be an enormous interstate variation in state-imposedcigarette excise tax levels and given the historical differences among the statesin the predisposition of state legislatures and governors to tax tobacco prod-ucts, the likelihood of a uniform large cigarette SSET imposed by all of thestates would seem remote at best. Ergo, it is argued that the administration ofthe SSET, once its precise form is identified, would very likely, out of practi-cal necessity, lie with the federal government. Alternatively stated, whereas theopportunity for successful adoption of either some form of nicotine-based cig-arette excise tax and/or nicotine-plus-tar based cigarette excise tax in the pub-lic interest appears to be plausible, it is likely that the only feasible way to im-pose a both significant and geographically uniform such tax would be at thefederal level2.
2 It is not impossible that such an effort could be at least partly offset by states that chooseto reduce state cigarette excise taxation in an effort to decrease effects of the total taxationincrease imposed by the federal government; on the other hand, given the revenue-poor sta-tus of most states in recent years, it may be unlikely or is at least questionable that such aneffort would gather much support.
IMP Da Empoli 1-2010.qxd:IMP Da Empoli fabio.qxd 23-12-2011 11:07 Pagina 55

56 Richard J. Cebula
Accordingly, consider what a federally administered, modified taxing ofcigarettes might look like, i.e., the practical/plausible form of the federal se-lective supplementary excise tax, or simply federal SSET. In addition to alarge flat federal tax on all cigarettes per pack, this approach could involveconstructing a supplementary tax increase in direct proportion to each cig-arette brand’s nicotine and tar content. For example, the total federal excisetax (TFET) could have two variable components in addition to a general flattax applicable to all cigarette brands equally:
TFETj = FLATTX + nj NICOTINEj + tj TARj [5]where TFETj is the total federal excise tax on cigarette brand j, which con-
sists of FLATTX, a flat federal excise tax imposed on every pack of cigarettesregardless of nicotine and tar content, and [nj NICOTINEj + tjTARj], the se-lective supplementary excise tax (SSET) on brand j. The tax rates nj and tjcorrespond to pennies per pack. Clearly the magnitudes of nj and tjmust besufficiently large in magnitude as to impose a clear financial disincentive toconsume cigarette j.In taxing cigarette brand j, a reference point is needed both in terms of
nicotine and tar. The reference points for the nicotine and tar tax bases sug-gested here are 0.1 milligrams (0.1 mg) of nicotine and 1.0 milligram (1 mg)of tar. Thus, if cigarette brand j had 0.4 mg of nicotine, the numerical val-ue of the term NICOTINEj = 4; furthermore, if cigarette j had, say, 6.0 mgof tar, TARj = 6. Although obviously other reference points could be cho-sen, these two reference points not only manifest the virtue of simplicity butalso effectively correspond to the lowest nicotine and tar cigarettes on theU.S. market3.Thus, in this initial formulation – equation [5] and using the reference
points suggested above, the SSET would impose higher taxes on cigarettesin direct proportion to the amounts of both nicotine and tar contents [tax-ation would be proportional to nicotine and tar contents]. The SSET tax rateswould be so constructed that a cigarette with 0.2 mg of nicotine carries twicethe nicotine SSET as a cigarette containing only 0.1 mg of nicotine; alter-natively, a cigarette with 1.0 mg of nicotine would carry a nicotine SSET often times that of the cigarette with only 0.1 mg thereof. As for the tar SSET,it would work the same way. Thus, a cigarette with 2 mg of tar would carrya tar SSET twice that of a cigarette having 1 mg of tar.
3 For instance, based on the concentration of tar in a cigarette, very low tar cigarettes con-tain 7 mg or less of tar, low tar cigarettes contain more than 7 mg of tar but less than 15,medi-um-tar cigarettes contain 15 to 21 mg of tar, and high-tar cigarettes contain at least 22 mg oftar.
IMP Da Empoli 1-2010.qxd:IMP Da Empoli fabio.qxd 23-12-2011 11:07 Pagina 56

In addition, the proposed tax shown in [5] could be expressed in non-lin-ear form and be made progressive with respect to either a cigarette’s nico-tine, tar, and/or carbon monoxide contents. For instance, the tax basesNICOTINEj and /or TARj could be expressed with an exponent greater than1 and thereby introduce graduated taxation, which arguably would creategreater disincentives to consume cigarettes with higher nicotine, tar, and/ orCO contents, depending upon which tax base (s) has its (their) exponents >1 . Thus, the general form of the SSET is given by:
TFETj = FLATTX + nj NICOTINEja + tj TARjb [6]
where FLATTX ≥ 0, nj ≥ 0, tj ≥ 0, a=0 or a ≥ 1, b=0 or b ≥ 1A policy as exemplified in [6] above could be useful in promoting health
benefits from cigarette excise tax policy by discouraging substitution of highnicotine cigarettes for lower nicotine cigarettes in light of significantly in-creased cigarette excise taxation. It remains to be seen to what extent greatersmoking intensity behavior resulting from increased nicotine consumption from eachcigarette smoked, as described in Adda and Cornaglia (2006), would be ame-liorated, however.Interestingly, the studies by Gine, Karlan – Zinman [2010] and O’Con-
nor, et al. [2011] suggest certain behavioral-based policy possibilities that,from the perspective of this study, could be used to supplement the SSET pol-icy route (de facto ‘third degree excise tax discrimination’) in an effort to re-duce cigarette consumption and truly promote improved public health.Moreover, a recent study by Anderson, Foster, and Frisvold [2010] findscompelling evidence that certain public policies for the young may be ef-fective in reducing the growth of new smokers. Based on their empiricalanalysis, Anderson, Foster, and Frisvold [2010, p. 587] find that «…partic-ipation in Head Start reduces the probability than an individual smokes cig-arettes as a young adult». Thus, endeavors such as Head Start, which is acomprehensive childhood development program, could also be used in con-junction with, i.e., to supplement, the SSET.Certainly, there is much need for and much room for further research in-
to the issue at hand. Included in the list of questions to be investigated is themagnitude of the terms included in the general equation [4], namely, FLAT-TX, nj, tj, a, and b. Clearly, more aggressive tax policies could take the formof not only of higher values for nj and/or tj but also the form of progressivetaxation through imposing values for a, and/or b in excess of 1. In this ageof controversial efforts to achieve health care reform, there clearly is an ur-gency underlying genuinely serious public policy change regarding cigaretteexcise tax policy. The work must continue with haste and care, given the so-cial and private costs of lost human life and other health conditions result-
A Preliminary Contemporary Panel Data Analysis of the Consumption Impact of Cigarette Taxation 57
IMP Da Empoli 1-2010.qxd:IMP Da Empoli fabio.qxd 23-12-2011 11:07 Pagina 57

ing from cigarette smoking, as observed in the Introduction above. Finally,it is perhaps worth observing that the cigarette excise template describedabove could be easily modified to apply to cigarette consumption deterrencein any nation, not merely in the U.S.
REFERENCES
ANDERSON, L. R. –MELLOR, J. M., 2008, «Predicting Health Behaviors with an Ex-perimental Measure of Risk Preference», Journal of Health Economics, 27 (4): 1260-74.
ADDA, J. – CORNAGLIA, F., 2006, «Taxes, Cigarette Consumption, and Smoking In-tensity», The American Economic Review, 96 (4): 1013-28.
CEBULA, R.J. – SMITH, K.E. – ALEXANDER, G.M., 2010, «The Impact of State Cig-arette Taxes on Cigarette Consumption: Recent Evidence», State Tax Notes, 56(26): 2143-50.
CENTERS FOR DISEASE CONTROL AND PREVENTION, 2008, «Morbidity and Mor-tality Weekly Report», http://www.cdc.gov/mmwr/preview/mmwrhtml/mm5745a3.htm
CENTERS FOR DISEASE CONTROL AND PREVENTION, 2009, «Health, United States,2009», http://www.cdc.gov/nchs/data/hus/hus09.pdf
CHALOUPKA, F. J. – WARNER, K. E., 2000, «The Economics of Smoking», in An-thony J. Culver and Joseph P. Newhouse, eds.,Handbook of Health Economics, Am-sterdam: Elsevier Science, North-Holland: 1539-627.
CHILES, T.W. – SOLLARS, D.L., 1993, «Estimating Cigarette-Tax Revenue», Jour-nal of Economics and Finance, 17 (3): 1-15.
COX, R.A., 2010, «Will High TaxesMake Smokers Quit?», State Tax Notes, 56 (13):1005-6.
DRAYTON,W., 1972, «The Tar andNicotine Tax: Pursuing Public Health ThroughTax Incentives», The Yale Law Review, 81 (8): 1487-1516.
EVANS, W. N. – FARRELLY, M. C., 1998, «The Compensating Behavior of Smok-ers: Taxes, Tar, and Nicotene», RAND Journal of Economics, 29 (3): 578-95.
FARRELLY,M. C. –NIMSCH, C. T. –HYLAND, A. and CUMMINGS, K.M., 2004, «TheEffects of Higher Cigarette Prices on Tar and Nicotine Consumption in a Co-hort of Adult Smokers», Health Economics, 13 (1): 49-58.
FORSTER, M. – JONES, A. M., 2001, «The Role of Tobacco Taxes in Starting andQuitting Smoking: Duration and Analysis of British Data», Journal of Royal Sta-tistical Society, 164 (3): 517-47.
GINE, XAVIER; K., D. – ZINMAN, J., 2010, «Put Your Money Where Your Butt Is:A Commitment Contract for Smoking Cessation»,America Economic Journal: Ap-plied Economics, 2 (4): 213-35.
HOLT, C. A. – LAURY, S. K., 2002, «Risk Aversion and Incentive Effects»,The Amer-ican Economic Review, 92 (5): 1644-55.
KENNEDY, P., 2003, A Guide to Econometrics, 5th ed., Cambridge, MA: M.I.T. Press.
58 Richard J. Cebula
IMP Da Empoli 1-2010.qxd:IMP Da Empoli fabio.qxd 23-12-2011 11:07 Pagina 58

KOCH, J. V., 1992, «A Note on Smoking Health Costs and Public Policy», Ameri-can Journal of Economics and Sociology, 41 (2): 159-60.
LIEN, D. S. – EVANS, W. N., 2005, «Estimating the Impact of Large Cigarette TaxHikes: The Case of Maternal Smoking and Infant Birth Weight», The Journal ofHuman Resources, 40 (2): 373-92.
LOVENHEIM, M.F., 2008, «How Far to the Border? The Extent and Impact ofCross-Border Casual Cigarette Smuggling», National Tax Journal, 61 (1): 7-32.
MEIER, K.J. – LICARI, M.J., 1997, «The Effect of Cigarette Taxes on Cigarette Con-sumption», American Journal of Public Health, 87 (7): 1126-30.
O’CONNOR, R.J – NORTON, K.J. – BANSAL-TRAVERS, M. –MAHONEY,M.C. – CUM-MINGS, K.M. and BORLAND, R., 2011, Harm Reduction Journal, 8 (1): 1-8.
SHOWALTER, M.H., 1998, «The Effect of Cigarette Taxes on Cigarette Consump-tion», American Journal of Public Health, 88 (7): 1118-9.
THUN, M. J. – LALLY, C. A. – FLANNERY, J. T. – CALLE, E. E. – FLANDERS, W. D.and HEATH, C. W. Jr., 1997, «Cigarette Smoking and Changes in theHystopathology of Lung Cancer», Journal of the National Cancer Institute, 89 (21):1580-86.
U.S. Department of Health and Human Services, 2004, The Health Consequences ofSmoking: A Report of the Surgeon General, Atlanta, GA: U.S. Department ofHealth and Human Services, Office on Smoking and Health. http://www/tobac-co/data_statistics/sgr/sgr_2004/index.htm
U.S. Department of Health and Human Services, 2001,Women and Smoking: A Re-port of the Surgeon General, Rockville, MD: U.S. Department of Health and Hu-man Services, Public Health Service, Office of the Surgeon General.http://www/tobacco/data_statistics/sgr/sgr_2001/index.htm
WHITE, H., 1980, «A Heteroskedasticity-Consistent Covariance Matrix and a Di-rect Test For Heteroskedasticity», Econometrica, 48 (4): 817-38.
WHITE, N.M., 2010, «New YorkGovernor Approves Highest Cigarette Tax inNa-tion», State Tax Notes, 56 (13): 1007.
A Preliminary Contemporary Panel Data Analysis of the Consumption Impact of Cigarette Taxation 59
IMP Da Empoli 1-2010.qxd:IMP Da Empoli fabio.qxd 23-12-2011 11:07 Pagina 59