Embed Size (px)
Citation preview

siemens.com
Portfolio gains drive income
»For business volume, we performed well in our markets. The profitability of our Industrial Business shows that we must still improve some businesses,« said Joe Kaeser, President and Chief Executive Officer of Siemens AG.
Second-quarter orders up 16%, to €20.8 billion, including large orders in the rail business; on a comparable basis,excluding currency translation and portfolio effects, orders up 7%
Revenue 8% higher at €18.0 billion, for a book-to-bill ratio of 1.15; revenue flat on a comparable basis
Industrial Business profit 5% lower, at €1.7 billion, due largely to Power and Gas as expected
Net income of €3.9 billion, including €1.6 billion, €1.4 billion and €0.2 billion, respectively, on the sale of the hearingaid business, Siemens’ stake in BSH Bosch und Siemens Hausgeräte GmbH (BSH) and the hospital information business;resulting in basic earnings per share (EPS) of €4.70
Munich, Germany, May 7, 2015
Earnings Release Q2 FY 2015 January 1 to March 31, 2015
Earnings Release Q2 FY 2015 | Siemens
2
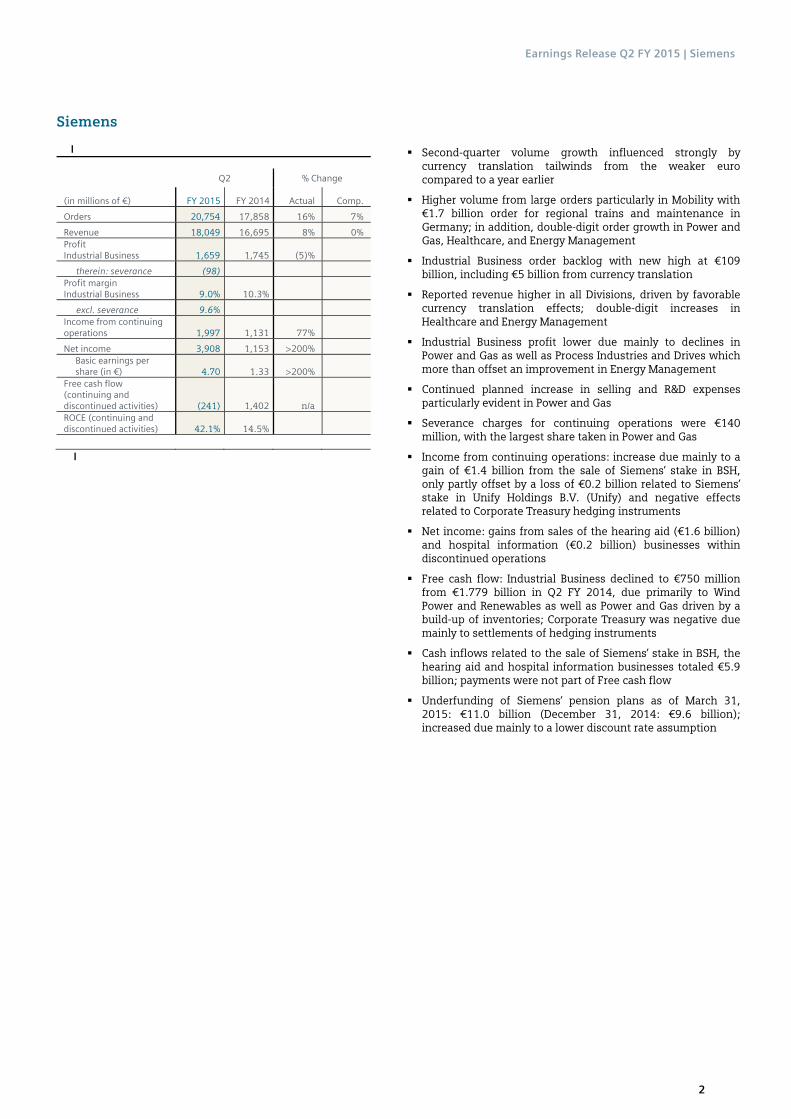
Siemens
Q2 % Change
(in millions of €) FY 2015 FY 2014 Actual Comp.
Orders 20,754 17,858 16% 7%
Revenue 18,049 16,695 8% 0% Profit Industrial Business 1,659 1,745 (5)%
therein: severance (98) − Profit margin Industrial Business 9.0% 10.3%
excl. severance 9.6% 0% Income from continuing operations 1,997 1,131 77%
Net income 3,908 1,153 >200% Basic earnings per share (in €) 4.70 1.33 >200%
Free cash flow (continuing and discontinued activities) (241) 1,402 n/a ROCE (continuing and discontinued activities) 42.1% 14.5%
Second-quarter volume growth influenced strongly bycurrency translation tailwinds from the weaker eurocompared to a year earlier
Higher volume from large orders particularly in Mobility with€1.7 billion order for regional trains and maintenance inGermany; in addition, double-digit order growth in Power andGas, Healthcare, and Energy Management
Industrial Business order backlog with new high at €109billion, including €5 billion from currency translation
Reported revenue higher in all Divisions, driven by favorablecurrency translation effects; double-digit increases inHealthcare and Energy Management
Industrial Business profit lower due mainly to declines inPower and Gas as well as Process Industries and Drives whichmore than offset an improvement in Energy Management
Continued planned increase in selling and R&D expensesparticularly evident in Power and Gas
Severance charges for continuing operations were €140million, with the largest share taken in Power and Gas
Income from continuing operations: increase due mainly to again of €1.4 billion from the sale of Siemens’ stake in BSH,only partly offset by a loss of €0.2 billion related to Siemens’stake in Unify Holdings B.V. (Unify) and negative effectsrelated to Corporate Treasury hedging instruments
Net income: gains from sales of the hearing aid (€1.6 billion)and hospital information (€0.2 billion) businesses withindiscontinued operations
Free cash flow: Industrial Business declined to €750 millionfrom €1.779 billion in Q2 FY 2014, due primarily to WindPower and Renewables as well as Power and Gas driven by abuild-up of inventories; Corporate Treasury was negative duemainly to settlements of hedging instruments
Cash inflows related to the sale of Siemens’ stake in BSH, thehearing aid and hospital information businesses totaled €5.9billion; payments were not part of Free cash flow
Underfunding of Siemens‘ pension plans as of March 31,2015: €11.0 billion (December 31, 2014: €9.6 billion);increased due mainly to a lower discount rate assumption
Earnings Release Q2 FY 2015 | Industrial Business
3
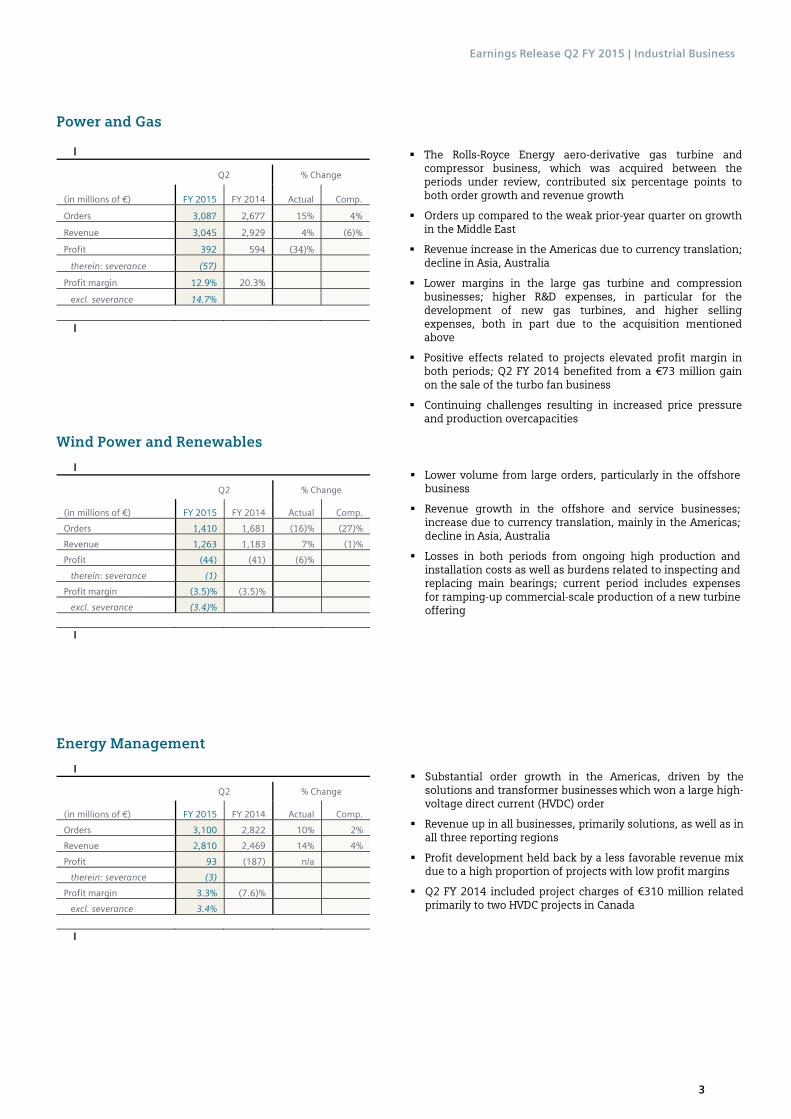
Power and Gas
Q2 % Change
(in millions of €) FY 2015 FY 2014 Actual Comp.
Orders 3,087 2,677 15% 4%
Revenue 3,045 2,929 4% (6)%
Profit 392 594 (34)%
therein: severance (57) −
Profit margin 12.9% 20.3%
excl. severance 14.7% 0%
The Rolls-Royce Energy aero-derivative gas turbine andcompressor business, which was acquired between theperiods under review, contributed six percentage points toboth order growth and revenue growth
Orders up compared to the weak prior-year quarter on growthin the Middle East
Revenue increase in the Americas due to currency translation;decline in Asia, Australia
Lower margins in the large gas turbine and compressionbusinesses; higher R&D expenses, in particular for thedevelopment of new gas turbines, and higher sellingexpenses, both in part due to the acquisition mentionedabove
Positive effects related to projects elevated profit margin inboth periods; Q2 FY 2014 benefited from a €73 million gainon the sale of the turbo fan business
Continuing challenges resulting in increased price pressureand production overcapacities
Wind Power and Renewables
Q2 % Change
(in millions of €) FY 2015 FY 2014 Actual Comp.
Orders 1,410 1,681 (16)% (27)%
Revenue 1,263 1,183 7% (1)%
Profit (44) (41) (6)%
therein: severance (1) −
Profit margin (3.5)% (3.5)%
excl. severance (3.4)% 0%
Lower volume from large orders, particularly in the offshorebusiness
Revenue growth in the offshore and service businesses;increase due to currency translation, mainly in the Americas;decline in Asia, Australia
Losses in both periods from ongoing high production andinstallation costs as well as burdens related to inspecting andreplacing main bearings; current period includes expensesfor ramping-up commercial-scale production of a new turbineoffering
Energy Management
Q2 % Change
(in millions of €) FY 2015 FY 2014 Actual Comp.
Orders 3,100 2,822 10% 2%
Revenue 2,810 2,469 14% 4%
Profit 93 (187) n/a
therein: severance (3) −
Profit margin 3.3% (7.6)%
excl. severance 3.4% 0%
Substantial order growth in the Americas, driven by thesolutions and transformer businesses which won a large high-voltage direct current (HVDC) order
Revenue up in all businesses, primarily solutions, as well as inall three reporting regions
Profit development held back by a less favorable revenue mixdue to a high proportion of projects with low profit margins
Q2 FY 2014 included project charges of €310 million relatedprimarily to two HVDC projects in Canada
Earnings Release Q2 FY 2015 | Industrial Business
4
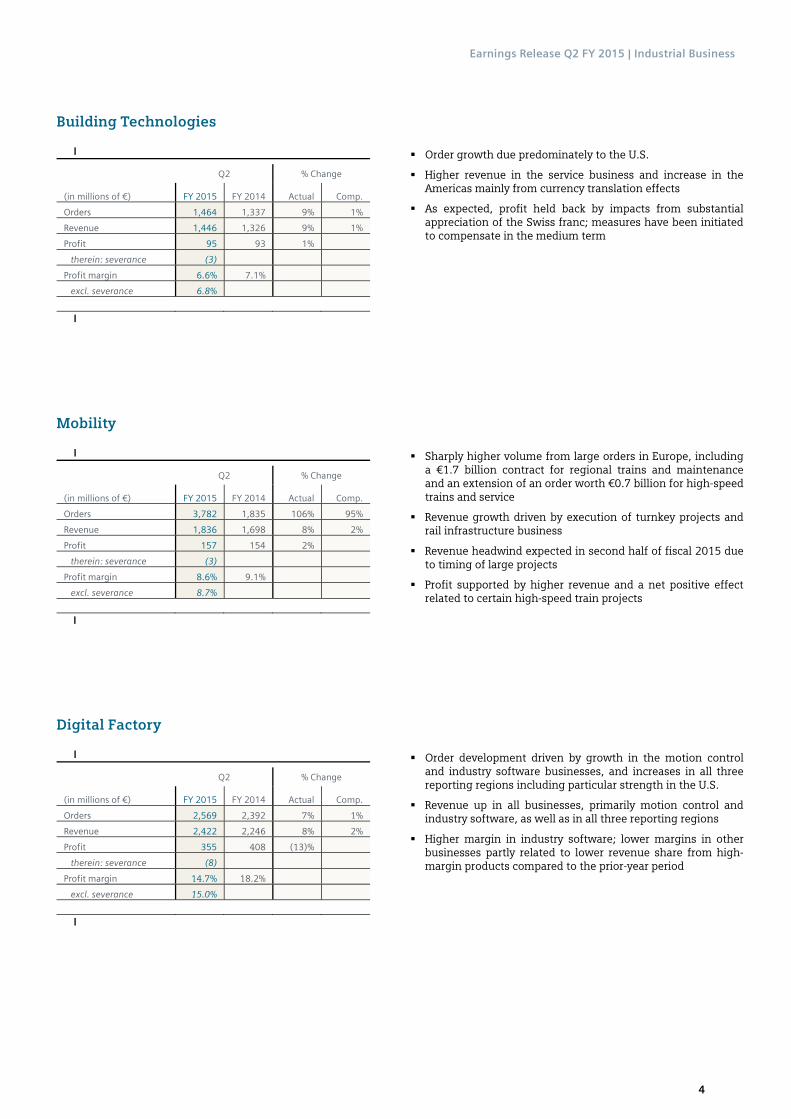
Building Technologies
Q2 % Change
(in millions of €) FY 2015 FY 2014 Actual Comp.
Orders 1,464 1,337 9% 1%
Revenue 1,446 1,326 9% 1%
Profit 95 93 1%
therein: severance (3) −
Profit margin 6.6% 7.1%
excl. severance 6.8% 0%
Order growth due predominately to the U.S.
Higher revenue in the service business and increase in theAmericas mainly from currency translation effects
As expected, profit held back by impacts from substantialappreciation of the Swiss franc; measures have been initiatedto compensate in the medium term
Mobility
Q2 % Change
(in millions of €) FY 2015 FY 2014 Actual Comp.
Orders 3,782 1,835 106% 95%
Revenue 1,836 1,698 8% 2%
Profit 157 154 2%
therein: severance (3) −
Profit margin 8.6% 9.1%
excl. severance 8.7% 0%
Sharply higher volume from large orders in Europe, includinga €1.7 billion contract for regional trains and maintenanceand an extension of an order worth €0.7 billion for high-speedtrains and service
Revenue growth driven by execution of turnkey projects andrail infrastructure business
Revenue headwind expected in second half of fiscal 2015 dueto timing of large projects
Profit supported by higher revenue and a net positive effectrelated to certain high-speed train projects
Digital Factory
Q2 % Change
(in millions of €) FY 2015 FY 2014 Actual Comp.
Orders 2,569 2,392 7% 1%
Revenue 2,422 2,246 8% 2%
Profit 355 408 (13)%
therein: severance (8) −
Profit margin 14.7% 18.2%
excl. severance 15.0% 0%
Order development driven by growth in the motion controland industry software businesses, and increases in all threereporting regions including particular strength in the U.S.
Revenue up in all businesses, primarily motion control andindustry software, as well as in all three reporting regions
Higher margin in industry software; lower margins in otherbusinesses partly related to lower revenue share from high-margin products compared to the prior-year period

Earnings Release Q2 FY 2015 | Industrial Business
5
Process Industries and Drives
Q2 % Change
(in millions of €) FY 2015 FY 2014 Actual Comp.
Orders 2,442 2,691 (9)% (13)%
Revenue 2,326 2,297 1% (5)%
Profit 85 188 (55)%
therein: severance (6) −
Profit margin 3.7% 8.2%
excl. severance 3.9% 0%
Lower volume from large orders, particularly in Asia,Australia, and overall weaker demand in commodity-relatedindustries, especially in oil & gas, mining, metals and cement
Revenue development driven by growth in the U.S. and Chinadue to currency translation tailwinds; lower revenue inhigher-margin process automation business
Weak profit margin mainly due to operational challenges,especially in the oil & gas and marine business and the largedrives business, related partly to secondary impacts from oilprice decline
Healthcare
Q2 % Change
(in millions of €) FY 2015 FY 2014 Actual Comp.
Orders 3,228 2,826 14% 4%
Revenue 3,212 2,854 13% 3%
Profit 526 536 (2)%
therein: severance (17) −
Profit margin 16.4% 18.8%
excl. severance 16.9% 0%
Orders and revenue up in all three reporting regions andacross all businesses, with the largest increase coming fromthe imaging and therapy systems businesses
Profit development included a €61 million gain fromdivestment of the microbiology business; Q2 FY 2014benefited from €66 million gain related to the sale of aparticle therapy installation

Earnings Release Q2 FY 2015 | Financial Services, Reconciliation to Consolidated Financial Statements and Outlook
6
Financial Services
Q2
(in millions of €) FY 2015 FY 2014
Income before income taxes 195 114
therein: severance (1) −
ROE (after taxes) 28.0% 18.1%
(in millions of €) Mar 31,
2015 Sep 30,
2014
Total assets 25,169 21,970
Increase in income before income taxes driven bysubstantially higher contribution from the equity business,primarily including a net gain in connection with the sale ofrenewable energy projects
Higher total assets compared to the end of fiscal 2014 duemainly to currency translation effects
Reconciliation to Consolidated Financial Statements
Profit
Q2
(in millions of €) FY 2015 FY 2014
Centrally managed portfolio activities 1,172 50
Siemens Real Estate 38 18
Corporate items (190) (126)
Centrally carried pension expense (119) (96) Amortization of intangible assets acquired in business combinations (126) (135) Eliminations, Corporate Treasury and other reconciling items (79) 3 Reconciliation to Consolidated Financial Statements 697 (287)
Centrally managed portfolio activities (CMPA): includes a gainof €1.4 billion on disposal of Siemens’ stake in BSH and a lossof €0.2 billion related to Siemens’ stake in Unify; Q2 FY 2014included equity investment income related to BSH
Effective with the current quarter, CMPA includes the solarbusiness which was formerly part of Wind Power andRenewables
Corporate items: influenced by the fair value of warrantsissued together with US$3 billion in bonds in fiscal 2012,which depends on the underlying Siemens and OSRAM shareprices as well as their respective volatilities; therefore resultsare expected to remain volatile in coming quarters
Eliminations, Corporate Treasury and other reconciling items:negative effects related to changes in the fair value of interestrate derivatives not qualifying for hedge accounting
Outlook
We confirm our outlook. We believe that our business environment will be complex in fiscal 2015, among other things due to geopolitical tensions. We expect revenue on an organic basis to remain flat year-over-year, and orders to exceed revenue for a book-to-bill ratio above 1. Furthermore, we expect that gains from divestments will enable us to increase basic EPS from net income by at least 15% from €6.37 in fiscal 2014. For our Industrial Business, we expect a profit margin of 10% to 11%. This outlook excludes impacts from legal and regulatory matters.

Earnings Release Q2 FY 2015 | Notes and forward-looking statements
7
Notes and forward-looking statements
Starting today at 9:00 a.m. CEST, the analysts and investors conference at which Siemens CEO Joe Kaeser and Siemens CFO Ralf P. Thomas discuss the quarterly figures will be broadcast live at www.siemens.com/analystconference.
Starting today at 10:40 a.m. CEST, CEO Joe Kaeser and CFO Ralf P. Thomas will hold a telephone conference in German for journalists, which can be followed live at www.siemens.com/conferencecall.
Recordings of the analysts and investors conference and the telephone conference for journalists will subsequently be made available as well.
Financial Publications are available for download at: www.siemens.com/ir Publications & Events.
This document contains statements related to our future business and financial performance and future events or developments involving Siemens that may constitute forward-looking statements. These statements may be identified by words such as “expect,” “look forward to,” “anticipate” “intend,” “plan,” “believe,” “seek,” “estimate,” “will,” “project” or words of similar meaning. We may also make forward-looking statements in other reports, in presentations, in material delivered to shareholders and in press releases. In addition, our representatives may from time to time make oral forward-looking statements. Such statements are based on the current expectations and certain assumptions of Siemens’ management, of which many are beyond Siemens’ control. These are subject to a number of risks, uncertainties and factors, including, but not limited to those described in disclosures, in particular in the chapter Risks in the Annual Report. Should one or more of these risks or uncertainties materialize, or should underlying expectations not occur or assumptions prove incorrect, actual results, performance or achievements of Siemens may (negatively or positively) vary materially from those described explicitly or implicitly in the relevant forward-looking statement. Siemens neither intends, nor assumes any obligation, to update or revise these forward-looking statements in light of developments which differ from those anticipated.
This document includes – in IFRS not clearly defined – supplemental financial measures that are or may be non-GAAP financial measures. These supplemental financial measures should not be viewed in isolation or as alternatives to measures of Siemens’ net assets and financial positions or results of operations as presented in accordance with IFRS in its Consolidated Financial Statements. Other companies that report or describe similarly titled financial measures may calculate them differently.
Due to rounding, numbers presented throughout this and other documents may not add up precisely to the totals provided and percentages may not precisely reflect the absolute figures.
Financial Media: Alexander Becker Phone: +49 89 636-36558 E-mail: [email protected]
Wolfram Trost Phone: +49 89 636-34794 E-mail: [email protected]
Siemens AG, 80333 Munich, Germany
© 2015 by Siemens AG, Berlin and Munich

s
Financial ResultsSecond Quarter and First Half of Fiscal 2015
siemens.com

Key figures(in millions of €, except where otherwise stated)
Volume
Q2 % Change Q1 - Q2 % Change
FY 2015 FY 2014 Actual Comp.1 FY 2015 FY 2014 Actual Comp.1
Orders 20,754 17,858 16% 7% 38,766 37,998 2% (3)%Revenue 18,049 16,695 8% 0% 35,464 33,271 7% 1%Book-to-bill ratio 1.15 1.09Order backlog (Industrial Business, in billions of €) 109 109
Profitability and Capital efficiency
Q2 Q1 - Q2
FY 2015 FY 2014 % Change FY 2015 FY 2014 % Change
Industrial BusinessProfit 1,659 1,745 (5)% 3,478 3,641 (4)%Profit margin 9.0% 10.3% 9.6% 10.8%
Continuing operationsEBITDA 3,480 2,114 65% 5,702 4,644 23%Income from continuing operations 1,997 1,131 77% 3,103 2,479 25%Basic earnings per share (in €)2 2.39 1.30 83% 3.70 2.87 29%
Continuing and discontinued operationsNet income 3,908 1,153 >200% 5,004 2,610 92%Basic earnings per share (in €)2 4.70 1.33 >200% 5.99 3.03 98%Return on capital employed (ROCE) 42.1% 14.5% 28.2% 16.6%
Capital structure and Liquidity
Mar 31, 2015 Sep 30, 2014
Total equity (Shareholders of Siemens AG) 33,176 30,954Industrial net debt 4,064 1,390Industrial net debt / EBITDA3 0.4 0.1
Q2 FY 2015 Q2 FY 2014 Q1 - Q2 FY 2015 Q1 - Q2 FY 2014
Free cash flowContinuing operations (191) 1,402 (163) 843Continuing and discontinued operations (241) 1,402 (385) 703
Employees
Mar 31, 2015 Sep 30, 2014
Continuing operations Total4 Continuing operations Total4
Employees (in thousands) 342 342 338 357
Germany 114 115 114 116
Outside Germany 227 227 224 240
1 Throughout excluding currency translation and portfolio effects. 3 For the interim calculation, EBITDA is annualized. 2 Basic earnings per share – attributable to shareholders of Siemens AG. For fiscal 2015 and 2014 weighted average shares outstanding 4 Continuing and discontinued operations. (basic) (in thousands) for the second quarter amounted to 826,843 and 845,672 and for the first six months to 828,777 and 844,894 shares, respectively.

Consolidated Statements of Income
Q2 Q1 - Q2
(in millions of €, per share amounts in €) FY 2015 FY 2014 FY 2015 FY 2014
Revenue 18,049 16,695 35,464 33,271
Cost of sales (12,664) (11,955) (24,906) (23,556)
Gross profit 5,385 4,740 10,557 9,715
Research and development expenses (1,112) (994) (2,097) (1,888)
Selling and general administrative expenses (2,756) (2,460) (5,375) (4,903)
Other operating income 119 131 211 444
Other operating expenses (95) (90) (165) (254)
Income from investments accounted for using the equity method, net 1,321 195 1,376 349
Interest income 312 255 606 511
Interest expenses (185) (183) (361) (371)
Other financial income (expenses), net (440) (21) (645) (112)
Income from continuing operations before income taxes 2,550 1,572 4,107 3,491
Income tax expenses (554) (441) (1,004) (1,011)
Income from continuing operations 1,997 1,131 3,103 2,479
Income from discontinued operations, net of income taxes 1,912 22 1,901 131
Net income 3,908 1,153 5,004 2,610
Attributable to:
Non-controlling interests 21 29 38 54
Shareholders of Siemens AG 3,887 1,124 4,966 2,556
Basic earnings per share
Income from continuing operations 2.39 1.30 3.70 2.87
Income from discontinued operations 2.31 0.03 2.29 0.16
Net income 4.70 1.33 5.99 3.03
Diluted earnings per share
Income from continuing operations 2.36 1.29 3.66 2.84
Income from discontinued operations 2.29 0.03 2.27 0.15
Net income 4.65 1.32 5.93 3.00
Consolidated Statements of Comprehensive Income
Q2 Q1 - Q2
(in millions of €) FY 2015 FY 2014 FY 2015 FY 2014
Net income 3,908 1,153 5,004 2,610
Remeasurements of defined benefit plans (817) (607) (1,489) (232)therein: Income tax effects 525 221 870 108
Items that will not be reclassified to profit or loss (817) (607) (1,489) (232)
therein: Income (expenses) from investments accounted for using the equity method (16) 6 (20) 7
Currency translation differences 2,171 (142) 2,374 (510)Available-for-sale financial assets 183 101 346 324
therein: Income tax effects (11) (7) (15) (7)
Derivative financial instruments (230) (33) (293) (24)
therein: Income tax effects 95 11 106 6
Items that may be reclassified subsequently to profit or loss 2,123 (74) 2,427 (211)
therein: Income (expenses) from investments accounted for using the equity method 86 (30) 67 (79)
Other comprehensive income, net of income taxes 1,307 (682) 938 (442)Total comprehensive income 5,215 471 5,941 2,168
Attributable to:
Non-controlling interests 82 29 106 55
Shareholders of Siemens AG 5,133 442 5,835 2,113

Consolidated Statements of Financial Position
Mar 31, Sep 30,
(in millions of €) 2015 2014
Assets
Cash and cash equivalents 8,844 8,013
Available-for-sale financial assets 1,100 925
Trade and other receivables 15,607 14,526
Other current financial assets 4,729 3,710
Inventories 17,576 15,100
Current income tax assets 622 577
Other current assets 1,406 1,290
Assets classified as held for disposal 100 3,935
Total current assets 49,985 48,076
Goodwill 19,628 17,783
Other intangible assets 5,410 4,560
Property, plant and equipment 10,092 9,638
Investments accounted for using the equity method 3,032 2,127
Other financial assets 22,238 18,416
Deferred tax assets 4,181 3,334
Other assets 1,336 945
Total non-current assets 65,915 56,803
Total assets 115,900 104,879
Liabilities and equity
Short-term debt and current maturities of long-term debt 4,236 1,620
Trade payables 7,245 7,594
Other current financial liabilities 2,499 1,717
Current provisions 4,357 4,354
Current income tax liabilities 2,028 1,762
Other current liabilities 18,783 17,954
Liabilities associated with assets classified as held for disposal 32 1,597
Total current liabilities 39,180 36,598
Long-term debt 20,361 19,326
Post-employment benefits 12,106 9,324
Deferred tax liabilities 512 552
Provisions 5,145 4,071
Other financial liabilities 2,576 1,620
Other liabilities 2,234 1,874
Total non-current liabilities 42,935 36,767
Total liabilities 82,114 73,365
Equity
Issued capital, no par value 2,643 2,643
Capital reserve 5,571 5,525
Retained earnings 26,441 25,729
Other components of equity 3,162 803
Treasury shares, at cost (4,641) (3,747)
Total equity attributable to shareholders of Siemens AG 33,176 30,954
Non-controlling interests 610 560
Total equity 33,786 31,514
Total liabilities and equity 115,900 104,879

Consolidated Statements of Cash Flows
Q2
(in millions of €) FY 2015 FY 2014
Cash flows from operating activities
Net income 3,908 1,153
Adjustments to reconcile net income to cash flows from operating activities - continuing operations
(Income) from discontinued operations, net of income taxes (1,912) (22)
Amortization, depreciation and impairments 617 593
Income tax expenses 554 441
Interest (income) expenses, net (128) (72)
(Income) loss related to investing activities (1,441) (297)
Other non-cash (income) expenses (371) 14
Change in operating net working capital
Inventories (727) (258)
Trade and other receivables 121 294
Trade payables 115 267
Billings in excess of costs and estimated earnings on uncompleted contracts and related advances (419) 206
Additions to assets leased to others in operating leases (113) (96)
Change in other assets and liabilities 345 (144)
Income taxes paid (677) (557)
Dividends received 75 16
Interest received 270 238
Cash flows from operating activities - continuing operations 218 1,777
Cash flows from operating activities - discontinued operations (39) 15
Cash flows from operating activities - continuing and discontinued operations 179 1,791
Cash flows from investing activities
Additions to intangible assets and property, plant and equipment (409) (374)
Acquisitions of businesses, net of cash acquired 76 (2)
Purchase of investments (307) (42)
Purchase of current available-for-sale financial assets (153) (142)
Change in receivables from financing activities (682) (542)
Disposal of investments, intangibles and property, plant and equipment 3,014 67
Disposal of businesses, net of cash disposed 376 78
Disposal of current available-for-sale financial assets 89 17
Cash flows from investing activities - continuing operations 2,003 (941)
Cash flows from investing activities - discontinued operations 2,982 497
Cash flows from investing activities - continuing and discontinued operations 4,985 (444)
Cash flows from financing activities
Purchase of treasury shares (364) —
Other transactions with owners 2 (13)
Issuance of long-term debt 18 218
Repayment of long-term debt (including current maturities of long-term debt) (5) (23)
Change in short-term debt and other financing activities (415) 963
Interest paid (169) (163)
Dividends paid to shareholders of Siemens AG (2,728) (2,533)
Dividends attributable to non-controlling interests (37) (75)
Cash flows from financing activities - continuing operations (3,699) (1,628)
Cash flows from financing activities - discontinued operations — —
Cash flows from financing activities - continuing and discontinued operations (3,699) (1,628)
Effect of changes in exchange rates on cash and cash equivalents 469 (45)
Change in cash and cash equivalents 1,934 (325)
Cash and cash equivalents at beginning of period 6,910 8,911
Cash and cash equivalents at end of period 8,845 8,586
Less: Cash and cash equivalents of assets classified as held for disposal and discontinued operations at end of period — 1
Cash and cash equivalents at end of period (Consolidated Statements of Financial Position) 8,844 8,585

Consolidated Statements of Cash Flows
Q1 - Q2
(in millions of €) FY 2015 FY 2014
Cash flows from operating activities
Net income 5,004 2,610
Adjustments to reconcile net income to cash flows from operating activities - continuing operations
(Income) from discontinued operations, net of income taxes (1,901) (131)
Amortization, depreciation and impairments 1,195 1,181
Income tax expenses 1,004 1,011
Interest (income) expenses, net (245) (140)
(Income) loss related to investing activities (1,554) (577)
Other non-cash (income) expenses (162) 281
Change in operating net working capital
Inventories (1,156) (925)
Trade and other receivables 1 394
Trade payables (964) (662)
Billings in excess of costs and estimated earnings on uncompleted contracts and related advances 364 443
Additions to assets leased to others in operating leases (185) (175)
Change in other assets and liabilities (700) (1,360)
Income taxes paid (980) (977)
Dividends received 325 118
Interest received 546 465
Cash flows from operating activities - continuing operations 594 1,556
Cash flows from operating activities - discontinued operations (182) (104)
Cash flows from operating activities - continuing and discontinued operations 412 1,452
Cash flows from investing activities
Additions to intangible assets and property, plant and equipment (756) (713)
Acquisitions of businesses, net of cash acquired (1,396) —
Purchase of investments (334) (146)
Purchase of current available-for-sale financial assets (361) (216)
Change in receivables from financing activities (1,113) (1,139)
Disposal of investments, intangibles and property, plant and equipment 3,141 260
Disposal of businesses, net of cash disposed 382 90
Disposal of current available-for-sale financial assets 199 37
Cash flows from investing activities - continuing operations (238) (1,828)
Cash flows from investing activities - discontinued operations 2,890 408
Cash flows from investing activities - continuing and discontinued operations 2,651 (1,419)
Cash flows from financing activities
Purchase of treasury shares (1,092) —
Other transactions with owners 2 (19)
Issuance of long-term debt 61 218
Repayment of long-term debt (including current maturities of long-term debt) (11) (28)
Change in short-term debt and other financing activities 1,280 2,101
Interest paid (250) (241)
Dividends paid to shareholders of Siemens AG (2,728) (2,533)
Dividends attributable to non-controlling interests (65) (79)
Cash flows from financing activities - continuing operations (2,802) (582)
Cash flows from financing activities - discontinued operations 5 —
Cash flows from financing activities - continuing and discontinued operations (2,797) (582)
Effect of changes in exchange rates on cash and cash equivalents 544 (98)
Change in cash and cash equivalents 810 (648)
Cash and cash equivalents at beginning of period 8,034 9,234
Cash and cash equivalents at end of period 8,845 8,586
Less: Cash and cash equivalents of assets classified as held for disposal and discontinued operations at end of period — 1
Cash and cash equivalents at end of period (Consolidated Statements of Financial Position) 8,844 8,585

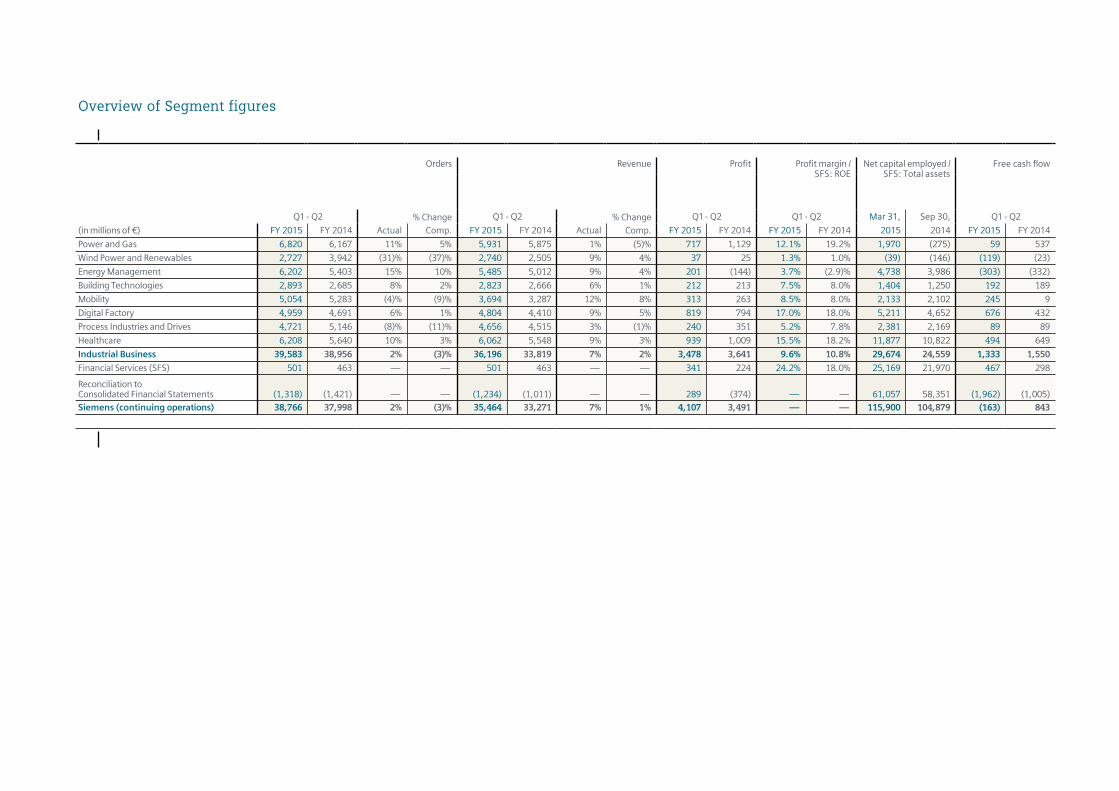
Overview of Segment figures
Orders Revenue Profit Profit margin /SFS: ROE
Net capital employed /SFS: Total assets
Free cash flow
Q2 % Change Q2 % Change Q2 Q2 Mar 31, Sep 30, Q2
(in millions of €) FY 2015 FY 2014 Actual Comp. FY 2015 FY 2014 Actual Comp. FY 2015 FY 2014 FY 2015 FY 2014 2015 2014 FY 2015 FY 2014
Power and Gas 3,087 2,677 15% 4% 3,045 2,929 4% (6)% 392 594 12.9% 20.3% 1,970 (275) 171 528
Wind Power and Renewables 1,410 1,681 (16)% (27)% 1,263 1,183 7% (1)% (44) (41) (3.5)% (3.5)% (39) (146) (230) 348
Energy Management 3,100 2,822 10% 2% 2,810 2,469 14% 4% 93 (187) 3.3% (7.6)% 4,738 3,986 (72) (76)
Building Technologies 1,464 1,337 9% 1% 1,446 1,326 9% 1% 95 93 6.6% 7.1% 1,404 1,250 178 160
Mobility 3,782 1,835 106% 95% 1,836 1,698 8% 2% 157 154 8.6% 9.1% 2,133 2,102 67 77
Digital Factory 2,569 2,392 7% 1% 2,422 2,246 8% 2% 355 408 14.7% 18.2% 5,211 4,652 338 327
Process Industries and Drives 2,442 2,691 (9)% (13)% 2,326 2,297 1% (5)% 85 188 3.7% 8.2% 2,381 2,169 60 76
Healthcare 3,228 2,826 14% 4% 3,212 2,854 13% 3% 526 536 16.4% 18.8% 11,877 10,822 237 340
Industrial Business 21,081 18,261 15% 7% 18,360 17,002 8% 0% 1,659 1,745 9.0% 10.3% 29,674 24,559 750 1,779
Financial Services (SFS) 280 236 — — 280 236 — — 195 114 28.0% 18.1% 25,169 21,970 224 192
Reconciliation toConsolidated Financial Statements (608) (640) — — (590) (543) — — 697 (287) — — 61,057 58,351 (1,165) (568)Siemens (continuing operations) 20,754 17,858 16% 7% 18,049 16,695 8% 0% 2,550 1,572 — — 115,900 104,879 (191) 1,402
Overview of Segment figures
Orders Revenue Profit Profit margin /SFS: ROE
Net capital employed /SFS: Total assets
Free cash flow
Q1 - Q2 % Change Q1 - Q2 % Change Q1 - Q2 Q1 - Q2 Mar 31, Sep 30, Q1 - Q2
(in millions of €) FY 2015 FY 2014 Actual Comp. FY 2015 FY 2014 Actual Comp. FY 2015 FY 2014 FY 2015 FY 2014 2015 2014 FY 2015 FY 2014
Power and Gas 6,820 6,167 11% 5% 5,931 5,875 1% (5)% 717 1,129 12.1% 19.2% 1,970 (275) 59 537
Wind Power and Renewables 2,727 3,942 (31)% (37)% 2,740 2,505 9% 4% 37 25 1.3% 1.0% (39) (146) (119) (23)
Energy Management 6,202 5,403 15% 10% 5,485 5,012 9% 4% 201 (144) 3.7% (2.9)% 4,738 3,986 (303) (332)
Building Technologies 2,893 2,685 8% 2% 2,823 2,666 6% 1% 212 213 7.5% 8.0% 1,404 1,250 192 189
Mobility 5,054 5,283 (4)% (9)% 3,694 3,287 12% 8% 313 263 8.5% 8.0% 2,133 2,102 245 9
Digital Factory 4,959 4,691 6% 1% 4,804 4,410 9% 5% 819 794 17.0% 18.0% 5,211 4,652 676 432
Process Industries and Drives 4,721 5,146 (8)% (11)% 4,656 4,515 3% (1)% 240 351 5.2% 7.8% 2,381 2,169 89 89
Healthcare 6,208 5,640 10% 3% 6,062 5,548 9% 3% 939 1,009 15.5% 18.2% 11,877 10,822 494 649
Industrial Business 39,583 38,956 2% (3)% 36,196 33,819 7% 2% 3,478 3,641 9.6% 10.8% 29,674 24,559 1,333 1,550
Financial Services (SFS) 501 463 — — 501 463 — — 341 224 24.2% 18.0% 25,169 21,970 467 298
Reconciliation toConsolidated Financial Statements (1,318) (1,421) — — (1,234) (1,011) — — 289 (374) — — 61,057 58,351 (1,962) (1,005)Siemens (continuing operations) 38,766 37,998 2% (3)% 35,464 33,271 7% 1% 4,107 3,491 — — 115,900 104,879 (163) 843

EBITDA Reconciliation
Profit Amortization of intangibleassets acquired in business
combinations
Financialincome
(expenses), net
EBIT Amortization,depreciation and
impairments
EBITDA
Q2 Q2 Q2 Q2 Q2 Q2
(in millions of €) FY 2015 FY 2014 FY 2015 FY 2014 FY 2015 FY 2014 FY 2015 FY 2014 FY 2015 FY 2014 FY 2015 FY 2014
Power and Gas 392— 594— (19)— (8)— (4)— (5)— 376— 590— 77— 59— 454— 648—
Wind Power and Renewables (44)— (41)— (2)— (2)— 6— (1)— (51)— (42)— 31— 34— (21)— (8)—
Energy Management 93— (187)— (6)— (6)— (2)— (3)— 89— (190)— 54— 50— 143— (139)—
Building Technologies 95— 93— (4)— (4)— — — — — 91— 90— 22— 20— 113— 110—
Mobility 157— 154— (16)— (14)— — — (4)— 142— 143— 32— 30— 174— 173—
Digital Factory 355— 408— (23)— (48)— — — 3— 332— 357— 67— 85— 400— 443—
Process Industries and Drives 85— 188— (12)— (12)— — — (1)— 74— 177— 60— 52— 133— 229—
Healthcare 526— 536— (45)— (42)— 6— 16— 475— 478— 135— 136— 610— 614—
Industrial Business 1,659— 1,745— (126)— (134)— 5— 7— 1,528— 1,604— 478— 466— 2,007— 2,070—
Financial Services (SFS) 195— 114— — — — — 151— 128— 43— (14)— 55— 51— 98— 37—
Reconciliation toConsolidated Financial Statements 697— (287)— 126— 135— (468)— (84)— 1,291— (68)— 84— 75— 1,375— 7
—
Siemens (continuing operations) 2,550— 1,572— — — — — (312)— 51— 2,862— 1,521— 617— 593— 3,480— 2,114—

EBITDA Reconciliation
Profit Amortization of intangibleassets acquired in business
combinations
Financialincome
(expenses), net
EBIT Amortization,depreciation and
impairments
EBITDA
Q1 - Q2 Q1 - Q2 Q1 - Q2 Q1 - Q2 Q1 - Q2 Q1 - Q2
(in millions of €) FY 2015 FY 2014 FY 2015 FY 2014 FY 2015 FY 2014 FY 2015 FY 2014 FY 2015 FY 2014 FY 2015 FY 2014
Power and Gas 717— 1,129— (33)— (16)— (8)— (11)— 692— 1,125— 141— 116— 833— 1,240—
Wind Power and Renewables 37— 25— (3)— (3)— 9— (4)— 24— 26— 63— 66— 87— 93—
Energy Management 201— (144)— (12)— (12)— (2)— (5)— 192— (151)— 106— 102— 298— (49)—
Building Technologies 212— 213— (8)— (7)— (2)— (1)— 206— 207— 42— 40— 248— 247—
Mobility 313— 263— (31)— (28)— (2)— (5)— 284— 240— 62— 59— 345— 299—
Digital Factory 819— 794— (45)— (97)— — — 3— 773— 694— 131— 177— 904— 872—
Process Industries and Drives 240— 351— (23)— (24)— (1)— (2)— 218— 329— 118— 104— 336— 433—
Healthcare 939— 1,009— (88)— (83)— 10— 20— 842— 905— 263— 265— 1,105— 1,171—
Industrial Business 3,478— 3,641— (243)— (271)— 3— (6)— 3,232— 3,376— 926— 929— 4,158— 4,305—
Financial Services (SFS) 341— 224— (1)— — — 313— 273— 27— (49)— 108— 103— 134— 53—
Reconciliation toConsolidated Financial Statements 289— (374)— 243— 271— (717)— (240)— 1,249— 137— 161— 149— 1,411— 286
—
Siemens (continuing operations) 4,107— 3,491— — — — — (401)— 27— 4,508— 3,463— 1,195— 1,181— 5,702— 4,644—

Orders & Revenue by region
Orders Revenue
Q2 % Change Q2 % Change
(in millions of €) FY 2015 FY 2014 Actual Comp. FY 2015 FY 2014 Actual Comp.
Europe, C.I.S., Africa, Middle East 11,418 9,190 24% 20% 9,302 9,006 3% 1%
therein: Germany 3,940 2,391 65% 65% 2,609 2,436 7% 7%
Americas 6,051 5,047 20% 3% 5,101 4,287 19% 2%
therein: U.S. 4,055 3,235 25% 3% 3,474 2,958 17% (2)%
Asia, Australia 3,284 3,621 (9)% (20)% 3,645 3,401 7% (6)%
therein: China 1,459 1,727 (15)% (27)% 1,640 1,472 11% (3)%
Siemens (continuing operations) 20,754 17,858 16% 7% 18,049 16,695 8% 0%
therein: Emerging markets 6,662 6,024 11% 0% 6,052 5,624 8% (3)%
Orders Revenue
Q1 - Q2 % Change Q1 - Q2 % Change
(in millions of €) FY 2015 FY 2014 Actual Comp. FY 2015 FY 2014 Actual Comp.
Europe, C.I.S., Africa, Middle East 19,971 20,364 (2)% (3)% 18,609 18,104 3% 2%
therein: Germany 6,258 5,516 13% 14% 5,366 4,998 7% 7%
Americas 11,967 10,387 15% 4% 9,797 8,604 14% 2%
therein: U.S. 7,879 7,149 10% (4)% 6,671 5,901 13% (1)%
Asia, Australia 6,828 7,247 (6)% (13)% 7,058 6,563 8% (1)%
therein: China 2,942 3,505 (16)% (24)% 3,219 2,854 13% 2%
Siemens (continuing operations) 38,766 37,998 2% (3)% 35,464 33,271 7% 1%
therein: Emerging markets 12,905 14,284 (10)% (14)% 11,655 11,030 6% 0%