Embed Size (px)
Citation preview
A&A 446, 1095–1105 (2006)DOI: 10.1051/0004-6361:20053951c© ESO 2006
Astronomy&
Astrophysics
Multiwavelength monitoring of BD +53◦2790, the opticalcounterpart to 4U 2206+54�
P. Blay1, I. Negueruela2, P. Reig3,4, M. J. Coe5, R. H. D. Corbet6,7, J. Fabregat8, and A. E. Tarasov9
1 Institut de Ciència dels Materials, Universidad de Valencia, PO Box 22085, 46071 Valencia, Spaine-mail: [email protected]
2 Departamento de Física, Ingeniería de Sistemas y Teoría de la Señal, EPSA, Universidad de Alicante, PO Box 99, 03080 Alicante, Spaine-mail: [email protected]
3 Foundation for Research and Technology-Hellas, 711 10 Heraklion, Crete, Greece4 Physics Department, University of Crete, 710 03 Heraklion, Crete, Greece
e-mail: [email protected] School of Physics and Astronomy, Southampton University, Southampton SO17 1BJ, UK
e-mail: [email protected] X-ray Astrophysics Laboratory, Code 662, NASA/Goddard Space Flight Center, Greenbelt, MD 20771, USA7 Universities Space Research Association
e-mail: [email protected] Observatori Astronómic, Universidad de Valencia, PO BOX 22085, 46071 Valencia, Spain
e-mail: [email protected] Crimean Astrophysical Observatory, Nauchny, Crimea, 334413, Ukraine
e-mail: [email protected]
Received 29 July 2005 / Accepted 5 October 2005
ABSTRACT
We present the results of our long-term monitoring of BD +53◦2790, the optical counterpart to the X-ray source 4U 2206+54. Unlike previousstudies that classify the source as a Be/X-ray binary, we find that its optical and infrared properties differ from those of typical Be stars: thevariability of the V/R ratio is not cyclical; there are variations in the shape and strength of the Hα emission line on timescales less than 1 day;and no correlation between the EW and the IR magnitudes or colors is seen. Our observations suggest that BD +53◦2790 is very likely apeculiar O9.5V star. In spite of exhaustive searches we cannot find any significant modulation in any emission line parameter or optical/infraredmagnitudes. Spectroscopy of the source extending from the optical to the K-band confirms the peculiarity of the spectrum: not only are the Helines stronger than expected for an O9.5V star but also there is no clear pattern of variability. The possibility that BD +53◦2790 is an early-typeanalogue to He-strong stars (like θ1 Ori C) is discussed.
Key words. stars: early-type – stars: emission-line, Be – stars: magnetic fields – stars: individual: BD+53◦2790
1. Introduction
4U 2206+54, first detected by the UHURU satellite (Giacconiet al. 1972), is a weak persistent X-ray source. It has beenobserved by Ariel V (as 3A 2206+543; Warwick et al. 1981),HEAO–1 (Steiner et al. 1984), EXOSAT (Saraswat & Apparao1992), ROSAT (as 1RX J220755+543111; Voges et al. 1999),RossiXTE (Corbet & Peele 2001; Negueruela & Reig 2001,henceforth NR01) and INTEGRAL (Blay et al. 2005). Thesource is variable, by a factor > 3 on timescales of a fewminutes and by a factor > 10 on longer timescales (Saraswat& Apparao 1992; Blay et al. 2005), keeping an average
� Tables 3, 5 and 6 are only available in electronic form athttp://www.edpsciences.org
luminosity around Lx ≈ 1035 erg s−1 for an assumed distanceof 3 kpc (NR01).
The optical counterpart was identified by Steiner et al.(1984), based on the position from the HEAO–1 ScanningModulation Collimator, as the early-type star BD +53◦2790.The star displayed Hα line in emission with two clearly differ-entiated peaks, separated by about 460 km s−1. Even thoughsome characteristics of the counterpart suggested a Be star(Steiner et al. 1984), high resolution spectra show it to bean unusually active O-type star, with an approximate spectraltype O9Vp (NR01).
RossiXTE/ASM observations of 4U 2206+54, show theX-ray flux to be modulated with a period of approxi-mately 9.6 days (see Corbet & Peele 2001; Ribó et al. 2006).
Article published by EDP Sciences and available at http://www.edpsciences.org/aa or http://dx.doi.org/10.1051/0004-6361:20053951
1096 P. Blay et al.: Multiwavelength monitoring of BD +53◦2790, the optical counterpart to 4U 2206+54
The short orbital period, absence of X-ray pulsations and pe-culiar optical counterpart make 4U 2206+54 a rather unusualHigh-Mass X-ray Binary (HMXB). The absence of pulsationsindicates that the compact companion could be a black hole.Recent studies of high energy emission from the system, how-ever, suggest that the compact object in 4U42206+54 is a neu-tron star (Blay et al. 2005; Torrejón et al. 2004; Masseti et al.2004).
In an attempt to improve our knowledge of this system,we have collected optical and infrared observations coveringabout 14 years.
2. Observations
We present data obtained as a part of a long-term monitor-ing campaign consisting of optical and infrared spectra, in-frared and optical broad-band photometry and narrow-bandStrömgren optical photometry of BD +53◦2790, the opticalcounterpart to 4U 2206+54.
2.1. Spectroscopy
2.1.1. Optical spectroscopy
We have monitored the source from 1990 to 1998, using the2.5-m Isaac Newton Telescope (INT) and the 1.0-m JakobusKapteyn Telescope (JKT), both located at the Observatorio delRoque de los Muchachos, La Palma, Spain, and the 1.5-m tele-scope at Palomar Mountain (PAL). We have also made useof data from the La Palma Archive (Zuiderwijk et al. 1994).The archival data consist of Hα spectroscopic observationstaken with the INT over the period 1986−1990. The twodatasets overlap for a few months and together they consti-tute continuous coverage of the source for thirteen years. Theolder INT observations had been taken with the IntermediateDispersion Spectrograph (IDS) and either the Image PhotonCounting System (IPCS) or a CCD camera. All the INT dataafter 1991 were obtained with CCD cameras. The JKT observa-tions were obtained using the St Andrew’s Richardson-BrealeySpectrograph (RBS) with the R1200Y grating, the red opticsand either the EEV7 or TEK4 CCD cameras, giving a nominaldispersion of ≈1.2 Å. The Palomar 1.5-m was operated usingthe f/8.75 Cassegrain echelle spectrograph in regular gratingmode (dispersion ≈0.8 Å/pixel).
Further observations were taken with the 2.6-m telescopeat the Crimean Astrophysical Observatory (CRAO) in Ukraine.
From 1999, further monitoring has been carried outusing the 1.52-m G. D. Cassini telescope at the LoianoObservatory (BOL), Italy, equipped with the Bologne FaintObject Spectrograph and Camera (BFOSC) and the 1.3-mTelescope at the Skinakas Observatory (SKI), in Crete, Greece.From Loiano, several observations were taken using grism #8,while higher resolution spectra were taken with grism #9in echelle mode (using grism #10 as cross-disperser). Otherspectra were taken with the echelle mode of grism #9 andgrism #13 as cross-disperser, giving coverage of the red/far-red/near-IR region (up to ∼9000 Å). At Skinakas, the tele-scope is an f/7.7 Ritchey-Cretien, which was equipped with
a 2000 × 800 ISA SITe chip CCD and a 1201 line mm−1 grat-ing, giving a nominal dispersion of 1 Å pixel−1.
Blue-end spectra of the source have also been taken with allthe telescopes listed, generally using the same configurationsas in the red spectroscopy, but with blue gratings and/or opticswhen the difference was relevant (for example, from Loiano,grisms #6 and #7 were used for the blue and yellow regionsrespectively).
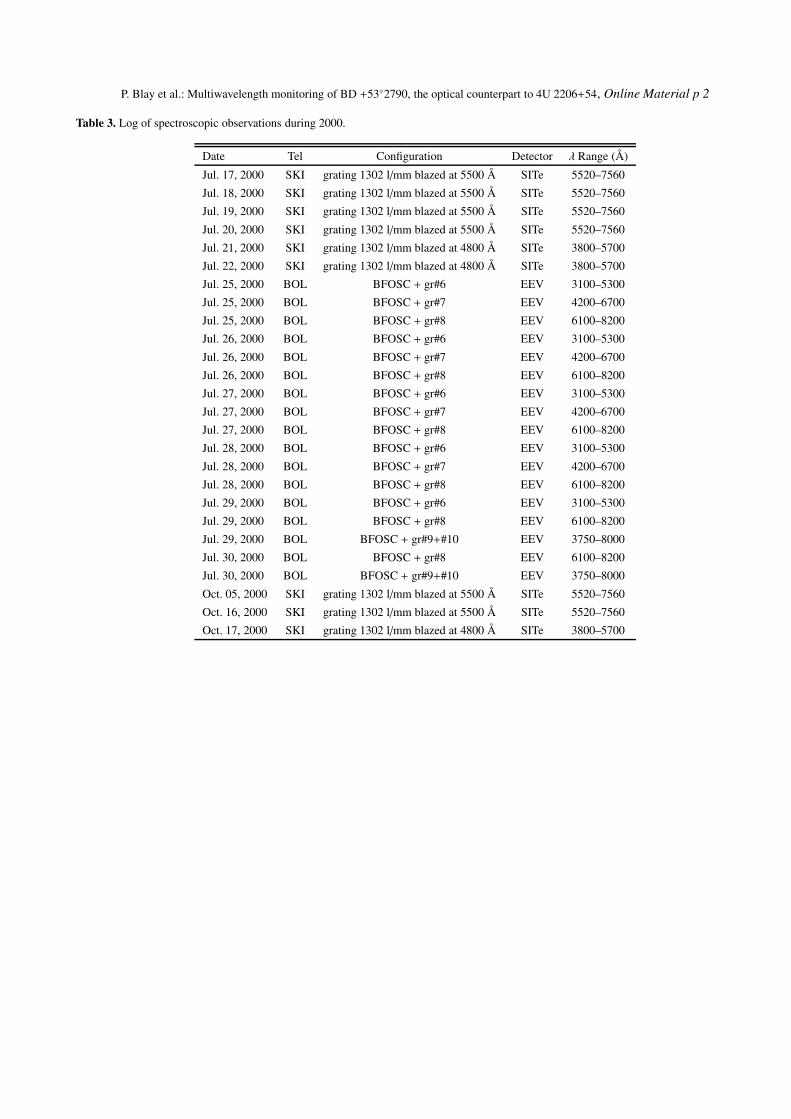
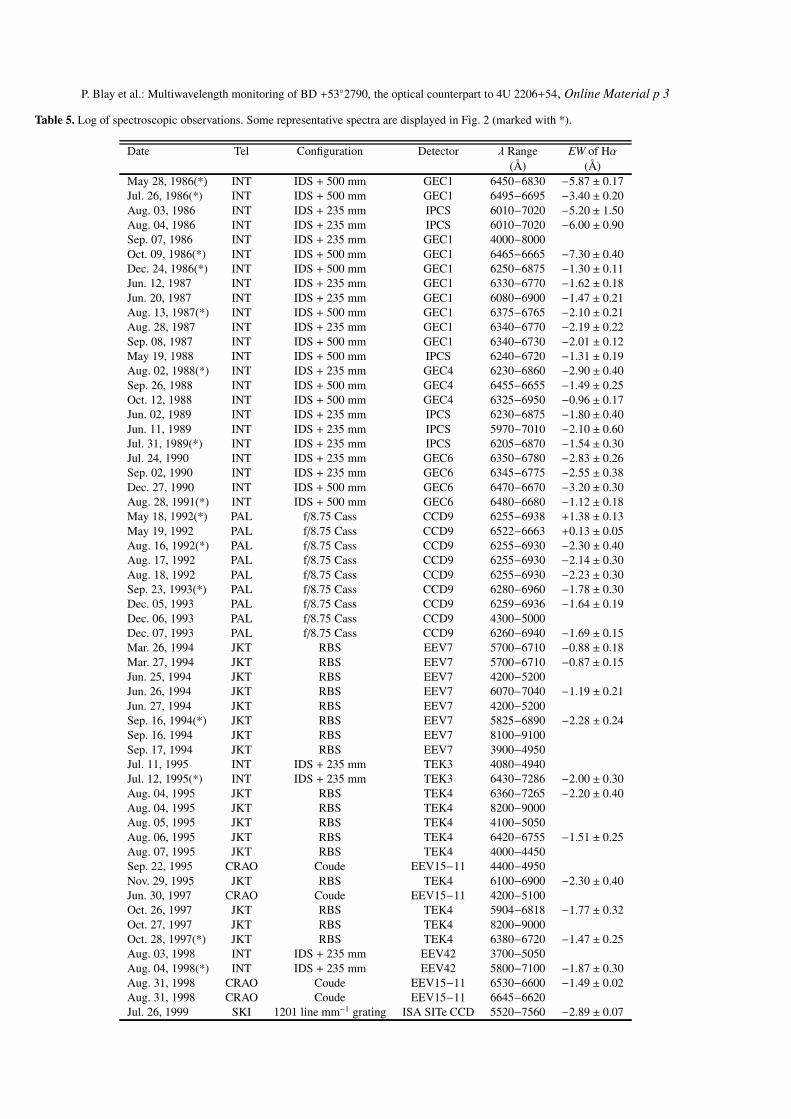
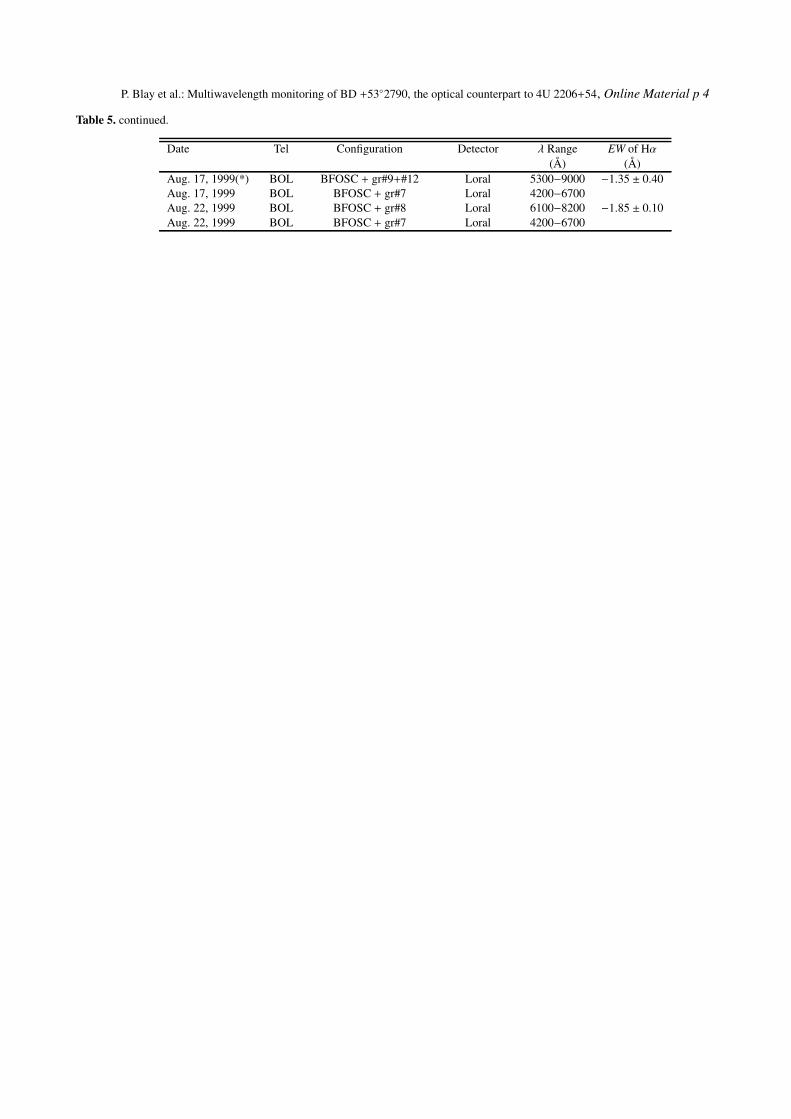
All the data have been reduced using the Starlink softwarepackage figaro (Shortridge et al. 1997) and analysed usingdipso (Howarth et al. 1997). Table 5 lists a log of the spectro-scopic observations.
2.1.2. Infrared spectroscopy
Near-infrared (I band) spectra of BD +53◦2790 have also beentaken with the JKT, INT and G. D. Cassini telescopes.
K-band spectroscopy of BD +53◦2790 was obtained onJuly 7−8, 1994, with the Cooled Grating Spectrometer (CGS4)on UKIRT, Hawaii. The instrumental configuration con-sisted of the long focal station (300 mm) camera and the75 lines mm−1 grating, which gives a nominal velocity reso-lution of 445 km s−1 at 2 µm (λ/∆λ ≈ 700). The data werereduced according to the procedure outlined by Everall et al.(1993).
2.2. Photometry
2.2.1. Optical photometry
We took one set of UBVRI photometry of the sourceon August 18, 1994, using the 1.0-m Jakobus KapteynTelescope (JKT). The observations were made using theTEK#4 CCD Camera and the Harris filter set. The data havebeen calibrated with observations of photometric standardsfrom Landolt et al. (1992) and the resulting magnitudes are onthe Cousins system.
We also obtained several sets of Strömgren uvbyβ photom-etry. The early observations were taken at the 1.5-m Spanishtelescope at the German-Spanish Calar Alto Observatory,Almería, Spain, using the UBVRI photometer with the uvby fil-ters, in single-channel mode, attached to the Cassegrain focus.Three other sets were obtained with the 1.23-m telescope atCalar Alto, using the TEK#6 CCD equipment. One further setwas taken with the 1.5-m Spanish telescope equipped with thesingle-channel multipurpose photoelectric photometer. Finally,one set was obtained with the 1.3-m Telescope at Skinakas,equipped with a Tektronik 1024 × 1024 CCD.
All observations are listed in Table 1.
2.2.2. Infrared photometry
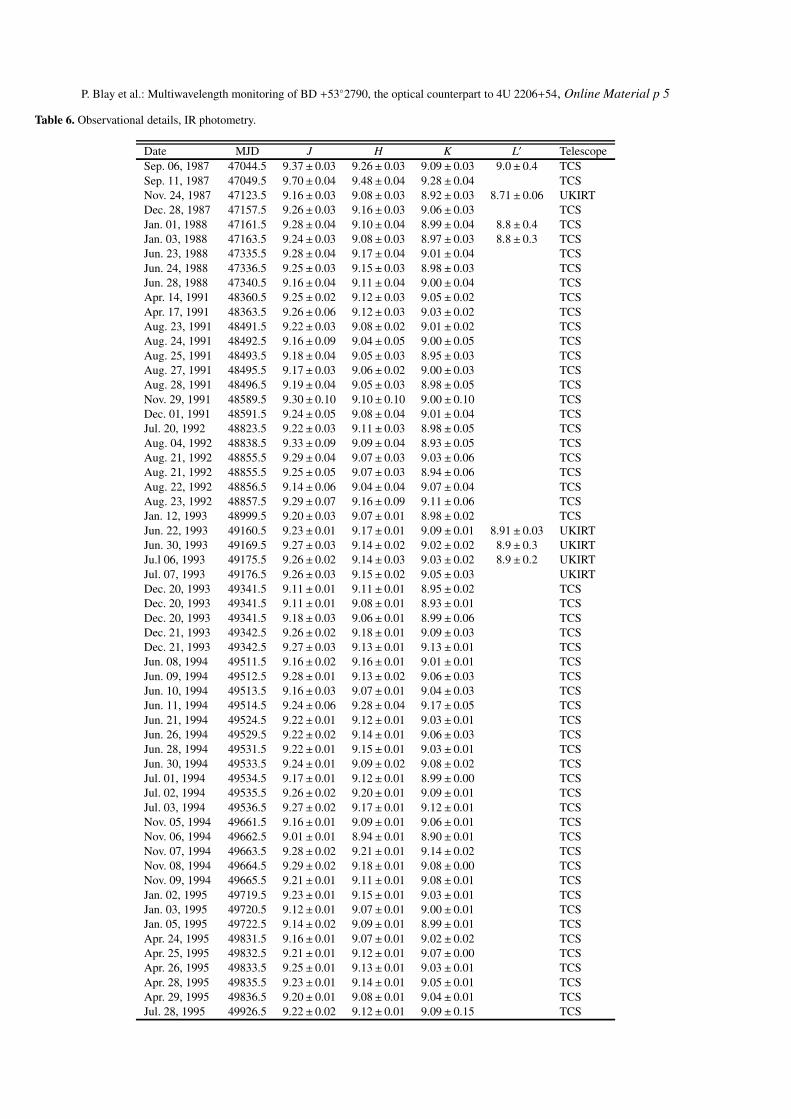
Infrared observations of BD +53◦2790 have been obtainedwith the Continuously Variable Filter (CVF) on the 1.5-m.Carlos Sánchez Telescope (TCS) at the Teide Observatory,Tenerife, Spain and the UKT9 detector at the 3.9-m UKInfrared Telescope (UKIRT) on Hawaii. All the observationsare listed in Table 6. The errors are much smaller after 1993,
P. Blay et al.: Multiwavelength monitoring of BD +53◦2790, the optical counterpart to 4U 2206+54 1097
Table 1. Strömgren photometry of the optical counterpart to 4U 2206+54. The last column indicates the telescope used. a stands for the 1.5-mSpanish telescope at Calar Alto. b represents the 1.23-m German telescope. c is the Skinakas 1.3-m telescope.
Date MJD V (b − y) m1 c1 β T
1988, Jan. 7 47168.290 9.909± 0.013 0.257± 0.005 −0.083± 0.007 0.011± 0.007 2.543± 0.040 a
1989, Jan. 4 74531.305 9.845± 0.015 0.257± 0.007 −0.042± 0.010 −0.117± 0.017 2.543± 0.007 a
1991, Nov. 16 48577.401 9.960± 0.034 0.268± 0.005 −0.040± 0.012 −0.041± 0.033 – b
1991, Dec. 19 48610.297 9.969± 0.038 0.271± 0.021 −0.322± 0.006 −0.010± 0.018 2.489± 0.024 b
1994, Jun. 21 49524.500 9.835± 0.019 0.258± 0.013 −0.032± 0.021 0.053± 0.030 2.617± 0.020 b
1996, May 26 50229.642 9.845± 0.012 0.267± 0.007 −0.052± 0.012 −0.074± 0.013 2.553± 0.006 a
1999, Aug. 16 51407.500 9.883± 0.031 0.255± 0.044 −0.226± 0.074 0.298± 0.094 − c
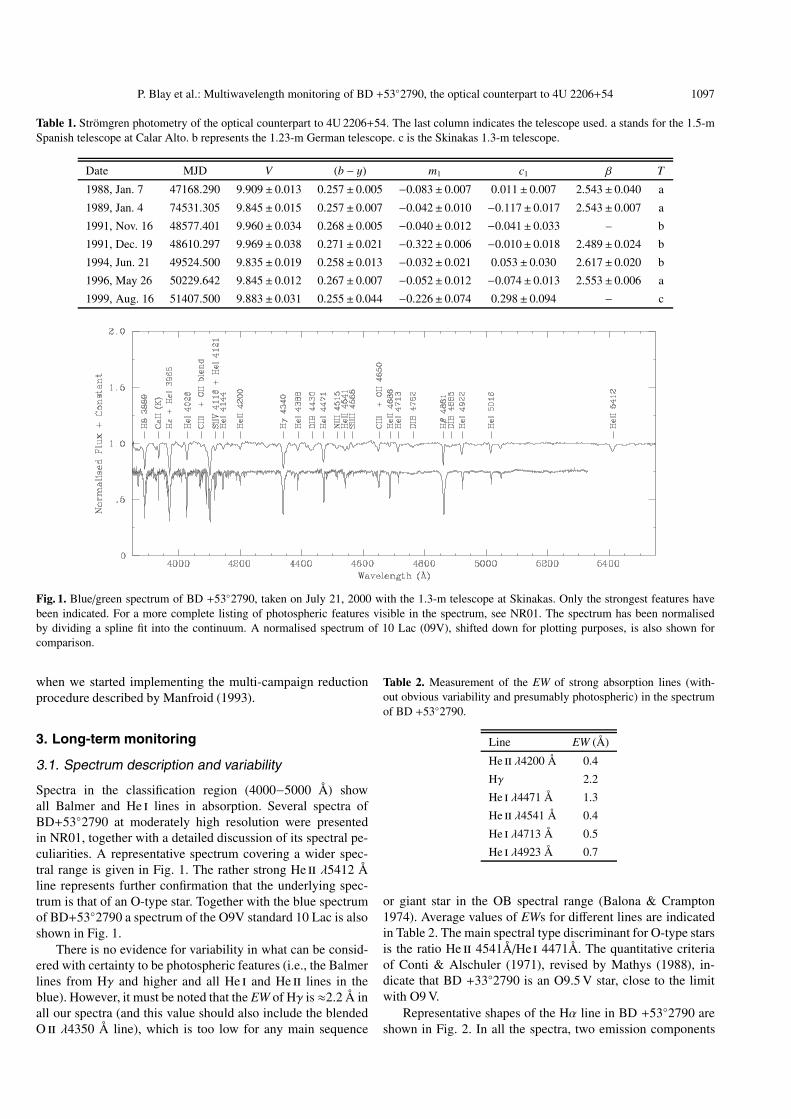
Fig. 1. Blue/green spectrum of BD +53◦2790, taken on July 21, 2000 with the 1.3-m telescope at Skinakas. Only the strongest features havebeen indicated. For a more complete listing of photospheric features visible in the spectrum, see NR01. The spectrum has been normalisedby dividing a spline fit into the continuum. A normalised spectrum of 10 Lac (09V), shifted down for plotting purposes, is also shown forcomparison.
when we started implementing the multi-campaign reductionprocedure described by Manfroid (1993).
3. Long-term monitoring
3.1. Spectrum description and variability
Spectra in the classification region (4000−5000 Å) showall Balmer and He i lines in absorption. Several spectra ofBD+53◦2790 at moderately high resolution were presentedin NR01, together with a detailed discussion of its spectral pe-culiarities. A representative spectrum covering a wider spec-tral range is given in Fig. 1. The rather strong He ii λ5412 Åline represents further confirmation that the underlying spec-trum is that of an O-type star. Together with the blue spectrumof BD+53◦2790 a spectrum of the O9V standard 10 Lac is alsoshown in Fig. 1.
There is no evidence for variability in what can be consid-ered with certainty to be photospheric features (i.e., the Balmerlines from Hγ and higher and all He i and He ii lines in theblue). However, it must be noted that the EW of Hγ is ≈2.2 Å inall our spectra (and this value should also include the blendedO ii λ4350 Å line), which is too low for any main sequence
Table 2. Measurement of the EW of strong absorption lines (with-out obvious variability and presumably photospheric) in the spectrumof BD +53◦2790.
Line EW (Å)
He ii λ4200 Å 0.4
Hγ 2.2
He i λ4471 Å 1.3
He ii λ4541 Å 0.4
He i λ4713 Å 0.5
He i λ4923 Å 0.7
or giant star in the OB spectral range (Balona & Crampton1974). Average values of EWs for different lines are indicatedin Table 2. The main spectral type discriminant for O-type starsis the ratio He ii 4541Å/He i 4471Å. The quantitative criteriaof Conti & Alschuler (1971), revised by Mathys (1988), in-dicate that BD +33◦2790 is an O9.5 V star, close to the limitwith O9 V.
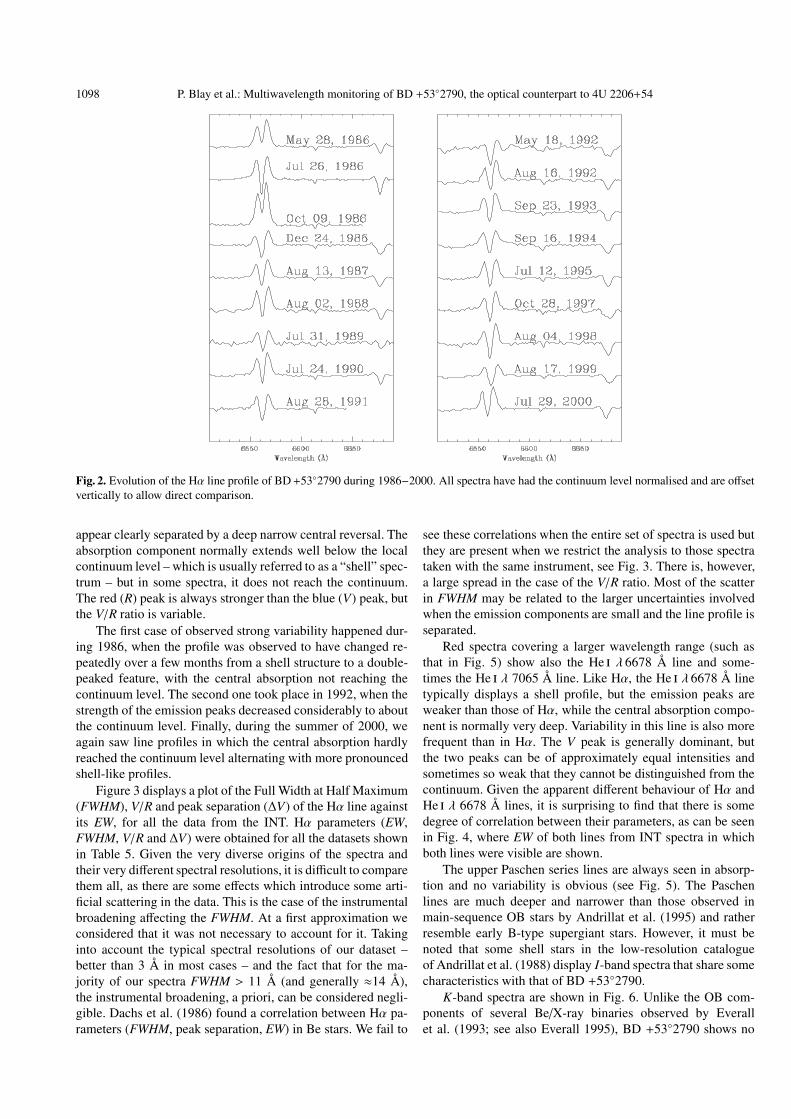
Representative shapes of the Hα line in BD +53◦2790 areshown in Fig. 2. In all the spectra, two emission components
1098 P. Blay et al.: Multiwavelength monitoring of BD +53◦2790, the optical counterpart to 4U 2206+54
Fig. 2. Evolution of the Hα line profile of BD+53◦2790 during 1986−2000. All spectra have had the continuum level normalised and are offsetvertically to allow direct comparison.
appear clearly separated by a deep narrow central reversal. Theabsorption component normally extends well below the localcontinuum level – which is usually referred to as a “shell” spec-trum – but in some spectra, it does not reach the continuum.The red (R) peak is always stronger than the blue (V) peak, butthe V/R ratio is variable.
The first case of observed strong variability happened dur-ing 1986, when the profile was observed to have changed re-peatedly over a few months from a shell structure to a double-peaked feature, with the central absorption not reaching thecontinuum level. The second one took place in 1992, when thestrength of the emission peaks decreased considerably to aboutthe continuum level. Finally, during the summer of 2000, weagain saw line profiles in which the central absorption hardlyreached the continuum level alternating with more pronouncedshell-like profiles.
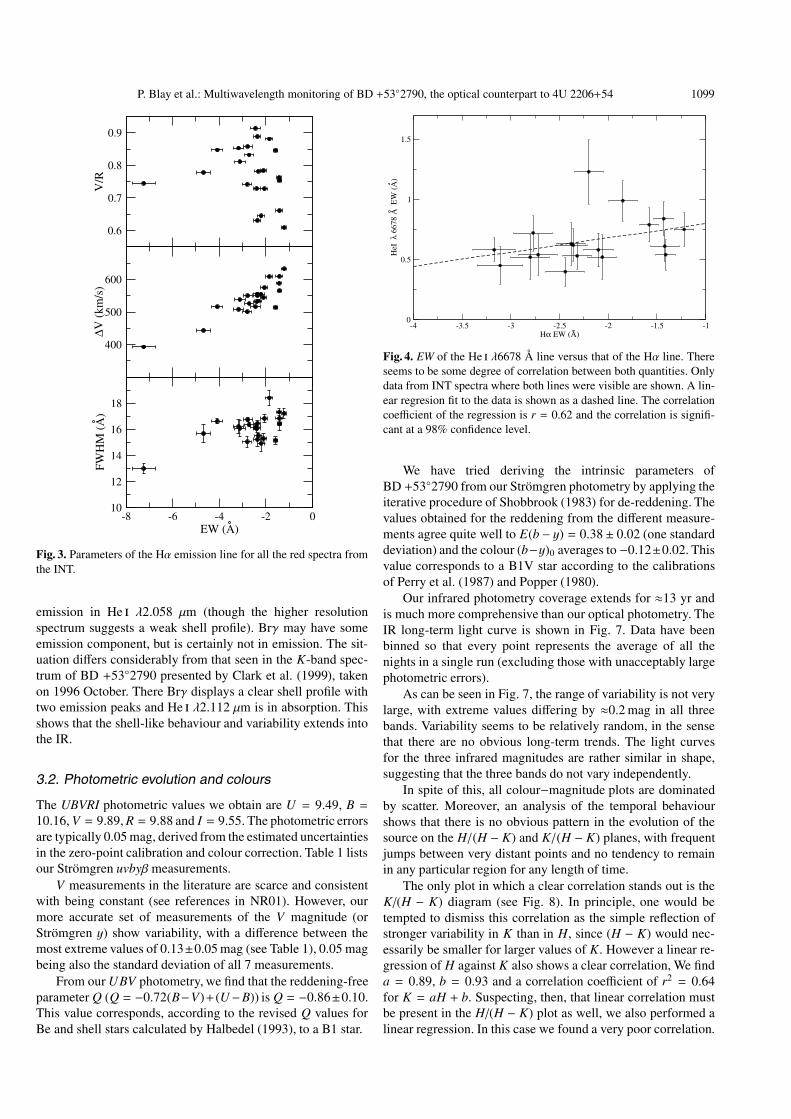
Figure 3 displays a plot of the Full Width at Half Maximum(FWHM), V/R and peak separation (∆V) of the Hα line againstits EW, for all the data from the INT. Hα parameters (EW,FWHM, V/R and ∆V) were obtained for all the datasets shownin Table 5. Given the very diverse origins of the spectra andtheir very different spectral resolutions, it is difficult to comparethem all, as there are some effects which introduce some arti-ficial scattering in the data. This is the case of the instrumentalbroadening affecting the FWHM. At a first approximation weconsidered that it was not necessary to account for it. Takinginto account the typical spectral resolutions of our dataset –better than 3 Å in most cases – and the fact that for the ma-jority of our spectra FWHM > 11 Å (and generally ≈14 Å),the instrumental broadening, a priori, can be considered negli-gible. Dachs et al. (1986) found a correlation between Hα pa-rameters (FWHM, peak separation, EW) in Be stars. We fail to
see these correlations when the entire set of spectra is used butthey are present when we restrict the analysis to those spectrataken with the same instrument, see Fig. 3. There is, however,a large spread in the case of the V/R ratio. Most of the scatterin FWHM may be related to the larger uncertainties involvedwhen the emission components are small and the line profile isseparated.
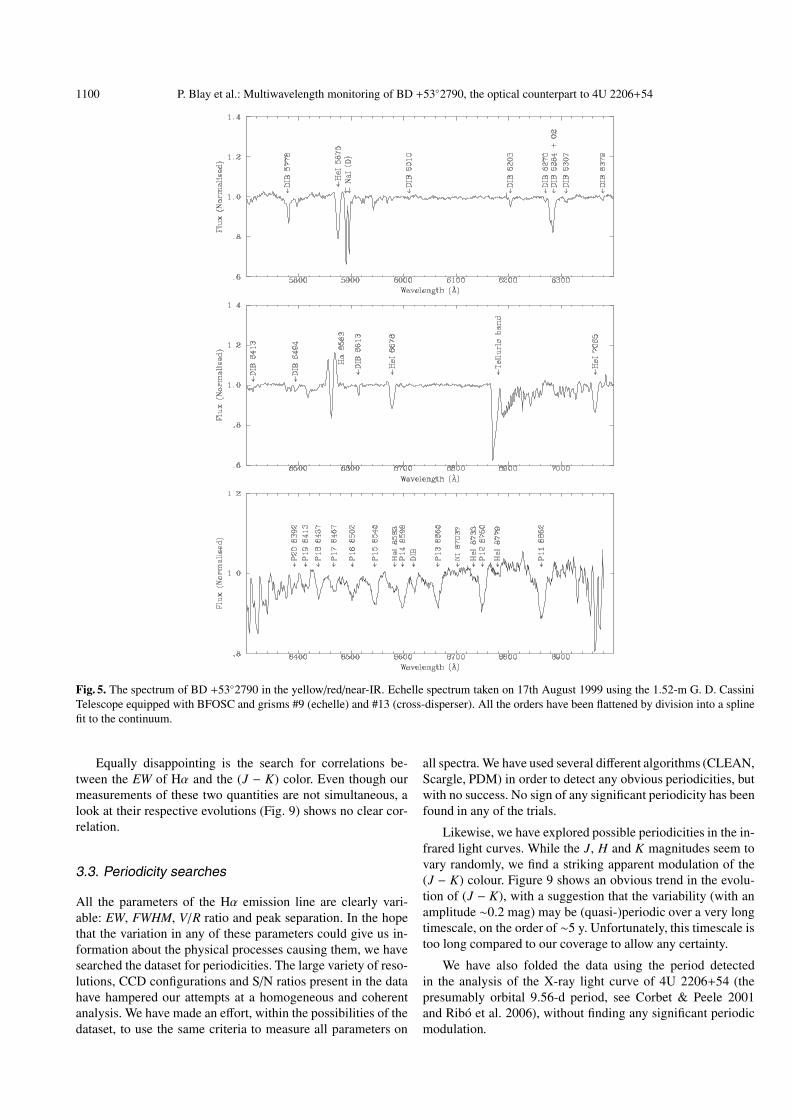
Red spectra covering a larger wavelength range (such asthat in Fig. 5) show also the He i λ 6678 Å line and some-times the He i λ 7065 Å line. Like Hα, the He i λ 6678 Å linetypically displays a shell profile, but the emission peaks areweaker than those of Hα, while the central absorption compo-nent is normally very deep. Variability in this line is also morefrequent than in Hα. The V peak is generally dominant, butthe two peaks can be of approximately equal intensities andsometimes so weak that they cannot be distinguished from thecontinuum. Given the apparent different behaviour of Hα andHe i λ 6678 Å lines, it is surprising to find that there is somedegree of correlation between their parameters, as can be seenin Fig. 4, where EW of both lines from INT spectra in whichboth lines were visible are shown.
The upper Paschen series lines are always seen in absorp-tion and no variability is obvious (see Fig. 5). The Paschenlines are much deeper and narrower than those observed inmain-sequence OB stars by Andrillat et al. (1995) and ratherresemble early B-type supergiant stars. However, it must benoted that some shell stars in the low-resolution catalogueof Andrillat et al. (1988) display I-band spectra that share somecharacteristics with that of BD +53◦2790.
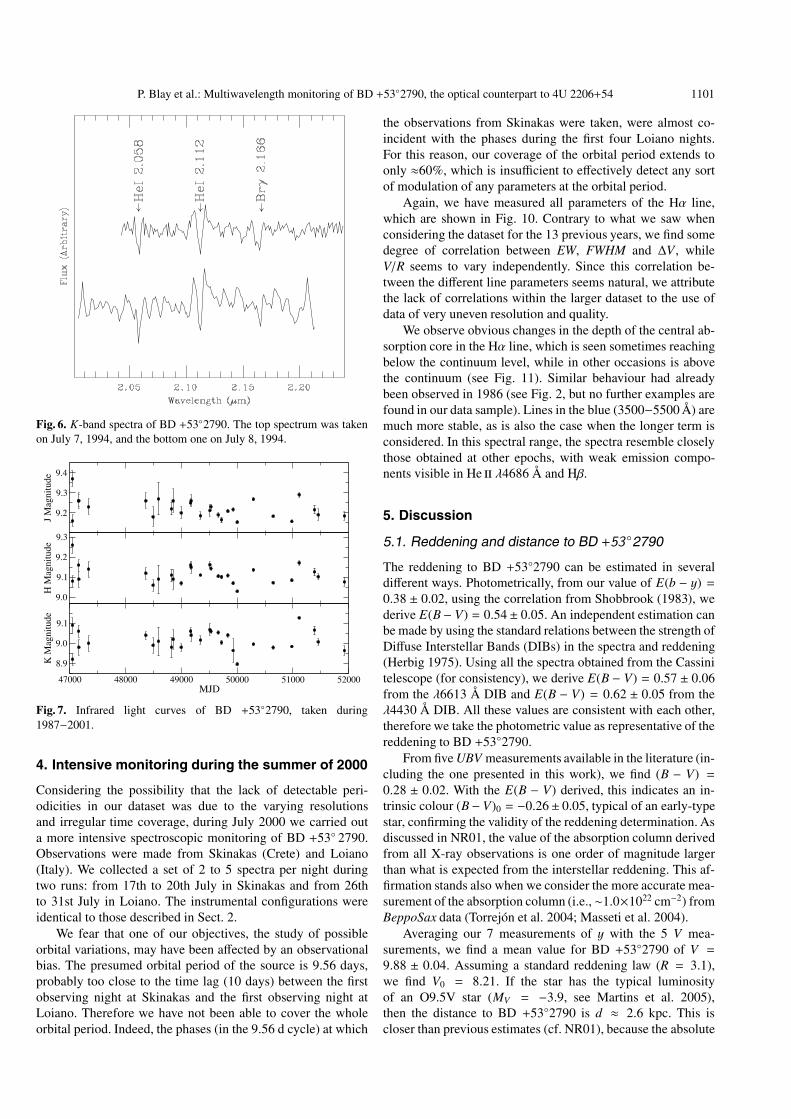
K-band spectra are shown in Fig. 6. Unlike the OB com-ponents of several Be/X-ray binaries observed by Everallet al. (1993; see also Everall 1995), BD +53◦2790 shows no
P. Blay et al.: Multiwavelength monitoring of BD +53◦2790, the optical counterpart to 4U 2206+54 1099
0.6
0.7
0.8
0.9
V/R
400
500
600
∆V (
km/s
)
-8 -6 -4 -2 0EW (A)
10
12
14
16
18
FWH
M (
A)
Fig. 3. Parameters of the Hα emission line for all the red spectra fromthe INT.
emission in He i λ2.058 µm (though the higher resolutionspectrum suggests a weak shell profile). Brγ may have someemission component, but is certainly not in emission. The sit-uation differs considerably from that seen in the K-band spec-trum of BD +53◦2790 presented by Clark et al. (1999), takenon 1996 October. There Brγ displays a clear shell profile withtwo emission peaks and He i λ2.112 µm is in absorption. Thisshows that the shell-like behaviour and variability extends intothe IR.
3.2. Photometric evolution and colours
The UBVRI photometric values we obtain are U = 9.49, B =10.16, V = 9.89, R = 9.88 and I = 9.55. The photometric errorsare typically 0.05 mag, derived from the estimated uncertaintiesin the zero-point calibration and colour correction. Table 1 listsour Strömgren uvbyβ measurements.
V measurements in the literature are scarce and consistentwith being constant (see references in NR01). However, ourmore accurate set of measurements of the V magnitude (orStrömgren y) show variability, with a difference between themost extreme values of 0.13±0.05 mag (see Table 1), 0.05 magbeing also the standard deviation of all 7 measurements.
From our UBV photometry, we find that the reddening-freeparameter Q (Q = −0.72(B−V)+(U−B)) is Q = −0.86±0.10.This value corresponds, according to the revised Q values forBe and shell stars calculated by Halbedel (1993), to a B1 star.
-4 -3.5 -3 -2.5 -2 -1.5 -1Hα EW (A)
0
0.5
1
1.5
HeI
λ 6
678
A E
W (
A)
Fig. 4. EW of the He i λ6678 Å line versus that of the Hα line. Thereseems to be some degree of correlation between both quantities. Onlydata from INT spectra where both lines were visible are shown. A lin-ear regresion fit to the data is shown as a dashed line. The correlationcoefficient of the regression is r = 0.62 and the correlation is signifi-cant at a 98% confidence level.
We have tried deriving the intrinsic parameters ofBD +53◦2790 from our Strömgren photometry by applying theiterative procedure of Shobbrook (1983) for de-reddening. Thevalues obtained for the reddening from the different measure-ments agree quite well to E(b − y) = 0.38± 0.02 (one standarddeviation) and the colour (b−y)0 averages to −0.12±0.02. Thisvalue corresponds to a B1V star according to the calibrationsof Perry et al. (1987) and Popper (1980).
Our infrared photometry coverage extends for ≈13 yr andis much more comprehensive than our optical photometry. TheIR long-term light curve is shown in Fig. 7. Data have beenbinned so that every point represents the average of all thenights in a single run (excluding those with unacceptably largephotometric errors).
As can be seen in Fig. 7, the range of variability is not verylarge, with extreme values differing by ≈0.2 mag in all threebands. Variability seems to be relatively random, in the sensethat there are no obvious long-term trends. The light curvesfor the three infrared magnitudes are rather similar in shape,suggesting that the three bands do not vary independently.
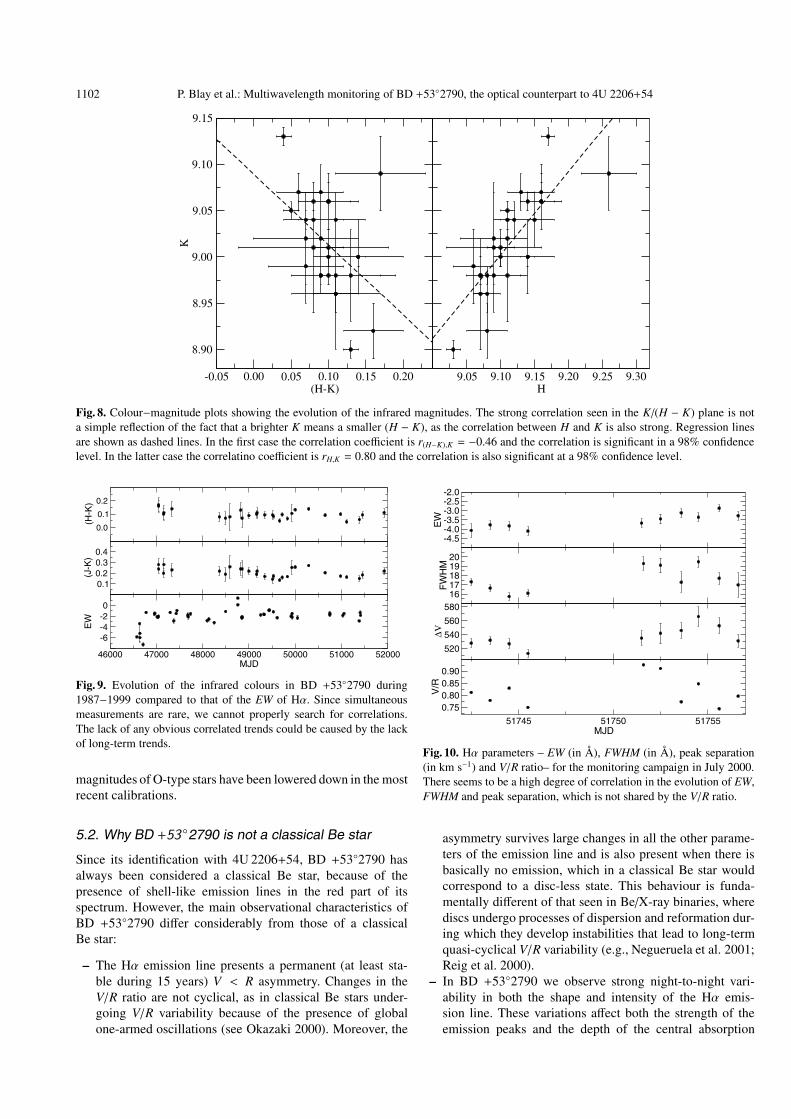
In spite of this, all colour−magnitude plots are dominatedby scatter. Moreover, an analysis of the temporal behaviourshows that there is no obvious pattern in the evolution of thesource on the H/(H − K) and K/(H − K) planes, with frequentjumps between very distant points and no tendency to remainin any particular region for any length of time.
The only plot in which a clear correlation stands out is theK/(H − K) diagram (see Fig. 8). In principle, one would betempted to dismiss this correlation as the simple reflection ofstronger variability in K than in H, since (H − K) would nec-essarily be smaller for larger values of K. However a linear re-gression of H against K also shows a clear correlation, We finda = 0.89, b = 0.93 and a correlation coefficient of r2 = 0.64for K = aH + b. Suspecting, then, that linear correlation mustbe present in the H/(H − K) plot as well, we also performed alinear regression. In this case we found a very poor correlation.
1100 P. Blay et al.: Multiwavelength monitoring of BD +53◦2790, the optical counterpart to 4U 2206+54
Fig. 5. The spectrum of BD +53◦2790 in the yellow/red/near-IR. Echelle spectrum taken on 17th August 1999 using the 1.52-m G. D. CassiniTelescope equipped with BFOSC and grisms #9 (echelle) and #13 (cross-disperser). All the orders have been flattened by division into a splinefit to the continuum.
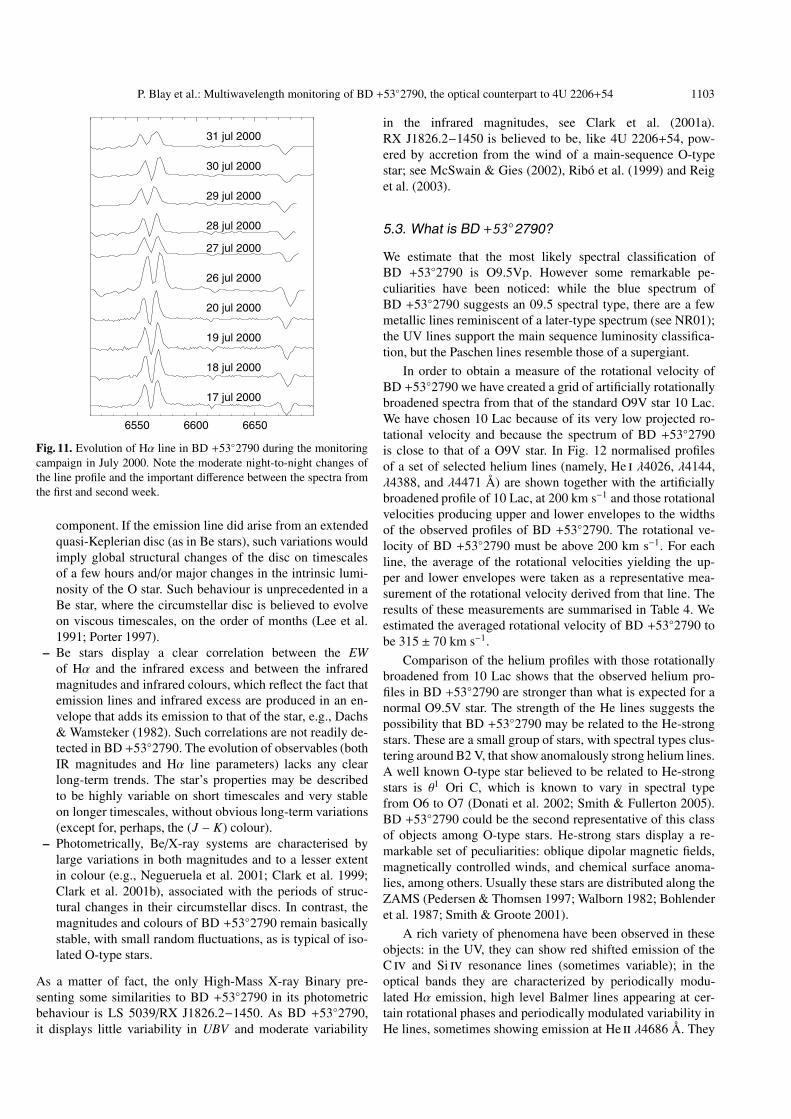
Equally disappointing is the search for correlations be-tween the EW of Hα and the (J − K) color. Even though ourmeasurements of these two quantities are not simultaneous, alook at their respective evolutions (Fig. 9) shows no clear cor-relation.
3.3. Periodicity searches
All the parameters of the Hα emission line are clearly vari-able: EW, FWHM, V/R ratio and peak separation. In the hopethat the variation in any of these parameters could give us in-formation about the physical processes causing them, we havesearched the dataset for periodicities. The large variety of reso-lutions, CCD configurations and S/N ratios present in the datahave hampered our attempts at a homogeneous and coherentanalysis. We have made an effort, within the possibilities of thedataset, to use the same criteria to measure all parameters on
all spectra. We have used several different algorithms (CLEAN,Scargle, PDM) in order to detect any obvious periodicities, butwith no success. No sign of any significant periodicity has beenfound in any of the trials.
Likewise, we have explored possible periodicities in the in-frared light curves. While the J, H and K magnitudes seem tovary randomly, we find a striking apparent modulation of the(J − K) colour. Figure 9 shows an obvious trend in the evolu-tion of (J − K), with a suggestion that the variability (with anamplitude ∼0.2 mag) may be (quasi-)periodic over a very longtimescale, on the order of ∼5 y. Unfortunately, this timescale istoo long compared to our coverage to allow any certainty.
We have also folded the data using the period detectedin the analysis of the X-ray light curve of 4U 2206+54 (thepresumably orbital 9.56-d period, see Corbet & Peele 2001and Ribó et al. 2006), without finding any significant periodicmodulation.
P. Blay et al.: Multiwavelength monitoring of BD +53◦2790, the optical counterpart to 4U 2206+54 1101
Fig. 6. K-band spectra of BD +53◦2790. The top spectrum was takenon July 7, 1994, and the bottom one on July 8, 1994.
9.2
9.3
9.4
J M
agni
tude
9.0
9.1
9.2
9.3
H M
agni
tude
47000 48000 49000 50000 51000 52000MJD
8.9
9.0
9.1
K M
agni
tude
Fig. 7. Infrared light curves of BD +53◦2790, taken during1987−2001.
4. Intensive monitoring during the summer of 2000
Considering the possibility that the lack of detectable peri-odicities in our dataset was due to the varying resolutionsand irregular time coverage, during July 2000 we carried outa more intensive spectroscopic monitoring of BD +53◦ 2790.Observations were made from Skinakas (Crete) and Loiano(Italy). We collected a set of 2 to 5 spectra per night duringtwo runs: from 17th to 20th July in Skinakas and from 26thto 31st July in Loiano. The instrumental configurations wereidentical to those described in Sect. 2.
We fear that one of our objectives, the study of possibleorbital variations, may have been affected by an observationalbias. The presumed orbital period of the source is 9.56 days,probably too close to the time lag (10 days) between the firstobserving night at Skinakas and the first observing night atLoiano. Therefore we have not been able to cover the wholeorbital period. Indeed, the phases (in the 9.56 d cycle) at which
the observations from Skinakas were taken, were almost co-incident with the phases during the first four Loiano nights.For this reason, our coverage of the orbital period extends toonly ≈60%, which is insufficient to effectively detect any sortof modulation of any parameters at the orbital period.
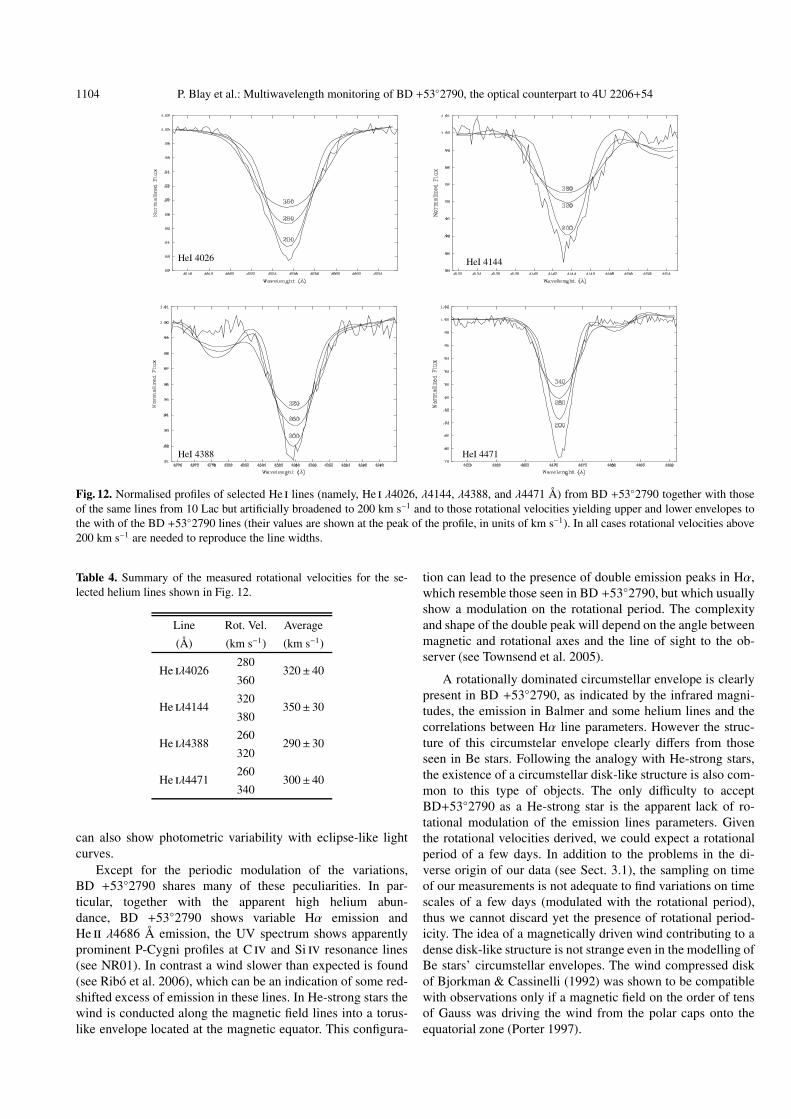
Again, we have measured all parameters of the Hα line,which are shown in Fig. 10. Contrary to what we saw whenconsidering the dataset for the 13 previous years, we find somedegree of correlation between EW, FWHM and ∆V , whileV/R seems to vary independently. Since this correlation be-tween the different line parameters seems natural, we attributethe lack of correlations within the larger dataset to the use ofdata of very uneven resolution and quality.
We observe obvious changes in the depth of the central ab-sorption core in the Hα line, which is seen sometimes reachingbelow the continuum level, while in other occasions is abovethe continuum (see Fig. 11). Similar behaviour had alreadybeen observed in 1986 (see Fig. 2, but no further examples arefound in our data sample). Lines in the blue (3500−5500 Å) aremuch more stable, as is also the case when the longer term isconsidered. In this spectral range, the spectra resemble closelythose obtained at other epochs, with weak emission compo-nents visible in He ii λ4686 Å and Hβ.
5. Discussion
5.1. Reddening and distance to BD +53◦2790
The reddening to BD +53◦2790 can be estimated in severaldifferent ways. Photometrically, from our value of E(b − y) =0.38 ± 0.02, using the correlation from Shobbrook (1983), wederive E(B− V) = 0.54± 0.05. An independent estimation canbe made by using the standard relations between the strength ofDiffuse Interstellar Bands (DIBs) in the spectra and reddening(Herbig 1975). Using all the spectra obtained from the Cassinitelescope (for consistency), we derive E(B − V) = 0.57 ± 0.06from the λ6613 Å DIB and E(B − V) = 0.62 ± 0.05 from theλ4430 Å DIB. All these values are consistent with each other,therefore we take the photometric value as representative of thereddening to BD +53◦2790.
From five UBV measurements available in the literature (in-cluding the one presented in this work), we find (B − V) =0.28 ± 0.02. With the E(B − V) derived, this indicates an in-trinsic colour (B− V)0 = −0.26± 0.05, typical of an early-typestar, confirming the validity of the reddening determination. Asdiscussed in NR01, the value of the absorption column derivedfrom all X-ray observations is one order of magnitude largerthan what is expected from the interstellar reddening. This af-firmation stands also when we consider the more accurate mea-surement of the absorption column (i.e., ∼1.0×1022 cm−2) fromBeppoSax data (Torrejón et al. 2004; Masseti et al. 2004).
Averaging our 7 measurements of y with the 5 V mea-surements, we find a mean value for BD +53◦2790 of V =9.88 ± 0.04. Assuming a standard reddening law (R = 3.1),we find V0 = 8.21. If the star has the typical luminosityof an O9.5V star (MV = −3.9, see Martins et al. 2005),then the distance to BD +53◦2790 is d ≈ 2.6 kpc. This iscloser than previous estimates (cf. NR01), because the absolute
1102 P. Blay et al.: Multiwavelength monitoring of BD +53◦2790, the optical counterpart to 4U 2206+54
-0.05 0.00 0.05 0.10 0.15 0.20(H-K)
8.90
8.95
9.00
9.05
9.10
9.15
K
9.05 9.10 9.15 9.20 9.25 9.30H
Fig. 8. Colour−magnitude plots showing the evolution of the infrared magnitudes. The strong correlation seen in the K/(H − K) plane is nota simple reflection of the fact that a brighter K means a smaller (H − K), as the correlation between H and K is also strong. Regression linesare shown as dashed lines. In the first case the correlation coefficient is r(H−K),K = −0.46 and the correlation is significant in a 98% confidencelevel. In the latter case the correlatino coefficient is rH,K = 0.80 and the correlation is also significant at a 98% confidence level.
46000 47000 48000 49000 50000 51000 52000MJD
-6-4-20
EW
0.10.20.30.4
(J-K
)
0.0
0.1
0.2
(H-K
)
Fig. 9. Evolution of the infrared colours in BD +53◦2790 during1987−1999 compared to that of the EW of Hα. Since simultaneousmeasurements are rare, we cannot properly search for correlations.The lack of any obvious correlated trends could be caused by the lackof long-term trends.
magnitudes of O-type stars have been lowered down in the mostrecent calibrations.
5.2. Why BD +53◦2790 is not a classical Be star
Since its identification with 4U 2206+54, BD +53◦2790 hasalways been considered a classical Be star, because of thepresence of shell-like emission lines in the red part of itsspectrum. However, the main observational characteristics ofBD +53◦2790 differ considerably from those of a classicalBe star:
– The Hα emission line presents a permanent (at least sta-ble during 15 years) V < R asymmetry. Changes in theV/R ratio are not cyclical, as in classical Be stars under-going V/R variability because of the presence of globalone-armed oscillations (see Okazaki 2000). Moreover, the
-4.5-4.0-3.5-3.0-2.5-2.0
EW
1617181920
FW
HM
520
540
560
580
∆V
51745 51750 51755MJD
0.750.800.850.90
V/R
Fig. 10. Hα parameters – EW (in Å), FWHM (in Å), peak separation(in km s−1) and V/R ratio– for the monitoring campaign in July 2000.There seems to be a high degree of correlation in the evolution of EW,FWHM and peak separation, which is not shared by the V/R ratio.
asymmetry survives large changes in all the other parame-ters of the emission line and is also present when there isbasically no emission, which in a classical Be star wouldcorrespond to a disc-less state. This behaviour is funda-mentally different of that seen in Be/X-ray binaries, wherediscs undergo processes of dispersion and reformation dur-ing which they develop instabilities that lead to long-termquasi-cyclical V/R variability (e.g., Negueruela et al. 2001;Reig et al. 2000).
– In BD +53◦2790 we observe strong night-to-night vari-ability in both the shape and intensity of the Hα emis-sion line. These variations affect both the strength of theemission peaks and the depth of the central absorption
P. Blay et al.: Multiwavelength monitoring of BD +53◦2790, the optical counterpart to 4U 2206+54 1103
6550 6600 6650
17 jul 2000
18 jul 2000
19 jul 2000
20 jul 2000
26 jul 2000
27 jul 2000
28 jul 2000
29 jul 2000
30 jul 2000
31 jul 2000
Fig. 11. Evolution of Hα line in BD +53◦2790 during the monitoringcampaign in July 2000. Note the moderate night-to-night changes ofthe line profile and the important difference between the spectra fromthe first and second week.
component. If the emission line did arise from an extendedquasi-Keplerian disc (as in Be stars), such variations wouldimply global structural changes of the disc on timescalesof a few hours and/or major changes in the intrinsic lumi-nosity of the O star. Such behaviour is unprecedented in aBe star, where the circumstellar disc is believed to evolveon viscous timescales, on the order of months (Lee et al.1991; Porter 1997).
– Be stars display a clear correlation between the EWof Hα and the infrared excess and between the infraredmagnitudes and infrared colours, which reflect the fact thatemission lines and infrared excess are produced in an en-velope that adds its emission to that of the star, e.g., Dachs& Wamsteker (1982). Such correlations are not readily de-tected in BD +53◦2790. The evolution of observables (bothIR magnitudes and Hα line parameters) lacks any clearlong-term trends. The star’s properties may be describedto be highly variable on short timescales and very stableon longer timescales, without obvious long-term variations(except for, perhaps, the (J − K) colour).
– Photometrically, Be/X-ray systems are characterised bylarge variations in both magnitudes and to a lesser extentin colour (e.g., Negueruela et al. 2001; Clark et al. 1999;Clark et al. 2001b), associated with the periods of struc-tural changes in their circumstellar discs. In contrast, themagnitudes and colours of BD +53◦2790 remain basicallystable, with small random fluctuations, as is typical of iso-lated O-type stars.
As a matter of fact, the only High-Mass X-ray Binary pre-senting some similarities to BD +53◦2790 in its photometricbehaviour is LS 5039/RX J1826.2−1450. As BD +53◦2790,it displays little variability in UBV and moderate variability
in the infrared magnitudes, see Clark et al. (2001a).RX J1826.2−1450 is believed to be, like 4U 2206+54, pow-ered by accretion from the wind of a main-sequence O-typestar; see McSwain & Gies (2002), Ribó et al. (1999) and Reiget al. (2003).
5.3. What is BD +53◦2790?
We estimate that the most likely spectral classification ofBD +53◦2790 is O9.5Vp. However some remarkable pe-culiarities have been noticed: while the blue spectrum ofBD +53◦2790 suggests an 09.5 spectral type, there are a fewmetallic lines reminiscent of a later-type spectrum (see NR01);the UV lines support the main sequence luminosity classifica-tion, but the Paschen lines resemble those of a supergiant.
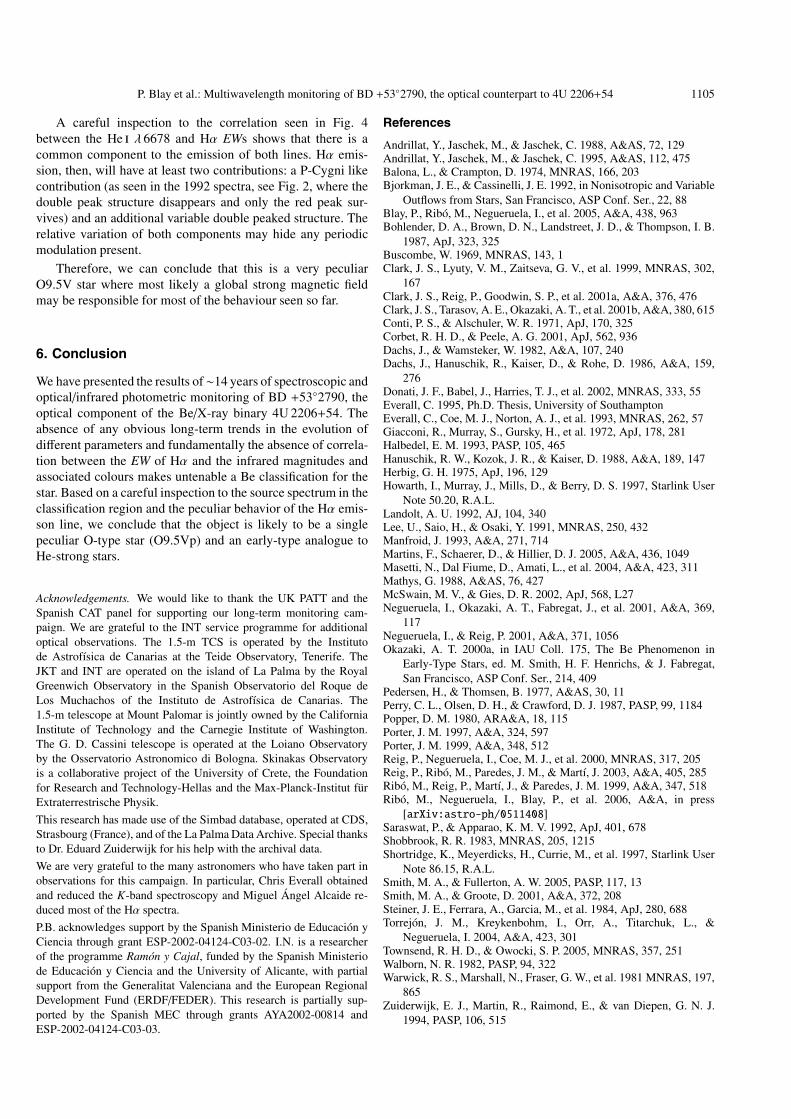
In order to obtain a measure of the rotational velocity ofBD +53◦2790 we have created a grid of artificially rotationallybroadened spectra from that of the standard O9V star 10 Lac.We have chosen 10 Lac because of its very low projected ro-tational velocity and because the spectrum of BD +53◦2790is close to that of a O9V star. In Fig. 12 normalised profilesof a set of selected helium lines (namely, He i λ4026, λ4144,λ4388, and λ4471 Å) are shown together with the artificiallybroadened profile of 10 Lac, at 200 km s−1 and those rotationalvelocities producing upper and lower envelopes to the widthsof the observed profiles of BD +53◦2790. The rotational ve-locity of BD +53◦2790 must be above 200 km s−1. For eachline, the average of the rotational velocities yielding the up-per and lower envelopes were taken as a representative mea-surement of the rotational velocity derived from that line. Theresults of these measurements are summarised in Table 4. Weestimated the averaged rotational velocity of BD +53◦2790 tobe 315 ± 70 km s−1.
Comparison of the helium profiles with those rotationallybroadened from 10 Lac shows that the observed helium pro-files in BD +53◦2790 are stronger than what is expected for anormal O9.5V star. The strength of the He lines suggests thepossibility that BD +53◦2790 may be related to the He-strongstars. These are a small group of stars, with spectral types clus-tering around B2 V, that show anomalously strong helium lines.A well known O-type star believed to be related to He-strongstars is θ1 Ori C, which is known to vary in spectral typefrom O6 to O7 (Donati et al. 2002; Smith & Fullerton 2005).BD +53◦2790 could be the second representative of this classof objects among O-type stars. He-strong stars display a re-markable set of peculiarities: oblique dipolar magnetic fields,magnetically controlled winds, and chemical surface anoma-lies, among others. Usually these stars are distributed along theZAMS (Pedersen & Thomsen 1997; Walborn 1982; Bohlenderet al. 1987; Smith & Groote 2001).
A rich variety of phenomena have been observed in theseobjects: in the UV, they can show red shifted emission of theC iv and Si iv resonance lines (sometimes variable); in theoptical bands they are characterized by periodically modu-lated Hα emission, high level Balmer lines appearing at cer-tain rotational phases and periodically modulated variability inHe lines, sometimes showing emission at He ii λ4686 Å. They
1104 P. Blay et al.: Multiwavelength monitoring of BD +53◦2790, the optical counterpart to 4U 2206+54
HeI 4026 HeI 4144
HeI 4388 HeI 4471
Fig. 12. Normalised profiles of selected He i lines (namely, He i λ4026, λ4144, λ4388, and λ4471 Å) from BD +53◦2790 together with thoseof the same lines from 10 Lac but artificially broadened to 200 km s−1 and to those rotational velocities yielding upper and lower envelopes tothe with of the BD +53◦2790 lines (their values are shown at the peak of the profile, in units of km s−1). In all cases rotational velocities above200 km s−1 are needed to reproduce the line widths.
Table 4. Summary of the measured rotational velocities for the se-lected helium lines shown in Fig. 12.
Line Rot. Vel. Average
(Å) (km s−1) (km s−1)
He iλ4026280
320± 40360
He iλ4144320
350± 30380
He iλ4388260
290± 30320
He iλ4471260
300± 40340
can also show photometric variability with eclipse-like lightcurves.
Except for the periodic modulation of the variations,BD +53◦2790 shares many of these peculiarities. In par-ticular, together with the apparent high helium abun-dance, BD +53◦2790 shows variable Hα emission andHe ii λ4686 Å emission, the UV spectrum shows apparentlyprominent P-Cygni profiles at C iv and Si iv resonance lines(see NR01). In contrast a wind slower than expected is found(see Ribó et al. 2006), which can be an indication of some red-shifted excess of emission in these lines. In He-strong stars thewind is conducted along the magnetic field lines into a torus-like envelope located at the magnetic equator. This configura-
tion can lead to the presence of double emission peaks in Hα,which resemble those seen in BD +53◦2790, but which usuallyshow a modulation on the rotational period. The complexityand shape of the double peak will depend on the angle betweenmagnetic and rotational axes and the line of sight to the ob-server (see Townsend et al. 2005).
A rotationally dominated circumstellar envelope is clearlypresent in BD +53◦2790, as indicated by the infrared magni-tudes, the emission in Balmer and some helium lines and thecorrelations between Hα line parameters. However the struc-ture of this circumstelar envelope clearly differs from thoseseen in Be stars. Following the analogy with He-strong stars,the existence of a circumstellar disk-like structure is also com-mon to this type of objects. The only difficulty to acceptBD+53◦2790 as a He-strong star is the apparent lack of ro-tational modulation of the emission lines parameters. Giventhe rotational velocities derived, we could expect a rotationalperiod of a few days. In addition to the problems in the di-verse origin of our data (see Sect. 3.1), the sampling on timeof our measurements is not adequate to find variations on timescales of a few days (modulated with the rotational period),thus we cannot discard yet the presence of rotational period-icity. The idea of a magnetically driven wind contributing to adense disk-like structure is not strange even in the modelling ofBe stars’ circumstellar envelopes. The wind compressed diskof Bjorkman & Cassinelli (1992) was shown to be compatiblewith observations only if a magnetic field on the order of tensof Gauss was driving the wind from the polar caps onto theequatorial zone (Porter 1997).
P. Blay et al.: Multiwavelength monitoring of BD +53◦2790, the optical counterpart to 4U 2206+54 1105
A careful inspection to the correlation seen in Fig. 4between the He i λ 6678 and Hα EWs shows that there is acommon component to the emission of both lines. Hα emis-sion, then, will have at least two contributions: a P-Cygni likecontribution (as seen in the 1992 spectra, see Fig. 2, where thedouble peak structure disappears and only the red peak sur-vives) and an additional variable double peaked structure. Therelative variation of both components may hide any periodicmodulation present.
Therefore, we can conclude that this is a very peculiarO9.5V star where most likely a global strong magnetic fieldmay be responsible for most of the behaviour seen so far.
6. Conclusion
We have presented the results of∼14 years of spectroscopic andoptical/infrared photometric monitoring of BD +53◦2790, theoptical component of the Be/X-ray binary 4U 2206+54. Theabsence of any obvious long-term trends in the evolution ofdifferent parameters and fundamentally the absence of correla-tion between the EW of Hα and the infrared magnitudes andassociated colours makes untenable a Be classification for thestar. Based on a careful inspection to the source spectrum in theclassification region and the peculiar behavior of the Hα emis-son line, we conclude that the object is likely to be a singlepeculiar O-type star (O9.5Vp) and an early-type analogue toHe-strong stars.
Acknowledgements. We would like to thank the UK PATT and theSpanish CAT panel for supporting our long-term monitoring cam-paign. We are grateful to the INT service programme for additionaloptical observations. The 1.5-m TCS is operated by the Institutode Astrofísica de Canarias at the Teide Observatory, Tenerife. TheJKT and INT are operated on the island of La Palma by the RoyalGreenwich Observatory in the Spanish Observatorio del Roque deLos Muchachos of the Instituto de Astrofísica de Canarias. The1.5-m telescope at Mount Palomar is jointly owned by the CaliforniaInstitute of Technology and the Carnegie Institute of Washington.The G. D. Cassini telescope is operated at the Loiano Observatoryby the Osservatorio Astronomico di Bologna. Skinakas Observatoryis a collaborative project of the University of Crete, the Foundationfor Research and Technology-Hellas and the Max-Planck-Institut fürExtraterrestrische Physik.
This research has made use of the Simbad database, operated at CDS,Strasbourg (France), and of the La Palma Data Archive. Special thanksto Dr. Eduard Zuiderwijk for his help with the archival data.
We are very grateful to the many astronomers who have taken part inobservations for this campaign. In particular, Chris Everall obtainedand reduced the K-band spectroscopy and Miguel Ángel Alcaide re-duced most of the Hα spectra.
P.B. acknowledges support by the Spanish Ministerio de Educación yCiencia through grant ESP-2002-04124-C03-02. I.N. is a researcherof the programme Ramón y Cajal, funded by the Spanish Ministeriode Educación y Ciencia and the University of Alicante, with partialsupport from the Generalitat Valenciana and the European RegionalDevelopment Fund (ERDF/FEDER). This research is partially sup-ported by the Spanish MEC through grants AYA2002-00814 andESP-2002-04124-C03-03.
References
Andrillat, Y., Jaschek, M., & Jaschek, C. 1988, A&AS, 72, 129Andrillat, Y., Jaschek, M., & Jaschek, C. 1995, A&AS, 112, 475Balona, L., & Crampton, D. 1974, MNRAS, 166, 203Bjorkman, J. E., & Cassinelli, J. E. 1992, in Nonisotropic and Variable
Outflows from Stars, San Francisco, ASP Conf. Ser., 22, 88Blay, P., Ribó, M., Negueruela, I., et al. 2005, A&A, 438, 963Bohlender, D. A., Brown, D. N., Landstreet, J. D., & Thompson, I. B.
1987, ApJ, 323, 325Buscombe, W. 1969, MNRAS, 143, 1Clark, J. S., Lyuty, V. M., Zaitseva, G. V., et al. 1999, MNRAS, 302,
167Clark, J. S., Reig, P., Goodwin, S. P., et al. 2001a, A&A, 376, 476Clark, J. S., Tarasov, A. E., Okazaki, A. T., et al. 2001b, A&A, 380, 615Conti, P. S., & Alschuler, W. R. 1971, ApJ, 170, 325Corbet, R. H. D., & Peele, A. G. 2001, ApJ, 562, 936Dachs, J., & Wamsteker, W. 1982, A&A, 107, 240Dachs, J., Hanuschik, R., Kaiser, D., & Rohe, D. 1986, A&A, 159,
276Donati, J. F., Babel, J., Harries, T. J., et al. 2002, MNRAS, 333, 55Everall, C. 1995, Ph.D. Thesis, University of SouthamptonEverall, C., Coe, M. J., Norton, A. J., et al. 1993, MNRAS, 262, 57Giacconi, R., Murray, S., Gursky, H., et al. 1972, ApJ, 178, 281Halbedel, E. M. 1993, PASP, 105, 465Hanuschik, R. W., Kozok, J. R., & Kaiser, D. 1988, A&A, 189, 147Herbig, G. H. 1975, ApJ, 196, 129Howarth, I., Murray, J., Mills, D., & Berry, D. S. 1997, Starlink User
Note 50.20, R.A.L.Landolt, A. U. 1992, AJ, 104, 340Lee, U., Saio, H., & Osaki, Y. 1991, MNRAS, 250, 432Manfroid, J. 1993, A&A, 271, 714Martins, F., Schaerer, D., & Hillier, D. J. 2005, A&A, 436, 1049Masetti, N., Dal Fiume, D., Amati, L., et al. 2004, A&A, 423, 311Mathys, G. 1988, A&AS, 76, 427McSwain, M. V., & Gies, D. R. 2002, ApJ, 568, L27Negueruela, I., Okazaki, A. T., Fabregat, J., et al. 2001, A&A, 369,
117Negueruela, I., & Reig, P. 2001, A&A, 371, 1056Okazaki, A. T. 2000a, in IAU Coll. 175, The Be Phenomenon in
Early-Type Stars, ed. M. Smith, H. F. Henrichs, & J. Fabregat,San Francisco, ASP Conf. Ser., 214, 409
Pedersen, H., & Thomsen, B. 1977, A&AS, 30, 11Perry, C. L., Olsen, D. H., & Crawford, D. J. 1987, PASP, 99, 1184Popper, D. M. 1980, ARA&A, 18, 115Porter, J. M. 1997, A&A, 324, 597Porter, J. M. 1999, A&A, 348, 512Reig, P., Negueruela, I., Coe, M. J., et al. 2000, MNRAS, 317, 205Reig, P., Ribó, M., Paredes, J. M., & Martí, J. 2003, A&A, 405, 285Ribó, M., Reig, P., Martí, J., & Paredes, J. M. 1999, A&A, 347, 518Ribó, M., Negueruela, I., Blay, P., et al. 2006, A&A, in press
[arXiv:astro-ph/0511408]Saraswat, P., & Apparao, K. M. V. 1992, ApJ, 401, 678Shobbrook, R. R. 1983, MNRAS, 205, 1215Shortridge, K., Meyerdicks, H., Currie, M., et al. 1997, Starlink User
Note 86.15, R.A.L.Smith, M. A., & Fullerton, A. W. 2005, PASP, 117, 13Smith, M. A., & Groote, D. 2001, A&A, 372, 208Steiner, J. E., Ferrara, A., Garcia, M., et al. 1984, ApJ, 280, 688Torrejón, J. M., Kreykenbohm, I., Orr, A., Titarchuk, L., &
Negueruela, I. 2004, A&A, 423, 301Townsend, R. H. D., & Owocki, S. P. 2005, MNRAS, 357, 251Walborn, N. R. 1982, PASP, 94, 322Warwick, R. S., Marshall, N., Fraser, G. W., et al. 1981 MNRAS, 197,
865Zuiderwijk, E. J., Martin, R., Raimond, E., & van Diepen, G. N. J.
1994, PASP, 106, 515

P. Blay et al.: Multiwavelength monitoring of BD +53◦2790, the optical counterpart to 4U 2206+54, Online Material p 1
Online Material
P. Blay et al.: Multiwavelength monitoring of BD +53◦2790, the optical counterpart to 4U 2206+54, Online Material p 2
Table 3. Log of spectroscopic observations during 2000.
Date Tel Configuration Detector λ Range (Å)
Jul. 17, 2000 SKI grating 1302 l/mm blazed at 5500 Å SITe 5520–7560
Jul. 18, 2000 SKI grating 1302 l/mm blazed at 5500 Å SITe 5520–7560
Jul. 19, 2000 SKI grating 1302 l/mm blazed at 5500 Å SITe 5520–7560
Jul. 20, 2000 SKI grating 1302 l/mm blazed at 5500 Å SITe 5520–7560
Jul. 21, 2000 SKI grating 1302 l/mm blazed at 4800 Å SITe 3800–5700
Jul. 22, 2000 SKI grating 1302 l/mm blazed at 4800 Å SITe 3800–5700
Jul. 25, 2000 BOL BFOSC + gr#6 EEV 3100–5300
Jul. 25, 2000 BOL BFOSC + gr#7 EEV 4200–6700
Jul. 25, 2000 BOL BFOSC + gr#8 EEV 6100–8200
Jul. 26, 2000 BOL BFOSC + gr#6 EEV 3100–5300
Jul. 26, 2000 BOL BFOSC + gr#7 EEV 4200–6700
Jul. 26, 2000 BOL BFOSC + gr#8 EEV 6100–8200
Jul. 27, 2000 BOL BFOSC + gr#6 EEV 3100–5300
Jul. 27, 2000 BOL BFOSC + gr#7 EEV 4200–6700
Jul. 27, 2000 BOL BFOSC + gr#8 EEV 6100–8200
Jul. 28, 2000 BOL BFOSC + gr#6 EEV 3100–5300
Jul. 28, 2000 BOL BFOSC + gr#7 EEV 4200–6700
Jul. 28, 2000 BOL BFOSC + gr#8 EEV 6100–8200
Jul. 29, 2000 BOL BFOSC + gr#6 EEV 3100–5300
Jul. 29, 2000 BOL BFOSC + gr#8 EEV 6100–8200
Jul. 29, 2000 BOL BFOSC + gr#9+#10 EEV 3750–8000
Jul. 30, 2000 BOL BFOSC + gr#8 EEV 6100–8200
Jul. 30, 2000 BOL BFOSC + gr#9+#10 EEV 3750–8000
Oct. 05, 2000 SKI grating 1302 l/mm blazed at 5500 Å SITe 5520–7560
Oct. 16, 2000 SKI grating 1302 l/mm blazed at 5500 Å SITe 5520–7560
Oct. 17, 2000 SKI grating 1302 l/mm blazed at 4800 Å SITe 3800–5700
P. Blay et al.: Multiwavelength monitoring of BD +53◦2790, the optical counterpart to 4U 2206+54, Online Material p 3
Table 5. Log of spectroscopic observations. Some representative spectra are displayed in Fig. 2 (marked with *).
Date Tel Configuration Detector λ Range EW of Hα(Å) (Å)
May 28, 1986(*) INT IDS + 500 mm GEC1 6450−6830 −5.87 ± 0.17Jul. 26, 1986(*) INT IDS + 500 mm GEC1 6495−6695 −3.40 ± 0.20Aug. 03, 1986 INT IDS + 235 mm IPCS 6010−7020 −5.20 ± 1.50Aug. 04, 1986 INT IDS + 235 mm IPCS 6010−7020 −6.00 ± 0.90Sep. 07, 1986 INT IDS + 235 mm GEC1 4000−8000Oct. 09, 1986(*) INT IDS + 500 mm GEC1 6465−6665 −7.30 ± 0.40Dec. 24, 1986(*) INT IDS + 500 mm GEC1 6250−6875 −1.30 ± 0.11Jun. 12, 1987 INT IDS + 235 mm GEC1 6330−6770 −1.62 ± 0.18Jun. 20, 1987 INT IDS + 235 mm GEC1 6080−6900 −1.47 ± 0.21Aug. 13, 1987(*) INT IDS + 500 mm GEC1 6375−6765 −2.10 ± 0.21Aug. 28, 1987 INT IDS + 235 mm GEC1 6340−6770 −2.19 ± 0.22Sep. 08, 1987 INT IDS + 500 mm GEC1 6340−6730 −2.01 ± 0.12May 19, 1988 INT IDS + 500 mm IPCS 6240−6720 −1.31 ± 0.19Aug. 02, 1988(*) INT IDS + 235 mm GEC4 6230−6860 −2.90 ± 0.40Sep. 26, 1988 INT IDS + 500 mm GEC4 6455−6655 −1.49 ± 0.25Oct. 12, 1988 INT IDS + 500 mm GEC4 6325−6950 −0.96 ± 0.17Jun. 02, 1989 INT IDS + 235 mm IPCS 6230−6875 −1.80 ± 0.40Jun. 11, 1989 INT IDS + 235 mm IPCS 5970−7010 −2.10 ± 0.60Jul. 31, 1989(*) INT IDS + 235 mm IPCS 6205−6870 −1.54 ± 0.30Jul. 24, 1990 INT IDS + 235 mm GEC6 6350−6780 −2.83 ± 0.26Sep. 02, 1990 INT IDS + 235 mm GEC6 6345−6775 −2.55 ± 0.38Dec. 27, 1990 INT IDS + 500 mm GEC6 6470−6670 −3.20 ± 0.30Aug. 28, 1991(*) INT IDS + 500 mm GEC6 6480−6680 −1.12 ± 0.18May 18, 1992(*) PAL f/8.75 Cass CCD9 6255−6938 +1.38 ± 0.13May 19, 1992 PAL f/8.75 Cass CCD9 6522−6663 +0.13 ± 0.05Aug. 16, 1992(*) PAL f/8.75 Cass CCD9 6255−6930 −2.30 ± 0.40Aug. 17, 1992 PAL f/8.75 Cass CCD9 6255−6930 −2.14 ± 0.30Aug. 18, 1992 PAL f/8.75 Cass CCD9 6255−6930 −2.23 ± 0.30Sep. 23, 1993(*) PAL f/8.75 Cass CCD9 6280−6960 −1.78 ± 0.30Dec. 05, 1993 PAL f/8.75 Cass CCD9 6259−6936 −1.64 ± 0.19Dec. 06, 1993 PAL f/8.75 Cass CCD9 4300−5000Dec. 07, 1993 PAL f/8.75 Cass CCD9 6260−6940 −1.69 ± 0.15Mar. 26, 1994 JKT RBS EEV7 5700−6710 −0.88 ± 0.18Mar. 27, 1994 JKT RBS EEV7 5700−6710 −0.87 ± 0.15Jun. 25, 1994 JKT RBS EEV7 4200−5200Jun. 26, 1994 JKT RBS EEV7 6070−7040 −1.19 ± 0.21Jun. 27, 1994 JKT RBS EEV7 4200−5200Sep. 16, 1994(*) JKT RBS EEV7 5825−6890 −2.28 ± 0.24Sep. 16, 1994 JKT RBS EEV7 8100−9100Sep. 17, 1994 JKT RBS EEV7 3900−4950Jul. 11, 1995 INT IDS + 235 mm TEK3 4080−4940Jul. 12, 1995(*) INT IDS + 235 mm TEK3 6430−7286 −2.00 ± 0.30Aug. 04, 1995 JKT RBS TEK4 6360−7265 −2.20 ± 0.40Aug. 04, 1995 JKT RBS TEK4 8200−9000Aug. 05, 1995 JKT RBS TEK4 4100−5050Aug. 06, 1995 JKT RBS TEK4 6420−6755 −1.51 ± 0.25Aug. 07, 1995 JKT RBS TEK4 4000−4450Sep. 22, 1995 CRAO Coude EEV15−11 4400−4950Nov. 29, 1995 JKT RBS TEK4 6100−6900 −2.30 ± 0.40Jun. 30, 1997 CRAO Coude EEV15−11 4200−5100Oct. 26, 1997 JKT RBS TEK4 5904−6818 −1.77 ± 0.32Oct. 27, 1997 JKT RBS TEK4 8200−9000Oct. 28, 1997(*) JKT RBS TEK4 6380−6720 −1.47 ± 0.25Aug. 03, 1998 INT IDS + 235 mm EEV42 3700−5050Aug. 04, 1998(*) INT IDS + 235 mm EEV42 5800−7100 −1.87 ± 0.30Aug. 31, 1998 CRAO Coude EEV15−11 6530−6600 −1.49 ± 0.02Aug. 31, 1998 CRAO Coude EEV15−11 6645−6620Jul. 26, 1999 SKI 1201 line mm−1 grating ISA SITe CCD 5520−7560 −2.89 ± 0.07
P. Blay et al.: Multiwavelength monitoring of BD +53◦2790, the optical counterpart to 4U 2206+54, Online Material p 4
Table 5. continued.
Date Tel Configuration Detector λ Range EW of Hα(Å) (Å)
Aug. 17, 1999(*) BOL BFOSC + gr#9+#12 Loral 5300−9000 −1.35 ± 0.40Aug. 17, 1999 BOL BFOSC + gr#7 Loral 4200−6700Aug. 22, 1999 BOL BFOSC + gr#8 Loral 6100−8200 −1.85 ± 0.10Aug. 22, 1999 BOL BFOSC + gr#7 Loral 4200−6700
P. Blay et al.: Multiwavelength monitoring of BD +53◦2790, the optical counterpart to 4U 2206+54, Online Material p 5
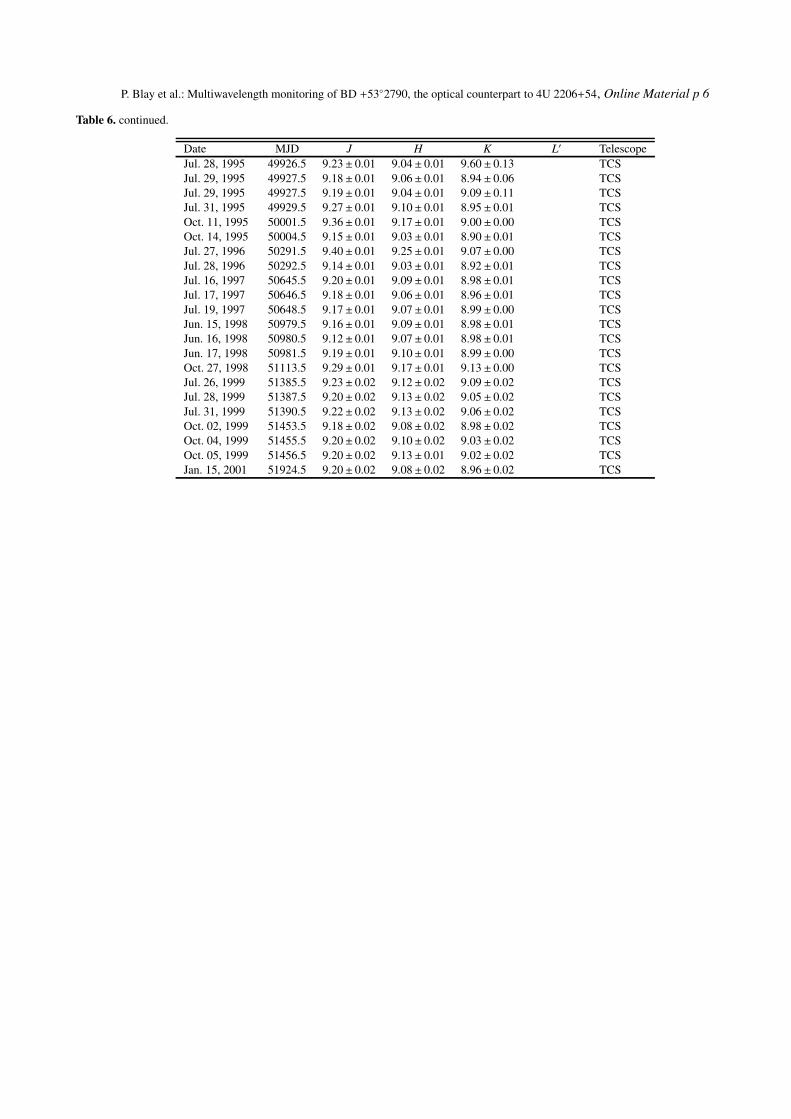
Table 6. Observational details, IR photometry.
Date MJD J H K L′ TelescopeSep. 06, 1987 47044.5 9.37± 0.03 9.26± 0.03 9.09± 0.03 9.0± 0.4 TCSSep. 11, 1987 47049.5 9.70± 0.04 9.48± 0.04 9.28± 0.04 TCSNov. 24, 1987 47123.5 9.16± 0.03 9.08± 0.03 8.92± 0.03 8.71± 0.06 UKIRTDec. 28, 1987 47157.5 9.26± 0.03 9.16± 0.03 9.06± 0.03 TCSJan. 01, 1988 47161.5 9.28± 0.04 9.10± 0.04 8.99± 0.04 8.8± 0.4 TCSJan. 03, 1988 47163.5 9.24± 0.03 9.08± 0.03 8.97± 0.03 8.8± 0.3 TCSJun. 23, 1988 47335.5 9.28± 0.04 9.17± 0.04 9.01± 0.04 TCSJun. 24, 1988 47336.5 9.25± 0.03 9.15± 0.03 8.98± 0.03 TCSJun. 28, 1988 47340.5 9.16± 0.04 9.11± 0.04 9.00± 0.04 TCSApr. 14, 1991 48360.5 9.25± 0.02 9.12± 0.03 9.05± 0.02 TCSApr. 17, 1991 48363.5 9.26± 0.06 9.12± 0.03 9.03± 0.02 TCSAug. 23, 1991 48491.5 9.22± 0.03 9.08± 0.02 9.01± 0.02 TCSAug. 24, 1991 48492.5 9.16± 0.09 9.04± 0.05 9.00± 0.05 TCSAug. 25, 1991 48493.5 9.18± 0.04 9.05± 0.03 8.95± 0.03 TCSAug. 27, 1991 48495.5 9.17± 0.03 9.06± 0.02 9.00± 0.03 TCSAug. 28, 1991 48496.5 9.19± 0.04 9.05± 0.03 8.98± 0.05 TCSNov. 29, 1991 48589.5 9.30± 0.10 9.10± 0.10 9.00± 0.10 TCSDec. 01, 1991 48591.5 9.24± 0.05 9.08± 0.04 9.01± 0.04 TCSJul. 20, 1992 48823.5 9.22± 0.03 9.11± 0.03 8.98± 0.05 TCSAug. 04, 1992 48838.5 9.33± 0.09 9.09± 0.04 8.93± 0.05 TCSAug. 21, 1992 48855.5 9.29± 0.04 9.07± 0.03 9.03± 0.06 TCSAug. 21, 1992 48855.5 9.25± 0.05 9.07± 0.03 8.94± 0.06 TCSAug. 22, 1992 48856.5 9.14± 0.06 9.04± 0.04 9.07± 0.04 TCSAug. 23, 1992 48857.5 9.29± 0.07 9.16± 0.09 9.11± 0.06 TCSJan. 12, 1993 48999.5 9.20± 0.03 9.07± 0.01 8.98± 0.02 TCSJun. 22, 1993 49160.5 9.23± 0.01 9.17± 0.01 9.09± 0.01 8.91± 0.03 UKIRTJun. 30, 1993 49169.5 9.27± 0.03 9.14± 0.02 9.02± 0.02 8.9± 0.3 UKIRTJu.l 06, 1993 49175.5 9.26± 0.02 9.14± 0.03 9.03± 0.02 8.9± 0.2 UKIRTJul. 07, 1993 49176.5 9.26± 0.03 9.15± 0.02 9.05± 0.03 UKIRTDec. 20, 1993 49341.5 9.11± 0.01 9.11± 0.01 8.95± 0.02 TCSDec. 20, 1993 49341.5 9.11± 0.01 9.08± 0.01 8.93± 0.01 TCSDec. 20, 1993 49341.5 9.18± 0.03 9.06± 0.01 8.99± 0.06 TCSDec. 21, 1993 49342.5 9.26± 0.02 9.18± 0.01 9.09± 0.03 TCSDec. 21, 1993 49342.5 9.27± 0.03 9.13± 0.01 9.13± 0.01 TCSJun. 08, 1994 49511.5 9.16± 0.02 9.16± 0.01 9.01± 0.01 TCSJun. 09, 1994 49512.5 9.28± 0.01 9.13± 0.02 9.06± 0.03 TCSJun. 10, 1994 49513.5 9.16± 0.03 9.07± 0.01 9.04± 0.03 TCSJun. 11, 1994 49514.5 9.24± 0.06 9.28± 0.04 9.17± 0.05 TCSJun. 21, 1994 49524.5 9.22± 0.01 9.12± 0.01 9.03± 0.01 TCSJun. 26, 1994 49529.5 9.22± 0.02 9.14± 0.01 9.06± 0.03 TCSJun. 28, 1994 49531.5 9.22± 0.01 9.15± 0.01 9.03± 0.01 TCSJun. 30, 1994 49533.5 9.24± 0.01 9.09± 0.02 9.08± 0.02 TCSJul. 01, 1994 49534.5 9.17± 0.01 9.12± 0.01 8.99± 0.00 TCSJul. 02, 1994 49535.5 9.26± 0.02 9.20± 0.01 9.09± 0.01 TCSJul. 03, 1994 49536.5 9.27± 0.02 9.17± 0.01 9.12± 0.01 TCSNov. 05, 1994 49661.5 9.16± 0.01 9.09± 0.01 9.06± 0.01 TCSNov. 06, 1994 49662.5 9.01± 0.01 8.94± 0.01 8.90± 0.01 TCSNov. 07, 1994 49663.5 9.28± 0.02 9.21± 0.01 9.14± 0.02 TCSNov. 08, 1994 49664.5 9.29± 0.02 9.18± 0.01 9.08± 0.00 TCSNov. 09, 1994 49665.5 9.21± 0.01 9.11± 0.01 9.08± 0.01 TCSJan. 02, 1995 49719.5 9.23± 0.01 9.15± 0.01 9.03± 0.01 TCSJan. 03, 1995 49720.5 9.12± 0.01 9.07± 0.01 9.00± 0.01 TCSJan. 05, 1995 49722.5 9.14± 0.02 9.09± 0.01 8.99± 0.01 TCSApr. 24, 1995 49831.5 9.16± 0.01 9.07± 0.01 9.02± 0.02 TCSApr. 25, 1995 49832.5 9.21± 0.01 9.12± 0.01 9.07± 0.00 TCSApr. 26, 1995 49833.5 9.25± 0.01 9.13± 0.01 9.03± 0.01 TCSApr. 28, 1995 49835.5 9.23± 0.01 9.14± 0.01 9.05± 0.01 TCSApr. 29, 1995 49836.5 9.20± 0.01 9.08± 0.01 9.04± 0.01 TCSJul. 28, 1995 49926.5 9.22± 0.02 9.12± 0.01 9.09± 0.15 TCS
P. Blay et al.: Multiwavelength monitoring of BD +53◦2790, the optical counterpart to 4U 2206+54, Online Material p 6
Table 6. continued.
Date MJD J H K L′ TelescopeJul. 28, 1995 49926.5 9.23± 0.01 9.04± 0.01 9.60± 0.13 TCSJul. 29, 1995 49927.5 9.18± 0.01 9.06± 0.01 8.94± 0.06 TCSJul. 29, 1995 49927.5 9.19± 0.01 9.04± 0.01 9.09± 0.11 TCSJul. 31, 1995 49929.5 9.27± 0.01 9.10± 0.01 8.95± 0.01 TCSOct. 11, 1995 50001.5 9.36± 0.01 9.17± 0.01 9.00± 0.00 TCSOct. 14, 1995 50004.5 9.15± 0.01 9.03± 0.01 8.90± 0.01 TCSJul. 27, 1996 50291.5 9.40± 0.01 9.25± 0.01 9.07± 0.00 TCSJul. 28, 1996 50292.5 9.14± 0.01 9.03± 0.01 8.92± 0.01 TCSJul. 16, 1997 50645.5 9.20± 0.01 9.09± 0.01 8.98± 0.01 TCSJul. 17, 1997 50646.5 9.18± 0.01 9.06± 0.01 8.96± 0.01 TCSJul. 19, 1997 50648.5 9.17± 0.01 9.07± 0.01 8.99± 0.00 TCSJun. 15, 1998 50979.5 9.16± 0.01 9.09± 0.01 8.98± 0.01 TCSJun. 16, 1998 50980.5 9.12± 0.01 9.07± 0.01 8.98± 0.01 TCSJun. 17, 1998 50981.5 9.19± 0.01 9.10± 0.01 8.99± 0.00 TCSOct. 27, 1998 51113.5 9.29± 0.01 9.17± 0.01 9.13± 0.00 TCSJul. 26, 1999 51385.5 9.23± 0.02 9.12± 0.02 9.09± 0.02 TCSJul. 28, 1999 51387.5 9.20± 0.02 9.13± 0.02 9.05± 0.02 TCSJul. 31, 1999 51390.5 9.22± 0.02 9.13± 0.02 9.06± 0.02 TCSOct. 02, 1999 51453.5 9.18± 0.02 9.08± 0.02 8.98± 0.02 TCSOct. 04, 1999 51455.5 9.20± 0.02 9.10± 0.02 9.03± 0.02 TCSOct. 05, 1999 51456.5 9.20± 0.02 9.13± 0.01 9.02± 0.02 TCSJan. 15, 2001 51924.5 9.20± 0.02 9.08± 0.02 8.96± 0.02 TCS