Embed Size (px)
Citation preview
Multivariate Stochastic Approximation to Tune Neural Network Hyperparameters for Criticial Infrastructure Communication Device
Identification
Trevor J. Bihl Air Force Research Laboratory
Daniel W. Steeneck Air Force Institute of Technology
Abstract The e-government includes Wireless Personal Area
Network (WPAN) enabled internet-to-government pathways. Of interest herein is Z-Wave, an insecure, low-power/cost WPAN technology increasingly used in critical infrastructure. Radio Frequency (RF) Fingerprinting can augment WPAN security by a biometric-like process that computes statistical features from signal responses to 1) develop an authorized device library, 2) develop classifier models and 3) vet claimed identities. For classification, the neural network-based Generalized Relevance Learning Vector Quantization-Improved (GRLVQI) classifier is employed. GRLVQI has shown high fidelity in classifying Z-Wave RF Fingerprints; however, GRLVQI has multiple hyperparameters. Prior work optimized GRLVQI via a full factorial experimental design. Herein, optimizing GRLVQI via stochastic approximation, which operates by iterative searching for optimality, is of interest to provide an unconstrained optimization approach to avoid limitations found in full factorial experimental designs. The results provide an improvement in GRLVQI operation and accuracy. The methodology is further generalizable to other problems and algorithms.
1. Introduction
The e-government provides for the efficient
information dissemination via electronic means and the necessary information and communication technologies (ICTs) for information dissemination within and around the government [1]. Due to the sensitivity of information, securing e-government networks is a primary concern [2]. However, adequately securing e-government networks, servers, firewalls and content is an issue with known deficiencies [2].
Wireless Personal Area Network (WPAN) devices are commonly low-cost and low-power devices which enable mesh networks comprised of smart internet of things (IoT) devices [3]. Z-Wave devices are among
the IoT enabling WPAN devices which support e-government [4]. Increasingly, such devices are found in e-government and Critical Infrastructure (CI) applications such as hospital [5] and electrical smart grid [6].
Security issues exist with Z-Wave, and other WPAN devices, due to 1) government-to-internet pathways, 2) the tendency for e-government connections to Critical Infrastructure (CI) control technologies, e.g. [7], and 3) since one compromised device can threaten the security of the entire network [8]. These issues are compounded by inherent vulnerabilities in WPAN technologies, see [9] [10]. For these reasons, enabling robust security by improving the ability to determine Z-Wave device identities, e.g. after they have claimed a bit-level identify (such as MAC address), is of interest.
To vet the identity of Z-Wave WPAN devices, the standard three step process (library building, classifier model development, and verification), as used in biometrics [11], is followed. However, to characterize communication devices, one logically compares predefined signal characteristics, such as preambles, between devices operating on the same standard. For this purpose, Radio Frequency (RF) fingerprinting is used whereby the communication signal of interest is examined, divided into bins, and statistical features are computed for each bin [12].
To discriminate between devices using RF fingerprint features, machine learning (ML) methods are employed. Two ML methods have generally been employed: Multiple Discriminant Analysis (MDA) and the Generalized Relevance Learning Vector Quantization-Improved (GRLVQI) classifier. MDA is a linear ML algorithm whereas GRLVQI is a nonlinear Artificial Neural Network (ANN) algorithm. Generally, for Z-Wave, GRLVQI outperforms MDA in classification accuracy [13]. However, GRLVQI has multiple algorithmic settings, called hyperparameters, which influence the way in which the classifier is trained. Little has been published in GRLVQI, or ANN, literature on these hyperparameters beyond
Proceedings of the 51st Hawaii International Conference on System Sciences | 2018
URI: http://hdl.handle.net/10125/50167ISBN: 978-0-9981331-1-9(CC BY-NC-ND 4.0)
Page 2225
vague guidelines for very specific applications [14] [15].
Prior work, c.f. [13], examined full factorial GRLVQI algorithm optimization relative to Z-Wave device identification for its five hyperparameters. However, the results and approach of [13] were not ideal since they: 1) were highly tailored to the example Z-Wave dataset and thus possibly not applicable to other WPAN device signals, 2) involved exploring only a small region of the design space and utilized subject matter expertise to find appropriate high (+) and low (–) settings, and 3) involved only a single replication and thus ignored the randomness existing in any ANN algorithm, including GRLVQI, result.
Efficiently determining optimal hyperparameters is thus of interest. More efficient alternatives to the approach of [13] include 1) considering an alternative experimental designs, e.g. [16] [17], and 2) stochastic estimation, e.g. [18]. Although various experimental design approaches have been used to find optimal hyperparameter settings, see [19], these do not avoid the limitations in specifying the high and low settings to examine. Stochastic approximation begins with initial hyperparameter settings and proceeds to search throughout the space to find optimal settings. Thus stochastic approximation is of interest since it does not artificially restrict the search space.
This work presents a framework for general algorithm optimization via stochastic approximation for sequential design. In doing so, this extends the initial work of [18] by allowing GRLVQI to find optimal settings in an iterative fashion for its four continuous hyperparameters: gradient descent learning rate (𝜖𝜖), relevance learning rate (𝜉𝜉), conscience rate 1 (𝛾𝛾), and conscience rate 2 (𝛽𝛽). Additionally, the work of [13] is extended by creating a more efficient approach to optimizing GRLVQI settings and by creating a more robust approach to GRLVQI optimization by averaging replication results.
2. WPAN Devices and E-Government Concerns
While much of the ICTs used in e-government applications involve access to information [20], increasingly the e-government includes other communication technologies such as WPAN devices [3] [21] and Supervisory Control and Data Acquisition (SCADA) [22] systems. SCADA systems generally connect to infrastructure, including CI, while WPAN devices serve as a backbone for IoT connectivity where devices ranging from refrigerators to Heating, Ventilation and Air Conditioning (HVAC) [23]. While these systems can be separate, and more secure, e-
government pathways can exist through systems being connected at various points; thus there generally exist a link between these networks and the internet [24] [25]. 2.1. Z-Wave Devices
Z-Wave devices are a wireless communication devices are small, low-cost hardware devices that are advantageous for WPANs because they support many network topologies, is simpler to work with than ZigBee [26]. However, Z-Wave is generally considered as less secure than competing WPAN technologies given 1) originally lacked built in encryption [27] and 2) the proprietary nature of the standard making it difficult for third parties to provide enhancements [28].
Vendors are largely responsible for integrating Z-Wave capabilities into their system. However, to produce a Z-Wave device, vendors must coordinate with Sigma Designs and sign a Non-Disclosure Agreement (NDA) to gain access to the proprietary details of the Z-Wave standard. Once an NDA is in place, hardware and software to develop Z-Wave devices are provide by Sigma Designs [10]. While Sigma Designs will provide examples to vendors who sign an NDA, without a signed NDA specific characteristics of the protocol are unknown [10]. The protocol describes general physical layer (PHY) and medium access layer characteristics, but the routing and application layer specifications are protected by the NDA enforced by Sigma Designs [10]. Thus one is confronted with a digital forensics, c.f. [29] [30], problem in analyzing the Z-Wave standard without an NDA and being bound by its restrictions.
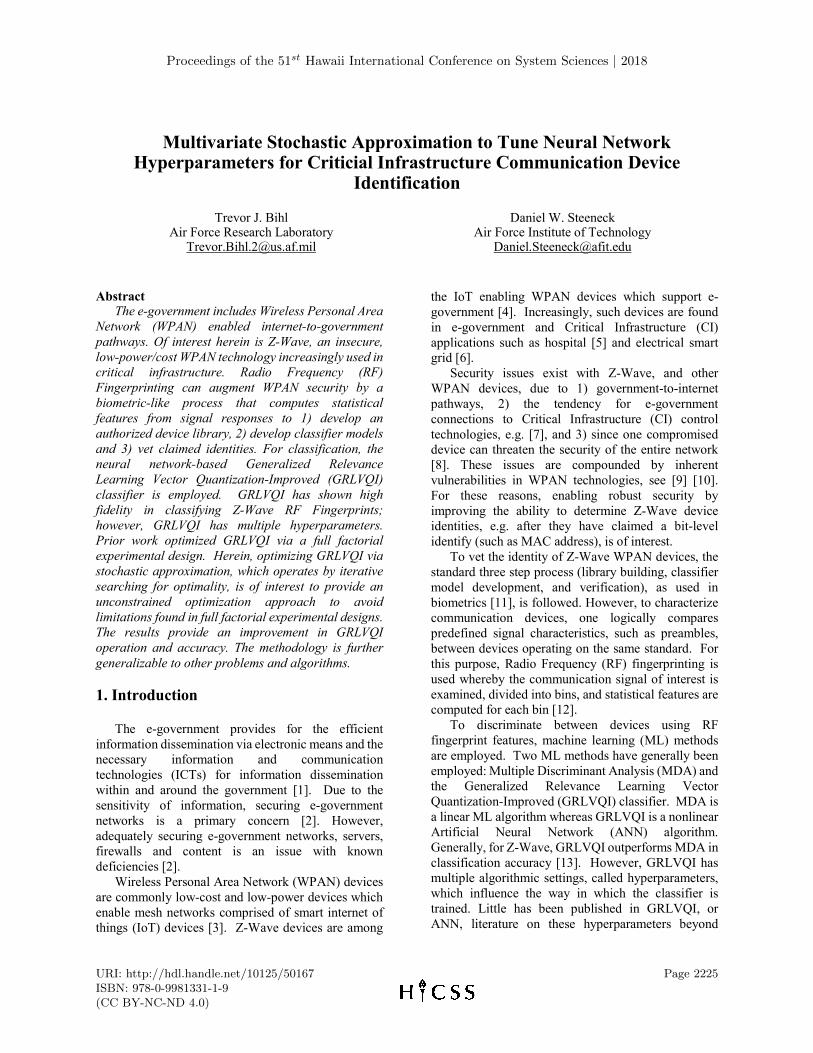
Figure 1. Z-Wave device protocol
characteristics [27] [28] [31]. What is known about Z-Wave is that it follows the
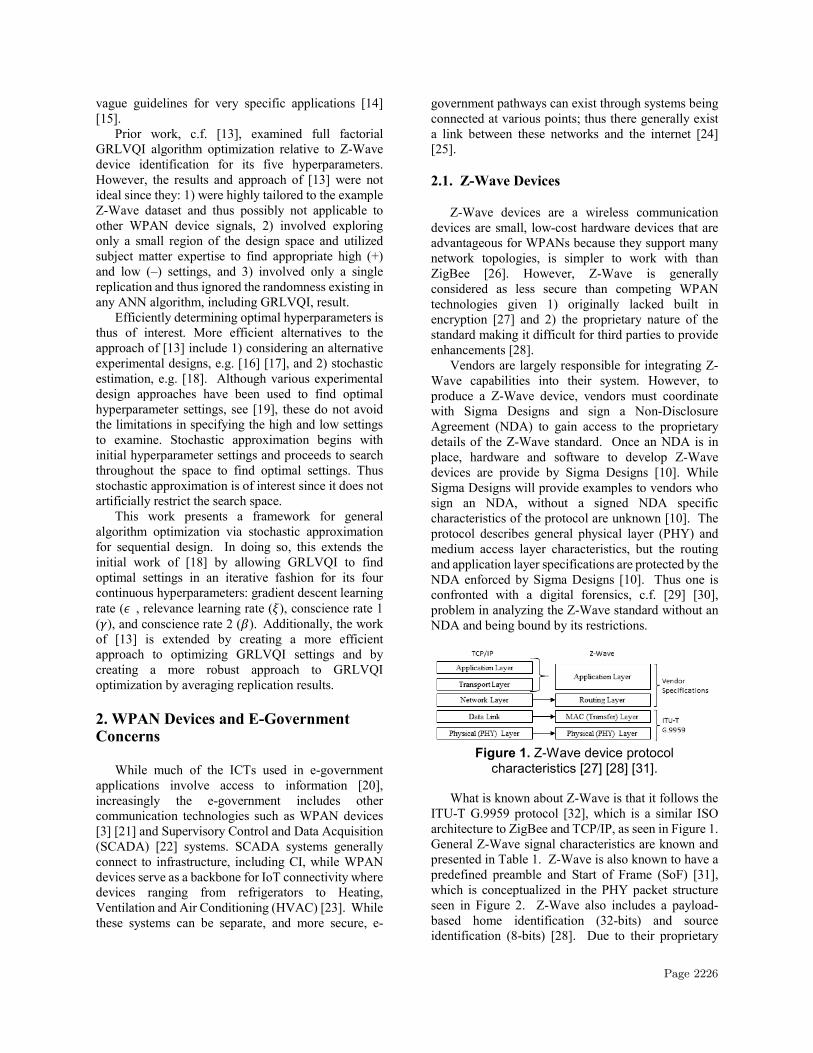
ITU-T G.9959 protocol [32], which is a similar ISO architecture to ZigBee and TCP/IP, as seen in Figure 1. General Z-Wave signal characteristics are known and presented in Table 1. Z-Wave is also known to have a predefined preamble and Start of Frame (SoF) [31], which is conceptualized in the PHY packet structure seen in Figure 2. Z-Wave also includes a payload-based home identification (32-bits) and source identification (8-bits) [28]. Due to their proprietary
Page 2226
nature, further knowledge of Z-Wave signal characteristics is limited and thus digital forensic analysis of Z-Wave devices remains an emerging area of interest [10].
Table 1. General Z-Wave Device Characteristics DEVICE Z-WAVE STANDARD Proprietary FREQUENCY 906 MHz BIT RATE 40 Kbits/s
SECURITY None (200 and 300 series models) AES 128 (400 series models)
LATENCY ~1000 ms RANGE 30 - 100 m MESSAGE SIZE (BYTES) 64 (max) TOPOLOGY Star, cluster, mesh
Figure 2. Z-Wave device signal characteristics
[27] [28] [31]. 3. RF Fingerprinting
RF Fingerprinting, as conceptualized in Figure 3 via the RF-DNA (Distinct Native Attributes) fingerprinting process of [12], is a systematic process of collecting communication signals. RF fingerprinting involves selecting a Region of Interest (ROI) to extract, then digital filtering, computation of the instantaneous amplitude, frequency and phase, fingerprint generation, and finally classifier model development and verification testing [12]. To simulate degraded and distance collections and environmental conditions, independent like-filtered Additive White Gaussian Noise (AWGN) is added to collected signals [12].
When used effectively, RF fingerprinting provides biometric-like security of communication devices whereby unique fingerprint features are computed for a communication signal’s ROI. Fingerprint features of variance, skewness and kurtosis are used for this task [12], which is similar to the use of mathematical moments for identification problems [33]. Standard predefined ROIs, e.g. preambles which have a specified sequence of 1s and 0s, are selected for RF fingerprinting and then RF fingerprint features are computed for this ROI. Due to production variations inherent in integrated circuit manufacturing, minute
differences between devices at a serial number level are resolvable through RF fingerprinting.
3.1 Z-Wave Signal Collection
The work herein considered the Z-Wave dataset used previously in [13] [34]. This dataset considered three devices, ND = 3, which were Aeon Labs’ Aeotec Z-Stick S2 transmitters. As discussed in Section 2.2, characteristics of the preamble response (the first 8.3 ms of Z-Wave bursts) are known for Z-Wave and this was considered as the ROI for RF fingerprinting.
Figure 3. Conceptualization of Z-Wave signal
collection within the RF fingerprinting generation and exploitation process of [12]
Of interest were collecting preamble responses, and
a total of 230 preambles were collected using a signal collection setup that had each Z-Stick transmitter being considered individually. As conceptualized at the top of Figure 3, to ensure laboratory collected signals were low noise, each Z-Stick device was located 10 cm from a vertically-oriented log periodic antenna (LP0410, Ettus Research, Santa Clara, CA), which was connected via a Gigabit Ethernet cable directly to a software defined radio device RF input (USRP-2921, National Instruments) [34].
Page 2227
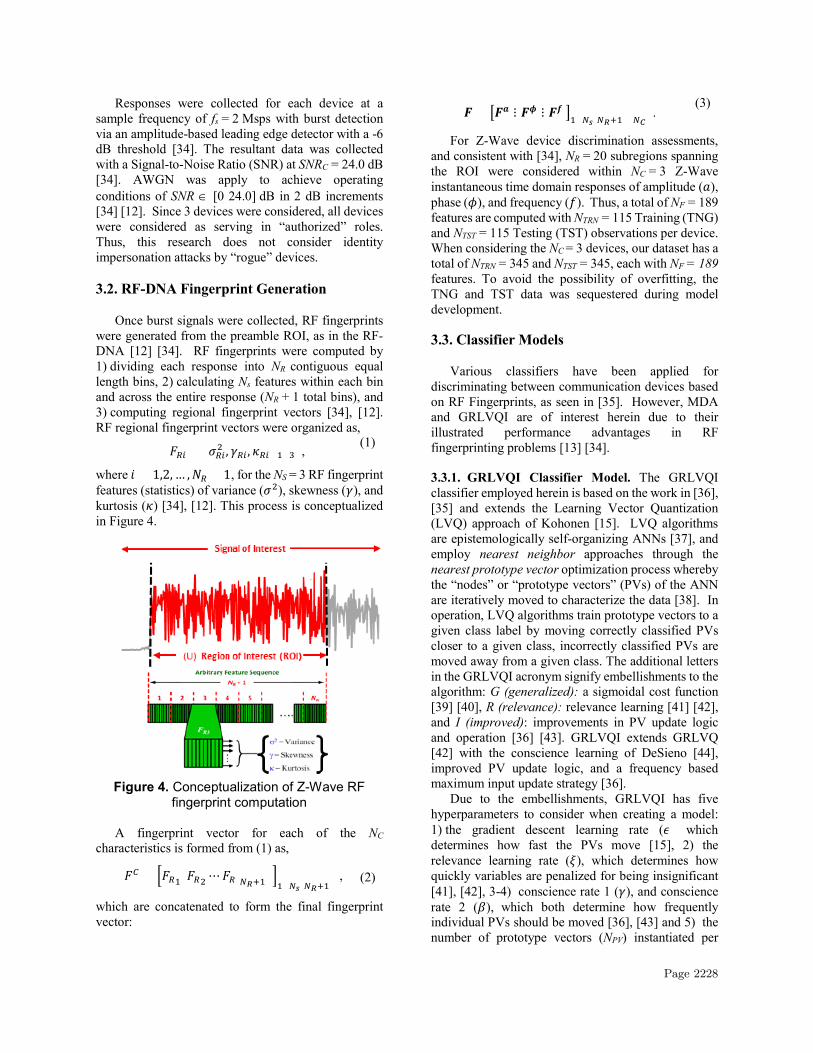
Responses were collected for each device at a sample frequency of fs = 2 Msps with burst detection via an amplitude-based leading edge detector with a -6 dB threshold [34]. The resultant data was collected with a Signal-to-Noise Ratio (SNR) at SNRC = 24.0 dB [34]. AWGN was apply to achieve operating conditions of SNR ∈ [0 24.0] dB in 2 dB increments [34] [12]. Since 3 devices were considered, all devices were considered as serving in “authorized” roles. Thus, this research does not consider identity impersonation attacks by “rogue” devices. 3.2. RF-DNA Fingerprint Generation
Once burst signals were collected, RF fingerprints were generated from the preamble ROI, as in the RF-DNA [12] [34]. RF fingerprints were computed by 1) dividing each response into NR contiguous equal length bins, 2) calculating Ns features within each bin and across the entire response (NR + 1 total bins), and 3) computing regional fingerprint vectors [34], [12]. RF regional fingerprint vectors were organized as,
𝐹𝐹𝑅𝑅𝑅𝑅 = [𝜎𝜎𝑅𝑅𝑅𝑅2 , 𝛾𝛾𝑅𝑅𝑅𝑅 , 𝜅𝜅𝑅𝑅𝑅𝑅 ]1×3 , (1)
where 𝑖𝑖 = 1,2, … ,𝑁𝑁𝑅𝑅 + 1, for the NS = 3 RF fingerprint features (statistics) of variance (𝜎𝜎2), skewness (𝛾𝛾), and kurtosis (𝜅𝜅) [34], [12]. This process is conceptualized in Figure 4.
Figure 4. Conceptualization of Z-Wave RF
fingerprint computation
A fingerprint vector for each of the NC characteristics is formed from (1) as,
𝐹𝐹𝐶𝐶 = �𝐹𝐹𝑅𝑅1 𝐹𝐹𝑅𝑅2 ⋯𝐹𝐹𝑅𝑅(𝑁𝑁𝑅𝑅+1) �1×𝑁𝑁𝑠𝑠(𝑁𝑁𝑅𝑅+1)
, (2)
which are concatenated to form the final fingerprint vector:
𝑭𝑭 = �𝑭𝑭𝒂𝒂 ⋮ 𝑭𝑭𝝓𝝓 ⋮ 𝑭𝑭𝒇𝒇 �1×𝑁𝑁𝑠𝑠(𝑁𝑁𝑅𝑅+1)×𝑁𝑁𝐶𝐶
. (3)
For Z-Wave device discrimination assessments, and consistent with [34], NR = 20 subregions spanning the ROI were considered within NC = 3 Z-Wave instantaneous time domain responses of amplitude (𝑎𝑎), phase (𝜙𝜙), and frequency (𝑓𝑓). Thus, a total of NF = 189 features are computed with NTRN = 115 Training (TNG) and NTST = 115 Testing (TST) observations per device. When considering the NC = 3 devices, our dataset has a total of NTRN = 345 and NTST = 345, each with NF = 189 features. To avoid the possibility of overfitting, the TNG and TST data was sequestered during model development.
3.3. Classifier Models
Various classifiers have been applied for discriminating between communication devices based on RF Fingerprints, as seen in [35]. However, MDA and GRLVQI are of interest herein due to their illustrated performance advantages in RF fingerprinting problems [13] [34].
3.3.1. GRLVQI Classifier Model. The GRLVQI classifier employed herein is based on the work in [36], [35] and extends the Learning Vector Quantization (LVQ) approach of Kohonen [15]. LVQ algorithms are epistemologically self-organizing ANNs [37], and employ nearest neighbor approaches through the nearest prototype vector optimization process whereby the “nodes” or “prototype vectors” (PVs) of the ANN are iteratively moved to characterize the data [38]. In operation, LVQ algorithms train prototype vectors to a given class label by moving correctly classified PVs closer to a given class, incorrectly classified PVs are moved away from a given class. The additional letters in the GRLVQI acronym signify embellishments to the algorithm: G (generalized): a sigmoidal cost function [39] [40], R (relevance): relevance learning [41] [42], and I (improved): improvements in PV update logic and operation [36] [43]. GRLVQI extends GRLVQ [42] with the conscience learning of DeSieno [44], improved PV update logic, and a frequency based maximum input update strategy [36].
Due to the embellishments, GRLVQI has five hyperparameters to consider when creating a model: 1) the gradient descent learning rate (𝜖𝜖) which determines how fast the PVs move [15], 2) the relevance learning rate (𝜉𝜉), which determines how quickly variables are penalized for being insignificant [41], [42], 3-4) conscience rate 1 (𝛾𝛾), and conscience rate 2 (𝛽𝛽), which both determine how frequently individual PVs should be moved [36], [43] and 5) the number of prototype vectors (NPV) instantiated per
Page 2228
class, which balances under and overfitting. Beyond rough heuristics, c.f. [14] [42], no “hard and fast” rules exist to determine GRLVQI parameters [36].
3.3.2. Multiple Discriminant Analysis. MDA is a linear approach to classification which is a multi-class extension of Fisher’s two class linear classifier [35]. MDA considers input fingerprint matrix F and NC classes and involves an eigenvector-based projection of the data relative to a ratio of between-group to within-group sum-of-squares, the Fisher criterion [45]. Since MDA is intuitive, computationally inexpensive and has shown significant performance advantages over GRLVQI for many RF-DNA Fingerprinting problems, e.g. ZigBee [34], it is included to provide a baseline performance reference, consistent with [35]. Additionally, MDA classifier results are not susceptible to random variations due to sampling since this provides a direct projection of the data. 3.4. Quantifying Algorithm Performance
Consistent with [13], both classification and
verification accuracy is considered. Classification accuracy is considered by developing classifier models for each SNR operating point and then evaluating performance for against both the TNG and TST datasets in a traditional confusion matrix approach for “one vs. many” scenarios as in [12]. Verification accuracy is considered in a “one vs one” scenario for a developed classifier model whereby a communication device claims an identity, authorized or rogue/unauthorized, and the communication device’s signal is evaluated using the classifier model and the associated probability mass function [46].
3.4.1. Classification Accuracy. Classification performance is evaluated by examining a plot of average percent correct classification (%C) versus SNR [13]. Consistent with [13], both a gain measure and an area under the classification curve approach can be used. Here, gain is defined as the reduction in required SNR, expressed in dB, for two methods to achieve the same %C, generally an arbitrary performance benchmark of %C = 90% accuracy [13] [47]. However, gain only considers one part of the %C vs. SNR curve; the Relative Accuracy Percentage (RAP) was introduced in [13] to provide for classifier assessment over the entire curve by 1) computing the Area Under Classification Curve (AUCC) values for each method via a trapezoidal approximation, and 2) computing the RAP of a given method’s AUCC relative to the baseline AUCCBase method. As discussed in [13], gain values, GSNR, are interpretted as
1) GSNR < 0.0 (negative), a given method achieves the same %C as the baseline at a higher SNR, i.e. the method underperforms the baseline method.
2) GSNR = 0.0, a given method achieves the same %C as the baseline at the same SNR
3) GSNR > 0.0 (positive), a given method achieves the same %C as the baseline at a lower SNR, i.e. the method outperforms the baseline method.
As developed in [13], RAP is interpreted as: 1) RAP < 1.0, a given method achieves overall lower
%C than the baseline 2) RAP = 1.0, a given method achieves overall %C
comparable to the baseline 3) RAP > 1.0, a given method exceeds overall
baseline %C performance. 3.4.2. Verification Accuracy. Verification performance is evaluated using Receiver Operating Characteristic (ROC) curves at a specified SNR, typically at the lowest SNR a %C = 90% accuracy threshold is reached [13]. In operation, and as described in [47], [46], verification involves: 1) an -unknown device claiming bit level credentials (e.g., MAC address) which matching a specific authorized device, 2) extracting RF fingerprint features from the unknown device, and 3) comparing current RF fingerprints against the model for the claimed authorized device having the claimed identity. For authorized devices, ROC curves are plotted as True Verification Rate (TVR) versus False Reject Rate (FRR). To evaluate performance, two approaches are used [13]: 1) the percentage authorized (%Aut) at an arbitrary TVR ≥ 90% at FVR ≤ 10% threshold and 2) the mean area of the ROC curves (AUCM). The AUCM approach was developed in [13] since %Aut reflects coarse and dichotomous sampling and dichotomous, e.g. ND = 3 devices %Aut ∈ [0, 33, 66, 100], and thus %Aut does not distinguish between relative performance differences between competing classifiers. 4. Multivariate Stochastic Approximation based Optimization of Hyperparameters
Consistent with general ANN operations, the performance of the GRLVQI classification algorithm after training is a random variable as the training data set is randomly selected. Thus, determining optimal hyperparameters for the GRLVQI requires an appropriate experimental design.
We use a sequential design strategy [48] which begins with an intitial guess of the hyperparameter settings. Based on these settings, GRLVQI is trained and the results from this training determine a new set
Page 2229
of hyperparameters. This procedure is repeated until it converges on a particular set of hyperparameters. To update the hyperparameter values each iteration, we use the method of Kiefer and Wolfowitz [49], which is a stochastic approximation version of gradient descent optimization.
We present a minimal amount of the theory behind stochastic approximation to demystify the psuedocode for the optimization algorithm. 4.1. Stochastic Approximation Theory
For the Kiefer and Wolfowitz approach of our sequential design strategy, we will let ℎ𝑅𝑅,𝑗𝑗 be the value of the 𝑖𝑖𝑡𝑡ℎ of 𝑁𝑁 continuous valued hyperparameter of the GLVQI at iteration 𝑗𝑗 of the optimiztion procedure, and let 𝒉𝒉𝑗𝑗 be vector of these hyperparameters. Let 𝑓𝑓�𝒉𝒉𝑗𝑗� be the performance measure of interest of GRLVQI. Finally, let {𝑎𝑎𝑛𝑛} and {𝑐𝑐𝑅𝑅} be sequences such that
∑ 𝑎𝑎𝑅𝑅∞𝑅𝑅=1 = ∞ ,
∑ 𝑎𝑎𝑛𝑛𝑐𝑐𝑛𝑛∞𝑅𝑅=1 < ∞ ,
and ∑ 𝑎𝑎𝑛𝑛2𝑐𝑐𝑛𝑛−2∞𝑅𝑅=1 < ∞ . 1
(5)
Using (5), let 𝒄𝒄𝑗𝑗𝑅𝑅 = �𝟎𝟎𝑅𝑅−1, 𝑐𝑐𝑗𝑗 ,𝟎𝟎𝑁𝑁−𝑅𝑅� where 𝟎𝟎𝑛𝑛 is a
vector of zeroes of size 𝑛𝑛. The iteration function is given by
⎣⎢⎢⎢⎡ℎ1,𝑗𝑗+1⋮
ℎ𝑅𝑅,𝑗𝑗+1⋮
ℎ𝑛𝑛,𝑗𝑗+1⎦⎥⎥⎥⎤
=𝑎𝑎𝑅𝑅2𝑐𝑐𝑅𝑅
⎣⎢⎢⎢⎢⎡ 𝑓𝑓�𝒉𝒉𝑗𝑗 + 𝒄𝒄𝑗𝑗1� − 𝑓𝑓�𝒉𝒉𝑗𝑗 − 𝒄𝒄𝑗𝑗1�
𝑓𝑓�𝒉𝒉𝑗𝑗 + 𝒄𝒄𝑗𝑗𝑅𝑅�⋮
−𝑓𝑓�𝒉𝒉𝑗𝑗 − 𝒄𝒄𝑗𝑗𝑅𝑅�⋮
𝑓𝑓�𝒉𝒉𝑗𝑗 + 𝒄𝒄𝑗𝑗𝑁𝑁� − 𝑓𝑓�𝒉𝒉𝑗𝑗 − 𝒄𝒄𝑗𝑗𝑁𝑁�⎦⎥⎥⎥⎥⎤
(6)
The algorithm terminates when the norm of the differences between 𝑓𝑓(𝒉𝒉) of two consective iterations is small. It should be noted that stochastic approximation finds locally optimal solutions, which are potentially significantly different from the globally optimal solutions. While it is never possible to be sure that we have arrived at the globablly optimal solution with stochastic approximation, we can identify multiple locally optimal solutions and select the best by running the algorithm multiple times with different intital
1 Suggested sequences are {𝑎𝑎𝑛𝑛} = 1
𝑛𝑛 and 𝑐𝑐𝑛𝑛 = 𝑛𝑛−
13
solutions (however, for this work, we have chosen to do only one run). 4.2. Sequential Design Algorithm In operation, the process in Section 4.1 can be applied to a given algorithm by following a few steps. Specifically we employ the following algorithm to find the (locally) optimal hyperparamers of 𝝐𝝐, 𝝃𝝃,𝜸𝜸, and 𝜷𝜷 for GRLVQI; however, this can be applied to many other algorithms. The algorithm works as follows, with 𝝉𝝉 being a termination criteria and 𝒇𝒇�𝑵𝑵𝒓𝒓𝒓𝒓𝒓𝒓(𝒉𝒉𝒊𝒊) representing the mean value of RAP values after training individual GRLVQI classifiers for 𝑵𝑵𝒓𝒓𝒓𝒓𝒓𝒓 replications. Also let |𝒉𝒉𝒊𝒊 − 𝒉𝒉𝒊𝒊−𝟏𝟏| be the L1 norm of 𝒉𝒉𝒊𝒊 and 𝒉𝒉𝒊𝒊−𝟏𝟏.
1. Set 𝒊𝒊 = 𝟏𝟏. 2. Specificy initial hyperparameter values for
𝝐𝝐𝟏𝟏, 𝛏𝛏𝟏𝟏,𝜸𝜸𝟏𝟏, and 𝜷𝜷𝟏𝟏 3. Let 𝒉𝒉𝟏𝟏 = (𝝐𝝐𝟏𝟏, 𝛏𝛏𝟏𝟏,𝜸𝜸𝟏𝟏,𝜷𝜷𝟏𝟏). 4. While |𝒉𝒉𝒊𝒊 − 𝒉𝒉𝒊𝒊−𝟏𝟏| < 𝝉𝝉 or 𝒊𝒊 ≥ 𝟏𝟏
a. Set 𝒂𝒂𝒊𝒊 = 𝟎𝟎.𝟏𝟏𝒊𝒊
and 𝒄𝒄𝒊𝒊 = 𝟎𝟎.𝟎𝟎𝟎𝟎𝟏𝟏𝒊𝒊− 𝟏𝟏𝟑𝟑.
b. Set 𝐑𝐑𝐑𝐑𝐑𝐑𝐮𝐮,𝐣𝐣 = 𝒇𝒇�𝑵𝑵𝒓𝒓𝒓𝒓𝒓𝒓�𝒉𝒉𝒊𝒊 + 𝒄𝒄𝒊𝒊𝒋𝒋�,
𝐑𝐑𝐑𝐑𝐑𝐑𝒍𝒍,𝐣𝐣 = 𝒇𝒇�𝑵𝑵𝒓𝒓𝒓𝒓𝒓𝒓�𝒉𝒉𝒊𝒊 − 𝒄𝒄𝒊𝒊𝒋𝒋�, 𝒋𝒋 = 𝟏𝟏, … ,𝟒𝟒,
and 𝑵𝑵𝒓𝒓𝒓𝒓𝒓𝒓 = 𝟏𝟏𝟎𝟎
c. Set 𝒉𝒉𝒊𝒊+𝟏𝟏 = 𝒂𝒂𝒊𝒊𝟐𝟐𝒄𝒄𝒊𝒊
�𝐑𝐑𝐑𝐑𝐑𝐑𝐮𝐮,𝟏𝟏 − 𝐑𝐑𝐑𝐑𝐑𝐑𝒍𝒍,𝟏𝟏
⋮𝐑𝐑𝐑𝐑𝐑𝐑𝐮𝐮,𝟒𝟒 − 𝐑𝐑𝐑𝐑𝐑𝐑𝒍𝒍,𝟒𝟒
�
d. Set 𝑹𝑹𝑹𝑹𝑷𝑷𝒊𝒊+𝟏𝟏 = 𝒇𝒇�𝑵𝑵𝒓𝒓𝒓𝒓𝒓𝒓(𝒉𝒉𝒊𝒊+𝟏𝟏) e. Set 𝒊𝒊 = 𝒊𝒊 + 𝟏𝟏.
5. Return 𝒉𝒉𝒊𝒊. The termination criteria, 𝝉𝝉, is used to comparing the
norm of the difference between the current iteration hyperparameter values, 𝒉𝒉𝒊𝒊, and its value from the last iteration, 𝒉𝒉𝒊𝒊+𝟏𝟏; thus when these results are sufficiently similar, the algorithm will stop. The initialization steps, #1-3 initalize the decay terms, the iteration counter, i, and the initial operating point of the algorithm. Step 4a specify how the decay terms are updated which monotonically decrease as the algorithm progresses. Step 4b runs the algorithm multiple times, each with a hyperparameter increased and decreased by c; in this case we have four hyperparameters and GRLVQI was run twice for each setting (8 times total) and then the process was replicated 10 times to improve the estimate of GRLVQI preformance with a given set of hyperparameters. Step 4c is in essence performing a gradient descent by examining the differences between the scores with ±c (Ncond = 2 conditions). and adjusting the hyperparameter values accordingly. Step 4d sets
Page 2230
the value of this iterations’s results and Step 4e increments the iteration counter. Step 5 retuns the optimal setting values for GRLVQI.
5. Learning Vector Quantization Setting Optimization
Work in [13] aimed to find optimal LVQ settings by using a full factorial model with optimal settings found via both a spreadsheet search and a response surface method with constrained nonlinear optimization. However, two limitations exist with the approach of [13]: 1) The full factorial approach was limited by
exploring only a constrained region of the possible design space
2) Lack of sufficient replications to account for random variation
5.1. Experimental Considerations
The Sequential Design strategy via Stochastic Approximation approach discussed in Section 4 was used to account for the first issue by allowing the Nhyp
= 4 continuous hyperparamters (𝜖𝜖, 𝜉𝜉, 𝛾𝛾, 𝛽𝛽) of GRLVQI to be optimized by consideration ±c. Consistent with [35], 𝒉𝒉𝟎𝟎 = (0.025, 0.005, 2.5,3.5) was used.
To account for the second issue, Nrep = 10 replicates were considered for all steps in the process to account for random variation. Optimization was considered with respect to maximum possible RAP, from 100 %C for all explored SNR operating points. Optimization was performed with respect to the TNG set performance to avoid training on testing data.
In total, with Nhyp × Nrep × Ncond = 80 GRLVQI runs were computed for each iteration. The average RAP was computed for GRLVQI by hyperparameter. The stochastic approximation appoach was allowed to run until the norm between latest iteration and last iteration was 0.01. This resulted in Niter = 28 iterations being run, thus 2,240 total GRLVQI classifiers were developed. 5.2. Results
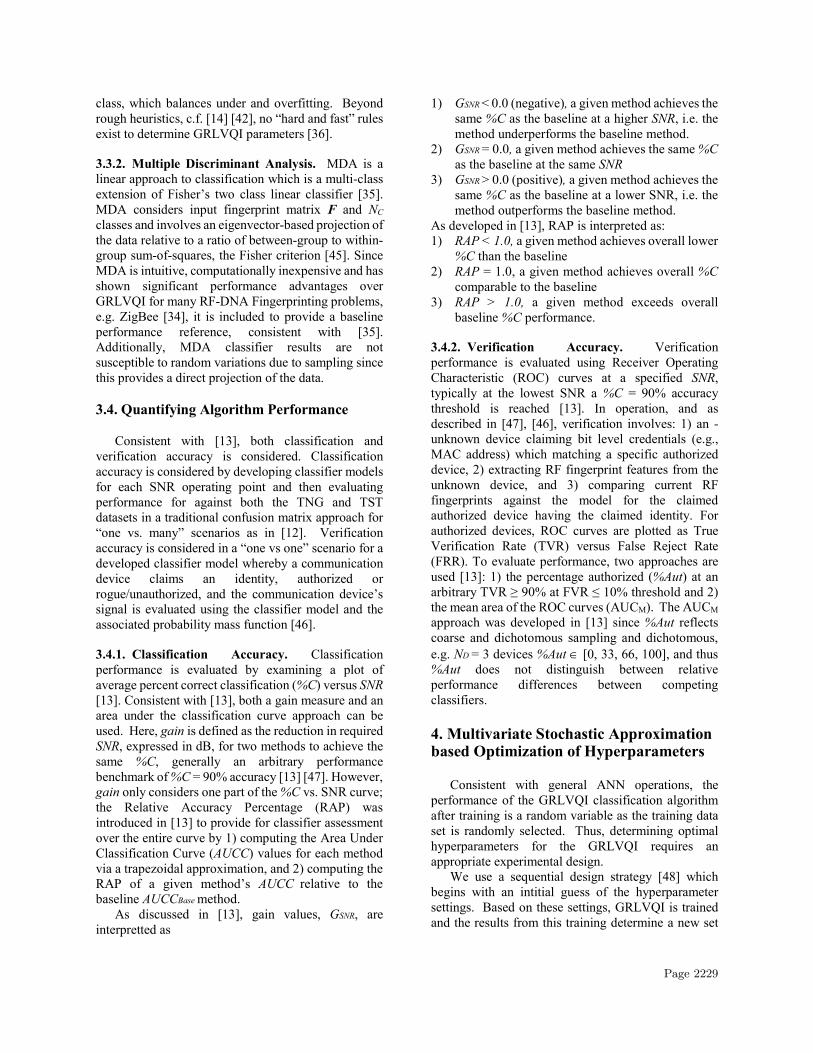
By evaluating the hyperparameter settings through each iteration, Figure 5, we can gather some indication of the path the stochastic approximation algorithm took where each subplot examines the respective rate versus iteration number. Figure 5a shows the learning rate progression shows a continual increase. Figure 5b shows the relevance rate progression which climbs fast and then oscillates around 0.02. Figure 5c and Figure
5d show the progression for the conscience learning rates, which quickly hit a general plateau.
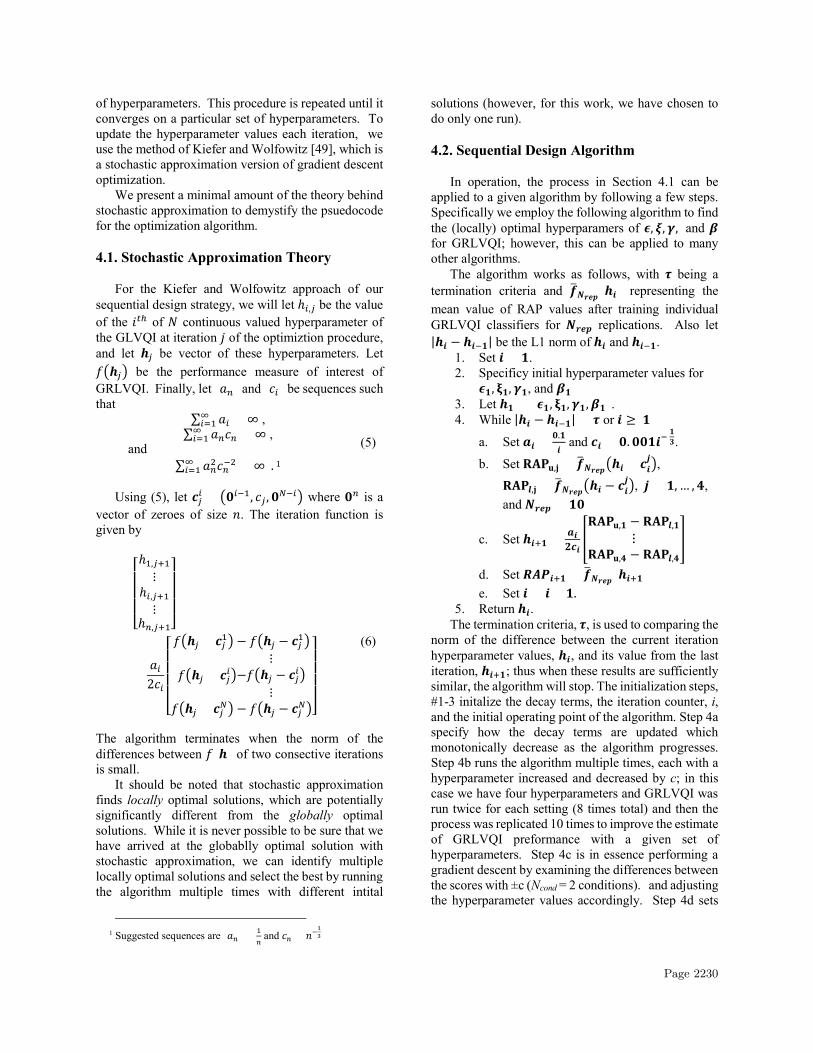
Although the progression of the learning rate in Figure 5a shows a continual climb, this is being counteracted by the decaying property of c in the algorithm. Additionally, we can examine the RAP values at each iteration (using a baseline of the maximum possible achievable performance of 100 %C at all SNR). Figure 6 shows the RAP values with error bars computed from the replicated runs. In Figure 6 we see that the algorithm climbs quickly from an initial RAP of approximately 0.63 and then levels off to an RAP of approximately 0.645. The error bars illustrate that this performance improvement is a significant improvement over the initial settings.
Figure 5. Hyperparameter settings through 28
iterations
Figure 6. RAP values with error bars (± σ(RAP)/
Nrep) at each iteration. When evaluating performance at the last iteration
step, we can see the curves from which the RAP values were generated. Figure 7 presents the performance results for the TST set of %C versus SNR for GRLVQI after Stochastic Optimization by Sequential Design (GRLVQI-SD), Baseline GRLVQI using the nominal
1 5 10 15 20 250.02
0.04
0.06
0.08
Iteration Number
Lear
ning
Rat
e
1 5 10 15 20 250
0.01
0.02
0.03
Iteration Number
Rele
vanc
e Ra
te
1 5 10 15 20 252.5
2.52
2.54
2.56
Iteration Number
Cons
cien
ce R
ate
1
1 5 10 15 20 250.3
0.32
0.34
0.36
Iteration Number
Cons
cien
ce R
ate
2
1 5 10 15 20 250.63
0.635
0.64
0.645
0.65
0.655
0.66
Iteration Number
Rela
tive
Acc
urac
y Pe
rcen
tage
(RA
P)
Page 2231

settings of [50], and MDA. Notably, GRLVQI outperforms MDA. When GRLVQI settings are optimized via stochastic approximation, classification performance is further improved.
Figure 7. Representative classification
performance for the TST set for the baseline GRLVQI algorithm, GRLVQI after Stochastic
Optimization via Sequential Design, and MDA. Table 2 condenses the results and presents
verification performance. In Table 2, RAP values were computed relative to MDA. Here we see that GRLVQI outperforms MDA and the baseline GRLVQI significantly. Additionally, Table 2 includes verification accuracy performance of all algorithms. This shows that the optimized GRLVQI offers both improved classification performance over baseline GRLVQI and MDA and improved verification accuracy over the baseline GRLVQI. Although verification performance is not as good as that of MDA, this performance is approaching the quality of the MDA verification performance if we consider AUCM. Additionally, the similarity between TST and TNG performance indicates that overfitting is not an issue.
Overall, these performance results are consistent with those of [13]. Although the reference “best” performance values of [13] are included for comparison, direct comparisons with these performance results are not possible since replications were not used in that effort. Thus the work of [13] was essentially “cherry picked” since it involved searching for best of nonreplicated runs. Interestingly, the optimal hyperparameter settings found through Stochastic Approximation are different from those found in [13], indicating the possibility of multiple local optima in ANN solutions. 6. Summary and Conclusions
The cyber attack surface, vectors by which cyber attacks can occur, are increased by sub-internet pathways, e.g. those comprised of common wireless WiFi, Z-Wave, ZigBee and Bluetooth devices. Risks associated with sub-internet pathways include risks of service degradation or disruption which are magnified since e-government pathways include hospitals, power grids and other CI systems. The approach presented herein demonstrates enhancements to sub-internet pathway security with applicable to WPANs.
Herein, a process was presented to find optimal algorithm settings by stochastic approximation which allowed hyperparameter settings to freely change without enforcing bounds as in a design of experiments approach, e.g. [13]. The results illustrate 1) the necessity in determining appropriate GRLVQI algorithm settings, 2) the viability of Stochastic Approximation for RF-DNA Fingerprinting algorithm optimization, and 3) general invariance of conscience learning rates in GRLVQI to accuracy.
Primary contributions include improvements to communication device discrimination using RF Fingerprints by: 1) formalization of a Stochastic
0 5 10 15 20 2530
40
50
60
70
80
90
100
SNR (dB)
Ave
Pct
Cor
rect
(%
C)
GRLVQI - SD, TstGRLVQI - baseline, TstMDA, Tst
Table 2. Algorithm Optimization Results
METHOD MAXIMIZATION OBJECTIVE
FACTORS LEVELS PERFORMANCE RESULTS
CLASSIFICATION VERIFICATION AT SNR = 20DB
A B C D E GSNR (DB) AT %C = 90% RAP TVR AUCM
TNG TST TNG TST Stochastic
Approximation Optimization
RAPTNG 0.078 0.016 2.527 0.319 7 +5.16 +5.05 1.16 1.17 66% 0.965
Best Full Factorial [13]
Spreadsheet Search 0.25 0.05 2.0 0.35 7 +5.30 +5.77 1.22 1.18 66% 0.979 Constrained Nonlinear
Optimization 0.1501 0.05 4.5 0.15 7 +5.23 +5.26 1.20 1.19 66% 0.967
None [13] BASELINE GRLVQI 0.025 0.005 2.5 0.35 10 +3.72 +3.32 1.14 1.13 33% 0.936 MDA N/A N/A N/A N/A N/A +1.68 0.00 1.23 1.0 100% 0.971
Page 2232
Approximation approach for classifier model development, 2) demonstration of this approach for GRLVQI optimization for Z-Wave device discrimination, and 3) improvements in the experimental approach of RF Fingerprinting classifier development by replication.
Results achieved were also similar to those of [13], but comparisons are notional since replications were not considered in [13]. Thus the performance results presented herein are more rigorous by considering both the estimate of the optimal hyper parameter value and the error on that estimate.
Future work includes further refining the sequential design strategy. Firstly, there is no guarantee that the globally optimal point has been found; further work would explore this issue. Secondly, since the algorithm relies on finite differences, we must be reasonably confident in the order relation between estimates of performance at the ±𝑐𝑐 values of the hyperparameters. This may require increasing the number of training replications per iteration. Thirdly, the sequential design strategy must be adapted to accommodate integer parameters, e.g. the number of PVs.
7. Acknowledgements
U.S. Government work not protected by U.S. copyright. Research supported by funding from the Scientific Test & Analysis Techniques (STAT) Center of Excellence (COE) at the Air Force Institute of Technology. The views contained herein are those of the authors and should not be interpreted as representing official policies or positions of the U.S. Government. 8. References [1] A. Chadwick and C. May, "Interaction between States
and Citizens in the Age of the Internet:“e‐Government” in the United States, Britain, and the European Union," Governance, vol. 16, no. 2, pp. 271-300, 2003.
[2] T. J. Perez, "Municipal E-Government Security: What is the greatest challenge?," Hawaii Int. Conf. System Sciences (HICSS), pp. 2263-2271, 2015.
[3] A. Wong, "Case Study: Simulated deployment of a mesh network in Honolulu," 43rd Hawaii Int. Conf. System Sciences (HICSS), pp. 1-9, 2010.
[4] A.-M. Chang, P. K. Kannan and S. Fellow, "Preparing for wireless and mobile technologies in government," E-government , pp. 345-393, 2003.
[5] H. Cao, V. Leung, C. Chow and H. Chan, "Enabling technologies for wireless body area networks: A survey and outlook.," IEEE Communications Magazine, vol. 47, no. 12, pp. 84-93, 2009.
[6] V. Güngör, D. Sahin, T. Kocak, S. Ergüt, C. Buccella, C. Cecati and G. Hancke, "Smart grid technologies: communication technologies and standards," IEEE Trans. on Industrial Informatics, vol. 7, no. 4, pp. 529-539, 2011.
[7] Microsoft Cloud, "City in the Cloud," 2017. [Online]. Available: http://www.theatlantic.com/sponsored/microsoft-2017/city-in-the-cloud/1133/. [Accessed 8 May 2017].
[8] H. Yang, H. Luo, F. Ye, S. Lu and L. Zhang, "Security in mobile ad hoc networks: challenges and solutions," IEEE wireless communications, vol. 11, no. 1, pp. 38-47, 2004.
[9] B. Reaves and T. Morris, "Analysis and mitigation of vulnerabilities in short-range wireless communications for industrial control systems," Int. J. of Critical Infrastructure Protection, vol. 5, no. 3, pp. 154-174, 2012.
[10] C. Badenhop, B. Ramsey, B. Mullins and L. Mailloux, "Extraction and analysis of non-volatile memory of the ZW0301 module, a Z-Wave transceiver," Digital Investigation, vol. 17, pp. 14-27, 2016.
[11] S. Prabhakar, S. Pankanti and A. K. Jain, "Biometric recognition: Security and privacy concerns.," IEEE security & privacy, vol. 99, no. 2, pp. 33-42, 2003.
[12] W. E. Cobb, E. D. Laspe, R. O. Baldwin, M. A. Temple and Y. C. Kim, "Intrinsic physical-layer authentication of integrated circuits," IEEE Trans. on Information Forensics and Security, vol. 7, no. 1, pp. 14-24, 2012.
[13] T. Bihl, M. Temple and K. Bauer, "An Optimization Framework for Generalized Relevance Learning Vector Quantization with Application to Z-Wave Device Fingerprinting," Hawaii Int. Conf. System Sciences (HICSS), pp. 2379-2387, 2017.
[14] M. Strickert, U. Seiffert, N. Sreenivasulu, W. Weschke, T. Villmann and B. Hammer, "Generalized relevance LVQ (GRLVQ) with correlation measures for gene expression analysis," Neurocomputing, vol. 69, no. 7-9, pp. 651-659, 2006.
[15] T. Kohonen, J. Kangas, J. Laaksonen and K. Torkkola, "LVQ_PAK: A program package for the correct application of Learning Vector Quantization algorithms," Proceedings of the Int. Joint Conference on Neural Networks, pp. 725-730, 1992.
[16] W. J. Dixon, "Efficient analysis of experimental observations," Annual review of pharmacology and toxicology, vol. 20, no. 1, pp. 441-462, 1980.
[17] W. Sukthomya and J. Tannock, "The optimisation of neural network parameters using Taguchi’s design of experiments approach: an application in manufacturing process modelling," Neural Computing & Applications, vol. 14, no. 4, pp. 337-344, 2005.
[18] D. W. Steeneck and T. J. Bihl, "Stochastic Estimation for Learning Rate Optimization for Generalized Relevance Learning Vector Quantization," IEEE Nat. Aerospace and Electronics Conf. (NAECON), 2017.
[19] T. Y. Lin and C. H. Tseng, "Optimum design for artificial neural networks: an example in a bicycle derailleur system," Engineering Applications of Artificial Intelligence, vol. 13, no. 1, pp. 3-14, 2000.
Page 2233
[20] S. Bhatnagar, "E-government and access to information," Global Corruption Report 2003, pp. 24-32, 2003.
[21] R. Bruno, M. Conti and E. Gregori, "WLAN Technologies for mobile ad hoc networks," Hawaii Int. Conf. System Sciences (HICSS), pp. 1-11, 2001.
[22] S. Stone, M. Temple and R. Baldwin, "Detecting Anomalous PLC Behavior Using RF-Based Hilbert Transform Features and a Correlation-Based Verification Process," Int. J. Critical Infrastructure Protection, vol. 9, pp. 41-51, 2015.
[23] J. Tan and S. G. M. Koo, "A survey of technologies in internet of things," IEEE Int. Conf. Distributed Computing in Sensor Systems (DCOSS), pp. 269-274, 2014.
[24] C. Ten, C. Liu and G. Manimaran, "Vulnerability assessment of cybersecurity for SCADA systems," IEEE Trans. on Power Systems , vol. 23, no. 4, pp. 1836-1846, 2008.
[25] S. Panguluri, T. D. Nelson and R. P. Wyman, "Creating a Cyber Security Culture for Your Water/Waste Water Utility," Cyber-Physical Security, pp. 133-159, 2017.
[26] I. Yaqoob, I. A. T. Hashem, Y. Mehmood, A. Gani, S. Mokhtar and S. Guizani, " Enabling Communication Technologies for Smart Cities," IEEE Communications Mag., vol. 55, no. 1, pp. 112-120, 2017.
[27] M. Knight, "How safe is Z-Wave?[Wireless standards]," Computing and Control Engineering, vol. 17, no. 6, pp. 18-23, 2006.
[28] C. Gomez and J. Paradells, "Wireless home automation networks: A survey of architectures and technologies," IEEE Communications Mag., pp. 92-101, June 2010.
[29] J. Sammons, The basics of digital forensics: the primer for getting started in digital forensics., Elsevier, 2012.
[30] S. Garfinkel, "Digital Forensics," American Scientist, vol. 101, no. 5, pp. 370-377, 2013.
[31] M. Galeev, "Catching the Z-Wave," Electronic Engineering Times India, pp. 1-5, Oct. 2006.
[32] ITU, ITU-T G.9959: Short range narrow-band digital radio communication transceiver - PHY and MAC layer specifications, Geneva, Switzerland: International Telecommunication Union, 2012.
[33] V. Lohweg, J. L. Hoffmann, H. Dörksen, R. Hildebrand, E. Gillich, J. Hofmann and J. Schaed, "Banknote authentication with mobile devices," IS&T/SPIE Electronic Imaging, pp. 1-14.
[34] T. J. Bihl, M. A. Temple, K. Bauer and B. Ramsey, "Dimensional Reduction Analysis for Physical Layer Device Fingerprints with Application to ZigBee and Z-Wave Devices," IEEE Military Communications Conf. (MILCOM), pp. 360-365, 2015.
[35] P. Harmer, D. Reising and M. Temple, "Classifier selection for physical layer security augmentation in cognitive radio networks," IEEE Int. Conf. on Communications (ICC), pp. 2846-2851, 2013.
[36] M. J. Mendenhall, A Neural Relevance Model for Feature Extraction from Hyperspectral Images, and its
Application in the Wavelet Domain, PhD Dissertation: Rice University, 2006.
[37] C. G. Looney, Pattern Recognition Using Neural Networks, Oxford University Press, 1997.
[38] M. Kaden, M. Lange, D. Nebel, M. Riedel, T. Geweniger and T. Villmann, "Aspects in classification learning-Review of recent developments in Learning Vector Quantization," Foundations of Computing and Decision Sciences, vol. 39, no. 2, pp. 79-105, 2014.
[39] A. S. Sato and K. Yamada, "Generalized learning vector quantization," in Advances in neural information processing systems, Cambridge, MA, MIT Press, 1995, pp. 423-429.
[40] A. I. Gonzalez, M. Grana and A. D'Anjou, "An analysis of the GLVQ algorithm," IEEE Trans. on Neural Networks, vol. 6, no. 4, pp. 1012-1016, 1995.
[41] T. Bojer, B. Hammer, D. Schunk and K. Tluk von Toschanowitz, "Relevance determination in learning vector quantization," Proceedings of European Symposium on Artificial Neural Networks (ESANN), pp. 271-276, 2001.
[42] B. Hammer and T. Villmann, "Generalized relevance learning vector quantization," Neural Networks, vol. 15, no. 8-9, pp. 1059-1068, 2002.
[43] M. J. Mendenhall and E. Merenyi, "Relevance-Based Feature Extraction for Hyperspectral Imagery," IEEE Trans. on Neural Networks, vol. 19, no. 4, pp. 658-672, 2008.
[44] D. DeSieno, "Adding a conscience to competitive learning," Proceedings of the IEEE Int. Conf. on Neural Networks, pp. 117-124, 1988.
[45] T. J. Bihl, M. A. Temple and K. Bauer, "Feature Selection Fusion (FSF) for Aggregating Relevance Ranking Information with Application to ZigBee Radio Frequency Device Identification," IEEE Nat. Aerospace and Electronics Conf. (NAECON), 2016.
[46] C. Dubendorfer, B. Ramsey and M. Temple, "ZigBee device verification for securing industrial control and building automation systems," International Conference on Critical Infrastructure Protection, pp. 47-62.
[47] T. J. Bihl, K. W. Bauer and M. A. Temple, "Feature selection for RF fingerprinting with multiple discriminant analysis and using zigbee device emissions," IEEE Trans. on Information Forensics and Security, vol. 11, no. 8, pp. 1862-1874, 2016.
[48] J. C. Spall, Introduction to stochastic search and optimization: estimation, simulation, and control, John Wiley & Sons, 2005.
[49] J. Kiefer and J. Wolfowitz, "Stochastic estimation of the maximum of a regression function," The Annals of Mathematical Statistics, vol. 23, no. 3, pp. 462-466, 1952.
[50] D. R. Reising, M. A. Temple and J. A. Jackson, "Authorized and rogue device discrimination using dimensionally reduced rf-dna fingerprints," IEEE Trans. on Information Forensics and Security, vol. 10, no. 6, pp. 1180-1192, 2015.
Page 2234


![On Stein’s method for multivariate normal approximation · Chatterjee [3], where several abstract normal approximation theorems, for approx-imating by standard Gaussian random vectors,](https://img.pdfslide.us/doc/110x75/5f53a0f2897d984734626843/on-steinas-method-for-multivariate-normal-approximation-chatterjee-3-where.jpg)