Embed Size (px)
Citation preview

NTIA Report 88-231NCS Technical Information Bulletin 88-02
Multitier Specification Applied toModify the Hardness of an Essential
NSEP Fiber Optic Link
David. F. Peach
Robert T.Adai r
U.S. DEPARTMENT OF COMMERCEC. William Verity, Secretary
Alfred C. Sikes, Assistant Secretaryfor Communications and Information
NATIONAL COMMUNICATIONS SYSTEM
March 1988


PREFACE
This report is submitted as the primary deliverable for a study conductedfor the National Communications System (NCS) , Office of the Manager, Technologyand Standards Office, Washington, DC, under Reimbursable Order 7-10215.Several other reports serve as background reports or are tools used to performthis study. The Multitier Specification is the primary tool used to evaluatethe fiber optic telecommunication link studied in this report. The followingreferenced reports provide the background information described above.
Englert, T. J. (1987) , Effects of radiation damage in opticalfibers--A tutorial, 57 pp., NTIA Contractor Report 87-38, May,(NTIS Order Number PB 87-210308/AS).
Englert, T. J. (1987), Consideration of ionizing radiation shieldingfor optical fibers, NTIA Contractor report number not yetavailable.
Hull, J. A. (1987), NSEP fiber optics system study background report:Nuclear effects on fiber optic transmission systems, NTIAReport 87-227/NCS TIB 87-26, 115 pp., (NTIS Order Number not yetavailable) .
Ingram, W. J. (1987), A program description of FIBRAM: A radiationattenuation model for optical fibers, NTIA Report 87 - 216/NCSTIB 87-22, 120 pp., NTIS Order Number PB 87-230868 (reportonly); PB 87-230678 (report and data disk).
Nesenbergs, M. (1987), Fiber optic networks and their servicesurvival, NTIA Report 87-214/NCS TIB 87-9, 120 pp., (NTIS OrderNumber PB 87-186706/AS).
Peach, D. F. (1987), Multitier specification for NSEP enhancement offiber optic long-distance telecommunication networks, Vol I:The multitier specification--An executive summary, 50 pp., NTIAReport 87-226/NCS TIB 87-24; Vol II: Multitier specificationbackground and technical support information, 222 pp., NTIAReport 87-226/NCS TIB 87-25, (NTIS Order numbers not yetavailable) .
The study reported here is an evaluation of a Mountain Bell fiber optictelecommunication link. Results of this study should not be construed toendorse or be critical of the Mountain Bell installation. The requirementsused for this evaluation are not necessarily applicable to the intended use ofthis link. Units for distance used in presentation of the results are statedin English units because the fiber optic long-haul industry primarily usesthose units in their documentation. Approximate metric units are included forreference.
This report includes data and information from industry, Governmentagencies, and literature. Certain commercial names are identified in thisreport to specify and describe some of the necessary information. Suchidentification does not imply exclusive recommendation or endorsement of the
iii

companies or products by NTIA or NCS. The views, op~n~ons, and/or findingscontained in this report are those of the authors and should not be construedas an official NTIA or NCS position unless designated by other officialdocumentation.
This report was completed with the assistance of representatives ofMountain Bell. The authors wish to thank those representatives of MountainBell for supporting the effort, and especially Mr. George B. McHenry, Jr., whocontributed a great deal of his time to supply information and offerconstructive ideas. The following representatives of NTIA's Institute forTelecommunication Sciences assisted in the successful completion of thisreport: Mr. Joe Hull--technical review, Mr. John Harman--graphics design,Mr. Bill Ingram--technical review and preparation of the information onalternate power sources, and Mrs. Lenora Cahoon--grammatical and format review.Ms. Eleanor Livingston, National Bureau of Standards, Boulder, CO, contributedwith a technical and grammatical review. The authors wish to express theirthanks to Mr. Ken Wadman, MITRE Corp., for his technical assistance andsupport.
iv

CONTENTS
LIST OF FIGURES
LIST OF TABLES
ABSTRACT
Page
vii
ix
1
1.
2.
INTRODUCTION
1.1 Background1.2 Study Objectives1.3 Participators in the Study1.4 Benefits of the Study
SELECTED NSEP LINK .
1
1234
4
Colorado Springs-to-Pueblo Link
2.12.22.32.4
Mission ObjectivesDescription of theSystem ProfileStress Analysis:
Selected Link5559
3.
4.
5.
6.
7.
8.
HARDENING ENHANCEMENTS
3.1 Selective Hardening: Benefits and Limitations3.2 Cable Upgrade Enhancements Required ...3.3 Regenerator Upgrade Enhancements Required ...3.4 Splice Box Upgrade Enhancements Required3.5 Comparison'of Original System Hardness and the Upgraded
System Hardness . . . . . . . . . . . . . . . . . .3.6 FIBRAM BER Analysis of Original and Upgraded System
PROJECTED STRESS PARAMETERS
4.1 Man-Made Events ..4.2 Naturally Occurring Events
RESTORABILITY OF AN OPTICAL FIBER LINK
COST OF ENHANCEMENTS
6.1 Cable Placement Upgrade Costs6.2 Regenerator Installation Cost Analysis6.3 Cost of Splice Boxes (Handholds)6.4 Summary of Costs to Upgrade the Fiber Optic Route
SUMMARY
CONCLUSIONS
v
14
14151517
1822
22
2627
28
29
29303233
37
38

CONTENTS (cont.)
9. ACKNOWLEDGMENTS
10. REFERENCES.
11. BIBLIOGRAPHY
APPENDIX A: EXCERPT FROM THE MULTITIER SPECIFICATION
APPENDIX B: QUESTIONS TO BE ANSWERED PRIOR TO THE APPLICATION OFTHE MULTITIER SPECIFICATION TO A FIBER OPTIC LINK
APPENDIX C: FIBER OPTIC LINK ROUTE MAPS
Page
40
40
41
47
59
65
APPENDIX D:
APPENDIX E:
INFORMATION ON A TYPICAL ABOVEGROUNDREGENERATOR STATION . . . . . . . .
INFORMATION ON A TYPICAL UNDERGROUND (CEV)REGENERATOR STATION . . . . . . . .
73
79
APPENDIX F: CONSIDERATION OF IONIZING RADIATION SHIELDINGFOR OPTICAL FIBERS . . . . . . . . . .
APPENDIX G: RESTORABILITY OF AN OPTICAL FIBER LINK
vi
85
121

LIST OF FIGURES
Page
View of the southwest corner of the regenerator building. 74
Figure 1.
Figure 2.
Figure 3.
Figure C-1.
Figure C-2.
Figure C-3.
Figure C-4.
Figure C-5.
Figure D-l.
Figure D-2.
Figure D-3.
Figure D-4.
Figure D-5.
Figure D-6.
Figure D-7.
Figure D-8.
Figure D-9.
Figure D-10.
Routing for Mountain Bell fiber optic communication link(Colorado Springs to Pueblo). . . .
"BER versus Time" graph for the existing fiber opticcommunication link. . . . . . . . . . . . . .
"BER versus Time" graph for the upgraded fiber opticcommunication link. . . . . . . . . .
Routing for Mountain Bell fiber optic communication link(Colorado Springs to Pueblo). . .
Sheet 1 of route map summary.
Sheet 2 of route map summary.
Sheet 3 of route map summary.
Sheet 4 of route map summary.
View of the south side of the regenerator building.
View of the "standby" diesel-powered generator...
View of the ac power control panel and ventilation fanlocated in the "standby" generator room.
View of the battery bank, which provides the dc powerand serves as the uninterruptible power source.
View of the battery charging and monitoring circuitelectronics. . .
Front view of the fiber optic connection/distributionchassis with protective cover in place .
Front view of the fiber optic connection/distributionchassis with protective cover removed. .
View of the fiber optic cables showing the overheadrouting_ . . . . . . . . . .
Front view of the top portion of the regeneratorelectronics cabinet with the covers in place ...
vii
7
24
25
67
68
69
70
71
74
74
75
75
75
76
76
76
77

LIST OF FIGURES (cont.)
Page
Figure D-ll. View of the w~r~ng on the rear of the alarm systemelectronics. .... .. . .
Figure D-12. View of three obsolete manually operated switchboardsscheduled for removal from the Pueblo central office.
Figure E-l. View of the southeast corner of the CEV entrance.
Figure E-2. View of the CEV entrance with the lid up ..
77
77
80
80
Figure E-3.
Figure E-4~
Figure E-5.
Figure E-6.
Figure E-7.
View of the public utility service entrance controlpanel on the left and the CEV environmental controlpanel and sensors on the right .
View of the fiber optic cable entrance into the topof the CEV. . .
Front view of the fiber optic connection/distributionchassis with protective door open. . . . . . .
View of the regenerator electronics and associatedpower supplies. . . . . . . . . . ....
View of the conventional copper wire pair circuitsthat exi t the CEV. .
80
81
81
82
82
Figure E-8. View of the CEV wall and a typical equipment rackmounting upright support post. 82
Figure E-9. Cut-away drawing of a standard CEV. 83
Figure E-10. Dimensions of available CEV's. 84
Figure G-1. A continuous UPS. 123
Figure G-2. A standby UPS. 125
Figure G-3. System performance degradation example: worst-caseregenerator sections of FT3C Northeast Corridor(NCS, 1985). . 137
Figure G-4.
Figure G-5.
"BER versus Time" graph for AT&T single mode fiberoperating at a wavelength of 1.3 microns in responseto various levels of fallout radiation (Ingram, 1987). . .. 138
"BER versus Time" graph for AT&T multimode fiberoperating at a wavelength of 1.3 microns in responseto various levels of fallout radiation. . . . . . . . . . . . 139
viii

LIST OF TABLES
Page
Cable Placement Cost Analysis 30
Data Used for Unhardened System 23
Estimated Costs to Upgrade the Two Regenerator Installations. 31
Data Used for Upgraded System 23
10Hardness Level as it Relates to Protection Level
Multitier Specification Level of Protection for the SpecificSystem being Studied . . . . . . . . 14
Fiber Optic Cable Protection Levels Before/After Upgrade toGet to Hardness Level 4 . . . . . . . . . . . . . . . 19
Regenerator Site Protection Levels Before/After Upgrade toGet to Hardness Level 4 . . 21
Splice Box Protection Levels Before/After Upgrade to Get toHardness Level 4 . . . . . . . 20
Summary of System Element Enhancements Required to Upgradethe Entire Fiber Optic Route (including both regeneratorstations) to a Level 4 (Maximum) Hardness . ..... 35
Estimated Costs for Hardening the Two Regenerator SitesDuring Initial Installation . . . . . 32
Table 1.
Table 2.
Table 3.
Table 4.
Table 5.
Table 6.
Table 7.
Table 8.
Table 9.
Table 10.
Table 11.
Table 12. Summary of the Cost Ratios for Hardening of the ExistingSystem, . . . . . . . . . . . . . 37
Table G-l. Data Used for FT3C Northeast Corridor Model Using SingleMode Cable . . .. .. 136
Table G-2. Data Used for FT3C Northeast Corridor Model Using MultimodeCable . . . .. . . . . . . . . 140
ix


MULTITIER SPECIFICATION APPLIEDTO MODIFY THE HARDNESS OF AN ESSENTIAL NSEP
FIBER OPTIC LINK
David F. Peach and Robert T. Adair *
The Mu1itier Specification was developed to provide guidelinesand recommendations for improving the durability of the communicationinstallations necessary for National Security/E~ergency Preparedness(NSEP). The application of the Mu1titier Specification is consideredbeyond the installation and engineering requirements of typicalcommercial fiber optic systems. Five levels of hardness are definedin the specification. A link that could be important (may be askedto provide service) to the operation of the U.S. Space Command/NORADwas chosen as a candidate for this analysis. Based on the timecritical nature of the telecommunication traffic carried on this linkand the stress expected, the Level 4 (Maximum) hardness was chosen asthe target level for upgrade of this link. The elements of theexisting system are classified into levels using the MulitierSpecification. This report describes the enhancements necessary tomitigate the stress threat within the guidelines of the MulitierSpecification and to raise the level of hardness to Level 4(Maximum). The cost associated with the installation of theseenhancements is included. Solutions to problems peculiar to the pathspecified for the link are described in terms of .Q.!J& suggestedalternative. Also, an estimate of the additional initial investmentrequired to harden the system to Level 4 (Maximum) is included.
Key words: cost proj ections; durability; enhancements; fiber optic link;guidelines; hardness level; Mu1itier Specification; NationalSecuri ty/Emergency Preparedness (NSEP) ; stress threat;telecommunication systems; U.S. Space Command/NORAD
L INTRODUCTION
The Institute for Telecommunication Sciences (ITS) has formulated a
Mu1titier Specification for use in effecting a durable terrestrial fiber optic
telecommunication link (Peach, 1987).
1.1 Background
Each layer of the specification (guideline) is structured to provide a
level of protection for stress categories of a more severe nature as defined in
the specification document. The objective for the Mu1itier Specification is to
define enhancements that could be implemented to harden a fiber optic,
*The authors are with the Institute for Telecommunication Sciences, NationalTelecommunications and Information Administration, U.S. Department of Commerce,Boulder, CO 80303-3328.

is designed to rate the hardness of an
the necessary enhancements to upgrade the
Although the Multitier Specification can be
long-haul path (increase its durability) designated as a National
Security/Emergency Preparedness (NSEP) route. Since a large percentage of
Government communication traffic is carried by commercial systems, the
specification is directed toward improvement of the durability of commercial
installations rather than Government-owned systems.
Many of the ideas and concepts used in the specification were obtained
from industry representatives. Distribution of the compilation of information
(Multitier Specification) to the carriers in the marketplace has effected a
transfer of this information to industry, which is the secondary objective of
the work at ITS. The knowledge gained by industry and the application of ideas
presented in the specification have improved the hardness of a typical fiber
optic link being placed in 1987. The industry is becoming more aware of the
need for the installation of a hardened system.
A coordinated set of enhancements to provide protection against all types
of stress (man-made as well as naturally occurring events) has not been applied
anywhere in the United States when installing a commercial system--at least no
system has been advertised to provide that protection. Each carrier uses the
enhancement that will achieve the necessary specific protection against a local
threat or problem.
The basic definition and explanation of the Multitier Specification and
its associated levels of hardness are presented in Appendix A. This appendix
contains excerpts from the Multitier Specification, which should provide the
reader with a basic working knowledge of the Multitier Specification and its
terminology.
1.2 Study Objectives
It is the goal of this study to apply a set of enhancements, determined by
the desired level of hardness, to a sample telecommunication link. The ideal
situation, one that would provide the most comprehensive analysis, would be an
existing fiber optic link with an NSEP mission. It has become obvious that
almost any link between maj or population areas or along terrestrial
thoroughfares will most likely carry emergency communication traffic of some
type.
The Multitier Specification
existing link and to determine
hardness to a specified level.
2

used to specify enhancements, the intent is not to use the specification for
design, but only as a design guideline. An existing fiber optic link would
provide the opportunity to do both. And an upgrade from an obsolete, or lower
capacity/technology, system would afford the opportunity to specify a newly
designed link.
1.3 Participators in the Study
The study is intended to provide information that would benefit commercial
telecommunication suppliers as well as Government users and suppliers. A
second obj ective is to provide a study that involves an NSEP link that is
necessary to maintain communication during an emergency caused by a natural
event (weather, accident, or overload due to high demand holidays) or a
national crisis event (threat of war, actual war response, sabotage, nuclear
detonation, or a nuclear accident).
This study is requested by the National Communications System (NCS) to
show application of the Multitier Specification to an actual commercial fiber
optic link. The intent is to discuss those enhancements that can be added to a
typical commercial link to improve the durability, when required for an NSEP
use.
Executive Order 12472 defines the National Communications System mission
(in part) as "The coordination of the planning for and provision of NSEP
communications for the Federal Government under all circumstances, including
crisis or emergency."
Key responsibilities of the NCS are to: seek development of a national
telecommunication infrastructure that is survivable, responsive to NSEP needs
of the President and the Federal Government, capable of satisfying priority
telecommunications, and consistent with other National policies, serve as a
focal point for joint industry-Government NSEP telecommunication planning; and
establish a joint Industry-Government National Coordinating Center. This study
is to support the National Security Telecommunications Policy as enunciated in
NSDD-97. .. "the national telecommunication infrastructure must possess the
functional characteristics of connectivity, redundancy, interoperability,
restorability, and hardness necessary to provide a range of telecommunication
services to support essential national leadership requirements."
The staff at NCS had suggested that a link with a tie point at the complex
in Colorado Springs would be appropriate. A link located near ITS makes the
3
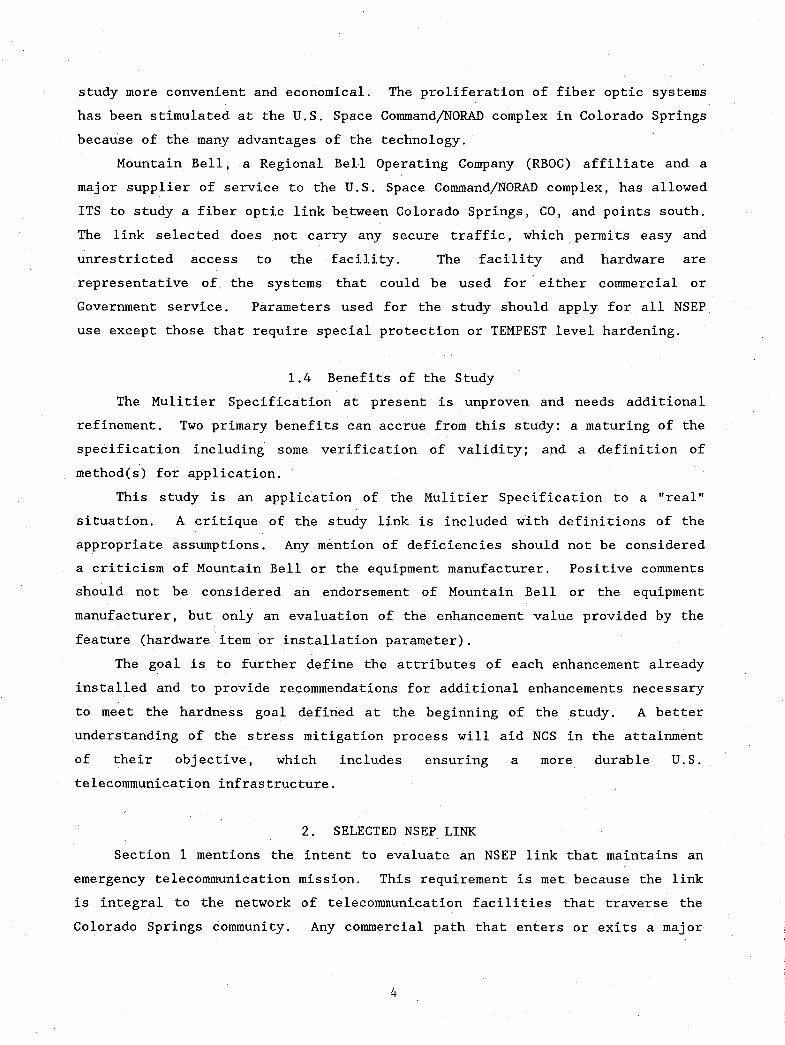
study more convenient and economical. The proliferation of fiber optic systems
has been stimulated at the U.S. Space Command/NORAD complex in Colorado Springs
because of the many advantages of the te~hnology.
Mountain Bell, a Regional Bell Operating Company (RBOC) affiliate and a
major supplier of service to the U.S. Space Command/NORAD complex, has allowed
ITS to study a fiber optic link between Colorado Springs, CO, and points south.
The link selected does not carry any secure traffic, which permits easy and
unrestricted access to the facility. The facility and hardware are
representative of the systems that could be used for either commercial or
Government service. Parameters used for the study should apply for all NSEP
use except those that require special protection or TEMPEST level hardening.
1.4 Benefits of the Study
The Mulitier Specification at present is unproven and needs additional
refinement. Two primary benefits can accrue from this study: a maturing of the
specification including some verification of validity; and a definition of
method(s) for application.
This study is an application of the Mulitier Specification to a "real"
situation. A critique of the study link is included with definitions of the
appropriate assumptions. Any mention of deficiencies should not be considered
a criticism of Mountain Bell or the equipment manufacturer. Positive comments
should not be considered an endorsement of Mountain Bell or the equipment
manufacturer, but only an evaluation of the enhancement value provided by the
feature (hardware item or installation parameter).
The goal is to further define the attributes of each enhancement already
installed and to provide recommendations for additional enhancements necessary
to meet the hardness goal defined at the beginning of the study. A better
understanding of the stress mitigation process will aid NCS in the attainment
of their objective, which includes ensuring a more durable U.S.
telecommunication infrastructure.
2. SELECTED NSEP LINK
Section 1 mentions the intent to evaluate an NSEP link that maintains an
emergency telecommunication mission. This requirement is met because the link
is integral to the network of telecommunication facilities that traverse the
Colorado Springs community. Any commercial path that enters or exits a major
4

military or metropolitan area will at some time carry emergency traffic. The
link selected for this study is a typical commercial link- -one that is not
Government-owned or -leased. Government traffic may be carried by the link if
that link is selected for use.
2.1 Mission Objectives
The mission objectives are only defined in terms of "service" that may be
carried over a commercial link. A specific mission could be analyzed if the
link were to be placed in service for use by a designated user/owner. For
purposes of this report the mission is defined as "necessary for emergency
use."
2.2 Description of the Selected Link
The selected link, owned and operated by Mountain Bell, spans the distance
from Colorado Springs, CO, to Pueblo, CO. The link terminates at a central
office at each end. Two regenerators are necessary to relay the signal along
the route. A data rate of 405 Mb/s is used to transmit data along the path.
The equipment used has a data rate capability of 417 Mb/s.
2.3 System Profile
The path is profiled in terms of the parameters discussed in the Mulitier
Specification so that the level of hardness can be determined. The path is
dissected into the maj or elements that can be classified for the level of
protection provided. Design parameters, as well as environmental parameters,
are considered when determining the level of protection. The path is divided
into the following elements:
1. fiber optic cable2. regenerator site3. cable splices4. the Central Office tie-point
The method of installation is documented and analyzed along with the type
and design of the hardware used for each elemental area mentioned above.
Features are noted that increase the resistance of the system to those stresses
that are listed in the Multitier Specification. If features are incorporated
that have not been evaluated in the Mulitier Specification, an analysis is
added. The goal of this analysis is to determine the type and magnitude of the
protection provided.
5

The recommended enhancements involve modification of the environment
surrounding each major element of the system. No attempt is made to redesign
or modify the design of the system to improve the resistance to stress.
Appendix B contains an extensive list of questions that must be answered
prior to application of the Multitier Specification to a fiber optic link. The
answers to these questions provide the information required to perform the
system analysis.
2.3.1 Colorado Springs-to-Pueblo Link
The link studied spans the service path between Colorado Springs, CO, and
Pueblo, CO. A route map of this link is illustrated in Figure 1, which shows
routing of the link relative to other geographic features in the area. More
detailed route maps appear in Appendix C. This link is currently used for
commercial traffic only, but could be used for Government~dedicated traffic if
desired since the link ties into the public-switched nationwide
telecommunication network (PSTN). Thus its use for NSEP purposes could be
vital for emergency use during periods of crisis or emergency. The link
represents a typical installation that could become a part of the necessary
NSEP network.
This evaluation presents the level of hardness, based upon the amount of
present protection from stress. The analysis includes the major stress
categories that are discussed in the Multitier Specification. If other stress
events seem appropriate for the specific location of this link, a discussion of
the effects is provided. Detailed data is provided for each major component of
the system as follows:
Fiber Optic Cable: Single-mode fiber optic cable is used for the entire route.
An all-dielectric cable design is used, with a polyethylene outer sheath. The
cable is a Siecor Type B Commercial (Industrial) with 6- and la-fiber pairs.
The 10-fiber pair cable is used through the urban area' of the route from
Colorado Springs to Fountain, CO (an exchange point on the route). The 6-pair
fiber optic cable is used for the remainder of the route.
The cable is installed underground, at a specified depth of 48 inches
(122 cm) except where obstacles preclude placing it at that depth. Existing
underground conduits are used for placement of the cable through urban areas.
The depth of these conduits is greater than 6 feet (1.8 m). Where possible,
6

COLORADO SPR INGS CENTRAL OFFICE
~.-,-
, ', '-I ", ,
l \ .....'-............ .... ... ",:
--,
PUEBLO MEMORIALAIRPORT
PETERSON FIELD
(Orowin9 !l2J 10 "01')
- ......
-SECURITY CENTRAL OFFICE
FOUNTAIN C.O.ANO REGEN.
PINONREGEN.
EL PASO COUNTYAIRPORT
SECURITYC.O.
COLO. SPGS.C.O.
CIlN
'"iD.
PUEBLO C.O.
lOw9. proportionally COII"I)
Figure 1. Routing for Mountain Bell fiber optic communication link(Colorado Springs to Pueblo).
7

the cable is plowed into the ground and placed inside a polyethylene conduit.
The conduit is filled with a compound at the ends to prevent entry of moisture
or other material. The installed cable lengths are 3 kilometers (approximately
10,000 feet).
Another cable, called a locate wire, is buried with the fiber optic cable
but not as deep. It is buried 2 feet (0.6 m) below the surface. This cable
consists of three copper wire twisted pairs. One pair is used for
communication along the cable route. Numerous communication terminal points
are provided for maintenance and operation personnel to use along the path. A
second pair is used to carry intrusion alarm information back to the central
office from the regenerator site. The third pair is a spare.
The "locate wire" acts as an aid in determining the location of the fiber
cable using a standard locate device (designed to locate a metal cable).
A yellow, 6-inch (1S-cm) wide, fiberglass warning tape is placed along
with the locate wire at a depth of 2 feet (0.6 m). The message "Danger Fiber
Optic Cable Below" is imprinted on the warning tape.
Cable· Splices: The cable is spliced as required to connect standard length
sections and at tie points for connections with side traffic. Fusion type
splices are used. All splices are placed in a standard type of enclosure. The
enclosure is then placed in a concrete shell splice box. The entire assembly
is then placed underground with at least 24 inches (61 cm) of soil covering the
splice box lid. The splice box has an open bottom that allows sufficient
drainage for the splice enclosure to remain dry.
A "locate ring" is placed above the splice box as an aid in finding the
splice box after back filling of the site has taken place. The ring provides a
strong target for tracking with a standard cable-locator device.
Regenerator Site: The regenerator building is an aboveground structure
constructed of cinder blocks and concrete. Appendix D contains photographs and
information on a typical aboveground regenerator installation. Two rows of
concrete blocks are laid at the base of the walls and cinder blocks are placed
in rows above. The roof is constructed with a flat profile and a gentle slope.
The voids in the cinder blocks are filled with vermiculite to aid in
conservation of energy during heating and cooling. An electric-powered
~heating/cooling unit is installed to control the environment inside the
8

-~-~~---------~ - ~~- --~ ~~--- --~ -------_._-----
electronics room of the building. The doors are metal with rigid-foam
insulation between the metal layers.
The building is divided into two rooms: an auxiliary power unit resides
in one room along with the associated actuation and switchover equipment; the
regenerator electronics and the battery bank are located in the second room.
The system is designed so that the diesel motor and companion generator turn on
immediately when the primary power grid fails. The battery bank is included
for those circumstances when the power grid and the auxiliary power unit fail.
A minimum of 8 hours of backup energy is provided from the batteries. The
approximate current drain for the regenerator electronics is 3 amperes at
48 volts.
The regenerator building is situated on a concrete slab, poured with a
reinforcing grid of rebar placed approximately 6 inches (lS-cm) apart. A
chain-link security fence with barbed-wire crown surrounds the building and a
small parking area adjacent to the building. The fiber optic cable entry and
egress is through the floor near [approximately 2 feet (0.6 m)] a building
corner. A 4-inch (lO-cm) diameter polyethylene conduit surrounds the inner
duct and fiber optic cable assembly from about 4 feet (1.2 m) outside the
building through the entry/exit of the building and to the ceiling inside the
regenerator structure.
2.4 Stress Analysis: Colorado Springs-to-Pueblo Link
The objective of this section is to note the features of the installed
system that are beneficial for a "hard" installation. A system is considered
to be "hardened" when protective features (enhancements) are added to the
facility design or installation, allowing it to withstand nuclear effects or
natural disaster. The protection level denotes the extent of application of
the possible protective features (enhancements). Table 1 is included to show
the relationship of hardness level, protection level, and physical properties
of a system.
A result of this analysis will be to assist in generating a list of
enhancements that will be necessary to increase the hardness to a Level 4
(Maximum) hardness installation. The HEMP hardness Level S (Virtual) requires
that a completely redundant parallel fiber optic path or link exist. This
issue is not be addressed in this study.
9

Table 1. Hardness Level as it Relates to Protection Level
Hardness Level Physical Properties Protection Level
1 Surface/Aerial Minimum
2 Surface with Conduit Moderateor Underground[1-2 ft (0.3-0.6 m)]
3 Underground Significant[3 ft (0.9 m)]
4 Underground Maximum[4 ft (1.2 m)]
5 Parallel Paths Virtual
Each major element of the link is analyzed separately. The hardness level
for each element is stated as determined by the Mulitier Specification. No
attempt is made to rate the level-of-hardness of the system asa link. The
assumption is made that the system hardness is determined by the element with
the lowest level-of-hardness.
2.4.1 Features That Contribute to the Hardness of Each Element
Fiber Optic Cable: The following features are beneficial in protecting the
link from naturally occurring and man-made stress. A short discussion of the
benefit of each feature is included. A more detailed discussion of the
enhancement is available in the Mulitier Specification and the background
information presented in that report.
1. All-dielectric cable - The elimination of all metal components from thefiber optic cable will reduce damage from bothHigh Altitude Electromagnetic Pulses (HEMP) andlightning strikes. The absence of metallic partsmakes it theoretically impossible for energy tocouple from HEMP and nearly impossible forlightning to cause damage. Damage could occurfrom lightning if the cable were placed near ametal obj ect that is struck by lightning. Theheat or explosion at the point-of-entry may causedamage to the fiber optic cable. Therefore caremust be taken when placing the cable, to ensurethat the cable is located a sufficient distanceaway from these objects.
10

2. Placement in conduit
3. Polyethylene sheath
4. Underground placement
This additional expense (some carriers areplacing the cable underground without a conduit)provides protection against rodents, damage dueto the pressure of rocks against the cable, rocksshifting position due to freeze/thaw cycles, etc.
- This provides excellent protection againstchemicals and moisture. The durable nature ofthis material also prevents dama&e to the fibersfrom minor abuse during placement that couldresult in punctures, cuts, bruises, etc.
- Placement at a depth of 48 inches (122 cm)locates the cable in an environment that isprotected from effects due to most events ofnature that occur on the surface of the Earth.Damage from agricultural diggings, constructiondiggings, etc., is minimized.
- Placement of the cable at the 48-inch (122-cm)depth provides substantial protection from gammaradiation. The actual absorption factors arediscussed in the Mulitier Specificatiort.
- Placement of the cable at a depth of 48 inches(122 cm) reduces the effect of the HEMP field.If the cable were to contain metallic components,the effect from HEMP would be minimized becauseof the attenuation provided by the soil covering.Estimates of the actual attenuation are includedin the Mulitier Specification.
The design parameters of the cable and the physical parameters of the
installation meet the criteria of a Level 4 (Maximum) hardness level
installation.
Splice Box: The features that contribute to the protection of the cable and
the splice are described here.
1. Rigid splice box - Placement within a rigid structure providesphysical protection from naturally occurring andman-made events that may happen on the Earth'ssurface. The assembly of spliced fibers iscontained within a closure. However, due to thefragile nature of the fibers it is imperativethat the splice be protected from extrememechanical stress (e. g., vibration, compressionand tension stress, lateral and shear stress).Although the splice box is bottomless, if placedon a properly installed drainage pit, the splice
11

assembly will remain dry, reducing the rate ofdeterioration caused by moisture.
2. Watertight closure - The splice assembly, with the actual splicesplaced on a supporting tray, is surrounded by arigid closure. A typical closure is a two-pieceassembly. When the clamshell assembly is closed,it can be filled with a blocking compound and thetwo parts clamped or welded together. Theclosure provides a dry environment for theexposed fibers adjacent to the splices,minimizing deterioration due to moisture orchemicals.
The level of protection against naturally occurring events is enhanced by
the use of a splice box (rigid structure). This installation should withstand
total flooding for a short period of time. The watertight closure will ensure
protection of the splices. However, the 24-inch (61-cm) layer of soil above
the 4-inch (lO-cm) thick concrete lid of the splice box does not provide
adequate protection from gamma radiation or HEMP. The splice assembly
(including the splice box) meets the suggested criteria, as defined by the
Mulitier Specification, for a Level 2 (Moderate) hardness level.
Regenerator Site: The following features are beneficial in protecting and
increasing the survivability of the regenerator including the cable, splices,
patch panels, transmit/receive electronics, and other sensitive equipment that
is necessary for the regenerator station operation.
1. Security fence/locked building- These precautions reduce the danger of damage
from vandalism and sabotage.
fromSince
stream,
An elevated site provides protectionflooding that may occur in the vicinity.the regenerator is located near a maj orthe danger of local flooding is real.
2. Elevated building site
3-. Grounding practices The National Electrical Code for buildings isobserved and care has been taken to tie all metalmounting components within the building to groundpotential using copper-clad conductors (#00gauge) .
4. Backup power system A diesel motor/generator set ispower during those times when thegrid fails. The control systemthat the motor/generator willseconds of the absence of primary
provided forprimary power
is designed sostart within
power. During
12
5. Transient suppression
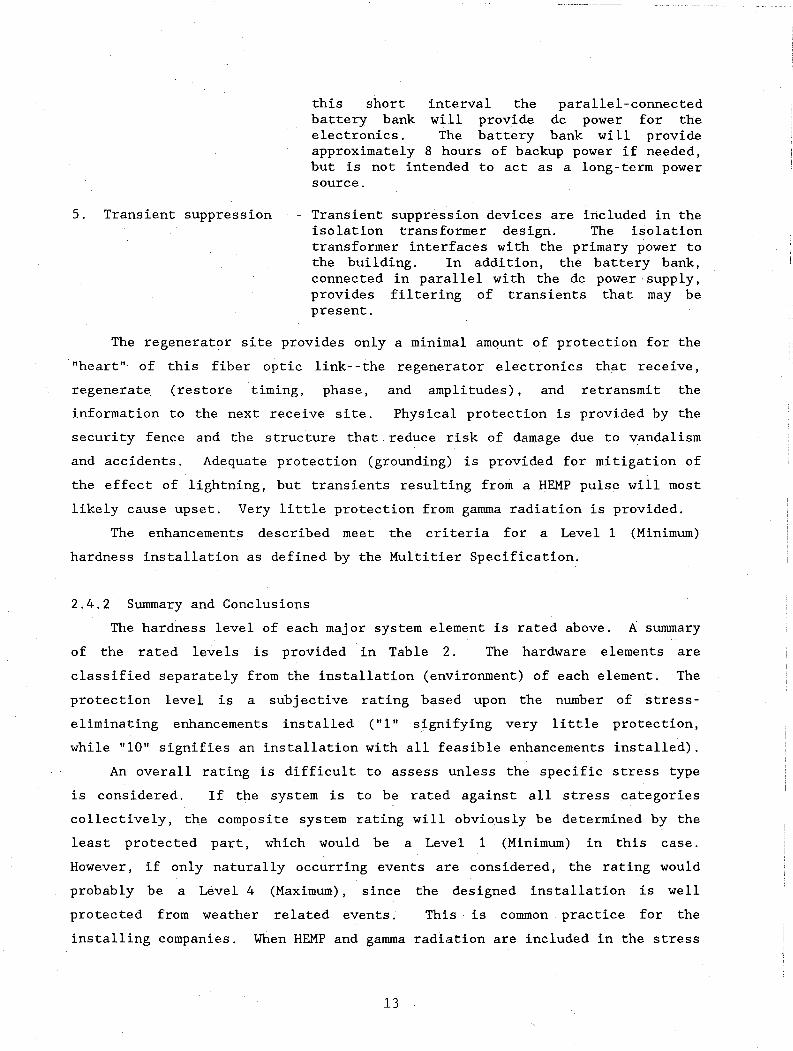
this short interval the parallel-connectedbattery bank will provide dc power for theelectronics. The battery bank will provideapproximately 8 hours of backup power if needed,but is not intended to act as a long-term powersource.
Transient suppression devices are included in theisolation transformer design. The isolationtransformer interfaces with the primary power tothe building. In addition, the battery bank,connected in parallel with the dc power supply,provides filtering of transients that may bepresent.
The regenerator site provides only a minimal amount of protection for the
"heart" of this fiber optic link- -the regenerator electronics that receive,
regenerate (restore timing, phase, and amplitudes), and retransmit the
information to the next receive site. Physical protection is provided by the
security fence and the structure that reduce risk of damage due to vandalism
and accidents. Adequate protection (grounding) is provided for mitigation of
the effect of lightning, but transients resulting from a HEMP pulse will most
likely cause upset. Very little protection from gamma radiation is provided.
The enhancements described meet the criteria for a Level 1 (Minimum)
hardness installation as defined by the Multitier Specification.
2.4.2 Summary and Conclusions
The hardness level of each major system element is rated above. A summary
of the rated levels is provided in Table 2. The hardware elements are
classified separately from the installation (environment) of each element. The
protection level is a subj ective rating based upon the number of stress
eliminating enhancements installed ("1" signifying very little protection,
while "10" signifies an installation with all feasible enhancements installed).
An overall rating is difficult to assess unless the specific stress type
is considered. If the system is to be rated against all stress categories
collectively, the composite system rating will obviously be determined by the
least protected part, which would be a Level 1 (Minimum) in this case.
However, if only naturally occurring events are considered, the rating would
probably be a Level 4 (Maximum), since the designed installation is well
protected from weather related events. This is common practice for the
installing companies. When HEMP and gamma radiation are included in the stress
13

matrix, the rated hardness level drops to Levell (Minimum). We then conclude
that, without a definition of stress threat, a protection level rating must be
based on the resistance to all types of stress. This fiber optic system would
than be rated as a Level 1 (Minimum) protected system.
Table 2. Multitier Specification Level of Protection for theSpecific System being Studied
System Element/Task Protection Level
Fiber Optic Cable 4Splice 4Splice Box 4Regenerator Electronics 3Regenerator Enclosure 1Cable Installation 4Splice Installation 2Regenerator EnclosureInstallation 3
3. HARDENING ENHANCEMENTS
The objective of this study is to verify the feasibility of the Mulitier
Specification to classify and specify the hardness of a fiber optic
telecommunication system. An example of system classification has been
completed using the Mountain Bell fiber optic link from Colorado Springs, CO,
to Pueblo, CO. As stated earlier, the Mountain Bell installed system will be
upgraded (on paper) to a Level 4 (Maximum) hardness system. Proposed
enhancements, discussed in this section, will be recommended to modify the
design or installation and as a result, to provide a Level 4 (Maximum) hardened
link.
3.1 Selective Hardening: Benefits and Limitations
The magnitude and type of stress may not always be the same on the entire
link. Separating the system into major elements allows us to apply different
conditions to each component. The hardening enhancements can be added in the
same manner. The result is that each element can be select~vely hardened to
meet the local threat.
For purposes of this report, we assume that the same threat exists along
the entire route, i.e., all elements will see the same stress level and stress
14

types. The stress levels defined for Level 4 (Maximum) will be used to
determine what enhancements are needed to upgrade each maj or element to a
Level 4 (Maximum) hardened system as defined in the Mulitier Specification.
3.2 Cable Upgrade Enhancements Required
The cable design used by Mountain Bellon the sample route meets the
requirements of the Mulitier Specification for a Level 4 (Maximum) hardened
system. Three attributes fulfill this requirement:
1. use of an all-dielectric cable2. use of a rodent-resistant cable sheath or conduit3. the burial of the cable to a depth of 48 inches (122 cm)
All of these items have been implemented by Mountain Bell. The only
concern is that the diameter of the conduit used as protection against rodents
is less than the 2.1-inch (5. 3-cm) diameter minimum requirement for rodent
protection (See Section 4.2.8 of the Multitier Specification). Mountain Bell
has not experienced· a problem with its 1.33-inch (3. 7-cm) outside diameter
configuration.
The following enhancements would be required to fully comply with the
Level 4 (Maximum), Multitier Specification recommendations:
1. Increase the conduit size to at least 2.1 inches (5.3 cm) toensure rodent protection.
2. No earthquake protection is required since this is not in a highrisk area.
3.3 Regenerator Upgrade Enhancements Required
The Regenerator Site, as installed by Mountain Bell, meets the criteria of
a Level 1 (Minimum) hardened sys tern as specified by the Multitier
Specification. The following features determine this classification:
1. The regenerator enclosure (building) is located at ground level.
2. The enclosure structure is fabricated of cinder blocks withoutreinforcement. This is equivalent to a reinforced wood framestructure.
3. Limited protection from fire (prairie fire, accidents, etc.) isprovided by the concrete and cinder block construction.
4. Very little gamma radiation protection is provided by the cinderblock structure.
15

5. Protection from HEMP is minimal. The present structure providesnegligible protection.
6. The regenerator electronicscoupling by a HEMP box,enhanced grounding.
assembly is not protected from HEMPtransient protection devices, or
7. Minimal earthquake protection is provided by the regeneratorbuilding installation.
The above features limit the stress resistance of the regenerator
installation. This installation appears to be very appropriate for a
commercial installation located in this part of the United States. The
structure provides more than adequate protection from the expected types and
magnitudes of naturally occurring stress in this locality.
The upgrade of this regenerator site to a Level 4 (Maximum) hardness
installation will require the following features and enhancements:
1. An underground structure with at least 48 inches (122 cm) ofsoil covering the entire structure will be necessary. If anaccess is required for maintenance and for ventilation, theplacement of the sensitive equipment (fiber optic cable,regenerator electronics, and other equipment using semiconductordevices) within the structure must be such that 48 inches(122 cm) of soil or equivalent shield will be in the path of agamma radiation source. The access port and the ventilationtower must extend above ground level a sufficient distance toavoid filling of the structure with water due to flooding thatmay flow over or around the site.
2. Transient protection of at least three stages must be installedas defined by the Multitier Specification.
3. An effective electrical grounding system must be installed forthe re'generator site and the systems within the enclosure (SeeMultitier Specification Section 4.8).
4. The emergency power source capability should be extended toprovide at least 14 days of backup power.
Placing the regenerator structure underground, at a 48-inch (122-cm)
depth, will provide adequate protection from gamma radiation. See the
Multitier Specification for the approximate absorption factors. Appendix E
contains photographs and further information on a typical underground
controlled-environment vault (CEV) regenerator installation. Implementation of
an effective ground (See Multitier Specification Section 4.8) for the
regenerator site and the equipment inside the enclosure, along with
16

installation of three stages of transient protection devices, will provide
adequate protection from HEMP and lightning.
Since the locality of this installation does not have a high earthquake
risk (See Section 4.4.3 of the Multitier Specification), the special features
for protection against extreme earthquake may not be needed. An analysis of
the structural strength of the foundation and the structure using the data
provided in the Multitier Specification should be done to ensure that the
regenerator site will withstand an earthquake projected to a 100 year "Return
Period."
Extending the backup power capability to 14 days may be as simple as
adding more fuel capacity. Caution must be taken when expanding the capacity
since the volume of fuel may increase the risk of fire. increase the system
susceptibility by increasing the risk of collapse of the fuel tank due to
nuclear blast overpressure conditions, or increase the risk of rupture due to
earthquake. An alternate power source may be in order if the expansion is not
feasible or is too costly.
3.4 Splice Box Upgrade Enhancements Required
The splice box, as installed, is basically a very good installation except
for the depth of burial. The poured concrete box structure should withstand
any naturally occurring event, i.e., weather conditions, earthquakes (expected
for this area of the United States), wet or dry conditions, and accidents.
The enhancement required to increase the level of protection to Level 4
(Maximum) hardness is to increase the burial depth to 48 inches (122 cm).
The present installation, used by Mountain Bell, is entirely adequate for
protection from all expected naturally occurring events such as weather or
accidents. Typically there are about 60 feet (18.3 m) of slack cable coiled in
each splice box. The depth of soil covering the 4-inch (lO-cm) thick concrete
splice box lid is approximately 2 feet (0.61 m). This provides less than full
protection from gamma radiation. The threat from HEMP is not a concern because
there are no metallic components within the splice box. The accumulation of
effects from gamma radiation, at each splice, would result in a substantial
erosion of the design margin (excess available power above the errorless
detection level).
17
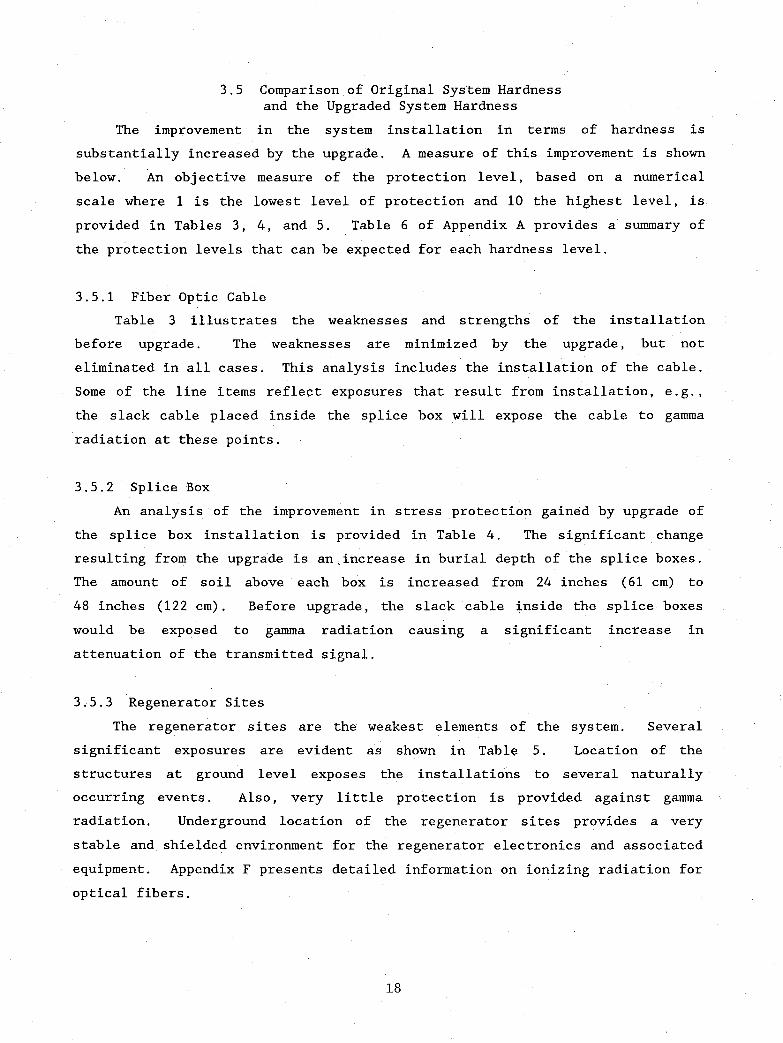
3.5 Comparison of Original System Hardnessand the Upgraded System Hardness
The improvement in the system installation in terms of hardness is
substantially increased by the upgrade. A measure of this improvement is shown
below. An obj ective measure of the protection level, based on a numerical
scale where 1 is the lowest level of protection and 10 the highest level, is
provided in Tables 3, 4, and 5. Table 6 of Appendix A provides a summary of
the protection levels that can be expected for each hardness level.
3.5.1 Fiber Optic Cable
Table 3 illustrates the weaknesses and strengths of the installation
before upgrade. The weaknesses are minimized by the upgrade, but not
eliminated in all cases. This analysis includes the installation of the cable.
Some of the line items reflect exposures that result from installation, e.g.,
the slack cable placed inside the splice box will expose the cable to gamma
radiation at these points.
3.5.2 Splice Box
An analysis of the improvement in stress protection gained by upgrade of
the splice box installation is provided in Table 4. The significant change
resulting from the upgrade is an,increase in burial depth of the splice boxes.
The amount of soil above each box is increased from 24 inches (61 cm) to
48 inches (122 cm). Before upgrade, the slack cable inside the splice boxes
would be exposed to gamma radiation causing a significant increase in
attenuation of the transmitted signal.
3.5.3 Regenerator Sites
The regenerator sites are the weakest elements of the system. Several
significant exposures are evident as shown in Table 5. Location of the
structures at ground level exposes the installations to several naturally
occurring events. Also, very little protection is provided against gamma
radiation. Underground location of the regenerator sites provides a very
stable and shielded environment for the regenerator electronics and associated
equipment. Appendix F presents detailed information on ionizing radiation for
optical fibers.
18
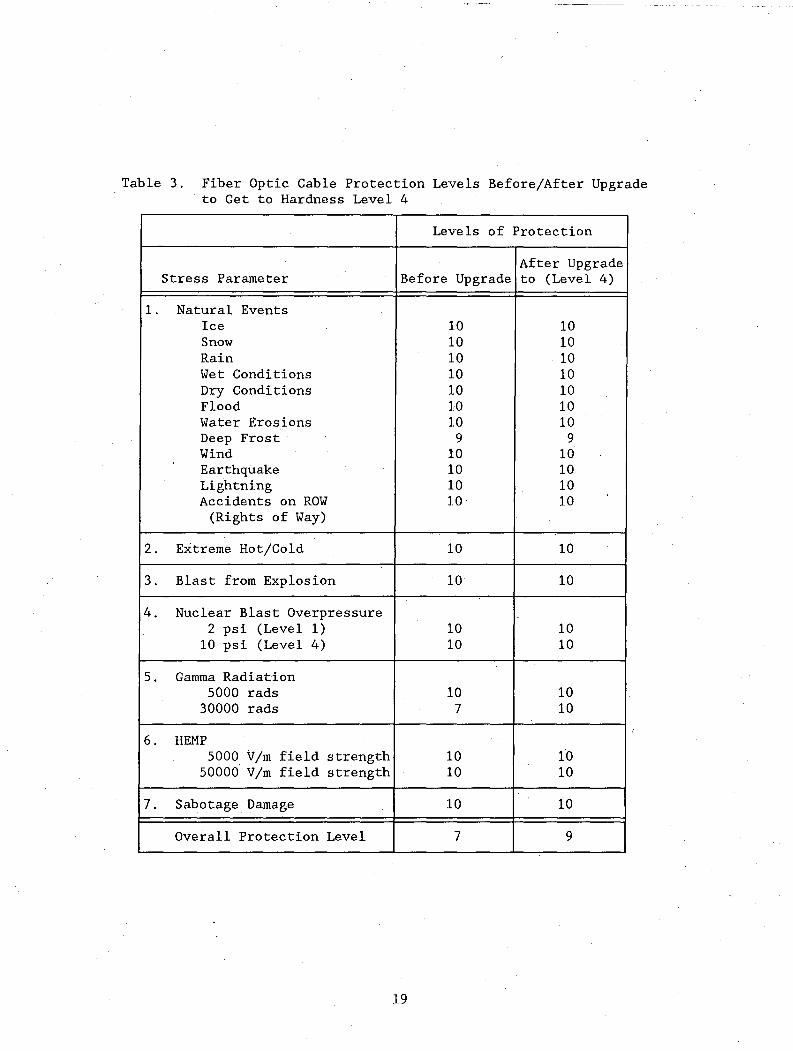
Table 3. Fiber Optic Cable Protection Levels Before/After Upgradeto Get to Hardness Level 4
Levels of Protection
After UpgradeStress Parameter Before Upgrade to (Level 4)
1. Natural EventsIce 10 10Snow 10 10Rain 10 10Wet Conditions 10 10Dry Conditions 10 10Flood 10 10Water Erosions 10 10Deep Frost 9 9Wind 10 10Earthquake 10 10Lightning 10 10Accidents on ROW 10 10
(Rights of Way)
2. Extreme Hot/Cold 10 10
3. Blast from Explosion 10 10
4. Nuclear Blast Overpressure2 psi (Level 1) 10 10
10 psi (Level 4) 10 10
5. Gamma Radiation5000 rads 10 10
30000 rads 7 10
6. HEMP5000 Vim field strength 10 10
50000 Vim field strength 10 10
7. Sabotage Damage 10 10
Overall Protection Level 7 9
19

Table 4. Splice Box Protection Levels Before/After Upgradeto Get to Hardness Level 4
Levels of Protection
After UpgradeStress Parameter Before Upgrade to (Level 4)
1. Natural EventsIce 10 10Snow 10 10Rain 10 10Wet Conditions 10 10Dry Conditions 10 10Flood 10 10
Water Erosions 10 10Deep Frost 10 10Wind 10 10Earthquake 10 10Lightning 10 10Accidents on ROW 10 10
2. Extreme Hot/Cold 10 10
3. Blast from Explosion 10 10
4. Nuclear Blast Overpressure2 psi (Levell) 10 10
10 psi (Level 4) 10 10
5. Gamma Radiation5000 rads 10 10
30000 rads 7 10
6. HEMP5000 Vim field strength 10 10
50000 Vim field strength 10 10
7. Sabotage Damage 10 10
Overall Protection Level 7 10
20

Table 5. Regenerator Site Protection Levels Before/After Upgradeto Get to Hardness Level 4
Levels of Protection
After UpgradeStress Parameter Before Upgrade to (Level 4)
l. Natural EventsIce 10 10Snow 10 10Rain 10 10Wet Conditions 10 9Dry Conditions 10 10Flood 10 8Water Erosions 10 10Deep Frost 10 10Wind 8 10Earthquake 8 9Lightning 10 10Accidents on ROW 9 10
2. Extreme Hot/Cold 10 10
3. Blast from Explosion 6 10
4. Nuclear Blast Overpressure2 psi (Levell) 10 10
10 psi (Level 4) 2 10
5. Gamma Radiation5000 rads 1 10
30000 rads 1 10
6. HEMP5000 Vim field strength 1 10
50000 Vim field strength 1 10
7. Sabotage Damage 7 10
Overall Protection Level 1 10
21

3.6 FIBRAM aER Analysis of Original and Upgraded System
In a recent NTIA/NCS report, W. Ingram describes a computer program
(FIBRAM) that models the attenuation of optical fibers after simulated exposure
to fallout gamma radiation (Ingram, 1987). FIBRAM can be used to estimate the
changes in bit error ratio (BER) in response to a variance in the intensity of
exposed radiation, the transmit power level, and/or the physical configuration
of the fiber link. Further examples of the application of FIBRAM appear in
Appendix G (Section G.3).
FIBRAM is used in this report to simulate gamma radiation exposure to the
system described in this report and shown in Figure 1. The bit error ratios
(BERs) are calculated for the current (original) system variables and for the
upgraded variables. These variables are shown in Tables 6 and 7.
Section number 1 in Tables 6 and 7 represents 42 miles (67.6 km) of
optical fiber that is covered with at least 4 feet (122 cm) of soil. The
protection factor is 7,000 for both the original and upgraded systems. Section
number 2 in the tables represents 2 miles (3.2 kms) of optical fiber that is
buried 2 feet (0.6 m) underground and covered with a concrete cap. Its
protection factor is increased from 50 (original) to 7,000 (upgraded) due to
better protection for the cable splice enclosures. Section number 3 in the
tables represents the photodiodes in the regenerator stations. Its protection
factor is increased from 10 (original) to 7,000 (upgraded) because the improved
regenerator stations are buried at least 48 inches (122 cm) underground.
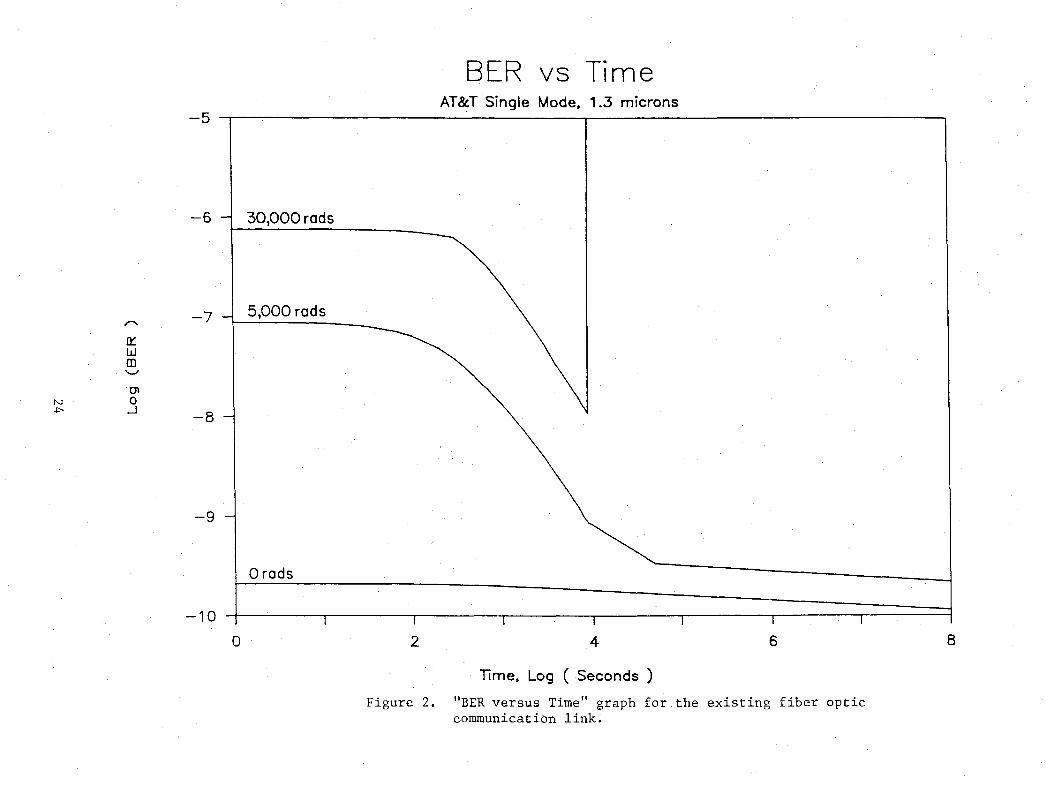
The bit error ratios (BERs) of both the original and the upgraded systems
are calculated in response to fallout levels of 0; 5,000; and 30,000 rads. The
results are shown in Figures 2 and 3. It should be noted that in Figure 2, the
curve representing 30,000 rads has a sharp upward slope at around 104 seconds.
This is due to the failure of the photodiode receiver rather than the optical
fiber. If the photodiode had not failed, the fiber would have traced a
recovery curve similar to the 5,000-rads curve.
4. PROJECTED STRESS PARAMETERS
The maximum stress threat parameters expected for the Mountain Bell path
are included below. These parameters are extracted from the Multitier
Specification, where such parameters have been treated in the specification and
projected based upon the stressful activity for this area of the country and
typical weather-generated stress along the route. The engineering/maintenance
22

Table 6. Data Used for Unhardened System
Section Protection Fiber Type Length Intrins. LossNumber Factor (meters) (dB/km)
1 7000 SM, 1.3J.lm 67600 0.3802 50 SM, 1.3J.lm 3220 0.3803 10 n/a photodiode n/a
Other Data. Total Transmit Power 0.16 mw1
Max. Gamma for Photodiode 1500 radsRegenerator Type llD/llE/llFFiber Manufacturer AT&T
Table 7. Data Used for Upgraded System
Section Protection Fiber Type Length Intrins. LossNumber Factor (meters) (dB/km)
1 7000 SM, 1.3JLm 67600 0.3802 7000 SM, 1.3J.lm 3220 0.3803 7000 n/a photodiode n/a
Other DataTotal Transmit Power 0.16 mw1
Max. Gamma for Photodiode 1500 radsRegenerator Type llD/llE/llFFiber Manufacturer AT&T
1 This value includes 45 cable splices with. an average power loss of 0.2 dBeach. It also includes two regenerator stations with an average power gain of6.5 dB each.
23
-5
.,-6 -l 30,000 rods
BER vs TimeAT&T Single Mode, 1.3 microns
,-.,. -7 -l 5,000 rods
~wm'-J
01N a-l>- ..J -8
-9
Orods
-10
o 2 4
lime, Log ( Seconds )
6 8
Figure 2. "BER versus Time" graph for the existing fiber opticcommunication link.

-5
-6 -
-7 -,-....
n:::wm'-'
0'1N 0lJ1
~ -8 -
BER vs TimeAT&T Single Mode, 1.3 microns
30000rads5000rads
Orads
-9 --1 ' \
~ \
tI
8
II
6
I-10 -I I
4
II
20
Time, Log ( Seconds)
Figure 3. "BER versus Time" graph for the upgraded fiber opticcommunication link.
personnel responsible for the route have been consulted for an estimate of the
stress when the parameters are not available in the Multitier Specification.
4.1 Man-Made Events
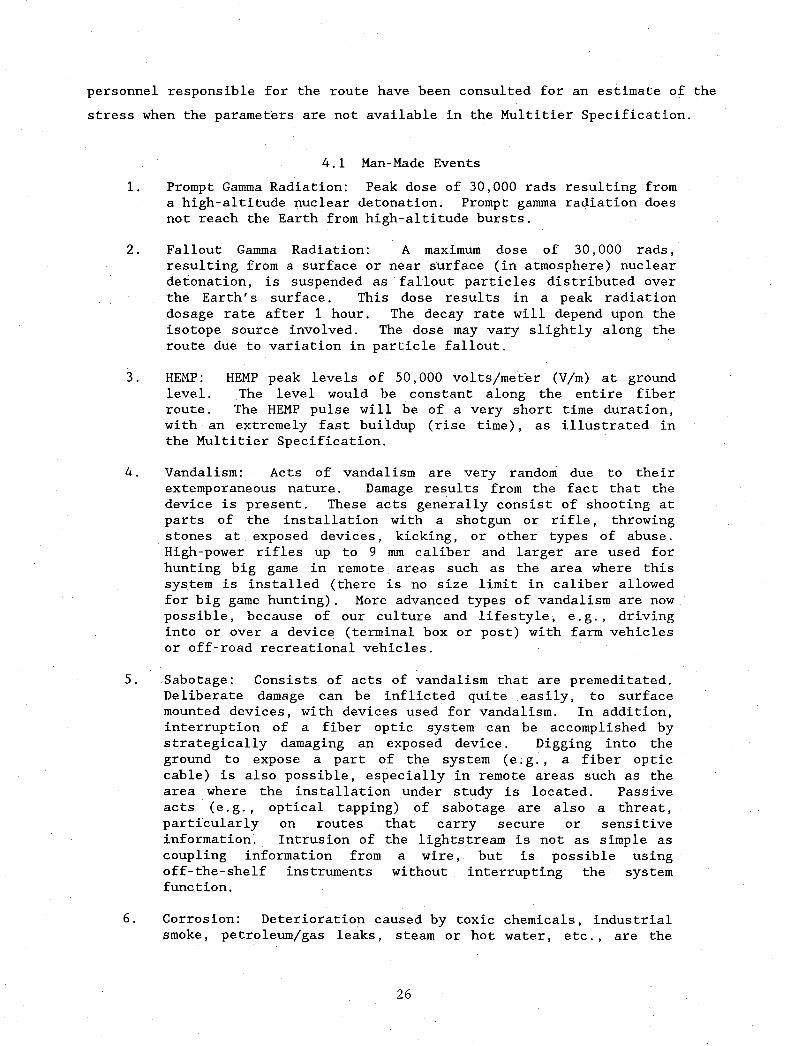
1. Prompt Gamma Radiation: Peak dose of· 30,000 rads resulting froma high-altitude nuclear detonation. Prompt gamma radiation doesnot reach the Earth from high-altitude bursts.
2. Fallout Gamma Radiation: A maximum dose of 30,000 rads,resulting from a surface or near surface (in atmosphere) nucleardetonation, is suspended as fallout particles distributed overthe Earth's surface. This dose results in a peak radiationdosage rate after 1 hour. The decay rate will depend upon theisotope source involved. The dose may vary slightly along theroute due to variation in particle fallout.
3. HEMP: HEMP peak levels of 50,000 volts/meter (V/m) at groundlevel. The level would be constant along the entire fiberroute. The HEMP pulse will be of a very short time duration,with an extremely fast buildup (rise time), as illustrated inthe Multitier Specification.
4. Vandalism: Acts of vandalism are very random due to theirextemporaneous nature. Damage results from the fact that thedevice is present. These acts generally consist of shooting atparts of the installation with a shotgun or rifle, throwingstones at exposed devices, kicking, or other types of abuse.High-power rifles up to 9 mm caliber and larger are used forhunting big game in remote areas such as the area where thissystem is installed (there is no size limit in caliber allowedfor big game hunting). More advanced types of vandalism are nowpossible, because of our culture and lifestyle, e.g., drivinginto or over a device (terminal box or post) with farm vehiclesor off-road recreational vehicles.
5. Sabotage: Consists of acts of vandalism that are premeditated.Deliberate damage can be inflicted quite easily, to surfacemounted devices, with devices used for vandalism. In addition,interruption of a fiber optic system can be accomplished bystrategically damaging an exposed device. Digging into theground to expose a part of the system (e; g., a fiber opticcable) is also possible, especially in remote areas such as thearea where the installation under study is located. Passiveacts (e.g., optical tapping) of sabotage are also a threat,particularly on routes that carry secure or sensitiveinformation. Intrusion of the lightstream is not as simple ascoupling information from a wire, but is possible usingoff-the-shelf instruments without interrupting the systemfunction.
6. Corrosion: Deterioration caused by toxic chemicals, industrialsmoke, petroleum/gas leaks, steam or hot water, etc., are the
26
main causes. Long term exposure to ultraviolet radiation willalso cause a type of deterioration. The possibility of placingthe fiber optic cable near a deposit of radioactive material isalso a concern. The material can be a result of an industrialdump or accident.·
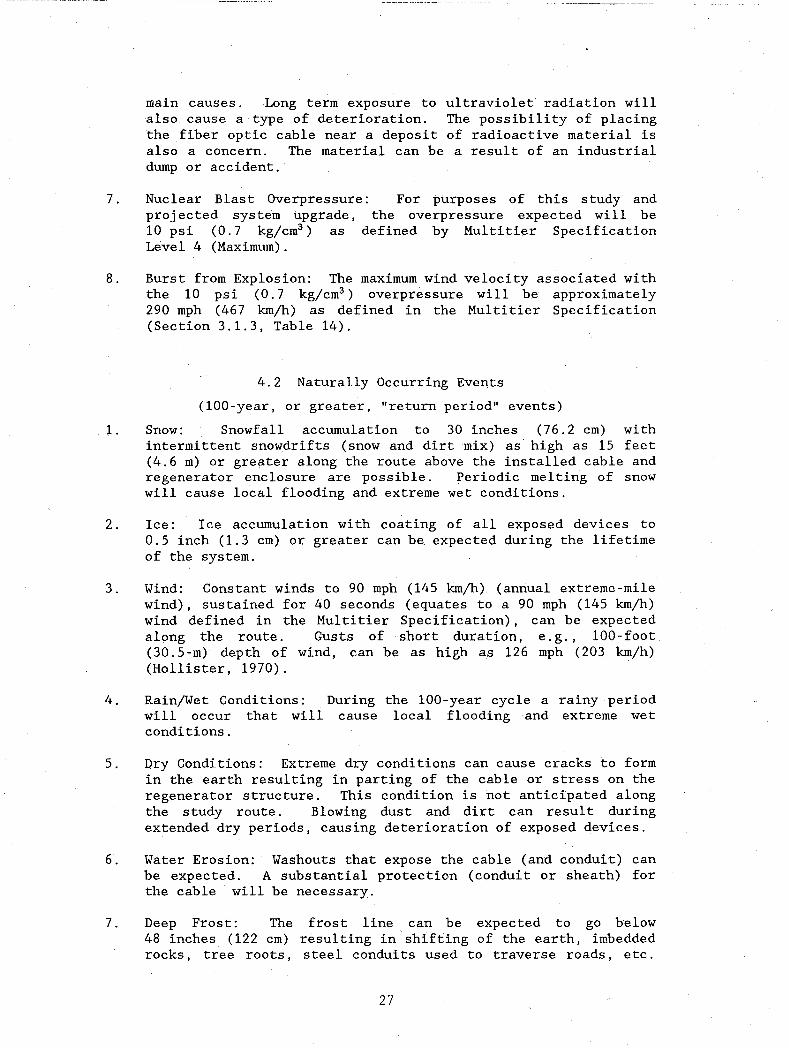
7. Nuclear Blast Overpressure: For purposes of this study andproj ected system upgrade, the overpressure expected will be10 psi (0.7 kg/cm3 ) as defined by Multitier SpecificationLevel 4 (Maximum).
8. Burst from Explosion: The maximum wind velocity associated withthe 10 psi (0.7 kg/cm3 ) overpressure will be approximately290 mph (467 kmjh) as defined in the Multitier Specification(Section 3.1.3, Table 14).
4.2 Naturally Occurring Events
(lOa-year, or greater, "return period" events)
1. Snow: Snowfall accumulation to 30 inches (76.2 cm) withintermittent snowdrifts (snow and dir1: mix) as high as 15 feet(4.6 m) or greater along the route above the installed cable andregenerator enclosure are possible. Periodic melting of snowwill cause local flooding and extreme wet conditions.
2. Ice: Ice accumulation with coating of all exposed devices to0.5 inch (1. 3 cm) or greater can be expected during the lifetimeof the system.
3. Wind: Constant winds to 90 mph (145 kmjh) (annual extreme-milewind), sustained for 40 seconds (equates to a 90 mph (145 kmjh)wind defined in the Multitier Specification), can be expectedalong the route. Gusts of short duration, e.g., 100-foot(30.5-m) depth of wind, can be as high as 126 mph (203 km/h)(Hollister, 1970).
4. RainjWet Conditions: During the lOa-year cycle a rainy periodwill occur that will cause local flooding and extreme wetconditions.
5. Dry Conditions: Extreme dry conditions can cause cracks to formin the earth resulting in parting of the cable or stress on theregenerator structure. This condition is not anticipated alongthe study route. Blowing dus t and dirt can resul t duringextended dry periods, causing deterioration of exposed devices.
6. Water Erosion: Washouts that expose the cable (and conduit) canbe expected. A substantial protection (conduit or sheath) forthe cable will be necessary.
7. Deep Frost: The frost line can be expected to go below48 inches (122 cm) resulting in shifting of the earth, imbeddedrocks, tree roots, steel conduits used to traverse roads, etc.
27

Lateral pressure on the cable could result along with thepossibility of shear, compression and tension.
8. Earthquake: The study link is in a very risk-free area of theUnited States as illustrated by the data made available in theMultitier Specification (See Section 4.4.3). The horizontalvelocity of the Earth's surface material is not expected toexceed 2 cm/s (0.78 in/s).
9. Lightning: The path of the study link lies in an area ofColorado where the lightning exposure factor is high. Theexposure factor is a product of soil resistivity and the numberof thunderstorm days. The high resistivity/in the area causesthe factor to be higher. The Multitier Specification(Section 4.7.1) shows a "lightning exposure factor" of 600-1,000for the area. A typical normal lightning exposure factor is inthe range of up to 600.
10. Accidents on rights-of-way: The fiber optic path is not along amajor thoroughfare or railroad. The risk of accidents should besmall.
11. Extreme Hot/Cold: The extremes for the location of this linkwill be between -48 of (-26.7 °C) and 112 of (44.4 °C) for theair temperature above the surface. The actual surfacetemperature, as noted by the Multitier Specification will be aslow as -52 OF (-28.9 °C) and as high as 122 of (50.0 °C) due tosurface phenomenon.
5. RESTORABILITY OF AN OPTICAL FIBER LINK
Optical fiber links can carry hundreds or thousands of calls at a time.
Regenerator stations serve to regenerate the optical signal. If one of these
elements fails, communication along that route is severed. The causes of such
failures usually come from one of the following categories:
1. power supply failure2. element failure3. optical fiber degradation
Power supply problems can usually be prevented by the judicious use of an
uninterruptible power supply (UPS). This is described in Appendix G
(Section G.l). Element failure can normally be circumvented by the use of
on-line spare parts that can be switched into the network. This issue is
addressed in Appendix G (Section G.3). Optical fiber degradation is caused by
exposure to radiation, but can be muted by hardening of the fiber and by
attenuating the radiation before it strikes the fiber. This is also described
in Appendix G (Section G.3).
28

6. COST OF ENHANCEMENTS
The mechanics of this study involve the analysis of an actual fiber optic
telecommunication link between two major cities and two smaller cities in
Colorado. We have attempted to make this a practical analysis rather than a
theoretical treatise. As a result, the information presented should be helpful
to numerous fiber optic companies and Government agencies. The objectives for
this study are
1. to estimate the cost to upgrade the protection level of thesystem
2. to project the least cost for the upgrade3. to show cost feasibility of the upgrade.
All three of these objectives will be dealt with in this section of the
report. The costs will be estimated for the particular installation being
studied and may not apply to all installations, e.g., if this same installation
were located in another geographic area where the stress risks are not the
same, the costs would differ. The intensity of stress for a particular
locality will vary as illustrated in the Multitier Specification. The specific
stresses that are expected for the path studied in this report have been
addressed.
6.1 Cable Placement Upgrade Costs
The enhancements required to upgrade the system to a Level 4 (Maximum)
hardness are suggested in Section 3.2 of this report. A cost estimate for
retrofitting the installation with these enhancements is included below.
Estimates of the cost differential of the system enhancement during initial
installation are also presented. It is recognized that sometimes the cost to
retrofit a system is greater than if enhancements are done as part of a new
installation.
Upgrade of the cable and cable installation is based upon the best
information available concerning the deficiency area. For example, according
to referenced literature a protective conduit at least 2.1 inches (5.3 cm) in
diameter around the cable should be used to repel gophers and ensure adequate
protection (Connelly and Cogelia, 1970). Recent data obtained from tests
performed at Colorado State University, by Dr. Bruce A. Wunder, indicates that
a 1.25 inch (outside diameter) conduit is probably sufficient protection in
most installations. However, there is insufficient evidence to conclude that
29

the 1.25 inch diameter conduit will provide complete protection against
rodents.
Mountain Bell decided to place the cable at a depth of 48 inches (122 cm).
The company could have saved some money if they had placed the cable at a
shallower depth, but the risk of damage and upset wo.uld increase significantly.
Table 8 illustrates the cost differential for three common depths for the
entire 44-mile (70.8-km) route. These cost estimates are typical and are
representative of the 1987 competitive market.
Table 8. Cable Placement Cost Analysis
Depth Installation Cost/Foot(Meter) Total Route Placement Cost
2 ft (0.6 m) $0.67 ($2.20) $156K3 ft (0.9 m) $1.00 ($3.28) $232K4 ft (1. 2 m) $1.50 ($4.92) $348K
6.2 Regenerator Installation Cost Analysis
The goal of this study is to provide the information necessary to ensure a
Level 4 (Maximum) hardness fiber optic regenerator installation. This analysis
will consist of two separate cost options: the cost of renovating the existing
installation, and the cost differentials resulting when implementing a new
installation. These cost estimates have been offered by representatives of
Mountain Bell (and the authors) and are considered to be accurate to within
10 percent.
6.2.1 Cost to Upgrade
The existing regenerator enclosures (buildings) are constructed at ground
level as described in Section 2.3 of this report. Upgrade of the regenerator
installations to meet the Level 4 (Maximum) criterion will require replacement
of the enclosures with underground CEVs as described in Section 3.3. Since
there are two regenerators, the upgrade will include replacement. of both
structures. The existing structure will still be required to house the backup
power generators and will need appropriate modifications. In addition, the
recommended transient protection and grounding system must be implemented as
suggested in the Multitier Specification.
30
Costs necessary to expand the

capability of the emergency power source to a capacity of 14 days will be
included.
The fiber optic transmit/receive electronics can be transferred to the new
underground structure without modification or additional cost. Placing the
electronics away from the entry hatch will be necessary to avoid exposure to
gamma radiation as discussed in Section 3.3. No additional cost will result
from these design considerations. Table 9 illustrates the estimated costs to
upgrade the existing regenerator installation.
Table 9. Estimated Costs to Upgrade the Two Regenerator Installations
System Element or Task Upgrade Cost ($K)
1. Regenerator enclosures(CEVs installed) 140
2. Installation of transient protection devicesand grounding system 10
3. Expansion of backup power system to 14 days 14
Total 164
6.2.2 Cost to Harden a New Installation
The additional costs to provide a Level 4 (Maximum) (as compared to a
typical installation such as the existing Colorado Springs to Pueblo link)
hardened regenerator are
1.2.
3.
the cost of additional transient protection and earththe additional cost of an underground regenerator(CEV)the costs of extending the emergency power to 14 days
groundsenclosure
The costs for a surface mounted regenerator enclosure and a CEV are about
equal if made part of the initial design. Installation costs are included.
For a new installation, the differential cost for extending the emergency power
to 14 days is the same as quoted for the upgrade. Table 10 illustrates the
estimated costs required to harden the regenerator site during initial
installation.
31

Table 10. Estimated Costs for Hardening the Two Regenerator SitesDuring Initial Installation
ApproximateSystem Element/Task Added Cost ($K)
l. Regenerator enclosure(CEVs installed) Negligible
2. Installation of transient protection device~
and grounding system 10
3. Expansion of backup power to 14 days 14
Total 24
6.3 Cost of Splice Boxes (Handholds)
The cost of commercially available fiberglass splice boxes is typically
$1,100. Concrete splice boxes were used in the fiber optic telecommunication
link being analyzed ih this document. Concrete splice boxes fabricated locally
cost $250 each. Typical boxes are 56 inches (l42 cm) long and 24 inches
(61 cm) wide and deep with 4-inch (lO-cm) thick concrete walls and lids. They
are installed with a minimum of 24 inches (61 cm) of soil covering the lid.
The boxes are placed on a 1-foot (30-cm) thick bed of gravel to prevent
settling and accumulation of condensation. Approximately 30 feet (9.1 m) of
slack fiber optic cable (on each side of the splice) are contained in each
splice box. This provides ample spare cable to perform a splice in a nearby
van-mounted work space.
There are 45 splices in this link from Colorado Springs to Pueblo. It is
estimated that 30 splices are contained in buried splice boxes. These splice
boxes must be dug up and reburied to a depth of 4 feet (1.2 m) (without
disturbing the eXisting splices) in order to upgrade this portion of the system
to a Level 4 (Maximum) hardness . It is estimated that two persons with a
backhoe could perform this operation on each splice box in 2 hours. This
activity is estimated to cost $200 for each splice box, which would be a total
of approximately $6,000 for this portion of the system enhancement.
32

6.4 Summary of Costs to Upgrade the Fiber Optic Route
The estimated costs of upgrading the separate elements of the fiber optic
route under study in this document are summarized in Table 11. The costs of
upgrading the system elements to a Level 4 (Maximum) hardness are listed along
with the cost differential if the elements had been installed originally to
meet the Level 4 (Maximum) hardness. The incremental costs to upgrade or to
include enhancements in the original design are calculated and displayed in
Table 11. Column headings are lettered so that the results of the calculations
are clear to the reader. In some cases the cost of upgrading is minimal and
in other cases it is substantial. Some elements could have been installed to
attain hardness Level 4 (Maximum) originally with very little extra cost. For
the proj ected use of this commercial system, there is no need to install a
hardened system. The results of the analysis on the system in this document
are in no way intended to imply that the system is not installed properly or
adequately. The primary purpose of this document is to provide an example of
the application of the Mulitier Specification to an actual, existing commercial
fiber optic network that could carry NSEP traffic. The rights-of-way costs
have not been addressed in this study since they will not be affected by the
hardness level of the system. The original costs associated with the
regenerator electronics installed at the regenerator sites and the central
offices have not been addressed in this study since they will not significantly
affect the hardness level of the system.
The cost figures contained in Table 11 are based upon the specific details
of the system being studied.
the following assumptions:
1. Route design cost:
The actual dollar amounts were determined using
a. The total design cost includes equipment specification,special system design and layout for each regeneratorstation, and route layout.
b. A cost of $0. 30/foot ($0. 99/m) was used for determiningthis cost.
c. This cost will be within the 10 percent allowance fordesigning a "hard original" system.
d. Redesign costs of $10K will be required for upgrade of thesystem.
33

2. Cable material cost:
a. The cable base cost was $1.90/foot ($6.27/m) for 44 miles(70.8 km) of cable.
b. A sales tax and shipping cost overhead of 8 percent of thecable base cost was used to determine the total materialcost.
c. This cost will be the same for a "hard original" system.
3. Miscellaneous overhead costs:
a. This line item includes costs for several types ofmaterials including warning tape, posts to mark the route,warning signs along the route, special conduits needed toplace cable under obstacles, and other special feesincurred during the installation of the system.
b. A cost equal to 6 percent of the cable base cost was usedto determine this cost.
c. This cost will not change when installing a "hard original"system.
4. Cable placement and upgrade costs:
a. Original cable placement costs were $1.S0/foot ($4.92/m)for 44 miles (70.8 km).
b. The upgrade costs for cable not originally buried to the48-inch (122-cm) depth required can only be estimated atthis time. The actual costs to upgrade this portion canonly be determined at the time of installation due tovarying local conditions. Costs to uncover the originalcable and bury or otherwise protect it to the equivalent ofthe 48-inch (l22-cm) depth are estimated at $4. SO/foot($14.7S/m) for 2 miles (3.2 km).
c. The cost of installing the 2 miles (3.2 km) of obstructedcable in a hardened fashion originally is estimated to cost$3/foot ($9. 84/m) in addition to the $1. SO/foot ($4.92/m)unobstructed cable installation cost. Alternate routing ofthe cable during the original installation could havepossibly reduced this cost (depending upon rights-of-way,local obstacles, etc.).
5. Regenerator enclosure upgrade costs:
a. Typical existing buildings to enclose the two regeneratorstations are estimated to cost $60,000 each.
b. Prefabricated CEVs installed in the ground are estimated tocost $65,000 each.
34

c. The upgrade or enhancement costs are estimated as the costof installing two new CEVs and adding a cost of $5,000 eachto transfer the fibers and electronics to the CEVs from theoriginal buildings. The heating/cooling and operatingcosts associated with CEVs should actually be less thanthose costs for similar size conventional buildings.
Table 11. Summary of System Element Enhancements Required to Upgrade theEntire Fiber Optic Route (including both regenerator stations)to a Level 4 (Maximum) Hardness
Costs (in thousands of dollars)
A B A+B C (A+B)-C C-A
Differ. Differ.Between Between
System Upgrade Upgrade<:l HardElement of Upgraded Hard & Hard Orig. &
or Existing Existing Existing Original Original ExistingTask System System System System Systems Systems
1. Route Design 70 10 80 70 10 0
2. Cable Material 476 0 476 476 0 0
3. Misc. Overhead 26 0 26 26 0 0
4. Cable Placement 348 48 396 380 +16 +32
5. RegeneratorEnclosures 120 140 260 130 +130 +10
6. TransientProtection 0 10 10 10 0 +10
7. RegeneratorBackup Power 4 14 18 14 +4 +10Sources
8. Splice Boxes 7.5 0 7.5 7.5 0 0
9. Splice Box 6 6 12 8 +4 +2Installation
TOTALS 1057.5 228 1285.5 1121.5 +164 +64
Regenerator enclosure costs are based upon the fact that prefabricated
CEVs placed in the ground (ready for the installation of the regenerator
35

electronics and its associated equipment) cost approximately the same as an
aboveground building. Thus the cost of regenerator enclosures hardened to
Level 4 (Maximum) would add no significant additional cost during the original
system construction. The CEVs are less convenient for normal use, which is the
primary reason they were not installed in the system being studied here. Also
a hardened system is not required for this particular telecommunication link.
6. Transient protection costs:
a. The upgrade costs include $5,000 for installing transient(EMP and lightning) protection in each new regeneratorenclosure (CEV).
b. The costs for transient protection would be the same ifinstalled as part of the design for a hard original system.
7. Regenerator backup power source upgrade costs:
a. The cost of shielding the existing diesel-powered generatorfor HEMP hardening is estimated to be $5,000 for eachregenerator installation.
b. The cost of purchasing and installing500 gallon diesel fuel tank is estimatedeach regenerator installation.
(underground) ato be $2,000 for
8. Splice box (upgrade) costs:
a. The cost for concrete splice boxes is $250 at each of the30 splice locations.
b. The same splice boxes could be used for a hard originaldesign.
9. Splice box installation costs:
a. The cost of installing the 30 splice boxes in this linkoriginally is estimated to be $200 each.
b. The cost of uncovering these splice boxes and burying them2 feet (0.6 m) deeper (without disturbing the splices) isestimated to be $200 each.
c. The cost of installing the splice boxes at the 48-inch(122-cm) depth during the original system constructionphase is estimated to be approximately $67 each more thanat the 24-inch (61-cm) depth.
The information contained in Table 11 is based upon estimated costs of
labor and supplies in the local area at the time this document was produced.
These cost figures may not be appropriate for other locations and are subj ect
36

to normal inflation as time passes. The relative costs are significant since
they illustrate the benefits and economics of installing a hardened system
during its original construction phase.
Table 12 summarizes the cost of upgrade and the cost of installing a
hardened original system in percent of the original cost. The significant
result of this analysis is that a 6 percent additional cost during the original
installation would have produced a Level 4 (Maximum) hardened system (hard
original), while upgrading of the originally installed system would cost
22 percent more. The savings between an upgra,ded system and a hard original
system for the owner of the system would be $164K. The additional owner
investment for the original installation of a Level 4 (Maximum) hardened system
would be $64K, or 6 percent of the existing system cost.
Table 12. Summary of the Cost Ratios for Hardening of the Existing System
Cost of:
Upgrade of Upgraded HardCost Ratio Existing Existing Existing Original
Based on: System System System System
Costof - - 22% 122% 106%ExistingSystem
Cost ofUpgraded 82% 18% - - 87%ExistingSystem
Cost ofHard 94% 20% 115% - -OriginalSystem
7. SUMMARY
The Multitier Specification is applied to modify the hardness of an
existing fiber optic telecommunication link. This commercial link between two
major cities and two smaller cities in Colorado is considered to be an
37

essential NSEP link. This is due to its close proximity to the U. S. Space
Command/NORAD complex near Colorado Springs, Colorado. It is also due to the
fact that typically a large percentage of Government and military traffic is
carried on commercial systems.
An analysis of this fiber optic link was performed and the hardness level
of the system as it presently exists was assessed using the guidelines of the
Multitier Specification. The major elements of the system were studied
individually using the Multitier Specification to determine the existing
hardness level and the enhancements required to upgrade the link to a full
Level 4 (Maximum) hardness. This information is then used to estimate the cost
increments required to upgrade all portions of the system to this desired
hardness level. The particular enhancements were suggested such that minimal
costs would be incurred while achieving the desired system upgrade. These
costs were then tabulated and compared with the cost of the original system and
with the projected cost of the installation of a hardened system initially.
These estimates substantiate the fact that the hardening of a system during the
original installation is the most economical. However, for the system studied
here, the costs of the enhancements are quite reasonable, especially when
calculated on a per circuit-mile (circuit-kilometer) basis. Furthermore, this
application of the Multitier Specification illustrates the excellent cost
effectiveness of upgrading the existing system. Without this detailed
analysis, one might assume that the system enhancement costs would be so
excessive that a new hardened link should be installed. The analysis of the
particular fiber optic,link presented in this document clearly illustrates the
cost effectiveness and feasibility of enhancing this existing system to the
hardness Level 4 (Maximum).
8. CONCLUSIONS
The preceding cost analysis for the system enhancements required to
upgrade the telecommunication link to a hardness Level 4 (Maximum) has provided
some important information. Table 11 presents the estimated cost of upgrading
the entire link to hardness Level 4 (Maximum). These costs of approximately
$218K are 45 percent of the total original cost (approximately $0.5 million)
for the construction and installation of this 44-mile (70. 8-km) fiber optic
telecommunication link. Since this link contains 6 (4 active) fiber pairs
(each of which can carry approximately 6,048 circuits) the upgrade cost per
38

circuit-mile (circuit-kilometer) is very low. The actual circuit-mile
(circuit-kilometer) cost for the Level 4 (Maximum) enhancement to the
particular link described in this document is approximately $0.14 ($0.09). It
should be noted, however, that this figure is based upon the full capacity of
the system and not the current lesser use of the system. Also it should be
noted that the fiber optic cable is placed at the Level 4 (Maximum) hardness
depth [48 inches (122 cm)] over 95 percent of the route during the original
installation. This reduces the system upgrade costs significantly. An all
dielectric, single-mode, fiber optic cable was chosen for the original
installation of this system. This type of cable presents a definite economical
and technical (HEMP hardness) advantage for a hardness Level 4 (Maximum)
system. In addition the regenerator sites lend themselves to the underground
regenerator enclosure (CEV) retrofit. Likewise, the deeper burial of the
splice boxes should be a relatively inexpensive part of the system enhancement
due to the original routing of the link and the soil composition in the area.
Based upon the foregoing analysis of this specific fiber optic
telecommunication link, one can conclude that it is far more economical to
enhance this existing system to hardness Level 4 (Maximum) than to install a
new link to achieve this hardness level. Howeyer, this may not be true for all
installed systems.
A similar conclusion could not be drawn for a significantly large
percentage of the existing fiber optic systems, primarily because a number of
them use some sort of metallic central strength member or protective cover for
the cable, and the cable is not usually buried to the hardness Level 4
(Maximum) depth. These two factors would probably dictate the considerable
expense of laying new cable to achieve the desired hardness Level 4 (Maximum).
The Multitier Specification must be applied in detail to each separate fiber
optic system in question. An economic analysis would also need to be
performed. This would allow the assessment of the hardness level as the system
exists. Further application of the Multitier Specification would then provide
the analysis to determine the cost and feasibility of enhancing the system in
question to the desired higher level of hardness.
The Multitier Specification as applied to the actual fiber optic system
studied in this document appears to be a capable tool to assess the hardness
level of existing, systems and recommend appropriate enhancements. The
development of the cost of system enhancements to higher levels of hardness is
39

then straightforward. Further studies of additional sample links are needed to
continue the validation of the Multitier Specification. More generalized
statements can then be made regarding the usefulness of the Multitier
Specification.
The Multitier Specification is also a capable tool to design fiber optic
systems and assess the costs of various hardness levels of fiber optic
telecommunication links as they are being implemented.
9. ACKNOWLEDGMENTS
The authors would like to express their sincere appreciation to the
following people for their assistance in producing this document: J. A. Hull
for technical support; J. M. Harman for graphics support; W. J. Ingram for
computer-aided manuscript preparation; and K. Henderson for help in preparation
of the manuscript.
We would also like to express our gratitude to Bill Cameron, Director,
Network Distribution Services Construction and Engineering, and especially to
George B. McHenry, Jr., Assistant Manager, Network Distribution Services
Engineering, Colorado Springs, Colorado Mountain Bell. Their many hours of
cheerful cooperation and sharing of the in-depth details associated with the
Mountain Bell fiber optic telecommunication link discussed in this document
have made this study much more useful.
10. REFERENCES
Connelly, R. A., and N. J. Cogelia (1970), The gopher and buried cable, BellLaboratories Record, April, pp. 99-103.
Hollister, S. C. (1970), The engineering interpretation of Weather Bureaurecords for wind loading on structures, Proceedings of technical meetingconcerning wind loads on buildings and structures, Held at the NationalBureau of Standards, Gaithersburg, MD, January 27-28, 1969, BuildingScience Series 30, (Superintendent of Documents Catalog Number 13.29/2;30,Washington, DC 20402).
Ingram, W. J. (1987), A program description of FIBRAM: A radiation attenuationmodel for optical fibers, NTIA Report 87-216/NCS TIB 87-22, 120 pp., NTISOrder Number PB 87-230686 (report), PB 87-230687 (report and flexibledisk), [National Technical Information Service (NTIS), 5285 Port RoyalRoad, Springfield, VA 22161].
40
Peach, D. F. (1987), Multitier Specification for NSEP e:(lhancement of fiberoptic long-distance telecommunication networks, Volume I: An ExecutiveSummary, NTIA Report 87-226, 50 pp., Volume. II: Multitier Specificationbackground and technical support information, 222 pp., NTIA Report Number87-226, NCS TIB 87-25, NTIS Order Number not yet available, December.
11. BIBLIOGRAPHY
Abe, K. (1986), Fiber and cable reliability, Proc. National Commun. Forum,Vol. XXXX, Book 1, September 29-0ctober 1, (National Communications Forum,505 North Lake Shore Drive, Suite 4808, Chicago, IL 60611).
AEC (U.S. Atomic Energy Commission) (1960), Reactor Handbook, Vol. I:Materials, C. Tipton, Jr. (Ed.), (Interscience Publishers, Inc., New York,NY) .
AIHA (American Industrial Hygiene Association) (1982), Engineering FieldReference Manual, (AIHA, 475 Wolf Ledges Parkway, Akron, OH 44311-1087).
Antinone, R. J. (1987), How to prevent circuit zapping, IEEE Spectrum, April,pp. 34-38.
ASCE ~American Society of Civil Engineers) (1961), Manuals of engineeringpractice, Number 42, Design of structures to resist nuclear weaponseffects, (ASCE, New York, NY).
ASTM (American Society for Testing and Materials) (1975), Standard method oftest for indentation hardness of rubber and plastics by means of adurometer, ASTM Standard Designation D 2240-75.
AT&T (1970), The gopher and buried cable, Bell Laboratories Record, April.
AT&T (1982), Outside plant engineering handbook, (AT&T Technologies, Inc.,Indianapolis, IN).
AT&T (1985), Telecommunication electrical protection, (Customer InformationCenter, order select code 350-060, Indianapolis, IN).
BDM (The BDM Corporation) (1983), DNA EMP cours~a study guide, BDMjW-82-305-TR,January, (Defense Nuclear Agency, Washington, DC).
BDM
BDM
(BDM Corporation) (1986a) , DNADNA-H-86-68-V1, BDMjW-85-1143-TR,Washington, DC 20305-1000).
(BDM Corporation) (1986b), DNADNA~H-86-68-V2, BDMjW-85-1143-TR,Washington, DC 20305-1000).
EMPMay
EMPMay
COURSE Study27, (Defense
COURSE Study27, (Defense
Guide,Nuclear
Guide,Nuclear
Vol. 1,Agency,
Vol. 2,Agency,
Bell, Trudy E. (1985), The main event, the decision to divest: Incredible orinevitable?, IEEE Spectrum 22, Number 11, November.
41

Booz, Allen & Hamilton (1984), Electromagnetic pulse (EMP) task force statusreport to the industry executive subcommittee, January 12, (NationalCommunications System, Washington, DC 20402).
BTL (Bell Telephone Laboratories) (1975), EMP engineering and design principles, Second Printing, (Loop Transmission Division, Technical Publications Department, Whippany, NJ).
CCITT (The International Telegraph and Telephone Consultative(1985), Construction, installation, jointing and protectionfibre cables, (International Telecommunication Union, Geneva,92-61-02421-1).
Committee)of optical
ISBN
Cogelia, N. J., G. K. LaVoie, and J. F. Glahn (1976), Rodent biting pressureand chewing action and their affects on wire and cable sheath, Proc. Int.Wire and Cable Symp., Cherry Hill, NJ, pp. 117-124.
DCA (Defense Communications Agency) (1981), DSN design practices forhigh-altitude electromagnetic pulse (HEMP) protection, Draft B, June 1,(DCA, Washington, DC).
DCPA (Defense Civil Preparedness Agency) (1972), EMP protection for emergencyoperating centers, TR-61A, (Federal Emergency Management Agency,Washington, DC), May.
DCPA (Defense Civil Preparedness Agency) (1976a), Shelter design and analysis:Fallout radiation shielding, TR-20, Vol. 1, June, (Federal EmergencyManagement Agency, Washington, DC).
DCPA (Defense Civil Preparedness Agency) (1976b), Shelter design and analysis:Protection factor estimator with instructions, TR-20, Vol. 2, February,p. 44, (Federal Emergency Management Agency, Washington, DC).
Denny, H. W. (1983), Grounding for the Control of EMI, (Don White Consultants,Inc., Gainsville, VA).
DNA (Defense Nuclear Agency) (1971), DNA EMP Awareness Course NOTES, DNA 2772T,August, (DNA, Washington, DC 20305).
DOD (Department of Defense) (1982), Grounding, Bonding, and Shielding forElectronic Equipments and Facilities, MIL-HDBK-419, January 21, (NavalPublications Office, 5801 Tabor Ave., Philadelphia, PA 19120).
DOD (Department of Defense) (1984), Grounding, bonding, and shielding forcommon long haul/tactical communication systems including ground basedcommunication-electronics facilities and equipments, MIL-STD-188-124A,February 2, (Naval Publications Office, 5801 Tabor Ave., Philadelphia, PA19120) .
Englert, T. J. (1987), Effects of radiation damage intutorial, NTIA Contractor Report 87-38, May, (NTIS87-210308/AS).
42
opticalOrder
fibers- -ANumber PB
FEMA (Federal Emergency Management Agency) (1980), EMP threat and protectivemeasures, TR-6l, April, (FEMA, Washington, DC).
FEMA (Federal Emergency Management Agency) (1982), FEMA attack manual,Chapter 2, CPG2-1A2, May, (FEMA, Washington, DC).
FEMA (Federal Emergency Management Agency) (1983), Radiation safety inshelters: A handbook for finding and providing the best protection inshelters with the use of instruments for detecting nuclear radiation,(Civil Preparedness Guide) 2-6.4, September 23, (GPO: 1985-483-703:32781,Superintendent of Documents, Washington, DC 20402).
FEMA (Federal Emergency Management Agency) (1985), Protective construction:Nuclear blast resistant design, TR-20, Vol. 4, March, (GPO 527-466/30494,Superintendent of Documents, Washington, DC 20402).
FEMA (Federal Emergency Management Agency) (1986), Attack environment manual,CPG 2-1A4, Chapter 4, (FEMA, Washington, DC).
FEMA (Federal Emergency Management Agency) (1986), Electromagnetic pulseprotection guidance, CPG-2-l7, January, (FEMA, Washington, DC).
Fischer, D.K., E. Bow, W. F. Busch, and E. C. Schrom (1986), Progress towardsthe development of lightning tests for telecommunications cables, Proc.35th Int. Wire and Cable Symp., pp. 374-'386.
Galuszka, Peter (1985), Unfazed by projections, carriers kindle the course oflightwave, Data Commun., pp. 72-73, April.
Georgopoulos, C. J. (1982), Fiber Optic and Optical Isolators, (Don WhiteConsultants, Inc., Gainesville, VA).
Glasstone, S., and P. Dolan (1977), The Effects of Nuclear Weapons, (GPO 19770-213-794, Superintendent of Documents, WaShington, DC 20402).
Haber, J. B. (1987), Characterization of ambient terrestrial radiation for longhaul fiber optic transmission systems, Proc. First Int. Military andGovernment Fiber Optics and Commun. Exp. (MFOC I 87), Washington, DC,March 16-19.
Horgan, John (1985), Safeguarding the national security, IEEE Spectrum 22,Number 11, November.
Hull, J. A. (1987), NSEP fiber optics system study background report: Nuclear.effects on fiber optic transmission systems, NTIA Report 87 - 227, NCS TIB87-26, 115 pp., NTIS Order Number not yet available, December.
Kao, C. K. (1982), Optical Fiber Systems: Technology, Design, and Application,(McGraw-Hill, Inc., New York, NY).
McKay, G., W. Cousineau, B. Braham, and J. Rowe (1986), Qualification procedurefor fiber optic cable design, Proc. 35th Int. Wire and Cable Symp.,pp. 307-314.
43

Miletta, J. R., M. Campi, R. J. Chase, and G. L. Roffman (1982), Defenseswitched network design practices for protection against high-altitudeelectromagnetic pulse, HDL-SR-82-2, .(U. S. Army Electronics Research andDevelopment Command, Harry Diamond Laboratories, Adelphi, MD).
National Research Council (1984), Evaluation of Methodologies for EstimatingVulnerability to Electromagnetic Pulse Effects, (National Academy Press,Washington, DC)
Naval Facilities Engineering Command (1986), High-altitude electromagneticpulse environment, Des ign Manual 12.02, SN 0525- LP - 300 - 9087, October,(200 Stovall Street, Alexandria, VA 22332-2300).
NBS (National Bureau of Standards) (1970), Proceedings of technical meetingconcerning wind loads on buildings and structures, held at the NationalBureau of Standards, Gaithersburg, MD, January 27-28, 1969, R. D. Marshalland H. C. S. Thorn (Ed.), Building Science Series 30, (Superintendent ofDocuments Catalog Number 13.29/2:30).
NCS (National Communications System) (1978), EMP, lightning and powertransients: their threat and relevance to EMP protection standards fortelecommunication facilities, TIB 78-1, (NCS-TS, Washington, DC).
NCS (National Communications System) (1985a), Assessment of nuclear falloutradiation on FT3C lightwave digital transmission system, TIB 85-11,November, (NCS-TS, Washington, DC).
NCS (National Communications System)communication system EMP test(NCS-TS, Washington, DC).
(1985b), FT3C mu1timode optical-fiberand assessment, TIB 85-12, November,
Nelson, D. B. (1972), A program to counter effects of nuclear EMP in commercialpower systems, ONRL-TM- 3552, October, (Oak Ridge National Laboratories,Oak Ridge, TN).
Nesenbergs, M. (1987), Fiber optic networks and their service survival, NTIAReport 87-214/NCS TIB 87-9, 121 pp., (NTIS Order Number PB 87-l86706/AS),National Technical Information Service (NTIS), 5285 Port Royal Road,Springfield, VA 22161).
Nicodemus, M. L., and N. B. Guttman (1980), Probability estimates oftemperature extremes for the contiguous United States, May, (NationalClimate Center, National Oceanic and Atmospheric Administration,Asheville, NC 28801).
Pittock, A. B., T. P. Ackerman, P. J. Crutzen, M. C. MacCracken, C. S. Shapiro,and R. P. Turco (1986), Environmental Consequences of Nuclear War,Scope 28, Vol. 1: Physical and Atmospheric Effects ,(John Wiley and Sons,New York, NY).
RAND Corporation (1987a), Feasibility of using interstate highway right-of-wayto obtain a more survivable fiber optics network, RAND Report NumberR-3499-DOT/NCS, Volume I, (The RAND Corporation, Santa Monica, CA90406-2138).
44

RAND Corporation (1987b), Feasibility of using interstate highway right-of-wayto obtain a more survivable fiber optics network, RAND Report NumberR-3500-DOT/NCS, Volume II, (The RAND Corporation, Santa Monica, CA90406-2138).
Rockwell International (1982), Baseline study of the EM vulnerability ofsystems, April, (Rockwell International, Anaheim, CA) .
•Shah, J. (1975), Effects of environmental nuclear radiation on optical fibers,
BSTJ 54, Number 7, pp. 1207-1213.
Sims, R. E. (1987), A HEMP hardened fiber optic repeater terminal, Proc. FirstInt. Military and Government Fiber Optic and Cornrnunicatiop.s Exposition.(MFOC-87), Washington, DC, March 16-19.
SRI International (1983), Draft military standard for EMP protection ofground-based C3 I facilities, (SRI International, Menlo Park, CA).
45


APPENDIX A
EXCERPT FROM THE MULTITIER SPECIFICATION
The following appendix is an unchanged (unedited) excerpt taken fromSection 4 of Multitier Specification for NSEP enhancement of fiber optic longdistance telecommunication networks (Peach, 1987). References cited inAppendix A are also included as entries in either Section 10 (References) orSection 11 (Bibliography) of this report. The original figure and tablenumbers in the excerpt have been retained from the original referenced documentto maintain consistency with that document. Therefore the figure and tablenumbers in Appendix A do not follow the nwnbering sequence used for thesubsequent appendixes.
47

4. LEVELS OF HARDNESS--KULTITIER. SPECIFICATION
4. 1 Background
The levels of hardness are determined by the physical- parameters of the
system components and their environment, the functional component design
parameters, and the strategic placement of the components of the system within
the environment. The ensuing sections of the report describe these parameters
for each of the selected levels of hardness.
The goal is to develop a specification (guideline) with succeedingly
higher levels of resistance to stress. An attempt has been made to select
meaningful measurement parameters in building the levels of hardness. Absolute
levels of stress tolerance are impossible to define because the fiber optic
technology is new (and rapidly changing), has only limited experience, and the
stress conditions being considered are hypothetical or unknown.
The cost associated with the upgrade to succeeding levels of the
specification is not dealt with here. A number of unique situations must be
dealt with in constructing and designing a fiber optic path; thus development
of a typical cost figure that can be applied to any path would not be feasible.
Figure 1 illustrates the intent of the specification to be a tool for use
in specifying or classifying the hardness level of a fiber optic path. The
definition of the stress expected (threat) must be defined by the user of that
path- -possibly determined by the type of traffic to be transmitted along the
path.
The Multitier Specification is a compilation of data and experience from
several sources. Figure 2 illustrates these inputs. Radiation tests were done
on the AT&T FT3C fiber optic telecommunication system (NCS, 1985a). A separate
set of tests were done on the AT&T 5ESS switch to determine susceptibility to
EMP fields (NCS, 1985b). The results of these tests, plus input from industry
design and inst~llation practices, have been used to define the levels of the
Multitier Specification.
The intent is for each successive level to be more hard than the preceding
level. As enhancements are added or environments are modified to provide
protection, the exposure to other types of stress-causing hazards may be
increased. For example, placing system elements underground for additional
protection against weather will increases the likelihood of damage caused by
rodents. Table 5 illustrates the improvement areas as the hardness level is
increased. The table also lists the areas of increased exposure (risk areas).
48

.j>\0
~l---®-OFiber Optic Path
or
Figure 1. Multitier specification as a tool to classify or specify.
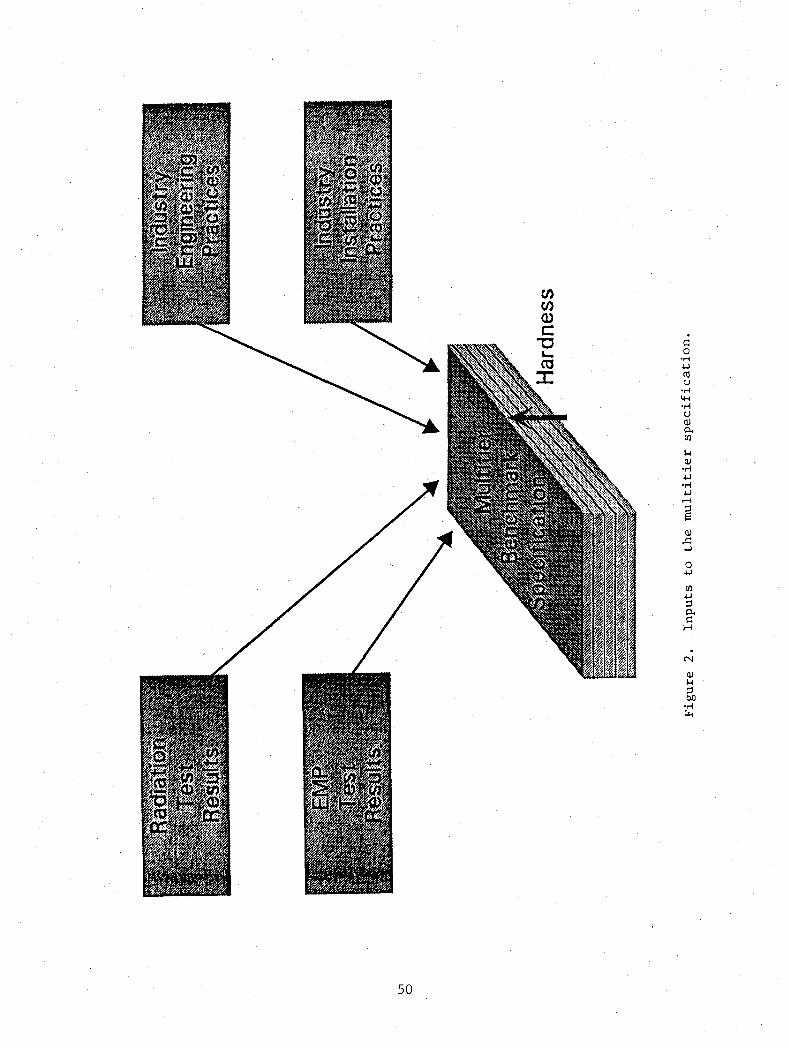
50
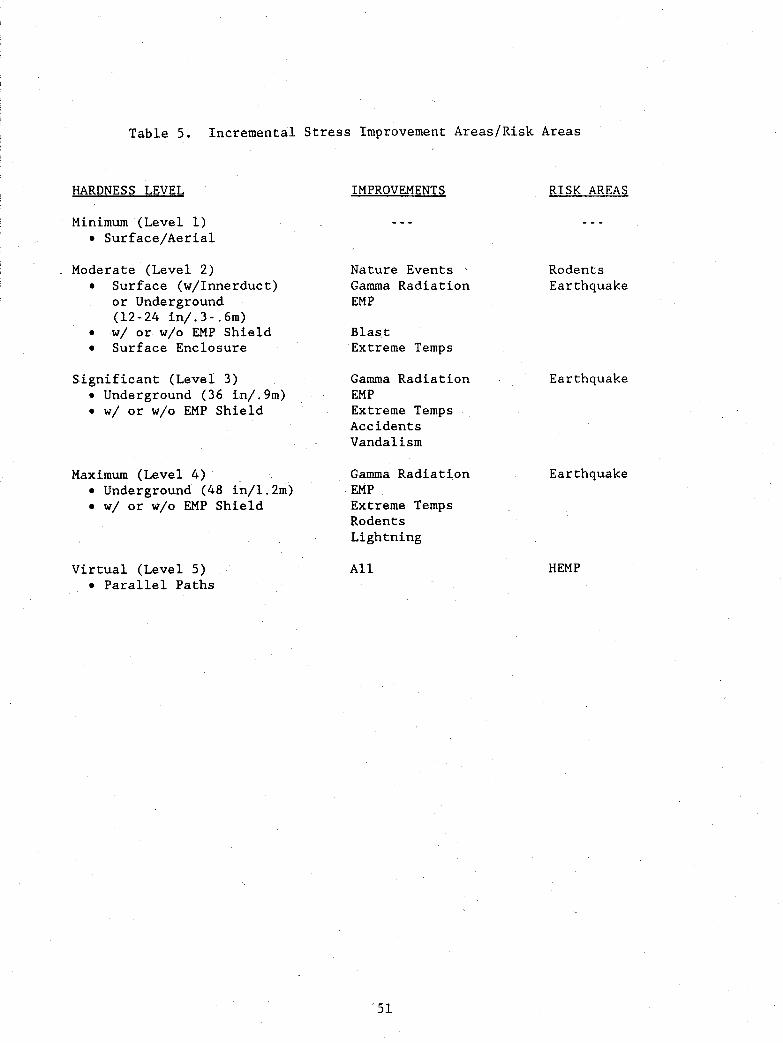
Table 5. Incremental Stress Improvement Areas/Risk Areas
HARDNESS LEVEL
Minimum (Levell)• Surface/Aerial
Moderate (Level 2)• Surface (w/Innerduct)
or Underground(12-24 in/.3-.6m)
• w/ or w/o EMP Shield• Surface Enclosure
Significant (Level 3)• Underground (36 in/.9m)• w/ or w/o EMP Shield
Maximum (Level 4)• Underground (48 in/I. 2m)• w/ or w/o EMP Shield
Virtual (Level 5)• Parallel Paths
IMPROVEMENTS
Nature EventsGamma RadiationEMP
BlastExtreme Temps
Gamma RadiationEMPExtreme TempsAccidentsVandalism
Gamma RadiationEMPExtreme TempsRodentsLightning
All
51
RISK AREAS
RodentsEarthquake
Earthquake
Earthquake
HEMP

While the shortcomings (increased exposure) are of concern, the improvements
(enhancements) at each level are designed to counteract the increased exposure.
The Multitier Specification was developed as a tool to aid in determining
the hardness of a specified fiber optic telecommunication path. Another use
for the Multitier Specification will be to assist in the hardness upgrade of a
fiber optic link. An upgrade flow diagram is presented in Figure 3 to
illustrate the options available for upgrade or for specification utilizing the
Multitier Specification. As illustrated, at Levels 2 (Moderate) through 4
(Maximum), the design can be specified with or without an EMP shield.
Installations that do not include an EMP shield will still yield protection
from EMP damage because of the underground placement. The EMP shield will
provide further attenuation of the EMP field for those paths that require the
additional protection (e.g., for use in transmitting time-critical data or
real-time information when EMP is expected).
Based on data available in unclassified documents, a guideline for
protection against the two most devastating stress threats (HEMP and gamma
radiation) have been developed for use in the Multitier Specification. The
guideline for adequate attenuation and absorption of the EMP field and the
gamma radiation energy is described below.
Gamma Radiation--The safe levels of exposure for equipment and the maximumdefined threat are included as a basis for providing protection. Theestimated doses are assumed to accumulate in a short period (severalminutes).
Equipment safe dose level--100radsEstimated threat dose level--30,OOO radsEquipment protection factor required--300Personnel safe dose level--50 radsEstimated threat dose level--30,OOO radsPersonnel protection factor required--600
HEMP- -The attenuation level required to reduce the EMP field to levelsthat will not affect the operation of the equipment is included as a basisfor providing protection.
Equipment safe level--50 VimMaximum threat level--50,OOO VimMaximum attenuation protection factor required--l,OOOPersonnel safe level--unlimited
References to support these guidelines are provided in Volume II of this
report. Data available in these references will provide information necessary
to extend the limits if required. These limits are judged to be sufficient for
52

LEVEL 4 (MAX)W/0 EMP SHIELD
OPTION 1
LEVEL 5(VIRTUAL)
LEVEL 4 (MAX)W/ EMP SHIELD
OPTION 2
lJ1W
LEVEL 3 (SIG)W/0 EMP SHIELD
OPTION 1
LEVEL 2 (MOD)W/0 EMP SHIELD
OPTION 1
LEVEL 1(MIN)
LEVEL 3 (SIG)W/ EMP SHIELD
OPTION 2
LEVEL 2 (MOD)W/ EMP SHIELD
OPTION 2
Figure 3. Multitier specification upgrade options.

use with commercial telecommunication systems used for traffic of a
non-critical nature.
A true measure of the system stamina would be the "probability of
survival" based on the protection level of the fiber optic system at each level
of the Multitier Specification. This can only be completed if the stress
threat is defined in parameters that can be mitigated. The limits of stress
threat considered for this report, for events of nature, are the type of
conditions expected on a daily basis plus those extreme events defined by
"return intervals." A "return period" denotes the frequency of occurence of a
specified magnitude of the referenced event of nature. Man-made events of a
random nature (e.g., vandalism, vehicle traffic accidents, etc.) are predicted
based on historical data that describe the event, the severity, and the
parameters of the damage (e.g., gun shot damage). A level of sabotage, caused
by deliberately inflicting damage such as HEMP from a high altitude nuclear
detonation or gamma radiation from a nuclear detonation within the atmosphere
is described by the parameters above.
Table 6 illustrates an estimate of the relative protection provided by
each level of the Multitier Specification using a numerical scale based on
total effectiveness (full protection). It should be noted that full protection
does not guarantee a degree of survivability. The numerical scale could be a
measure of survival probability; however, it is not specifically intended to
illustrate that parameter. Although 10 is the highest level of protection, it
does not represent 100 percent survival. Man-made stress events that are
deliberate will preclude 100 percent survival. Rather, the protection level
should be viewed as relative with a level of 10 representing the best possible
protection within the capability of technology readily available. The basis
for full protection from EMP is a factor of 1,000 as suggested by NCS (1978)
and substantiated by data compiled from o~her sources. Full protection of
equipment from gamma radiation is estimated to be attained with an absorption
factor of 300 (reduction of flux to a safe level of 100 rads) , assuming a dose
rate of 30,000 rads and photon energy of approximately 1 MeV.
The attributes of a system built to a particular hardness level of the
Multitier Specification can be described in terms of the physical parameters of
the installation and hardware, or in terms of the stress protection provided.
Table 7 summarizes these parameters in a way that one can quickly create an
image of the physical installation of a fiber optic system necessary to meet a
54

Table 6. Multitier Specification--Re1ative Level of Protection
1 - LEAST PROTECTION10 - MOST PROTECTION
NATUREEVENTS
(ICE,HARDNESS OPT ION RADIATION EXTREME BURST SNOW,LEVEL 1 2 @lMeV @6MeV TEMP. /llIND RODENTS FLOOD)
MINIMUM 4 - 1 - 3 2 3 2(LEVEL 1)
U1U1
6 3MODERATE 10 1 6 5 10 7(LEVEL 2)
SIGNIFICANT 7 10 10 4 10 9 10 8(LEVEL 3)
MAXIMUM 8 10 10 7 10 9 10 9(LEVEL 4)
VIRTUAL 10 10 10 10 10 10 10 10

Table 7. Multitier Specification-Physical Properties Summary and Protection Overview
Physical Properties
o Cable
Installation Type
Installed without duct
o Regenerator Enclosure
Installation Type
Stress Protection Parameters
o Heat (Fire Resistance)
o Blast (Wind) Resistance
o Wind Resistance
o Lightning
o EMP
o Gamma Radiation
Cable
Regenerator
o Earthquake
Cable
Regenerator
o Back-up Power Source
o Rodent Protection
o Electrical Grounding
Minimal Hardness (Levell)
Aerial
> 25% of length
Surface - wood framereinforced
Limited protection
1-2 psi «70 mph)
< 70 mph (1, 2, &5-year events)
Minor lightning-frequentinterruption
Structure Only: 10 dB atten.
None
Limited protection
Limited protection
Survives 1, 2, & 5-yearevents
None
Limited protection
Standard electrical ground
Moderate Hardness (Level 2)
Underground 12-24 in. (0.3-0.6 m)
None
Surface - concrete reinforcedwith earth berm, but no earthcover. Bonded-rebar reinforcedcage.
Good protection
2 psi (70 mph)
< 100 mph (1, 2, 5, 10, &
25-year events)
Moderate lightning-very littleinterruption
Structure Only: 25 dB atten.Structure & Shield: 80 dB atten.
Absorption factor = 35 dB at 1 Mevparticle energy level
Absorption factor = 2 dB at 1 Mevparticle energy level
Ground separation < 1 in. (2.5 cm)
Survives 1, 2, 5, & 10-yearevents
8-hour rechargeable battery
Good protection (service interruptionminimal)
Meaningful electrical ground(penetration to water table)
Significant Hardness (Level 3)
Underground> 36 in. (0.9 m)
None
Underground> 36 in. (0.9 m)
Excellent protection
5 psi (150 mph)
< 110 mph (1, 2, 5, 10, 25, & 50-year events)
Heavy lightning-very little interruption
Structure Only: 40 dB atten.Structure & Shield: 80 dB atten.2-stage TPD protection
Absorption factor> 50,000 at 1 MeVparticle energy level
Absorption factor> 50,000 at 1 MeVparticle energy level
Ground separation < 4 in. (10 cm)2% slack in slack pitscable in PVC innerduct
Survives 1, 2, 5, 10, 25, & 50-year events
Sustains power for 7 4ays
Excellent protection (service interruptionrare)
Meaningful electrical ground2-stage TPD protection
Maximum Hardness (Level 4)
Underground> 48 in. (1.2 m)
None
Underground> 48 in. (1.2 m)
Full protection
10 psi (1,400 mph)
> 130 mph (1, 2, 5, 10, 25, 50, &
100-year events)
Multiple lightning strikes-very rareinterruption
Structure Only: 50 dB atten.Structure & Shield: 80 dB atten.3-stage TPD protection
Absorption factor> 2,000,000 at 1 Mevparticle energy level
Absorption factor> 2,000,000 at 1 MeVparticle energy level
Ground separation < 12 in. (0.3 m)6% slack in slack pitscable in PVC innerduct
Survives 1,2,5,10,25,50,100, &
250-year events
Sustains power for 14 days
Full protection (service interruptionvery rare)
Meaningful electrical ground3-stage TPD protection
56

selected hardness level of the specification. In addition, if one knows the
level of the installed system, the stress protection, for. the major stress
sources, can be determined without referencing Volume II of this report.
Volume II will have to be consulted for more detailed information or for
protection levels provided for stresses that are not included in Table 7.
57


APPENDIX B
QUESTIONS TO BE ANSWERED PRIOR TO THE APPLICATION OFTHE MULTITIER SPECIFICATION TO A FIBER OPTIC LINK
B.l Fiber Optic Cable SpecificsB.2 Conduit SpecificsB.3 Cable Splice SpecificsB.4 Cable Splice Box SpecificsB.5 Cable Burial SpecificsB.6 Cable Route Marking & Identification SpecificsB.7 Regenerator Building SpecificsB.B Regenerator Power Source SpecificsB.9 Regenerator Electro-Optics SpecificsB.10 Fiber Optic Link SpecificsB.ll System Layout SpecificsB.12 Rights-of-Way SpecificsB.13 Security, Maintenance, and System Recovery Specifics
59

APPENDIX B: QUESTIONS TO BE ANSWERED PRIOR TO THE APPLICATION OF THE MULTITIERSPECIFICATION TO A FIBER OPTIC LINK
B.l Fiber Optic Cable Specifics
a. Who is the manufacturer of cable being installed?b. Is the cable all-dielectric, shielded, or double shielded?c. Do you use a rodent/lightning protected cable?d. What is the usable maximum data rate of each fiber in the cable
(1. 7 Gb/s)?e. Is this data rate different for the 1.3 ~m and the 1.5 ~m windows?f. What is the cable strength member material (kevlar, fiberglass, or
stainless steel)?g. Does the cable contain any metallic shield material (single or
multiple layers, continuous or stranded)?h. If metallic shielded cable is used, how and where is it grounded (in
relation to the regenerators, splice boxes, and central offices)?i. How is the cable protected against lightning (by grounding or by
protection devices)?j. How is the cable protected against HEMP (how are the currents shunted
away from the electronic enclosures)?k. How many fiber pairs are contained in the cable?1. Are the fibers single-mode or multimode?m. Is the fiber core free from phosphorus dopant?n. Are the fibers radiation hardened (what level of gamma radiation can
be tolerated at the surface above the fiber? Are the fibers recoveryenhanced or reduced loss enhanced?
o. What are the core/clad diameters of the individual fibers?p. What dopants are used in the fibers?q. What is the outside diameter of the cable?r. Is the cable designed to be rodent immune?
B.2 Conduit Specifics
a. Is the fiber optic cable contained in a conduit over the entireroute?
b. What is the conduit material (pvc or polyethylene)?c. What is the outer diameter and wall thickness of the conduit?d. Does the conduit contain a gel or other filling material?e. Is the conduit sealed at each end?f. Is a compound conduit used such as small innerducts within a larger
conduit?g. Is any type of gamma radiation-resistant conduit used? If so, how
much absorption is provided?h. Where is conduit used in the system?i. What is the conduit diameter, wall thickness, and material
1. at the entrance (and exit) of the central offices?2. at the entrance (and exit) of the regenerator buildings?3. at the sites where the conduit is suspended under bridges?
60

j. What are the lengths of the metal conduits that span the bridges?(Are all the span conduits metal?)
k. What type and size of conduit is used when placing FlO cable under
1. roadways?2. intermittent waterways?3. natural waterways?
1. When crossing a right-of-way (ROW), does the conduit span the entireROW or just the width of the road itself?
m. How are the conduits sealed
1. at the central office ends?2. at the regenerator buildings
a. underground outside the building?b. inside the building?
3. at the bridge span sites?
n. Are the conduits pressurized to prevent water entry?
B.3 Cable Splice Specifics
a. Are all splices the Advanced Rotary splices?b. Are any fusion splices used in the system?c. What is the maximum allowable signal loss specification (in dB) at
each splice?d. Will the actual signal loss at each splice be measured?e. What is the expected average signal loss (in dB) at each splice?f. Are all splices accessible for future repair if necessary?g. How many feet (meters) of spare fiber cable are provided at each
splice?
B.4 Cable Splice Box Specifics
a. What are the dimensions of the splice boxes?b. Are they commercially available units?c. What materials are they made of?d. What is the wall thickness?e. What is the lid thickness and how is it attached?f. Is the box open or closed at the bottom?g. How does the FlO cable enter and exit the box?h. Is the top of the lid of any splice box less than 4 feet (1.2 m)
below the surface?i. Are the splices encased in typical splice closures within the splice
boxes?j. Do the splice boxes contain shelves to support the splices and the
coils of spare cable length?k. Are the splice boxes resting on existing earth or fill material (such
as sand) in the trench bottoms?1. Are the splice boxes marked with buried metallic devices?m. Are the splice box locations marked with aboveground markers?
61
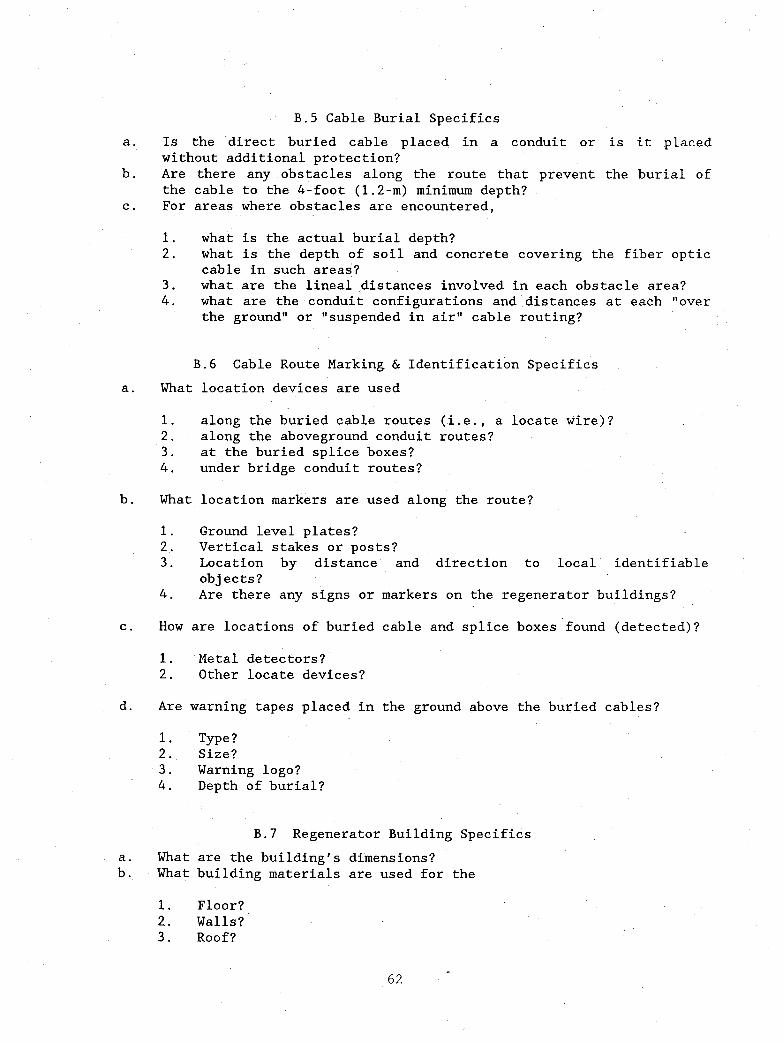
B.5 Cable Burial Specifics
a. Is the direct buried cable placed in a conduit or is it placedwithout additional protection?
b. Are there any obstacles along the route that prevent the burial ofthe cable to the 4-foot (1.2-m) minimum depth?
c. For areas where obstacles are encountered,
1. what is the actual burial depth?2. what is the depth of soil and concrete covering the fiber optic
cable in such areas?3. what are the lineal distances involved in each obstacle area?4. what are the conduit configurations and distances at each "over
the ground" or "suspended in air" cable routing?
B.6 Cable Route Marking & Identification Specifics
a. What location devices are used
1. along the buried cable routes (1. e., a locate wire)?2. along the aboveground conduit routes?3. at the buried splice boxes?4. under bridge conduit routes?
b. What location markers are used along the route?
1. Ground level plates?2. Vertical stakes or posts?3. Location by distance and direction to local identifiable
objects?4. Are there any signs or markers on the regenerator buildings?
c. How are locations of buried cable and splice boxes found (detected)?
1. Metal detectors?2. Other locate devices?
d. Are warning tapes placed in the ground above the buried cables?
1. Type?2. Size?3. Warning logo?4. Depth of burial?
B.7 Regenerator Building Specifics
a. What are the building's dimensions?b. What building materials are used for the
1. Floor?2. Walls?3. Roof?
62

4. Doors?5. Vents?6. Insulation?
c. Does the building have heating and/or air conditioning?d. What are the dimensions and locations of the public service ac power
entrances for
1. aboveground utilities?2. underground utilities?3. the power buss grounding
a. outside the building?b. inside the building?
4. Are there transient protection devices (such as metal-oxidevaristors) in the ac power lines?
B.8 Regenerator Power Source Specifics
a. What is the primary power source (public utilities)?b. What is the backup power source (diesel motor~generator set)?c. Uninterruptible power source (UPS):
1. Are there lead-acid batteries?2. Are there gel-cell batteries?3. How long can the regenerator operate on the UPS only?
d. Is there provision for the connection of an external emergency powersource?
B.9 Regenerator Electro-Optics Specifics
a. How many regenerators are in the link?'b. What are the locations of each?c. What is the system margin (in dB) of each regenerator?d. How many active channels are in each regenerator station?e. How many "hot standby" channels are in each regenerator station?f. How many backup (spare) channels are in each regenerator station?g. What upgrade capabilities are availabl.e?h. What is the current data rate of the hardware?
1. How many circuits are available for expansion?2. To what data rate can the existing hardware be expanded?
B.I0 Fiber Optic Link Specifics
a. What is the current data rate of transmission on the system(417 Mb/s)?
b. What expanded data rate has been designed into the system (1.7 Gb/s)?c. How many active fibers does the system contain?d. How many "hot standby" fibers does the system contain?
63

e. How many spare fibers does the system contain?f. What restoration time is projected for a cable cut?
B.ll System Layout Specifics
a. Provide a simplified drawing of the system showing
1. rights-of-way relative to identifiable landmarks.2. location of splices.3. location of regenerator buildings.4. location and length of obstacles.5. location and length of spans not buried.
b. Provide a list of
1. number of splices.2. number of regenerator stations.3. distance between regenerator stations.
B.12 Rights-of-Way Specifics
a. What portion (distance) of the system lies on Federal land?b. What portion (distance) of the system lies on state land?c. What portion (distance) of the system lies on railroad land?d. What portion (distance) of the system lies on private land?e. At how many places does the unburied fiber optic cable cross a major
thoroughfare or railroad right-of-way?
B.13 Security, Maintenance, and System Recovery Specifics
a. If a cable is cut, will it be spliced at the break or will the cablebe replaced between the two nearest splice boxes?
b. If a major outage occurs at a regenerator station, are thereprovisions to reroute the traffic on parallel or competitor links?
c. Will the fiber optic cable link route be inspected (by walking ordriving) on a regular basis (weekly or monthly)?
d. What other methods of system surveillance are planned?e. What kind of provisions are being planned for system maintenance?
1. How much spare cable will be kept on hand?2. What spare regenerator electronics will be kept on hand?3. What UPS spares will be kept on hand?
64
APPENDIX C
FIBER OPTIC LINK ROUTE MAPS
John M. Harman
Figure C-l. Routing for Mountain Bell fiber optic communication link(Colorado Springs to Pueblo) .
Figure C-2. Sheet 1 of route map summary.
Figure C-3. Sheet 2 of route map summary.
Figure C-4. Sheet 3 of route map summary.
Figure C-5. Sheet 4 of route map summary.
65


r-_, -,
~'
/ ' .../ '/ '/ ' \
I \I . ,I __
'--- ... - -,- __ I
- __ I
--I
r----,I ,
I~'I 'I 'I ' ,I ,I )I .. 'I ....I ..L __ ,.'"
PUEBLO MEMORIALAIRPORT
PETERSON FIELD
~INON REGENERATOR
(Drawing.!!.2! to scole)
...........-
FOUNTAIN CENTRAL OFFICE~t:,;!,""' AND REGENERATOR
~ .):-
r--:. .PUEBLO
CENTRAL OFFICE
.r\:::~~~~~S~E~"C~~U:R~IT:Y::CENTRAL OFFICE
EL PASO COUNTYAIRPORT
COLORADO SPR INGS CENTRAL OFFICECOLO. SPGS.C.O.
FOUNTAIN C.O.AND REGEN.
PINONREGEN.
SECURITYC.O.
(XlN01
10_
PUEBLO C.O.
(OW9. proportional! y correct)
Figure C-l. Routing for Mountain Bell fiber optic communication link(Colorado Springs to Pueblo).

N
....=:I:I/)
Zo....=zo
10
iIi::;Ii: . •
~I I I I I I I I I ...
!'; i ! ~ :
.~ I• I. I. I. I. I. 1M I. J. I" ~...II : : l .... .... ....- t---'- f---' .... -' -' -' -'- ,...-I u·· -- ... -' 1-I I I I " 1·1
IIl10105_ IITt1Io5J11l' II
IIl~_ II. I. I
J~..., -' I' I -'- ~-' I.....
i . Iusm 105 Zl14 lSIlll IIlU lS JlIrlSll II
• ;-'1 to~_. ....
til_sPeC
Figure C-2. Sheet 1 of route map summary.
68
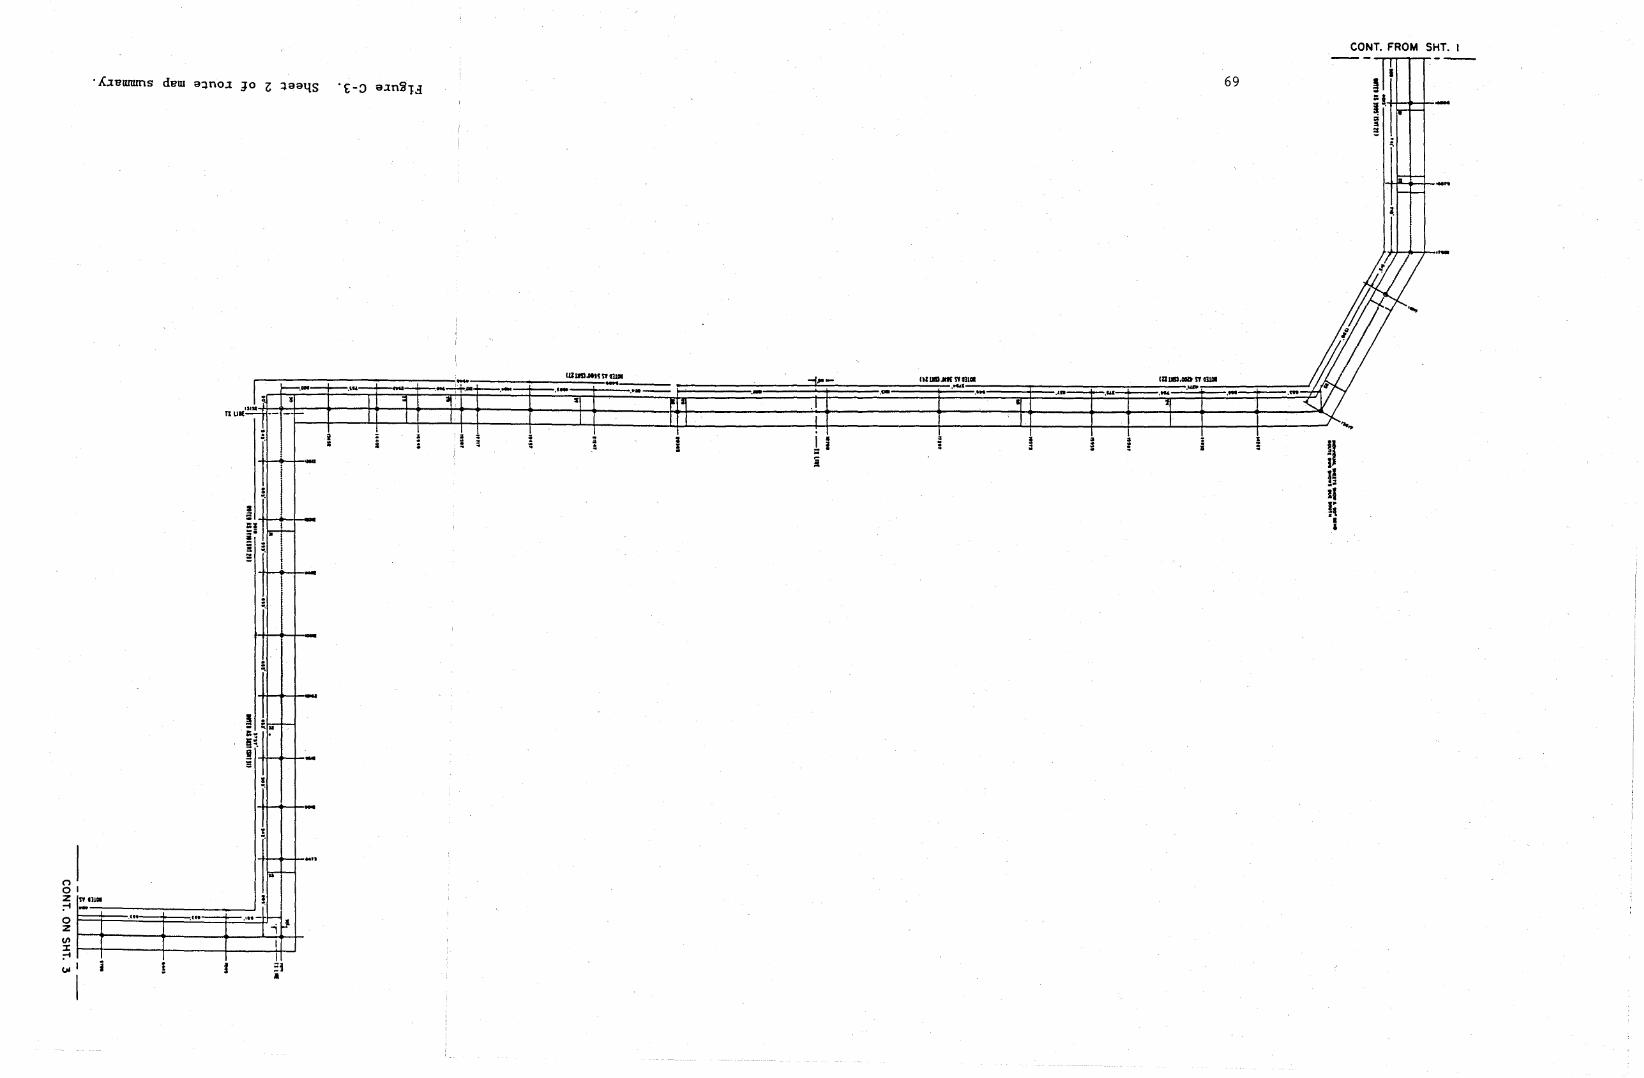
CaNT. FROM SHT. I
!i
---~I~
-69. A.reurnms dem a4no.l }O l 4aaqs '£-:J a.ln~la
=§I' ..- f0-r
;i!I:
~
- >-~>-
a.
(
f/ .....
l
IUum,H'UU1111 .,...- nUIII_WI1I111 IDIIlI.llllltWt1IlII~.-~''''=F''''~-~'- - .- ....- 1--.... .- .- ....I; .'- ..• .- .e- ....
sl .r I, 2f-, : I rI~Ilit r I r I T I r I I I I J ...~nUl( • r-
~ 1 I
~ I • ~ ! '" I ; ! n; :~
z= i
-.I : i a = ! =i
!I~
I--III
,"-.;~~ II== I
:ii fri-! I! -.:: II -II
-.
-~
-~ !I;r f-l::- .§~~ -!S
•r -I
I.
I ....Iir f-
IW llilll !- .'" -h-.". ....
~1-;II
ooz:-iozII)
:J::-i
~I

. \:~ I' X
enZ0
-' .,;
18
i
..·_,~--.-.,-----t-++---+-t--i--4H
!
iii
"'--,-""
I
....--r--....
I
-,'Mill 1$1.,.'1111 ..,
..... ..'...._·-+-t,_..u+-+---+---~+--+-----+---"'~-+-4----~--++--<H--+---+---H--~-1"""';f-
--+-+--1-11-1
....-+.....--1-11-1
Figure C-4. Sheet 3 of route map summary.
70

TL


APPENDIX D
INFORMATION ON A TYPICALABOVEGROUND REGENERATOR STATION
Photographs of the Pinon, CO, Regenerator Station in the ColoradoSprings to Pueblo Fiber Optic Link of the Mountain Bell System
73

Figure D-1. View of the southwestcorner of the regenerator building.
This view shows the securityfence and the louvered air intakefor the diesel-powered generatingplant.
Figure D-3. View of the fI standbyfldiesel-powered generator.
74
Figure D-2. View of the south sideof the regenerator building.
This view shows the cinderblock construction with metal roofand insulated steel doors. The roomon the left houses the f1 s tandby"diesel-powered generator, and theair-condi tioned room on the righthouses the dc power source, theelectronics, and the fiber optics.

Figure D-4. View of the ac powercontrol panel and ventilation fanlocated in the "standby" generatorroom.
Figure D-6. View of the batterycharging and monitoring circuitelectronics.
75
Figure D-5. View of the batterybank ,which provides the dc powerand serves as the uninterruptablepo:wer source.

Figure 0-7. Front view of the fiberoptic connection/distri bution chassis with protective cover in lace.
Figure 0-9. View of the fi ber opticcables showing the overhead routing.
The 4-inch (10.1-cm) diameterpvc conduit and the 1.5-inchD.8-cm) flexible conduit feedinginto the fiber optic connection/distri bution chassis are shown. Thetop rear portion of the regeneratorelectroni cs cabinet is visible inthe lower portion of the photograph.
76
Figure 0-8. Front view of the fiberoptic connection/distribution chassis with protective cover removed.
Six fiber pairs, their connections, and the coils of spare fiberare visi ble. Three of the fiberpairs are active, one pair is on"hot standby" and the remaining twofiber pairs are spares~
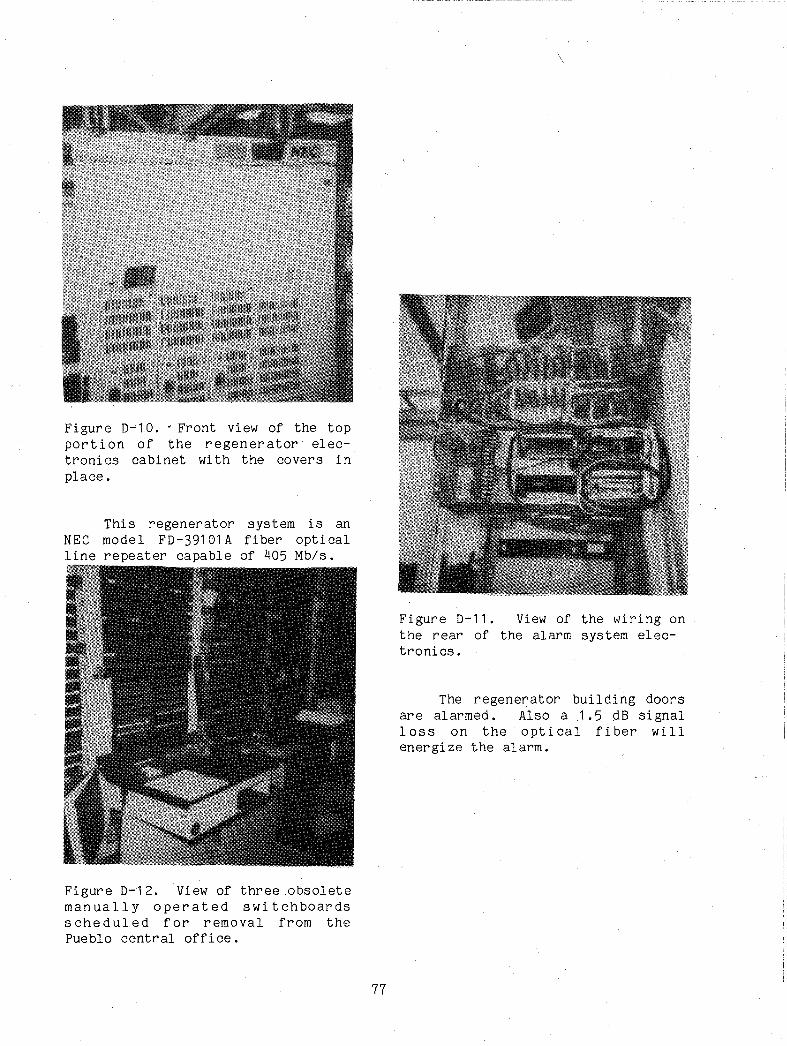
Fi gur e D~ 10. . Front vi ew of the topportion of the regenerator electronics cabinet wi th the covers inplace.
This regenerator system is anNEe model FD-391 01 A fiber opticalline repeater capable of 405 Mb/s.
Figure D-12. View of three .obsoletemanually operated swi tchboardss che d uled f or removal from thePueblo central office.
77
\
Figure D-11. View of the wiring onthe rear of the alarm system electronics.
The regenerator bUilding doorsare alarmed. Also a 1.5 dB signalloss on the optical fiber willenergize the alarm.


APPENDIX EINFORMATION ON A TYPICAL
UNDERGROUND (CEV) REGENERATOR STATION
Photographs of the Colorado Springs Regenerator Station Located ina Controlled Environment Vault (CEV) Located Adjacent to the
Easement Along the South Side of Garden of the Gods Road1.5 Miles (2.4 Km) West of Interstate Highway 25.
79

Figure E-1. View of the southeastcorner of the CEV entrance.
The CEV entrance cover is inthe foreground and the airconditioning unit is located in thehousing immediately behind.
Figure E-3. View of the publicut iIi ty servi ce entrance controlpanel on the left and the CEVen vi ronmental control panel andsensors on the right.
Figure E-2. View of the CEVentrance with the lid up.
The entrance ladder and some ofthe alarm circui t components can beseen. Note the cover lock in bottomforeground.
80

Figure E-4. View of the fiber opticcable entrance into the top of theCEV.
The cables are housed in 4-inch(10.1-cm) rigid conduit from theutil i ty tunnel under the center ofthe road. Twenty-fourfi ber pairsenter the CEV at this point.
81
Figure E-5. Front view of the fiberoptic connection./distri bution chassis with protecti v;e door open.
The two fiber pairs being utilized in this installation can beseen in this photograph.

These units are AT&T model DDN1000 dual DS3 multiplexers.
Figure E-6.electronicssupplies.
View of the regeneratorand associ ated. power
Figure E-7. View of the conventional copper wire pair circuitsthat exit the CEV.
The copper wire patch panel canbe seen in the foreground.
82
Figure E-8. View of the CEV walland a typical equipment rack mounting upright support post.
The equipment support postcontains a complete complement ofwiring ready to connect to theelectronic equipment when futureexpansion is required. The blackhorizontal line across the photograph is the nonnardening siliconetype sealant used to seal the upperhalf of the CEV to the lower half.The CEV concrete wall thickness is6 inches (15 cm) throughout.
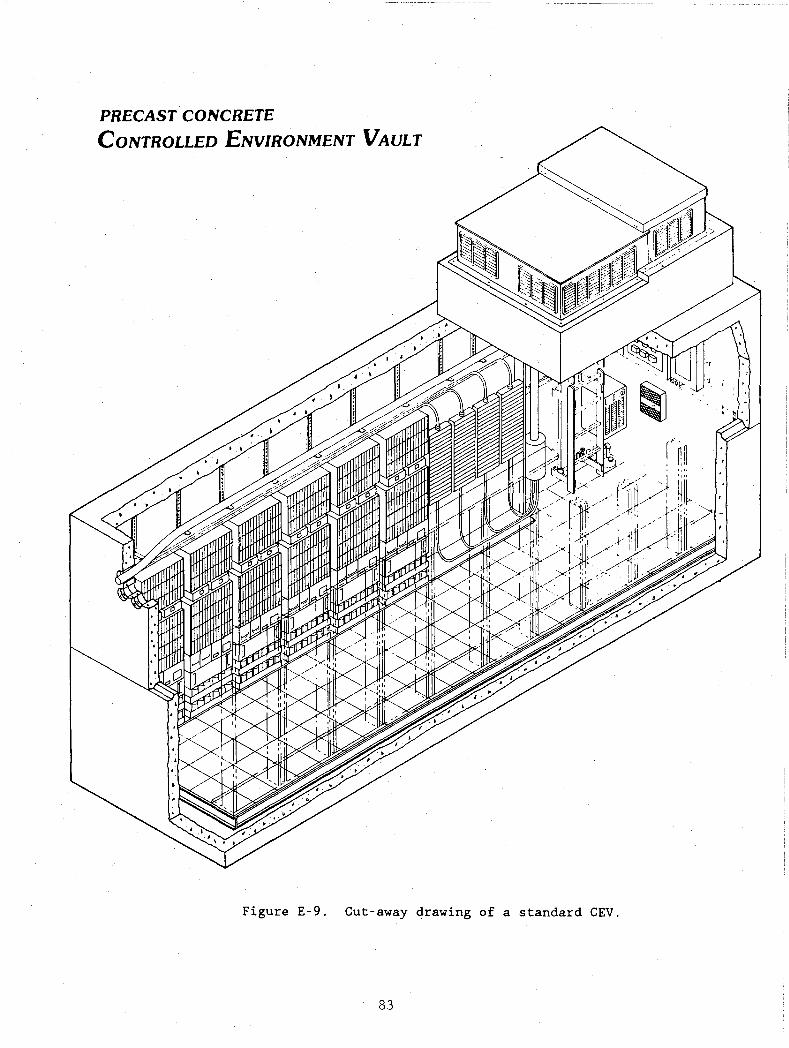
PRECAST CONCRETE
CONTROLLED ENVIRONMENT VAULT
Figure E-9. Cut-away drawing of a standard CEV.
83
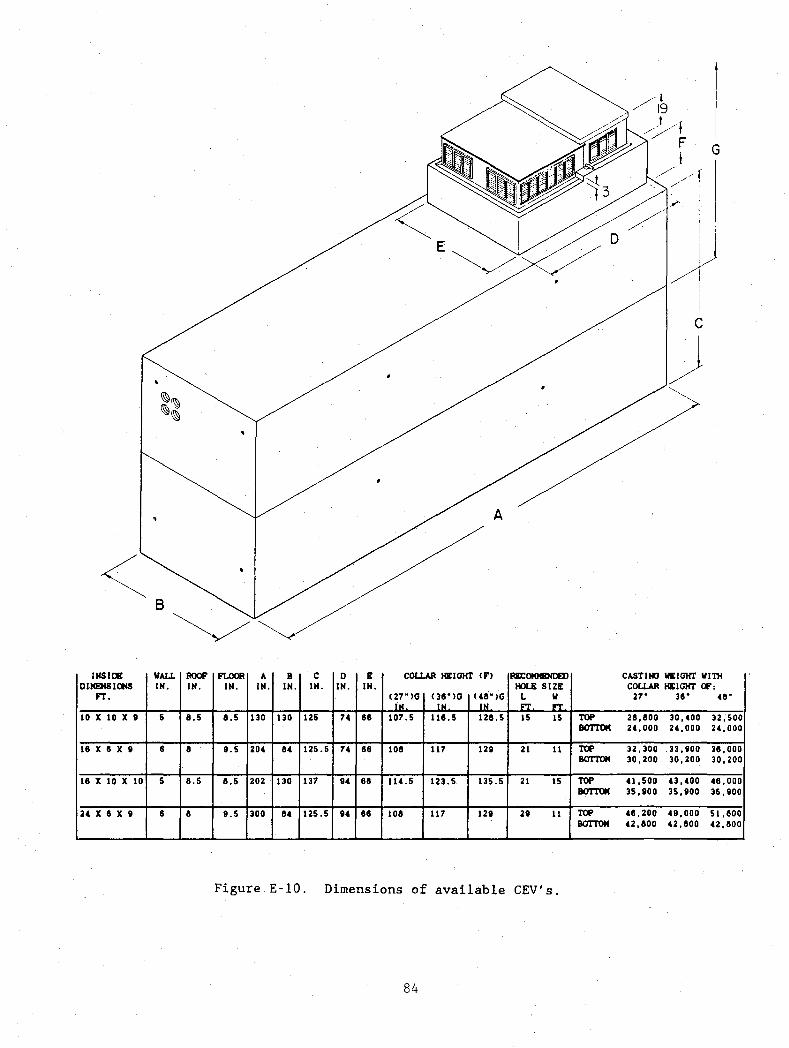
<INSUlt VALL ROOF FLOOR A B C 0 E COLLAR HIt IGIn' (F) Rl£COMMIDltlID CASTII«l WIEIGKJ' VIlli
DIIGDlSIONS IN. IN. IN. IN. IN. IN. IN. IN. HOLE SIZE COLLAR H1t1GKJ' OF:FT. (27")0 (38")0 (48")0 L V 27" 38" 48"
IN. IN IN no "'10 X 10 X 9 5 8.5 8.5 130 130 125 74 88 107.5 118.5 128.5 15 15 TOP 28,800 30,400 32,500llOTTOI( 24,000 24,000 24,000
18 X 8 X 9 8 8 9.5 204 84 125.5 74 88 108 117 129 21 11 TOP 32,300 33,900 38,000llOTTOI( 30,200 30,200 30,200
18 X 10 X 10 5 8.5 8.5 202 130 137 94 68 114.5 123.5 135.5 21 15 TOP 41,500 43,400 46,000llOTTOI( 35,900 35,900 35,900
24 X 6 X 9 6 8 9.5 300 84 125.5 94 88 108 117 129 29 11 TOP 48,200 49,000 51,800BOTI'OM 42,800 42,800 42,800
Figure E-IO. Dimensions of available CEV's.
84
APPENDIX F
CONSIDERATION OF IONIZING RADIATION SHIELDING FOR OPTICAL FIBERS
T. J. Englert
A Brief Summary of the Physical Processes Involved inRadiation Interaction with Matter and How these
Processes Relate to ShieldingCongiderations
85
TABLE OF CONTENTS
1. INTRODUCTION
2. UNITS COMMONLY USED IN RADIATION AND SHIELDING
2.1 Energy Units
2.2 Units of Radiation Dose
2.2.1 The curie (Ci)
2.2.2 The roentgen (r) and roentgen equivalent man (rem)
2.2.3 The rad and the gray (Gy)
3. INTERACTION OF RADIATION WITH MATTER
3.1 The Structure of Matter Relative to Radiation Absorption
3.2 Penetration Range of Radiation in Matter
3.3 Alpha Particle Interaction with Matter
3.4 Beta Particle Interaction with Matter
3.5 Gamma Interaction with Matter
3.5.1 Photoelectric process
3.5.2 Compton process
3.5.3 The Pair-Production process
3.6 Photonuclear Reactions
4. RADIATION ATTENUATION OR SHIELDING
4.1 Shielding for Alpha Radiation
4.2 Shielding for Beta Radiation (Electrons)
4.3 Shielding for Gamma Radiation (Photons)
4.3.1 Build-up factor in photon shielding
4.4 Shielding Effects of Soils
5. SUMMARY
6. REFERENCES
86

FIGURES
Figure 1. Diagrams depicting the concept of range.(The diagrams shown here depict the concept of radiationpenetration in an arbitrary material. The distance regionsup to the straggling area should not be interpreted literallysince th~y do not show the exponential behavior. The rangecan be seen to represent an average maximum distance ofpenetration) •
Figure 2. Range of alpha particles in air.(Notations at points on the graph denote the radioisotope fromwhich the alpha radiation is emitted).
Figure 3. Range of electrons or beta particles in aluminum.(Note that the range units are mg/cm 2 /(Van Nostrand ScientificEncyclopedia, 1976). The range of electrons in most othersolids will not be significantly different from values shownhere since electron density changes rather slowly with atomicnumber) •
Figure 4. Diagrams depicting processes of photon energy absorption andscattering in matter.
a) Photoelectric processb) Compton scatteringc) Pair production
Figure 5. (a) Contributions of photoelectric, Compton and pair-productionprocesses to the absorption coefficient (units of cm- l
) forgamma radiation in lead.
(b) The total absorption coefficient (units of cm 2 /gm) for gammaradiation in various materials, (Van Nostrand ScientificEncyclopedia, 1976).
Figure 6. Radiation build-up process and relation to absorber thickness.(a) Diagram showing the process of scattering of radiation in an
absorber resulting in bUild~up.
(b) Build-up factor, B, for gamma radiation scattering from alead shield. Note in particular the effect of shieldingthickness on build-up.
87
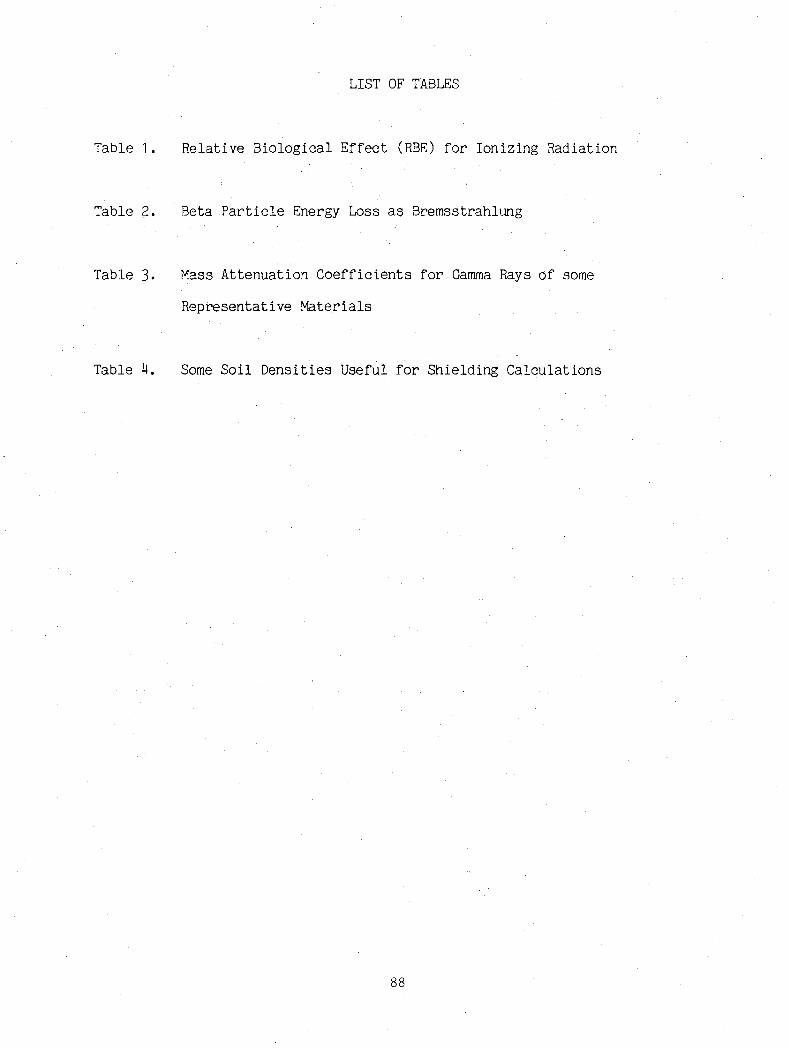
Table 1.
Table 2.
Table 3.
Table 4.
LIST OF TABLES
Relative Biological Effect (RBE) for Ionizing Radiation
Beta Particle Energy Loss as Bremsstrahlung
Mass Attenuation Coefficients for Gamma Rays of some
Representative Materials
Some Soil Densities Useful for Shielding Calculations
88

CONSIDERATION OF IONIZING RADIATION SHIELDING
FOR OPTICAL FIBERS
Thad J. Englert*
A brief overview of nuclear radiation processes is presented. Unitsof radiation energy and dose are discussed. Interactions of radiationprocesses with matter are analyzed in order to understand radiation andits energy. Range is discussed in relation to structures of matter inrepresentative materials. Specific emphasis is placed on interaction ofthese radiation processes with soils in order to consider the ultimateeffects of radiation on optical fibers located in a medium of soil andsoil types. The shielding effects of soils are analyzed for the purposeof understanding radiation damage to any buried cable which may containoptical fibers.
Key words: absorption coefficient, atomic structure, bremsstrahlung,build-up, buried cable, ionizing radiation, nuclearparticle absorption, optical fibers(s), photon absorption,radiation damage, radiation shielding, soil attenuation,x-ray absorption.
1. INTRODUCTION
The superiority of optical fibers in many applications of communications
and data transmission is widely accepted. Deterioration of the optical quality
of this type of fiber has been found to result when these fibers are exposed
to ionizing radiation (Friebele, et al., 1985), however, prompting further
considerations of fiber use in radiation environments. The radiation
*The author is with the Department of Electrical Engineering, University of
Wyoming, Laramie, Wyoming.
89

environment might be caused by natural conditions, such as that surrounding an
optical fiber cable buried in a region with relatively large quantities of
naturally-occurring radioisotopes, or man-made regions of concentrated
radiation such as those near or in a reactor or fallout following a nuclear
event. In either case the problems of shielding the cable from ionizing
radiation are similar. This report is a brief summary of the physical
processes involved in radiation interaction with matter and the relation of
these processes to shielding considerations. It is assumed that the reader
has some previous knowledge of atomic structure and the kinds of particles or
photons associated with radioactivity (Englert, 1987).
Since the units used to describe and measure radiation and radiation
dose are often confusing, some time will be given to these topics. Some
sample calculations in shielding will also be presented with the hope of
providing some clarification.
2. UNITS COMMONLY USED IN RADIATION AND SHIELDING
The unit of energy most commonly used to describe radiation is the
electron-volt (eV). One electron-volt is that amount of potential energy of
an electron in an electric potential of one volt or that amount of kinetic
energy of an electron after acceleration through one volt. As the name
"electron-volt" implies, 1 eV of energy is the product of the electron's
charge times one volt. (A quick review of your basic physics text will
refresh your memory. The product of electric charge times electric potential
yields energy or work units.)
The conversion from electron-volts to joules is straightforward:
.1 eV (magnitude of charge on electron) x (1 volt)
90
(1)
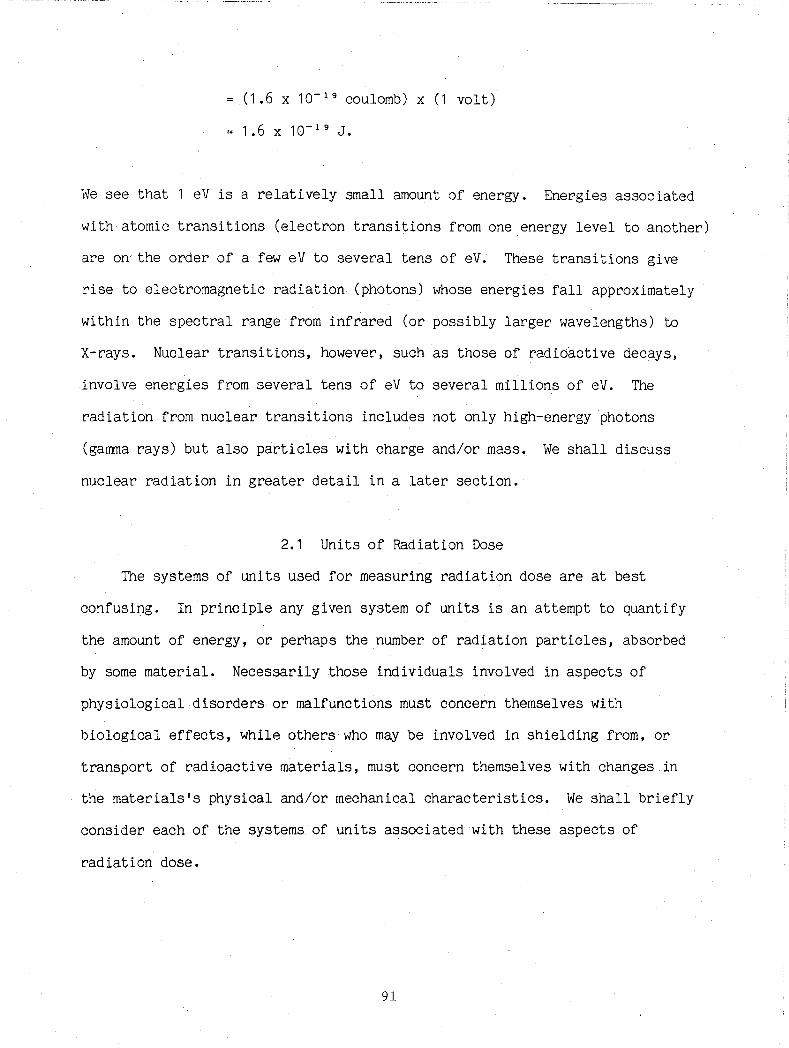
(1.6 X 10- 19 coulomb) x (1 volt)
1.6 x 10- 1 9 J.
We see that 1 eV is a relatively small amount of energy. Energies associated
with atomic transitions (electron transitions from one energy level to another)
are on the order of a few eV to several tens of eV. These transitions give
rise to electromagnetic radiation (photons) whose energies fall approximately
within the spectral range from infrared (or possibly larger wavelengths) to
X-rays. Nuclear transitions, however, such as those of radioactive decays,
involve energies from several tens of eV to several millions of eV. The
radiation from nuclear transitions includes not only high-energy photons
(gamma rays) but also particles with charge and/or mass. We shall discuss
nuclear radiation in greater detail in a later section.
2.1 Units of Radiation Dose
The systems of units used for measuring radiation dose are at best
confusing. In principle any given system of units is an attempt to quantify
the amount of energy, or perhaps the number of radiation particles, absorbed
by some material. Necessarily those individuals involved in aspects of
physiological disorders or malfunctions must concern themselves with
biological effects, while others who may be involved in shielding from, or
transport of radioactive materials, must concern themselves with changes in
the materials's physical and/or mechanical characteristics. We shall briefly
consider each of the systems of units associated with these aspects of
radiation dose.
91
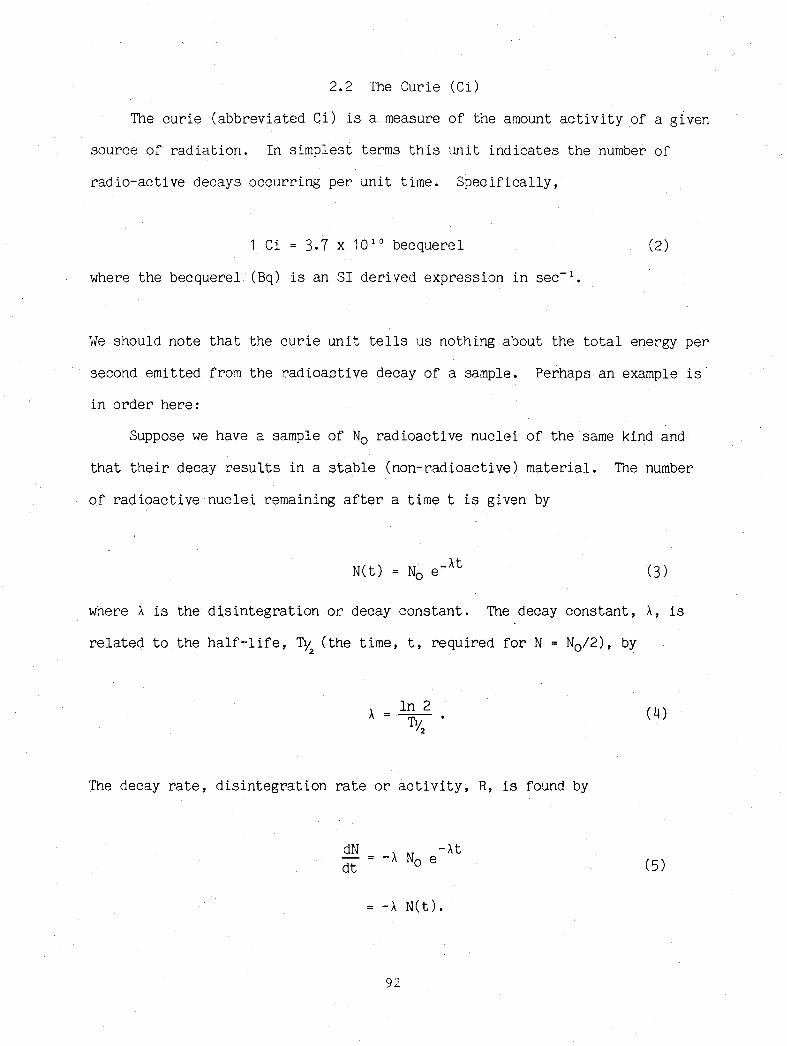
2.2 The Curie (Ci)
The curie (abbreviated Ci) is a measure of the amount activity of a given
source of radiation. In simplest terms this unit indicates the number of
radio-active decays occurring per unit time. Specifically,
1 Ci = 3.7 x 10 10 becquerel
where the becquerel (Bq) is an SI derived expression in sec-I.
(2)
We should note that the curie unit tells us nothing about the total energy per
second emitted from the radioactive decay of a sample. Perhaps an example is
in order here:
Suppose we have a sample of No radioactive nuclei of the same kind and
that their decay results in a stable (non-radioactive) material. The number
of radioactive nuclei remaining after a time t is given by
where A is the disintegration or decay constant. The decay constant, A, is
related to the half-life, T~ (the time, t, required forN = No/2), by
In 2A = TY.
2
The decay rate, disintegration rate or activity, R, is found by
(4)
dN- =dt
_, N -At1\ 0 e
-A N(t).
92
(5)
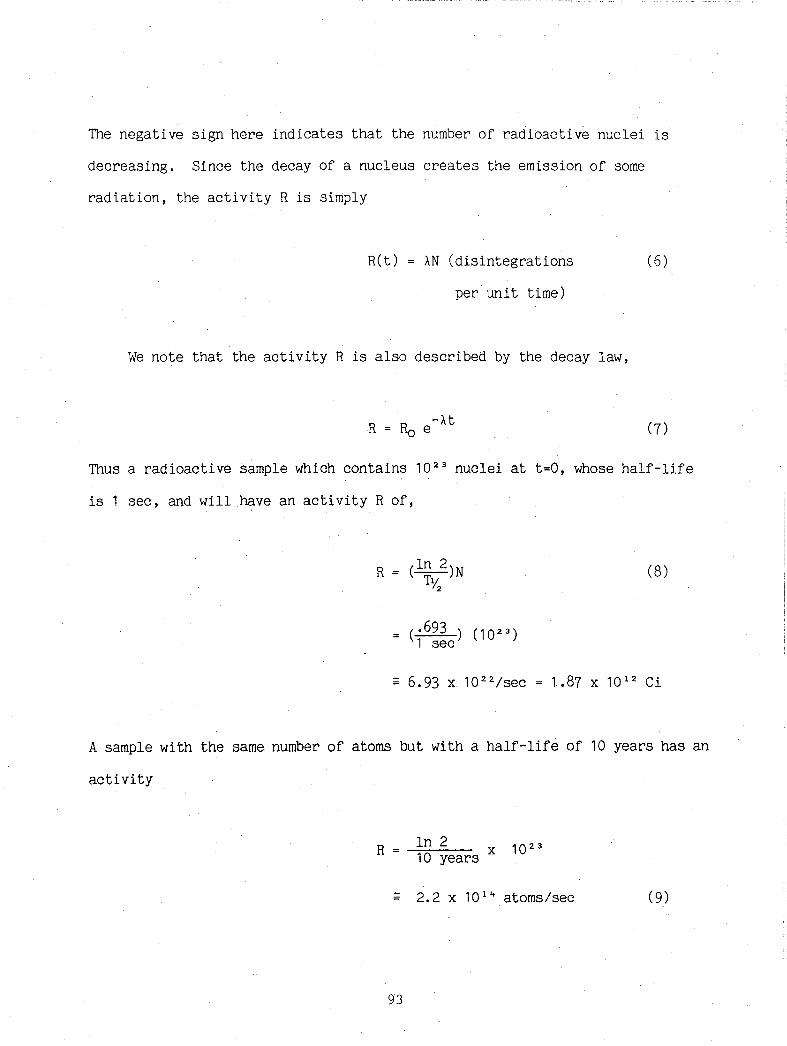
The negative sign here indicates that the number of radioactive nuclei is
decreasing. Since the decay of a nucleus creates the emission of some
radiation, the activity R is simply
R(t) AN (disintegrations
per unit time)
(6)
We note that the activity R is also described by the decay law,
Thus a radioactive sample which contains 10 23 nuclei at t=O, whose half-life
is 1 sec, and will have an activity R of,
R
( .693 ) (10 23 )1 sec
- 6.93 x 10 22 /sec
(8)
1.87 X 10 12 Ci
A sample with the same number of atoms but with a half-life of 10 years has an
activity
R
93
ln 2 x 102310 years
2.2 X 101q atoms/sec (9)

5.94 x 10 3 Ci
Thus the acti vi ty is greatly influenced by the half-life of the material.
2.3 The Roentgen (R) and Roentgen Equivalent Man (rem)
These two sets of units are included in the same section since they are
closely related. The roentgen unit is a measure of radiation energy loss in
terms of ionization of air that is exposed to the radiation, while the rem is
an attempt to include the relative effects of different types of radiation in
human tissue. The definitions are as follows:
1 R ~ that amount of X- or gamma-radiation interacting with air,
so as to cause ion pairs amounting to a total charge of
3.56 x 10- 10 coulombs in 1 cc of air at standard conditions.
The rem is an attempt to relate the ionizing capabilities of various types of
radiation to their relative interaction with human tissue,
1 rem (1 r) x (RBE) (10)
where "RBE" is the relative biological effect for the specific type of radia
tion. Table 1 shows accepted values (Van Nostrand Scientific Encyclopedia,
1976) •
94

Table 1. Relative Biological Effect (RBE) for Ionizing Radiation
Radiation Type RBE
X- and gamma
beta
alpha 20
fast neutrons* 10
slow (thermal) neutrons 5
*"Fast" neutrons are those within the approximate energy
range of 0.1 MeV to 10 MeV. For energies greater than 10 MeV
the RBE increases rapidly.
3. INTERACTION OF RADIATION WITH MATTER
The interaction of ionizing radiation with matter occurs in various modes,
depending on the type of radiation as well as the energy of the radiation par
ticles and photons. Consideration of the processes of radiation energy absorp
tion by materials becomes especially important if we are to understand and
compensate for radiation damage in optical devices and if we are to provide
effective shielding of optical devices from damaging radiation.
95

Although the interaction of radiation with materials is quite varied,
there is sufficient uniformity to allow us to treat this interaction according
to the general categories of charged particles, neutral particles and photons.
Before we address the specific behavior of the various types of radiation and
how they interact with matter, some general properties of matter are presented
as well as a brief look at the statistical nature of radiation absorption.
3.1 The Structure of Matter Relative to Radiation Absorption
A complete understanding of the structure of matter at the atomic level
at which interactions under consideration here would occur, would require a
working knowledge of quantum mechanics and special relativity. This is beyond
the scope, and intent, of this report. However we can gain a good deal of
insight through some simple considerations.
The "absorption" of radiation by matter means that the radiation has given
up its energy to the material through which it passes, by some mechanism or
other. We shall discuss these processes in later sections, but it is
sufficient that charged particles such as electrons and alpha particles,
interact via coulomb forces, which are relatively long-range forces while
electrically neutral radiation such as photons and neutrons must suffer nearly
head-on collisions with constituent particles of the material in order to give
up their energy.
Atomic structure is well known to consist of a positively charged central
core (the nucleus) surrounded by a negative "cloud" of electrons. Atomic radii
are on the order of 10- 7 cm. or less, while those of nuclei are on the order of
10- 12 cm. An empirical formula for determining nuclear radii, r, is given by
(11)
96

where A is the atomic mass number of the given element. ~e see therefore,
that there is in effect a rather large fraction of empty space in the atom.
It is no wonder that head-on collisions of radiation with electrons and/or
nuclei of the material are rare events. The effect of the coulomb force,
which extends beyond atomic dimensions, contributes to the interaction of
ionizing radiation with those nuclei and electrons which make up the absorbing
material.
3.2 Penetration Range of Radiation in Matter
The scattering or interaction of particles and photons as they propagate
through matter is necessarily statistical. Thus when we refer to a distance
of penetration by radiation into matter, commonly referred to as range, we
really mean the average distance. It's a bit like throwing rocks into a dense
thicket of trees. Some rocks will go farther than others, but if we threw
enough rocks (all assumed to have the same mass and speed) we would find that
their penetration into the forest would tend to cluster about an average. The
variation about the average range is often referred to as straggling. (See
Figure 1.)
We find that there are two convenient measures of range which we shall
discuss briefly. An obvious kind of measurement is simply a linear distance,
x, measured in units of length (em, m, inches, etc.). A second kind of measure
pertains to the amount of matter penetrated by the incident radiation with
units of gm/cm 2• At first glance, this may seem awkward, but a moment's
consideration will show you that this measure of penetration actually makes
good sense.
97

"\; EXTnAPOLATEO: RANGEIIIIIIIIIIIIIII,,I
o ISTANC"E .
DISTANCE
( .. )
(A )
STRAGGLINGJ- ~r ;
I,II· CUT-OFF
~. DISTANCE
: 0" MEAN "Af'-GEIrIII
NUMBF:ROF
PA"TICLf::.S
INTENS lTV
Figure 1. Diagrams depicting the concept of range.
(The diagrams shown here depict the concept of radiationpenetration in an arbitrary material. The distance regions upto the straggling area should not be interpr'Elted li terally since cethey do not show the exponential behavior. The range can beseen to represent an average maximum distance of penetration).
98
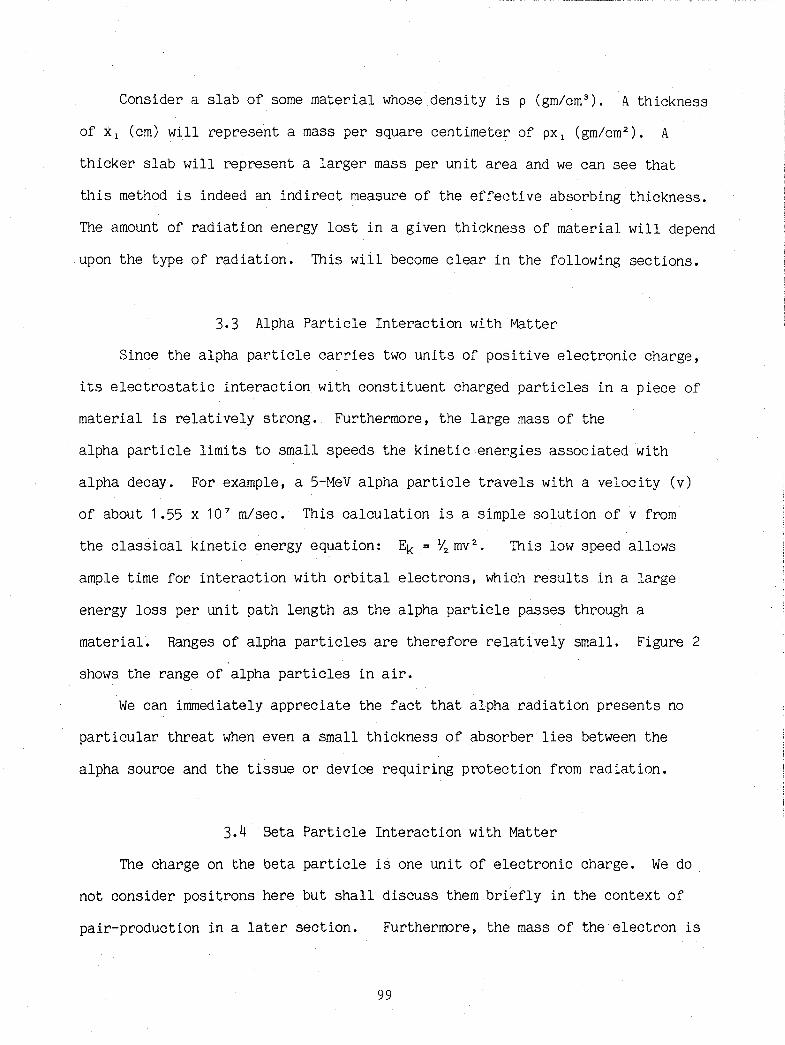
Consider a slab of some material whose density is p (gm/cm 3). A thickness
of Xl (cm) will represent a mass per square centimeter of pX l (gm/cm2). A
thicker slab will represent a larger mass per unit area and we can see that
this method is indeed an indirect measure of the effective absorbing thickness.
The amount of radiation energy lost in a given thickness of material will depend
upon the type of radiation. This will become clear in the following sections.
3.3 Alpha Particle Interaction with Matter
Since the alpha particle carries two units of positive electronic charge,
its electrostatic interaction with constituent charged particles in a piece of
material is relatively strong. Furthermore, the large mass of the
alpha particle limits to small speeds the kinetic ,energies associated with
alpha decay. For example, a 5-MeV alpha particle travels with a velocity (v)
of about 1.55 x 10 7 m/sec. This calculation is a simple solution of v from
the classical kinetic energy equation: Ek = Y2mv2. This low speed allows
ample time for interaction with orbital electrons, which results in a large
energy loss per unit path length as the alpha particle passes through a
materiaL Ranges of alpha particles are therefore relatively smalL Figure 2
shows the range of alpha particles in air.
We can immediately appreciate the fact that alpha radiation presents no
particular threat when even a small thickness of absorber lies between the
alpha source and the tissue or device requiring protection from radiation.
3.4 Beta Particle Interaction with Matter
The charge on the beta particle is one unit of electronic charge. We do
not consider positrons here but shall discuss them briefly in the context of
pair-production in a later section. Furthermore, the mass of the electron is
99

16
15
13
12
W 9
"Z0( 6rrZ 70(W
I 6
1_.I
air /-~/Thc1at
Vr-T~C'"
7 Theine
~·n:tc')
/-- 7
~rn
-
-~., I.,'".,- DI'8
5 • 6 10 II 12
Figure 2. Range of alpha particles in air.
(Notations at points on the graph denote the radioisotope fromwhich the alpha radiation is emitted).
100

only approximately 1/1836 the mass of the proton, which leads to relatively
large speeds for typical nuclear decay energies. A 5-MeV electron, for
example, has a speed of 0.998 c, where c is the speed of light. Techniques of
special relativity must be used in calculating such speeds of beta particles.
As such, the net result of these features is that beta particles exhibit much
larger ranges of penetration in materials than those of alpha particles.
Figure 3 shows the range of beta particles in aluminum. Note that the axes of
this graph are logarithmic.
As a beta particle suffers scattering on its path through material,
ionization of the constituent atoms may occur. A secondary process must also
be considered, namely bremsstrahlung radiation. Each "collision" of the beta
particle results in a change in its momentum, either in direction or
magnitude, or both. These changes in momentum result in the emission of
radiation due to these collisions. This is precisely the process used in
X-ray machines wherein a beam of electrons is typically stopped by a heavy
metal target. The emitted X-radiation is a result of the sudden deceleration
of the electrons. We, find that a significant fraction of beta-radiation
energy goes into bremsstrahlung radiation energy 2S the beta particle
traverses a material. Table 2 gives the fractional loss of energy to
bremsstrahlung for several materials and beta energies.
101

10,0001000
0.11=-----I------117'L----I-----t-----d
OO.l.':-.Jo<::..J:..l...LLJW!:~.L..I.....u...L.ll.I.L-L-LJUl.illl-.L-L.l.JU1JW--l-LJ..lJ.LUJQl 100
Figure 3. Range of electrons or beta particles in aluminum.
[Note that the range units are mg/cm 2 (Van Nostrand ScientificEncyclopedia, 1976). The range of electrons in most othersolids will not be significantly different from values shownhere electron since gensity changes rather slowly with atomic numberJ.
102
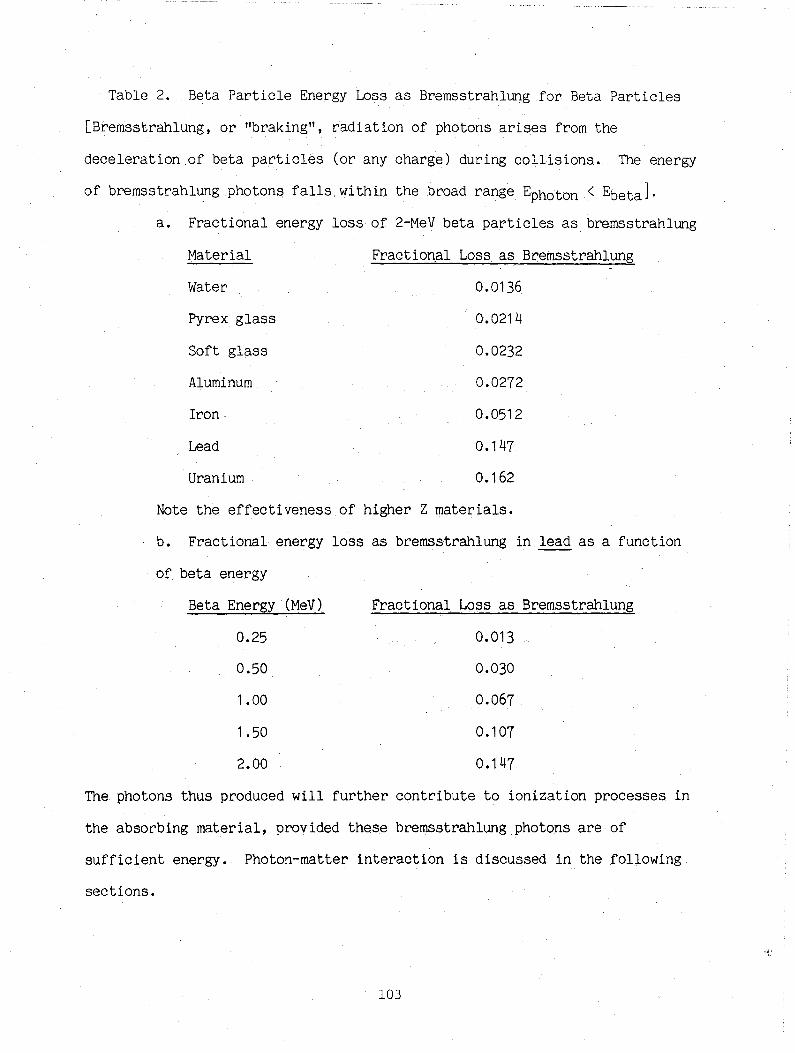
Table 2. Beta Particle Energy Loss as Bremsstrahlung for Beta Particles
[Bremsstrahlung, or "braking", radiation of photons arises from the
deceleration of beta particles (or any charge) during collisions. The energy
of bremsstrahlung photons falls within the broad range Ephoton< Ebeta]'
a. Fractional energy loss of 2-MeV beta particles as bremsstrahlung
Material
Water
Pyrex glass
Soft glass
Aluminum
Iron
Lead
Uranium
Fractional Loss as Bremsstrahlung
0.0136
0.0214
0.0232
0.0212
0.0512
0.141
0.162
Note the effectiveness of higher Z materials.
b. Fractional energy loss as bremsstrahlung in lead as a function
of beta energy
Beta Energy (MeV)
0.25
0.50
1.00
1.50
2.00
Fractional Loss as Bremsstrahlung
0.013
0.030
0.061
0.101
0.141
103

3.5 Gamma Interaction with Matter
A gamma photon is the electromagnetic quantum of energy given off during
some radioactive decays. It would be misleading to imply that only gamma
photons are capable of causing damage in materials since any high-energy
photon can cause such effects. The point is that we really cannot distinguish
between gamma photon and any other photon of the same energy. We therefore,
for purposes of discussion here, make no differentiation between gamma
radiation such as X-radiation, and lump all such electromagnetic radiation
into the term photon.
Photon-electron interactions account for nearly all photon absorption in
matter, at least within the range of photon energies pertinent to this report.
Anyone of three processes is possible; photoelectric, compton and pair-produc
tion (the likelihood of the specific process depending on the photon energy).
Each process results in secondary electrons which subsequently interact with
matter as outlined in Section 3.4. We shall discuss these processes
separately. However, it should be kept in mind that they are competing
processes. A beam of photons, with sufficient energy per photon, will likely
exhibit all three processes as the beam interacts with matter. The relative
amounts of photoelectric, compton and pair-production processes will depend on
the energy of the photons making up the beam.
3.5.1 Photoelectric Process
Figure 4(a) depicts the generation of a photoelectron. Here the energy
of the incident photon is completely absorbed by an atomic electron and the
photoelectron thus created represents ionization of the atom. The kinetic
energy Ee ?f the photoelectron is given by
104
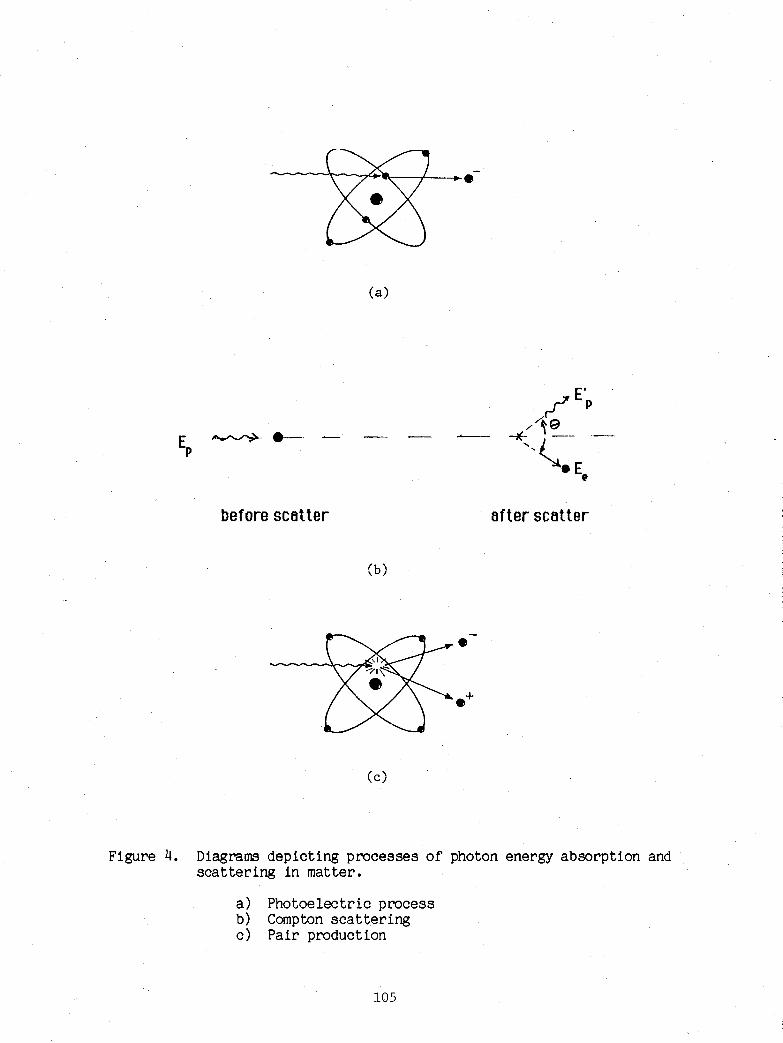
(a)
before scotter
(b)
(c)
ofter scotter
Figure 4. Diagrams depicting processes of photon energy absorption andscattering in matter.
a) Photoelectric processb) Compton scatteringc) Pair production
105
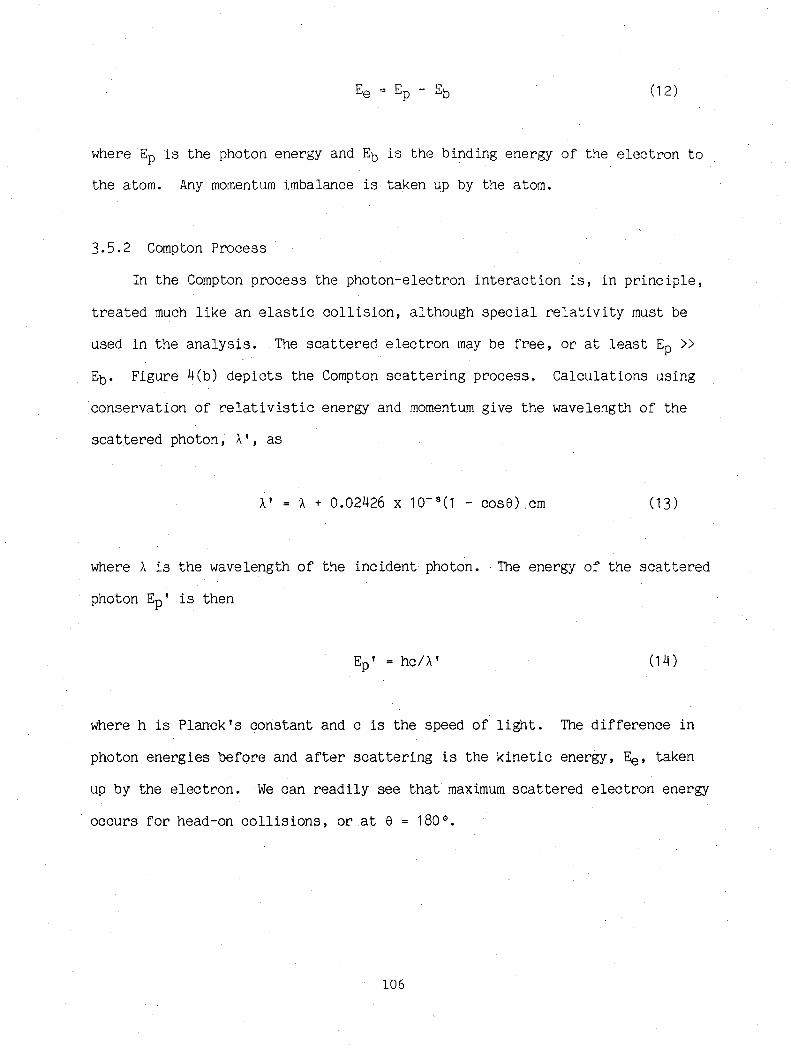
(12)
where Ep is the photon energy and Eb is the binding energy of the electron to
the atom. Any momentum imbalance is taken up by the atom.
3.5.2 Compton Process
In the Compton process the photon-electron interaction is, in principle,
treated much like an elastic collision, although special relativity must be
used in the analysis. The scattered electron may be free, or at least Ep »
Eb' Figure 4(b) depicts the Compton scattering process. Calculations using
conservation of relativistic energy and momentum give the wavelength of the
scattered photon, A', as
A' A + 0.02426 x 10- 8 (1 - cose) cm (13 )
where A is the wavelength of the incident photon. The energy of the scattered
photon Ep ' is then
Ep '= hC/A' (14)
where h is Planck's constant and c is the speed of light. The difference in
photon energies before and after scattering is the kinetic energy, Ee , taken
up by the electron. We can readily see that maximum scattered electron energy
occurs for head-on collisions, or at e = 180°.
106

3.5.3 The Pair-Production Process
As the name ilnplies, pair production results in the creation of an electron
positron pair. the positron is the antiparticle of the electron and is the
same as the electron in all respects except that its charge is positive. Pair
production begins to occur when the photon has an energy at least twice mc 2
where mc 2 is the mass energy of an electron. As a photon with Ep > 2 mc 2
passes within the vicinity of a nucleus, the photon may be annihilated, during
which time the energy of the photon is converted into the mass energy of the
electron and positron. Any energy in excess of 2 mc 2 becomes kinetic energy
of the particles thus created. Figure 4(c) depicts a pair-production event.
The electron proceeds on its way through the material, interacting with
matter as described earlier. The positron also interacts with the matter,
causing ionization in the same way as the electron. However, it ultimately
results in relatively high energy gamma photons as we shall see.
Once the positron has lost sufficient energy, through collision processes,
to reduce its speed sufficiently, it.will form a short-lived bound system with
an electron. The binding together of the electron and positron takes place
via the coulomb interaction (attraction of two unlike charges). This
combination annihilates the electron and positron which results in the
production of two 0.511-MeV gamma rays. This is just a manifestation of
energy conservation since mc 2 = 0.511 MeV for an electron. The two photons
created by the annihilation of the electron and positron will then interact
with the material as described in previous sections of this report.
107

3.6 Photonuclear Reactions
If a photon has energy Ep > 10 MeV it is possible for this photon to direct
ly interact (collide) with a nucleus, causing the ejection of one or more nu
cleons (neutrons and protons).
The ejection of a neutron does not change the atomic number, Z, and so
the remaining nucleus is an isotope of the same element represented by the
nucleus before the collision. The ejection of a proton decreases the atomic
number of the affected nucleus by 1 and so this new isotope is also a
different element which may be radioactive. Often, however, this new isotope
is radioactive and may decay via any of the radioactive decay processes,
depending on the isotope.
It is further possible that combinations of nucleons may be ejected,
resulting in new isotopes and/or new elements, which may also be radioactive.
The reader is referred to the chart of nuclides, which may be found in the CRC
Handbook of Physics and Chemistry.
4. RADIATION ATTENUATION OR SHIELDING
Shielding is perhaps a misnomer, although used extensively, to describe
protection from radiation. Absorber might be a better word since it more ac
curately describes the processes involved in radiation "shielding". In effect,
any shielding process really involves the absorption of the radiation energy
before the particles and/or photons reach the object we wish to protect. The
absorption processes are those interactions of radiation with matter described
in the preceding sections.
We investigate the shielding qualities of several materials, depending on
the type and energy of the radiation, and we also attempt to generalize
shielding effects to facilitate calculations.
108
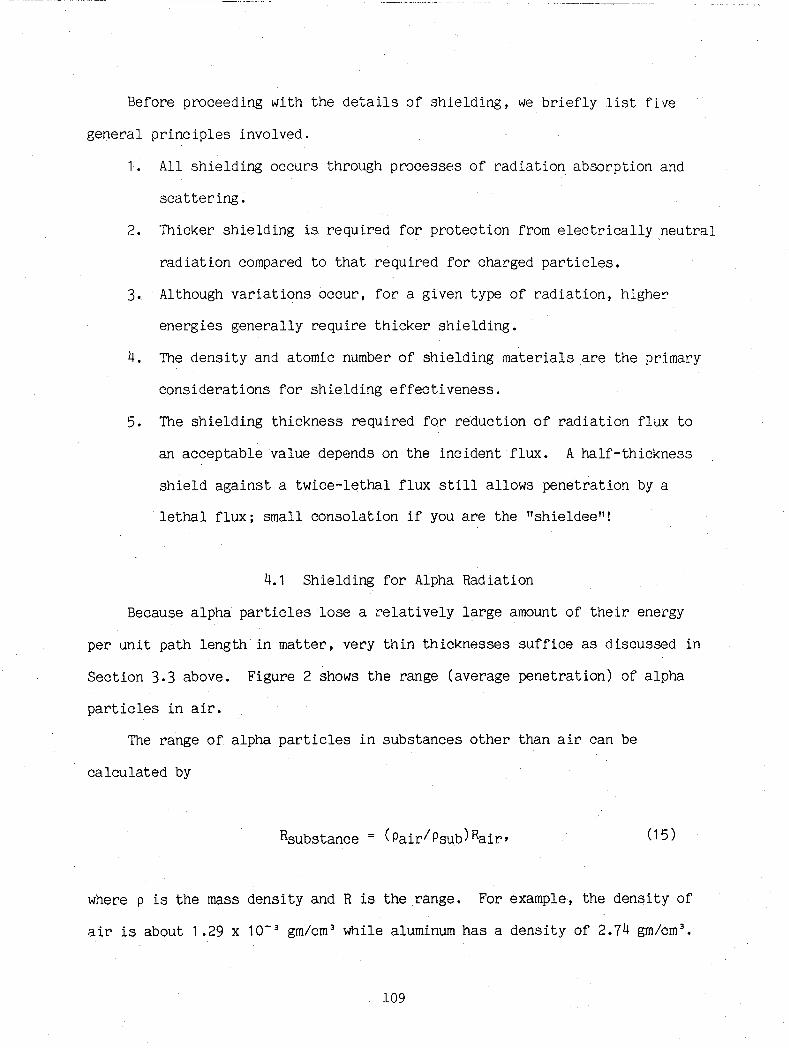
Before proceeding with the details of shielding, we briefly list five
general principles involved.
1. All shielding occurs through processes of radiation absorption and
scattering.
2. Thicker shielding is required for protection from electrically ,neutral
radiation compared to that required for charged particles.
3. Although variations occur, for a given type of radiation, higher
energies generally require thicker shielding.
4. The density and atomic number of shielding materials are the primary
considerations for shielding effectiveness.
5. The shielding thickness required for reduction of radiation flux to
an acceptable value depends on the incident flux. A half-thickness
shield against a twice-lethal flux still allows penetration by a
lethal flux; small consolation if you are the "shieldee"!
4.1 Shielding for Alpha Radiation
Because alpha particles lose a relatively large amount of their energy
per unit path length in matter, very thin thicknesses suffice as discussed in
Section 3.3 above. Figure 2 shows the range (average penetration) of alpha
particles in air.
The range of alpha particles in substances other than air can be
calculated by
Rsubstance (15 )
where p is the mass density and R is the range. For example, the density of
air is about 1.29 x 10- 3 gm/cm 3 while aluminum has a density of 2.74 gm/cm 3•
109
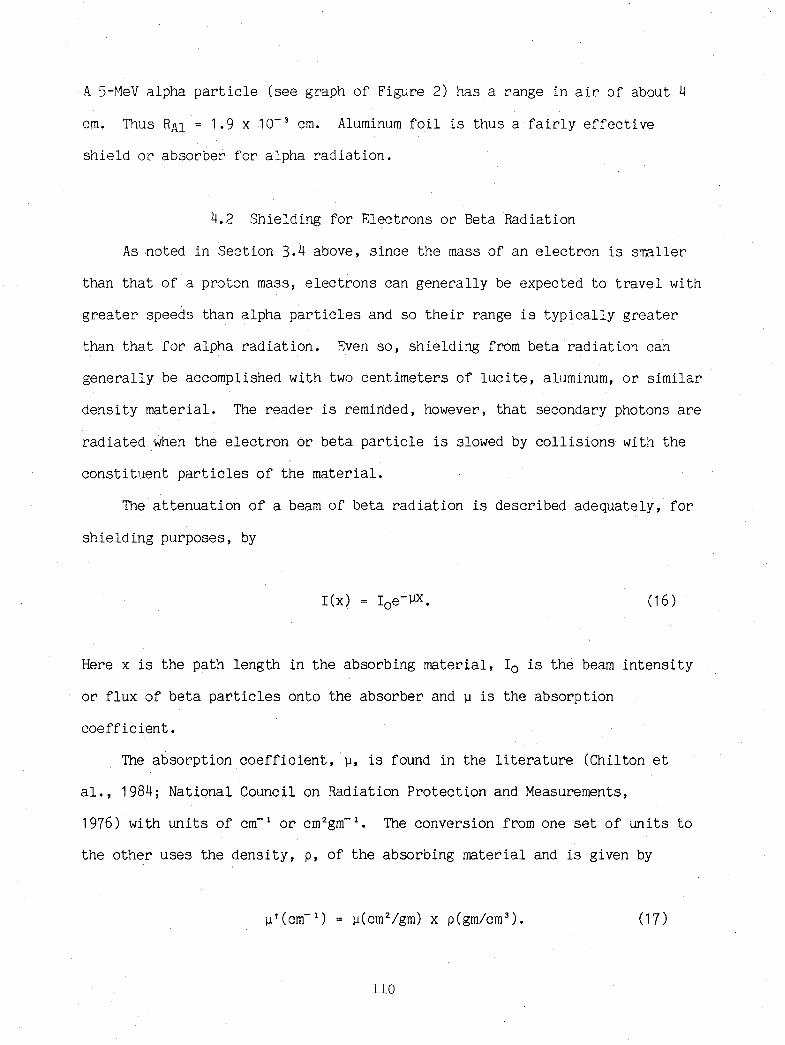
A 5-MeV alpha particle (see graph of Figure 2) has a r'ange in air' of about 4
cm. Thus RAI = 1.9 X 10- 3 cm. Aluminum foil is thus a fair'ly effective
shield Or' absor'ber' for' alpha radiation.
4.2 Shielding for' Electr'ons Or' Beta Radiation
As noted in Section 3.4 above, since the mass of an electr'on is smaller'
than that of a pr'oton mass, electrons can gener'ally be expected to tr'avel with
gr'eater speeds than alpha particles and so their r'ange is typically gr'eater
than that for' alpha radiation. Even so, shielding fr'om beta r'adiation can
genemlly be accomplished with two centimeters of lucite, aluminum, Or' similar
density mater'ial. The reader' is r'eminded, however, that secondary photons ar'e
radiated when the electron or beta par'ticle is slowed by collisions with the
constituent par'ticles of the material.
The attenuation of a beam of beta r'adiation is descr'ibed adequately, for'
shielding purposes, by
I(x) (16 )
Here x is the path length in the absorbing rnater'ial, Io is the beam intensity
Or' flux of beta particles onto the absorber and ~ is the absor'ption
coefficient.
The absorption coefficient, ~, is found in the liter'ature (Chilton et
al., 1984; National Council on Radiation Pr'otection and Measurements,
1976) with units of cm- 1 or cm 2 gm- 1• The conversion from one set of units to
the other uses the density, p, of the absorbing material and is given by
(17 )
no

A simila~ conversion is useful in calculating thicknesses of abso~bers.
Example:
The thickness of aluminum ~equired to ~educe 1.71-MeV beta ~adiation
to half its initial value (half-thickness) is
0.110 gm/cm 2 (Chilton et al., 1984). (18 )
That is, the abso~be~ is of such a thickness that the beta particle "sees"
0.110 gm/cm 2 of matter.
PAl 2.7 gm/cm 3
4.1 X 10- 2 em.
(19)
(20 )
4.3 Shielding fo~ Gamma Radiation (Photons)
The attenuation of photons occurs via a combination of the photoelectric,
Compton, pai~-production processes, and to a lesser degree, photonuclear
reactions at high energies. These reactions a~e discussed in Section 3.5. As
with electrons, the attenuation of gamma ~adiation is ~easonably well
described by equation (16). Some minor exceptions to this exponential
attenuation occur for photons and will be discussed briefly below. Figure
5(a) shows the contributions of the photon-electron interactions to the
absorption coefficient fo~ lead, fo~ photons up to 10 MeV.
Figure 5(b) shows the total mass absorption coefficients for several mate~-
ials fo~ photon energies up to 100 MeV.
Example:
111

O'a = Klein· Nishina Absorptionus= Klein· Nishina Scattering0' = O'a + us = Compton TotalT =Photoelectric AbsorptionK = Pair Production).10 =u+ T + K =Max. Total Attenuation
u =0'8 +O's
';'8 0.20E
oWc°0li38 0.15
c..8Q,..0 0.101l
-<
0.05
2 3 456
Energy (Mevl7 8 9 10
(a)
Pb
o
50 100Mev
205 10Photon Energy
21
Pb (821
W f!.411,P 1921
\
\ \\ HIlI
\
I,1\
,\
)1'\.1\ ", '\. U
"- ~
"- I' .--- W
'" :-. "- :::::: ? ;:;;;~, "H ~ 7 M~........ .... ~ :-- -............... -: c:::;:::::;:: Fe
--...:::: t-b- - H - r.-AII'
I CI 1 'Be
0.20
0.04
0.18
0.16
0.02
0.06
0.00o.a 0.5
0.14~ Mo (42'u 0.12S Fe (268 0.10
Be (410.08
(b)
Figure 5. (a) Contributions of photoelectric, Compton and pair-productionprocesses to the absorption coeffacient (units of em-I) forgamma radiation in lead.
(b) The total absorption coefficient (units of cm 2 /gm) for gammanadiation in various materials (Van Nostrand ScientificEncyclopedia, 1976).
112

It is informative to compare the half-thickness of 1.7-MeV photons
in aluminum to the half-thickness of 1.7-MeV electrons. (See Reference 2
for an explanation of half-thickness.) From Figure 5(b) )l ;;; .05 cm 2 /gm
for photons in aluminum.
In 2x =--Y2 )l
;;; 13.9 gm/cm 2
Converting to a linear thickness,
13.9 gm/cm 2
2.7 gm/cm 3
5.1 cm.
(21)
(22)
(23 )
Thus the shielding thickness of aluminum for photons is nearly 125 times
that for electrons for 1.7-MeV radiation. This clearly illustrates the
need for thicker shielding for photons.
Table 3 is a partial list of mass absorption coefficients in various
materials for photon energies up to 10 MeV. Two features should be noted.
The absorption tends to decrease with energy up to 10 MeV and absorption
coefficients tend to converge as photon energies approach 10 MeV. As seen in
Figure 5, however, one must exercise some caution in extrapolation of these
trends.
113

4.3.1 Build-up Factor in Photon Shielding
Tne exponential attenuation of gamma radiation or photons passing through
a material is modulated somewhat by scattering of photons back into the original
direction. This process is called build-up. Figure 6(a) depicts the build-up
phenomenon and Figure 6(b) gives some representative values of the build-up
factor, B, for photons in lead. The build-up factor is included as a
multiplier in the attenuation equation,
(24 )
The reader should notice that the build-up becomes more significant with increas-
ing absorber thickness, d.
Table 3. Mass Attenuation Coefficients for Gamma Rays forSome Representative Materials
(U.S. Department of Health, Education, and Welfare, 1970)
Photon Energy SiO z Air Concrete Polyethylene
0.40 0.0959 0.0954 0.0963 0.109
0.50 0.0874 0.0870 0.0877 0.0995
0.60 0.0808 0.0805 0.0810 0.0921
0.80 0.0707 0.0707 0.0709 0.0809
1.00 0.0636 0.0636 0.0637 0.0727
1.50 0.0518 0.0518 0.0519 0.0592
2.00 0.0447 0.0445 0.0448 0.0507
3.00 0.0363 0.0358 0.0365 0.0405
4.00 0.0317 0.0308 0.0319 0.0345
5.00 0.0287 0.0275 0.0290 0.0305
6.00 0.0266 0.0252 0.0270 0.0277
8.00 0.0241 0.0223 0.0245 0.0239
10.00 0.0226 0.0204 0.0231 0.0215
Photon Energies in Units of MeVAbso~ption Coefficients in Units of cmz/gm
114
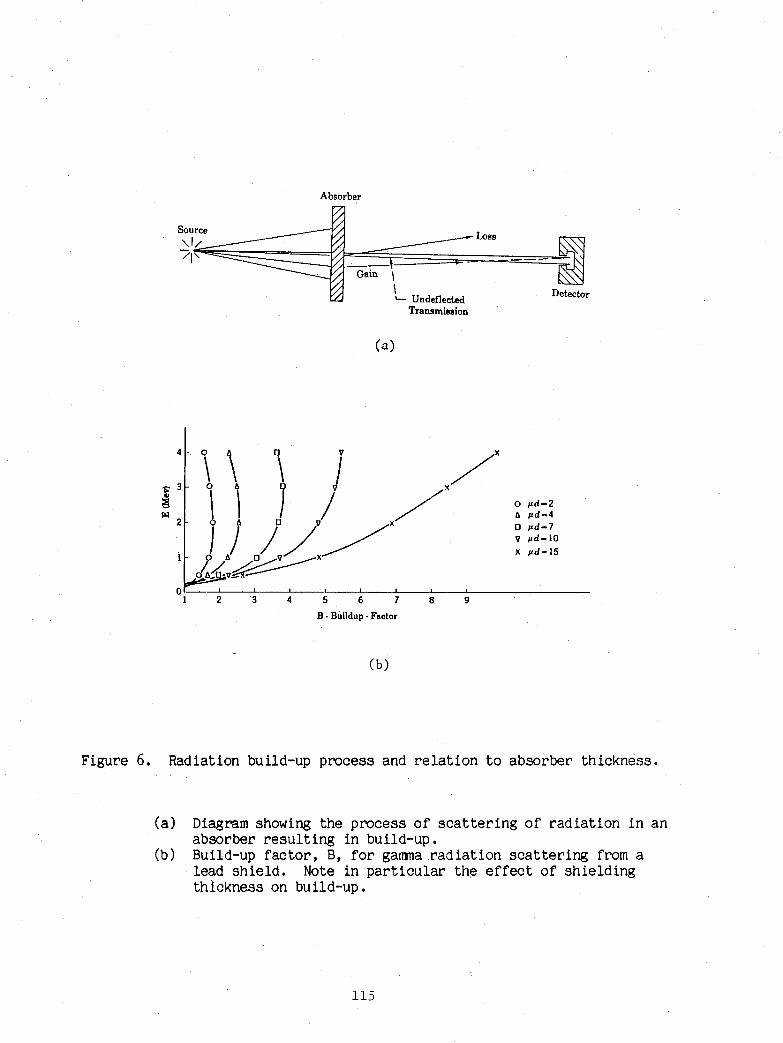
Source,,1//1'
Absorber
__ Loss
Gain \
\'- Undeflected
Transmission
(a)
---~Detector
o I'd-2tJ. I'd-4o I'd-7II I'd-IO
x I'd-15
O'---'-----...L-_-'-__L.!_-..Ll _--I.!_-JI~_J....I _
I 2 "3 4 5 6 7 8 9
B . Buildup. Factor
(b)
Figure 6. Radiation build-up process and relation to absorber thickness.
(a) Diagram showing the process of scattering of radiation in anabsorber resulting in build-up.
(b) Build-up factor, B, for gamma radiation scattering from alead shield. Note in particular the effect of shieldingthickness on build-up.
115

4.4 Shielding Effects of Soils
One of the more accepted means of cable disposition is burial beneath the
Earth's surface. For purposes of applying the information in this report to
shielding of optical fiber transmission lines, a separate section is dedicated
to shielding due to soils.
Due to the variations in soil constituents and structure from one
location to another, it is not possible to characterize shielding effects of
soils as specifically as those of other materials. The situation is not as
desperate and unwieldy as it might seem at first glance, however, since the
required soil thickness for effective shielding can be calculated, if the soil
density is known. Table 4 gives the densities of several soil types from
which a worst-case scenario and shielding design may be determined. The
following example is used to illustrate this point.
Example:
From Table 3 and ~igure 5 we see that a safe estimate of the
absorption coefficient for 1-MeV photons is about 0.07 cm 2 /gm. The required
half-thickness is then x%(gm/cm 2) = (In 2)/j! = 10.12 gm/cm 2
• If the device
to be protected is buried in silty soil (see Table 4) the least density
expected is 1.39 gm/cm 3• This gives a half-thickness of xY0cm) = 7.28 cm
using the same calculation techniques shown earlier. See the examples of
Sections 4.2 and 4.3.
116

*Dry Density (gm/cm 3)
1.47 - 1. 76
1.33 - 1.89
1.28 - 1.89
1.39 - 2.03
1.36 - 2.21
1.22 - 1. 92
1.43 - 2.34
1.12 - 2.08
Table 4. Some Soil Densities Useful for Shielding Calculations (Hough, 1957)
Soil Type
Standard Ottawa Sand
Clean Uniform Sand
Uniform Inorganic Silt
Silty Sand
Fine to Coarse Sand
Micaceous Sand
Silty Sand and Gravel
Clay
*Dry density is determined after baking at 105 DC for 24 hours.
An additional word of caution is in order here. The half-thickness calcu
lated in the examples presented here is that thickness required to reduce the
radiation flux to half its initial value. The addition of each successive
half-thickness of absorber or shielding reduces the radiation flux by another
factor of one-half. It may be necessary to have many half-thicknesses of
shielding before the radiation flux is reduced to an acceptable level.
A convenient aid in planning cable burial, when radiation shielding becomes
a consideration, may be obtained from the Soil Conservation Service of the
United States Department of Agriculture. Although not yet complete, maps of
the United States are available which show soil types.
5. Sill1MARY
The foregoing data, comments and sample calculations are by no means ex
haustive and are only intended to make the reader aware of problems and proce
dures associated with radiation shielding. The materials presented herein are
not original but represent a brief consolidation of a vast quantity of works
117

accumulated over the decades of study of radioactivity and shielding. Applica
tion of the techniques of shielding for adequate protection of equipment and/or
personnel from the harmful effects of ionizing radiation must surely be done
on a situation-by-situation basis. Worst-case design of shielding in all
instances is encouraged--the adage "What you can't see won't hurt you" does
not apply here.
118

6. REFERENCES
Chilton, A. B., J. K. Shultis, and R. E. Faw (1984), Principles of RadiationShielding, (Prentice Hall, Inc., Englewood Cliffs, NJ).
Englert, T. J. (1987), Effects of Radiation Damage in Optical Fibers--ATutorial, 62 pp., NTIA Contraction Report 87-38, NTIS Order No. PB 87-2103081AS, May.
Friebele, E. J., K. J. Long, G. G. Askins and r1. E. Gingerich (1985), Overviewof Radiation Effects in Fiber Optics, Optical Materials in RadiationEnvironments, Proc. of SPIE, Vol. 541, Radiation effects in optical networks, pp. 70-88, March 6-7, (SPIE--The International Society for OpticalEngineering, P.O. Box 10, Bellingham, WA 98227-0010).
Hough, B. K. (1957), Basic Soil Engineering, (Ronald Press Co., New York, NY).
National Council on Radiation Protection and Measurements (NCRD) (1976),Structural Shielding Design and Evaluation for Medical Use of X-Rays andGamma-Rays of Energies Up to 10 MeV, NCRD Report No. 49.
U.S. Department of Health, Education, and Welfare (1970), Radiological HealthHandbook, Revised Edition, (U.S. Department of Health, Education, andWelfare, Washington, DC).
Van Nostrand Scientific Encyclopedia (1976), 5th Edition, (Van NostrandReinhold Company, New York, NY).
119


APPENDIX G
RESTORABILITY OF AN OPTICAL FIBER LINK
WilliamJ. Ingram
G. RESTORABILITY OF AN OPTICAL FIBER LINKG.l Uninterruptible Power Supply
G.l.l Continuous UPSG.l.2 Standby UPSG.l.3 BatteriesG.l.4 Battery Grading
G.2 Power SuppliesG.2.1 Public ServiceG.2.2 Fossil Fuel GeneratorsG.2.3 Solar EnergyG.2.4 Wind Energy
G.3 Recovery from DamageG.3.1 Fiber OpticsG.3.2 Station DamageG.3.3 Power Loss
G.4 References
121

APPENDIX G: RESTORABILITY OF AN OPTICAL FIBER LINK
Optical fiber links can carry hundreds or thousands of calls at a time.
Regenerator stations serve to regenerate the optical signal. If one of these
elements fails, communication along that route is severed. The causes of such
failures usually corne from one of the following categories:
1. Power supply failure2. Element failure3. Optical fiber degradation.
Power supply problems can usually be preventeQ by the judicious use of an
uninterruptible power supply (UPS). This is described in Appendix G.1. Device
failure can normally be circumvented by the use of on-line spare parts that can
be switched into the network. This issue is addressed in Appendix G. 3 .
Optical fiber degradation is caused by exposure to gamma radiation. This can
be muted by hardening of the fiber and by attenuating the radiation before it
strikes the fiber. This is also described in Appendix G.3.
G.1 Uninterruptible Power Supply (UPS)
An uninterruptible power supply is an invaluable piece of equipment for
those installations where an unexpected power loss could disrupt critical
operations. A typical UPS consists of an array of batteries, one or more ac/dc
converters, and associated controlling electronics. The two major types of UPS
that are used to provide uninterrupted electricity flow are 1) a continuous UPS
and 2) a standby UPS.
G.1.1 Continuous UPS
The continuous UPS is, as its name implies, a UPS that supplies an
unbroken stream of electrical power. The ac from a public utility is channeled
through a rectifier and is used to keep a battery array fully charged. The
output from this rectifier is also connected to an electrical invertor that
converts the dc back into ac (Figure G-1). Since the battery array is
inherently connected to the input of the invertor, if the incoming ac power
fails, power for the invertor is automatically supplied by the batteries
(Knurek, 1987).
In this type of system, the load is completely isolated from problems on
the incoming ac line such as brownouts and transient power surges.
Unfortunately, this kind of system suffers from the entropic power loss caused
122
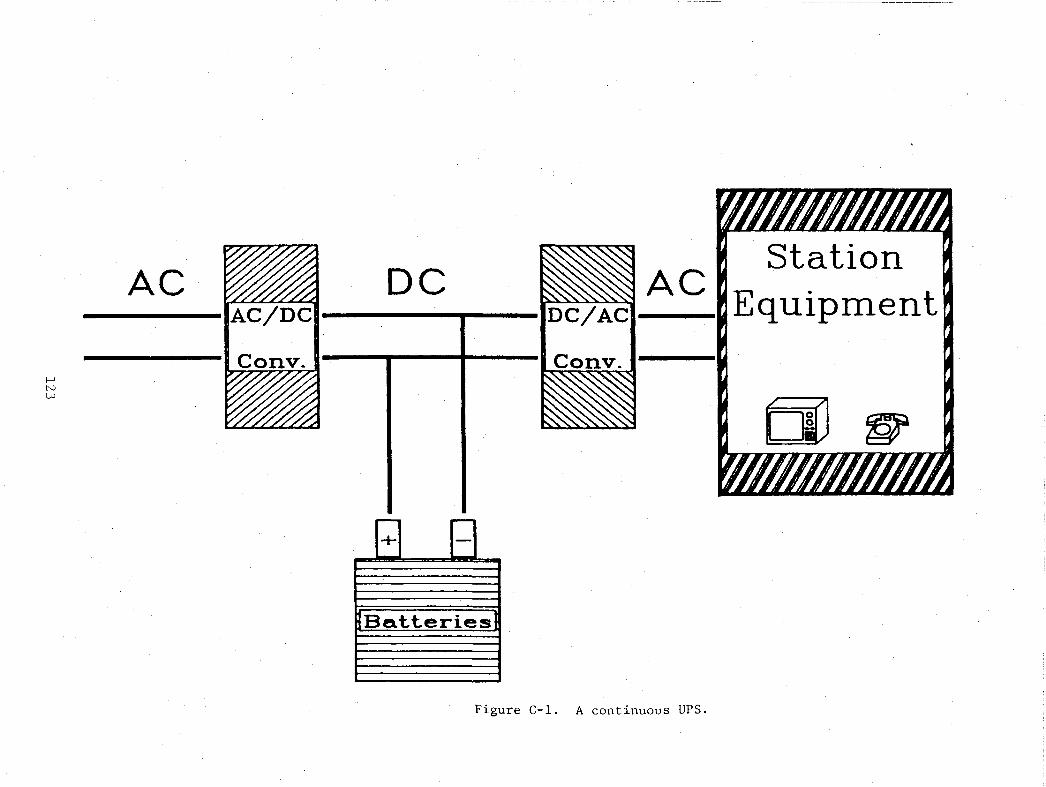
[jJ~
DC AC" StationI i rD~>c~7A~>cl. ~Equiprnent
AC
f-'NW
.--- -+
Batteries
Figure G-l. A continuous UPS.

by the double conversion scheme. This constant power loss inherent in a
continuous UPS is not very cost effective.
Most telecommunication equipment runs on 48 Vdc and so can be connected
directly to the battery array. Additionally, the electrical invertor can be
removed from the circuit if dc lighting and dc environmental controls are used
in the station. This would result in a greater overall station efficiency.
G.1.2 Standby UPS
The standby UPS is more efficient than the continuous UPS because, under
normal operating conditions, the commercial ac power is directly connected to
the load (Figure G-2). None of the ac power is lost through a rectifier/in
vertor scheme. The ac power is also connected to a rectifier which keeps a
bank of batteries fully charged. These batteries are connected to the input of
an inactive dc/ac invertor. When sensors, attached to the commercial ac line,
sense that the ac power has failed, the invertor is activated and begins
producing ac power from the batteries while the commercial ac power is removed
from the system. This battery-produced power is then used to supply power to
the station load. Switchover takes 1.5 to 4 milliseconds which, for the
majority of loads, is short enough so that the power service is considered to
be uninterrupted. One drawback to this system is that power surges and
brownout conditions may not be detected and may be inadvertently passed onto
the load.
As in a continuous UPS, the telecommunication equipment will likely be
directly connected to the 48 Vdc battery array. If the station contains no
equipment that needs ac power, the electrical invertor can be eliminated from
the setup and the standby UPS becomes a continuous UPS.
Many UPS systems need adequate air conditioning. In the event of an air
condi tioning failure, the UPS might overheat and Likewise fail. This could
mean no power at all, or worse yet, allow corrupted power to pass to tele
communication equipment.
G.1.3 Batteries
The size and type of batteries installed in a UPS is dependent upon the
particular station site requirements. The cheapest and most widely used
batteries are standard lead-acid batteries (e.g., automobile type batteries).
Several rows of these batteries can be connected together to supply specific
124

r-'NV1
AC
DC
Batteries
Switch
AC
,. 'J ~'r.
~ ~ ~ ~r~ r~ '~
StationEq • tUlprnen
DID ~~'J
Figure G-2. A standby UPS.

power requirements for specific telecommunication needs. For example, a UPS
that is designed to supply a week's worth of power to telecommunication
equipment would typically need many more batteries than one designed to last
only 30 minutes. Similarly, a UPS designed to supply power to a dozen
equipment racks would need many more batteries than one designed for a single
equipment rack.
The storage of lead-acid batteries can be bulky, messy, and dangerous,
especially in those situations where the UPS must supply a substantial amount
of electricity for a long period of time. The UPS is therefore usually housed
in a large room specially designed for large numbers of unsealed batteries.
Adequate drainage and ventilation facilities are needed to reduce hazards from
escaping gasses and/or leaking acid.
Periodic maintenance is needed to replace lost water that is vented off as
vapor during battery recharging (Wilson, 1987). In addition, most lead-acid
batteries can only be recharged about 800-900 times before they need
replacement (Maycock, 1981).
Sealed lead-acid batteries are being made that can reduce the hazards and
inconvenience of a centralized UPS. These sealed batteries use gas
recombination techniques to recover the oxygen and hydrogen gasses produced
during recharging and recombine them back into water. Although these batteries
are smaller and less powerful than unsealed batteries, several of them can be
linked together to produce the same power output as regular lead-acid
batteries. Since these batteries are smaller and fully self-contained, they
can easily be incorporated directly into equipment racks with the equipment
itself .
Equipment racks containing sealed lead-acid batteries mounted with the
equipment they are powering, can then be transported as a whole unit. This
method can be used to quickly replace a failed unit with a completely new spare
unit. The down time would be greater if the failed equipment had to be first
disconnected from the main power supply and then from the optical fibers
themselves. Once the equipment (with batteries) has been removed from the
circuit and replaced, the batteries can be extracted from the failed unit and
incorporated into a new unit,which can then be used as a spare.
Such sealed batteries can also be useful in environments where the venting
of gasses can cause immediate dangers such as an explosion. Also, potential
126

damage caused by vandalism and sabotage can be reduced by eliminating
ventilation ductwork that is no longer needed ",rhen using sealed batteries.
G.1.4 Battery Grading
Backup battery protection is usually supplied by an array of similar-sized
batteries with the same voltage ratings. In a typical installation, batteries
are replaced throughout the life of a UPS. This results in batteries from
different batches and maybe even different manufacturers being inserted into
the array (Kindschuh, 1987). Consequently, the array will be made of battery
cells that have slightly different voltages and/or power capacities.
Each individual battery cell has its own distinctive discharge curve
showing output voltage as a function of time. Typically, a cell's voltage will
remain constant (within 10 percent) for approximately the first 95 percent of
its discharge cycle. When the cell is almost completely discharged, the
voltage drops sharply (the voltage drop-off point) and the cell is considered
to be fully discharged. In a battery array, the "weak link" theory applies.
When anyone individual battery cell becomes fully discharged, the voltage of
the entire array drops accordingly. Premature discharge of a few "weak" cells
can cause the array voltage to drop to less than 90 percent of its rated
vol tage. When this happens, the entire array is then considered to be
discharged. Unfortunately, most of the batteries will still have around 10
percent of their power capacity left.
Battery cells with the same rated voltage may have vastly different actual
power capacities. By defining several different power grades within a specific
rated voltage, a cell's power capacity (and thus the voltage drop-off point),
can be evenly matched with other graded battery cells. These matched cells can
then be put into the same battery array. The batteries in such an array will
tend to reach their drop-off voltages at approximately the same time.
Such grading will extend the life of an array by using each battery cell
to its fullest capacity. When fully exercising and utilizing each battery,
less strain is placed on any individual cell, extending the life of each
battery and thus the entire array.
127

G.2 Power Supplies
G.2.1 Public Service
Electricity from public utilities can be a very cheap method of supplying
electricity to a regenerator station. The cost of installing electrical cable
from the regenerator station to a public service contact point will normally be
the most expensive element. According to a representative of Public Service
Company of Colorado (private communication, 1987), the installation cost is
about $15,000 per mile ($9, 300/km) for flat terrain and $22,000 per mile
($13,700/km) for mountainous terrain. Once the cable has been installed, the
cost of the electricity is about $0.07-$0.10 per kWh, depending on the area of
the country (Maycock, 1981).
The costs of maintenance for this power cable a1;"e borne by the public
service company. Their maintenance responsibility ends at the customer's
termination point, usually a power transformer. These maintenance costs have
already been calculated into their normal electric utility rates.
Public service power is normally available at least 99.9 percent of the
time. According to a representative of Public Service of Colorado (private
communication, 1987), public utilities typically experience down times of less
than one half hour per year.
Sometimes the electricity delivered by a public utility is not a precise
60-Hertz waveform. This can be caused by a fault at the generating facilities
or by other customers' errant usage of electricity on the same power lines.
This corrupted power can cause some equipment to function erratically and may
cause irreparable damage to others. In applications where the regenerator
stations must be active 100 percent of the time, this is unacceptable. By
routing the public utility power through a UPS, faults such as voltage spikes
and voltage dips can be muted. By integrating the public utility power with
electricity from local sources such as diesel generators, photovoltaic cells,
and/or wind turbines, additional faults such as blackouts and brownouts can be
circumvented.
G.2.2 Fossil Fuel Generators
Fossil fuel generators, most often diesel type, can be used to provide
power through a UPS. This power will be used to keep an array of batteries
charged.
128

G.2.3 Solar Energy
One alternative to electricity from public utilities or fossil fuel
generators is to use photovoltaic (PV) cells. J~n array of these PV cells will
often have a higher initial cost. To justify these costs, a solar array needs
to have a useful life of several decades so that the initial costs can be
satisfactorily amortized (Murr, 1980). Fortunately, estimates show that solar
cells are generally designed for over 25,000 hours of operation, which can be
more than 10 years of useful service (McVeigh, 1977). Including amortization
and yearly maintenance costs, atypical PV array can generate electricity at a
cost of between $0.50-$1 per kWh (Maycock, 1981).
Solar cells are often made from silicon or gallium-arsenide wafers that
have been purified to where less than a few parts per million' of unwanted
impurities remain. Specific impurities are then reintroduced into the silicon
that cause portions of these wafers to expel electrons when exposed to light.
Other portions of the wafer that have been doped with other specific impurities
will absorb these electrons. A wire connecting these two portions will
transport these electrons, thus producing electricity. The technology needed
to produce these PV cells is in its infancy compared to that of fossil fuel
generators (McVeigh, 1977).
Typically on a sunny summer day at noon, about 1 kW of energy per square
meter (0.1 kW/ft2 ) reaches the Earth's surface. Depending on the time of the
year, the time of day, and the weather, this value can drop to almost zero.
129
Current PV cells can only convert 10 to 25 percent of the available energy
directly into electricity (Maycock, 1981). Individual photovoltaic cells are
manufactured to produce 1.5 volts at several milliamps. The overall wattage of
a PV cell depends upon its size and construction. Several PV cells can be
connected in series to form a bank of PV cells with a specific voltage.
Several banks of PV cells can then be connected in parallel to supply a
specific average amperage. The exact number of banks needed to produce a
specific power level will be determined by the location, local weather
conditions, and the average sunlight for the area. Although PV cells seem to
take up a large amount of space, they have a much greater power-to-weight ratio
than lead-acid batteries or fossil fuel generators.
Parabolic mirrors can concentrate the sun's rays onto the PV cells to
produce far greater amounts of electricity. Consider, for example, that two
PV cells ("A" and "B") are set. up and each is 1 square meter (10.8 ft2 ) in
area. These cells convert 15 percent of the sunlight falling on them to
electricity. Assuming 1,000 watts of energy fallon each PV cell, this makes a
total of 30 watts of electricity produced by the two cells. A second setup has
been constructed next to the first one. One PV cell ("G") has been built, also
wi th an area of 1 square meter (10.8 ft2 ) and an efficiency of 15 percent.
Mirrors and concentrators have been placed on the second square meter (where PV
cell "D" could have been built) and are used to reflect its 1,000. watts of
sunlight onto PV cell "C." Cell "C" is now producing 30 watts of electricity.
The same amount of electricity is being produced with only one PVcell rather
than two. Assuming, for the moment, that the cost of the mirrors and
concentrating equipment is less than that of a second PV cell, it is cheaper to
use only a few PV cells and COncentrate extra sunlight onto them.
PV cells will become cheaper as more companies begin to use automatic
manufacturing processes to make them. Eventually, it may become cheaper to
install large numbers of PV cells instead of using concentrators.
Parabolic arrays have been constructed that are 20 to 100 times as
efficient as flat-surfaced solar arrays (Murr, 1980). These parabolic·mirrors
can produce temperatures as great as 300°C, necessitating the need for special
high-temperature devices or adequate cooling systems. Another expensive
element of a tracking parabolic array is the sophisticated system allowing the
array to follow the sun's arc across the sky.
130
Another method of extracting as much electricity as possible from a given
area of sunlight is to use filters to break up the sunlight into its component
wavelengths. Specific wavelengths of light are converted into electricity with
varying degrees of efficiently by different types of silicon PV cells. By
using various filtering techniques, the specific wavelengths of light can be
absorbed by the appropriate PV cells. In theory, these techniques could have
about a 60 percent efficiency. In practice, only about 35 to 40 percent
efficiency has been achieved (Maycock, 1981).
Photovoltaic arrays are susceptible to deterioration caused by dust, water
vapor, and natural or man-made chemicals in the atmosphere. Periodic
replacement of the protective outer coatings of glass may be necessary as they
become pitted, scarred, or otherwise damaged by the elements.
G.2.4 Wind Power
Wind-powered machines have been around for thousands of years. In the
"good old" days, wind machines consisted of simple sailing ships and
wind-driven mills. Merchants were at the mercy of the weather conditions and
could be crippled for several days, weeks, or even months without wind. In
modern times, we still cannot control the weather, but we can store excess
power generated during windy periods and use it when there is not enough wind
to produce electricity.
A wind turbine that is generating electricity without the benefit of a
battery backup would never be an acceptable power supply. Even a turbine with
several days' worth of battery storage would only be marginally acceptable.
Extended calm weather can cause the battery's iPower reserves to be completely
drained, leaving the station without power until the wind begins again. On the
other hand, if the wind velocity exceeds the capacity of the turbine, the
turbine must be shut down to prevent damage to the turbines. If wind turbines
are to be the only incoming energy source, the station will typically
experience unpredictable periods of complete power loss. The duration of these
power loss periods depends upon the specifc location of the wind turbine.
Accurate wind studies and sophisticated turbine designs, however ,can help to
minimize this down time.
Sophisticated analysis can determine the expected yearly energy output of
a modern wind turbine. Such an analysis can help, for example, to determine
131

how many turbines would need to be set up to generate a predetermined average
amount of electricity.
To estimate the energy produced by a wind turbine, the total energy
available must first be determined. The kinetic energy, ~, of a moving air
stream is defined to be
~ =1
2(G-1) ,
per unit mass, where V is the velocity of the air (McVeigh, 1977). The mass
flow rate, Fm , of air through a cross-sectional area, A, is
Fm = p A V (G-2)
where p is the density of air. Combining (G-1) and (G-2), the total power
available, Em' in the air stream passing through the wind turbine is
~ =1
2(G-3)
Assuming the rotor blades are arranged in a circular array (e. g., an
airplane propeller) and each has a length that describes a diameter D, the area
traced by the blades is
A =4
(G-4)
By substituting (G-4) into (G-3), the maximum energy available, Em' can be
expressed as
11"
(G-5)8
The actual power available, Ea , is less than ~ due to inefficiencies
inherent in energy conversion. It can be expressed as
132

(G-6)
where E and Kr are terms associated with wind dynamics and the efficiencies of
rotor power systems. The term Kr can be determined by analyzing the conversion
factors of the turbine system.
The maximum amount of kinetic energy that could be extracted from a moving
airstream is 0.59259 (E r ) of the theoretical kinetic energy available. This
was shown in 1927 by the German engineer Betz (McVeigh, 1977).
Not all of this extracted energy can be converted into usable power.
Friction between the rotor blades and the air and friction between moving parts
within the turbine can reduce the output power significantly. Many current
wind turbine designs can produce rotor conversion efficiencies, E c ' of around
75 percent.
Noting that the density of air, p, is 1.293 Kg/m3 (at OOG, 760 rnrn Hg) and
including the rotary systems efficiencies, Kr can then be calculated as
K =r(G-7)
8
1r 1. 293 Kgx x 0.59259 x 0.75
= 0.226 Kg/m3 •
The actual power can then be found by combining (G-6) and (G-7) as
(G-8)
The annual wattage of a wind turbine, l\-, can then be calculated by
multiplying (G-8) by the number of hours in a year (H=8766 hours) and a factor
Ks . This factor is a semiempirical factor associated with the statistical
'nature of wind energy and has been shown to be about 2.06 (Pontin, 1975). The
typical average annual energy can then be expressed as
133

(G-9)
where the wind velocity, V', is considered to be the mean annual wind speed.
This mean annual wind speed is calculated as
V,~3~ (G-10)
When calculating V', the mean of V3 is used rather than the mean of V. A more
accurate mean is achieved using this method because (G-8) shows that Ea is
linearly related to V3 rather than V. A transient linear increase in V will
contribute far more to the energy total than an equivalent linear decrease will
deduct.
As an example, consider a wind turbine erected at a regenerator station
site with a mean annual wind speed of 6 m/s (19 ft/s). The rotor blades trace
a circular area with a diameter of 5 meters (16 ft). The turbine itself has a
life expectancy of 10 years. The turbine costs $3,000 to buy and $3,000 to set
up. Annual maintenance on the turbine costs $300. By amortizing the initial
costs over ten years and adding in yearly maintenance, the annual cost of
owning the wind turbine is $900 . Substituting the rotor diameter and wind
speed into (G-9), the annual power output is calculated as 22,000 kWh. The
cost of electricity in this example is $0.041/kWh.
This final cost will, of course, be site specific. Many additional
circumstances could affect this figure. The mean annual wind speed of an area
can vary from almost zero to more than 20 m/s. Even if th~ mean annual wind
speed is within acceptable limits, this does not mean that the wind blows at
appropriate speeds all the time. Several wind turbine manufacturers claim that
the annual cost of maintenance will normally be less than the $300 used in the
above example. The installation costs might be higher than this example if,
for instance, a remote station site needs to have its wind turbine flown in by
helicopter. Generally, the cost of electricity will remain under $O.lO/kWh.
G.3 Recovery from Damage
Regenerator stations will likely be damaged at some time or another. Much
of this damage will come from natural sources such as earthquakes, weather, and
134

animals. The rest of this damage will be caused by man-made events such as
vandalism, sabotage, or war. Most damage will consist of physical destruction
of the devices. Some damage will be the result of either long-term mild
radiation exposure or a sudden, massive dosage. Regenerator stations and fiber
optic cables can never be designed to withstand all such damaging events.
System elements that are designed to withstand most of this damage are usually
quite cumbersome and expensive and still would not guarantee· 100 percent
survival.
A reasonable approach to this situation is to balance the cost of
hardening the system against the additional degree of protection. Adequate
consideration must be given to the losses incurred if the system were to fail.
Separate studies would be needed for the hardening of the optical cable as well
as for the regenerator station itself.
G.3.1 Fiber Optics
Optical fiber cable that has been exposed to appreciable amounts of gamma
radiation will suffer some attenuation of its light transmission ability. The
radiation striking the fiber will react with certain impurities in the fiber,
causing electrons to be ej ected from their ascribed positions. These free
electrons and "electron holes" can act to absorb light, making the entire cable
less light-conductive. This is known as fiber darkening.
Optical cable that has been damaged by this darkening effect will recover
as the free electrons eventually fall back into the "electron holes." Although
the fiber will continue to recover indefinitely, total recovery will never
reach 100 percent.
In a recent NTIA/NCS report, W. Ingram describes a computer program
(FIBRAM) that models the attenuation of optical fibers after simulated exposure
to gamma radiation (Ingram, 1987).. FIBRAM can be used to estimate the changes
in bit error ratio (BER) in response to a variance in the intensity of exposed
radiation, the transmit power level, and/or the physical configuration of the
fiber l:lnk.
FIBRAM is used in this report to present several examples of the reaction
of the bit error ratio to changes in the cable configuration and/or gamma
radiation levels.
The first example will be based upon data taken from the FT3C Northeast
Corridor lightwave digital transmission system as described in NCS Technical
135
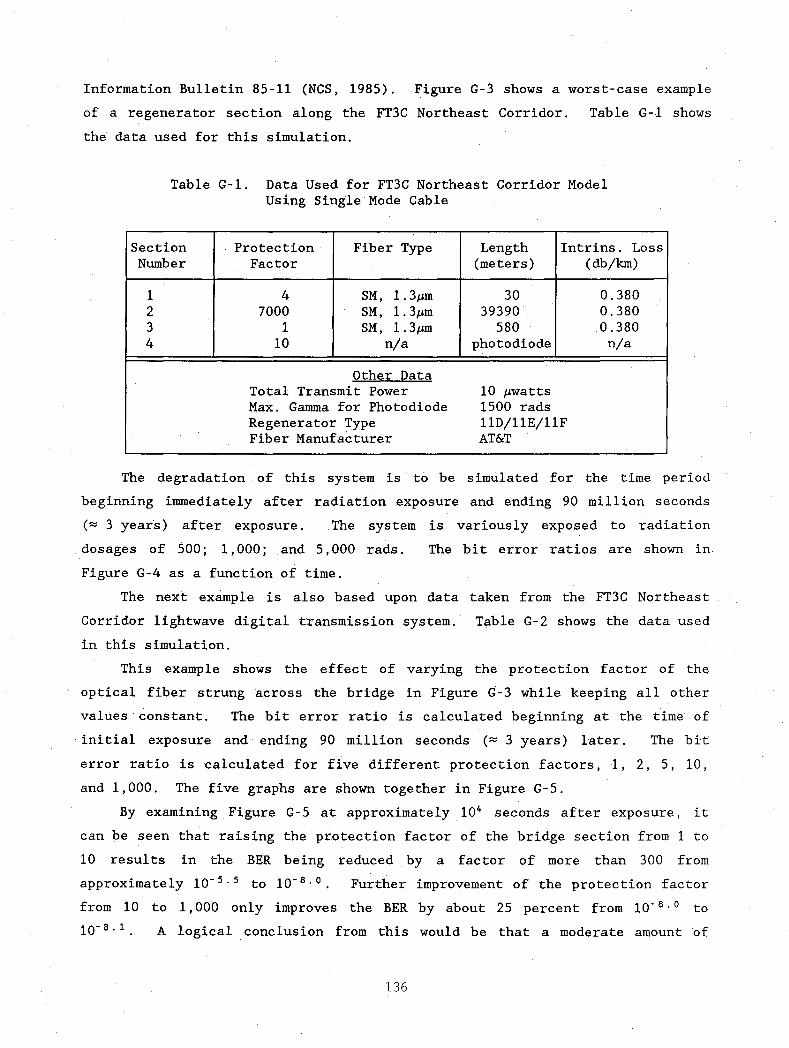
Information Bulletin 85-11 (NCS, 1985). Figure G-3 shows a worst-case example
of a regenerator section along the FT3C Northeast Corridor. Table G-1 shows
the data used for this simulation.
Table G-1. Data Used for FT3C Northeast Corridor ModelUsing Single Mode Cable
Section Protection Fiber Type Length Intrins. LossNumber Factor (meters) (db/kIn)
1 4 SM, 1.3;sm 30 0.3802 7000 SM, 1.3;sm 39390 0.3803 1 SM, 1.3;sm 580 0.3804 10 n/a photodiode n/a
Other DataTotal Transmit Power 10 ;swattsMax. Gamma for Photodiode 1500 radsRegenerator Type llD/llE/llFFiber Manufacturer AT&T
The degradation of this system is to be simulated for the time period
beginning immediately after radiation exposure and ending 90 million seconds
(::::: 3 years) after exposure. The system is variously exposed to radiation
The bit error ratios are shown indosages of 500; 1,000; and 5,000 rads.
Figure G-4 as a function of time.
The next example is also based upon data taken from the FT3C Northeast
Corridor lightwave digital transmission system. Table G-2 shows the data used
in this simulation.
This example shows the effect of varying the protection factor of the
optical fiber strung across the bridge in Figure G-3 while keeping all other
values constant. The bit error ratio is calculated beginning at the time of
initial exposure and ending 90 million seconds (::::: 3 years) later. The bit
error ratio is calculated for five different protection factors, 1, 2, 5, 10,
and 1,000. The five graphs are shown together in Figure G-5.
By examining Figure G-5 at approximately 104 seconds after exposure, it
can be seen that raising the protection factor of the bridge section from 1 to
10 results in the BER being reduced by a factor of more than 300 from
approximately 10- 5 . 5 to 10- 8 . 0 • Further improvement of the protection factor
from 10 to 1,000 only improves the BER by about 25 percent from 10- 8.0 to
10- 8.1. A logical conclusion from this would be that a moderate amount of
136
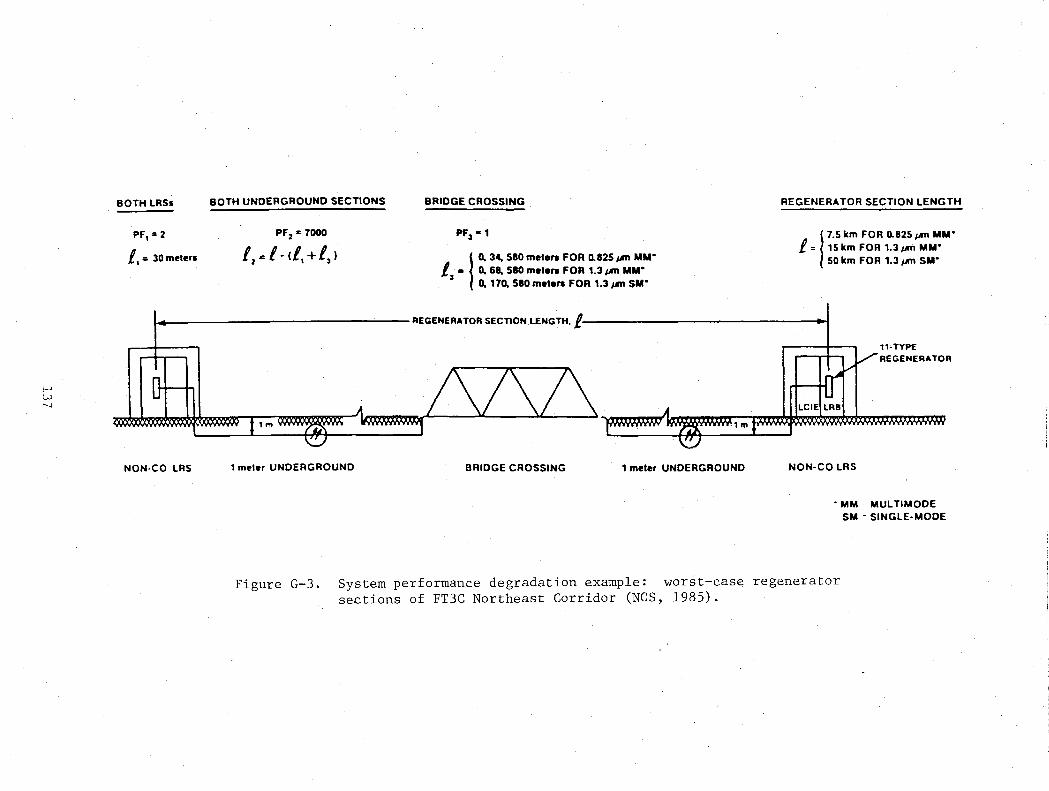
BOTH LRSs BOTH UNDERGROUND SECTIONS
PF, =2 PFZ " 7000
l,=30m~t~r. fz .. l·d,+l,)
BRIDGE CROSSING
PF, -1
I0. 34, 580 meten FOR o.8251Jm MM"£,. 0. 68, 580 meten FOR 1.31Jm MM"
0. 170. 580 meten FOR 1.31Jlft SM"
REGENERATOR SECTION LENGTH
17.5 km FOR 0.825 JJ"1 MM"
£= 15 km FOR 1.3 JJ"1 MM"50 km FOR 1.3 JJ"1 SM"
I_ REGENERATOR SECTION LENGTH.l • I
f-'W--...J LCIEILRB
,,·TYPEREGENERATOR
NON·CO LRS 1 m~ler UNDERGROUND BRIDGE CROSSING 1 meter UNDERGROUND NON-CO LRS
• MM . MULT1MODESM - SINGLE-MODE
Figure G-3. System performance degradation example: worst-case regeneratorsections of FT3C Northeast Corridor (NCS, 1985).

BER vs TimeAT&T Single Mode. 1.3 microns
-5 f I
-6
,...,-7 J 5000 rods
=Ii:1~
'-'
f-' til -8 J 1000 rodsw 000.oJ .
500 rods .......... \. II
I
-9-1 '\. \.. """IIII
II
I ===,II
-10
0 2 4- 6 8
'T';me. toe ( Seconds )
Figure G-4. "BER versus Time" graph for AT&T single mode fiber operating at awavelength of 1.3 microns in response to various levels of falloutradiation (Ingram, 1987).

BER vs. TimeMUltimode Fiber, 5000 rads
-5 -,----------- ---.,
-8.5
-5.5
~
~G -6~
~
0
~-6.5
G
~0P. -7
•I-' J:wI.D ~
0-7.5
~-P:til -8lQ
I-91 -r- I I I Iii
o 2 4- 6 8
Time (to the power or ten) seconds
Figure G-5. "BER versus Time" graph for AT&Tmultimode fiber operating at a wavelengthof 1.3 microns in response to various levels of fallout radiation.

protection is far better than no protection. but a large amount of protection
is only somewhat better than a moderate amount.
FIBRAM can similarly be used to vary the radiation dosage rates, change
the intrinsic losses, or substitute a different fiber type for each section.
These results could then be compared and appropriate cabling selections could
then be made.
Table G-2. Data Used for FT3C Northeast Corridor ModelUsing Multimode Cable
Section Protection Fiber Type Length Intrins. LossNumber Factor (meters) (db/kIn)
1 4 MM. 1.3J.£m 30 2.02 7000 MM. 1.3J.£m 14902 2.03 * MM. 1.3J.£m 68 2.04 10 n/a photodiode n/a
Other DataTotal Transmit Power 110 J.£wattsTotal Exposed Gamma 5000 radsMax. Gamma for Photodiode 1500 radsRegenerator Type 11D/11E/11FFiber Manufacturer AT&T
* indicates the PF is varied from 1 to 1000
G.3.2 Station Damage
The best way to repair regenerator station damage is to prevent the damage
in the first place. One way to do this is to bury the regenerator station in
an underground shelter. The shelter would be best buried several feet (several
meters) deep in soil. To protect the integrity of the structure, all entrances
and exits should be covered with adequate protection. The entrance to the
shelter could be sealed and buried along with the shelter itself. The shelter
should have no ventilation shafts open to the atmosphere.
Because the shelter is completely sealed and buried several feet (several
meters) underground. the station must be self-contained. The optical fibers
and the incoming power supply cables will enter the station through sealed
underground conduits. Sealed batteries must be used in the station because
there would be no ventilation. The backup battery life must be able to run the
station for a minimum of several weeks. This would be enough time for workers
140
to discover that a power supply problem exists, dig down to the entrance, and
repair the damage.
By burying the shelter underground, such hazards as vandalism, weather
damage, and HEMP damage can be drastically reduced. Although damage from
earthquakes, sabotage, and war can never be completely eliminated, underground
shelters can somewhat reduce the severeness of these events.
Should the shelter be damaged somehow, contingency plans must be made for
the repair or replacement of the facility. The simplest method would be to
design the shelter so that it could quickly be exhumed and replaced with an
undamaged shelter. This shelter could be brought in by truck for stations near
roadways or by helicopters to remote areas. A crane or helicopter could be
used to lift the damaged station out of its crater and replace it with the
replacement station. Once the replacement shelter is put in place, a team of
workers could quickly resplice the cable connections and bring the station on
line again.
Of course such a scheme would be very expensive to implement. Spare
regenerator stations would depreciate and deteriorate while not in use. Heli
copters can cost hundreds of dollars per hour to operate. A team of workers to
resplice the cable can also cost hundreds of dollars per hour. In addition,
helicopters and workers may be difficult to find in the aftermath of whatever
caused the destruction of the regenerator station.
G.3.3 Power Loss
"Where were you when the lights went out?" "In the dark!", goes the old
one-liner. But when a fiber optics regenerator station loses power, it's
unlikely anyone would find it very humorous.
When power is lost, hundreds or even thousands of communication links will
be broken. If the regenerator station is along a critical path between two
major communication centers, the broken link might not be able to be
reestablished.
To make matters worse, whatever event that caused the power loss will
likely increase the volume of attempted calls over those and other
telecommunication lines. For example, if an earthquake struck an area and
knocked out power to a regenerator station, it will probably have caused damage
to nearby towns also. The town's phone lines will subsequently be tied up with
141

outgoing emergency calls as well as incoming calls to find out if friends and
relatives have survived.
Another example might be in the event of a war. Communications between
the armed forces would be most critical during and after an attack by hostile
forces. Unfortunately during and after an attack would be the most likely
times of a power outage.
The installation of an integrated power system utilizing a continuous UPS,
public utilities, automatic diesel generators, and PV cells can ensure that a
regenerator station can survive and function in almost any environment short of
total station destruction.
G.4 References
Ingram, W.J. (1987), A program description of FIBRAM: a radiation attenuationmodel· for optical fibers, NTIA Report 87-216/NCS Technical InformationBulletin 87-22, June. (NTIS Order number PB87-230686, report only;PB87-230678, report and data disk).
Kindschuh, D. (1987), Cell grading improves communications batteries, MobileRadio Tech. 2, Number 6, pp. 22-28, June.
Knurek, D. (1987), Invertor evolution in UPS applications, Telephone Engineer &Management 21, Number 11, pp. 80-87, June 1.
(1977), Sun Power.(Pergamon Press,
Maycock, P.D., andElectricity inAndover, MA).
McVeigh, J.C.Energy,10523).
Stirewalt, E.N. (1981), Photovoltaics, Sunlight toOne Step (Brick House Publishing Co., 34 Essex St.,
An Introduction to the Application of SolarMaxwell House, Fairview Park, Elmsford, NY
Murr, L.E. (ed.) (1980), Introduction to Solar Materials Science (AcademicPress Inc., 111 Fifth Ave., New York City, NY 10003), p.7.
NCS (1985), Assessment of nuclear fallout radiation on FT3C lightwave digitaltransmission system, National Communications System Technical InformationBulletin 85-11, November.
Pontin, G.W-W. (1975), The bland economics of windpower, Wind Energy SupplyCompany, Redhill.
Wilson, G.A. (1987), Batteries modernize for TELCO backup, Telephone Engineer &Management 21, Number 11, pp. 64-67, June 1.
142
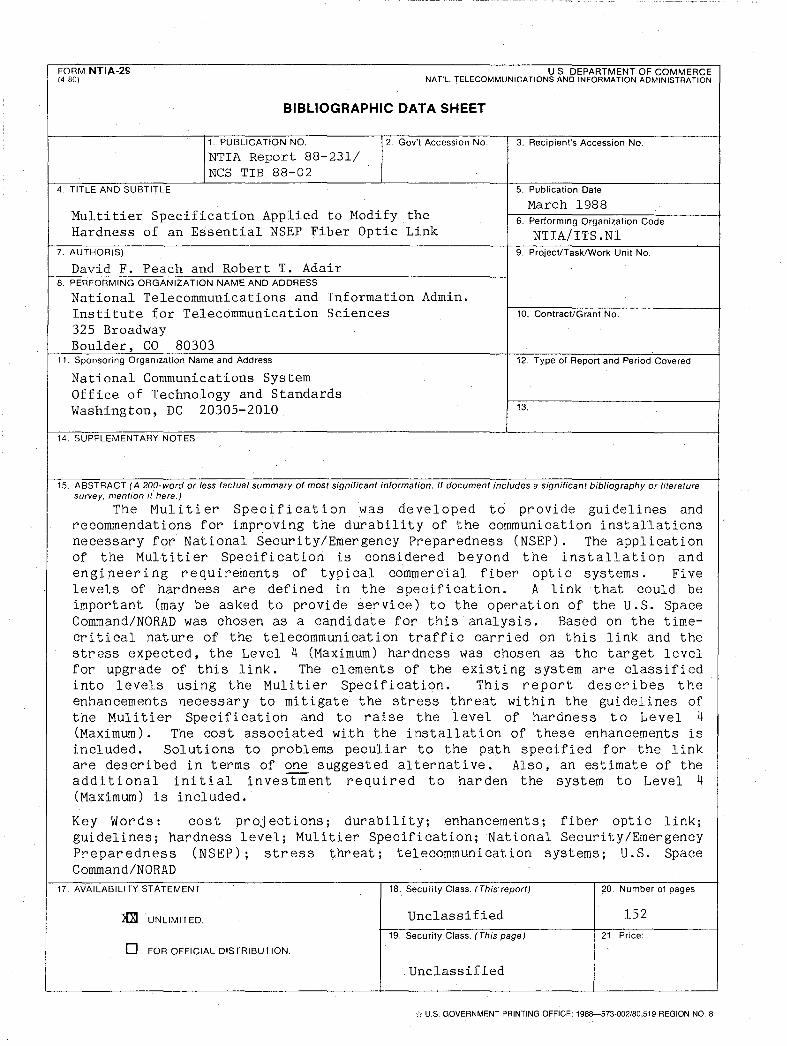
FORM NTIA-2S(4-80)
U.S. DEPARTMENT OF COMMERCENAT'L. TELECOMMUNICATIONS AND INFORMATION ADMINISTRATION
BIBLIOGRAPHIC DATA SHEET
1. PUBLICATION NO.
NTIA Report 88-231/NCS TIB 88-02
2. Gov't Accession No. 3. Recipient's Accession No.
4. TITLE AND SUBTITLE
Multitier Specification Applied to Modify theHardness of an Essential NSEP Fiber Optic Link
7. AUTHOR(S)
David F. Peach and RobertT. Adair8. PERFORMING ORGANIZATION NAME AND ADDRESS
National Telecommunications and Information Admin.Institute for Telecommunication Sciences325 BroadwayBoulder, CO 80303
11. Sponsoring Organization Name and Address
National Communications SystemOffice of Technology and StandardsWashington, DC 20305-2010
14. SUPPLEMENTARY NOTES
5. Publication Date
March 19886. Performing Organization Code
NTIA/ITS. Nl9. ProjecVTask/Work Unit No.
10. ContracVGrant No.
12. Type of Report and Period Covered
13.
15. ABSTRACT (A 200-word or less factual summary of most significant information. If document includes a significant bibliography or literaturesurvey, mention it here.)
The Mulitier Specification was developed to provide guidelines andrecommendations for improving the durability of the communication installationsnecessary for National Security/Emergency Preparedness (NSEP). The applicationof the Multitier Specification is considered beyond the installation andengi neer i ng requirements of typical commercial fiber optic systems. Fivelevels of hardness are defined in the specification. A link that could beimportant (may be asked to provide ~ervice) to the operation of the U.S. SpaceCommand/NORAD was chosen as a candidate for this analysis. Based on the timecritical nature of the telecommunication traffic carried on this link and thestress expected, the Level 4 (Maximum) hardness was chosen as the target levelfor upgrade of this link. The elements of the existing system are classifiedinto levels using the Mulitier Specification. This report describes theenhancements necessary to mitigate the stress threat within the guidelines ofthe Mull. tier Specifi cation and to raise the level of hardness to Level 4(Maximum) . The cost associated with the installation of these enhancements isincluded. Solutions to problems peculiar to the path specified for the linkare described in terms of one suggested alternative. Also, an estimate of theaddi tional ini tial investment required to harden the system to Level 4(Maximum) is included.
Key Words: cost pr oj ections; durability; enhancements; fiber opti clink;guidelines; hardness level; Mulitier Specification; National Security/EmergencyPreparedness (NSEP); stress threat; telecommunication systems; U.S. SpaceCommand/NORAD
17. AVAILABILITY STATEMENT
1£XI UNLIMITED.
o FOR OFFICIAL DISTRIBUTION.
18. Security Class. (This report)
Unclassified19. Security Class. (This page)
Unclassified
20. Number of pages
15221. Price:
;, U.S. GOVERNMENT PRINTING OFFICE: 198B-573-002/80,519 REGION NO.8