Embed Size (px)
Citation preview
International Journal of Advanced Robotic Systems, Vol. 4, No.2 (2007) ISSN 1729-8806, pp. 173-186 173
Multisensor Data Fusion for Spaceborne and Airborne Reduction of Mine Suspected Areas Isabelle Bloch; Nada Milisavljevi & Marc Acheroy Ecole Nationale Supérieure des Télécommunications, Dept TSI, CNRS UMR 5141, Paris, France Signal and Image Centre, Royal Military Academy, Brussels, Belgium Corresponding author E-mail: [email protected]
Abstract: The problem of mined area reduction is addressed in this paper. Pieces of information collected using airborne multispectral scanners and airborne full polarimetric SAR, together with context information, all integrated in a geographical information system, are classified and combined in order to find indicators of mine presence and mine absence and provide image analysts with adequate tools to interpret mined scenes during the area reduction process. The paper contains a broad description of the whole problem and of the developed method and focuses on classification and data fusion tools based on the belief function framework and fuzzy sets theory. Keywords: humanitarian demining, multisensor data fusion, remote sensing
1. Introduction
Antipersonnel landmines affect at least 84 countries and 8 areas not internationally recognized as independent states (ICBL, 2005). Thanks to the Mine Ban Treaty, mine clearing operations have been organized in a more controlled and effective way, yet mine clearance remains a slow and resource demanding process. It is estimated that, on average, a deminer clears 10 m2 during a working day using conventional tools such as metal detectors and prodders. Thus, humanitarian mine clearance operations must be understood and designed correctly, providing efficient aid to innocent people who may be severely injured by this dreadful pollution. The recommendations made during the Standing Committee on Mine Clearance, Mine Risk Education and Mine Action Technologies state that: 1) technologists should avoid building technologies based on assumed needs and should work interactively with end-users, 2) appropriate technologies could save human lives and increase mine action efficiency, and 3) nothing is more important than understanding the working environment (Acheroy, M., 2003; JMU). Besides the very long time needed to clear polluted terrain, actual demining campaigns show that the false alarm rate is very large, the threat of plastic mines (which cannot be detected by metal detectors) is not negligible and the variety of mine clearance scenarios is high, depending on the country, the region, the climate etc. These facts prove that the humanitarian mine detection is a very complex problem. In addition, the experience shows that it will be a long process to achieve a mine-free world, so the concept of a mine-free world is evolving softly toward the concept of a mine impact-free world, although a mine-free world remains the final goal of the Mine Ban Treaty.
By this, the first priority of mine action becomes in allowing affected regions to reach their level of socio-economic standards. This new vision increases the importance of tools that facilitate prioritization and contribute to a rational and efficient distribution of the available resources. Several information management systems are developed and used. An example is the Information Management System for Mine Action – IMSMA (IMSMA, 1999), developed thanks to the Geneva International Centre for Humanitarian Demining (GICHD) and in use in more than 40 affected countries. Other examples are systems completing IMSMA, such as the EODIS system (Askelin, J.-I., 1999) developed by SWEDEC in Sweden and the PARADIS system (Delhay, S., Lacroix, V. & Idrissa, M, 2005) developed by the Royal Military Academy (RMA) in Belgium. Possible entries of such management systems are danger and risk assessment maps provided by the Space and airborne Mined Area Reduction Tools (SMART) project (SMART consortium, 2004; Acheroy, M., 2005), funded by the European Commission and described in this paper. The maps, obtained using data fusion, synthesize the knowledge gathered from the existing data. In the framework of SMART, the fusion module, detailed in this paper, is a very important step, since it allows taking the best benefit from all available data, and of the large efforts made in the scientific community to design detectors and classifiers adapted to these data. It has proven to be a required step before constructing risk maps. This is an improvement in comparison to existing information management systems in this area. In particular, the proposed approach exploits all available data and knowledge and automatically adapts to the quality of the detectors and classifier outputs.
International Journal of Advanced Robotic Systems, Vol. 4, No. 2 (2007)
174
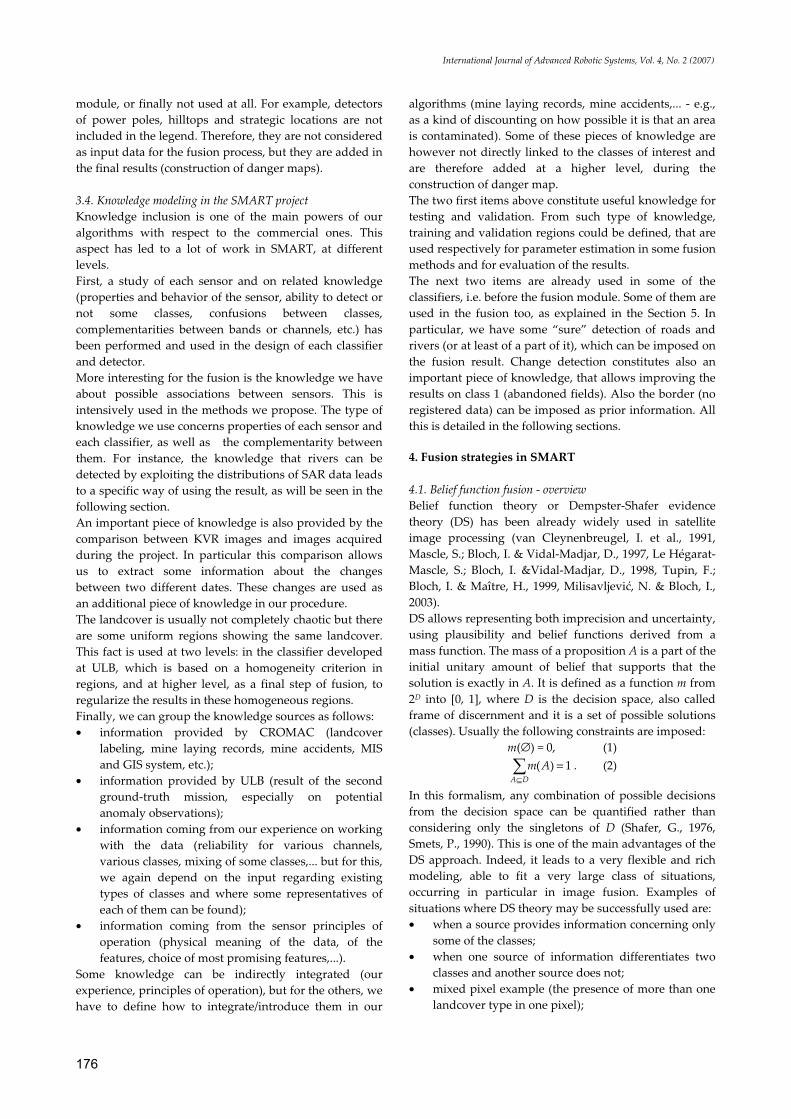
Fig. 1. The global SMART approach; Det – detector, Cl - classifier, M – number of detectors, N – number of classifiers, ChD – change detection.
In Section 2, the SMART approach to the problem of mined area reduction and the image processing tools are described. Section 3 summarizes the available information for fusion in SMART, with the example of Glinska Poljana site, defines the decision space and discusses the knowledge modeling issue. Section 4 presents different fusion strategies applied in SMART. Section 5 addresses additional knowledge inclusion and spatial regularization. Results are discussed in Section 6, while Section 7 briefly explains final SMART steps, i.e. formation of the danger maps, and first validation results.
2. Area reduction: the SMART approach
2.1. Overview of the approach The aim of area reduction is to find which mine-suspected areas do not contain mines and this task is recognized as a mine action activity that should result in reduction in time and resources. Several well-known methods are in use to perform area reduction, especially using mechanical means. These expensive methods change and damage the environment and the ecosystem most of the time. To avoid this, some approaches have been developed that acquire the necessary information remotely, from air or space, using appropriate sensors associated with context information collected from the field and integrated in a geographical information system (GIS). The SMART project, funded by the European Commission/DG/INFSO, is among these approaches, and it is applied to Croatia. The goal of this project is to provide the human analyst with the SMART system, i.e. a GIS-based system augmented with dedicated tools and methods designed to use multispectral and radar data in order to assist in his interpretation of the possibly mined scene during the area reduction process. The usefulness of such image processing tools to help photo-interpretation is, at first place, in the possibility to process automatically a large amount of data and help a visual analysis (SMART consortium, 2004). The use of SMART includes a field survey and an archive analysis in order to
collect knowledge about the site, a satellite data collection, a flight campaign to record the data and the exploitation of the SMART tools by an operator to detect indicators of presence or absence of mine-suspected areas. With the help of a data fusion module based on belief functions and fuzzy sets, the operator prepares thematic maps synthesizing all the knowledge gathered with these indicators. These maps of indicators can be transformed into risk maps showing how dangerous an area may be according to the location of known indicators and into priority maps indicating which areas to clear first, based on socio-economic impacts and political priorities. These maps are designed to help the mined area reduction process. Preliminary results obtained using SMART have shown a reduction rate of 25% (0.98 km2 over analyzed 3.9 km2) and an error rate of 0.1% for what SMART considers as not mined and is actually mined.
2.2. Overview of the data processing tools Fig. 1 illustrates the global SMART approach. Here, MIS denotes a mine information system, Det denotes a detector (of some anomalies), providing information mainly on one class, Cl – a classifier (several of them have been developed in the project, with complementary properties), ChD – information about changes between images acquired at different dates. All these tools provide the pieces of information that are then combined in the fusion module. Based on field campaigns and discussions with mine action specialists of the Croatian Mine action Centre (CROMAC), it was clear that the first task is to set up a list of features (indicators) that need to be looked for in the data, and that could be seen in the data and related to the absence or presence of mines or minefields. Indicators of mine absence are the most important in determining if an area is actually mine-safe. These indicators are not numerous, and the key one is a cultivated field. Most of available indicators are the ones that indicate mine presence. Thus, SMART has two applications: 1) area reduction, by detecting indicators of mine absence, and 2) suspicion reinforcement, by detecting indicators of mine presence (Yvinec, Y., 2005). The next step consists in preprocessing, i.e., registering and geocoding the available data as well as restoring the SAR images by a speckle reduction method based on the non-decimated wavelet transform (Duskunovic, I. et al., 2000). This step is followed by the development of methods and tools to detect the indicators, based on two approaches: 1) anomaly detection (detecting specific objects in the data) and 2) classification. The final step fuses the information produced by anomaly detectors and classifiers and builds the so-called danger maps. This paper focuses on the fusion step, which provides an intermediary result in SMART, consisting of improved land cover classification maps, along with confidence values. Thus, it is a very useful result, exploited by the deminers together with the final result.
Pre-Processing
/ Pre- classification
…
Contextual info (sensors, agricultural data…)
Fusion Over-view
image
Data
Danger map
Decision
SMART
operator
Contextual info (anomaly description, legend, training set…)
Contextual info (topography, MIS…)
Output: confidence map for each class and each potential indicator
Det1
DetM
ClN
ChD
…Cl1
Isabelle Bloch, Nada Milisavljevi & Marc Acheroy / Multisensor Data Fusion for Spaceborne and Airborne Reduction of Mined Areas
175
Table 1. Expected classes in the images
3. Data, knowledge and their specificities in SMART
3.1. Available images The available images include SAR, multispectral, high resolution optical and satellite data. SAR data were collected with the E-SAR system of the German Aerospace Centre (DLR) in fully polarimetric P- and L-band and in vv-polarization (waves are vertically transmitted and received) X- and C-band. Multispectral Daedalus data were collected with a spatial resolution of 1 m and in 12 channels, ranging from visible blue to thermal infrared. SAR and Daedalus data were geocoded. DLR also provided a complete set of RMK photographic aerial views recorded with a colored infrared film at a resolution of 3 cm. This non-geocoded data set is used as evidence to control the processing tools and for qualitative interpretation by photo-interpreters. Finally, geocoded KVR-1000 black-and-white satellite images with a resolution of 2 m, recorded before the war in Croatia, were purchased in order to assess the changes in the landscape due to the war.
3.2. The legend The legend (expected classes in the images), derived based on the existing and gathered knowledge about the mined areas, is given in Table 1. Ground truth was provided as a set of regions (training regions and validation regions). In the fusion module, training regions are used for estimating the parameters of some of the proposed methods; validation regions are used for the evaluation of the results.
3.3. Input of the fusion module Table 2 summarizes the input of the fusion module. A logistic regression classification was developed on SAR data at RMA (Borghys, D.; Perneel, C.; Keller, M.; Pizurica, A. & Philips, W., 2004). The results consist of confidence images for each class, except for class 4, which is not detected by this approach. A classification into hedges, trees, shadows, and rivers from SAR data has been developed at DLR (Keller, M.; Milisavljevi , N.; Suess, H. & Acheroy, M., 2002). The method relies on the satisfaction of several criteria. The number of satisfied criteria directly provides the confidence images for hedges and trees (after scaling on
Table 2. Summary of the input of the fusion module
[0, 1]). Shadows and rivers, provided as binary images, are “discounted“(work done at RMA based on spectral characteristics of these types of landcover, and on existing landcover indices and meanings of Daedalus bands). Hedges and trees are then grouped to form class 6 using a maximum operator. Shadows and rivers are directly interpreted as classes 7 and 8. Several classifiers have been developed for Daedalus: • a supervised classification method based on
minimum distance has been developed at RMA and a decision image is provided (Keller, M.; Milisavljevi , N.; Suess, H. & Acheroy, M., 2002);
• a region-based classification was performed at ULB and confidence images interpreted as membership degrees to each class are provided;
• a belief function classification was developed at RMA and confidence images per class are provided (Keller, M.; Milisavljevi , N.; Suess, H. & Acheroy, M., 2002).
Road detection was performed at ULB and RMA (Borghys, D.; Lacroix, V. & Perneel, C., 2002). Linear structures are provided. They are dilated to obtain roads with a width corresponding to the real width. A tool for river detection previously developed at ENST was used too. It is based on a Markovian approach. This is not directly a result of SMART but it is interesting to show how such knowledge can be introduced in the fusion process. Change detection was obtained at ULB, based on a comparison between older KVR images and images made during the project. It provides mainly information on abandoned regions (class 1). Again, this is an important knowledge that both improves the landcover classification and provides interesting results after the fusion for the construction of danger map.Other anomaly detection and classification tools developed in SMART were not used in the fusion
Class no. Legend 1 Abandoned agricultural land 2 Agricultural land in use 3 Asphalted roads 4 Rangeland 5 Residential areas 6 Trees and shrubs 7 Shadow 8 Water
Data type Type of result SAR Classification with confidence images
per class SAR & Daedalus
Detection of hedges, trees, shadows, rivers, with confidence degrees, sometimes discounted
Daedalus Supervised classification, result as a decision image
Daedalus Region-based classification with confidence images per class
Daedalus Belief function classification with confidence images per class
SAR & Daedalus
Binary detection of roads
SAR River detection (binary) Daedalus & KVR
Change detection (binary image)
International Journal of Advanced Robotic Systems, Vol. 4, No. 2 (2007)
176
module, or finally not used at all. For example, detectors of power poles, hilltops and strategic locations are not included in the legend. Therefore, they are not considered as input data for the fusion process, but they are added in the final results (construction of danger maps).
3.4. Knowledge modeling in the SMART project Knowledge inclusion is one of the main powers of our algorithms with respect to the commercial ones. This aspect has led to a lot of work in SMART, at different levels. First, a study of each sensor and on related knowledge (properties and behavior of the sensor, ability to detect or not some classes, confusions between classes, complementarities between bands or channels, etc.) has been performed and used in the design of each classifier and detector. More interesting for the fusion is the knowledge we have about possible associations between sensors. This is intensively used in the methods we propose. The type of knowledge we use concerns properties of each sensor and each classifier, as well as the complementarity between them. For instance, the knowledge that rivers can be detected by exploiting the distributions of SAR data leads to a specific way of using the result, as will be seen in the following section. An important piece of knowledge is also provided by the comparison between KVR images and images acquired during the project. In particular this comparison allows us to extract some information about the changes between two different dates. These changes are used as an additional piece of knowledge in our procedure. The landcover is usually not completely chaotic but there are some uniform regions showing the same landcover. This fact is used at two levels: in the classifier developed at ULB, which is based on a homogeneity criterion in regions, and at higher level, as a final step of fusion, to regularize the results in these homogeneous regions. Finally, we can group the knowledge sources as follows: • information provided by CROMAC (landcover
labeling, mine laying records, mine accidents, MIS and GIS system, etc.);
• information provided by ULB (result of the second ground-truth mission, especially on potential anomaly observations);
• information coming from our experience on working with the data (reliability for various channels, various classes, mixing of some classes,... but for this, we again depend on the input regarding existing types of classes and where some representatives of each of them can be found);
• information coming from the sensor principles of operation (physical meaning of the data, of the features, choice of most promising features,...).
Some knowledge can be indirectly integrated (our experience, principles of operation), but for the others, we have to define how to integrate/introduce them in our
algorithms (mine laying records, mine accidents,... - e.g., as a kind of discounting on how possible it is that an area is contaminated). Some of these pieces of knowledge are however not directly linked to the classes of interest and are therefore added at a higher level, during the construction of danger map.The two first items above constitute useful knowledge for testing and validation. From such type of knowledge, training and validation regions could be defined, that are used respectively for parameter estimation in some fusion methods and for evaluation of the results.The next two items are already used in some of the classifiers, i.e. before the fusion module. Some of them are used in the fusion too, as explained in the Section 5. In particular, we have some “sure” detection of roads and rivers (or at least of a part of it), which can be imposed on the fusion result. Change detection constitutes also an important piece of knowledge, that allows improving the results on class 1 (abandoned fields). Also the border (no registered data) can be imposed as prior information. All this is detailed in the following sections.
4. Fusion strategies in SMART
4.1. Belief function fusion - overview Belief function theory or Dempster-Shafer evidence theory (DS) has been already widely used in satellite image processing (van Cleynenbreugel, I. et al., 1991, Mascle, S.; Bloch, I. & Vidal-Madjar, D., 1997, Le Hégarat-Mascle, S.; Bloch, I. &Vidal-Madjar, D., 1998, Tupin, F.; Bloch, I. & Maître, H., 1999, Milisavljevi , N. & Bloch, I., 2003).DS allows representing both imprecision and uncertainty, using plausibility and belief functions derived from a mass function. The mass of a proposition A is a part of the initial unitary amount of belief that supports that the solution is exactly in A. It is defined as a function m from 2D into [0, 1], where D is the decision space, also called frame of discernment and it is a set of possible solutions (classes). Usually the following constraints are imposed:
m(∅) = 0, (1) 1)( =
⊆DAAm . (2)
In this formalism, any combination of possible decisions from the decision space can be quantified rather than considering only the singletons of D (Shafer, G., 1976, Smets, P., 1990). This is one of the main advantages of the DS approach. Indeed, it leads to a very flexible and rich modeling, able to fit a very large class of situations, occurring in particular in image fusion. Examples of situations where DS theory may be successfully used are: • when a source provides information concerning only
some of the classes; • when one source of information differentiates two
classes and another source does not; • mixed pixel example (the presence of more than one
landcover type in one pixel);
Isabelle Bloch, Nada Milisavljevi & Marc Acheroy / Multisensor Data Fusion for Spaceborne and Airborne Reduction of Mined Areas
177
• in cases where global source reliability has to be taken into account;
• in cases where knowledge of source reliability is available only for some classes;
• in cases where a priori information has to be introduced - even if it is not represented in a probabilistic manner, it can be taken into account if it induces a way to assign masses, in particular to compound hypotheses;
• in cases of having rare data, i.e. when their amount is not sufficient for a reliable statistical learning, while there is a lot of external (such as expert) knowledge that is quite reliable, as it is the case in mine detection (Milisavljevi , N. & Bloch, I., 2003) and in SMART.
A recent application where these features of DS are used extensively can be found in (Milisavljevi , N.; Bloch, I.; van den Broek, S. & Acheroy, M., 2003, Milisavljevi , N. & Bloch, I., 2003, Milisavljevi , N. & Bloch, I., 2005). In image processing, mass functions may be derived at three different levels. At the highest, most abstract level, information representation is used in a way similar to that in artificial intelligence. Masses are assigned to propositions, often provided by experts, such as knowledge inclusion in SMART, discussed in Section 3.4 (Gordon, J. & Shortliffe, E. H., 1985, Neapolitan, R. E., 1992). Up to now, this kind of information is usually not derived from measures on the images. At an intermediate level, masses are computed from attributes, and may involve simple geometrical models (van Cleynenbreugel, I. et al., 1991, Chen, S. Y.; Lin, W. C. & Chen, C. T., 1993). This is well adapted to model-based pattern recognition but it is difficult to use for image fusion classification of complex structures without a model. At the pixel level, mass assignment is inspired from statistical pattern recognition. The most widely used approach is as follows: masses on simple hypotheses are computed from probabilities or from the distance to a class center (Appriou, A., 1993). Then a global ignorance m(D) is introduced as a discounting factor, often as a constant on all pixels (Lee, R. H. & Leahy, R., 1990). In most cases no other compound hypothesis is considered, and this drastically under-exploits the power of DS. Masses can also be defined from a distance measure to class centers (Denœux, T., 1995). The mass assignment in (Bloch. I, 1996) is based on a reasoning approach where knowledge about the information provided by each image is used to choose the focal elements (i.e., subsets with non-zero mass values). A similar reasoning is used in (Milisavljevi , N. & Bloch, I., 2001). However, in case of large numbers of classes, this process would become too tedious, and unsupervised methods are needed, such as (Mascle, S.; Bloch, I. & Vidal-Madjar, D., 1997) for SAR imaging or (Ménard, M.; Zahzah, E. H. & Shahin, A., 1996) for fusion of several classifiers. In the DS framework, masses assigned by different sources (e.g. classifiers) are combined by the orthogonal
rule of Dempster (Shafer, G., 1976). For mj being the mass function associated with source j (j=1...l, where l is the number of sources), this rule is written, for all non-empty subsets A of D:
=∩∩=
⊕⊕⊕=
ABBll
l
l
BmBmBm
AmmmAm
...2211
21
1
)()...()(
))(...()(. (3)
After the combination in this unnormalized form (Smets, P., 1993), the mass that is assigned to the empty set:
∅=∩∩=∅
lBBll BmBmBmm
...2211
1
)()...()()( (4)
can be interpreted as a measure of conflict between the sources. It can be directly taken into account in the combination as a normalization factor. It is very important to consider this value for evaluating the quality of the combination: when it is high (in case of strong conflict), the normalized combination may not make sense and may lead to questionable decisions (Dubois, D. & Prade, H., 1988). Several authors suggest not normalizing the combination result (e.g. Smets, P., 1993), which corresponds to Eq. (3). This fusion operator has a conjunctive behavior. This means that all imprecision on the data has to be introduced explicitly at the modeling level, in particular in the choice of the focal elements. For instance, ambiguity between two classes in one image has to be modeled using a disjunction of hypotheses, so that conflict with other images can be limited and ambiguity can be possibly solved during the combination. From a mass function, we can derive a belief function:
≠∅⊆=∈∀
BAB
D BmABelA,
)()(,2 (5)
as well as a plausibility function:
∅≠∩=∈∀
AB
D BmAPlsA )()(,2 . (6)
After the combination, the final decision is usually taken in favor of a simple hypothesis using one of several rules (Denœux, T., 1995): e.g. the maximum of plausibility (generally over simple hypotheses), the maximum of belief, the pignistic decision rule (Smets, P., 1995), etc. For some applications, such as in humanitarian demining, it may also be necessary to give more importance to some classes (e.g., mines, since they must not be missed) at the decision level. Then maximum of plausibility can be used for the classes that should not be missed, and maximum of belief for the others (Milisavljevi , N. & Bloch, I., 2001). In all that follows, the computations are performed at pixel level. A final regularization step is then applied (see Section 5.2).
4.2. SMART fusion strategy no. 1: direct use of the classes A first, simple method consists in considering each classifier as one information source. The focal elements are simply the classes. The classifier outputs (confidence values) are directly used as mass functions in this model. When no confidence values are provided but only a decision image or a binary detection, the mass takes only
International Journal of Advanced Robotic Systems, Vol. 4, No. 2 (2007)
178
values 0 or 1. This approach inevitably results in a high mass of the empty set after the combination. Moreover, only the classes detected by all classifiers are obtained as resulting focal elements. Thus, no good result can be expected with this approach. It shows the interest of really using belief function theory or any other that takes into account the specificities of the classifiers, disjunctions of classes and ignorance (mass assigned to the full set, D).
4.3. SMART fusion strategy no.2: adding a global discounting factor (BF1) Here, we still consider each classifier as one information source, but the focal elements are the singletons and D.The definition of m(D) takes into account both the fact that some classes are not detected (thus it should be equal to 1 at points where 0 is obtained for all detected classes) as well as global errors. We propose to use a discounting factor α equal to the sum of the diagonal elements of the confusion matrix, divided by the cardinality of the training areas. This discounting is applied on all masses defined as in the previous approach. Then:
m(D) = 1 - α . (7) Note that this uses explicitly the confidence matrix, which should be computed on the training areas for each classifier or detector. It results that at each step of the fusion, the focal elements are always singletons and D.Decision rule can be maximum of belief, of mass or of pignistic probability (all being equivalent in this case). This approach is very easy to implement and models in a simple way the fact that classifiers or detectors may not give any information on some classes and may be imperfect. Results of this method are shown in Section 6.
4.4. SMART fusion strategy no.3: considering each class of each classifier/detector as an information source More sophisticated methods can be designed by considering each classifier as several sources. Namely, each classifier provides an output for each class, which can be considered as an information source for the fusion. Focal elements for a source defined by the output of a classifier or detector to a class Ci can be Ci, and D or D\Ci. These are the simplest models. If focal elements are chosen as Ci and D, then results provide only singletons and D as focal elements. The mass m(Ci) can be tuned as a function of the values provided by the classifier in the area of the training regions for this class. For example, if the values are not very high, the mass can be reinforced and defined as m(Ci)= k⋅v(Ci) where v(Ci) denotes the results provided by the classifier for class Ci. Then m(D)= 1-v(Ci). Although this approach is quite simple, it raises the problem of the choice of k. It is difficult to derive it in an automatic way, and thus this approach was not further tested. If this factor is ignored, the results are not satisfactory. However, this idea can be interestingly combined with ideas for using the confidence matrix in a more subtle way as described in Subsection 4.6.
If focal elements are chosen as Ci and D\ Ci, then several disjunctions appear in the result. The mass is spread over more subsets of D. Actually if at least one classifier provides results for all classes, as soon as this classifier is completely used in the fusion, then the resulting focal elements can be only singletons (and empty set). This method was tested, but did not provide interesting results: there are a lot of unclassified points (i.e. assigned to 0), which is not very satisfactory. Mixed cases can also be considered: sometimes, focal elements are Ci and D, and sometimes Ci and D\ Ci
(typically in cases where the classifier provides a good separation between Ci and the other classes). Several disjunctions can appear in the combination. A drawback of this approach is that it also provides many unclassified points. Moreover, it can be difficult to decide for each class of each classifier if we should take D or D\ Ci as focal elements. In cases where a classifier leads to a lot of confusion between several classes, e.g. Ci and Cj (but it can be more than two classes), we could take as focal elements Ci ∪ Cj
and D (or D \ {Ci, Cj}). The problem is that such cases are seldom and we may lose some information.
4.5. SMART fusion strategy no.4: analysis of the behavior of each classifier for each class Now each class of each classifier is considered as a source and we take into account the behavior of the classifier with respect to the other classes. This behavior can be partly understood by looking at the histogram of the output of the classifier for class Ci (v(Ci)) in training areas for class Ci and at the histogram of v(Ci) in training areas of classes Cj that are often confused with Ci.If low values are obtained, then we can set m(Cj)=1-v(Ci). If high values are obtained, then we can set m(Ci ∪ Cj)=1-v(Ci). A mass on D can also be introduced as 1-v(Ci). Then normalization should be performed in order to obtain a sum of masses equal to 1. There are many difficulties with this approach: e.g., training areas and confusion matrices are intensively used in a non-trivial way, and it is difficult to define the relative weights of all defined masses. The latter is the main problem, and may explain why no good results are obtained so far with this method, although many tests have been performed. Overall, this approach could be interesting since it is quite rich and flexible, but it is very difficult to tune.
4.6. SMART fusion strategy no.5: use of confusion matrices for more specific discounting (BF2) Next, we propose to use the confusion matrices for defining more specific discounting for each class. From the confusion matrix computed from the decision made from one classifier and from training areas, we derive a kind of probability that the class is Ci given that the classifier says Cj as:
=i
jiconfjiconf
jic),(
),(),( , (8)
Isabelle Bloch, Nada Milisavljevi & Marc Acheroy / Multisensor Data Fusion for Spaceborne and Airborne Reduction of Mined Areas
179
where the values conf(i,j) denote the coefficients of the confusion matrix. We can ignore the low values and normalize the others, in order to reduce the number of non-zero coefficients (thus the number of focal elements in the following). We used a threshold value of 0.05. There are several ways to use this normalized confusion matrix, e.g. by setting m(Ci)=c(i,j) for detected pixels in case of detectors and deriving a more complex method for classifiers. The most interesting way, applying to both classifiers and detectors in a similar way, is as follows. We use c(i,j) for discounting in methods described in Subsection 4.4, in particular in the one where only Ci and D are taken as focal elements (without any k). This time, the decision image for each classifier is not required. We still consider that a class j of a classifier is one source, as for all instances of methods of Subsection 4.4. From v(Cj)provided for this class by a classifier, we define:
),()()( jicCvCm ji = (9)
for all classes Ci which are confused with Cj (which provides )()( ji i CvCm = ), and:
)(1)( jCvDm −= . (10)
In comparison to the simplest method, instead of keeping a mass on Ci only (and D), this mass is spread over all classes possibly confused with Ci, thus better exploiting the richness of the information provided by a classifier. Results of this method are given in Section 6.
4.7. SMART fusion strategy no.6: fuzzy fusion (FUZZY)In order to compare the previous methods with a fuzzy approach, we tested a simple method, where we choose for each class the best classifiers, and combine them with a maximum operator (possibly with some weights). Then decision is made according to a maximum rule. The choice is made based on the confusion matrix for each classifier or detector, by comparing the diagonal elements in all matrices for each class. In the illustrated example, the best detections, according to the confusion matrix of each classifier or detector are detailed in Section 6.3. They provide the inputs of the combination step, and a simple maximum operator performs well for this step. This approach is interesting because it is very fast. It uses only a part of the information, which could also be a drawback if this part is not chosen appropriately. Some weights have to be tuned, which may need some user interaction in some cases. Although it may sound somewhat ad hoc, it is interesting to show what we can get by using the best parts of all classifiers. Since results obtained this way are about the best for each class among all classifiers, the results are shown in Section 6.
5. Knowledge introduction and spatial regularization
5.1. Introducing knowledge In order to improve the results, some additional knowledge can be included in the fusion results (note that knowledge on the classifiers, their behaviors, etc. has
already been included in the previous steps). We use at this step only the pieces of knowledge that directly provide information on the landcover classification. Other pieces of knowledge such as mine reports, etc. are not directly related to classes of interest, but rather to the dangerous areas, and are therefore included in the danger map construction, which follows the fusion. At this step, several pieces of knowledge proved to be very useful. They concern on the one hand some “sure” detection. Some detectors are available for roads and rivers, which provide areas or lines that surely belong to these classes. There is almost no confusion, but some parts can be missing. Then these detections can be imposed on the classification results. This is simply achieved by replacing the label of each pixel in the decision image by the label of the detected class if this pixel is actually detected. If not, its label is not changed. As for roads, additional knowledge is used, namely on the width of the roads (based on observations done during the field missions). Since the detectors provide only lines, these are dilated by the appropriate size, taking into account both the actual road width and the resolution of the images. Another type of knowledge is very useful: the detection of changes between images taken during the project and KVR images obtained earlier. The results of the change detection processing provide mainly information about class 1, since they exhibit the fields which were previously cultivated, and which are now abandoned. These results do not show all regions belonging to class 1, but the detected areas surely belong to that class. Then a similar process can be applied as for the previous detectors. With the proposed methods, it was difficult to obtain good results on class 2, while preserving the results on class 1 that is crucial since it corresponds to fields no longer in use and therefore potentially dangerous. Therefore we use the best detection of class 2 (extracted from region based classification on Daedalus) as an additional source of knowledge. As will be seen in Section 6, this additional knowledge introduction allows us to obtain better results.
5.2. Spatial regularizationThe last step is a regularization step. Indeed, it is very unlikely that isolated pixels of one class can appear in another class. Several local filters have been tested, such as a majority filter, a median filter, or morphological filters, applied on the decision image. A Markovian regularization approach on local neighborhoods was tested too. The results are somewhat better, but not significantly better. A better approach is to use the segmentation into homogeneous regions provided by ULB. In each of these regions, a majority voting is performed: we count the number of pixels in this region that are assigned to each class and the class that has the largest
International Journal of Advanced Robotic Systems, Vol. 4, No. 2 (2007)
180
Table 3. Discounting factors for method BF1
cardinality is chosen for the whole region (all pixels of this region are relabeled and assigned to this class). This type of regularization, which is performed at a regional level rather than at a local one, provides good results, as will be seen in Section 6.
5.3. On the levels of fusion Three levels of fusion are often distinguished: low level (usually pixel level), intermediary level (features such as lines or regions) and higher level (often called decision fusion). Here all three levels are addressed in the proposed schemes. Firstly, all three levels appear in the input of fusion, since classifiers may be based on pixels, on regions, on detection of linear structures (as for river or roads), on semantics (like change detection), etc. Then, the three levels also appear in the fusion itself: the computation of the combination is performed at pixel level, but based on semantic information provided by the classifiers and detectors (in terms of classes and decisions). Thus, this step merges two levels of fusion.
Table 4. UA and PA for all three methods (after knowledge inclusion and spatial regularization) and the best classifier (BC) for each important class
The final regularization step is performed at an intermediary level, in homogeneous regions which are not reduced to a simple pixel neighborhood, but which on the other hand do not cover one class each (several regions belong to the same class).
6. Results
In this section, we provide results obtained with the three most interesting methods described in Subsections 4.3 (BF1), 4.6 (BF2) and 4.7 (FUZZY) in case of Glinska Poljana site in Croatia.
6.1. Results with BF1 For each classifier, the discounting factor α is obtained from the normalized sum of the diagonal elements of the confusion matrix obtained on the training areas. The values are given in Table 3. After this type of fusion, a lot of confusion occurs between classes 1 and 2, but this is largely improved by knowledge inclusion, while noisy aspect is suppressed by regularization. In order to assess classification accuracy, we use user's accuracy (UA) and producer's accuracy (PA) measures that can be derived directly from confusion matrices. UA represents the probability that a given pixel will appear on the ground as it is classed (i.e., how much confidence should a user have for a given classification). PA is the percentage of a given class that is correctly identified on the map (it says how well we produce a map of classification for a specific class). The two accuracies per class are given in Table 4. Note that the most interesting
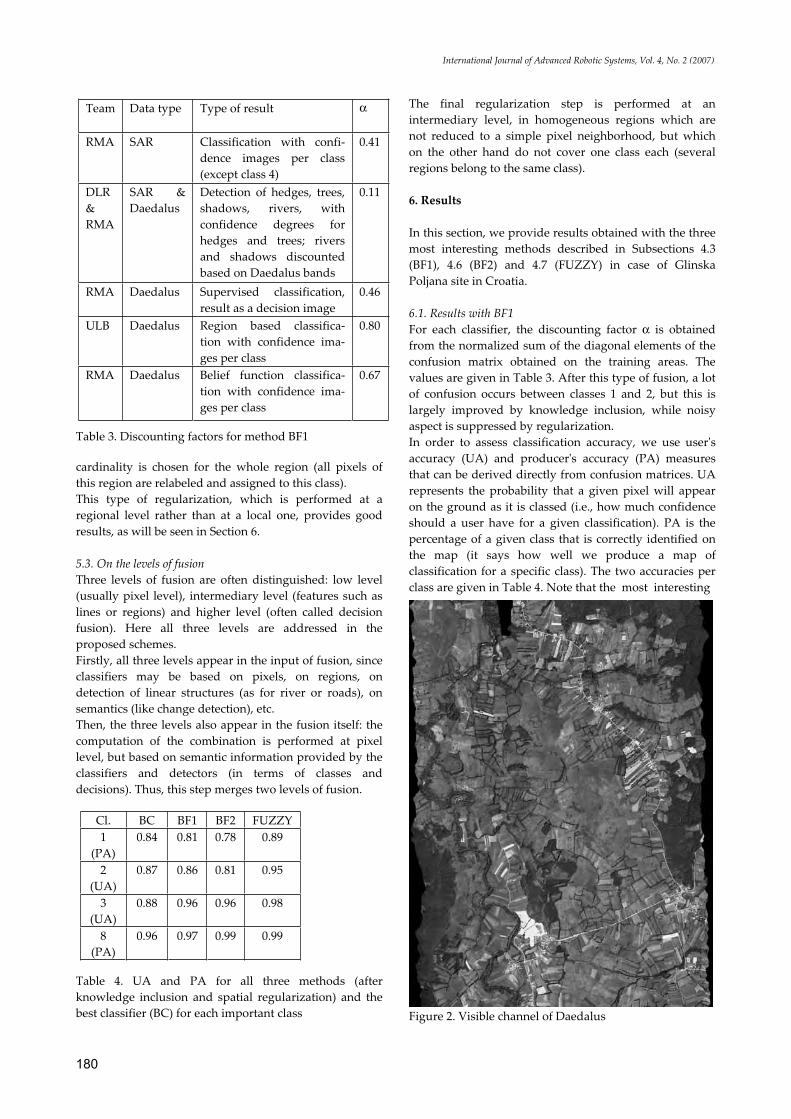
Figure 2. Visible channel of Daedalus
Team Data type Type of result α
RMA SAR Classification with confi-dence images per class (except class 4)
0.41
DLR&RMA
SAR & Daedalus
Detection of hedges, trees, shadows, rivers, with confidence degrees for hedges and trees; rivers and shadows discounted based on Daedalus bands
0.11
RMA Daedalus Supervised classification, result as a decision image
0.46
ULB Daedalus Region based classifica-tion with confidence ima-ges per class
0.80
RMA Daedalus Belief function classifica-tion with confidence ima-ges per class
0.67
Cl. BC BF1 BF2 FUZZY 1
(PA)0.84 0.81 0.78 0.89
2(UA)
0.87 0.86 0.81 0.95
3(UA)
0.88 0.96 0.96 0.98
8(PA)
0.96 0.97 0.99 0.99
Isabelle Bloch, Nada Milisavljevi & Marc Acheroy / Multisensor Data Fusion for Spaceborne and Airborne Reduction of Mined Areas
181
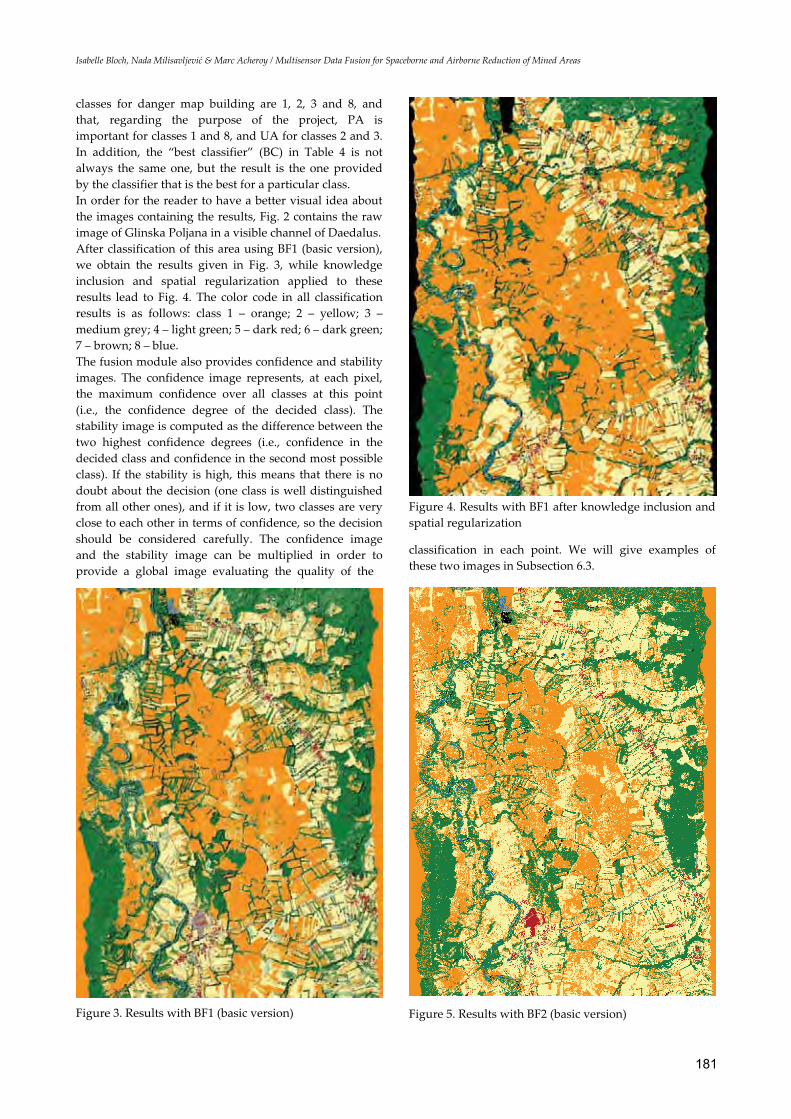
classes for danger map building are 1, 2, 3 and 8, and that, regarding the purpose of the project, PA is important for classes 1 and 8, and UA for classes 2 and 3. In addition, the “best classifier” (BC) in Table 4 is not always the same one, but the result is the one provided by the classifier that is the best for a particular class. In order for the reader to have a better visual idea about the images containing the results, Fig. 2 contains the raw image of Glinska Poljana in a visible channel of Daedalus. After classification of this area using BF1 (basic version), we obtain the results given in Fig. 3, while knowledge inclusion and spatial regularization applied to these results lead to Fig. 4. The color code in all classification results is as follows: class 1 – orange; 2 – yellow; 3 – medium grey; 4 – light green; 5 – dark red; 6 – dark green; 7 – brown; 8 – blue. The fusion module also provides confidence and stability images. The confidence image represents, at each pixel, the maximum confidence over all classes at this point (i.e., the confidence degree of the decided class). The stability image is computed as the difference between the two highest confidence degrees (i.e., confidence in the decided class and confidence in the second most possible class). If the stability is high, this means that there is no doubt about the decision (one class is well distinguished from all other ones), and if it is low, two classes are very close to each other in terms of confidence, so the decision should be considered carefully. The confidence image and the stability image can be multiplied in order to provide a global image evaluating the quality of the
Figure 3. Results with BF1 (basic version)
Figure 4. Results with BF1 after knowledge inclusion and spatial regularization
classification in each point. We will give examples of these two images in Subsection 6.3.
Figure 5. Results with BF2 (basic version)
International Journal of Advanced Robotic Systems, Vol. 4, No. 2 (2007)
182
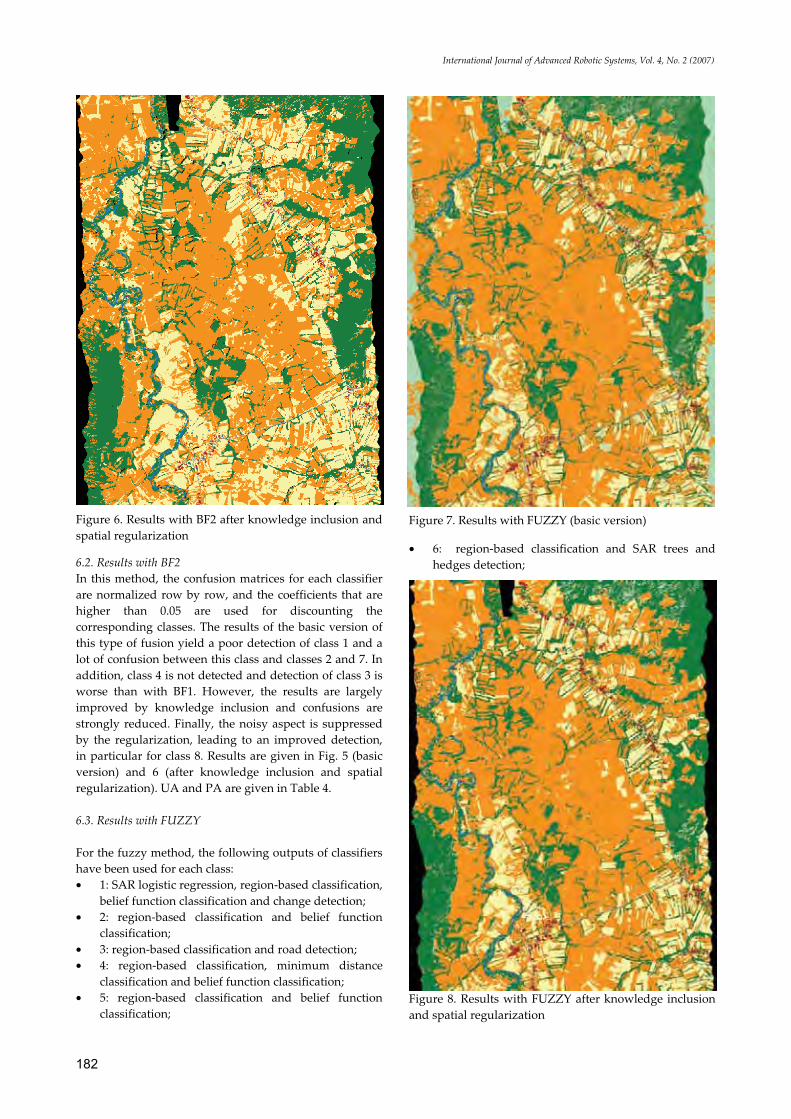
Figure 6. Results with BF2 after knowledge inclusion and spatial regularization
6.2. Results with BF2 In this method, the confusion matrices for each classifier are normalized row by row, and the coefficients that are higher than 0.05 are used for discounting the corresponding classes. The results of the basic version of this type of fusion yield a poor detection of class 1 and a lot of confusion between this class and classes 2 and 7. In addition, class 4 is not detected and detection of class 3 is worse than with BF1. However, the results are largely improved by knowledge inclusion and confusions are strongly reduced. Finally, the noisy aspect is suppressed by the regularization, leading to an improved detection, in particular for class 8. Results are given in Fig. 5 (basic version) and 6 (after knowledge inclusion and spatial regularization). UA and PA are given in Table 4.
6.3. Results with FUZZY
For the fuzzy method, the following outputs of classifiers have been used for each class: • 1: SAR logistic regression, region-based classification,
belief function classification and change detection; • 2: region-based classification and belief function
classification; • 3: region-based classification and road detection; • 4: region-based classification, minimum distance
classification and belief function classification; • 5: region-based classification and belief function
classification;
Figure 7. Results with FUZZY (basic version)
• 6: region-based classification and SAR trees and hedges detection;
Figure 8. Results with FUZZY after knowledge inclusion and spatial regularization
Isabelle Bloch, Nada Milisavljevi & Marc Acheroy / Multisensor Data Fusion for Spaceborne and Airborne Reduction of Mined Areas
183
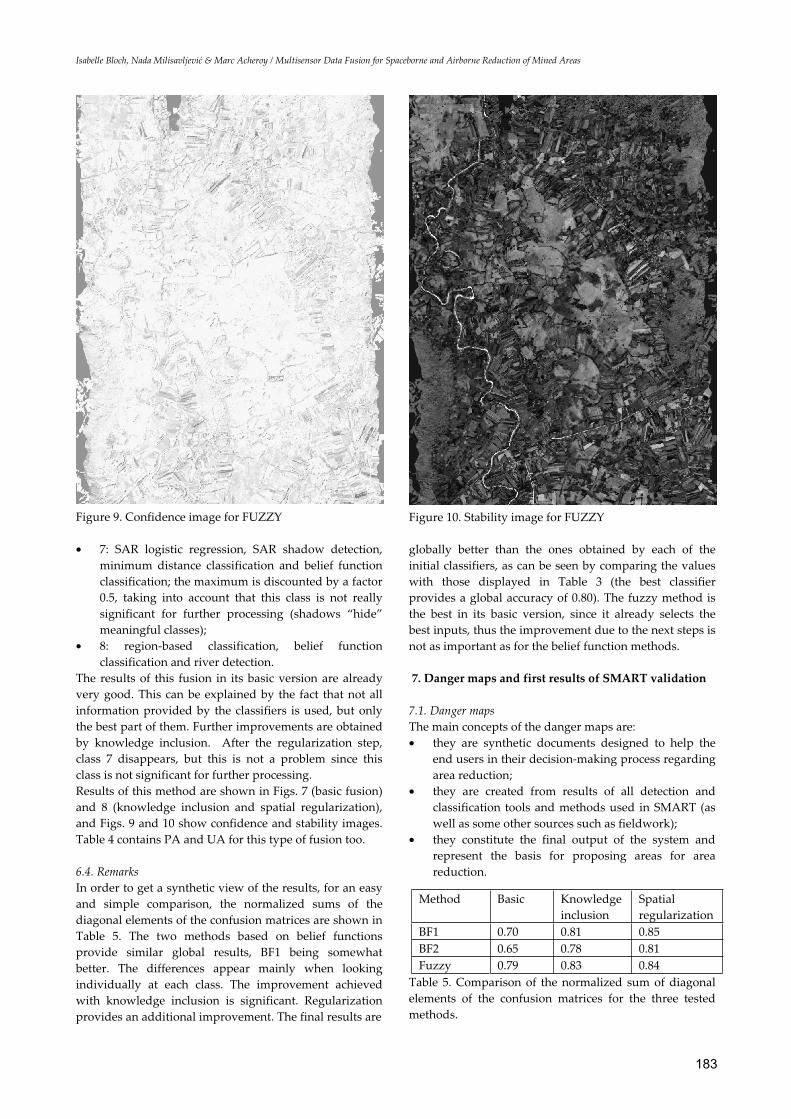
Figure 9. Confidence image for FUZZY
• 7: SAR logistic regression, SAR shadow detection, minimum distance classification and belief function classification; the maximum is discounted by a factor 0.5, taking into account that this class is not really significant for further processing (shadows “hide” meaningful classes);
• 8: region-based classification, belief function classification and river detection.
The results of this fusion in its basic version are already very good. This can be explained by the fact that not all information provided by the classifiers is used, but only the best part of them. Further improvements are obtained by knowledge inclusion. After the regularization step, class 7 disappears, but this is not a problem since this class is not significant for further processing. Results of this method are shown in Figs. 7 (basic fusion) and 8 (knowledge inclusion and spatial regularization), and Figs. 9 and 10 show confidence and stability images. Table 4 contains PA and UA for this type of fusion too.
6.4. RemarksIn order to get a synthetic view of the results, for an easy and simple comparison, the normalized sums of the diagonal elements of the confusion matrices are shown in Table 5. The two methods based on belief functions provide similar global results, BF1 being somewhat better. The differences appear mainly when looking individually at each class. The improvement achieved with knowledge inclusion is significant. Regularization provides an additional improvement. The final results are
Figure 10. Stability image for FUZZY
globally better than the ones obtained by each of the initial classifiers, as can be seen by comparing the values with those displayed in Table 3 (the best classifier provides a global accuracy of 0.80). The fuzzy method is the best in its basic version, since it already selects the best inputs, thus the improvement due to the next steps is not as important as for the belief function methods.
7. Danger maps and first results of SMART validation
7.1. Danger mapsThe main concepts of the danger maps are: • they are synthetic documents designed to help the
end users in their decision-making process regarding area reduction;
• they are created from results of all detection and classification tools and methods used in SMART (as well as some other sources such as fieldwork);
• they constitute the final output of the system and represent the basis for proposing areas for area reduction.
Table 5. Comparison of the normalized sum of diagonal elements of the confusion matrices for the three tested methods.
Method Basic Knowledge inclusion
Spatialregularization
BF1 0.70 0.81 0.85 BF2 0.65 0.78 0.81 Fuzzy 0.79 0.83 0.84
International Journal of Advanced Robotic Systems, Vol. 4, No. 2 (2007)
184
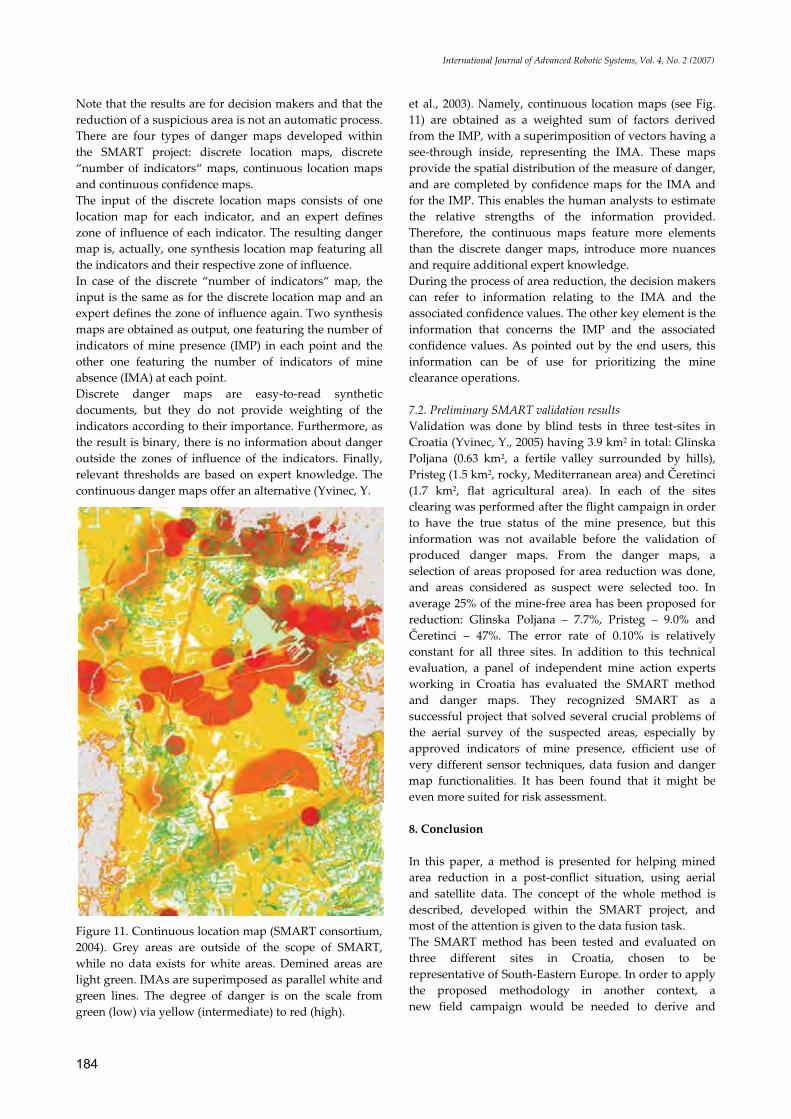
Note that the results are for decision makers and that the reduction of a suspicious area is not an automatic process. There are four types of danger maps developed within the SMART project: discrete location maps, discrete “number of indicators“ maps, continuous location maps and continuous confidence maps. The input of the discrete location maps consists of one location map for each indicator, and an expert defines zone of influence of each indicator. The resulting danger map is, actually, one synthesis location map featuring all the indicators and their respective zone of influence. In case of the discrete “number of indicators“ map, the input is the same as for the discrete location map and an expert defines the zone of influence again. Two synthesis maps are obtained as output, one featuring the number of indicators of mine presence (IMP) in each point and the other one featuring the number of indicators of mine absence (IMA) at each point. Discrete danger maps are easy-to-read synthetic documents, but they do not provide weighting of the indicators according to their importance. Furthermore, as the result is binary, there is no information about danger outside the zones of influence of the indicators. Finally, relevant thresholds are based on expert knowledge. The continuous danger maps offer an alternative (Yvinec, Y.
Figure 11. Continuous location map (SMART consortium, 2004). Grey areas are outside of the scope of SMART, while no data exists for white areas. Demined areas are light green. IMAs are superimposed as parallel white and green lines. The degree of danger is on the scale from green (low) via yellow (intermediate) to red (high).
et al., 2003). Namely, continuous location maps (see Fig. 11) are obtained as a weighted sum of factors derived from the IMP, with a superimposition of vectors having a see-through inside, representing the IMA. These maps provide the spatial distribution of the measure of danger, and are completed by confidence maps for the IMA and for the IMP. This enables the human analysts to estimate the relative strengths of the information provided. Therefore, the continuous maps feature more elements than the discrete danger maps, introduce more nuances and require additional expert knowledge. During the process of area reduction, the decision makers can refer to information relating to the IMA and the associated confidence values. The other key element is the information that concerns the IMP and the associated confidence values. As pointed out by the end users, this information can be of use for prioritizing the mine clearance operations.
7.2. Preliminary SMART validation resultsValidation was done by blind tests in three test-sites in Croatia (Yvinec, Y., 2005) having 3.9 km2 in total: Glinska Poljana (0.63 km2, a fertile valley surrounded by hills), Pristeg (1.5 km2, rocky, Mediterranean area) and eretinci (1.7 km2, flat agricultural area). In each of the sites clearing was performed after the flight campaign in order to have the true status of the mine presence, but this information was not available before the validation of produced danger maps. From the danger maps, a selection of areas proposed for area reduction was done, and areas considered as suspect were selected too. In average 25% of the mine-free area has been proposed for reduction: Glinska Poljana – 7.7%, Pristeg – 9.0% and
eretinci – 47%. The error rate of 0.10% is relatively constant for all three sites. In addition to this technical evaluation, a panel of independent mine action experts working in Croatia has evaluated the SMART method and danger maps. They recognized SMART as a successful project that solved several crucial problems of the aerial survey of the suspected areas, especially by approved indicators of mine presence, efficient use of very different sensor techniques, data fusion and danger map functionalities. It has been found that it might be even more suited for risk assessment.
8. Conclusion
In this paper, a method is presented for helping mined area reduction in a post-conflict situation, using aerial and satellite data. The concept of the whole method is described, developed within the SMART project, and most of the attention is given to the data fusion task. The SMART method has been tested and evaluated on three different sites in Croatia, chosen to be representative of South-Eastern Europe. In order to apply the proposed methodology in another context, a new field campaign would be needed to derive and
Isabelle Bloch, Nada Milisavljevi & Marc Acheroy / Multisensor Data Fusion for Spaceborne and Airborne Reduction of Mined Areas
185
implement new general rules. Before using SMART, the list of indicators must be re-evaluated and adapted. Furthermore, the SMART method is not designed to provide the final stage of area reduction, which would require that 0% of the area proposed for the reduction is actually mined, but an early stage in the whole process. It provides danger maps, confidence maps of indicators of mine presence and confidence maps of indicators of mine absence, which help the interpretation of the areas proposed for area reduction.Regarding the data fusion module itself, we have worked on numerical fusion methods. The proposed approaches are to a large part original and constitute by themselves a result of the project. Results have been obtained on the three sites with the three most promising approaches, and as an example, fusion results for one of the sites (Glinska Poljana) are given in this paper. We have shown how the results can be improved by introducing additional knowledge in the fusion process. A spatial regularization at a regional level further improves the results. At the end, the results are at least as good as the ones provided for each class by the best classifier for that class. Therefore they are globally better than any input classifier or detector. This shows the improvement brought by fusion. The user has the possibility to be involved in the choice of the classifiers, in the choice of some of the parameters (in particular for the fuzzy fusion approach, some supervision is still required in the choice of the parameters). Although for the two first approaches, the parameters are automatically derived from the confusion matrices of each classifier, the programs are flexible enough to allow the user to modify them at wish. The work done for this fusion module will certainly be useful in many other applications, even in quite different domains, and constitutes therefore a large set of methods and tools for both research and applicative work. In particular, SMART gave us the opportunity to propose and develop schemes that have a noticeable variety and richness and constitute a real improvement over existing tools.
Acknowledgements
The authors thank all the researchers of the project SMART, co-funded by the European Commission (IST-2000-25044) and involving the following partners: CROMAC, DLR, ENST, IXL, Renaissance asbl (RMA), RST, TRASYS, ULB-IGEAT and Zeppelin.
References
Acheroy, M. (2003). Mine Action Technologies: Problems and Recommendations, Journal for Mine Action, vol. 7, no. 3.
Acheroy, M. (2005). Spaceborne and Airborne Mined Area Reduction Tools. Workshop on Inventory and analysis of operationally validated results related to
mine action space- and airborne surveys, Zagreb, Croatia, Scientific Council of CROMAC (invited paper).
Appriou, A. (1993). Formulation et traitement de l'incer-tain en analyse multi-senseurs. Proc. of Quatorzième Colloque GRETSI, pp. 951-954, Juan les Pins.
Askelin, J.-I. (1999). EOD IS - a Loaded Laptop. FOA magazine, Swedish Defense Research, No. 1.
Bloch, I. (1996). Some Aspects of Dempster-Shafer Evidence Theory for Classification of Multi-Modality Medical Images Taking Partial Volume Effect into Account. Pattern Recognition Letters, Vol. 17, No. 8, pp. 905-919.
Borghys, D.; Lacroix, V. & Perneel, C. (2002). Edge and Line Detection in Polarimetric SAR Images. In Proc. of International Conference on Pattern Recognition, Vol. 2, pp. 921-924, Quebec, Canada.
Borghys, D.; Perneel, C.; Keller, M.; Pizurica, A. & Philips, W. (2004). Supervised Feature-Based Classification of Multi-channel SAR Images Using Logistic Regression. In Proc. of European Conference on Synthetic Aperture Radar (EUSAR), Vol. 2, pp. 949-952, Ulm, Germany.
Chen, S. Y.; Lin, W. C. & Chen, C. T. (1993). Evidential Reasoning based on Dempster-Shafer Theory and its Application to Medical Image Analysis. In Proc. of SPIE, Vol. 2032 - Neural and Stochastic Methods in Image and Signal Processing II, Su-Shing Chen (editor), pp. 35-46.
Delhay, S., Lacroix, V. & Idrissa, M. (2005). PARADIS: GIS Tools for Humanitarian Demining. ISCRAM 2005: Information Systems for Crisis Response And Management Conference.
Denœux, T. (1995). A k-nearest Neighbor Classification Rule based on Dempster-Shafer Theory. IEEE Transactions on Systems, Man and Cybernetics, Vol. 25, No. 5, pp. 804-813.
Dubois, D. & Prade, H. (1988). Representation and Combination of Uncertainty with Belief Functions and Possibility Measures. Computational Intelligence, Vol. 4, pp. 244-264.
Duskunovic, I.; Stippel, G.; Pizurica, A.; Philips, W. & Lemahieu, I. (2000). A New Restoration Method and its Application to Speckle Images. In Proc. of the IEEE International Conf. on Image Processing (ICIP 2000), pp. 273-276, Vancouver, Canada.
Gordon, J. & Shortliffe, E. H. (1985). A Method for Managing Evidential Reasoning in a Hierarchical Hypothesis Space. Artificial Intelligence, Vol. 26, pp. 323-357.
IMSMA (1999). http://www.imsma.org, Information
International Journal of Advanced Robotic Systems, Vol. 4, No. 2 (2007)
186
Management System for Mine Action
International Campaign to Ban Landmines - ICBL (2005). Landmine Monitor 2005: Toward a Mine-Free World,Mines Action Canada, Handicap International, Human Rights Watch, Norwegian People's Aid.
JMU. http://www.maic.jmu.edu, USA: website of the Mine Action Information Center at the James Madison University
Keller, M.; Milisavljevi , N.; Suess, H. & Acheroy, M. (2002). Reduction of Mine Suspected Areas by Multisensor Airborne Measurements: First Results. In Proc. of SPIE Conference on Detection Technologies for Mines and Minelike Targets, Vol. 4742, pp. 857-871, Orlando, USA.
Lee, R. H. & Leahy, R. (1990). Multi-spectral Classification of MR Images Using Sensor Fusion Approaches. In Proc. of SPIE Medical Imaging IV: Image Processing, Vol. 1233, pp. 149-157.
Le Hégarat-Mascle, S.; Bloch, I. & Vidal-Madjar, D. (1998). Introduction of Neighborhood Information in Evidence Theory and Application to Data Fusion of Radar and Optical Images with Partial Cloud Cover. Pattern Recognition, Vol. 31, No. 11, pp.1811-1823.
Mascle, S.; Bloch, I. & Vidal-Madjar, D. (1997). Application of Dempster-Shafer Evidence Theory to Unsupervised Classification in Multisource Remote Sensing. IEEE Transactions on Geoscience and Remote Sensing, Vol. 35, No. 4, pp. 1018-1031.
Ménard, M.; Zahzah, E. H. & Shahin, A. (1996). Mass Function Assessment: Case of Multiple Hypotheses for the Evidential Approach. In Proc. of Europto Conf. on Image and Signal Processing for Remote Sensing, Vol. 2955, pp. 214-218, Taormina, Italy.
Milisavljevi , N. & Bloch, I. (2001). A Two-Level Approach for Modeling and Fusion of Humanitarian Mine Detection Sensors within the Belief Function Framework. In Proc. of Applied Stochastic Models and Data Analysis, Vol. 2, pp. 743-748, Compiègne, France.
Milisavljevi , N.; Bloch, I.; van den Broek, S. & Acheroy, M. (2003). Improving Mine Recognition Through Processing and Dempster-Shafer Fusion of Ground-Penetrating Radar Data. Journal of Pattern Recognition,Vol. 36, No. 5, pp. 1233-1250.
Milisavljevi , N. & Bloch, I. (2003). Sensor Fusion in Anti-Personnel Mine Detection Using a Two-Level Belief Function Model. IEEE Transactions on Systems, Man and Cybernetics – Part C, Vol. 33, No. 2, pp. 269-283.
Milisavljevi , N. & Bloch, I. (2005). Improving Mine Recognition through Processing and Dempster-Shafer Fusion of Multisensor Data. In: Computer-Aided Intelligent Recognition, Techniques and Applications, M.
Sarfraz (Ed.), ch. 17, pp. 319-343, J. Wiley, New York, ISBN: 0-470-09414-1.
Neapolitan, R. E. (1992). A Survey of Uncertain and Approximate Inference. In Fuzzy Logic for the Management of Uncertainty, L. Zadeh and J. Kaprzyk (Eds.), pp. 55-82, J. Wiley, New York.
Shafer, G. (1976). A Mathematical Theory of Evidence. Princeton University Press.
SMART consortium (2004). SMART - final report.
Smets, P. (1990). The Combination of Evidence in the Transferable Belief Model. IEEE Transactions on Pattern Analysis and Machine Intelligence, Vol. 12, No. 5, pp. 447-458.
Smets, P. (1993). Belief Functions: The Disjunctive Rule of Combination and the Generalized Bayesian Theorem. International Journal of Approximate Reasoning, Vol. 9, pp. 1-35.
Smets, P. (1995). The Transferable Belief Model for Uncertainty Representation. Technical Report TR/IRIDIA/95-23, IRIDIA, Université Libre de Bruxelles, Brussels, Belgium.
Tupin, F.; Bloch, I. & Maître, H. (1999). A First Step Towards Automatic Interpretation of SAR Images using Evidential Fusion of Several Structure Detectors. IEEE Transactions on Geoscience and Remote Sensing, Vol. 37, No. 3, pp. 1327-1343.
van Cleynenbreugel, I.; Osinga, S.A.; Fierens, F.; Suetens, P. & Oosterlinck, A. (1991). Road Extraction from Multi-temporal Satellite Images by an Evidential Reasoning Approach. Pattern Recognition Letters, Vol. 12, pp. 371-380.
Yvinec, Y.; Borghys, D.; Acheroy, M.; Suess, H.; Keller, M.; Bajic, M.; Wolff, E.; Vanhuysse, S.; Bloch, I.; Yu, Y.& Damanet, O. (2003). SMART: Space and Airborne Mined Area Reduction Tools – Presentation. In Proc. of EUDEM2-SCOT-2003 International Conference on requirements and Technologies for the Detection, Removal and neutralization of Landmines and UXO - Vrije Universiteit Brussel, pp. 595-602, Brussels, Belgium.
Yvinec, Y. (2005). A Validated Method to Help Area Reduction in Mine Action with Remote Sensing Data. In Proc. of the 4th International Symposium on Image and Signal Processing and Analysis (ISPA 2005), Zagreb, Croatia.
Yu, Y.; Bloch, I. & Trouvé, A. (2003). A Unified Unsupervised Clustering Algorithm and its First Application to Landcover Classification. In Proc. of International Conference on Acoustics, Speech, and Signal Processing (ICASSP'03), vol. III, pp. 689-692, Hong-Kong, China.