Embed Size (px)
Citation preview
Multisensor Data Fusion for Human ActivityRecognition
Sarthak AhujaB.Tech Computer Science
Indraprastha Institute of Information TechnologyOkhla, Delhi 110020
Email: [email protected]
Anchita GoelB.Tech Computer Science
Indraprastha Institute of Information TechnologyOkhla, Delhi 110020
Email: [email protected]
Abstract—Human activity recognition is a well known area ofresearch in pervasive computing, which involves detecting activityof an individual by using various types of sensors. This finds greatutility in the context of human-centric problems in the real worldnot only for purposes of tracking ones daily activities but also inmonitoring activities of others - like the elderly, patrol officers,etc for purposes of health-care and security. With the growth ofinterest in AI, such a system can provide useful information tomake the agent much more intelligent and aware about the user,thus giving a more personalized experience. Several technologieshave been used to get estimates of a person’s activity like sensorsfound in smartphones(accelerometer, gyroscope, magnetometeretc.), egocentric cameras, other wearable sensors to measure vitalsigns like heart rate, respiration rate and skin temperature (apartfrom the same data provided by smartphones), worn on differentparts of the body like chest, wrist, ankles, environment sensors tomeasure humidity, audio level, temperature etc. The activities thatcan be recognised are daily activities like walking, lying down,sitting, standing, running, travelling. However, to the best of ourknowledge we have come across no work where a fusion of thesesensors and egocentric cameras has been put to use. In this paperwe explore the suggested fusion of sensors and share the resultsobtained. Our fusion approach shows significant improvementover using both the chosen sensors independently.
Keywords—accelerometer, gyrometer, sensor, smart watch, ego-centric, fusion, human activity.
I. MOTIVATION
As of today the state-of-the-art architecture for Humanactivity detection is found in two different domains. One iswearables where wearable sensors like accelerometers, gy-rometers mounted on smartphones and smartwatches are usedand the other where egocentric cameras are used. The useof egocentric cameras on human activity detection has justcome up recently and has been used to detect only a limitedset of activities. We here perform data fusion between thesetwo domains in an attempt to improve the performance of theexisting architectures.
II. LITERATURE SURVEY
We performed a comprehensive literature survey as a partof this project to identify the classifier popularly used andthe activities that they have successfully able to detect, whichhas been summarised and tabulated in table 2. We clearlyobserve that among popular approaches, RDF and Decisiontrees have proven to be successful in classifying accelerometer
and gyrometer data while SVMs have been the best choice foroptical flow related features.
III. DATA
A. Collected Data Set
1) Data Collection Procedure: We used the followingdevices for data collection:
1) OnePlus One Android Smartphone2) LG G Watch R (W110)3) GoPro Hero3+
We developed separate applications for the phone and thesmartwatch which take as input the name of the person, theactivity being recorded. The output is a file containing thedata for the three axes for both sensors on each device. Wecollected data from 25 different people. Each person was madeto perform seven activities: sitting, standing, walking, jumping,running, climbing up the stairs and going down the stairs. Eachactivity was performed for about a minute.
2) Data Set Pre-Processing: Each activity was recordedseparately. But before actually starting with any activity thereis some noise at the beginning and the end because of adjustingthe application input. Hence, we performed visual editing ofthe data after plotting each activity for each person on a graphand choosing the relevant time period.
3) Annotation: We talk about ELAN which we use toannotate and clean our videos. We add either the name of theactivity or ’DontCare’ to remove parts which contain movingobjects or pure darkness, low gradient.
4) Data Set Highlights:
1) For purposes of data collection we covered the entire23 acre campus of IIIT-Delhi.
2) Does not include moving objects.3) Equal distribution of gender, height, weight.4) Good distribution over illumination conditions.5) Wider variety of activities.6) Preference to indoor conditions due to high gradient.
B. Public Data Sets
We primarily used three databases:
1) Huji/Chetan + Allen: Egocentric Videos
Research Devices Used Activities recognised Database CommentsFoerster et al.,1999[1] External accelerometer sen-
sorsSitting, Standing, Walking,Climbing, Cycling
50 min recordings for 24 par-ticipants
Database not available online. Separatethe DC and the AC components of theaccelerometer signals.
Parkka et al., 2006[2] Accelerometer, TemperatureSensors, Compass, IR LightReflectance, Piezo Sensor,Microphone
Biking, Sitting, Standing,Running, Rowing
31 hours of annotated 35channel data from sixteen par-ticipants
Database not available online. Classi-fiers include Artificial Neural Network,Custom Decision Trees, AutomaticallyGenerated Decision Trees
Maurer et al., 2006[3] eWatch with Accelerometer,Light and Temperature Sen-sor, Microphone
Sitting, Standing, Walking,Climbing Up, Walking Down,Running
50 minutes data each from sixparticipants
Database not available. Classifiersinclude Decision Trees (C4.5algorithm),k-Nearest Neighbor (k-NN), Naive-Bayes and the Bayes Netclassifier
Tapia at al., 2007[4] 3-D accelerometers, wirelessHeart Rate monitor
Lying down, Sitting, Stand-ing, Cycling, Running, Walk-ing, Ascend stairs, Descendstairs, Lifting weights
21 participants performing 30different gymansium activities
Along with activity recognition, alsoidentified the intensity of the activity(in rpm). Classifiers include DecisionTrees (C4.5 algorithm) and Naive BayesClassifier
Poleg et al., 2014[5] Egocentric Camera Moving in car,bus, Sitting,Standing
29 videos - a few fromyoutube and rest self-recorded
Database available online. Used One-vs-One model for SVM classification.
TABLE I. LITERATURE SURVEY CARRIED OUT AS A PART OF THE PROJECT
2) UCI Dataset: Smart Phone3) MHEALTH Dataset: Smart Watch
IV. APPROACH
A. Classification Problem
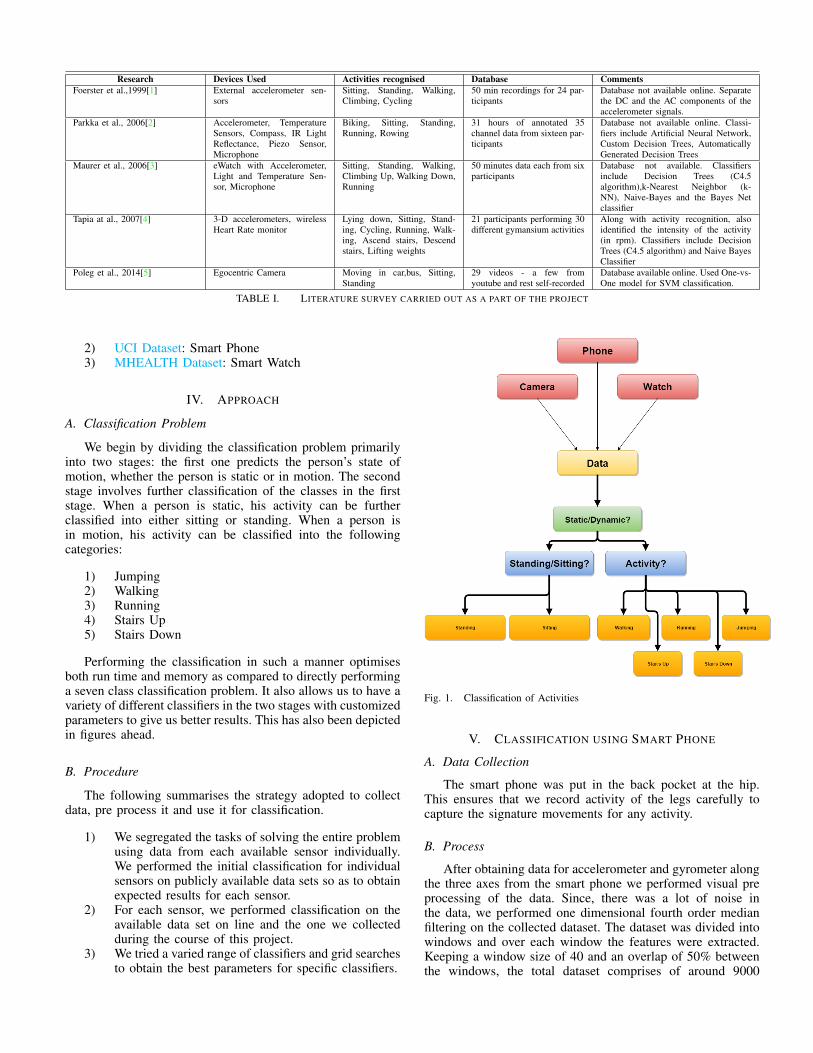
We begin by dividing the classification problem primarilyinto two stages: the first one predicts the person’s state ofmotion, whether the person is static or in motion. The secondstage involves further classification of the classes in the firststage. When a person is static, his activity can be furtherclassified into either sitting or standing. When a person isin motion, his activity can be classified into the followingcategories:
1) Jumping2) Walking3) Running4) Stairs Up5) Stairs Down
Performing the classification in such a manner optimisesboth run time and memory as compared to directly performinga seven class classification problem. It also allows us to have avariety of different classifiers in the two stages with customizedparameters to give us better results. This has also been depictedin figures ahead.
B. Procedure
The following summarises the strategy adopted to collectdata, pre process it and use it for classification.
1) We segregated the tasks of solving the entire problemusing data from each available sensor individually.We performed the initial classification for individualsensors on publicly available data sets so as to obtainexpected results for each sensor.
2) For each sensor, we performed classification on theavailable data set on line and the one we collectedduring the course of this project.
3) We tried a varied range of classifiers and grid searchesto obtain the best parameters for specific classifiers.
Fig. 1. Classification of Activities
V. CLASSIFICATION USING SMART PHONE
A. Data Collection
The smart phone was put in the back pocket at the hip.This ensures that we record activity of the legs carefully tocapture the signature movements for any activity.
B. Process
After obtaining data for accelerometer and gyrometer alongthe three axes from the smart phone we performed visual preprocessing of the data. Since, there was a lot of noise inthe data, we performed one dimensional fourth order medianfiltering on the collected dataset. The dataset was divided intowindows and over each window the features were extracted.Keeping a window size of 40 and an overlap of 50% betweenthe windows, the total dataset comprises of around 9000
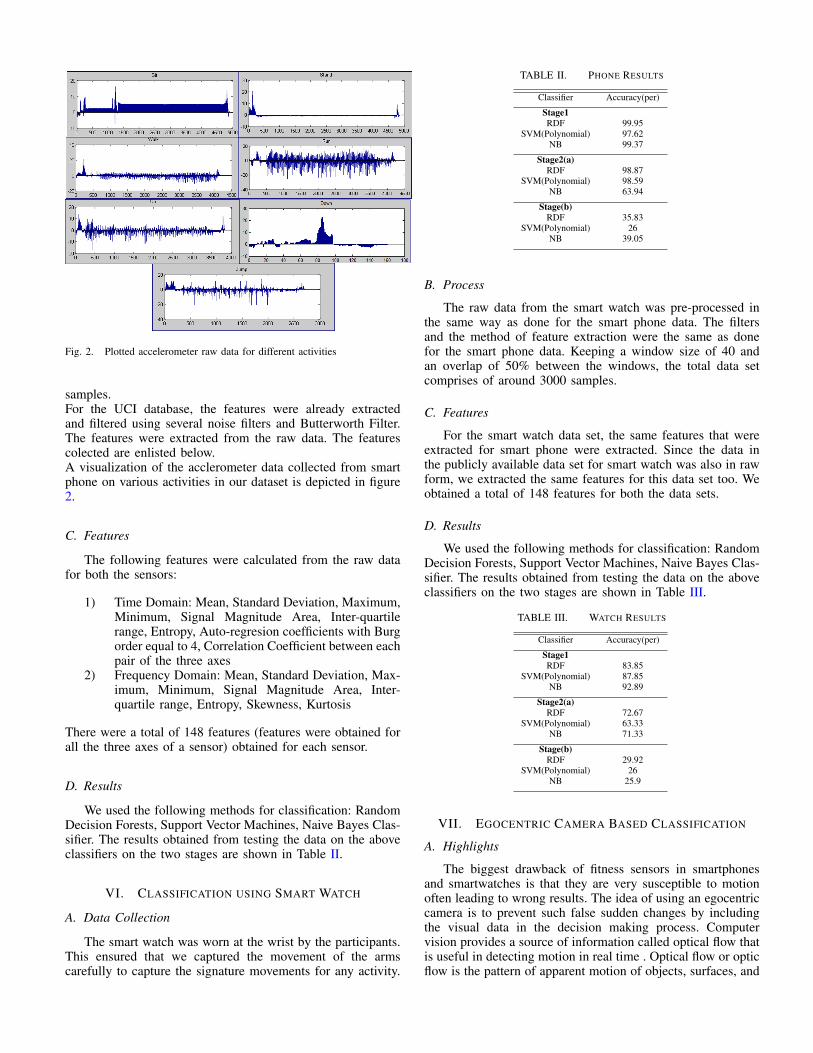
Fig. 2. Plotted accelerometer raw data for different activities
samples.For the UCI database, the features were already extractedand filtered using several noise filters and Butterworth Filter.The features were extracted from the raw data. The featurescolected are enlisted below.A visualization of the acclerometer data collected from smartphone on various activities in our dataset is depicted in figure2.
C. Features
The following features were calculated from the raw datafor both the sensors:
1) Time Domain: Mean, Standard Deviation, Maximum,Minimum, Signal Magnitude Area, Inter-quartilerange, Entropy, Auto-regresion coefficients with Burgorder equal to 4, Correlation Coefficient between eachpair of the three axes
2) Frequency Domain: Mean, Standard Deviation, Max-imum, Minimum, Signal Magnitude Area, Inter-quartile range, Entropy, Skewness, Kurtosis
There were a total of 148 features (features were obtained forall the three axes of a sensor) obtained for each sensor.
D. Results
We used the following methods for classification: RandomDecision Forests, Support Vector Machines, Naive Bayes Clas-sifier. The results obtained from testing the data on the aboveclassifiers on the two stages are shown in Table II.
VI. CLASSIFICATION USING SMART WATCH
A. Data Collection
The smart watch was worn at the wrist by the participants.This ensured that we captured the movement of the armscarefully to capture the signature movements for any activity.
TABLE II. PHONE RESULTS
Classifier Accuracy(per)
Stage1RDF 99.95
SVM(Polynomial) 97.62NB 99.37
Stage2(a)RDF 98.87
SVM(Polynomial) 98.59NB 63.94
Stage(b)RDF 35.83
SVM(Polynomial) 26NB 39.05
B. Process
The raw data from the smart watch was pre-processed inthe same way as done for the smart phone data. The filtersand the method of feature extraction were the same as donefor the smart phone data. Keeping a window size of 40 andan overlap of 50% between the windows, the total data setcomprises of around 3000 samples.
C. Features
For the smart watch data set, the same features that wereextracted for smart phone were extracted. Since the data inthe publicly available data set for smart watch was also in rawform, we extracted the same features for this data set too. Weobtained a total of 148 features for both the data sets.
D. Results
We used the following methods for classification: RandomDecision Forests, Support Vector Machines, Naive Bayes Clas-sifier. The results obtained from testing the data on the aboveclassifiers on the two stages are shown in Table III.
TABLE III. WATCH RESULTS
Classifier Accuracy(per)
Stage1RDF 83.85
SVM(Polynomial) 87.85NB 92.89
Stage2(a)RDF 72.67
SVM(Polynomial) 63.33NB 71.33
Stage(b)RDF 29.92
SVM(Polynomial) 26NB 25.9
VII. EGOCENTRIC CAMERA BASED CLASSIFICATION
A. Highlights
The biggest drawback of fitness sensors in smartphonesand smartwatches is that they are very susceptible to motionoften leading to wrong results. The idea of using an egocentriccamera is to prevent such false sudden changes by includingthe visual data in the decision making process. Computervision provides a source of information called optical flow thatis useful in detecting motion in real time . Optical flow or opticflow is the pattern of apparent motion of objects, surfaces, and
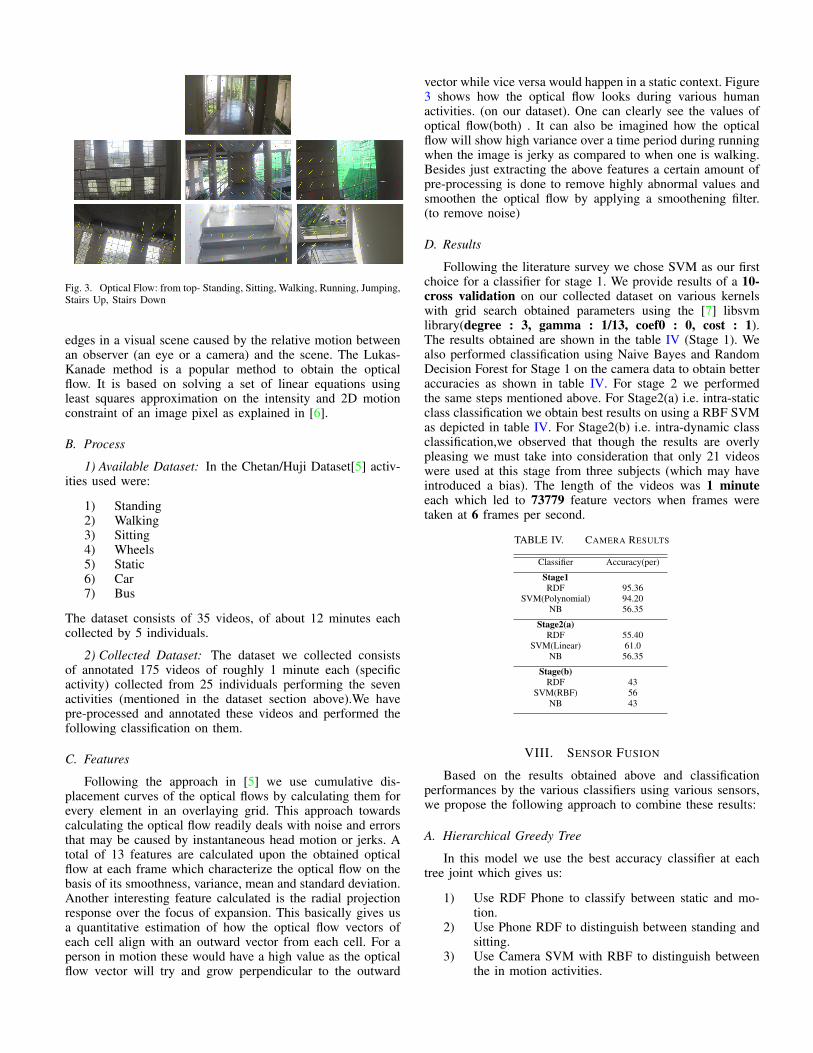
Fig. 3. Optical Flow: from top- Standing, Sitting, Walking, Running, Jumping,Stairs Up, Stairs Down
edges in a visual scene caused by the relative motion betweenan observer (an eye or a camera) and the scene. The Lukas-Kanade method is a popular method to obtain the opticalflow. It is based on solving a set of linear equations usingleast squares approximation on the intensity and 2D motionconstraint of an image pixel as explained in [6].
B. Process
1) Available Dataset: In the Chetan/Huji Dataset[5] activ-ities used were:
1) Standing2) Walking3) Sitting4) Wheels5) Static6) Car7) Bus
The dataset consists of 35 videos, of about 12 minutes eachcollected by 5 individuals.
2) Collected Dataset: The dataset we collected consistsof annotated 175 videos of roughly 1 minute each (specificactivity) collected from 25 individuals performing the sevenactivities (mentioned in the dataset section above).We havepre-processed and annotated these videos and performed thefollowing classification on them.
C. Features
Following the approach in [5] we use cumulative dis-placement curves of the optical flows by calculating them forevery element in an overlaying grid. This approach towardscalculating the optical flow readily deals with noise and errorsthat may be caused by instantaneous head motion or jerks. Atotal of 13 features are calculated upon the obtained opticalflow at each frame which characterize the optical flow on thebasis of its smoothness, variance, mean and standard deviation.Another interesting feature calculated is the radial projectionresponse over the focus of expansion. This basically gives usa quantitative estimation of how the optical flow vectors ofeach cell align with an outward vector from each cell. For aperson in motion these would have a high value as the opticalflow vector will try and grow perpendicular to the outward
vector while vice versa would happen in a static context. Figure3 shows how the optical flow looks during various humanactivities. (on our dataset). One can clearly see the values ofoptical flow(both) . It can also be imagined how the opticalflow will show high variance over a time period during runningwhen the image is jerky as compared to when one is walking.Besides just extracting the above features a certain amount ofpre-processing is done to remove highly abnormal values andsmoothen the optical flow by applying a smoothening filter.(to remove noise)
D. Results
Following the literature survey we chose SVM as our firstchoice for a classifier for stage 1. We provide results of a 10-cross validation on our collected dataset on various kernelswith grid search obtained parameters using the [7] libsvmlibrary(degree : 3, gamma : 1/13, coef0 : 0, cost : 1).The results obtained are shown in the table IV (Stage 1). Wealso performed classification using Naive Bayes and RandomDecision Forest for Stage 1 on the camera data to obtain betteraccuracies as shown in table IV. For stage 2 we performedthe same steps mentioned above. For Stage2(a) i.e. intra-staticclass classification we obtain best results on using a RBF SVMas depicted in table IV. For Stage2(b) i.e. intra-dynamic classclassification,we observed that though the results are overlypleasing we must take into consideration that only 21 videoswere used at this stage from three subjects (which may haveintroduced a bias). The length of the videos was 1 minuteeach which led to 73779 feature vectors when frames weretaken at 6 frames per second.
TABLE IV. CAMERA RESULTS
Classifier Accuracy(per)
Stage1RDF 95.36
SVM(Polynomial) 94.20NB 56.35
Stage2(a)RDF 55.40
SVM(Linear) 61.0NB 56.35
Stage(b)RDF 43
SVM(RBF) 56NB 43
VIII. SENSOR FUSION
Based on the results obtained above and classificationperformances by the various classifiers using various sensors,we propose the following approach to combine these results:
A. Hierarchical Greedy Tree
In this model we use the best accuracy classifier at eachtree joint which gives us:
1) Use RDF Phone to classify between static and mo-tion.
2) Use Phone RDF to distinguish between standing andsitting.
3) Use Camera SVM with RBF to distinguish betweenthe in motion activities.
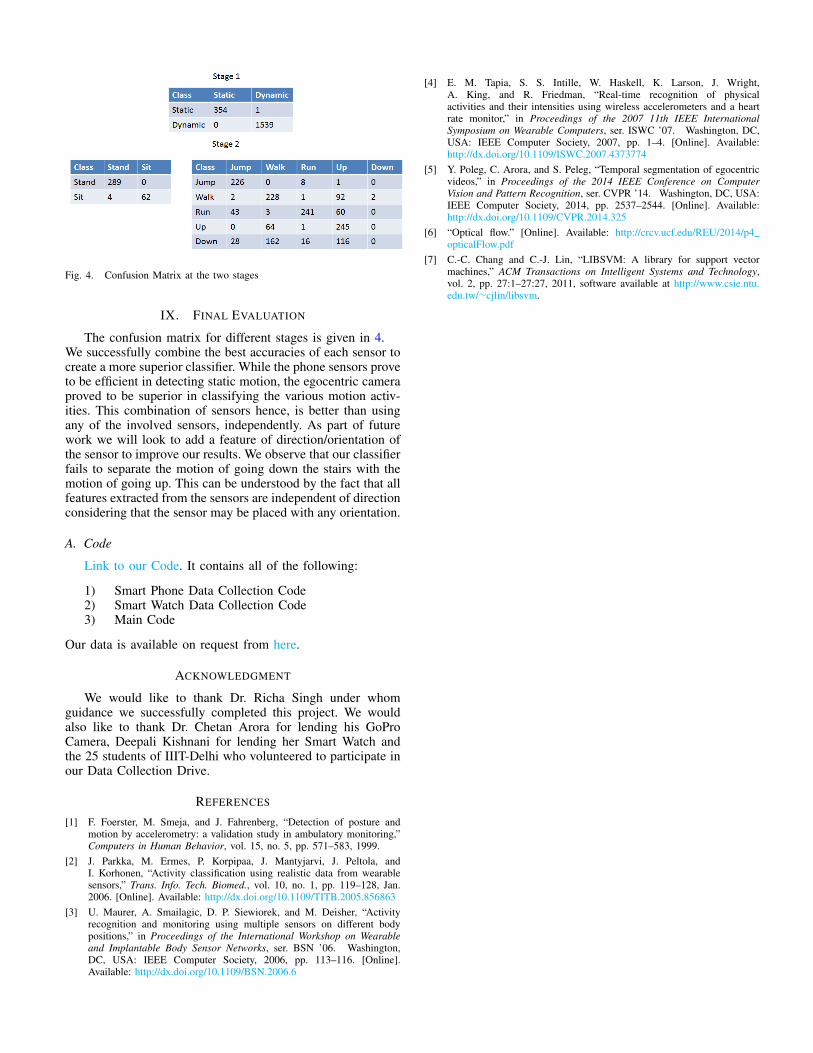
Fig. 4. Confusion Matrix at the two stages
IX. FINAL EVALUATION
The confusion matrix for different stages is given in 4.We successfully combine the best accuracies of each sensor tocreate a more superior classifier. While the phone sensors proveto be efficient in detecting static motion, the egocentric cameraproved to be superior in classifying the various motion activ-ities. This combination of sensors hence, is better than usingany of the involved sensors, independently. As part of futurework we will look to add a feature of direction/orientation ofthe sensor to improve our results. We observe that our classifierfails to separate the motion of going down the stairs with themotion of going up. This can be understood by the fact that allfeatures extracted from the sensors are independent of directionconsidering that the sensor may be placed with any orientation.
A. Code
Link to our Code. It contains all of the following:
1) Smart Phone Data Collection Code2) Smart Watch Data Collection Code3) Main Code
Our data is available on request from here.
ACKNOWLEDGMENT
We would like to thank Dr. Richa Singh under whomguidance we successfully completed this project. We wouldalso like to thank Dr. Chetan Arora for lending his GoProCamera, Deepali Kishnani for lending her Smart Watch andthe 25 students of IIIT-Delhi who volunteered to participate inour Data Collection Drive.
REFERENCES
[1] F. Foerster, M. Smeja, and J. Fahrenberg, “Detection of posture andmotion by accelerometry: a validation study in ambulatory monitoring,”Computers in Human Behavior, vol. 15, no. 5, pp. 571–583, 1999.
[2] J. Parkka, M. Ermes, P. Korpipaa, J. Mantyjarvi, J. Peltola, andI. Korhonen, “Activity classification using realistic data from wearablesensors,” Trans. Info. Tech. Biomed., vol. 10, no. 1, pp. 119–128, Jan.2006. [Online]. Available: http://dx.doi.org/10.1109/TITB.2005.856863
[3] U. Maurer, A. Smailagic, D. P. Siewiorek, and M. Deisher, “Activityrecognition and monitoring using multiple sensors on different bodypositions,” in Proceedings of the International Workshop on Wearableand Implantable Body Sensor Networks, ser. BSN ’06. Washington,DC, USA: IEEE Computer Society, 2006, pp. 113–116. [Online].Available: http://dx.doi.org/10.1109/BSN.2006.6
[4] E. M. Tapia, S. S. Intille, W. Haskell, K. Larson, J. Wright,A. King, and R. Friedman, “Real-time recognition of physicalactivities and their intensities using wireless accelerometers and a heartrate monitor,” in Proceedings of the 2007 11th IEEE InternationalSymposium on Wearable Computers, ser. ISWC ’07. Washington, DC,USA: IEEE Computer Society, 2007, pp. 1–4. [Online]. Available:http://dx.doi.org/10.1109/ISWC.2007.4373774
[5] Y. Poleg, C. Arora, and S. Peleg, “Temporal segmentation of egocentricvideos,” in Proceedings of the 2014 IEEE Conference on ComputerVision and Pattern Recognition, ser. CVPR ’14. Washington, DC, USA:IEEE Computer Society, 2014, pp. 2537–2544. [Online]. Available:http://dx.doi.org/10.1109/CVPR.2014.325
[6] “Optical flow.” [Online]. Available: http://crcv.ucf.edu/REU/2014/p4opticalFlow.pdf
[7] C.-C. Chang and C.-J. Lin, “LIBSVM: A library for support vectormachines,” ACM Transactions on Intelligent Systems and Technology,vol. 2, pp. 27:1–27:27, 2011, software available at http://www.csie.ntu.edu.tw/∼cjlin/libsvm.