Embed Size (px)
Citation preview
Multiscale population genetic analysis of muledeer (Odocoileus hemionus hemionus) in westernCanada sheds new light on the spread of chronicwasting disease
C.I. Cullingham, S.M. Nakada, E.H. Merrill, T.K. Bollinger, M.J. Pybus, andD.W. Coltman
Abstract: To successfully manage wildlife diseases, it is necessary to understand factors that influence spread. One ap-proach is to analyze host movement and social structure, as these behaviors can be associated with the probability of trans-mission. Some populations of mule deer (Odocoileus hemionus hemionus (Rafinesque, 1817)) in western Canada areinfected with chronic wasting disease (CWD), a transmissible and fatal neurodegenerative disease. We used populationanalysis of spatial genetic structure of mule deer at broad and local scales to understand factors that influence spread. Wegenotyped 2535 mule deer sampled from Alberta, Saskatchewan, and portions of British Columbia using 16 microsatelliteloci. We found weak genetic structure at broad spatial scales (overall FST = 0.008) that was well defined by geographicdistance, indicating the risk of CWD spread from the focus of infection will decline gradually with increasing distance,but there are no barriers to the spread over time. At the local scale of approximately 2 km, elevated relatedness amongCWD-infected individuals suggests transmission rates within social groups. Sex-biased spatial autocorrelation in genetic re-latedness also indicates that female philopatry underlies the social structure, and therefore transmission among relatives ispotentially driving local disease persistence.
Resume : Afin de gerer avec succes les maladies de la faune sauvage, il est necessaire de comprendre les facteurs qui in-fluencent leur dissemination. Une methode est d’analyser les deplacements et la structure sociale des hotes puisque cescomportements peuvent etre associes a la probabilite de transmission. Certaines populations de cerfs-mulets (Odocoileushemionus hemionus (Rafinesque, 1817)) de l’Ouest canadien sont infectees par la maladie du deperissement chronique(CWD), une maladie neurodegenerative transmissible et fatale. Une analyse de la structure spatiale genetique de la popula-tion de cerfs-mulets a des echelles etendues et locales nous a servi a comprendre les facteurs qui affectent la dissemina-tion. Nous avons determine le genotype de 2535 cerfs-mulets echantillonnes en Alberta, en Saskatchewan et dans desregions de Colombie-Britannique a l’analyse de 16 locus microsatellites. Il existe une faible structure genetique aux echel-les spatiales etendues (FST global = 0,008) qui est bien definie par la distance geographique, ce qui indique que le risquede transmission de la CWD a partir du foyer d’infection diminue graduellement en fonction de l’accroissement de la dis-tance, mais qu’il n’y a pas de barriere a la transmission dans le temps. A l’echelle locale d’environ 2 km, la parente accrueentre les individus infectes de la CWD laisse croire a une transmission a l’interieur des groupes sociaux. L’autocorrelationspatiale de la parente genetique avec biais sexuel indique aussi que la philopatrie des femelles sous-tend la structure spa-tiale et qu’ainsi la transmission entre individus apparentes explique potentiellement la persistance locale de la maladie.
[Traduit par la Redaction]
Introduction
Populations of mule deer (Odocoileus hemionus hemionus(Rafinesque, 1817)) and white-tailed deer (Odocoileus vir-ginianus (Zimmermann, 1780)) in portions of the Canadianprairies are affected by chronic wasting disease (CWD).Chronic wasting disease is a transmissible spongiform ence-phalopathy that disrupts neurological function and ultimately
leads to death (Williams and Young 1980; Williams 2005).This disease does not have a cure or preventative vaccineand can be transmitted from one animal to another poten-tially through saliva, urine, or blood from diseased individu-als (Miller and Williams 2003; Mathiason et al. 2006; Haleyet al. 2009; Tamguney et al. 2009). Additional sources of in-fection may include environmental sources (Mathiason et al.2009) caused by contamination from faeces (Tamguney et
Received 18 May 2010. Accepted 29 November 2010. Published on the NRC Research Press Web site at cjz.nrc.ca on 28 January 2011.
C.I. Cullingham,1,2 S.M. Nakada, E.H. Merrill, and D.W. Coltman. Department of Biological Sciences, University of Alberta,Edmonton, AB T6G 2E9, Canada.T.K. Bollinger. Department of Veterinary Pathology, Western College of Veterinary Medicine, Saskatoon, SK S7N 5B4, Canada.M.J. Pybus. Fish and Wildlife Division, Alberta Sustainable Resource Development, Edmonton, AB T6H 4P2, Canada.
1Corresponding author (e-mail: [email protected]).2Both authors contributed equally to the article.
134
Can. J. Zool. 89: 134–147 (2011) doi:10.1139/Z10-104 Published by NRC Research Press
2
Can
. J. Z
ool.
Dow
nloa
ded
from
ww
w.n
rcre
sear
chpr
ess.
com
by
Dep
osito
ry S
ervi
ces
Prog
ram
on
10/2
2/13
For
pers
onal
use
onl
y.
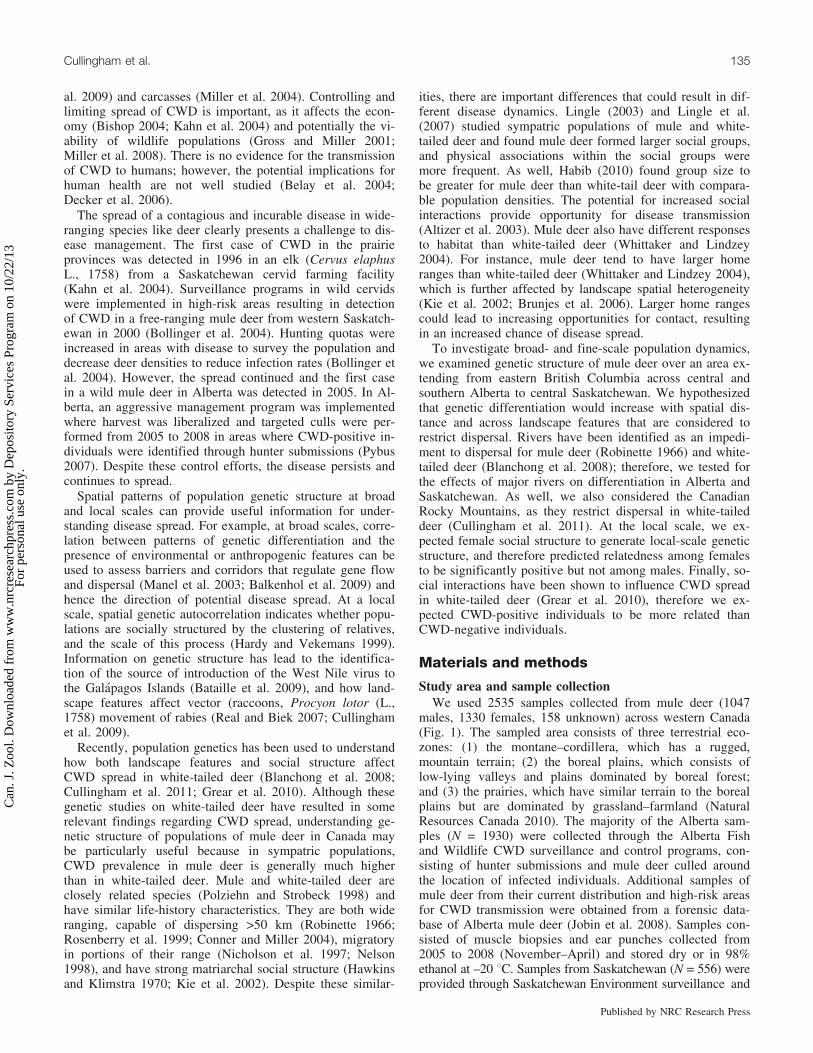
al. 2009) and carcasses (Miller et al. 2004). Controlling andlimiting spread of CWD is important, as it affects the econ-omy (Bishop 2004; Kahn et al. 2004) and potentially the vi-ability of wildlife populations (Gross and Miller 2001;Miller et al. 2008). There is no evidence for the transmissionof CWD to humans; however, the potential implications forhuman health are not well studied (Belay et al. 2004;Decker et al. 2006).
The spread of a contagious and incurable disease in wide-ranging species like deer clearly presents a challenge to dis-ease management. The first case of CWD in the prairieprovinces was detected in 1996 in an elk (Cervus elaphusL., 1758) from a Saskatchewan cervid farming facility(Kahn et al. 2004). Surveillance programs in wild cervidswere implemented in high-risk areas resulting in detectionof CWD in a free-ranging mule deer from western Saskatch-ewan in 2000 (Bollinger et al. 2004). Hunting quotas wereincreased in areas with disease to survey the population anddecrease deer densities to reduce infection rates (Bollinger etal. 2004). However, the spread continued and the first casein a wild mule deer in Alberta was detected in 2005. In Al-berta, an aggressive management program was implementedwhere harvest was liberalized and targeted culls were per-formed from 2005 to 2008 in areas where CWD-positive in-dividuals were identified through hunter submissions (Pybus2007). Despite these control efforts, the disease persists andcontinues to spread.
Spatial patterns of population genetic structure at broadand local scales can provide useful information for under-standing disease spread. For example, at broad scales, corre-lation between patterns of genetic differentiation and thepresence of environmental or anthropogenic features can beused to assess barriers and corridors that regulate gene flowand dispersal (Manel et al. 2003; Balkenhol et al. 2009) andhence the direction of potential disease spread. At a localscale, spatial genetic autocorrelation indicates whether popu-lations are socially structured by the clustering of relatives,and the scale of this process (Hardy and Vekemans 1999).Information on genetic structure has lead to the identifica-tion of the source of introduction of the West Nile virus tothe Galapagos Islands (Bataille et al. 2009), and how land-scape features affect vector (raccoons, Procyon lotor (L.,1758) movement of rabies (Real and Biek 2007; Cullinghamet al. 2009).
Recently, population genetics has been used to understandhow both landscape features and social structure affectCWD spread in white-tailed deer (Blanchong et al. 2008;Cullingham et al. 2011; Grear et al. 2010). Although thesegenetic studies on white-tailed deer have resulted in somerelevant findings regarding CWD spread, understanding ge-netic structure of populations of mule deer in Canada maybe particularly useful because in sympatric populations,CWD prevalence in mule deer is generally much higherthan in white-tailed deer. Mule and white-tailed deer areclosely related species (Polziehn and Strobeck 1998) andhave similar life-history characteristics. They are both wideranging, capable of dispersing >50 km (Robinette 1966;Rosenberry et al. 1999; Conner and Miller 2004), migratoryin portions of their range (Nicholson et al. 1997; Nelson1998), and have strong matriarchal social structure (Hawkinsand Klimstra 1970; Kie et al. 2002). Despite these similar-
ities, there are important differences that could result in dif-ferent disease dynamics. Lingle (2003) and Lingle et al.(2007) studied sympatric populations of mule and white-tailed deer and found mule deer formed larger social groups,and physical associations within the social groups weremore frequent. As well, Habib (2010) found group size tobe greater for mule deer than white-tail deer with compara-ble population densities. The potential for increased socialinteractions provide opportunity for disease transmission(Altizer et al. 2003). Mule deer also have different responsesto habitat than white-tailed deer (Whittaker and Lindzey2004). For instance, mule deer tend to have larger homeranges than white-tailed deer (Whittaker and Lindzey 2004),which is further affected by landscape spatial heterogeneity(Kie et al. 2002; Brunjes et al. 2006). Larger home rangescould lead to increasing opportunities for contact, resultingin an increased chance of disease spread.
To investigate broad- and fine-scale population dynamics,we examined genetic structure of mule deer over an area ex-tending from eastern British Columbia across central andsouthern Alberta to central Saskatchewan. We hypothesizedthat genetic differentiation would increase with spatial dis-tance and across landscape features that are considered torestrict dispersal. Rivers have been identified as an impedi-ment to dispersal for mule deer (Robinette 1966) and white-tailed deer (Blanchong et al. 2008); therefore, we tested forthe effects of major rivers on differentiation in Alberta andSaskatchewan. As well, we also considered the CanadianRocky Mountains, as they restrict dispersal in white-taileddeer (Cullingham et al. 2011). At the local scale, we ex-pected female social structure to generate local-scale geneticstructure, and therefore predicted relatedness among femalesto be significantly positive but not among males. Finally, so-cial interactions have been shown to influence CWD spreadin white-tailed deer (Grear et al. 2010), therefore we ex-pected CWD-positive individuals to be more related thanCWD-negative individuals.
Materials and methods
Study area and sample collectionWe used 2535 samples collected from mule deer (1047
males, 1330 females, 158 unknown) across western Canada(Fig. 1). The sampled area consists of three terrestrial eco-zones: (1) the montane–cordillera, which has a rugged,mountain terrain; (2) the boreal plains, which consists oflow-lying valleys and plains dominated by boreal forest;and (3) the prairies, which have similar terrain to the borealplains but are dominated by grassland–farmland (NaturalResources Canada 2010). The majority of the Alberta sam-ples (N = 1930) were collected through the Alberta Fishand Wildlife CWD surveillance and control programs, con-sisting of hunter submissions and mule deer culled aroundthe location of infected individuals. Additional samples ofmule deer from their current distribution and high-risk areasfor CWD transmission were obtained from a forensic data-base of Alberta mule deer (Jobin et al. 2008). Samples con-sisted of muscle biopsies and ear punches collected from2005 to 2008 (November–April) and stored dry or in 98%ethanol at –20 8C. Samples from Saskatchewan (N = 556) wereprovided through Saskatchewan Environment surveillance and
Cullingham et al. 135
Published by NRC Research Press
Can
. J. Z
ool.
Dow
nloa
ded
from
ww
w.n
rcre
sear
chpr
ess.
com
by
Dep
osito
ry S
ervi
ces
Prog
ram
on
10/2
2/13
For
pers
onal
use
onl
y.
disease programs consisting of hunter submissions. Addi-tional samples from Saskatchewan consisted of ear punchescollected from anesthetized deer by researchers from theUniversity of Saskatchewan and the Canadian CooperativeWildlife Health Centre from 2003 to 2007 (November–April). Samples from British Columbia (N = 49) were ac-quired through road kills or hunter submissions as part oftheir CWD surveillance program and provided as DNAfrom 2002 or ear punches collected in 2006 and 2007. Allsamples were marked with a unique identifier given by thecollecting agency with geo-referenced data including UTMcoordinates, township coordinates, or wildlife managementunits, zones, or areas (WMU Alberta; WMZ Saskatchewan;WMA British Columbia). The majority of the samples hadUTM coordinates with an accuracy of 500 m – 1 km (N =2185), while the remainder (N = 287) had a maximum ac-curacy of 10 km. Additional information included sex, age,CWD status, and collection date.
Samples from Alberta were tested for CWD using theBio-Rad TeSeE1 test kit (Bio-Rad, Hercules, California,USA). This method is nationally approved in Canada anduses monoclonal antibodies to detect CWD-specific prionproteins. In Saskatchewan, CWD status was determined us-ing standard immunohistochemistry with anti-TSE mono-clonal F99/97.6.1 (VMRD Inc., Pullman, Washington,USA) on an automated immunostainer (Ventana MedicalSystem, Tucson, Arizona, USA).
DNA extraction and microsatellite genotypingDNA extractions were performed using the Qiagen 96
DNeasy1 blood and tissue kit following the manufacturer’sinstructions (Qiagen, Mississauga, Ontario, Canada). Sixteenmicrosatellite loci were amplified in three multiplex reac-tions using a QIAGEN1 multiplex PCR kit. The forwardprimer of each pair was fluorescently labeled. Details on pri-mer sequences, multiplex panels, fluorescent labels, andPCR chemistry are provided in Table 1. The 5’ end of thereverse primers for markers P and Cervid1 were modifiedaccording to Brownstein et al. (1996). This allowed for com-plete adenylation of the 3’ forward strand to enhance accu-rate genotyping and to avoid overlapping allele ranges. Allamplifications were performed on Mastercycler ep gradientthermocyclers (Eppendorf, Mississauga, Ontario, Canada)with the following cycles: 15 min at 95 8C; 33 cycles of94 8C for 30 s, 60 8C for 90 s, and 72 8C for 90 s; and finalextension at 72 8C for 30 min. PCR product was diluted to1:40 and 3 mL of this was run on an ABI 3730 (Applied Bi-osystems, Foster City, California, USA) using GeneScanTM
500 LIZTM as the size standard (ABI). Fragment analysiswas performed manually using GeneMapper1 version 4.0(Applied Biosystems, Foster City, California, USA).
Genetic diversity measuresFour measures of global genetic diversity were calculated
for each locus. Observed (HO) and expected (HE) hetero-zygosity (Nei 1978) were calculated using GenAlEx version6 (Peakall and Smouse 2006), and mean number of allelesper locus (k) and Weir and Cockerham’s FIS (Weir andCockerham 1984) per locus and overall were calculated us-ing FSTAT version 2.9.3 (Goudet 2001). All individuals
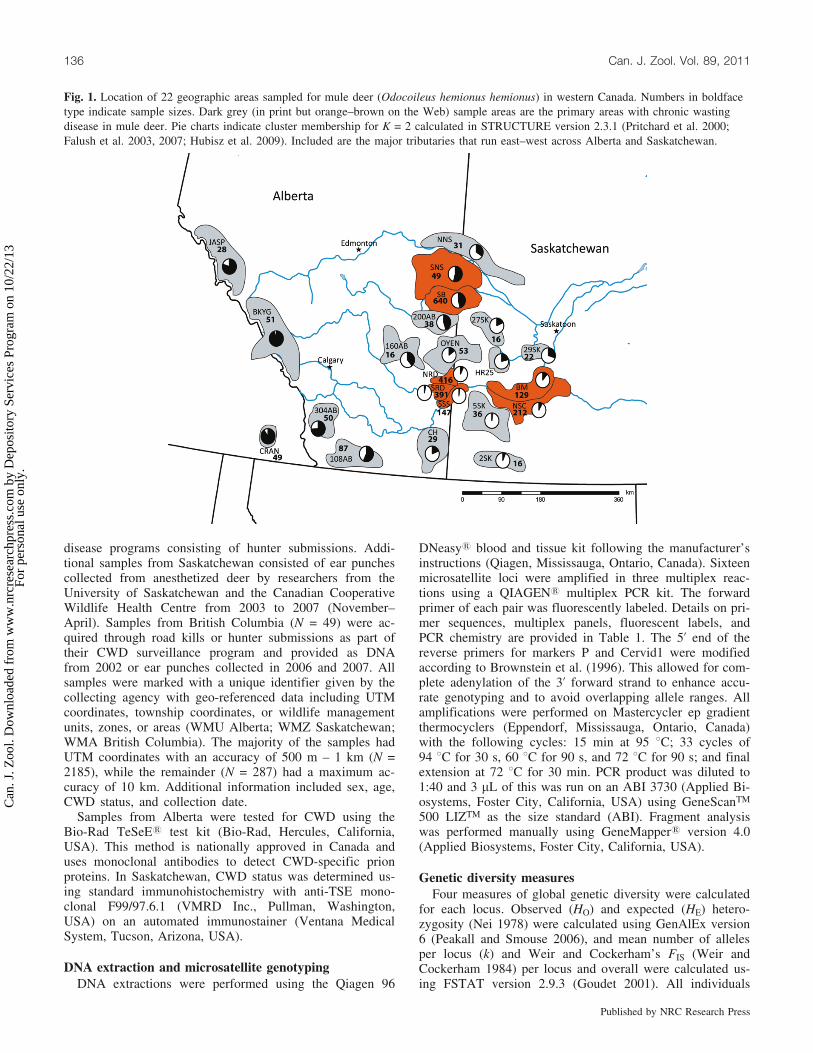
Fig. 1. Location of 22 geographic areas sampled for mule deer (Odocoileus hemionus hemionus) in western Canada. Numbers in boldfacetype indicate sample sizes. Dark grey (in print but orange–brown on the Web) sample areas are the primary areas with chronic wastingdisease in mule deer. Pie charts indicate cluster membership for K = 2 calculated in STRUCTURE version 2.3.1 (Pritchard et al. 2000;Falush et al. 2003, 2007; Hubisz et al. 2009). Included are the major tributaries that run east–west across Alberta and Saskatchewan.
136 Can. J. Zool. Vol. 89, 2011
Published by NRC Research Press
Can
. J. Z
ool.
Dow
nloa
ded
from
ww
w.n
rcre
sear
chpr
ess.
com
by
Dep
osito
ry S
ervi
ces
Prog
ram
on
10/2
2/13
For
pers
onal
use
onl
y.
were pooled to determine Hardy–Weinberg equilibrium(HWE) and linkage disequilibrium (LD) between all pairsof loci using GENEPOP version 3.4 (Raymond and Rousset1995a). The Bonferroni correction (Bonferroni 1936) wasapplied to tests of statistical significance for HWE and LD.
Broad-scale population structureBroad-scale population structure was analyzed using both
a priori groups and an individual based analysis. For the apriori analysis, individuals were assigned to 22 sample areasbased on spatial clustering and major rivers (Fig. 1). Exacttests of allelic differentiation were calculated among sampleareas using GENEPOP version 3.4 (Raymond and Rousset1995a). The effect of distance on genetic differentiationwas estimated by the correlation between matrices of pair-wise genetic distance, calculated as FST/(1 – FST), and thepairwise Euclidean distance (Rousset 1997) using a Manteltest (Mantel 1967). A partial Mantel test was used to testfor the effect of rivers on genetic distance while correctingfor geographic distance. The river matrix was generatedmanually and consisted of zeros between populations notseparated by a river and ones if they were separated by ariver. Genetic and geographic matrices were calculated us-ing SPAGEDi 1.2 (Hardy and Vekemans 2002) and Manteltests were conducted in zt (Bonnet and Van de Peer 2002).
Individual analysis was conducted on 2535 individualsfrom the 22 sample areas using a Bayesian clustering analy-sis implemented in the program STRUCTURE version 2.3.1(Pritchard et al. 2000; Falush et al. 2003, 2007; Hubisz et al.2009). This analysis determines the number of populations(K) by assigning individual genotypes into clusters that min-imize HWE and LD. Given the dispersal capability of deer,we used the sample area as a prior, as it has been shown toimprove assignment when genetic differentiation is low (Ex-coffier and Heckel 2006; Hubisz et al. 2009). Five independ-ent runs from K = 1–10 were used in the admixture modelwith correlated allele frequencies with a burn-in of 500 000replicates and 1 000 000 Markov chain Monte Carlo steps.To infer the most likely K, we used the method outlined byEvanno et al. (2005) that looks at the relative rate of changein the mean posterior probabilities across the inferred K val-ues. For the most likely K, we summarized the assignmentof individuals across multiple runs using CLUMPP version1.1.1 (Jakobsson and Rosenberg 2007). Individuals were as-signed to a cluster if their probability was greater than 0.7.
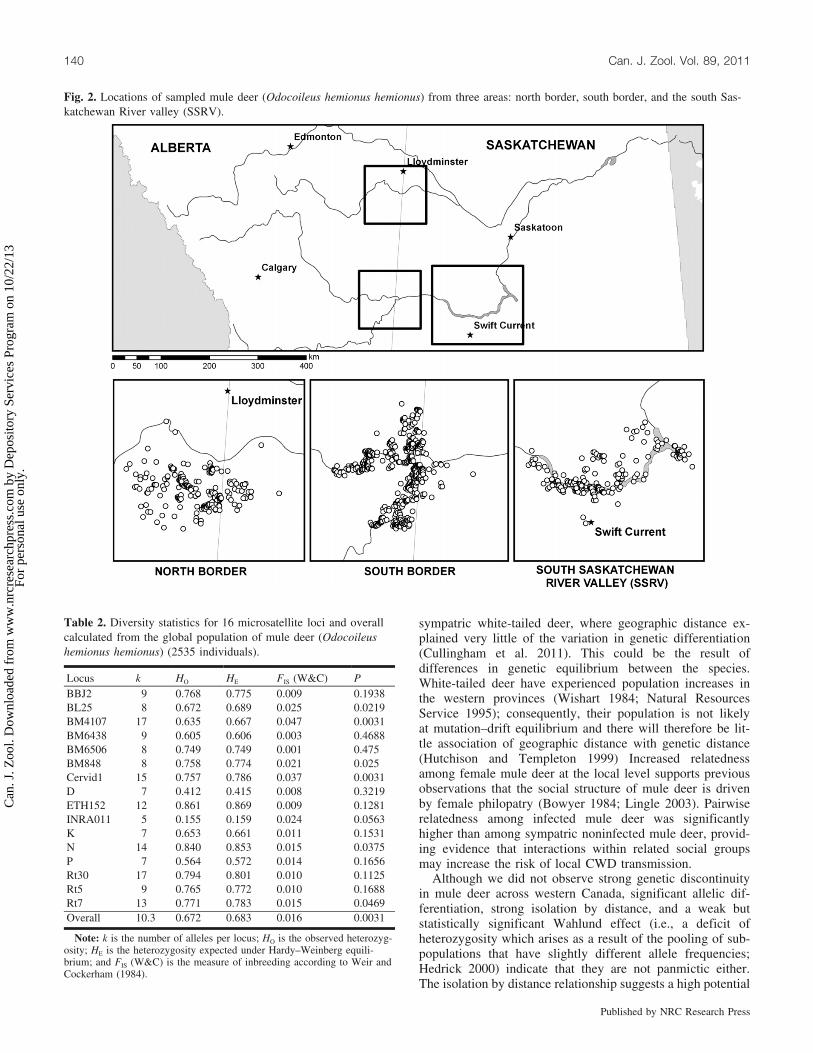
Local population structureWe examined local population structure in three exten-
sively and contiguously sampled regions: north border (n =553), south border (n = 944), and the south SaskatchewanRiver valley (SSRV; n = 339) (Fig. 2). Fawns were includedin the analysis, which was also restricted to individuals withUTM coordinates with an accuracy within 500 m. We esti-mated spatial autocorrelation of genetic relatedness for eachregion and sex using Moran’s I statistic (Moran 1950). Weused 2 km distance classes from 0 km (individuals sampledat the same geographic coordinates) to 22 km. Our choice of2 km was based on sample density and distribution. MeanMoran’s I and standard error (SE) in each distance class
were estimated by jackknife resampling over loci. Signifi-cance was evaluated using the progressive Bonferroni ap-proach (Hewitt et al. 1997). We used the lower limit of thedistance class at which Moran’s I first reached zero (Clarkand Richardson 2002) to indicate the spatial scale at whichanimals were no longer related. To compare spatial geneticstructure among regions, we quantified genetic relatednessbased on a Sp statistic calculated as –b/(1 – F(1)) (Vekemansand Hardy 2004), which is the slope of the correlogram (b)standardized by the relatedness at the first distance class(F(1)). We calculated the error for this statistic using thestandard deviation of the slope. This measure is recom-mended because it is not affected by sample distribution(Vekemans and Hardy 2004). Mean pairwise relatedness, R(Queller and Goodnight 1989), was also calculated forsame-sex pairs of deer sampled from the same location(500 m resolution) within regions. All analyses were conductedusing SPAGEDi version 1.2 (Hardy and Vekemans 2002).
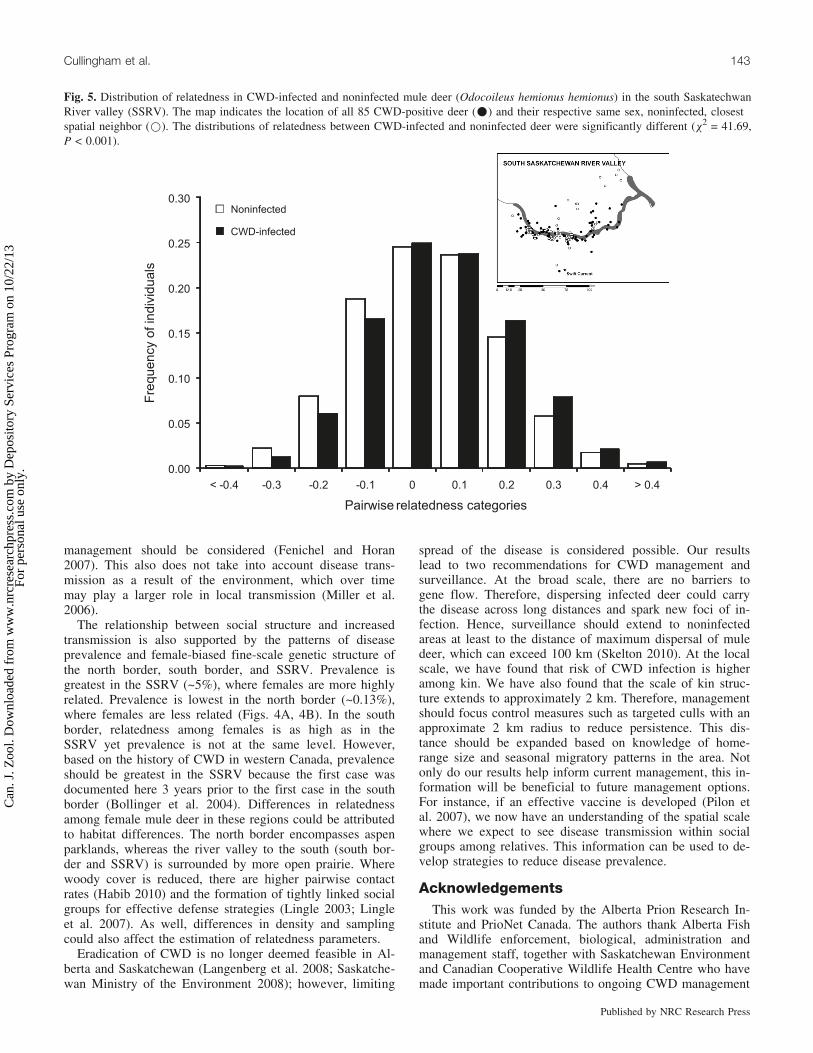
Samples of 85 CWD-positive deer from the SSRV (39 fe-males and 46 males) were matched to their closest nonin-fected, same-sex neighbor. This was the only region inwhich the sample size was sufficient to perform this analy-sis, and sample size necessitated analysis of the sexes com-bined. We calculated pairwise relatedness matricesseparately for infected and noninfected neighbors using theestimator R (Queller and Goodnight 1989) in SPAGEDi ver-sion 1.2. This estimator requires allele frequency informa-tion, therefore we used all mule deer sampled within theSSRV (N = 339) as the reference population. To comparethe distributions of the pairwise R estimates between in-fected and noninfected deer, we used a contingency testwhere values were grouped by 0.1 intervals from lessthan –0.4 to greater than 0.4. Because the distribution ofpairwise relatedness are not independent points, we alsoused the nonparametric method employed in Cullingham etal. (2011), where two random samples are generated withoutreplacement from all pairwise relatedness values and the dif-ference in the means is calculated. Permutation of10 000 samples generates a distribution to assess the signifi-cance (95%) of the actual difference in means.
Results
Genetic diversity measuresThe mean number of alleles per locus (Table 2) was 10.3,
ranging from 5 (INRA011) to 17 (BM4107 and Rt30). Meanmeasures of HO and HE per locus were 0.672 (SE = 0.179)and 0.683 (SE = 0.181), respectively. FIS had a narrow rangefrom 0.001 to 0.047 (mean = 0.016, SE = 0.012). Deviationfrom HWE (FIS > 0) was nominally significant (a = 0.05) atsix loci and overall, but only two loci and global FIS remainedsignificant after Bonferroni correction (a = 0.0031). No pairsof loci were in significant linkage disequilibrium after correc-tion for multiple comparisons (a = 0.0022).
Broad-scale population structureGlobal FST was significant but weak (0.008, P < 0.0001).
Exact tests of allelic differentiation among the 22 sampleareas (supplementary Table S1)3 also supported genetic
3 Supplementary Table S1 is available with the article through the journal Web site (http://cjz.nrc.ca).
Cullingham et al. 137
Published by NRC Research Press
Can
. J. Z
ool.
Dow
nloa
ded
from
ww
w.n
rcre
sear
chpr
ess.
com
by
Dep
osito
ry S
ervi
ces
Prog
ram
on
10/2
2/13
For
pers
onal
use
onl
y.
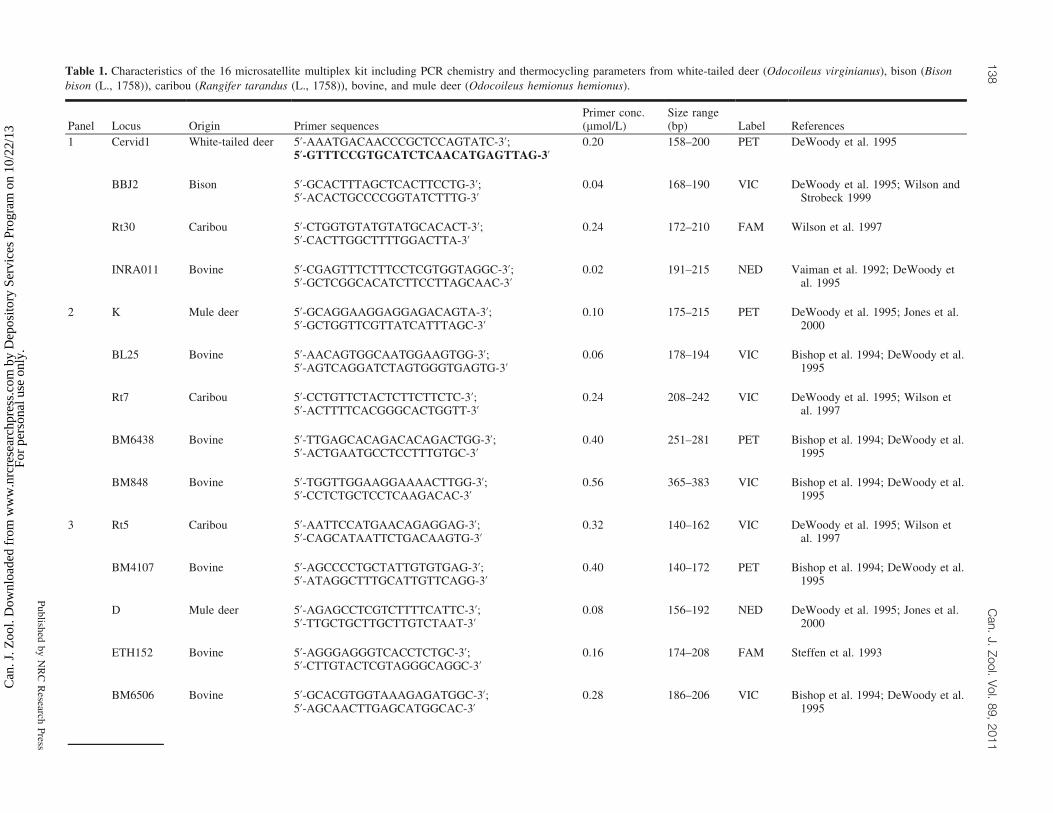
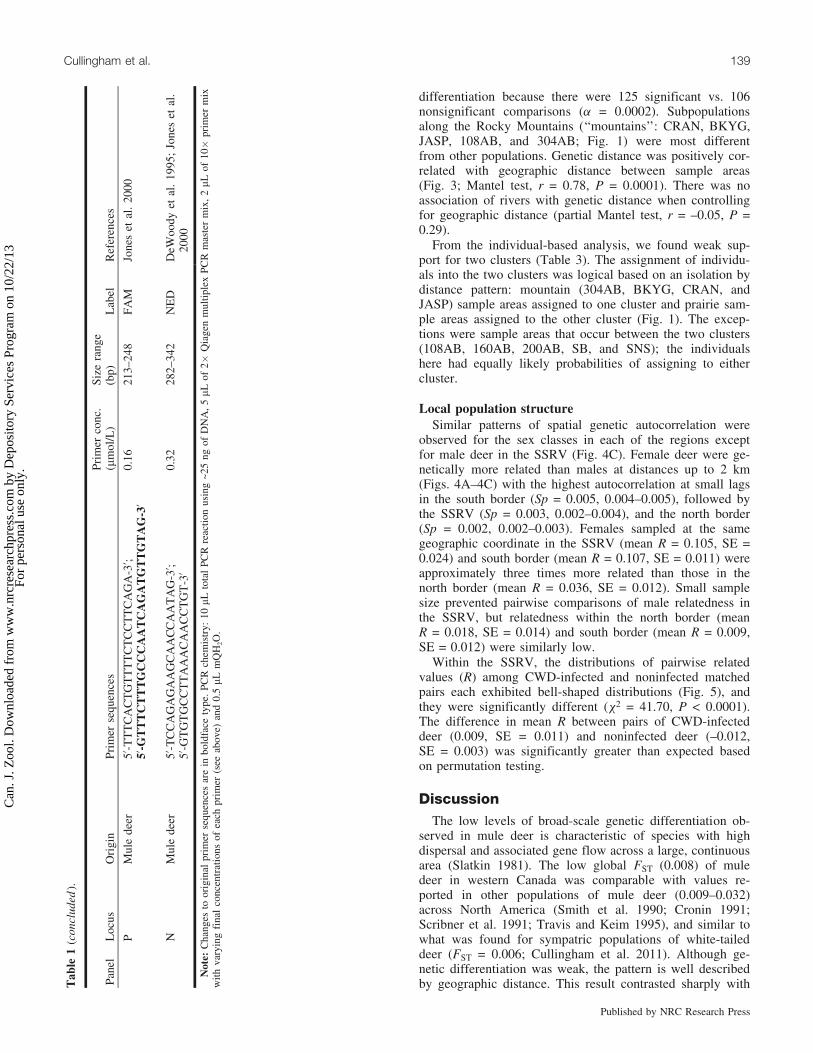
Table 1. Characteristics of the 16 microsatellite multiplex kit including PCR chemistry and thermocycling parameters from white-tailed deer (Odocoileus virginianus), bison (Bisonbison (L., 1758)), caribou (Rangifer tarandus (L., 1758)), bovine, and mule deer (Odocoileus hemionus hemionus).
Panel Locus Origin Primer sequencesPrimer conc.(mmol/L)
Size range(bp) Label References
1 Cervid1 White-tailed deer 5’-AAATGACAACCCGCTCCAGTATC-3’;5’-GTTTCCGTGCATCTCAACATGAGTTAG-3’
0.20 158–200 PET DeWoody et al. 1995
BBJ2 Bison 5’-GCACTTTAGCTCACTTCCTG-3’;5’-ACACTGCCCCGGTATCTTTG-3’
0.04 168–190 VIC DeWoody et al. 1995; Wilson andStrobeck 1999
Rt30 Caribou 5’-CTGGTGTATGTATGCACACT-3’;5’-CACTTGGCTTTTGGACTTA-3’
0.24 172–210 FAM Wilson et al. 1997
INRA011 Bovine 5’-CGAGTTTCTTTCCTCGTGGTAGGC-3’;5’-GCTCGGCACATCTTCCTTAGCAAC-3’
0.02 191–215 NED Vaiman et al. 1992; DeWoody etal. 1995
2 K Mule deer 5’-GCAGGAAGGAGGAGACAGTA-3’;5’-GCTGGTTCGTTATCATTTAGC-3’
0.10 175–215 PET DeWoody et al. 1995; Jones et al.2000
BL25 Bovine 5’-AACAGTGGCAATGGAAGTGG-3’;5’-AGTCAGGATCTAGTGGGTGAGTG-3’
0.06 178–194 VIC Bishop et al. 1994; DeWoody et al.1995
Rt7 Caribou 5’-CCTGTTCTACTCTTCTTCTC-3’;5’-ACTTTTCACGGGCACTGGTT-3’
0.24 208–242 VIC DeWoody et al. 1995; Wilson etal. 1997
BM6438 Bovine 5’-TTGAGCACAGACACAGACTGG-3’;5’-ACTGAATGCCTCCTTTGTGC-3’
0.40 251–281 PET Bishop et al. 1994; DeWoody et al.1995
BM848 Bovine 5’-TGGTTGGAAGGAAAACTTGG-3’;5’-CCTCTGCTCCTCAAGACAC-3’
0.56 365–383 VIC Bishop et al. 1994; DeWoody et al.1995
3 Rt5 Caribou 5’-AATTCCATGAACAGAGGAG-3’;5’-CAGCATAATTCTGACAAGTG-3’
0.32 140–162 VIC DeWoody et al. 1995; Wilson etal. 1997
BM4107 Bovine 5’-AGCCCCTGCTATTGTGTGAG-3’;5’-ATAGGCTTTGCATTGTTCAGG-3’
0.40 140–172 PET Bishop et al. 1994; DeWoody et al.1995
D Mule deer 5’-AGAGCCTCGTCTTTTCATTC-3’;5’-TTGCTGCTTGCTTGTCTAAT-3’
0.08 156–192 NED DeWoody et al. 1995; Jones et al.2000
ETH152 Bovine 5’-AGGGAGGGTCACCTCTGC-3’;5’-CTTGTACTCGTAGGGCAGGC-3’
0.16 174–208 FAM Steffen et al. 1993
BM6506 Bovine 5’-GCACGTGGTAAAGAGATGGC-3’;5’-AGCAACTTGAGCATGGCAC-3’
0.28 186–206 VIC Bishop et al. 1994; DeWoody et al.1995
138C
an.J.
Zool.V
ol.89,
2011
Publishedby
NR
CR
esearchPress
Can
. J. Z
ool.
Dow
nloa
ded
from
ww
w.n
rcre
sear
chpr
ess.
com
by
Dep
osito
ry S
ervi
ces
Prog
ram
on
10/2
2/13
For
pers
onal
use
onl
y.
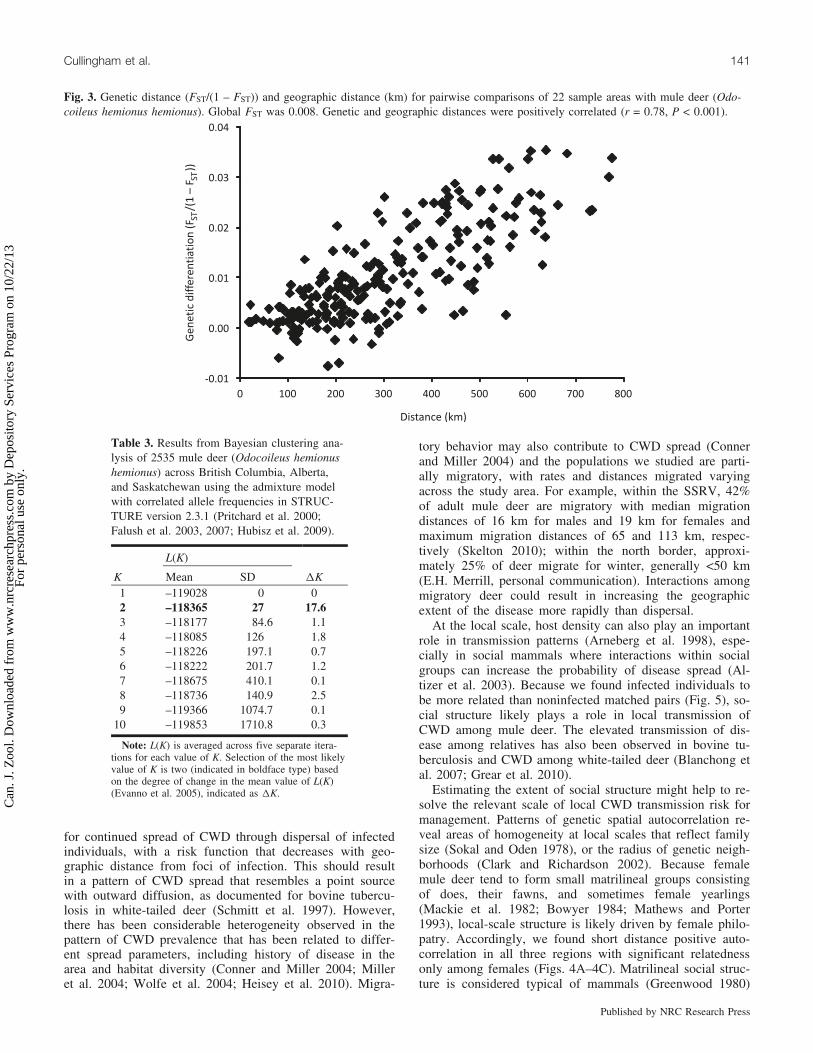
differentiation because there were 125 significant vs. 106nonsignificant comparisons (a = 0.0002). Subpopulationsalong the Rocky Mountains (‘‘mountains’’: CRAN, BKYG,JASP, 108AB, and 304AB; Fig. 1) were most differentfrom other populations. Genetic distance was positively cor-related with geographic distance between sample areas(Fig. 3; Mantel test, r = 0.78, P = 0.0001). There was noassociation of rivers with genetic distance when controllingfor geographic distance (partial Mantel test, r = –0.05, P =0.29).
From the individual-based analysis, we found weak sup-port for two clusters (Table 3). The assignment of individu-als into the two clusters was logical based on an isolation bydistance pattern: mountain (304AB, BKYG, CRAN, andJASP) sample areas assigned to one cluster and prairie sam-ple areas assigned to the other cluster (Fig. 1). The excep-tions were sample areas that occur between the two clusters(108AB, 160AB, 200AB, SB, and SNS); the individualshere had equally likely probabilities of assigning to eithercluster.
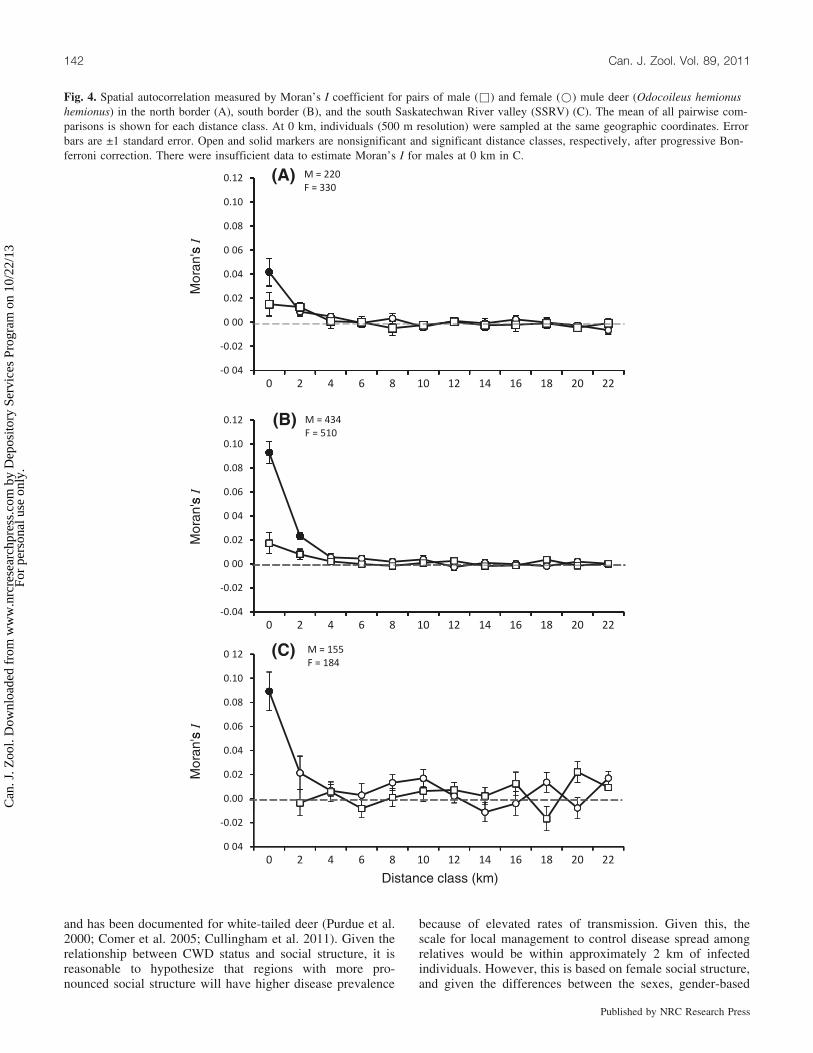
Local population structureSimilar patterns of spatial genetic autocorrelation were
observed for the sex classes in each of the regions exceptfor male deer in the SSRV (Fig. 4C). Female deer were ge-netically more related than males at distances up to 2 km(Figs. 4A–4C) with the highest autocorrelation at small lagsin the south border (Sp = 0.005, 0.004–0.005), followed bythe SSRV (Sp = 0.003, 0.002–0.004), and the north border(Sp = 0.002, 0.002–0.003). Females sampled at the samegeographic coordinate in the SSRV (mean R = 0.105, SE =0.024) and south border (mean R = 0.107, SE = 0.011) wereapproximately three times more related than those in thenorth border (mean R = 0.036, SE = 0.012). Small samplesize prevented pairwise comparisons of male relatedness inthe SSRV, but relatedness within the north border (meanR = 0.018, SE = 0.014) and south border (mean R = 0.009,SE = 0.012) were similarly low.
Within the SSRV, the distributions of pairwise relatedvalues (R) among CWD-infected and noninfected matchedpairs each exhibited bell-shaped distributions (Fig. 5), andthey were significantly different (c2 = 41.70, P < 0.0001).The difference in mean R between pairs of CWD-infecteddeer (0.009, SE = 0.011) and noninfected deer (–0.012,SE = 0.003) was significantly greater than expected basedon permutation testing.
DiscussionThe low levels of broad-scale genetic differentiation ob-
served in mule deer is characteristic of species with highdispersal and associated gene flow across a large, continuousarea (Slatkin 1981). The low global FST (0.008) of muledeer in western Canada was comparable with values re-ported in other populations of mule deer (0.009–0.032)across North America (Smith et al. 1990; Cronin 1991;Scribner et al. 1991; Travis and Keim 1995), and similar towhat was found for sympatric populations of white-taileddeer (FST = 0.006; Cullingham et al. 2011). Although ge-netic differentiation was weak, the pattern is well describedby geographic distance. This result contrasted sharply withT
able
1(c
oncl
uded
).
Pane
lL
ocus
Ori
gin
Prim
erse
quen
ces
Prim
erco
nc.
(mm
ol/L
)Si
zera
nge
(bp)
Lab
elR
efer
ence
s
PM
ule
deer
5’-T
TT
CA
CT
GT
TT
TC
TC
CT
TC
AG
A-3’;
5’-G
TT
TC
TT
TG
CC
CA
AT
CA
GA
TG
TT
GT
AG
-3’
0.16
213–
248
FAM
Jone
set
al.
2000
NM
ule
deer
5’-T
CC
AG
AG
AA
GC
AA
CC
AA
TA
G-3’;
5’-G
TG
TG
CC
TT
AA
AC
AA
CC
TG
T-3’
0.32
282–
342
NE
DD
eWoo
dyet
al.
1995
;Jo
nes
etal
.20
00
Not
e:C
hang
esto
orig
inal
prim
erse
quen
ces
are
inbo
ldfa
cety
pe.
PCR
chem
istr
y:10
mLto
tal
PCR
reac
tion
usin
g~2
5ng
ofD
NA
,5mL
of2�
Qia
gen
mul
tiple
xPC
Rm
aste
rm
ix,
2mL
of10�
prim
erm
ixw
ithva
ryin
gfi
nal
conc
entr
atio
nsof
each
prim
er(s
eeab
ove)
and
0.5mL
mQ
H2O
.
Cullingham et al. 139
Published by NRC Research Press
Can
. J. Z
ool.
Dow
nloa
ded
from
ww
w.n
rcre
sear
chpr
ess.
com
by
Dep
osito
ry S
ervi
ces
Prog
ram
on
10/2
2/13
For
pers
onal
use
onl
y.
sympatric white-tailed deer, where geographic distance ex-plained very little of the variation in genetic differentiation(Cullingham et al. 2011). This could be the result ofdifferences in genetic equilibrium between the species.White-tailed deer have experienced population increases inthe western provinces (Wishart 1984; Natural ResourcesService 1995); consequently, their population is not likelyat mutation–drift equilibrium and there will therefore be lit-tle association of geographic distance with genetic distance(Hutchison and Templeton 1999) Increased relatednessamong female mule deer at the local level supports previousobservations that the social structure of mule deer is drivenby female philopatry (Bowyer 1984; Lingle 2003). Pairwiserelatedness among infected mule deer was significantlyhigher than among sympatric noninfected mule deer, provid-ing evidence that interactions within related social groupsmay increase the risk of local CWD transmission.
Although we did not observe strong genetic discontinuityin mule deer across western Canada, significant allelic dif-ferentiation, strong isolation by distance, and a weak butstatistically significant Wahlund effect (i.e., a deficit ofheterozygosity which arises as a result of the pooling of sub-populations that have slightly different allele frequencies;Hedrick 2000) indicate that they are not panmictic either.The isolation by distance relationship suggests a high potential
Fig. 2. Locations of sampled mule deer (Odocoileus hemionus hemionus) from three areas: north border, south border, and the south Sas-katchewan River valley (SSRV).
Table 2. Diversity statistics for 16 microsatellite loci and overallcalculated from the global population of mule deer (Odocoileushemionus hemionus) (2535 individuals).
Locus k HO HE FIS (W&C) PBBJ2 9 0.768 0.775 0.009 0.1938BL25 8 0.672 0.689 0.025 0.0219BM4107 17 0.635 0.667 0.047 0.0031BM6438 9 0.605 0.606 0.003 0.4688BM6506 8 0.749 0.749 0.001 0.475BM848 8 0.758 0.774 0.021 0.025Cervid1 15 0.757 0.786 0.037 0.0031D 7 0.412 0.415 0.008 0.3219ETH152 12 0.861 0.869 0.009 0.1281INRA011 5 0.155 0.159 0.024 0.0563K 7 0.653 0.661 0.011 0.1531N 14 0.840 0.853 0.015 0.0375P 7 0.564 0.572 0.014 0.1656Rt30 17 0.794 0.801 0.010 0.1125Rt5 9 0.765 0.772 0.010 0.1688Rt7 13 0.771 0.783 0.015 0.0469Overall 10.3 0.672 0.683 0.016 0.0031
Note: k is the number of alleles per locus; HO is the observed heterozyg-osity; HE is the heterozygosity expected under Hardy–Weinberg equili-brium; and FIS (W&C) is the measure of inbreeding according to Weir andCockerham (1984).
140 Can. J. Zool. Vol. 89, 2011
Published by NRC Research Press
Can
. J. Z
ool.
Dow
nloa
ded
from
ww
w.n
rcre
sear
chpr
ess.
com
by
Dep
osito
ry S
ervi
ces
Prog
ram
on
10/2
2/13
For
pers
onal
use
onl
y.
for continued spread of CWD through dispersal of infectedindividuals, with a risk function that decreases with geo-graphic distance from foci of infection. This should resultin a pattern of CWD spread that resembles a point sourcewith outward diffusion, as documented for bovine tubercu-losis in white-tailed deer (Schmitt et al. 1997). However,there has been considerable heterogeneity observed in thepattern of CWD prevalence that has been related to differ-ent spread parameters, including history of disease in thearea and habitat diversity (Conner and Miller 2004; Milleret al. 2004; Wolfe et al. 2004; Heisey et al. 2010). Migra-
tory behavior may also contribute to CWD spread (Connerand Miller 2004) and the populations we studied are parti-ally migratory, with rates and distances migrated varyingacross the study area. For example, within the SSRV, 42%of adult mule deer are migratory with median migrationdistances of 16 km for males and 19 km for females andmaximum migration distances of 65 and 113 km, respec-tively (Skelton 2010); within the north border, approxi-mately 25% of deer migrate for winter, generally <50 km(E.H. Merrill, personal communication). Interactions amongmigratory deer could result in increasing the geographicextent of the disease more rapidly than dispersal.
At the local scale, host density can also play an importantrole in transmission patterns (Arneberg et al. 1998), espe-cially in social mammals where interactions within socialgroups can increase the probability of disease spread (Al-tizer et al. 2003). Because we found infected individuals tobe more related than noninfected matched pairs (Fig. 5), so-cial structure likely plays a role in local transmission ofCWD among mule deer. The elevated transmission of dis-ease among relatives has also been observed in bovine tu-berculosis and CWD among white-tailed deer (Blanchong etal. 2007; Grear et al. 2010).
Estimating the extent of social structure might help to re-solve the relevant scale of local CWD transmission risk formanagement. Patterns of genetic spatial autocorrelation re-veal areas of homogeneity at local scales that reflect familysize (Sokal and Oden 1978), or the radius of genetic neigh-borhoods (Clark and Richardson 2002). Because femalemule deer tend to form small matrilineal groups consistingof does, their fawns, and sometimes female yearlings(Mackie et al. 1982; Bowyer 1984; Mathews and Porter1993), local-scale structure is likely driven by female philo-patry. Accordingly, we found short distance positive auto-correlation in all three regions with significant relatednessonly among females (Figs. 4A–4C). Matrilineal social struc-ture is considered typical of mammals (Greenwood 1980)
Fig. 3. Genetic distance (FST/(1 – FST)) and geographic distance (km) for pairwise comparisons of 22 sample areas with mule deer (Odo-coileus hemionus hemionus). Global FST was 0.008. Genetic and geographic distances were positively correlated (r = 0.78, P < 0.001).
Table 3. Results from Bayesian clustering ana-lysis of 2535 mule deer (Odocoileus hemionushemionus) across British Columbia, Alberta,and Saskatchewan using the admixture modelwith correlated allele frequencies in STRUC-TURE version 2.3.1 (Pritchard et al. 2000;Falush et al. 2003, 2007; Hubisz et al. 2009).
L(K)
K Mean SD DK1 –119028 0 02 –118365 27 17.63 –118177 84.6 1.14 –118085 126 1.85 –118226 197.1 0.76 –118222 201.7 1.27 –118675 410.1 0.18 –118736 140.9 2.59 –119366 1074.7 0.1
10 –119853 1710.8 0.3
Note: L(K) is averaged across five separate itera-tions for each value of K. Selection of the most likelyvalue of K is two (indicated in boldface type) basedon the degree of change in the mean value of L(K)(Evanno et al. 2005), indicated as DK.
Cullingham et al. 141
Published by NRC Research Press
Can
. J. Z
ool.
Dow
nloa
ded
from
ww
w.n
rcre
sear
chpr
ess.
com
by
Dep
osito
ry S
ervi
ces
Prog
ram
on
10/2
2/13
For
pers
onal
use
onl
y.
and has been documented for white-tailed deer (Purdue et al.2000; Comer et al. 2005; Cullingham et al. 2011). Given therelationship between CWD status and social structure, it isreasonable to hypothesize that regions with more pro-nounced social structure will have higher disease prevalence
because of elevated rates of transmission. Given this, thescale for local management to control disease spread amongrelatives would be within approximately 2 km of infectedindividuals. However, this is based on female social structure,and given the differences between the sexes, gender-based
Fig. 4. Spatial autocorrelation measured by Moran’s I coefficient for pairs of male (&) and female (*) mule deer (Odocoileus hemionushemionus) in the north border (A), south border (B), and the south Saskatechwan River valley (SSRV) (C). The mean of all pairwise com-parisons is shown for each distance class. At 0 km, individuals (500 m resolution) were sampled at the same geographic coordinates. Errorbars are ±1 standard error. Open and solid markers are nonsignificant and significant distance classes, respectively, after progressive Bon-ferroni correction. There were insufficient data to estimate Moran’s I for males at 0 km in C.
142 Can. J. Zool. Vol. 89, 2011
Published by NRC Research Press
Can
. J. Z
ool.
Dow
nloa
ded
from
ww
w.n
rcre
sear
chpr
ess.
com
by
Dep
osito
ry S
ervi
ces
Prog
ram
on
10/2
2/13
For
pers
onal
use
onl
y.
management should be considered (Fenichel and Horan2007). This also does not take into account disease trans-mission as a result of the environment, which over timemay play a larger role in local transmission (Miller et al.2006).
The relationship between social structure and increasedtransmission is also supported by the patterns of diseaseprevalence and female-biased fine-scale genetic structure ofthe north border, south border, and SSRV. Prevalence isgreatest in the SSRV (~5%), where females are more highlyrelated. Prevalence is lowest in the north border (~0.13%),where females are less related (Figs. 4A, 4B). In the southborder, relatedness among females is as high as in theSSRV yet prevalence is not at the same level. However,based on the history of CWD in western Canada, prevalenceshould be greatest in the SSRV because the first case wasdocumented here 3 years prior to the first case in the southborder (Bollinger et al. 2004). Differences in relatednessamong female mule deer in these regions could be attributedto habitat differences. The north border encompasses aspenparklands, whereas the river valley to the south (south bor-der and SSRV) is surrounded by more open prairie. Wherewoody cover is reduced, there are higher pairwise contactrates (Habib 2010) and the formation of tightly linked socialgroups for effective defense strategies (Lingle 2003; Lingleet al. 2007). As well, differences in density and samplingcould also affect the estimation of relatedness parameters.
Eradication of CWD is no longer deemed feasible in Al-berta and Saskatchewan (Langenberg et al. 2008; Saskatche-wan Ministry of the Environment 2008); however, limiting
spread of the disease is considered possible. Our resultslead to two recommendations for CWD management andsurveillance. At the broad scale, there are no barriers togene flow. Therefore, dispersing infected deer could carrythe disease across long distances and spark new foci of in-fection. Hence, surveillance should extend to noninfectedareas at least to the distance of maximum dispersal of muledeer, which can exceed 100 km (Skelton 2010). At the localscale, we have found that risk of CWD infection is higheramong kin. We have also found that the scale of kin struc-ture extends to approximately 2 km. Therefore, managementshould focus control measures such as targeted culls with anapproximate 2 km radius to reduce persistence. This dis-tance should be expanded based on knowledge of home-range size and seasonal migratory patterns in the area. Notonly do our results help inform current management, this in-formation will be beneficial to future management options.For instance, if an effective vaccine is developed (Pilon etal. 2007), we now have an understanding of the spatial scalewhere we expect to see disease transmission within socialgroups among relatives. This information can be used to de-velop strategies to reduce disease prevalence.
AcknowledgementsThis work was funded by the Alberta Prion Research In-
stitute and PrioNet Canada. The authors thank Alberta Fishand Wildlife enforcement, biological, administration andmanagement staff, together with Saskatchewan Environmentand Canadian Cooperative Wildlife Health Centre who havemade important contributions to ongoing CWD management
Fig. 5. Distribution of relatedness in CWD-infected and noninfected mule deer (Odocoileus hemionus hemionus) in the south SaskatechwanRiver valley (SSRV). The map indicates the location of all 85 CWD-positive deer (*) and their respective same sex, noninfected, closestspatial neighbor (*). The distributions of relatedness between CWD-infected and noninfected deer were significantly different (c2 = 41.69,P < 0.001).
Cullingham et al. 143
Published by NRC Research Press
Can
. J. Z
ool.
Dow
nloa
ded
from
ww
w.n
rcre
sear
chpr
ess.
com
by
Dep
osito
ry S
ervi
ces
Prog
ram
on
10/2
2/13
For
pers
onal
use
onl
y.
and research. Samples used in this study were collected pri-marily from their efforts. We also acknowledge supportfrom the Alberta Conservation Association, Alberta Cooper-ative Conservation Research Unit, Alberta Professional Out-fitter Society Alberta, Alberta Ingenuity, and the CanadianFoundation for Innovation. Numerous individuals have madevery important contributions along the way and we acknowl-edge them here: Mark Ball, Eric Brownrigg, Bill Clark,Corey Davis, Laura Elliott, Chris Garrett, Tom Habib, Pat-rick James, Erica Kubanek, Erin Rees, Erin Silbernagel,Chris Wilke, Marnie Zimmer, and two anonymous reviewers.Lastly, we thank all of the cooperating landowners and hunt-ers in CWD-affected areas of Alberta and Saskatchewan.
ReferencesAltizer, S., Nunn, C.L., Thrall, P.H., Gittleman, J.L., Antonovics,
J., Cunningham, A.A., Dobson, A.P., Ezenwa, V., Jones, K.E.,Pedersen, A.B., Poss, M., and Pulliam, J.R.C. 2003. Social orga-nization and parasite risk in mammals: integrating theory andempirical studies. Annu. Rev. Ecol. Syst. 34(1): 517–547.doi:10.1146/annurev.ecolsys.34.030102.151725.
Arneberg, P., Skorping, A., Grenfell, B., and Read, A. 1998. Hostdensities as determinants of abundance in parasite communities.Proc. R. Soc. Lond. B Biol. Sci. 265(1403): 1283–1289. doi:10.1098/rspb.1998.0431.
Balkenhol, N., Waits, L., and Dezzani, R. 2009. Statistical ap-proaches in landscape genetics: an evaluation of methods forlinking landscape and genetic data. Ecography, 32(5): 818–830.doi:10.1111/j.1600-0587.2009.05807.x.
Bataille, A., Cunningham, A., Cedeno, V., Cruz, M., Eastwood, G.,Fonseca, D.M., Causton, C.E., Azuero, R., Loayza, J., CruzMartinez, J.D., and Goodman, S.J. 2009. Evidence for regularongoing introductions of mosquito disease vectors into the Gala-pagos Islands. Proc. R. Soc. Lond. B Biol. Sci. 276(1674):3769–3775. doi:10.1098/rspb.2009.0998.
Belay, E.D., Maddox, R.A., Williams, E.S., Miller, M.W., Gam-betti, P., and Schonberger, L.B. 2004. Chronic wasting diseaseand potential transmission to humans. Emerg. Infect. Dis. 10(6):977–984. PMID:15207045.
Bishop, R.C. 2004. The economic impacts of chronic wasting dis-ease (CWD) in Wisconsin. Hum. Dimens. Wildl. 9(3): 181–192.doi:10.1080/10871200490479963.
Bishop, M.D., Kappes, S.M., Keele, J.W., Stone, R.T., Sunden,S.L.F., Hawkins, G.A., Toldo, S.S., Fries, R., Grosz, M.D.,Yoo, J., and Beattie, C.W. 1994. A genetic linkage map for cat-tle. Genetics, 136(2): 619–639. PMID:7908653.
Blanchong, J.A., Scribner, K.T., Kravchenko, A.N., and Winter-stein, S.R. 2007. TB-infected deer are more closely related thannon-infected deer. Biol. Lett. 3(1): 104–106. doi:10.1098/rsbl.2006.0547. PMID:17443977.
Blanchong, J.A., Samuel, M.D., Scribner, K.T., Weckworth, B.V.,Langenberg, J.A., and Filcek, K.B. 2008. Landscape geneticsand the spatial distribution of chronic wasting disease. Biol. Lett.4(1): 130–133. doi:10.1098/rsbl.2007.0523. PMID:18077240.
Bollinger, T., Caley, P., Merrill, E., Messier, F., Miller, M.W., Sa-muel, M.D., and Vanopdenbosch, E. 2004. Chronic wasting dis-ease in Canadian wildlife: an expert opinion on theepidemiology and risks to wild deer. Prepared by Expert Scien-tific Panel on Chronic Wasting Disease. July 2004. CanadianCooperative Wildlife Health Centre, Western College of Veter-inary Medicine, Saskatoon, Sask. Available from http://www.ccwhc.ca/publications/CWD_Expert_Report_Final_20040804.pdf [accessed 12 January 2010].
Bonferroni, C.E. 1936. Teoria statistica delle classi e calcolo delleprobabilita. Pubblicazioni del R Istituto Superiore di ScienzeEconomiche e Commerciali di Firenze, 8: 3–62.
Bonnet, E., and Van de Peer, Y. 2002. zt: a software tool for sim-ple and partial Mantel tests. J. Stat. Softw. 10(10): 1–12.
Bowyer, R.T. 1984. Sexual segregation in southern mule deer. J.Mammal. 65(3): 410–417. doi:10.2307/1381087.
Brownstein, M.J., Carpten, J.D., and Smith, J.R. 1996. Modulationof non-templated nucleotide addition by Taq DNA polymerase:primer modifications that facilitate genotyping. Biotechniques,20(6): 1004–1006, 1008–1010. PMID:8780871.
Brunjes, K.J., Ballard, W.B., Humphrey, M.H., Harwell, F., McIn-tyre, N.E., Krausman, P.R., and Wallace, M.C. 2006. Habitatuse by sympatric mule and white-tailed deer in Texas. J. Wildl.Manage. 70(5): 1351–1359. doi:10.2193/0022-541X(2006)70[1351:HUBSMA]2.0.CO;2.
Clark, S.A., and Richardson, B.J. 2002. Spatial analysis of geneticvariation as a rapid assessment tool in the conservation manage-ment of narrow-range endemics. Invertebr. Syst. 16(4): 583–587.doi:10.1071/IT01041.
Comer, C.E., Kilgo, J.C., D’Angelo, G.J., Glenn, T.C., Miller, K.V.,and DeWoody. 2005. Fine-scale genetic structure and social orga-nization in female white-tailed deer. J. Wildl. Manage. 69(1): 332–344. doi:10.2193/0022-541X(2005)069<0332:FGSASO>2.0.CO;2.
Conner, M.M., and Miller, M.W. 2004. Movement patterns andspatial epidemiology of a prion disease in mule deer populationunits. Ecol. Appl. 14(6): 1870–1881. doi:10.1890/03-5309.
Cronin, M.A. 1991. Mitochondrial DNA phylogeny of deer (Cer-vidae). J. Mammal. 72(3): 553–566. doi:10.2307/1382139.
Cullingham, C.I., Kyle, C.J., Pond, B.A., Rees, E.E., and White,B.N. 2009. Differential permeability of rivers to raccoon geneflow corresponds to rabies incidence in Ontario, Canada. Mol.Ecol. 18(1): 43–53. PMID:19140963.
Cullingham, C.I., Merrill, E.H., Pybus, M.J., Bollinger, T.K., Wil-son, G.A., and Coltman D.W. 2011. Broad and fine-scale ge-netic analysis of white-tailed deer populations: estimating therelative risk of chronic wasting disease. Evol. Appl. 4(1): 116–131. doi:10.1111/j.1752-4571.2010.00142.x .
Decker, D., Wild, M., Riley, S., Siemer, W., Miller, M., Leong, K.,Powers, J., and Rhyan, J. 2006. Wildlife disease management: amanager’s model. Hum. Dimens. Wildl. 11(3): 151–158. doi:10.1080/10871200600669908.
DeWoody, J.A., Honeycutt, R.L., and Skow, L.C. 1995. Micro-satellite markers in white-tailed deer. J. Hered. 86(4): 317–319.PMID:7658002.
Evanno, G., Regnaut, S., and Goudet, J. 2005. Detecting the num-ber of clusters of individuals using the software STRUCTURE:a simulation study. Mol. Ecol. 14(8): 2611–2620. doi:10.1111/j.1365-294X.2005.02553.x. PMID:15969739.
Excoffier, L., and Heckel, G. 2006. Computer programs for popula-tion genetics data analysis: a survival guide. Nat. Rev. Genet.7(10): 745–758. doi:10.1038/nrg1904. PMID:16924258.
Falush, D., Stephens, M., and Pritchard, J.K. 2003. Inference of po-pulation structure using multilocus genotype data: linked lociand correlated allele frequencies. Genetics, 164(4): 1567–1587.PMID:12930761.
Falush, D., Stephens, M., and Pritchard, J.K. 2007. Inference of po-pulation structure using multilocus genotype data: dominantmarkers and null alleles. Mol. Ecol. Notes, 7(4): 574–578.doi:10.1111/j.1471-8286.2007.01758.x. PMID:18784791.
Fenichel, E.P., and Horan, R.D. 2007. Gender-based harvesting inwildlife disease management. Am. J. Agric. Econ. 89(4): 904–920. doi:10.1111/j.1467-8276.2007.01025.x.
Goudet, J. 2001. FSTAT: a program to estimate and test gene
144 Can. J. Zool. Vol. 89, 2011
Published by NRC Research Press
Can
. J. Z
ool.
Dow
nloa
ded
from
ww
w.n
rcre
sear
chpr
ess.
com
by
Dep
osito
ry S
ervi
ces
Prog
ram
on
10/2
2/13
For
pers
onal
use
onl
y.
diversities and fixation indices. Version 2.9.3 [computer pro-gram]. Available from http://www2.unil.ch/popgen/softwares/fstat.htm [accessed 12 January 2010].
Grear, D.A., Samuel, M.D., Scribner, K.T., Weckworth, B.V., andLangenberg, J.A. 2010. Influence of genetic relatedness and spa-tial proximity on chronic wasting disease infection among fe-male white-tailed deer. J. Appl. Ecol. 47(3): 532–540. doi:10.1111/j.1365-2664.2010.01813.x.
Greenwood, P.J. 1980. Mating systems, philopatry and dispersal inbirds and mammals. Anim. Behav. 28(4): 1140–1162. doi:10.1016/S0003-3472(80)80103-5.
Gross, J.E., and Miller, M.W. 2001. Chronic wasting disease inmule deer: disease dynamics and control. J. Wildl. Manage.65(2): 205–215. doi:10.2307/3802899.
Habib, T.J. 2010. Ecology and management of white-tailed deer(Odocoileus virginianus) and mule deer (O. hemionus) of east-central Alberta in relation to chronic wasting disease. M.Sc. the-sis, University of Alberta, Edmonton.
Haley, N.J., Seelig, D.M., Zabel, M.D., Telling, G.C., Hoover, E.A.,and Cookson, M.R. 2009. Detection of CWD prions in urine andsaliva of deer by transgenic mouse bioassay. PLoS One, 4(3):e4848. doi:10.1371/journal.pone.0004848. PMID:19293928.
Hardy, O.J., and Vekemans, X. 1999. Isolation by distance in a con-tinuous population: reconciliation between spatial autocorrelationanalysis and population genetics models. Heredity, 83(2): 145–154. doi:10.1046/j.1365-2540.1999.00558.x. PMID:10469202.
Hardy, O.J., and Vekemans, X. 2002. SPAGEDi: a versatile computerprogram to analyze spatial genetic structure at the individual orpopulation levels. Mol. Ecol. Notes, 2(4): 618–620. doi:10.1046/j.1471-8286.2002.00305.x.
Hawkins, R.E., and Klimstra, W.D. 1970. A preliminary study ofthe social organization of white-tailed deer. J. Wildl. Manage.34(2): 407–419. doi:10.2307/3799027.
Hedrick, P. 2000. Genetics of populations. Jones and Bartlett, Boston,Mass.
Heisey, D.M., Osnas, E.E., Cross, P.C., Joly, D.O., Langenberg,J.A., and Miller, M.W. 2010. Linking process to pattern: esti-mating spatiotemporal dynamics of a wildlife epidemic fromcross-sectional data. Ecol. Monogr. 80(2): 221–240. doi:10.1890/09-0052.1.
Hewitt, J.E., Legendre, P., McArdle, B.H., Thrush, S.F., Bellehumeur,C., and Lawrie, S.M. 1997. Identifying relationships between adultand juvenile bivalves at different spatial scales. J. Exp. Mar. Biol.Ecol. 216(1–2): 77–98. doi:10.1016/S0022-0981(97)00091-9.
Hubisz, M., Falush, D., Stephens, M., and Pritchard, J. 2009. Infer-ring weak population structure with the assistance of samplegroup information. Mol. Ecol. Resour. 9(5): 1322–1332. doi:10.1111/j.1755-0998.2009.02591.x.
Hutchison, D., and Templeton, A. 1999. Correlation of pairwise ge-netic and geographic distance measures: Inferring the relative in-fluences of gene flow and drift on the distribution of geneticvariability. Evolution, 53(6): 1898–1914. doi:10.2307/2640449.
Jakobsson, M., and Rosenberg, N.A. 2007. CLUMPP: a clustermatching and permutation program for dealing with labelswitching and multimodality in analysis of population structure.Bioinformatics, 23(14): 1801–1806. doi:10.1093/bioinformatics/btm233. PMID:17485429.
Jobin, R.M., Patterson, D., and Zhang, Y. 2008. DNA typing in po-pulations of mule deer for forensic use in the province of Al-berta. Forensic Sci. Int.: Genet. 2(3): 190–197. doi:10.1016/j.fsigen.2008.01.003. PMID:19083820.
Jones, K.C., Levine, K.F., and Banks, J.D. 2000. DNA-based ge-netic markers in black-tailed and mule deer for forensic applica-tions. Calif. Fish Game, 86: 115–126.
Kahn, S., Dube, C., Bates, L., and Balachandran, A. 2004. Chronicwasting disease in Canada: Part 1. Can. Vet. J. 45(5): 397–404.PMID:15206588.
Kie, J.G., Bowyer, R.T., Nicholson, M.C., Boroski, B.B., and Loft,E.R. 2002. Landscape heterogeneity at differing scales: effectson spatial distribution of mule deer. Ecology, 83(2): 530–544.doi:10.1890/0012-9658(2002)083[0530:LHADSE]2.0.CO;2.
Langenberg, J.A., Miller, M.W., and Creekmore, L. 2008. Albertachronic wasting disease management. program review panel re-port. Alberta Fish and Wildlife. Edmonton. Available fromht tp : / /www.s rd .a lbe r t a . ca /B ioDiver s i tyStewardsh ip /WildlifeDiseases/documents/CWD-ABreview_FINAL.pdf [ac-cessed 13 January 2010].
Lingle, S. 2003. Group composition and cohesion in sympatricwhite-tailed deer and mule deer. Can. J. Zool. 81(7): 1119–1130. doi:10.1139/z03-097.
Lingle, S., Rendall, D., Wilson, W.F., DeYoung, R.W., and Pellis,S.M. 2007. Altruism and recognition in the antipredator defenseof deer: 2. Why mule deer help nonoffspring fawns. Anim.Behav. 73(5): 907–916. doi:10.1016/j.anbehav.2006.11.004.
Mackie, R.J., Hamlin, K.L., and Pac, D.F. 1982. Mule deer. inWild mammals of North America: biology, management, andeconomics. Edited by J.A. Chapman and G.A. Feldhamer. TheJohns Hopkins University Press, Baltimore, Md.
Manel, S., Schwartz, M.K., Luikart, G., and Taberlet, P. 2003.Landscape genetics: combining landscape ecology and popula-tion genetics. Trends Ecol. Evol. 18(4): 189–197. doi:10.1016/S0169-5347(03)00008-9.
Mantel, N. 1967. The detection of disease clustering and a general-ized regression approach. Cancer Res. 27(2): 209–220. PMID:6018555.
Mathews, N.E., and Porter, W.F. 1993. Effect of social structure ongenetic structure of free-ranging white-tailed deer in the Adiron-dack Mountains. J. Mammal. 74(1): 33–43. doi:10.2307/1381903.
Mathiason, C.K., Powers, J.G., Dahmes, S.J., Osborn, D.A., Miller,K.V., Warren, R.J., Mason, G.L., Hays, S.A., Hayes-Klug, J.,Seelig, D.M., Wild, M.A., Wolfe, L.L., Spraker, T.R., Miller,M.W., Sigurdson, C.J., Telling, G.C., and Hoover, E.A. 2006.Infectious prions in the saliva and blood of deer with chronicwasting disease. Science (Washington, D.C.), 314(5796): 133–136. doi:10.1126/science.1132661. PMID:17023660.
Mathiason, C.K., Hays, S.A., Powers, J., Hayes-Klug, J., Langen-berg, J., Dahmes, S.J., Osborn, D.A., Miller, K.V., Warren, R.J.,Mason, G.L., and Hoover, E.A. 2009. Infectious prions in pre-clinical deer and transmission of chronic wasting disease solelyby environmental exposure. PLoS One, 4(6): e5916. doi:10.1371/journal.pone.0005916. PMID:19529769.
Miller, M.W., and Williams, E.S. 2003. Prion disease: horizontalprion transmission in mule deer. Nature (London), 425(6953):35–36. doi:10.1038/425035a. PMID:12955129.
Miller, M.W., Williams, E.S., Hobbs, N.T., and Wolfe, L.L. 2004.Environmental sources of prion transmission in mule deer.Emerg. Infect. Dis. 10(6): 1003–1006. PMID:15207049.
Miller, M.W., Hobbs, N.T., and Tavener, S.J. 2006. Dynamics ofprion disease transmission in mule deer. Ecol. Appl. 16(6):2208–2214. doi:10.1890/1051-0761(2006)016[2208:DOPDTI]2.0.CO;2. PMID:17205898.
Miller, M.W., Swanson, H.M., Wolfe, L.L., Quartarone, F.G.,Huwer, S.L., Southwick, C.H., Lukacs, P.M., and Baylis, M.2008. Lions and prions and deer demise. PLoS One, 3(12):e4019. doi:10.1371/journal.pone.0004019. PMID:19107193.
Moran, P.A.P. 1950. Notes on continuous stochastic phenomena.Biometrika, 37: 17–33. doi:10.2307/2332142.
Cullingham et al. 145
Published by NRC Research Press
Can
. J. Z
ool.
Dow
nloa
ded
from
ww
w.n
rcre
sear
chpr
ess.
com
by
Dep
osito
ry S
ervi
ces
Prog
ram
on
10/2
2/13
For
pers
onal
use
onl
y.
Natural Resources Canada. 2010. The atlas of Canada. Governmentof Canada, Ottawa, Ont. Available from http://atlas.nrcan.gc.ca[accessed 13 January 2010].
Natural Resources Service. 1995. Management plan for white-taileddeer in Alberta. Alberta Environmental Protection Natural Re-sources, Government of Alberta, Edmonton.
Nei, M. 1978. Estimation of average heterozygosity and geneticdistance from a small number of individuals. Genetics, 89(3):583–590. PMID:17248844.
Nelson, M.E. 1998. Development of migratory behavior in northernwhite-tailed deer. Can. J. Zool. 76(3): 426–432. doi:10.1139/cjz-76-3-426.
Nicholson, M.C., Bowyer, R.T., and Kie, K.G. 1997. Habitat selec-tion and survival of mule deer: tradeoffs associated with migra-tion. J. Mammal. 78(2): 483–504. doi:10.2307/1382900.
Peakall, R., and Smouse, P.E. 2006. GENALEX 6: genetic analysis inExcel. Population genetic software for teaching and research. Mol.Ecol. Notes, 6(1): 288–295. doi:10.1111/j.1471-8286.2005.01155.x.
Pilon, J., Loiacono, C., Okeson, D., Lund, S., Vercauteren, K.,Rhyan, J., and Miller, L. 2007. Anti-prion activity generated bya novel vaccine formulation. Neurosci. Lett. 429(2-3): 161–164.doi:10.1016/j.neulet.2007.10.015. PMID:18023980.
Polziehn, R.O., and Strobeck, C. 1998. Phylogeny of wapiti, reddeer, sika deer, and other North American cervids as determinedfrom mitochondrial DNA. Mol. Phylogenet. Evol. 10(2): 249–258. doi:10.1006/mpev.1998.0527. PMID:9878235.
Pritchard, J.K., Stephens, M., and Donnelly, P. 2000. Inference ofpopulation structure using multilocus genotype data. Genetics,155(2): 945–959. PMID:10835412.
Purdue, J.R., Smith, M.H., and Patton, J.C. 2000. Female philopa-try and extreme spatial genetic heterogeneity in white-taileddeer. J. Mammal. 81(1): 179–185. doi:10.1644/1545-1542(2000)081<0179:FPAESG>2.0.CO;2.
Pybus, M.J. 2007. Alberta’s chronic wasting disease response pro-gram: March, 2007. Alberta Fish and Wildlife, Alberta Govern-ment, Edmonton. Available from http://www.afga.org/documents.html?fileID=234 [accessed 13 January 2010].
Queller, D.C., and Goodnight, K.F. 1989. Estimating relatednessusing genetic markers. Evolution, 43(2): 258–275. doi:10.2307/2409206.
Raymond, M., and Rousset, F. 1995a. Genepop (version 1.2): po-pulation genetics software for exact tests and ecumenicism. J.Hered. 86(3: 248–249.
Raymond, M., and Rousset, F. 1995b. An exact test for populationdifferentiation. Evolution, 49(6): 1280–1283. doi:10.2307/2410454.
Real, L.A., and Biek, R. 2007. Spatial dynamics and genetics of in-fectious diseases on heterogeneous landscapes. J. R. Soc.Interface, 4(16): 935–948. doi:10.1098/rsif.2007.1041. PMID:17490941.
Robinette, W.L. 1966. Mule deer home range and dispersal inUtah. J. Wildl. Manage. 30(2): 335–349. doi:10.2307/3797822.
Rosenberry, C.S., Lancia, R.A., and Conner, M.C. 1999. Population ef-fects of white-tailed deer dispersal. Wildl. Soc. Bull. 27: 858–864.
Rousset, F. 1997. Genetic differentiation and estimation of geneflow from F-statistics under isolation by distance. Genetics,145(4): 1219–1228. PMID:9093870.
Saskatchewan Ministry of the Environment. 2008. 2008 Chronicwasting disease management program. Available from http://www.env i ronment .gov .sk .ca / adx/aspx/adxGetMedia .aspx?DocID=1756,300,254,99,88,Documents&MediaID=981&Filename=2008+CWD+Program+Information.pdf&l=English [ac-cessed 12 January 2010].
Schmitt, S.M., Fitzgerald, S.D., Cooley, T.M., Bruning-Fann, C.S.,Sullivan, L., Berry, D., Carlson, T., Minnis, R.B., Payeur, J.B.,and Sikarskie, J. 1997. Bovine tuberculosis in free-rangingwhite-tailed deer from Michigan. J. Wildl. Dis. 33(4): 749–758.PMID:9391958.
Scribner, K.T., Smith, M.H., Garrott, R.A., and Carpenter, L.H.1991. Temporal, spatial, and age-specific changes in genotypiccomposition of mule deer. J. Mammal. 72(1): 126–137. doi:10.2307/1381987.
Skelton, N.K. 2010. Migration, dispersal, and survival patterns ofmule deer (Odocoileus hemionus) in a chronic wasting disease-endemic area of southern Saskatchewan. M.Sc. thesis, Depart-ment of Veterinary Pathology, The University of Saskatchewan,Saskatoon.
Slatkin, M. 1981. Estimating levels of gene flow in natural popula-tions. Genetics, 99(2): 323–335. PMID:17249120.
Smith, M.H., Scribner, K.T., Carpenter, L.H., and Garrott, R.A.1990. Genetic characteristics of Colorado mule deer (Odocoileushemionus) and comparisons with other cervids. Southwest. Nat.35(1): 1–8. doi:10.2307/3671978.
Sokal, R.R., and Oden, N.L. 1978. Spatial autocorrelation in biol-ogy 2. Some biological implications and four applications ofevolutionary and ecological interest. Biol. J. Linn. Soc. 10(2):229–249. doi:10.1111/j.1095-8312.1978.tb00014.x.
Steffen, P., Eggen, A., Stranzinger, G., Fries, R., Dietz, A.B., andWomack, J.E. 1993. Isolation and mapping of polymorphicmicrosatellites in cattle. Anim. Genet. 24(2): 121–124. doi:10.1111/j.1365-2052.1993.tb00252.x. PMID:8328693.
Tamguney, G., Miller, M.W., Wolfe, L.L., Sirochman, T.M., Glid-den, D.V., Palmer, C., Lemus, A., DeArmond, S.J., and Prusi-ner, S.B. 2009. Asymptomatic deer excrete infectious prions infaeces. Nature (London), 461(7263): 529–532. doi:10.1038/nature08289. PMID:19741608.
Travis, S.E., and Keim, P. 1995. Differentiating individuals and po-pulations of mule deer using DNA. J. Wildl. Manage. 59(4):824–831. doi:10.2307/3801963.
Vaiman, D., Osta, R., Mercier, D., Grohs, C., and Leveziel, H.1992. Characterization of five new bovine dinucleotide repeats.Anim. Genet. 23(6): 537–541. doi:10.1111/j.1365-2052.1992.tb00175.x. PMID:1492706.
Vekemans, X., and Hardy, O.J. 2004. New insights from fine-scalespatial genetic structure analyses in plant populations. Mol.Ecol. 13(4): 921–935. doi:10.1046/j.1365-294X.2004.02076.x.PMID:15012766.
Weir, B.S., and Cockerham, C.C. 1984. Estimating F-statistics forthe analysis of population structure. Evolution, 38(6): 1358–1370. doi:10.2307/2408641.
Whittaker, D.G., and Lindzey, F.G. 2004. Habitat use patterns ofsympatric deer species on Rocky Mountain Arsenal, Colorado.Wildl. Soc. Bull. 32(4): 1114–1123. doi:10.2193/0091-7648(2004)032[1114:HUPOSD]2.0.CO;2.
Williams, E.S. 2005. Chronic wasting disease. Vet. Pathol. 42(5):530–549. doi:10.1354/vp.42-5-530. PMID:16145200.
Williams, E.S., and Young, S. 1980. Chronic wasting disease ofcaptive mule deer: a spongiform encephalopathy. J. Wildl. Dis.16(1): 89–98. PMID:7373730.
Wilson, G.A., and Strobeck, C. 1999. The isolation and characteri-zation of microsatellite loci in bison, and their usefulness inother artiodactyls. Anim. Genet. 30(3): 226–227. doi:10.1046/j.1365-2052.1999.00404-1.x. PMID:10442989.
Wilson, G.A., Strobeck, C., Wu, L., and Coffin, J.W. 1997. Char-acterization of microsatellite loci in caribou Rangifer tarandus,and their use in other artiodactyls. Mol. Ecol. 6(7): 697–699.doi:10.1046/j.1365-294X.1997.00237.x. PMID:9226951.
146 Can. J. Zool. Vol. 89, 2011
Published by NRC Research Press
Can
. J. Z
ool.
Dow
nloa
ded
from
ww
w.n
rcre
sear
chpr
ess.
com
by
Dep
osito
ry S
ervi
ces
Prog
ram
on
10/2
2/13
For
pers
onal
use
onl
y.
Wishart, W.D. 1984. Whitetail populations and habitats: westernCanada. In White-tailed deer: ecology and management. Editedby L.K. Halls. The Wildlife Management Institution, Washing-ton, D.C. pp. 475–486.
Wolfe, L.L., Miller, M.W., and Williams, E.S. 2004. Feasibility of‘‘test-and-cull’’ for managing chronic wasting disease in urbanmule deer. Wildl. Soc. Bull. 32(2): 500–505. doi:10.2193/0091-7648(2004)32[500:FOTFMC]2.0.CO;2.
Cullingham et al. 147
Published by NRC Research Press
Can
. J. Z
ool.
Dow
nloa
ded
from
ww
w.n
rcre
sear
chpr
ess.
com
by
Dep
osito
ry S
ervi
ces
Prog
ram
on
10/2
2/13
For
pers
onal
use
onl
y.