Embed Size (px)
Citation preview
Multiscale Modeling of the Effects of Nanoscale Load Transfer on
the Effective Elastic Properties of Carbon Nanotube-Polymer
Nanocomposites
Yumeng Li
Dissertation submitted to the Faculty of the
Virginia Polytechnic Institute and State University
in partial fulfillment of the requirements for the degree of
Doctor of Philosophy
in
Aerospace Engineering
Gary D. Seidel, Chair
Romesh C. Batra
Rakesh K. Kapania
Mayuresh J. Patil
Sept. 29, 2014
Blacksburg, Virginia
Keywords: Multiscale modeling, carbon nanotube nanocomposites, interface, molecular
dynamic simulation, cohesive zone, composite cylinder model, finite element analysis
Copyright 2014, Yumeng Li
Multiscale Modeling of the Effects of Nanoscale Load Transfer on the
Effective Elastic Properties of Carbon Nanotube-Polymer Nanocomposites
Yumeng Li
ABSTRACT
A multiscale model is proposed to study the influence of interfacial interactions at the
nanoscale in carbon nanotube(CNT)-polymer nanocomposites on the macroscale bulk e-
lastic material properties. The efficiency of CNT reinforcement in terms of interfacial load
transferring is assessed for the non-functionalized and functionalized interfaces between the
CNTs and polymer matrix using force field based molecular dynamic simulations at the
nanoscale. Polyethylene (PE) as a thermoplastic material is adopted and studied first be-
cause of its simplicity. Characterization of the nanoscale load transfer has been done through
the identification of representative nanoscale interface elements for unfunctionalized CNT-
PE interface models which are studied parametrically in terms of the length of the PE chains,
the number of the PE chains and the ”grip” position. Referring to the non-functionalized
interface, CNTs interact with surrounding polymer only through weakly nonbonded van der
Waals (vdW) forces in our study. Once appropriate values of these parameters are deemed
to yield sufficiently converged results, the representative interface elements are subjected
to normal and sliding mode simulations in order to obtain the force-separation responses
at 100K and 300K for unfunctionalized CNT-PE interfaces. To study the functionalization
effects, atomistic interface representative elements for functionalized CNT-PE interface are
built based on non-functionalized interface models by grafting functional groups between the
PE matrix and the graphene sheet. This introduces covalent bonding forces in addition to
the non-bonded vdW forces. A modified consistent covalent force field (CVFF) and adaptive
intermolecular reactive empirical bond order (AIREBO) potentials, both of which account
for bond breaking, are applied to investigate the interfacial characteristic of functionalized
CNT-PE interface in terms of the force-separation responses at 100K in both normal opening
and sliding mode separations. In these studies, the focus has been on the influence of the
functionalization density on the load transfer at the nanoscale interface.
As an important engineering material, Epon 862/DETDA epoxy polymer,a thermoset plas-
tic, has also been used as the polymer matrix material in order to see the difference in
interfacial load transfer between a network structured polymer and the amorphous entan-
gled structure of the PE matrix. As for thermoset epoxy polymer, emphasis has been put
on investigating the effects of the crosslink density of the epoxy network on the interfacial
load transfer ability for both non-functionalized and functionalized CNT-Epoxy interface at
different temperatures(100K and 300K) and on the functionalization effect influenceing the
interfacial interactions at the functionalized CNT-Epoxy interface.
Cohesive zone traction-displacement laws are developed based on the force-separation re-
sponses obtained from the MD simulations for both non-functionalied and functionalized
CNT-PE/epoxy interfaces. Using the cohesive zone laws, the influence of the interface on
the effective elastic material properties of the nanocomposites are observed and determined
in continuum level models using analytic and computational micromechanics approaches,
iii
allowing for the assessment of the improvement in reinforcement efficiency of CNTs due
to the functionalization. It is found that the inclusion of the nanoscale interface in place
of the perfectly bonded interface results in effective elastic properties which are dependent
on the applied strain and temperature in accordance with the interface sensitivity to those
effects, and which are significantly diminished from those obtained under the perfect inter-
face assumption for non-functionalized nanocomposites. Better reinforcement efficiency of
CNTs are also observed for the nanocomposites with the functionalized interface between
CNTs and polymer matrix, which results in large increasing for the effective elastic material
properties relative to the non-functionalized nanocomposites with pristine CNTs. Such ob-
servations indicates that trough controlling the degree of functionalization, i.e. the number
and distribution of covalent bonds between the embedded CNTs and the enveloping polymer,
one can tailor to some degree the interfacial load transfer and hence, the effective mechanical
properties.
The multiscale model developed in this study bridges the atomistic modeling and microme-
chanics approaches with cohesive zone models, which demonstrates to deepen the under-
standing of the nanoscale load transfer mechanism at the interface and its effects on the
effective mechanical properties of the nanocomposites. It is anticipated that the results can
offer insights about how to engineer the interface and improve the design of nanocomposites.
This work received support provided by the Army Materials Center of Excellence (MCOE)
Multilayered Technologies for Armored Structures and Composites (MultiTASC) under A-
greement No:W911NF-06-2-0014 and the support provided by AFOSR grant FA9550-12-1-
iv

0205 inthe Multi-Scale Structural Mechanics and Prognosis Program.
v

Dedication
This dissertation is dedicated to my beloved family.
vi
Acknowledgments
It would not have been possible to complete this doctoral dissertation without the help and
support of the kind people around me, to only some of whom it is possible to give particular
mention here.
Foremost, I would like to express my deepest appreciation and gratitude to my advisor,
Dr. Gary D. Seidel, for his patience, motivation, enthusiasm, and immense knowledge and
providing me with the continuous support of my Ph.D study and research. His excellent
guidance helped me throughout my time at Virginia Tech. I am truly fortunate to have had
the opportunity to work with him.
I would like to thank the rest of my dissertation committee: Dr. Romesh C. Batra, Dr.
Rakesh K. Kapania, and Mayuresh J. Patil, for their friendly guidance and thought provoking
suggestions.
My sincere thanks also goes to all members in our research group, Dr. Xiang Ren, Skylar
Stephens, Adarsh Chaurasia, Naveen Prakash and Engin Sengezer for their valuable help
throughout my studies. Also I would like to thank all my friends in Blacksburg for all the
vii

supports they gave and the fun we have had in the past five years.
Last but not the least, I would like to thank my mother who is always there for me.
viii
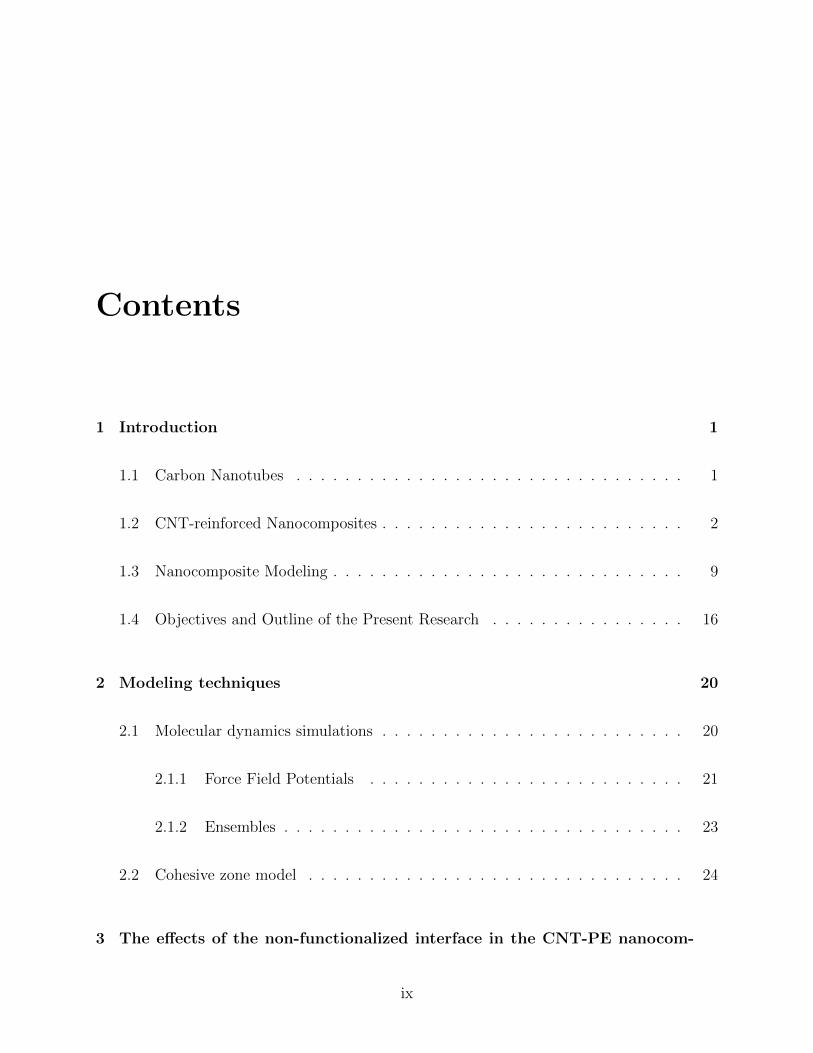
Contents
1 Introduction 1
1.1 Carbon Nanotubes . . . . . . . . . . . . . . . . . . . . . . . . . . . . . . . . 1
1.2 CNT-reinforced Nanocomposites . . . . . . . . . . . . . . . . . . . . . . . . . 2
1.3 Nanocomposite Modeling . . . . . . . . . . . . . . . . . . . . . . . . . . . . . 9
1.4 Objectives and Outline of the Present Research . . . . . . . . . . . . . . . . 16
2 Modeling techniques 20
2.1 Molecular dynamics simulations . . . . . . . . . . . . . . . . . . . . . . . . . 20
2.1.1 Force Field Potentials . . . . . . . . . . . . . . . . . . . . . . . . . . 21
2.1.2 Ensembles . . . . . . . . . . . . . . . . . . . . . . . . . . . . . . . . . 23
2.2 Cohesive zone model . . . . . . . . . . . . . . . . . . . . . . . . . . . . . . . 24
3 The effects of the non-functionalized interface in the CNT-PE nanocom-
ix
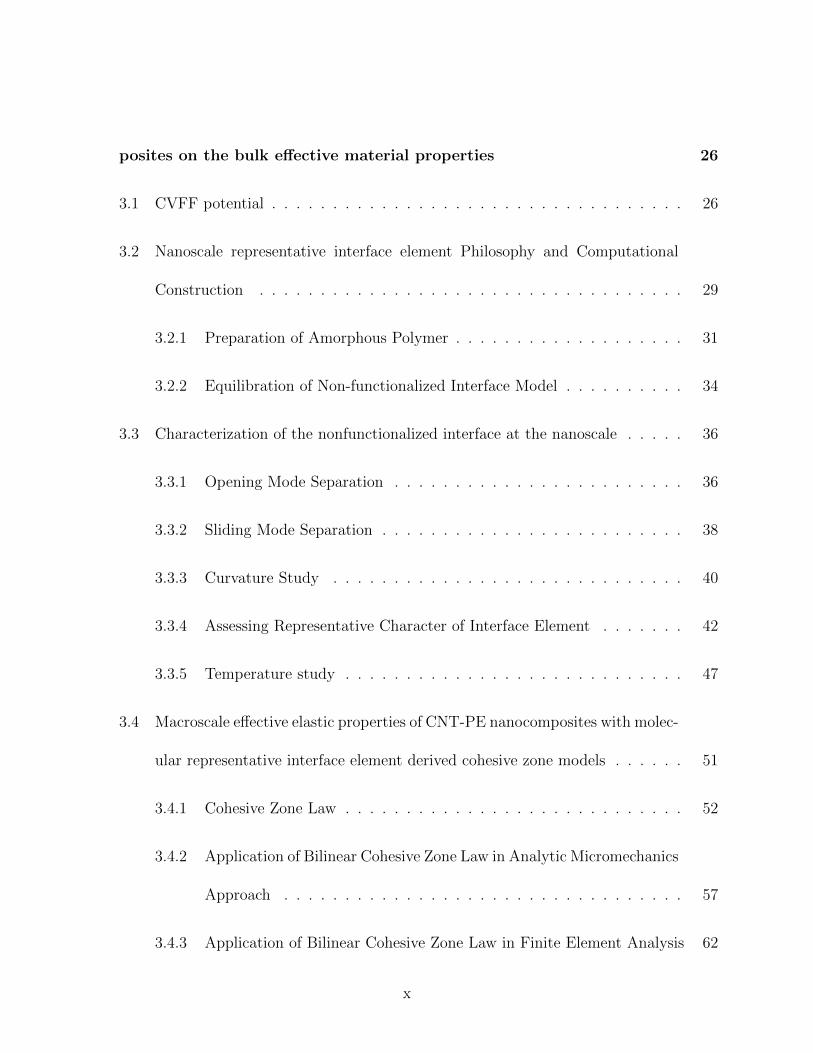
posites on the bulk effective material properties 26
3.1 CVFF potential . . . . . . . . . . . . . . . . . . . . . . . . . . . . . . . . . . 26
3.2 Nanoscale representative interface element Philosophy and Computational
Construction . . . . . . . . . . . . . . . . . . . . . . . . . . . . . . . . . . . 29
3.2.1 Preparation of Amorphous Polymer . . . . . . . . . . . . . . . . . . . 31
3.2.2 Equilibration of Non-functionalized Interface Model . . . . . . . . . . 34
3.3 Characterization of the nonfunctionalized interface at the nanoscale . . . . . 36
3.3.1 Opening Mode Separation . . . . . . . . . . . . . . . . . . . . . . . . 36
3.3.2 Sliding Mode Separation . . . . . . . . . . . . . . . . . . . . . . . . . 38
3.3.3 Curvature Study . . . . . . . . . . . . . . . . . . . . . . . . . . . . . 40
3.3.4 Assessing Representative Character of Interface Element . . . . . . . 42
3.3.5 Temperature study . . . . . . . . . . . . . . . . . . . . . . . . . . . . 47
3.4 Macroscale effective elastic properties of CNT-PE nanocomposites with molec-
ular representative interface element derived cohesive zone models . . . . . . 51
3.4.1 Cohesive Zone Law . . . . . . . . . . . . . . . . . . . . . . . . . . . . 52
3.4.2 Application of Bilinear Cohesive Zone Law in Analytic Micromechanics
Approach . . . . . . . . . . . . . . . . . . . . . . . . . . . . . . . . . 57
3.4.3 Application of Bilinear Cohesive Zone Law in Finite Element Analysis 62
x
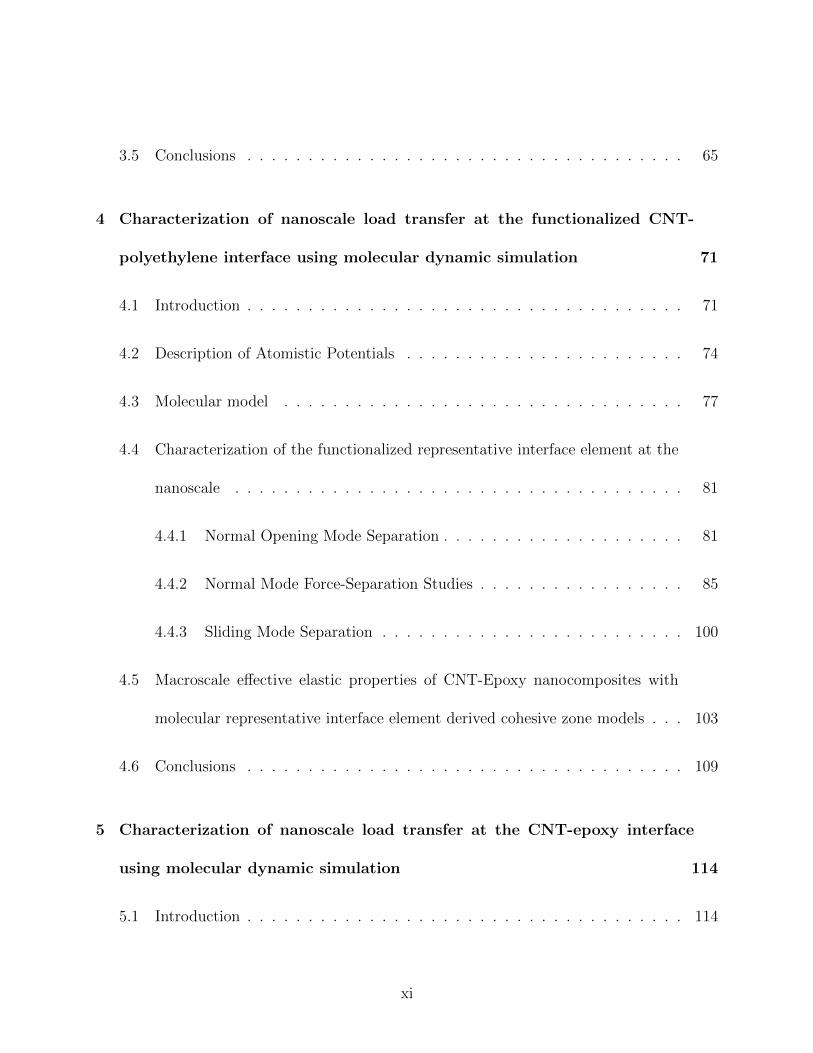
3.5 Conclusions . . . . . . . . . . . . . . . . . . . . . . . . . . . . . . . . . . . . 65
4 Characterization of nanoscale load transfer at the functionalized CNT-
polyethylene interface using molecular dynamic simulation 71
4.1 Introduction . . . . . . . . . . . . . . . . . . . . . . . . . . . . . . . . . . . . 71
4.2 Description of Atomistic Potentials . . . . . . . . . . . . . . . . . . . . . . . 74
4.3 Molecular model . . . . . . . . . . . . . . . . . . . . . . . . . . . . . . . . . 77
4.4 Characterization of the functionalized representative interface element at the
nanoscale . . . . . . . . . . . . . . . . . . . . . . . . . . . . . . . . . . . . . 81
4.4.1 Normal Opening Mode Separation . . . . . . . . . . . . . . . . . . . . 81
4.4.2 Normal Mode Force-Separation Studies . . . . . . . . . . . . . . . . . 85
4.4.3 Sliding Mode Separation . . . . . . . . . . . . . . . . . . . . . . . . . 100
4.5 Macroscale effective elastic properties of CNT-Epoxy nanocomposites with
molecular representative interface element derived cohesive zone models . . . 103
4.6 Conclusions . . . . . . . . . . . . . . . . . . . . . . . . . . . . . . . . . . . . 109
5 Characterization of nanoscale load transfer at the CNT-epoxy interface
using molecular dynamic simulation 114
5.1 Introduction . . . . . . . . . . . . . . . . . . . . . . . . . . . . . . . . . . . . 114
xi
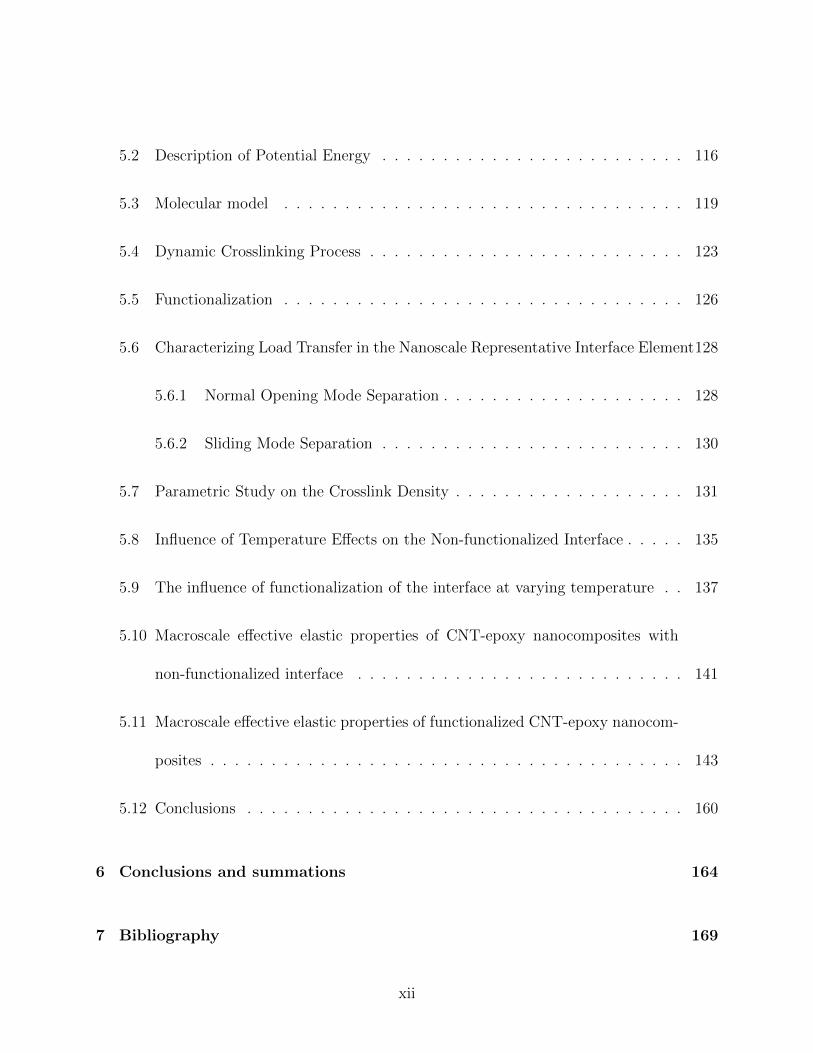
5.2 Description of Potential Energy . . . . . . . . . . . . . . . . . . . . . . . . . 116
5.3 Molecular model . . . . . . . . . . . . . . . . . . . . . . . . . . . . . . . . . 119
5.4 Dynamic Crosslinking Process . . . . . . . . . . . . . . . . . . . . . . . . . . 123
5.5 Functionalization . . . . . . . . . . . . . . . . . . . . . . . . . . . . . . . . . 126
5.6 Characterizing Load Transfer in the Nanoscale Representative Interface Element128
5.6.1 Normal Opening Mode Separation . . . . . . . . . . . . . . . . . . . . 128
5.6.2 Sliding Mode Separation . . . . . . . . . . . . . . . . . . . . . . . . . 130
5.7 Parametric Study on the Crosslink Density . . . . . . . . . . . . . . . . . . . 131
5.8 Influence of Temperature Effects on the Non-functionalized Interface . . . . . 135
5.9 The influence of functionalization of the interface at varying temperature . . 137
5.10 Macroscale effective elastic properties of CNT-epoxy nanocomposites with
non-functionalized interface . . . . . . . . . . . . . . . . . . . . . . . . . . . 141
5.11 Macroscale effective elastic properties of functionalized CNT-epoxy nanocom-
posites . . . . . . . . . . . . . . . . . . . . . . . . . . . . . . . . . . . . . . . 143
5.12 Conclusions . . . . . . . . . . . . . . . . . . . . . . . . . . . . . . . . . . . . 160
6 Conclusions and summations 164
7 Bibliography 169
xii

A Parameters for CVFF 183
B Formula of AIREBO 185
xiii
List of Figures
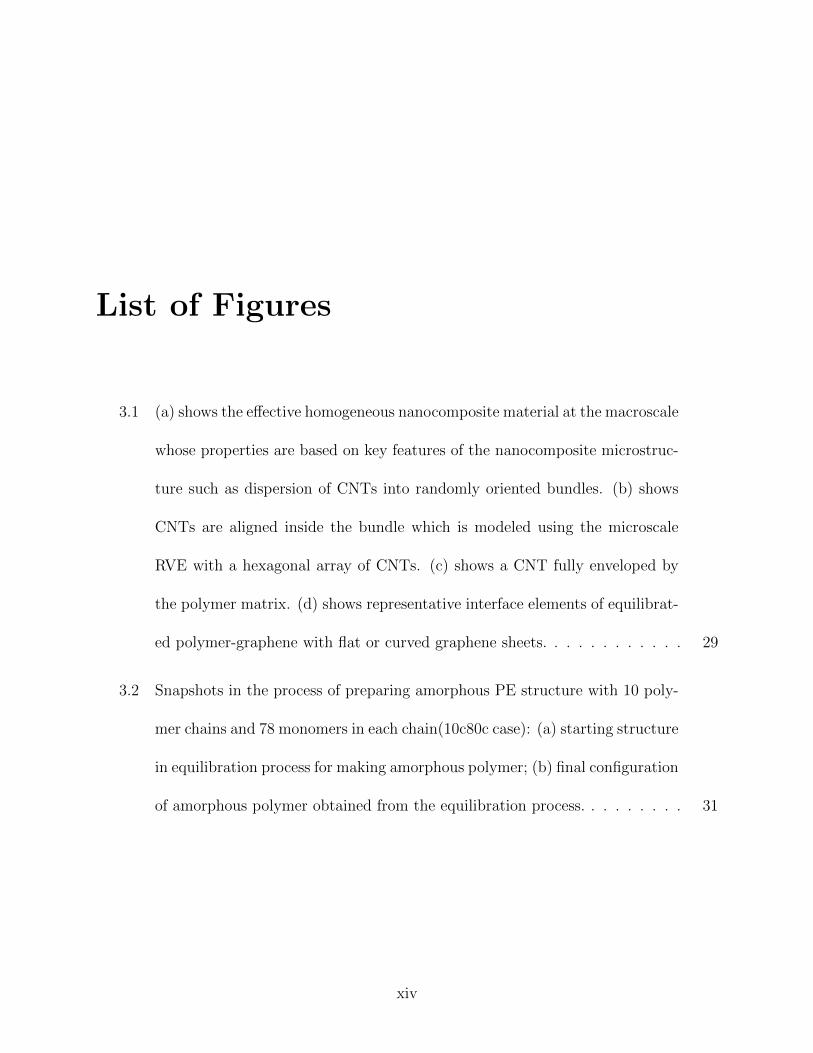
3.1 (a) shows the effective homogeneous nanocomposite material at the macroscale
whose properties are based on key features of the nanocomposite microstruc-
ture such as dispersion of CNTs into randomly oriented bundles. (b) shows
CNTs are aligned inside the bundle which is modeled using the microscale
RVE with a hexagonal array of CNTs. (c) shows a CNT fully enveloped by
the polymer matrix. (d) shows representative interface elements of equilibrat-
ed polymer-graphene with flat or curved graphene sheets. . . . . . . . . . . . 29
3.2 Snapshots in the process of preparing amorphous PE structure with 10 poly-
mer chains and 78 monomers in each chain(10c80c case): (a) starting structure
in equilibration process for making amorphous polymer; (b) final configuration
of amorphous polymer obtained from the equilibration process. . . . . . . . . 31
xiv
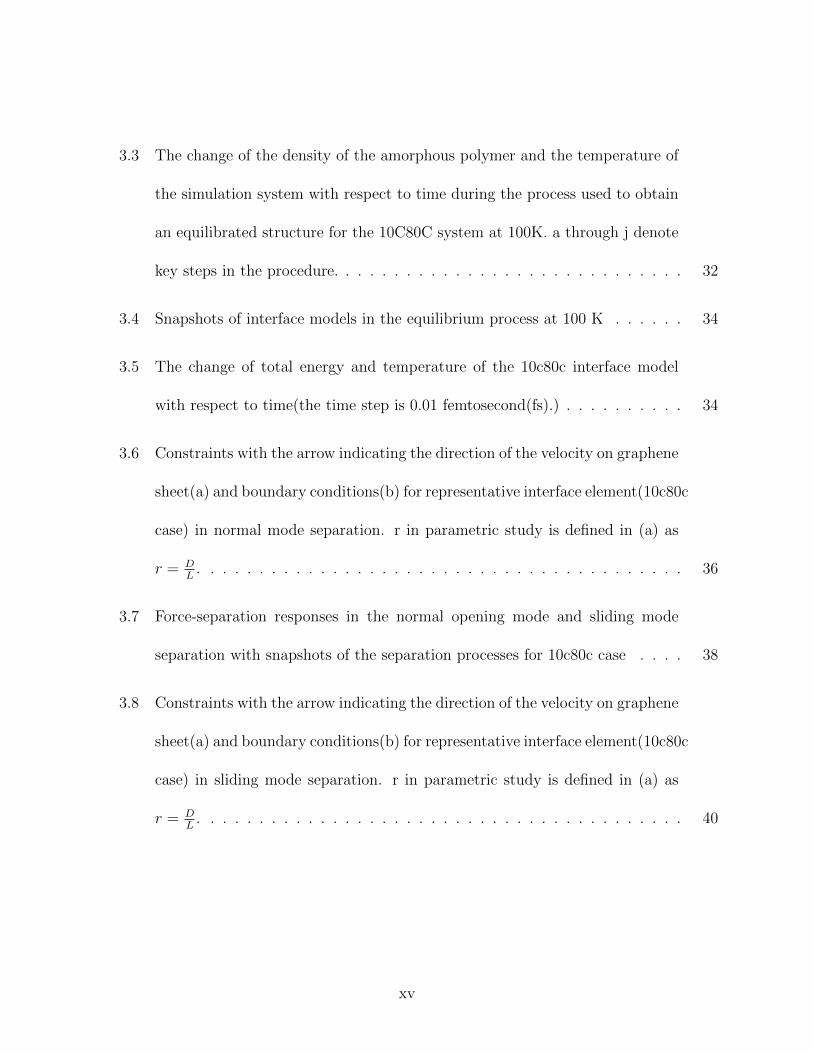
3.3 The change of the density of the amorphous polymer and the temperature of
the simulation system with respect to time during the process used to obtain
an equilibrated structure for the 10C80C system at 100K. a through j denote
key steps in the procedure. . . . . . . . . . . . . . . . . . . . . . . . . . . . . 32
3.4 Snapshots of interface models in the equilibrium process at 100 K . . . . . . 34
3.5 The change of total energy and temperature of the 10c80c interface model
with respect to time(the time step is 0.01 femtosecond(fs).) . . . . . . . . . . 34
3.6 Constraints with the arrow indicating the direction of the velocity on graphene
sheet(a) and boundary conditions(b) for representative interface element(10c80c
case) in normal mode separation. r in parametric study is defined in (a) as
r = DL
. . . . . . . . . . . . . . . . . . . . . . . . . . . . . . . . . . . . . . . . 36
3.7 Force-separation responses in the normal opening mode and sliding mode
separation with snapshots of the separation processes for 10c80c case . . . . 38
3.8 Constraints with the arrow indicating the direction of the velocity on graphene
sheet(a) and boundary conditions(b) for representative interface element(10c80c
case) in sliding mode separation. r in parametric study is defined in (a) as
r = DL
. . . . . . . . . . . . . . . . . . . . . . . . . . . . . . . . . . . . . . . . 40
xv
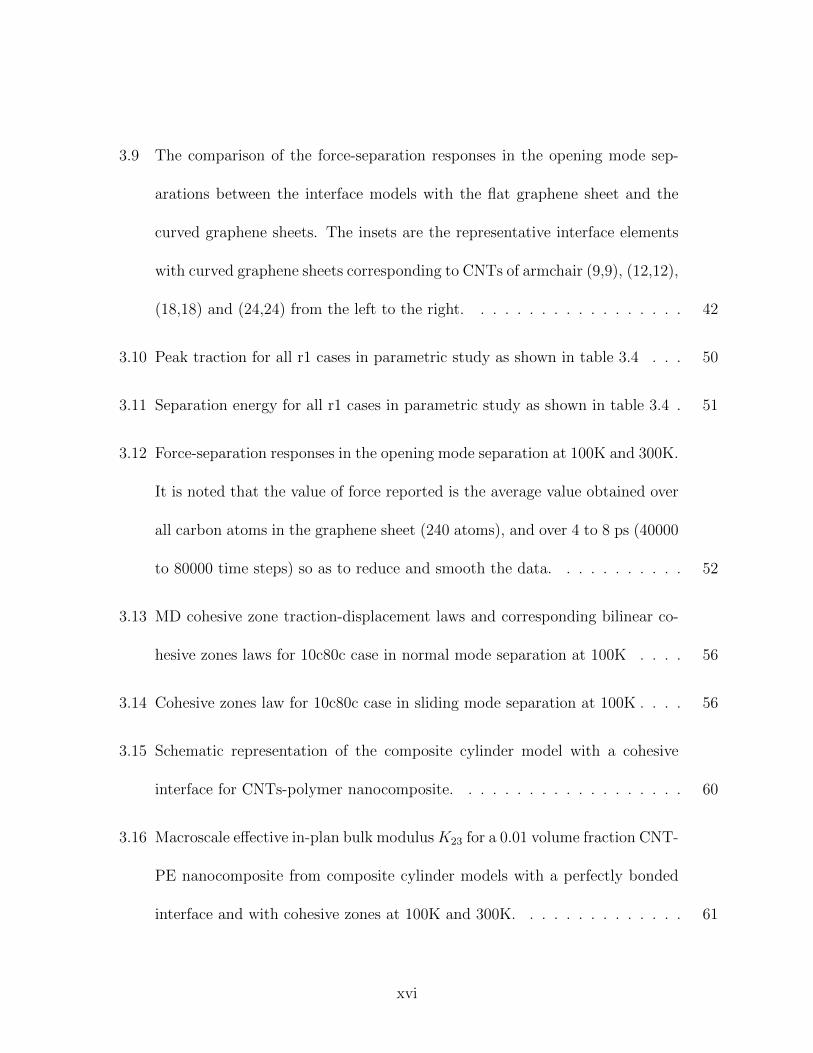
3.9 The comparison of the force-separation responses in the opening mode sep-
arations between the interface models with the flat graphene sheet and the
curved graphene sheets. The insets are the representative interface elements
with curved graphene sheets corresponding to CNTs of armchair (9,9), (12,12),
(18,18) and (24,24) from the left to the right. . . . . . . . . . . . . . . . . . 42
3.10 Peak traction for all r1 cases in parametric study as shown in table 3.4 . . . 50
3.11 Separation energy for all r1 cases in parametric study as shown in table 3.4 . 51
3.12 Force-separation responses in the opening mode separation at 100K and 300K.
It is noted that the value of force reported is the average value obtained over
all carbon atoms in the graphene sheet (240 atoms), and over 4 to 8 ps (40000
to 80000 time steps) so as to reduce and smooth the data. . . . . . . . . . . 52
3.13 MD cohesive zone traction-displacement laws and corresponding bilinear co-
hesive zones laws for 10c80c case in normal mode separation at 100K . . . . 56
3.14 Cohesive zones law for 10c80c case in sliding mode separation at 100K . . . . 56
3.15 Schematic representation of the composite cylinder model with a cohesive
interface for CNTs-polymer nanocomposite. . . . . . . . . . . . . . . . . . . 60
3.16 Macroscale effective in-plan bulk modulusK23 for a 0.01 volume fraction CNT-
PE nanocomposite from composite cylinder models with a perfectly bonded
interface and with cohesive zones at 100K and 300K. . . . . . . . . . . . . . 61
xvi
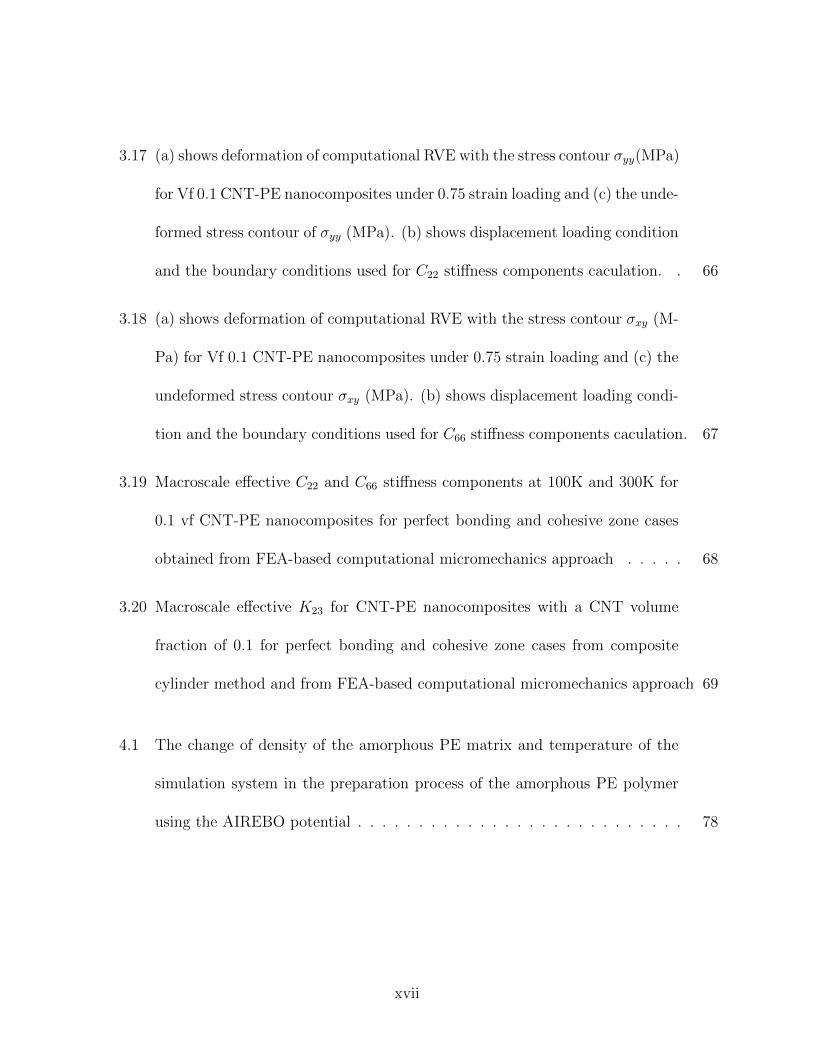
3.17 (a) shows deformation of computational RVE with the stress contour σyy(MPa)
for Vf 0.1 CNT-PE nanocomposites under 0.75 strain loading and (c) the unde-
formed stress contour of σyy (MPa). (b) shows displacement loading condition
and the boundary conditions used for C22 stiffness components caculation. . 66
3.18 (a) shows deformation of computational RVE with the stress contour σxy (M-
Pa) for Vf 0.1 CNT-PE nanocomposites under 0.75 strain loading and (c) the
undeformed stress contour σxy (MPa). (b) shows displacement loading condi-
tion and the boundary conditions used for C66 stiffness components caculation. 67
3.19 Macroscale effective C22 and C66 stiffness components at 100K and 300K for
0.1 vf CNT-PE nanocomposites for perfect bonding and cohesive zone cases
obtained from FEA-based computational micromechanics approach . . . . . 68
3.20 Macroscale effective K23 for CNT-PE nanocomposites with a CNT volume
fraction of 0.1 for perfect bonding and cohesive zone cases from composite
cylinder method and from FEA-based computational micromechanics approach 69
4.1 The change of density of the amorphous PE matrix and temperature of the
simulation system in the preparation process of the amorphous PE polymer
using the AIREBO potential . . . . . . . . . . . . . . . . . . . . . . . . . . . 78
xvii
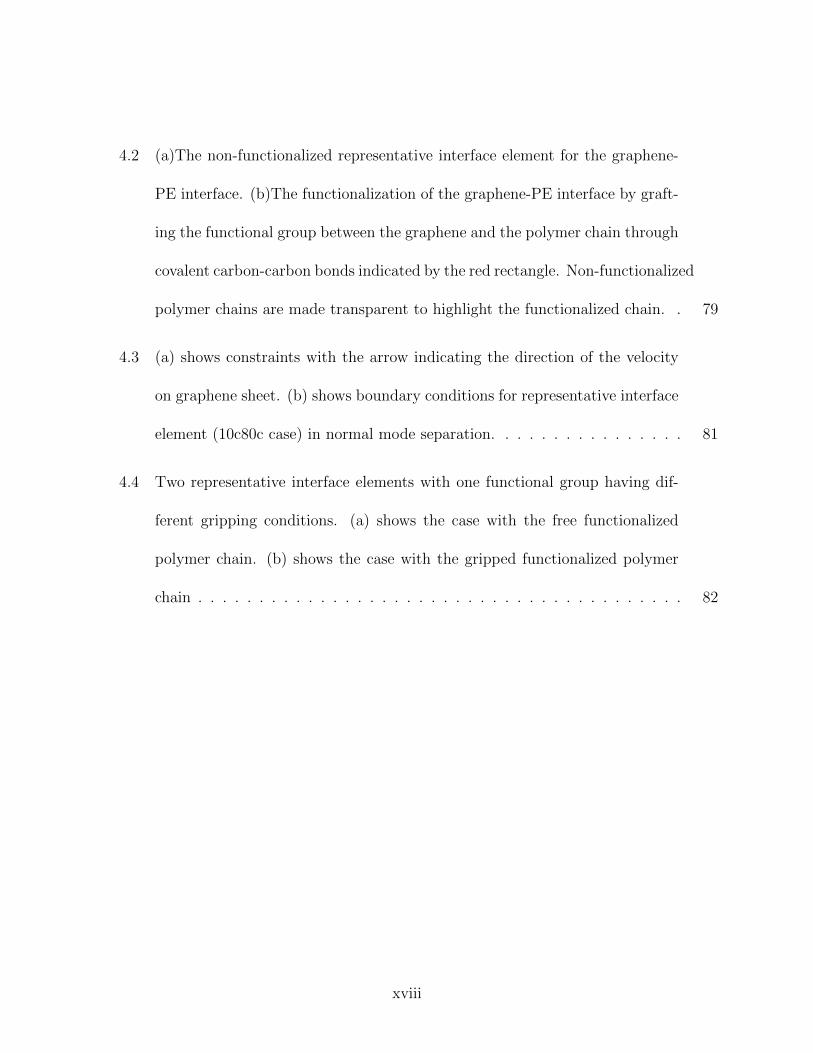
4.2 (a)The non-functionalized representative interface element for the graphene-
PE interface. (b)The functionalization of the graphene-PE interface by graft-
ing the functional group between the graphene and the polymer chain through
covalent carbon-carbon bonds indicated by the red rectangle. Non-functionalized
polymer chains are made transparent to highlight the functionalized chain. . 79
4.3 (a) shows constraints with the arrow indicating the direction of the velocity
on graphene sheet. (b) shows boundary conditions for representative interface
element (10c80c case) in normal mode separation. . . . . . . . . . . . . . . . 81
4.4 Two representative interface elements with one functional group having dif-
ferent gripping conditions. (a) shows the case with the free functionalized
polymer chain. (b) shows the case with the gripped functionalized polymer
chain . . . . . . . . . . . . . . . . . . . . . . . . . . . . . . . . . . . . . . . . 82
xviii
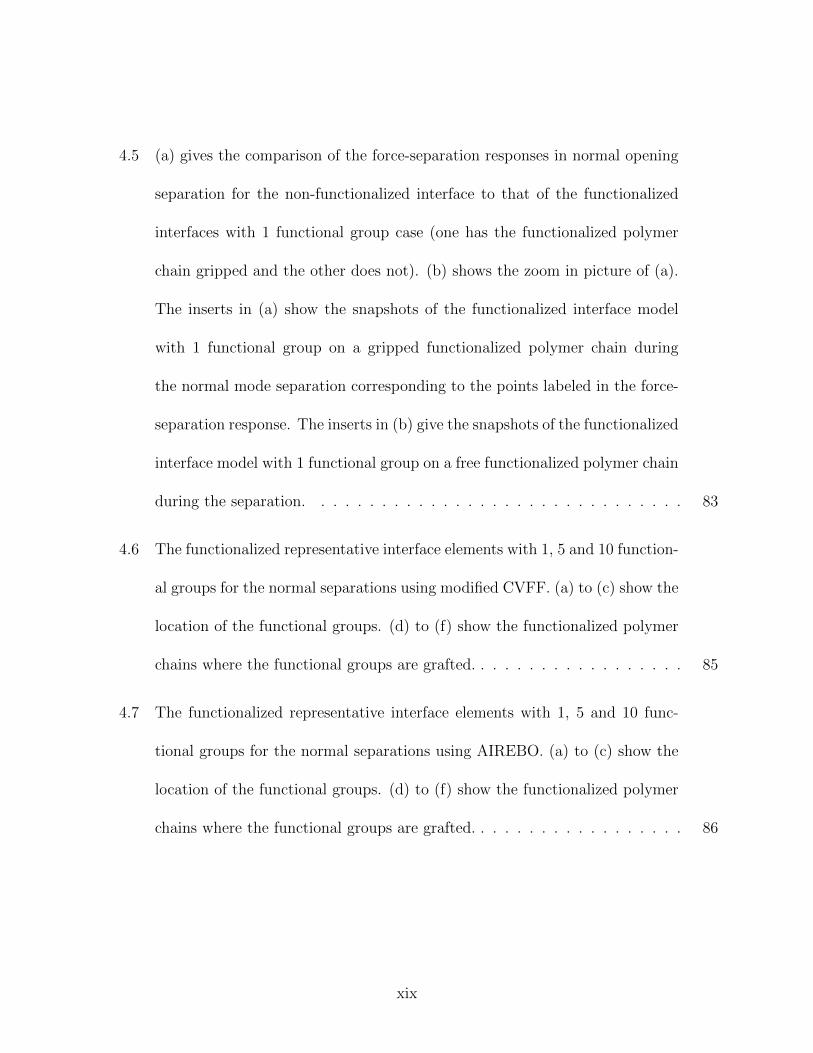
4.5 (a) gives the comparison of the force-separation responses in normal opening
separation for the non-functionalized interface to that of the functionalized
interfaces with 1 functional group case (one has the functionalized polymer
chain gripped and the other does not). (b) shows the zoom in picture of (a).
The inserts in (a) show the snapshots of the functionalized interface model
with 1 functional group on a gripped functionalized polymer chain during
the normal mode separation corresponding to the points labeled in the force-
separation response. The inserts in (b) give the snapshots of the functionalized
interface model with 1 functional group on a free functionalized polymer chain
during the separation. . . . . . . . . . . . . . . . . . . . . . . . . . . . . . . 83
4.6 The functionalized representative interface elements with 1, 5 and 10 function-
al groups for the normal separations using modified CVFF. (a) to (c) show the
location of the functional groups. (d) to (f) show the functionalized polymer
chains where the functional groups are grafted. . . . . . . . . . . . . . . . . . 85
4.7 The functionalized representative interface elements with 1, 5 and 10 func-
tional groups for the normal separations using AIREBO. (a) to (c) show the
location of the functional groups. (d) to (f) show the functionalized polymer
chains where the functional groups are grafted. . . . . . . . . . . . . . . . . . 86
xix
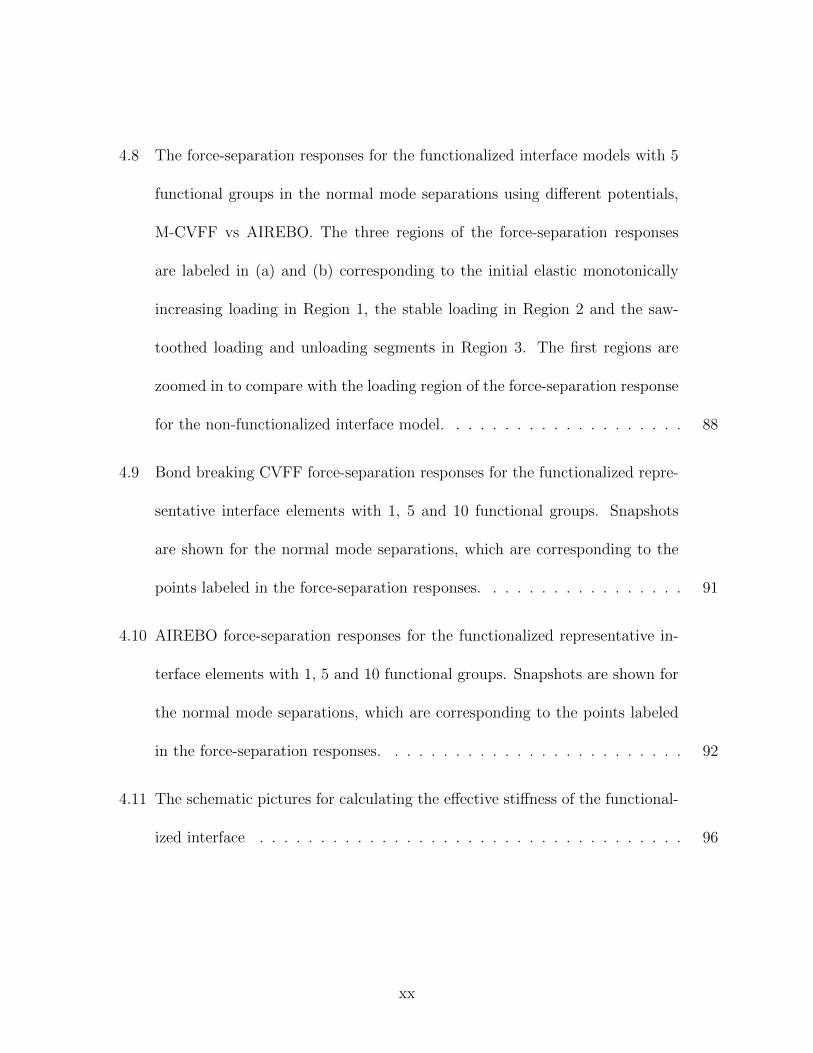
4.8 The force-separation responses for the functionalized interface models with 5
functional groups in the normal mode separations using different potentials,
M-CVFF vs AIREBO. The three regions of the force-separation responses
are labeled in (a) and (b) corresponding to the initial elastic monotonically
increasing loading in Region 1, the stable loading in Region 2 and the saw-
toothed loading and unloading segments in Region 3. The first regions are
zoomed in to compare with the loading region of the force-separation response
for the non-functionalized interface model. . . . . . . . . . . . . . . . . . . . 88
4.9 Bond breaking CVFF force-separation responses for the functionalized repre-
sentative interface elements with 1, 5 and 10 functional groups. Snapshots
are shown for the normal mode separations, which are corresponding to the
points labeled in the force-separation responses. . . . . . . . . . . . . . . . . 91
4.10 AIREBO force-separation responses for the functionalized representative in-
terface elements with 1, 5 and 10 functional groups. Snapshots are shown for
the normal mode separations, which are corresponding to the points labeled
in the force-separation responses. . . . . . . . . . . . . . . . . . . . . . . . . 92
4.11 The schematic pictures for calculating the effective stiffness of the functional-
ized interface . . . . . . . . . . . . . . . . . . . . . . . . . . . . . . . . . . . 96
xx
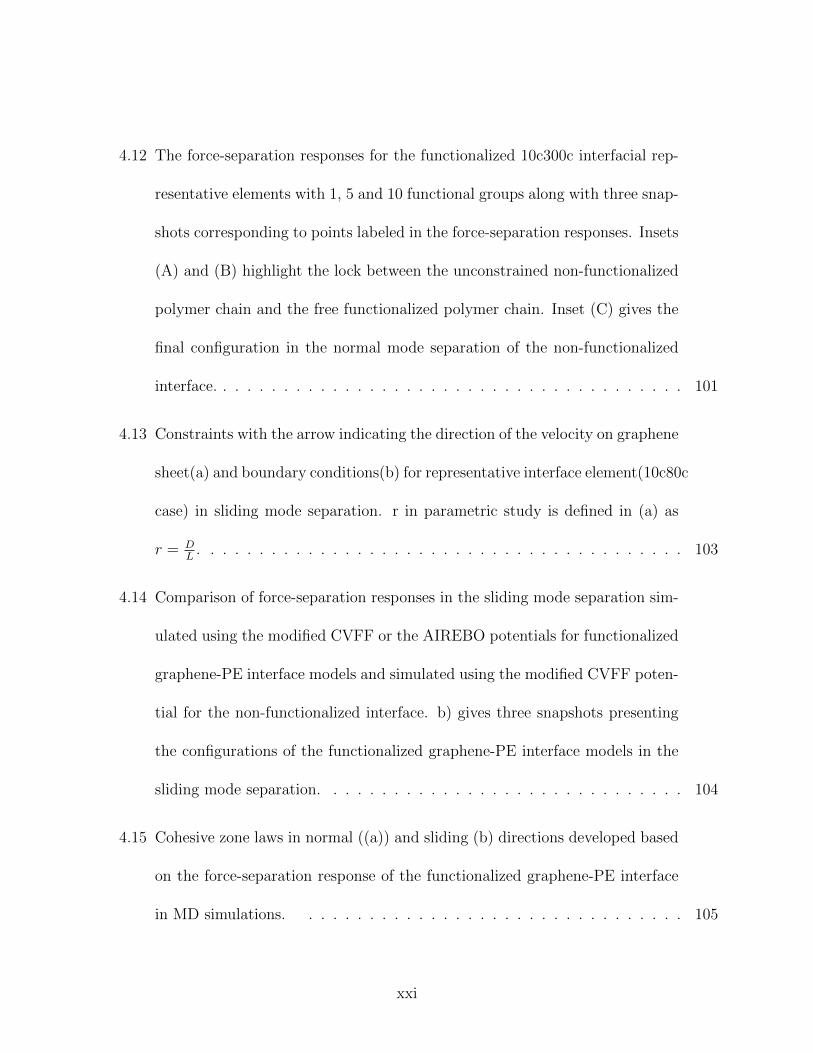
4.12 The force-separation responses for the functionalized 10c300c interfacial rep-
resentative elements with 1, 5 and 10 functional groups along with three snap-
shots corresponding to points labeled in the force-separation responses. Insets
(A) and (B) highlight the lock between the unconstrained non-functionalized
polymer chain and the free functionalized polymer chain. Inset (C) gives the
final configuration in the normal mode separation of the non-functionalized
interface. . . . . . . . . . . . . . . . . . . . . . . . . . . . . . . . . . . . . . . 101
4.13 Constraints with the arrow indicating the direction of the velocity on graphene
sheet(a) and boundary conditions(b) for representative interface element(10c80c
case) in sliding mode separation. r in parametric study is defined in (a) as
r = DL
. . . . . . . . . . . . . . . . . . . . . . . . . . . . . . . . . . . . . . . . 103
4.14 Comparison of force-separation responses in the sliding mode separation sim-
ulated using the modified CVFF or the AIREBO potentials for functionalized
graphene-PE interface models and simulated using the modified CVFF poten-
tial for the non-functionalized interface. b) gives three snapshots presenting
the configurations of the functionalized graphene-PE interface models in the
sliding mode separation. . . . . . . . . . . . . . . . . . . . . . . . . . . . . . 104
4.15 Cohesive zone laws in normal ((a)) and sliding (b) directions developed based
on the force-separation response of the functionalized graphene-PE interface
in MD simulations. . . . . . . . . . . . . . . . . . . . . . . . . . . . . . . . 105
xxi
4.16 The deformation of computational RVE with the stress contour σyy(Pa) for
Vf 0.1 CNT-PE nanocomposites under strain loading and. . . . . . . . . . . 109
4.17 Macroscale effective C22 stiffness component at 100K for 0.1 vf CNT-PE
nanocomposites for perfect bonding and cohesive zone cases with non-functionalized
or functionalized interface obtained from FEA-based computational microme-
chanics approach . . . . . . . . . . . . . . . . . . . . . . . . . . . . . . . . . 110
5.1 The atomistic structures of (a)Epon 862 monomers and (b)DETDA hardener
with the labels of atomic types as described in Table 5.1 and reactive pairs. . 119
5.2 (a) shows the initial configuration of the 3 segments system modeled. (b)
shows the initial state of 12/6 system obtained by combining the 3 chains
systems with different translations and rotations. . . . . . . . . . . . . . . . 120
5.3 The change of the density of the mixed Epon monomers and the hardeners
and the temperature of the simulation system with respect to time during the
preparing process at 100K. a through k denote key steps in the procedure. (A)
gives the amorphous polymer structure and (B) gives the prepared equilibrium
interface model . . . . . . . . . . . . . . . . . . . . . . . . . . . . . . . . . . 121
xxii
5.4 The crosslinking reaction for the reactive pairs in the EPON 862 monomers
and DETDA hardener, the epoxide ends and amines in the left. The C-O and
N-H bonds are debonded during the crosslinking process. The new C-N and
O-H bonds are formed to create an epoxy network. One type of R1 and R2
can be the parts of EPON 862 monomer and DETDA hardener inside the red
boxes as shown in Figure 5.2. . . . . . . . . . . . . . . . . . . . . . . . . . . 124
5.5 The flowchart of the algorithm designed for the crosslinking process . . . . . 144
5.6 The configuration of the graphene sheet with the grafted functional groups
having amine groups labeled by the red rectangles. . . . . . . . . . . . . . . 145
5.7 Constraints with the arrow indicating the direction of the velocity on graphene
sheet(a) and boundary conditions(b) for representative interface element(10c80c
case) in normal mode separation. r in parametric study is defined in (a) as
r = DL
. . . . . . . . . . . . . . . . . . . . . . . . . . . . . . . . . . . . . . . . 145
5.8 The comparison of force-separation responses for the normal mode separation
of the non-functionalized graphene-epoxy interface models with crosslink den-
sity of 53% and 86%. (A) and (H) give the snapshots of the non-functionalized
graphene-epoxy interface models during the normal mode separation corre-
sponding to the points labeled in the force-separation responses. . . . . . . 146
xxiii
5.9 Constraints with the arrow indicating the direction of the velocity on graphene
sheet(a) and boundary conditions(b) for representative interface element(10c80c
case) in sliding mode separation. r in parametric study is defined in (a) as
r = DL
. . . . . . . . . . . . . . . . . . . . . . . . . . . . . . . . . . . . . . . . 147
5.10 Traction-separation responses for the sliding mode and normal opening mode
separations(a) of the non-functionalized graphene-epoxy interface models with
snapshots for the sliding mode separation (b). . . . . . . . . . . . . . . . . . 148
5.11 The density profiles of the non-functionalized and functionalized graphene-
epoxy representative interface elements with various crosslink densites in the
z dimension. . . . . . . . . . . . . . . . . . . . . . . . . . . . . . . . . . . . 149
5.12 The distribution of the crosslinks in the epoxy polymer matrix along the z
dimension inside the non-functionalized and functionalized graphene-epoxy
representative interface elements with various crosslink densites. . . . . . . 149
5.13 The normal mode traction-separation responses for the non-functionalized
graphene-PE interface models with different length of polymer chains (80 vs
300) and the non-functionalized graphene-epoxy interface models with differ-
ent crosslink densities (53% vs 86%). . . . . . . . . . . . . . . . . . . . . . . 150
5.14 Comparison of normal mode force-separation responses at 300K and 100K for
the graphene-epoxy interface models with crosslink density of 53% and 86%. 150
xxiv
5.15 Normal mode force-separation responses for the functionalized and non-functionalized
graphene-epoxy interface models with 86% crosslinked epoxy polymer at 100K
and 300K. Snapshots corresponding to points labeled in the force-separation
responses are shown in (b) and (c) . . . . . . . . . . . . . . . . . . . . . . . 151
5.16 Comparison of normal mode traction-separation responses at 100K for the
functionalized graphene-epoxy interface model with crosslink density of 86%
and and the functionalized graphene-PE interface model. . . . . . . . . . . . 152
5.17 MD cohesive zone traction-displacement laws and corresponding bilinear co-
hesive zones laws for the graphene-epoxy interface in normal and sliding mode
separation at 100K . . . . . . . . . . . . . . . . . . . . . . . . . . . . . . . . 153
5.18 (a) shows deformation of computational RVE with the stress contour σyy(MPa)
for Vf 0.1 CNT-epoxy nanocomposites under 0.75 strain loading with the
displacement loading condition and the boundary conditions used for C22 s-
tiffness components calculation and (b) shows deformation of computational
RVE with the stress contour σxy(MPa) for Vf 0.1 CNT-epoxy nanocompos-
ites under 0.75 strain loading with displacement loading condition and the
boundary conditions used for C66 stiffness components calculation. . . . . . 154
5.19 Macroscale effective C22 and C66 stiffness components at 100K and 300K for
0.1 vf CNT-epoxy nanocomposites for perfect bonding and cohesive zone cases
obtained from FEA-based computational micromechanics approach . . . . . 155
xxv
5.20 Macroscale effective K23 for CNT-epoxy nanocomposites with a CNT volume
fraction of 0.1 for perfect bonding and cohesive zone cases from FEA-based
computational micromechanics approach at 100K and 300K . . . . . . . . . 156
5.21 Cohesive zone law developed based on the force-separation response of the
functionalized graphene-epoxy interface in MD simulations. . . . . . . . . . 157
5.22 The deformation of computational RVE with the stress contour σyy(Pa) for
Vf 0.1 CNT-epoxy nanocomposites under 0.24 strain loading. . . . . . . . . 159
5.23 Macroscale effective C22 stiffness component at 100K for 0.1 vf functional-
ized CNT-epoxy nanocomposites for perfect bonding and cohesive zone cases
obtained from FEA-based computational micromechanics approach . . . . . 159
xxvi
List of Tables
3.1 Peak force and separation energy for all cases in curvature study. . . . . . . 41
3.2 Sensitivity tests . . . . . . . . . . . . . . . . . . . . . . . . . . . . . . . . . . 47
3.3 Tortuosity as measured according to equation 3.6 for the three initial config-
urations for a subset of the cases in the parametric study. . . . . . . . . . . . 48
3.4 Peak traction (GPa), separation energy(mJ/m2) and separation distance (A)
for r1 cases . . . . . . . . . . . . . . . . . . . . . . . . . . . . . . . . . . . . 48
3.5 Peak traction (GPa) ,separation energy(mJ/m2) and separation distance (A)
for r2 cases . . . . . . . . . . . . . . . . . . . . . . . . . . . . . . . . . . . . 49
3.6 Peak traction (GPa), separation energy(mJ/m2) and separation distance (A)
for r3 cases . . . . . . . . . . . . . . . . . . . . . . . . . . . . . . . . . . . . 49
3.7 Averaged peak traction (Gpa) and averaged separation energy(mJ/m2) for
each case over r1, r2 and r3. . . . . . . . . . . . . . . . . . . . . . . . . . . . 50
xxvii
3.8 Reduction ofK23 in analytic (CCM) and computational micromechanics (FEA)
for cohesive zone model with respect to the perfect bonding model for 0.01, 0.1,
and 0.5 volume fraction. Values are reported in terms of loading/unloading
stages. . . . . . . . . . . . . . . . . . . . . . . . . . . . . . . . . . . . . . . 61
3.9 Reduction of C22 and C66 in computational micromechanics (FEA) for cohe-
sive zone model with respect to the perfect bonding model for 0.1, and 0.5
volume fraction. Values are reported in terms of loading/unloading stages. . 64
4.1 Overall Peak force (pN) during the normal mode separation for 10c80c and
10c300c cases. N indicates the number of functional groups in the represen-
tative interface elements. . . . . . . . . . . . . . . . . . . . . . . . . . . . . . 97
4.2 Separation energy (mJ/m2) for 10c80c and 10c300c cases. N indicates the
number of functional groups in the representative interface elements . . . . . 98
5.1 Atom types in EPON 862 and DETDA. . . . . . . . . . . . . . . . . . . . . 119
5.2 The stiffness and the equilibrium bond lengthes of the newly formed C-N
bonds and O-H bonds in each step of the multiple-step relaxation. . . . . . . 125
5.3 Peak force (pN) , separation energy (mJ/m2) and separation distance (A)for
all non-functionalized realizations at 100K and 300K . . . . . . . . . . . . . 136
5.4 Strain energy failure criteria for covalent bonds. . . . . . . . . . . . . . . . . 138
xxviii
5.5 Reduction of C22 and C66 in computational micromechanics (FEA) for cohe-
sive zone model with respect to the perfect bonding model for 0.1, and 0.5
volume fraction. Values are reported in terms of loading/unloading stages. . 143
A.1 CVFF parameters used in the graphene-PE interface model . . . . . . . . . . 184
xxix
Chapter 1
Introduction
1.1 Carbon Nanotubes
Since first reported by Iijima in 1991, carbon nanotubes (CNT) have been one of the hottest
research topics because of their exceptionally high stiffness, strength, flexibility as well as
superior electrical and thermal properties([1, 2, 3, 4, 5]). CNTs consist of covalently bonded
carbon atoms in a long cylinder shape. The two basic types of CNTs are sinlge-wall carbon
nanotube (SWCNT) and multiwall carbon nanotube (MWCNT). SWCNT is considered as a
single graphene sheet(i.e a single layer of graphite) rolled into a tube at a certain chiral angle
([6]). MWCNT can be similarly considered as SWCNTs stacking with interlayer separations
of around 0.34 nm around the hollow core of the innermost layer ([7]). The density of
SWCNT is about 1.33-1.4 g/cm3, which is smaller than the density of most of nanofillers
1
Yumeng Li Chapter 1. Introduction 2
and just one-half of the density of aluminum ([8]). CNTs are reported to have an axial
tensile modulus in the range of 300 to 1200 GPa (comparable to that of diamond (1.2 TPa))
and axial strength in the range of 10 to 150 GPa (higher than that of high-strength steel
(2 GPa)) ([8]). With the radius on the order of the nanometers and length on the order of
micrometers, CNTs possess high aspect ratios which are beneficial to their use in composites.
In addition to superior mechanical properties, SWCNTs exhibit high thermal conductivity
(> 6000W/(mK)) at room temperature, which is nearly double the thermal conductivity
of diamond of 3320 W/(mK) ([8]). SWCNTs can be either metallic or semi-conduction
depending on the chirality of the tubes as indicated by the orientation of the carbon atoms
around the nanotube circumference ([6]). The three common classifications are arm chair
(which are conducting), zigzag (which are semiconduction)and chiral (which can be either
semi-conducting or conducting). It is thus envisioned that CNTs can improve both the
mechanical as well as the thermal and electrical properties of materials in which they are
embedded making them multifunctional materials.
1.2 CNT-reinforced Nanocomposites
Much interest exists in reinforcing polymer materials using CNTs to gain the improvements
in the mechanical, thermal and electrical properties. As these are expected to be achieved
with minimum weight penalty given the CNTs and polymers have similar densities [9], such
multifunctional improvements in properties are envisioned to be extremely beneficial for the
Yumeng Li Chapter 1. Introduction 3
aerospace structures. With the unique combination of the physical, mechanical, electrical and
thermal properties, CNTs are considered as promising candidates to perhaps even substitute
for conventional micro-scale filler material while imparting multifunctionality to composites
wherein they are a constituent.
A sizable body of work is available in the literature reporting efforts to fabricate and char-
acterize polymer nanocomposites based on SWCNTs and MWCNTs in an effort to take
advantage of their exceptional high stiffness, strength, superior electrical and thermal prop-
erties. For example, in [10] authors obtained the increases in Young’s modulus and hardness
by factors of 1.8 and 1.6 for poly(vinyl alcohol)(PVA)/MWNTs nanocomposites at 1 wt.%
and 2.8 and 2.0 for Poly(9-vinyl carbazole)(PVK)/MWNTs at 8 wt.%. In [11] the authors
dispersed MWNTs homogeneously throughout polystyrene matrices by a simple solution-
evaporation method. Increases in the range of 36% to 42% for the elastic modulus of the
nanocomposites were observed with just 1 wt% addition of CNTs. They also noted that 5
vol% of carbon fibers is needed to increase the polypropylene matrix moduli by the same
extent observed in 1 wt% MWNT samples based on results in [12]. In [13] the authors in-
vestigated properties of low density polyethylene (LDPE) composites reinforced by MWNTs
and reported 89% and 56% increases in the Young’s modulus and tensile strength of the com-
posites with 10 wt% CNTs loading, respectively. In [14] the authors reinforced high density
polyethylene (HDPE) based composites using CNTs at 0.11, 0.22, 0.33 and 0.44 % volume
fraction. It was noted that with increases in the volume fraction of CNTs, a considerable
improvement was achieved in Young’s modulus from 1.169 GPa (6.74% increasing) to 1.338
Yumeng Li Chapter 1. Introduction 4
GPa (22.23%), and in the strength from 105.51 MPa to 109.86 MPa. Glassy and rubbery
epoxy-matrix composites were processed in [15] with the addition of SWCNTs, MWCNTs,
graphite and carbon nanofibers (CNTs) at 1 or 4 wt.%. For the composites with the glassy
or rubbery matrix, 4% SWCNT/epoxy exhibited approximately the highest tensile modu-
lus increasing by about 11% and 134% in the glassy and rubbery phases, respectively. In
[16] the authors reinforced an epoxy matrix using 0.1 wt.% addition of CNTs with variable
lengths ranging from 503 to 2091 nm. It was found that nanocomposites containing long
carbon nanotubes (2091 and 1689 nm) exhibited better mechanical properties(higher tensile
strength (13-25%), elastic modulus (5-20%), fracture strain and toughness(30-45%)) than
those containing short carbon nanotubes (1332, 992 and 503 nm).
While the CNT-reinforced polymer nanocomposites exhibit promising increases in the me-
chanical properties relative to pure polymer material, the experimental results do not meet
expectations and typically remain far behind the idealized theoretical predictions obtained
from the rule of mixtures and Halpin-Tsai models ([13, 17, 14]). For example, in [13] the
authors observed increases in the tensile modulus of CNT-PE nanocomposties from 0.235
GPa to 0.261 GPa with the addition of 1 wt.%, i.e. 11% increase over the neat PE value,
however the rule of mixtures would predict the modulus to be 1.23 GPa at this loading of C-
NTs (assuming well dispersed and the modulus of MWNTs is 1 TPa). Significant effort has
been dedicated toward experimentally identifying critical conditions for fabricating CNT-
reinforced nanocomposites able to match the theoretical expected mechanical performance.
Although CNTs themselves possess extremely high mechanical properties, how to transfer
Yumeng Li Chapter 1. Introduction 5
their properties to the nanocomposites and produce a better macroscale effective materi-
al properties remain an issue. In addition to the properties of the individual constituents,
several factors have been identified to be critical for the mechanical performance of the CNT-
reinforced nanocomposites, such as the alignment and the dispersion of the CNTs as well as
the interface between the CNTs and matrix material. In [18] the authors fabricated linear
low density polyethylene (LLDPE) matrix composites reinforced by 2 wt% MWNTs through
an extrusion process to achieve a degree of alignment of the CNTs. The composites panels
were formed by stacking the extruded filaments into layers in a unidirectional fashion and
tested under tension in the longitudinal as well as the transverse directions relative to the
extrusion direction. The tensile strength and modulus of the composites was observed to
increase by about 34 and 38 % in longitudinal directions, but decreased by about 20.2 and
9.47 % in the transverse direction relative to the neat LLDPE thereby demonstrating the
alignment of nanotubes in the composites and their reinforcement effects along the extru-
sion direction. Methods have been proposed to achieve better dispersion of CNTs in the
nanocomposites, e.g. ultrasonication, solution mixing of a suspension of CNTs in dissolved
polymer, mechanical blending of CNTs and melted polymers and in situ polymerization of
monomers with CNTs [8, 19, 20, 21, 22]. In [23] the authors prepared MWCNT/HDPE
composites by using immobilized catalyst and reported greatly enhanced mechanical prop-
erties, 359% and 281% increases in the Young’s modulus with respect to the reference PE
and mechanically blended MWCNT/PE composite, respectively, which were believed to be
attributed to the better dispersion of CNTs.
Yumeng Li Chapter 1. Introduction 6
Given their large surface area to volume ratio, the interfacial interaction is a crucial issue
governing the effective material properties of CNT/polymer nanocomposites [24]. From the
processing point of view, the surface modification of the CNTs assists their exfoliation from
CNT bundles to individual CNTs by offering repulsive forces between tubes which helps to
uniformly disperse them in a polymer matrix in order to maximize the contact surface with
the matrix [25]. In addition to governing dispersion, the interface between the CNTs and
the polymer matrix is widely believed to be a significant factor affecting the load transfer
from the matrix to CNTs, which is critical to fully take advantage of the superb properties
of CNTs, and thereby directly impacts nanocomposites mechanical properties [26]. Without
proper treatments of the interface, poor load transfer between the polymer matrix and C-
NTs has been observed to impact the macroscale mechanical properties of the CNT-polymer
nanocomposites resulting in the large difference between the theoretical predictions and the
experimental results [27, 28, 29]. In order to fully exploit the reinforcement ability of CNTs
in the CNT-polymer nanocomposites, it is critical to improve CNT-polymer interfacial prop-
erties, i.e. the efficiency of load transfer at the interface between CNTs and the polymer
matrix. As such, increasing interests exist in research on techniques of engineering the inter-
face to achieve better load-transfer properties ([30, 31, 32]). Functionalization of the surface
of CNTs includes noncovalent and covalent methods. Noncovalent methods include wrap-
ping polymer chains around CNTs or attaching various surfactants to the surface of CNTs
such that only non-covalent bonding interactions occur between the modification molecules
and CNT. One example of introducing a surfactant as the wetting agent is discussed in
Yumeng Li Chapter 1. Introduction 7
[33] wherein it is demonstrated that about a 26% increasing in mechanical properties of
the nanocomposites is achieved with only 1 wt.% addition of CNTs as opposed to an 11%
increase without the surfactant (both with respect to the neat polymer). In covalent meth-
ods of surface functionalization, covalent chemical bonds are formed between the polymer
chains and CNTs in order to enhance the interfacial strength. In [34] the authors fabricated
polymer-MWNTs composite films using PVA or polypropylene as the matrix. In the former
case having PVA matrix, increases in Young’s modulus, tensile strength and toughness were
observed to be 3.7, 4.3 and 1.7 times, respectively, for the nanocomposites with less than 1
wt.% non-functionalized CNTs (i.e. only non-covalent interaction). Crystalline coating of
PVA was noted around the nanotubes in this case, which can be viewed as an interphase
region and is believed to contribute to the improvement of the mechanical properties. In
the latter case, covalent fuctionalization of the CNTs is used in order to achieve better dis-
persions in chlorinated polypropylene. Increases in Young’s modulus, tensile strength and
toughness of 3.1, 3.9 and 4.4, respectively, compared to the non-functionalized nanocompos-
ites values were observed at 1 wt.% nanotube loading levels equivalent to the former case.
Amino-functionalization of CNTs has been applied as a covalent means of improved load
transfer in CNT-epoxy polymer nanocomposites in [30]. There it is reported that a better
dispersion and integration of CNTs in the polymer matrix is achieved resulting in remark-
able improvement in mechanical properties, e.g. 24.6% increase in the elastic modulus with
only 0.5 wt% addition of functionalized CNTs in contrast to only 3.2% increases over the
neat polymer value with non-functionalized CNT. In [35] the authors fabricated epoxy-based
Yumeng Li Chapter 1. Introduction 8
nanocomposites reinforced by CNTs with covalently attached amino groups which allowed
for the ful integration of CNTs into the nanocomposites as the amino group grafted on the
surface can react with the epon resin in the polymer matrix. They reported 30-70% in-
crease in ultimate strength and modulus of the nanocomposites with 1-4 wt% functionalized
SWNTs along with an increased strain to failure.
In order to understand and study the interactions between CNTs and polymer, efforts have
been made to experimentally characterize the interface in CNT-based nanocomposites. Load
transfer properties of nanocomposites with different matrix materials reinforced by CNTs
have been evaluated using atomic force microscope (AFM), transmission electron microscope
(TEM)/nano-manipulation system (NMS) or Raman spectrum measurement [31, 36, 37].
The load transfer in CNT/epoxy nanocomposites with/without functionalization is evaluat-
ed in [31] based on strain-sensitive Raman spectroscopy. Improved load transfer efficiency is
reported by the authors for functionalized CNT/epoxy nanocomposites based on the obser-
vation of higher initial G’-band slope and higher strain corresponding to the shift of G’-band.
However, as these are indirect measurements of the CNT-polymer interaction, no quantita-
tive information was given as to the magnitude of the interfacial strength. In [36] and [37]
the authors measured the interfacial shear strength of CNT-dispersed polymer nanocom-
posites using AFM and reported 47Mpa for MWNT/polyethylene-butene nanocomposites
and 3.7-14Mpa for CNT/PEEK nanocomposites, respectively. However, only a few experi-
ments on direct exploration of the load transfer capability of the CNT-polymer interface in
nanocomposites have been reported and the results exhibit wide variations [37] due to the
Yumeng Li Chapter 1. Introduction 9
reasons as concluded in [38] such as ”(i) the lack of proper direct measuring techniques at
the nanometer scale; (ii) tremendous limitations on the specimen size; (iii) an uncertainty
in the data obtained from indirect measurements; (iv) inadequate preparation techniques of
test specimens and the lack of control over the alignment and distribution of nanotubes.”
Therefore, computational material science techniques and multiscale modeling techniques
are beginning to play a key roll in more systematically investigation of the tailoring of inter-
facial strength at the nanoscale and its corresponding influence on the macroscale mechanical
properties of the CNT-reinforced nanocomposites.
1.3 Nanocomposite Modeling
Given the potential applications across a widely range of industries, there is a need to develop
models to predict the mechanical, thermal and electrical properties of the nanocomposites
for design efforts. A significant amount of effort has been dedicated in particular towards
analytical and numerical studies of the mechanical properties of the CNT-based nanocom-
posites. One of the key challenges is that nanocomposite properties are governed by features
which exist in and interact across a wide range of length scales, from the discrete atomistic
nanometer scale through continuum micro, meso, and macroscales. In this section, current
theories and models are reviewed for addressing material behavior of nanocomposites at the
various length scales.
Many efforts have been dedicated towards analytical and numerical studies of the mechan-
Yumeng Li Chapter 1. Introduction 10
ical properties of the CNT-based nanocomposites using continuum models. In [39, 40] the
authors modeled CNT/polymer nanocomposite using cylindrical, square and hexagonal rep-
resentative volume elements (RVEs), including single short/long CNTs or multiple aligned
CNTs to predict the elastic mechanical properties of nanocomposites using continuum finite
element analysis. Increase of the stiffness of the composites at a volume fraction of 3.6%
in the CNT axial direction was found to be as much as 33% for the case of infinitely long
CNTs, i.e. CNTs which extend the full length of the RVEs used. A large microscale con-
tinuum model with short/long rigid aligned fibers was applied in [41] to model CNT-based
nanocomposites. The effective elastic mechanical material properties of the nanocomposites
were calculated by solving the boundary integral equations using a fast multipole boundary
element method. There it was observed that better reinforcement (i.e. larger increases in
elastic properties) were obtained using long CNTs in the nanocomposite. As some of the very
first works for predicting the properties of nanocomposites, perfect bonding assumptions are
made in these continuum models without considering the effects of interphase or interface
regions between CNTs and polymer matrix in nanocomposites. In [42] and [43] the authors
have studied the effective elastic properties of carbon nanotube reinforced composites and
discussed the influence of the alignment, clustering, and the presence of an interphase region
using both finite element method (FEM) and composite cylinders model (CCM) microme-
chanics techniques. The interphase is a finite thickness region surrounding the CNT where
the local polymer morphology has been perturbed by the CNT presence [44]. In contrast, the
interface is a zero thickness region representing atomic forces responsible for load transfer
Yumeng Li Chapter 1. Introduction 11
between the CNT and polymer. The influence of the interphase with prescribed material
properties is investigated as the third phase in the FEM and CCM models based on contin-
uum mechanics. The calculated moduli match well with the experimental moduli for CNT
reinforced nanocomposites with fairly low volume fractions, but overpredict the observed
experimental values when the volume fraction of CNTs was increased.
Because CNT/polymer nanocomposites consists of polymer molecules and CNTs both of
which have dimensions at the nanoscale, their interactions with each other may highly de-
pend on the local morphologies at the interface. Efforts have been made to model and
characterize the CNT/polymer nanocomposites using molecular dynamic (MD) /molecular
mechanics (MM) simulations to investigate the influence of atomistic details on the con-
tinuum properties of nanocomposites. In [45] the authors have studied and reported the
stress-strain behaviors of CNT-polymer nanocomposites with short and continuous CNTs
in a PE matrix using MD simulation. MD was also used in [46] to calculate the Young’s
modulus of single-wall nanotube (SWCNT)-PE nanocomposites (SWNT volume fraction of
2%), where it was observed that the nanocomposites did not show significant enhancement
relative to pure PE system. In [47] assassination has been made for the thermal and mechan-
ical properties of DGEBA/44DDS epoxy system with/without the addition of CNTs based
on the stress-strain relations calculated using atomistic modeling and MD simulations. A
moderate increase around 18% was observed for the elastic modulus of the DGEBA/44DDS
epoxy resin by adding 11.8 wt.% of SWCNTs. However, it is still controversial to estimate
the bulk material properties using the virial stress at the nanoscale because of arguments
Yumeng Li Chapter 1. Introduction 12
about the equivalence of the virial stress and Cauchy stress [48]. In [49] the authors com-
pared the tensile response and fracture of CNT-based nanocomposites with crystalline and
amorphous PE using MM simulations and observed that the increase in strength is larger
by reinforcing an amorphous PE matrix with a through CNT, which also encompasses the
interface effects, but neglects the influence of the temperature. The mechanical performance
of nanocomposites reinforced by the pristine or functionalized CNTs were studied in [50] us-
ing MD simulations. A huge increase (around 50%) in the Young’s modulus was observed for
the nanocomposites using the functionalized CNTs as the filler as oppose to the unchanged
mechanical properties of the nanocomposites with the pristine CNTs as compared to the
neat crosslinked epoxy. Such observations demonstrate the significant role of the interface in
the enhancement of mechanical properties in nanocomposites. While atomistic simulations
are able to include both non-covalent and covalent interfacial interactions between CNTs
and the polymer matrix in the study of nanocomposites, however pure atomistic studies
are in general limited in the size of the representative volume elements (RVEs) and the
length of simulation time, i.e the number and aspect ratio of CNTs included in the simula-
tion system. Among the few studies towards combing nanoscale and microscale modeling,
an approach linking the nanoscale structure and the macroscale properties was develope-
d in [51, 52]. Therein the idea of an effective continuum fiber is proposed to model the
nanotube, the polymer near the nanotube and the interface between them based the atom-
istic simulations, i.e. homogenizing the interface and interphase along with the CNT into
an effective nanofiber. The effective nanofiber then serves as a link between this so called
Yumeng Li Chapter 1. Introduction 13
equivalent-continuum and micromechanics models to predict the bulk material properties of
SWCNT/polyimide composite systems wherein the micromechanics RVEs can have multiple
CNTs with multiple orientations, e.g. randomly oriented, can be considered in simulations
on continuum time scales. Here again, the comparison with the experimental data is good
for low volume fraction nanocomposites (e.g. less than 0.2% ). It is noted, however, that
the equivalent-truss model applied in the equivalent-continuum modeling does not retain the
effect of the temperature on the interface, and that the homogenization of the effective fiber
does not retain the sensitivity of the interface on the applied load.
In the experimental and computational modeling studies, it has been observed that interface
not only affects the dispersion of CNTs, but also influences the macroscale effective material
by dictating load transfer efficiency and thereby governs the overall mechanical performance
of the nanocomposites. Given the challenges associated with directly probing materials at
the nanoscale, there is increasing interest in and reliance on computational materials science
techniques to characterize the interface between the CNTs and polymer matrix using the
continuum models and atomistic simulation [53, 54, 55]. In analytical studies, most of work
has tried to apply microscale rules developed for microscale fibers in traditonal composites
towards predicting nanocomposites properties [53, 56]. In [53] the authors calculated the in-
terfacial shear strength in CNT-polymer nanocomposites by using the extended Kelly-Tyson
model and reported that the interface may be stronger than the bulk polymer in terms of
sustaining shear. However, microscale modeling assumptions may not be valid when directly
applied to nanoscale structures due to the assumptions like perfect bonding. As the interface
Yumeng Li Chapter 1. Introduction 14
and interphase region involve the polymer chains in the very near vicinity (around 3 nm)
of CNTs, the CNTs interact with the surrounding polymers mainly through vdW forces,
which allows for sliding and debonding of CNTs with respect to the matrix material under
variable loading conditions. In [57] effort has been made to include the vdW interactions
in their model by directly fitting vdW potential to a cohesive zone model and study the
interfacial shear stress by conducing pullout tests. When implemented within the finite el-
ement method (FEM), cohesive zone models are able to simulate interface debonding and
sliding in the composites, however it is difficult to obtain physically meaningful and accurate
cohesive law parameters for the nanoscale interface from continuum studies. A cohesive law,
describing the relation of the normal/shear traction and the opening/sliding displacement
across the interface has been developed in [58] in terms of the area density of CNT and the
volume density of polymer. However, continuum models are basically considering both the
reinforcement and the matrix material as continuum bodies and are using assumptions about
the interface developed for and applicable to microscale continuum fibers. However, by ig-
noring the atomistic details of CNTs and the polymer, the continuum modeling is not able to
observe and characterize the atomistic morphology at the interface around CNTs, and more
importantly, how it evolves under load. As it is believed that the behavior of the interface is
highly dependent on the local atomistic configuration, MD simulations are therefore better
suited in capturing the detailed information about the load transfer at the interface than the
continuum models. Applying MD towards understanding nanoscale load transfer, in [55] and
[46] the authors conducted pullout tests of CNTs in polymer matrix using MD simulations
Yumeng Li Chapter 1. Introduction 15
and reported interfacial shear strengths up to 75 MPa for SWCNT-epoxy resin nanocom-
posites and to around 141.40 MPa for SWCNT-PE nanocomposites. In [54] comparison has
been done for the behavior of polymer-nanotube interface with non-bonded interaction to
the interface with chemical bonds between the nanotube and matrix, and concluded that
the shear strength can be increased for the polymer-nanotube interface by introduction of
a low density of covalent bonds between the matrix and nanotubes. However, those studies
researched and reported only the shear strength, which gives only one mode (i.e. sliding
mode) of interface load transfer. To consider a range of loading conditions, it is important
to know the response of the interface under normal mode separation as well. The separa-
tions in both normal and sliding directions were studied in [59] for the non-functionalized
interface in CNT-PE nanocomposites using MD simulations in an effort to characterize the
load transfer only associated with vdW interactions and observed that the normal separation
response was significantly stronger than the sliding mode. It is therefore expected that the
functionalized interface, which in addition to the non-boned vdW interactions has covalent
bond interactions that are associated with the grafting of the functional groups between
CNTs and the polymer matrix, would therefore demonstrate even greater enhancement of
the normal mode response so that when combined with the observed functionalized sliding
mode response from the pullout test, the overall strength and load transfer ability of the
interface in the nanocomposite would be significantly improved.
Yumeng Li Chapter 1. Introduction 16
1.4 Objectives and Outline of the Present Research
In the present work a multiscale modeling approach is proposed for assessing the effects
of the non-functionalized and functionalized interface between the CNTs and a polymer
matrix in nanocomposites. At the smallest length scale, force field based atomistic MD
simulations are used to assess the interface force-separation response following the approach
employed by Awasthi et al. [59]. The force-separation response is then mapped into a
cohesive law used to describe the interface load transfer in larger length scale continuum
micromechanics studies. This hierarchical approach allows for off-line MD simulations to
provide relevant atomistic temperature dependent interfacial load transfer information to
continuum simulations which can use larger RVEs and time scales in determining effective
elastic properties. Special emphasis is placed on assessing MD interface RVE characteristics
in determining a converged set of cohesive zone parameters. Opening mode and sliding
mode separations of the CNT-polymer interface model have been performed using MD at a
given temperature for the interface in order to obtain the force-separation responses of the
graphene sheet. s based on peak traction and the energy of separation for non-functionalized
and functionalized interface have been embedded in the next level analytic and computational
micromechanics models to construct a multiscale model for exploring the bulk mechanical
properties of the nanocomposites.
Two different material systems, CNT-PE and CNT-Epoxy nanocomposites, are studied. For
the thermoplastic CNT-PE nanocomposites, parametric studies are conducted in terms of
Yumeng Li Chapter 1. Introduction 17
the number and the length of polymer chains, and the ’grip’ position in order to obtain the
suitable size of the representative interface elements at the nanoscale. The interface between
PE and CNTs at different temperatures are characterized in normal opening mode separa-
tion. For the thermoset polymer epoxy (Epon 862/DETDA), algorithms for the cross-linking
process are developed to prepare the atomistic structures of the epoxy with variable cross-
linking densities. Simulations are performed to explore the influence of cross-linking density
and the temperature on the load transfer across the interface of CNT-Epoxy nanocomposites
in terms of the force-separation response.
In the aforementioned experimental studies, treatments of the CNT surface have been ex-
plored to improve the load transfer at the interface. It was observed and reported that the
functionalized CNT-polymer nanocomposites exhibited better mechanical material proper-
ties in both experimental and modeling research. To understand the mechanisms behind
the improvement of interfacial strength, atomistic functionalized representative interface
elements are built for both CNT-PE and CNT-Epoxy material system with variable func-
tionalization densities. Normal mode separations are simulated at different temperatures to
produce force-separation responses using MD techniques in order to evaluate the efficiency
of the load transfer across the interface with variable numbers of functional groups at the
nanoscale.
At the microscale, cohesive zone models are implemented in the composite cylinder method
and in finite element analysis to estimate the effects of the interface between CNTs and the
polymer on the macroscale effective material properties. Cohesive zone laws are developed
Yumeng Li Chapter 1. Introduction 18
to describe the sliding and debonding of the interface in variable loading conditions based
on continuum traction-separation laws which are obtained by averaging the force-separation
response over the area of graphene sheet from MD simulations. In assessing the influence of
the interface on the effective elastic material properties, the stiffness components of the CNT-
polymer nanocomposites are calculated by solving the boundary value problems assuming
perfect bonded interface or considering the interface by applying the developed cohesive zone
laws.
This work is presented as follows. Chapter II provides a overview of MD simulation tech-
niques and cohesive zone models. Chapter III provides the atomistic modeling of the non-
functionalized thermoplastic graphene interface and continuum modeling of the CNT-PE
nanocomposites using cohesive zone model embedded CCM and FEM . The nanoscale load
transfer of the graphene-PE interface is characterized using MD simulations to develop the
cohesive zone laws, which are transferred to the higher level micromechanics model to in-
clude the nanoscale interface information in the study of the effective mechanical properties
of the nanocomposties. This contributes towards the understanding of the influence of the
nanoscale interface effects on the macroscale effective mechanical properties of the CNT-PE
nanocomposites with non-functionalized interface. Chapter IV provides the atomistic mod-
eling of the functionalized thermoplastic graphene interface and continuum modeling of the
functionalized CNT-PE nanocomposite using FEM combined with cohesive zone models.
Results about the load transfer ability of the functionalized graphene-PE interface and the
effective mechanical properties of the CNT-PE nanocomposites are provided to illustrate the
Yumeng Li Chapter 1. Introduction 19
effects of functionalization at the nanoscale and microscale. Chapter V discussed the atom-
istic modeling of the non-functionalized and functionalized thermoset graphene interface.
A dynamic crosslinking algorithm is provided to prepare the thermoset polymer material
with different crosslink densities. Discussion about parameters impacting the nanoscale load
transfer ability of the non-functionalized and functionalized thermoset graphene interface
is provided, leading to observations on the influence of functionalization on the macroscale
effective material performance of the CNT-epoxy nanocomposites.
Chapter 2
Modeling techniques
2.1 Molecular dynamics simulations
Molecular dynamics is a computer simulation technique for simulating the movements of
atoms and molecules in the context of an N-body atomistic system. In most cases, the parti-
cles in molecular dynamics simulations are treated as point masses which interact through a
set of force fields described by potential functions. Choosing a proper force potential for the
given system is the critical first step for MD simulations. The choice depends on the type of
material system and the process that is of interest. After the force field potential is chosen,
the initial configuration of the simulation system needs to be established by assigning every
particle spacial positions, a coordination and a velocity. Given the boundary conditions,
the trajectories of atoms and molecules inside the simulation system can be calculated for a
20
Yumeng Li Chapter 2. Modeling techniques 21
period of time by numerically integrating Newton’s equations of motion. Periodic boundary
conditions are usually applied in certain dimensions, which allows the representative volume
elements to be repeated in certain directions for representing large (infinite) systems.
2.1.1 Force Field Potentials
A force field potential is based on parameters determined by fitting the results from experi-
ments or ab-initio calculations. There are classical and reactive force fields. Classical force
fields are parameterized to describe the structures and energies close to equilibrium. No
bond breaking nor creating are allowed in classic force fields.
The consistent Valence Force Field (CVFF) potential [60] employed in the present study is
a classical force field that is properly calibrated for the carbon-carbon and carbon-hydrogen
interactions. It consists of four energy components, bond stretching, angle bending, torsion
and non-bonded potential.
To overcome the limitation of classical force fields, reactive force fields are developed which
include bond breaking and creating during the simulation without performing computation-
ally intensive quantum mechanics calculations. The Tersoff Brenner potential, the Reactive
Empirical Bond Order (REBO) and the Adaptive Intermolecular REBO (AIREBO) poten-
tial proposed are commonly used reactive force fields [61, 62, 63]. AIREBO, proposed by
Stuart and Harrison is a further development of the reactive empirical bond-order (REBO)
potential of Brenner, which in turn is based on the Tersoff Brenner potential. As it is pa-
Yumeng Li Chapter 2. Modeling techniques 22
rameterized for modeling condensed-phase hydrocarbon systems and the breaking and the
formation of chemical bonds, the AIREBO potential is adopted for some cases studied here.
It includes three energy components, the REBO potential, a torsional interaction poten-
tial and an intermolecular interaction potential. The REBO potential uses a Tersoff-style
potential to treat the covalent bonding interaction and depends not only on the distance
between atoms, but also on their local atomic environment by using a parameterized bond
order function. The AIREBO potential has been used in the current study for simulating
the functionalized interfacial system with the thermoplastic PE matrix.
Optimized potentials for liquid simulations (OPLS) All-Atom(AA) force field, which was
developed by Jorgensen and coworkers [64] based on the Assisted Model Building and Energy
Refinement(AMBER) potential for the organic molecules, was used to simulate the intra and
intermolecular forces in the interfacial system within the thermoset epoxy polymer and is a
classical force field potential like CVFF. OPLS AA potential consists of four energy parts
including bond stretching, angle bending, torsion and non-bonded interactions.
As the AIREBO potential is computational expensive to use, the CVFF and OPLS potentials
are modified by including strain energy failure criteria to allow for bond breaking, and are
then applied to characterize the load transfer ability of the functionalized graphene-polymer
interface.
Yumeng Li Chapter 2. Modeling techniques 23
2.1.2 Ensembles
There are generally four types of simulation conditions considered in MD simulations referred
to as ensembles.
The canonical ensemble (NVT ensemble) has the number of particles (N), temperature (T)
and volume (V) conserved, and is known as constant temperature molecular dynamics. In
this ensemble, the simulation system has thermal contact with a large heat bath, which
allows for the addition and/or removal of energy from the MD simulation in an realistic way.
The isothermal-Isobaric ensemble (NPT ensemble) has the number of particles (N), pressure
(P) and temperature (T) conserved in the simulation system. Both a thermostat and barostat
are applied in this ensemble. The volume of the system is allowed to change freely with the
change of temperature and pressure. This ensemble is widely used in MD simulations as most
real experiments are carried out under conditions of controlled temperature and pressure.
The microcanonical ensemble (NVE ensemble) has the number of particles (N), volume (V)
and energy (E) conserved. This ensemble simulates an isolated system where there is no
heat exchange.
The isoenthalpic-Isobaric ensemble (NPH ensemble) has the number of particles (N), pressure
(P) and enthalpy (H) conserved. Because H = E+PV , the internal energy E and the kinetic
energy PV are allowed to change proportionally, thus indicating that the volume is also a
dynamic variable.
NVT ensemble is used in this study to achieve temperature control in MD simulations.
Yumeng Li Chapter 2. Modeling techniques 24
NPT ensemble is used to prepare the polymer matrix with realistic densities under a certain
temperature and atmosphere pressure.
2.2 Cohesive zone model
In the study of failure behavior, may engineering materials exhibit some ductility after
reaching the strength limits. If the small zone in the front of the crack tip termed as the
failure process zone where small-scale yielding, microcracking and void initiation, growth and
coalescence are observed is not sufficiently small relative to the structural dimensions, the
linear elastic fracture mechanics does not apply and the failure process zone is not negligible.
As first introduced by Dugdale and Barenblatt [65, 66], cohesive zone model have been widely
used to investigate the failure process in materials and structures [67, 68], such as imperfect
interfaces and crack propagation, by having the basic idea to lift the limitation of small scale
yielding beyond the crack tip and eliminate the singularity of stress in front of the crack tip
usually associated with classical linear elastic fracture mechanics. Another reason for the
widespread use of cohesive zone models is that it is easy to incorporate cohesive zone models
in various computational methods.
In cohesive zone models, the assumed crack propagation path in front of the actual crack tip
has the upper and lower surface idealized as cohesive zones with vanishing thickness which
are assumed to support traction in both normal and tangential directions relative to the
surface normal vector. The cohesive traction-displacement laws across the crack propaga-
Yumeng Li Chapter 2. Modeling techniques 25
tion plane are used to describe the mechanical behavior of the cohesive zones which relates
the surface traction to the relative separation displacement of the crack surface. While the
crack propagates through the material, the failure process zone in the front of the crack tip
is degraded by following the cohesive traction-displacement relationship and has a different
constitution from the material surrounding it. Therefore it is observed that the form of
cohesive zone laws is critical in predicting the mechanical response of the material. Various
cohesive traction-displacement laws have been developed and studied for ductile and brittle
materials in the literature [69]. In this study, bilinear and non-linear cohesive zone laws
are developed to describe the response of the non-functionalized and functionalized interface
between CNTs and the polymer matrix. As discussed in detail in the following chapter, the
cohesive zone models are embedded in CCM and FEA to investigate the macroscale effec-
tive elastic mechanical properties of the CNT-polymer nanocomposites under the nanoscale
interface effects.
Chapter 3
The effects of the non-functionalized
interface in the CNT-PE
nanocomposites on the bulk effective
material properties
3.1 CVFF potential
To model the CNT-PE interface at the nanoscale, CVFF potential is applied to simulate
the interactions between atoms in the interfacial system. CVFF is properly calibrated for
the carbon-carbon and carbon-hydrogen interactions and consists of four energy components
26
Yumeng Li Chapter 3. CNT-PE nanocomposites with the non-functionalized interface 27
which are associated with bond stretching, angle bending, torsion and non-bonded potential
associated with van der Waals interaction.
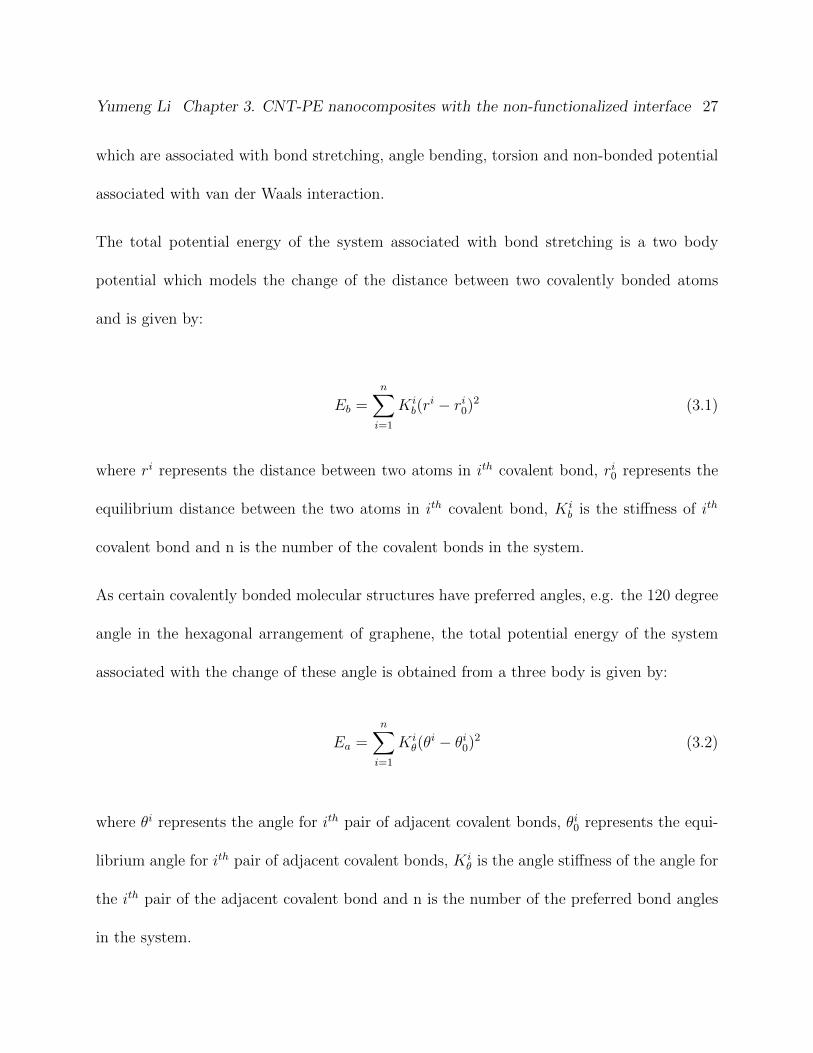
The total potential energy of the system associated with bond stretching is a two body
potential which models the change of the distance between two covalently bonded atoms
and is given by:
Eb =n∑i=1
Kib(r
i − ri0)2 (3.1)
where ri represents the distance between two atoms in ith covalent bond, ri0 represents the
equilibrium distance between the two atoms in ith covalent bond, Kib is the stiffness of ith
covalent bond and n is the number of the covalent bonds in the system.
As certain covalently bonded molecular structures have preferred angles, e.g. the 120 degree
angle in the hexagonal arrangement of graphene, the total potential energy of the system
associated with the change of these angle is obtained from a three body is given by:
Ea =n∑i=1
Kiθ(θ
i − θi0)2 (3.2)
where θi represents the angle for ith pair of adjacent covalent bonds, θi0 represents the equi-
librium angle for ith pair of adjacent covalent bonds, Kiθ is the angle stiffness of the angle for
the ith pair of the adjacent covalent bond and n is the number of the preferred bond angles
in the system.
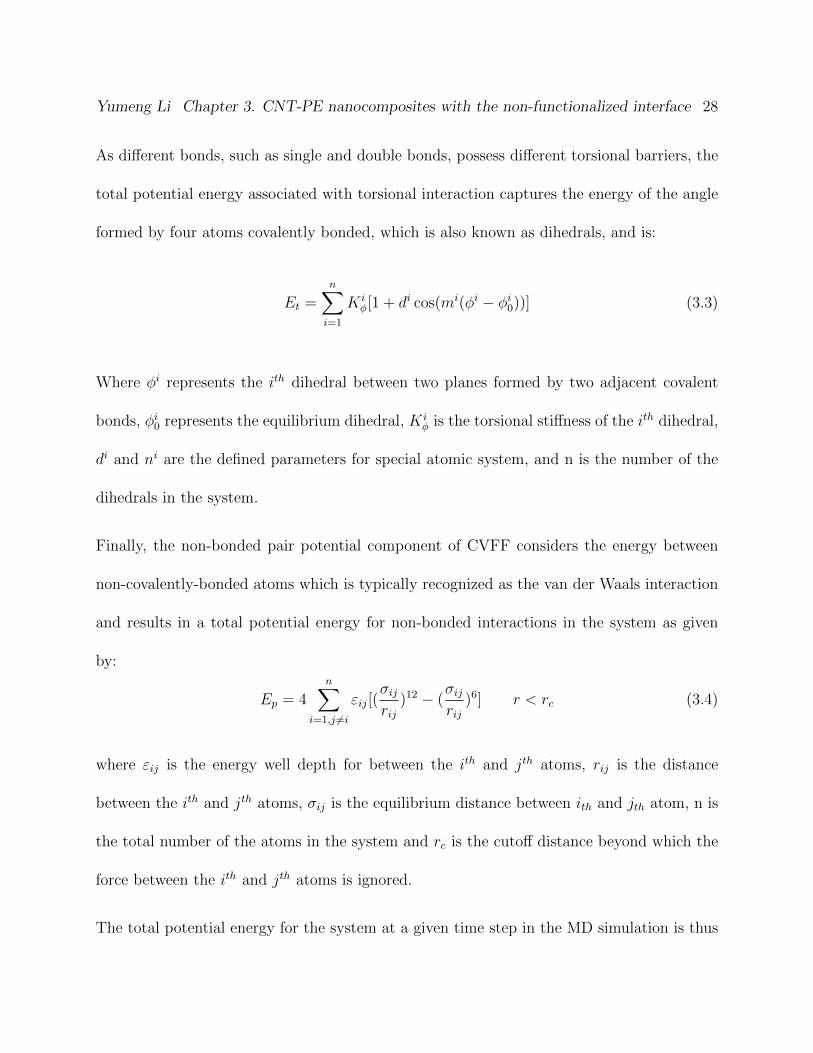
Yumeng Li Chapter 3. CNT-PE nanocomposites with the non-functionalized interface 28
As different bonds, such as single and double bonds, possess different torsional barriers, the
total potential energy associated with torsional interaction captures the energy of the angle
formed by four atoms covalently bonded, which is also known as dihedrals, and is:
Et =n∑i=1
Kiφ[1 + di cos(mi(φi − φi0))] (3.3)
Where φi represents the ith dihedral between two planes formed by two adjacent covalent
bonds, φi0 represents the equilibrium dihedral, Kiφ is the torsional stiffness of the ith dihedral,
di and ni are the defined parameters for special atomic system, and n is the number of the
dihedrals in the system.
Finally, the non-bonded pair potential component of CVFF considers the energy between
non-covalently-bonded atoms which is typically recognized as the van der Waals interaction
and results in a total potential energy for non-bonded interactions in the system as given
by:
Ep = 4n∑
i=1,j 6=i
εij[(σijrij
)12 − (σijrij
)6] r < rc (3.4)
where εij is the energy well depth for between the ith and jth atoms, rij is the distance
between the ith and jth atoms, σij is the equilibrium distance between ith and jth atom, n is
the total number of the atoms in the system and rc is the cutoff distance beyond which the
force between the ith and jth atoms is ignored.
The total potential energy for the system at a given time step in the MD simulation is thus
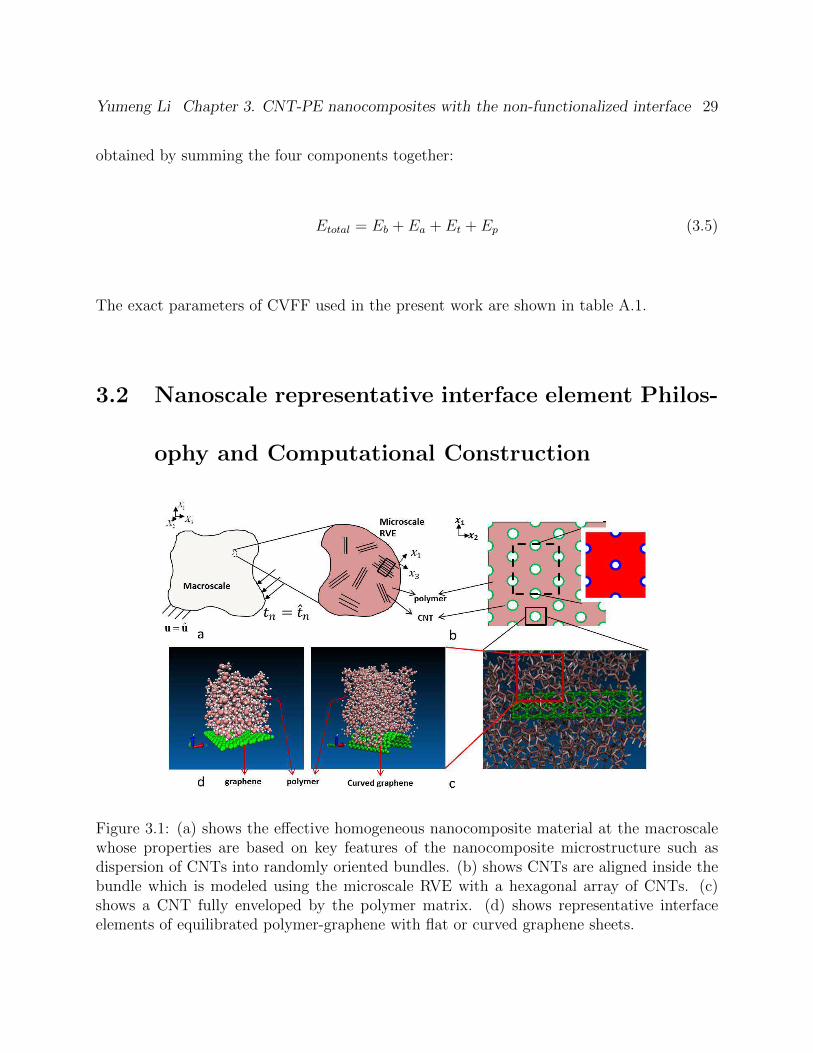
Yumeng Li Chapter 3. CNT-PE nanocomposites with the non-functionalized interface 29
obtained by summing the four components together:
Etotal = Eb + Ea + Et + Ep (3.5)
The exact parameters of CVFF used in the present work are shown in table A.1.
3.2 Nanoscale representative interface element Philos-
ophy and Computational Construction
Figure 3.1: (a) shows the effective homogeneous nanocomposite material at the macroscalewhose properties are based on key features of the nanocomposite microstructure such asdispersion of CNTs into randomly oriented bundles. (b) shows CNTs are aligned inside thebundle which is modeled using the microscale RVE with a hexagonal array of CNTs. (c)shows a CNT fully enveloped by the polymer matrix. (d) shows representative interfaceelements of equilibrated polymer-graphene with flat or curved graphene sheets.
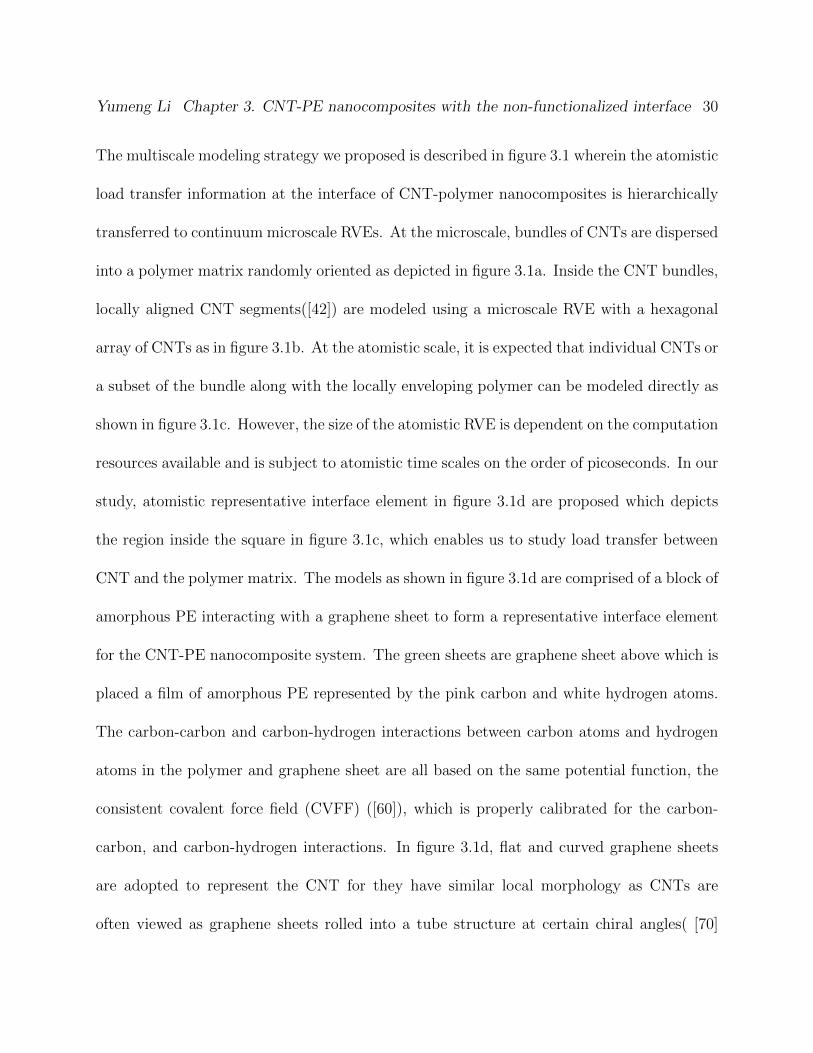
Yumeng Li Chapter 3. CNT-PE nanocomposites with the non-functionalized interface 30
The multiscale modeling strategy we proposed is described in figure 3.1 wherein the atomistic
load transfer information at the interface of CNT-polymer nanocomposites is hierarchically
transferred to continuum microscale RVEs. At the microscale, bundles of CNTs are dispersed
into a polymer matrix randomly oriented as depicted in figure 3.1a. Inside the CNT bundles,
locally aligned CNT segments([42]) are modeled using a microscale RVE with a hexagonal
array of CNTs as in figure 3.1b. At the atomistic scale, it is expected that individual CNTs or
a subset of the bundle along with the locally enveloping polymer can be modeled directly as
shown in figure 3.1c. However, the size of the atomistic RVE is dependent on the computation
resources available and is subject to atomistic time scales on the order of picoseconds. In our
study, atomistic representative interface element in figure 3.1d are proposed which depicts
the region inside the square in figure 3.1c, which enables us to study load transfer between
CNT and the polymer matrix. The models as shown in figure 3.1d are comprised of a block of
amorphous PE interacting with a graphene sheet to form a representative interface element
for the CNT-PE nanocomposite system. The green sheets are graphene sheet above which is
placed a film of amorphous PE represented by the pink carbon and white hydrogen atoms.
The carbon-carbon and carbon-hydrogen interactions between carbon atoms and hydrogen
atoms in the polymer and graphene sheet are all based on the same potential function, the
consistent covalent force field (CVFF) ([60]), which is properly calibrated for the carbon-
carbon, and carbon-hydrogen interactions. In figure 3.1d, flat and curved graphene sheets
are adopted to represent the CNT for they have similar local morphology as CNTs are
often viewed as graphene sheets rolled into a tube structure at certain chiral angles( [70]
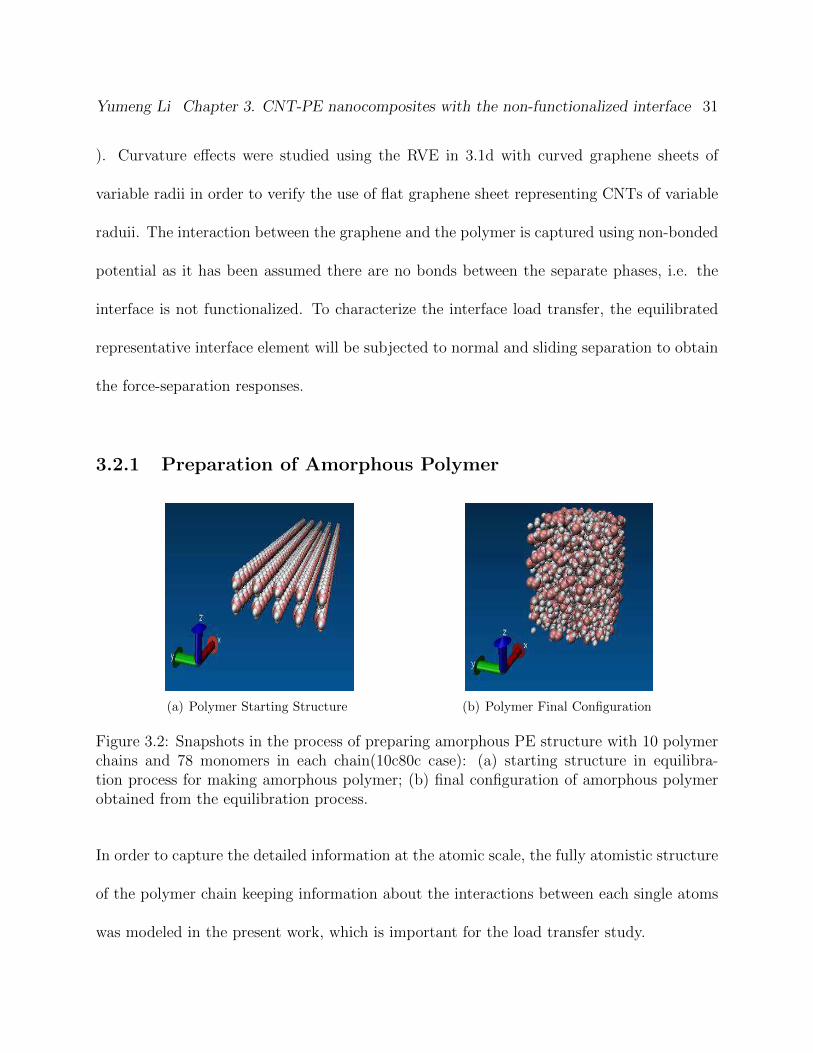
Yumeng Li Chapter 3. CNT-PE nanocomposites with the non-functionalized interface 31
). Curvature effects were studied using the RVE in 3.1d with curved graphene sheets of
variable radii in order to verify the use of flat graphene sheet representing CNTs of variable
raduii. The interaction between the graphene and the polymer is captured using non-bonded
potential as it has been assumed there are no bonds between the separate phases, i.e. the
interface is not functionalized. To characterize the interface load transfer, the equilibrated
representative interface element will be subjected to normal and sliding separation to obtain
the force-separation responses.
3.2.1 Preparation of Amorphous Polymer
(a) Polymer Starting Structure (b) Polymer Final Configuration
Figure 3.2: Snapshots in the process of preparing amorphous PE structure with 10 polymerchains and 78 monomers in each chain(10c80c case): (a) starting structure in equilibra-tion process for making amorphous polymer; (b) final configuration of amorphous polymerobtained from the equilibration process.
In order to capture the detailed information at the atomic scale, the fully atomistic structure
of the polymer chain keeping information about the interactions between each single atoms
was modeled in the present work, which is important for the load transfer study.
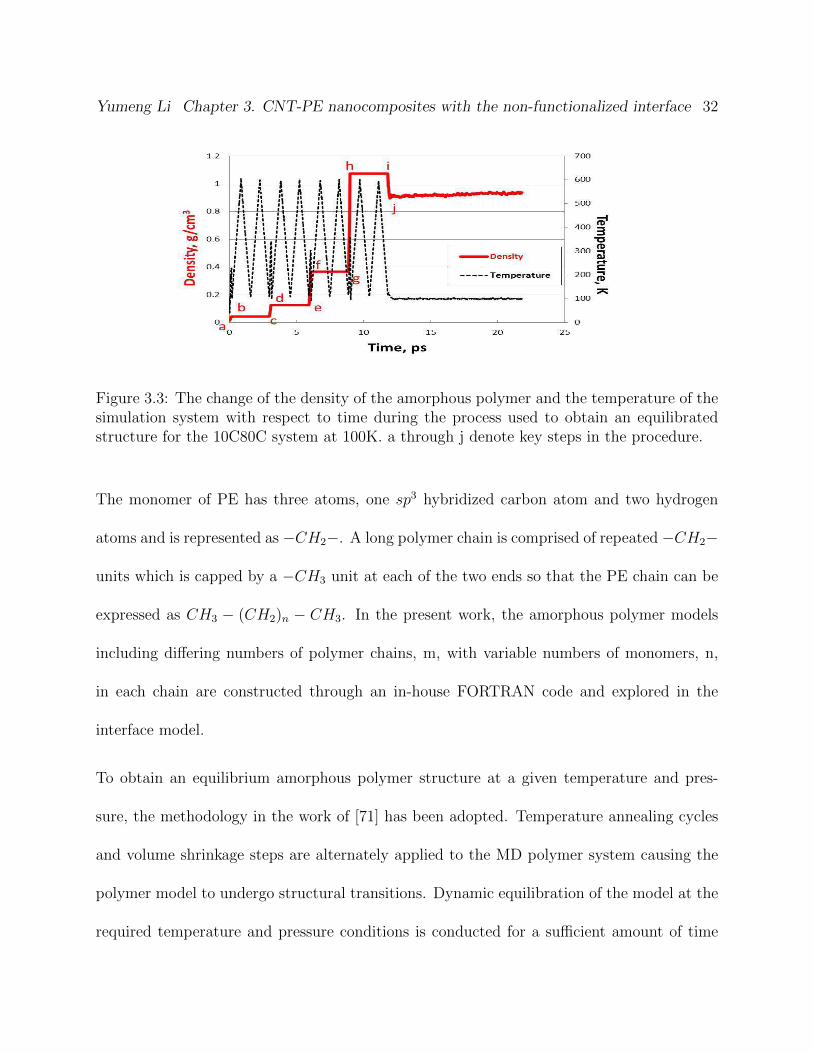
Yumeng Li Chapter 3. CNT-PE nanocomposites with the non-functionalized interface 32
Figure 3.3: The change of the density of the amorphous polymer and the temperature of thesimulation system with respect to time during the process used to obtain an equilibratedstructure for the 10C80C system at 100K. a through j denote key steps in the procedure.
The monomer of PE has three atoms, one sp3 hybridized carbon atom and two hydrogen
atoms and is represented as −CH2−. A long polymer chain is comprised of repeated −CH2−
units which is capped by a −CH3 unit at each of the two ends so that the PE chain can be
expressed as CH3 − (CH2)n − CH3. In the present work, the amorphous polymer models
including differing numbers of polymer chains, m, with variable numbers of monomers, n,
in each chain are constructed through an in-house FORTRAN code and explored in the
interface model.
To obtain an equilibrium amorphous polymer structure at a given temperature and pres-
sure, the methodology in the work of [71] has been adopted. Temperature annealing cycles
and volume shrinkage steps are alternately applied to the MD polymer system causing the
polymer model to undergo structural transitions. Dynamic equilibration of the model at the
required temperature and pressure conditions is conducted for a sufficient amount of time
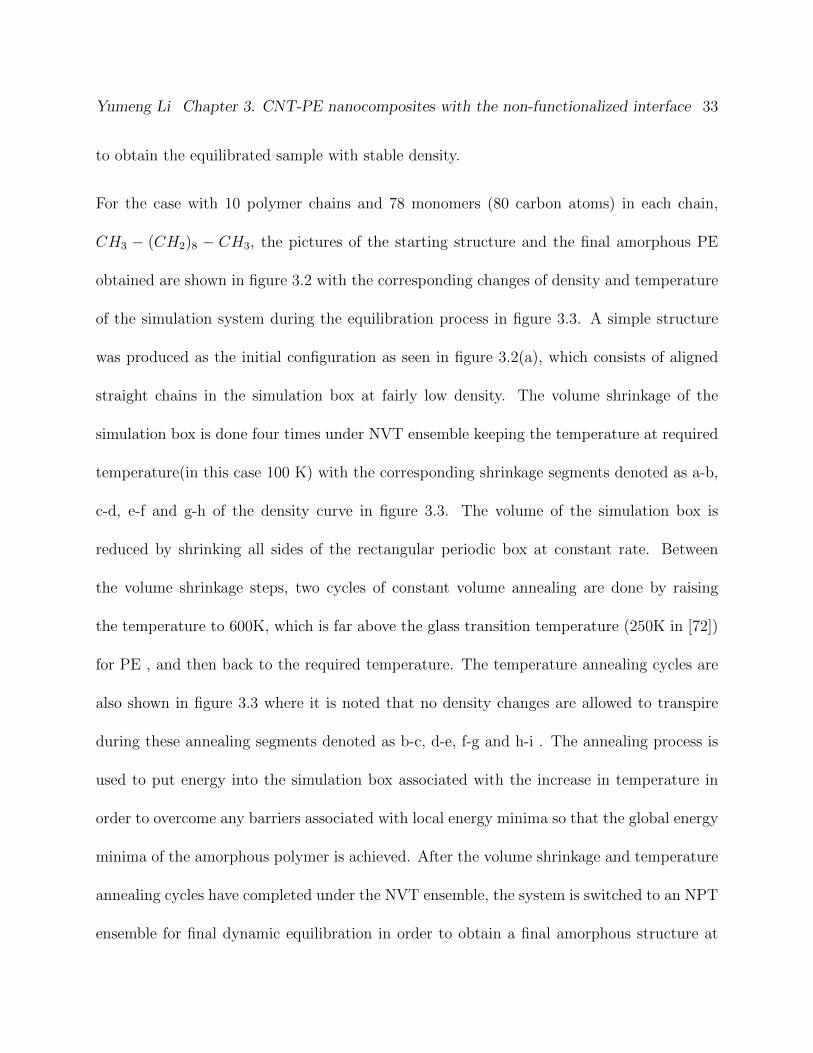
Yumeng Li Chapter 3. CNT-PE nanocomposites with the non-functionalized interface 33
to obtain the equilibrated sample with stable density.
For the case with 10 polymer chains and 78 monomers (80 carbon atoms) in each chain,
CH3 − (CH2)8 − CH3, the pictures of the starting structure and the final amorphous PE
obtained are shown in figure 3.2 with the corresponding changes of density and temperature
of the simulation system during the equilibration process in figure 3.3. A simple structure
was produced as the initial configuration as seen in figure 3.2(a), which consists of aligned
straight chains in the simulation box at fairly low density. The volume shrinkage of the
simulation box is done four times under NVT ensemble keeping the temperature at required
temperature(in this case 100 K) with the corresponding shrinkage segments denoted as a-b,
c-d, e-f and g-h of the density curve in figure 3.3. The volume of the simulation box is
reduced by shrinking all sides of the rectangular periodic box at constant rate. Between
the volume shrinkage steps, two cycles of constant volume annealing are done by raising
the temperature to 600K, which is far above the glass transition temperature (250K in [72])
for PE , and then back to the required temperature. The temperature annealing cycles are
also shown in figure 3.3 where it is noted that no density changes are allowed to transpire
during these annealing segments denoted as b-c, d-e, f-g and h-i . The annealing process is
used to put energy into the simulation box associated with the increase in temperature in
order to overcome any barriers associated with local energy minima so that the global energy
minima of the amorphous polymer is achieved. After the volume shrinkage and temperature
annealing cycles have completed under the NVT ensemble, the system is switched to an NPT
ensemble for final dynamic equilibration in order to obtain a final amorphous structure at
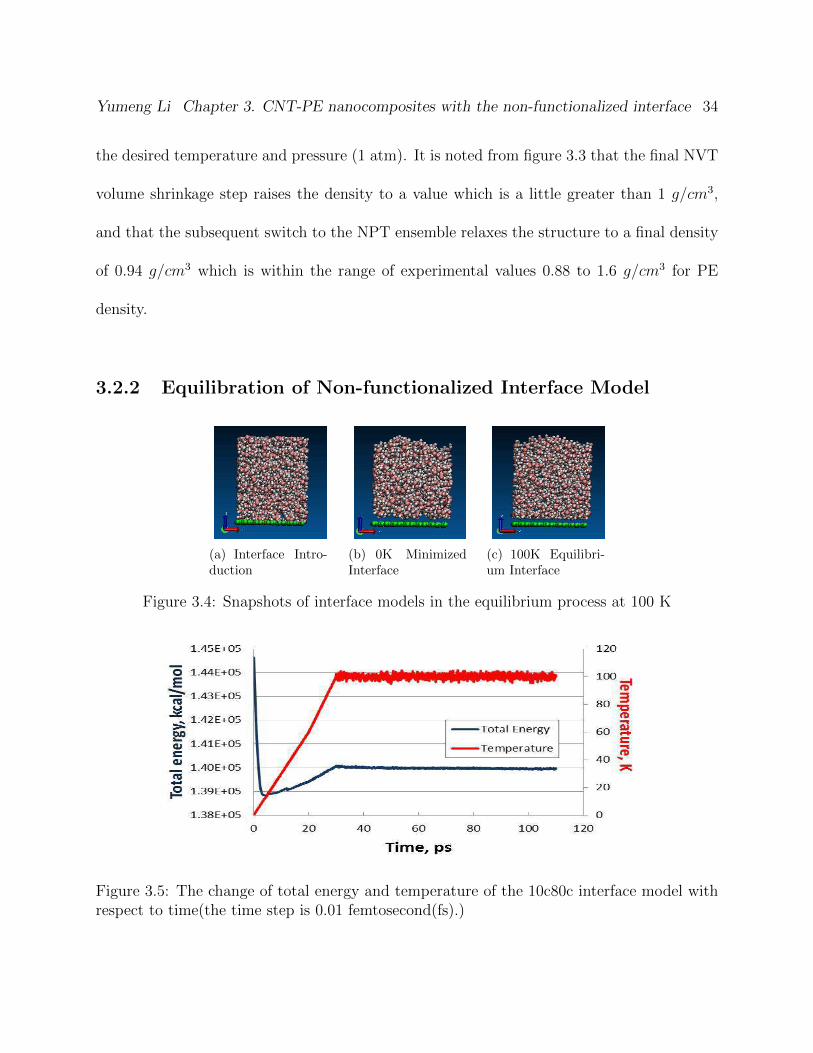
Yumeng Li Chapter 3. CNT-PE nanocomposites with the non-functionalized interface 34
the desired temperature and pressure (1 atm). It is noted from figure 3.3 that the final NVT
volume shrinkage step raises the density to a value which is a little greater than 1 g/cm3,
and that the subsequent switch to the NPT ensemble relaxes the structure to a final density
of 0.94 g/cm3 which is within the range of experimental values 0.88 to 1.6 g/cm3 for PE
density.
3.2.2 Equilibration of Non-functionalized Interface Model
(a) Interface Intro-duction
(b) 0K MinimizedInterface
(c) 100K Equilibri-um Interface
Figure 3.4: Snapshots of interface models in the equilibrium process at 100 K
Figure 3.5: The change of total energy and temperature of the 10c80c interface model withrespect to time(the time step is 0.01 femtosecond(fs).)
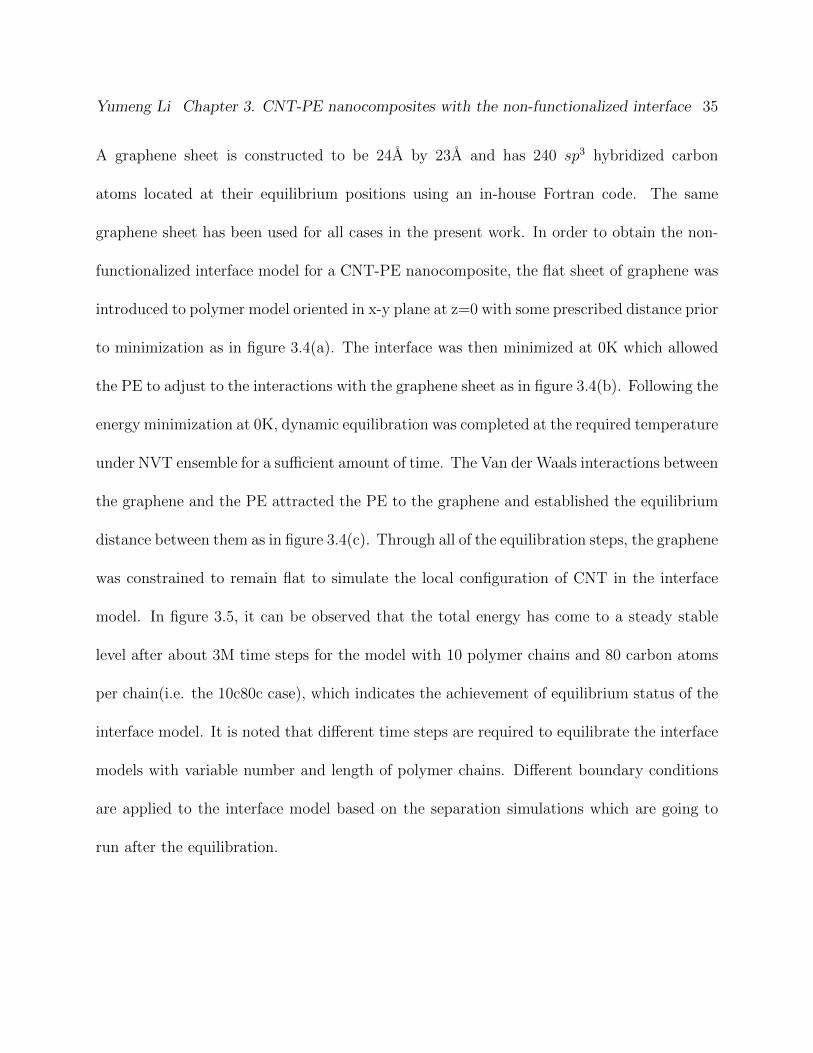
Yumeng Li Chapter 3. CNT-PE nanocomposites with the non-functionalized interface 35
A graphene sheet is constructed to be 24A by 23A and has 240 sp3 hybridized carbon
atoms located at their equilibrium positions using an in-house Fortran code. The same
graphene sheet has been used for all cases in the present work. In order to obtain the non-
functionalized interface model for a CNT-PE nanocomposite, the flat sheet of graphene was
introduced to polymer model oriented in x-y plane at z=0 with some prescribed distance prior
to minimization as in figure 3.4(a). The interface was then minimized at 0K which allowed
the PE to adjust to the interactions with the graphene sheet as in figure 3.4(b). Following the
energy minimization at 0K, dynamic equilibration was completed at the required temperature
under NVT ensemble for a sufficient amount of time. The Van der Waals interactions between
the graphene and the PE attracted the PE to the graphene and established the equilibrium
distance between them as in figure 3.4(c). Through all of the equilibration steps, the graphene
was constrained to remain flat to simulate the local configuration of CNT in the interface
model. In figure 3.5, it can be observed that the total energy has come to a steady stable
level after about 3M time steps for the model with 10 polymer chains and 80 carbon atoms
per chain(i.e. the 10c80c case), which indicates the achievement of equilibrium status of the
interface model. It is noted that different time steps are required to equilibrate the interface
models with variable number and length of polymer chains. Different boundary conditions
are applied to the interface model based on the separation simulations which are going to
run after the equilibration.
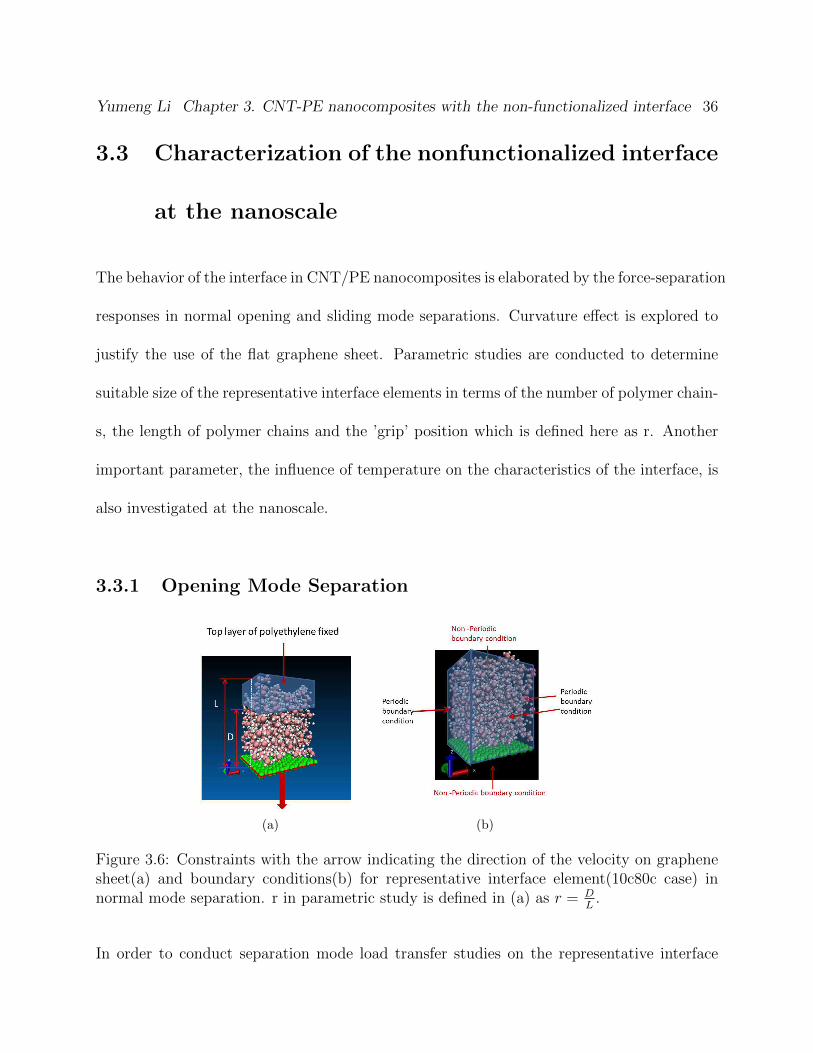
Yumeng Li Chapter 3. CNT-PE nanocomposites with the non-functionalized interface 36
3.3 Characterization of the nonfunctionalized interface
at the nanoscale
The behavior of the interface in CNT/PE nanocomposites is elaborated by the force-separation
responses in normal opening and sliding mode separations. Curvature effect is explored to
justify the use of the flat graphene sheet. Parametric studies are conducted to determine
suitable size of the representative interface elements in terms of the number of polymer chain-
s, the length of polymer chains and the ’grip’ position which is defined here as r. Another
important parameter, the influence of temperature on the characteristics of the interface, is
also investigated at the nanoscale.
3.3.1 Opening Mode Separation
(a) (b)
Figure 3.6: Constraints with the arrow indicating the direction of the velocity on graphenesheet(a) and boundary conditions(b) for representative interface element(10c80c case) innormal mode separation. r in parametric study is defined in (a) as r = D
L.
In order to conduct separation mode load transfer studies on the representative interface
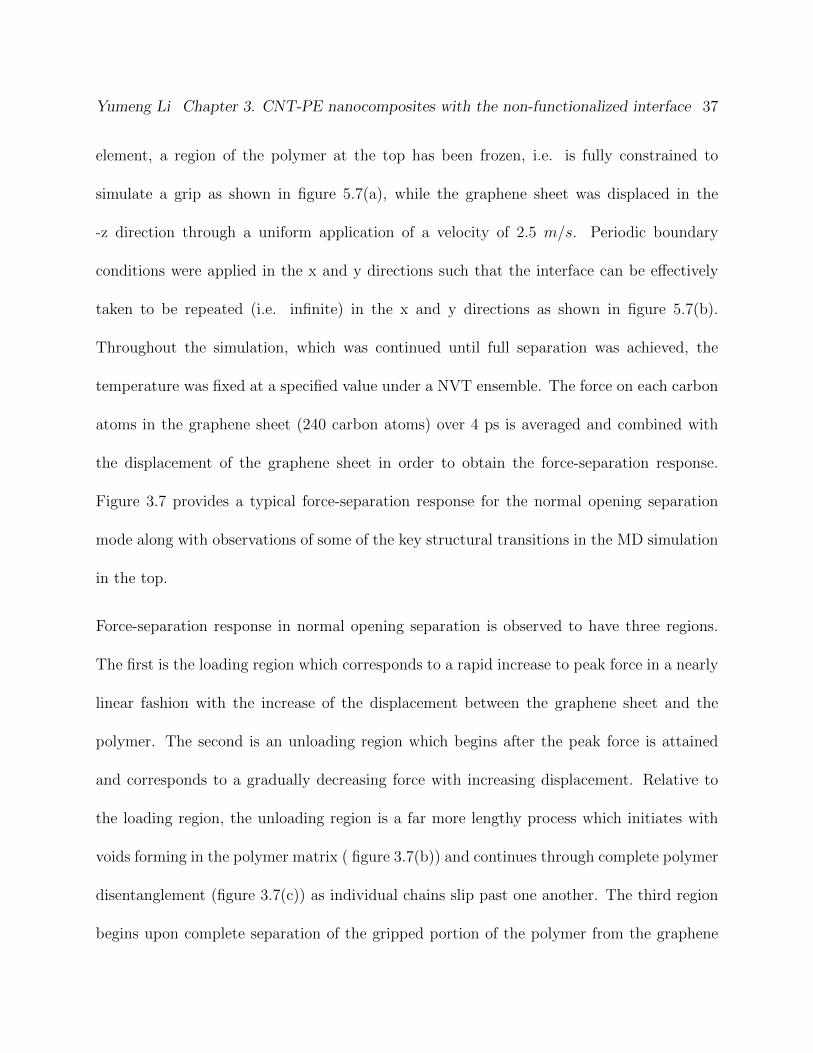
Yumeng Li Chapter 3. CNT-PE nanocomposites with the non-functionalized interface 37
element, a region of the polymer at the top has been frozen, i.e. is fully constrained to
simulate a grip as shown in figure 5.7(a), while the graphene sheet was displaced in the
-z direction through a uniform application of a velocity of 2.5 m/s. Periodic boundary
conditions were applied in the x and y directions such that the interface can be effectively
taken to be repeated (i.e. infinite) in the x and y directions as shown in figure 5.7(b).
Throughout the simulation, which was continued until full separation was achieved, the
temperature was fixed at a specified value under a NVT ensemble. The force on each carbon
atoms in the graphene sheet (240 carbon atoms) over 4 ps is averaged and combined with
the displacement of the graphene sheet in order to obtain the force-separation response.
Figure 3.7 provides a typical force-separation response for the normal opening separation
mode along with observations of some of the key structural transitions in the MD simulation
in the top.
Force-separation response in normal opening separation is observed to have three regions.
The first is the loading region which corresponds to a rapid increase to peak force in a nearly
linear fashion with the increase of the displacement between the graphene sheet and the
polymer. The second is an unloading region which begins after the peak force is attained
and corresponds to a gradually decreasing force with increasing displacement. Relative to
the loading region, the unloading region is a far more lengthy process which initiates with
voids forming in the polymer matrix ( figure 3.7(b)) and continues through complete polymer
disentanglement (figure 3.7(c)) as individual chains slip past one another. The third region
begins upon complete separation of the gripped portion of the polymer from the graphene
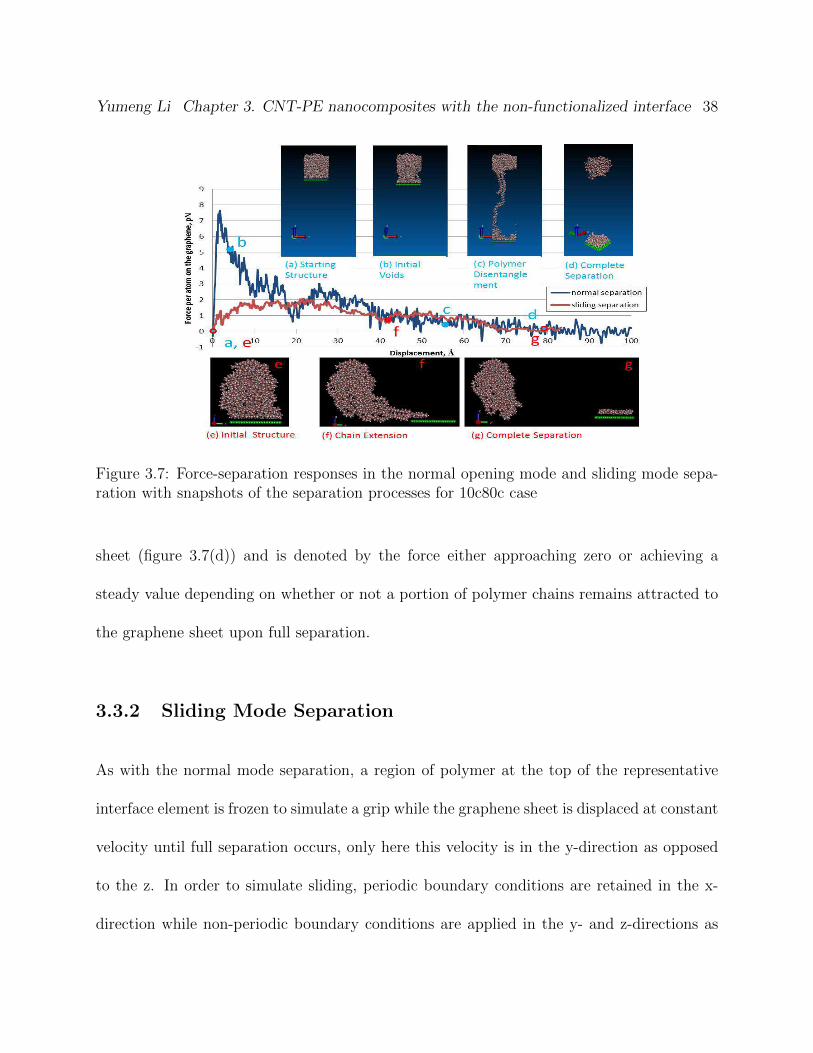
Yumeng Li Chapter 3. CNT-PE nanocomposites with the non-functionalized interface 38
Figure 3.7: Force-separation responses in the normal opening mode and sliding mode sepa-ration with snapshots of the separation processes for 10c80c case
sheet (figure 3.7(d)) and is denoted by the force either approaching zero or achieving a
steady value depending on whether or not a portion of polymer chains remains attracted to
the graphene sheet upon full separation.
3.3.2 Sliding Mode Separation
As with the normal mode separation, a region of polymer at the top of the representative
interface element is frozen to simulate a grip while the graphene sheet is displaced at constant
velocity until full separation occurs, only here this velocity is in the y-direction as opposed
to the z. In order to simulate sliding, periodic boundary conditions are retained in the x-
direction while non-periodic boundary conditions are applied in the y- and z-directions as
Yumeng Li Chapter 3. CNT-PE nanocomposites with the non-functionalized interface 39
shown in figure 5.9(b). During the separation process, the averaged force on graphene sheet
has been monitored in y direction.
A typical sliding mode force-separation response is provided in figure 3.7 where it is observed
that the force initially increases rapidly and then plateaus for a significant period before
beginning to decay to zero or a stable small value depending on whether or not any polymer
remains attracted to the graphene surface upon full separation. The peak force is around
1.8 pN which is fairly low compared with the peak force of normal separation. It is believed
that the plateau may depend on the length of movable polymer chains such that when there
are much longer movable polymer chains, they can be stretched out in y direction while
remaining in contact with the graphene sheet. It is noted that following the plateau region,
the force decreases to 0.5 pN at 43 angstroms of displacement and then begins to increase
again to 1 pN before finally resuming its decay. This behavior is believed to be associated
with a configuration transition whereby an entangled set of polymer chains began to carry
more load before achieving disentanglement and subsequent chain sliding until full separation
was achieved. Reductions in polymer chain length and/or increases in the size of the region
of frozen polymer in the grip can therefore lead to a shorter plateau region and a sharper
decrease in force at the conclusion of the plateau. Three snapshots of sliding mode separation
are shown in the bottom of figure 3.7 and corresponds to the points labeled e),f) and g) in
the force-separation response.1
1It is noted that the sliding representative interface element shown in Figures 3.7 and 5.10 is selected tobe consistent with the normal mode representative interface element. However, for sliding mode, it wouldbe preferable to use a longer graphene sheet in order to demonstrate sustained sliding in the absence of edgeeffects. Though not provided herein, the results obtained for such representative interface elements yieldeda peak force approximately equal to that of the sliding mode representative interface element reported here.
Yumeng Li Chapter 3. CNT-PE nanocomposites with the non-functionalized interface 40
(a) (b)
Figure 3.8: Constraints with the arrow indicating the direction of the velocity on graphenesheet(a) and boundary conditions(b) for representative interface element(10c80c case) insliding mode separation. r in parametric study is defined in (a) as r = D
L.
3.3.3 Curvature Study
In order to investigate the significance of curvature on the force-separation response, curved
graphene sheets corresponding to CNTs with differing radii were studied. The graphene
sheets with 240 sp3 hybridized carbon atoms were rearranged to form the curvature of a
cylinder of radius 6A(R6), 8A(R8), 12A(R12) and 16A(R16) as shown in Figure 3.9 corre-
sponding to CNTs of armchair (9,9), (12,12), (18,18) and (24,24), respectively. The amor-
phous polymer in the representative interface elements includes 10 polymer chains and 80
carbon atoms per chains(10c80c). The amorphous polymer was introduced to the curved
graphene segments and equilibrated in the same manner as the flat graphene sheets. The
averaged force recorded on the graphene sheet is in the z-direction as opposed to the radial
direction of the curved graphene sheet.
Force-separation responses are shown in Figure 3.9 for the interface models with the flat
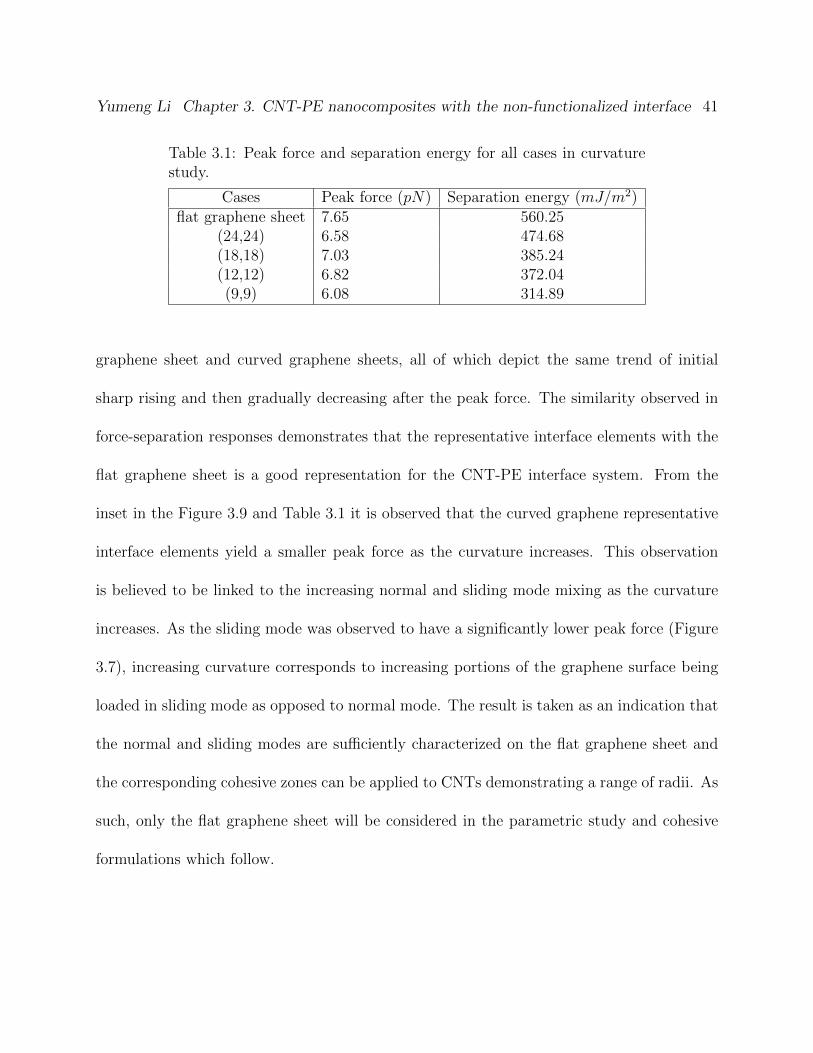
Yumeng Li Chapter 3. CNT-PE nanocomposites with the non-functionalized interface 41
Table 3.1: Peak force and separation energy for all cases in curvaturestudy.
Cases Peak force (pN) Separation energy (mJ/m2)flat graphene sheet 7.65 560.25
(24,24) 6.58 474.68(18,18) 7.03 385.24(12,12) 6.82 372.04(9,9) 6.08 314.89
graphene sheet and curved graphene sheets, all of which depict the same trend of initial
sharp rising and then gradually decreasing after the peak force. The similarity observed in
force-separation responses demonstrates that the representative interface elements with the
flat graphene sheet is a good representation for the CNT-PE interface system. From the
inset in the Figure 3.9 and Table 3.1 it is observed that the curved graphene representative
interface elements yield a smaller peak force as the curvature increases. This observation
is believed to be linked to the increasing normal and sliding mode mixing as the curvature
increases. As the sliding mode was observed to have a significantly lower peak force (Figure
3.7), increasing curvature corresponds to increasing portions of the graphene surface being
loaded in sliding mode as opposed to normal mode. The result is taken as an indication that
the normal and sliding modes are sufficiently characterized on the flat graphene sheet and
the corresponding cohesive zones can be applied to CNTs demonstrating a range of radii. As
such, only the flat graphene sheet will be considered in the parametric study and cohesive
formulations which follow.
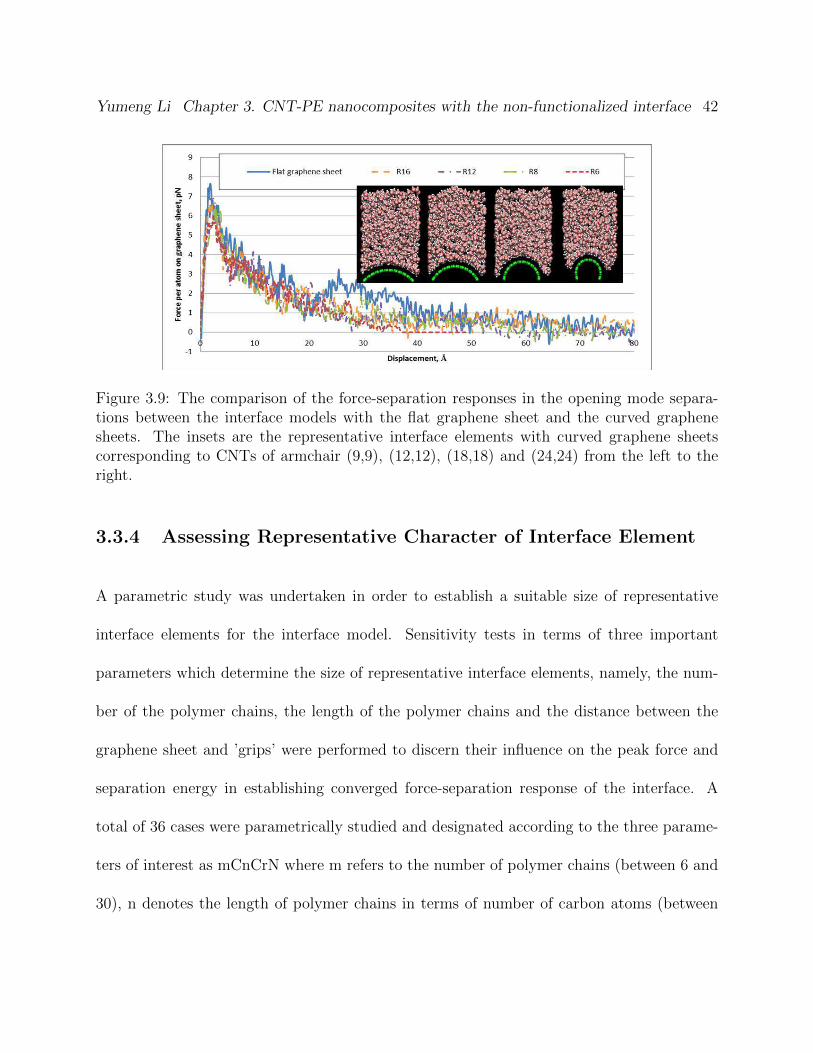
Yumeng Li Chapter 3. CNT-PE nanocomposites with the non-functionalized interface 42
Figure 3.9: The comparison of the force-separation responses in the opening mode separa-tions between the interface models with the flat graphene sheet and the curved graphenesheets. The insets are the representative interface elements with curved graphene sheetscorresponding to CNTs of armchair (9,9), (12,12), (18,18) and (24,24) from the left to theright.
3.3.4 Assessing Representative Character of Interface Element
A parametric study was undertaken in order to establish a suitable size of representative
interface elements for the interface model. Sensitivity tests in terms of three important
parameters which determine the size of representative interface elements, namely, the num-
ber of the polymer chains, the length of the polymer chains and the distance between the
graphene sheet and ’grips’ were performed to discern their influence on the peak force and
separation energy in establishing converged force-separation response of the interface. A
total of 36 cases were parametrically studied and designated according to the three parame-
ters of interest as mCnCrN where m refers to the number of polymer chains (between 6 and
30), n denotes the length of polymer chains in terms of number of carbon atoms (between
Yumeng Li Chapter 3. CNT-PE nanocomposites with the non-functionalized interface 43
60 and 300)2, and r denotes the relative influence of the ’grip’ as measured by the ratio
r = DL
as denoted in Figure 5.7(a). It is noted that as the number and length of polymer
chains increases, the area of the graphene sheet remains fixed. As such, higher m and n
correspond to larger dimensions in the z-direction so that r is more appropriately thought
of as the percentage of polymer column height which is unconstrained by the ’grip’, i.e. is
outside of the frozen region. Values for this parameter span from approximately 58% to 77%
unconstrained. It is further noted that polymer chains may be fully, partially or not at all
contained within the frozen ’grip’ region, and therefore extend the ’grip’ interaction through
subsequent entanglements with chains in the unconstrained region. The specific cases and
the corresponding number of atoms in each case are provided in Table 3.2. For each case
identified, three different configurations are selected from the range of dynamic equilibrium
of the interface model and are used to establish initial estimates of the average response and
standard deviation for the case.
In order to insure that there are not residual biases from starting with straight polymer chains
in the amorphous polymer construction and to explore the potential degree of entanglements
within the final amorphous polymer configurations selected for parametric study, the average
tortuosity(τor) for each case is measured and reported in Table 3.3 by using Equation 3.6.
By definition, lower average τor means polymer chains in the model prefer to entangle with
itself or other polymer chains, and higher average τor means polymer chains in the model
2It is noted that all of our simulations involve polymer chains which are of a rather short length ascompared to real-life polymer chains. To simulate real-life polymer chains would be significantly morecomputationally expensive, and may necessitate coarse graining. However, with increasing chain length andnumber of chains, a convergent behavior was observed in our present results which we believe provides areasonable alternative to larger coarse graining in assessing interface load transfer.
Yumeng Li Chapter 3. CNT-PE nanocomposites with the non-functionalized interface 44
are more straight. In Table 3.3, as the number of the polymer chains increases from 6 to 30
with 100 carbon atoms per chain, τor increases from 0.29 to 0.4 which correlates with the
increase of the density of the amorphous chains. In contrast, as the length of the chains are
increased, in this case by a factor of 3 in going from the 10c100c case to the 10c300c case,
average tortuosity decreases from 0.32 to 0.22 as the longer chains have greater possibility
to form entanglements than do shorter chains.
τor =
m∑i=1
n−1∑j=2
aij(j−1)l
(n− 1)m(3.6)
where aij stands for the distance between carbon atom j and carbon atom 1 in the ith polymer
chain with atom 1 at one end. l is the equilibrium length of one carbon-carbon bond.
The peak traction(T), the separation distance(S) and the separation energy(E) are obtained
for all the cases by averaging over the three simulations(as shown in Table 3.4 for r1 cases,
Table 3.5 for r2 cases, Table 3.6 for r3 cases). Table 3.7 provides averaged T, E and S over r1,
r2 and r3 for each case. The peak traction is calculated by averaging the peak force on the
graphene sheet over its area. Similar trends are observed for the force-separation responses
in the normal mode separations for all of the cases in the sensitivity study.
It is observed that upon the full separation, there are either polymer chains remaining with
the graphene sheet (Figure 3.7) or there are no polymer chains on the graphene sheet,
resulting in different third regions of force-separation relations, e.g. the force hovering just
above zero when there is residual polymer continuing to interact with the graphene sheet
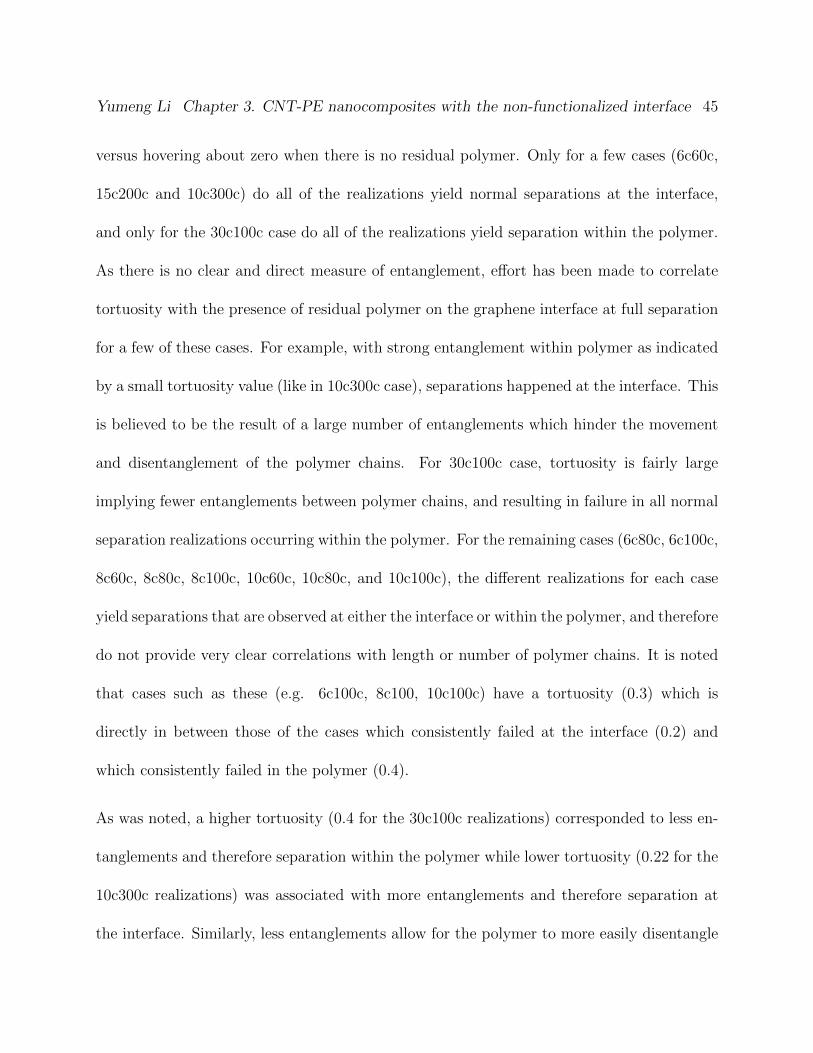
Yumeng Li Chapter 3. CNT-PE nanocomposites with the non-functionalized interface 45
versus hovering about zero when there is no residual polymer. Only for a few cases (6c60c,
15c200c and 10c300c) do all of the realizations yield normal separations at the interface,
and only for the 30c100c case do all of the realizations yield separation within the polymer.
As there is no clear and direct measure of entanglement, effort has been made to correlate
tortuosity with the presence of residual polymer on the graphene interface at full separation
for a few of these cases. For example, with strong entanglement within polymer as indicated
by a small tortuosity value (like in 10c300c case), separations happened at the interface. This
is believed to be the result of a large number of entanglements which hinder the movement
and disentanglement of the polymer chains. For 30c100c case, tortuosity is fairly large
implying fewer entanglements between polymer chains, and resulting in failure in all normal
separation realizations occurring within the polymer. For the remaining cases (6c80c, 6c100c,
8c60c, 8c80c, 8c100c, 10c60c, 10c80c, and 10c100c), the different realizations for each case
yield separations that are observed at either the interface or within the polymer, and therefore
do not provide very clear correlations with length or number of polymer chains. It is noted
that cases such as these (e.g. 6c100c, 8c100, 10c100c) have a tortuosity (0.3) which is
directly in between those of the cases which consistently failed at the interface (0.2) and
which consistently failed in the polymer (0.4).
As was noted, a higher tortuosity (0.4 for the 30c100c realizations) corresponded to less en-
tanglements and therefore separation within the polymer while lower tortuosity (0.22 for the
10c300c realizations) was associated with more entanglements and therefore separation at
the interface. Similarly, less entanglements allow for the polymer to more easily disentangle
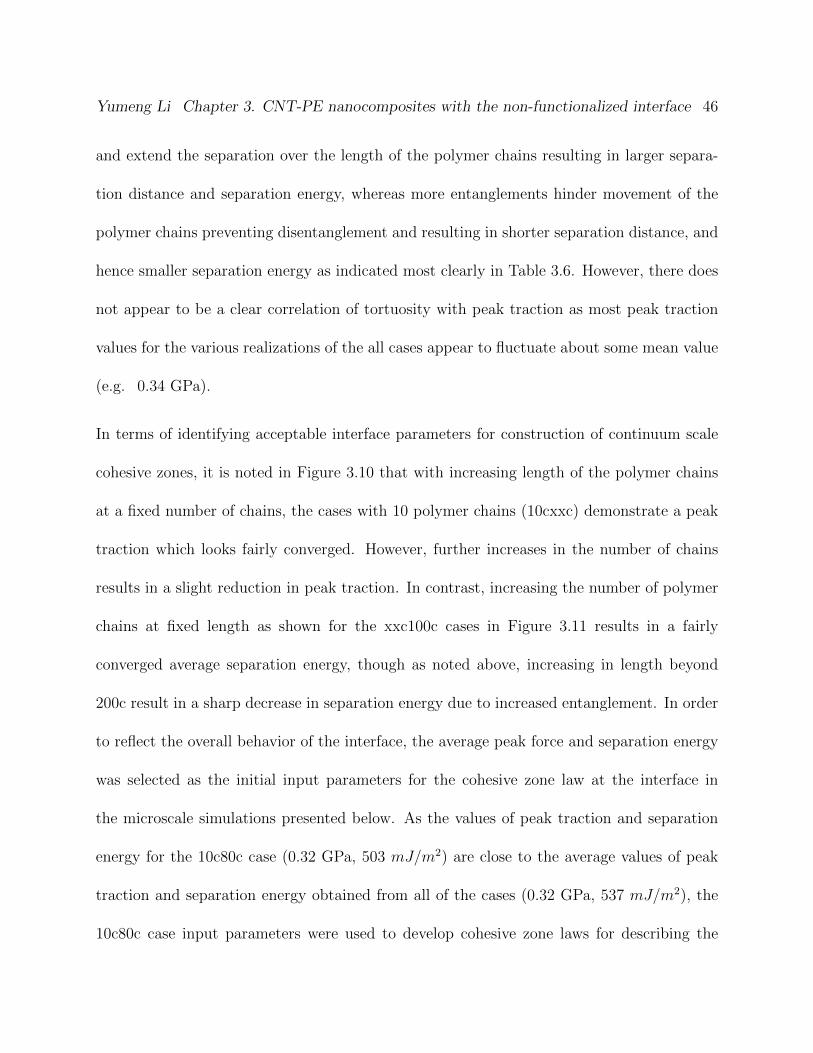
Yumeng Li Chapter 3. CNT-PE nanocomposites with the non-functionalized interface 46
and extend the separation over the length of the polymer chains resulting in larger separa-
tion distance and separation energy, whereas more entanglements hinder movement of the
polymer chains preventing disentanglement and resulting in shorter separation distance, and
hence smaller separation energy as indicated most clearly in Table 3.6. However, there does
not appear to be a clear correlation of tortuosity with peak traction as most peak traction
values for the various realizations of the all cases appear to fluctuate about some mean value
(e.g. 0.34 GPa).
In terms of identifying acceptable interface parameters for construction of continuum scale
cohesive zones, it is noted in Figure 3.10 that with increasing length of the polymer chains
at a fixed number of chains, the cases with 10 polymer chains (10cxxc) demonstrate a peak
traction which looks fairly converged. However, further increases in the number of chains
results in a slight reduction in peak traction. In contrast, increasing the number of polymer
chains at fixed length as shown for the xxc100c cases in Figure 3.11 results in a fairly
converged average separation energy, though as noted above, increasing in length beyond
200c result in a sharp decrease in separation energy due to increased entanglement. In order
to reflect the overall behavior of the interface, the average peak force and separation energy
was selected as the initial input parameters for the cohesive zone law at the interface in
the microscale simulations presented below. As the values of peak traction and separation
energy for the 10c80c case (0.32 GPa, 503 mJ/m2) are close to the average values of peak
traction and separation energy obtained from all of the cases (0.32 GPa, 537 mJ/m2), the
10c80c case input parameters were used to develop cohesive zone laws for describing the
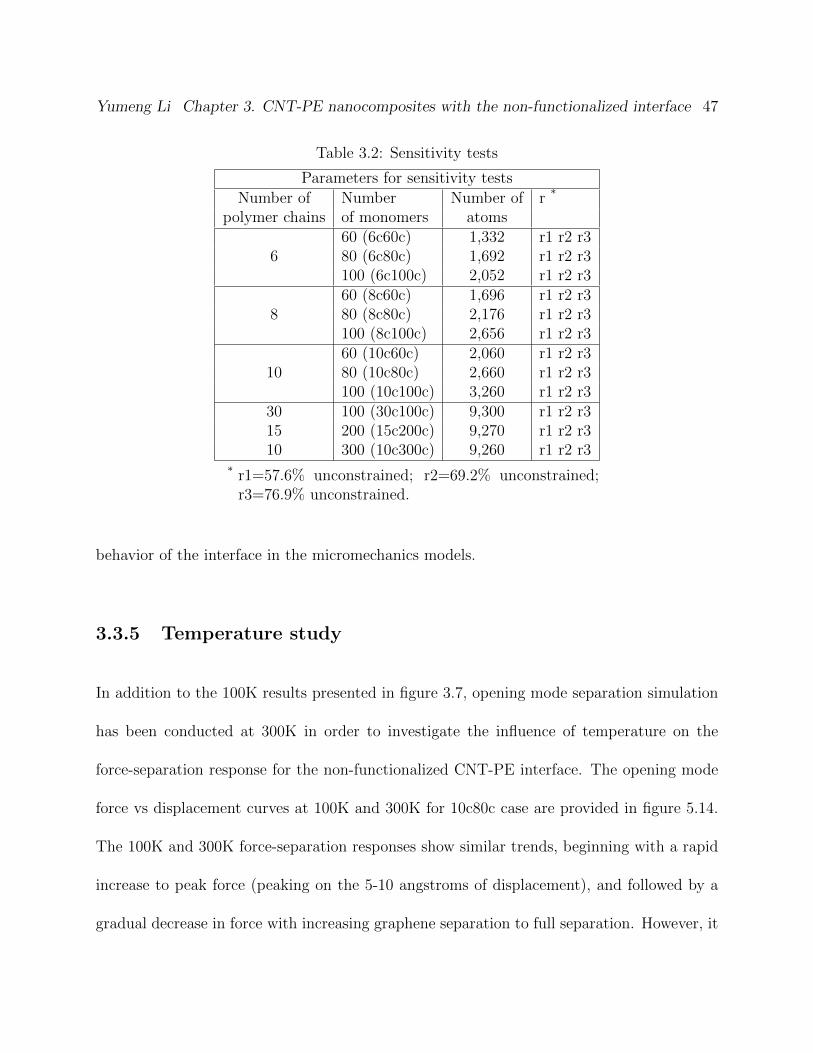
Yumeng Li Chapter 3. CNT-PE nanocomposites with the non-functionalized interface 47
Table 3.2: Sensitivity tests
Parameters for sensitivity tests
Number of Number Number of r *
polymer chains of monomers atoms
660 (6c60c) 1,332 r1 r2 r380 (6c80c) 1,692 r1 r2 r3100 (6c100c) 2,052 r1 r2 r3
860 (8c60c) 1,696 r1 r2 r380 (8c80c) 2,176 r1 r2 r3100 (8c100c) 2,656 r1 r2 r3
1060 (10c60c) 2,060 r1 r2 r380 (10c80c) 2,660 r1 r2 r3100 (10c100c) 3,260 r1 r2 r3
30 100 (30c100c) 9,300 r1 r2 r315 200 (15c200c) 9,270 r1 r2 r310 300 (10c300c) 9,260 r1 r2 r3
* r1=57.6% unconstrained; r2=69.2% unconstrained;r3=76.9% unconstrained.
behavior of the interface in the micromechanics models.
3.3.5 Temperature study
In addition to the 100K results presented in figure 3.7, opening mode separation simulation
has been conducted at 300K in order to investigate the influence of temperature on the
force-separation response for the non-functionalized CNT-PE interface. The opening mode
force vs displacement curves at 100K and 300K for 10c80c case are provided in figure 5.14.
The 100K and 300K force-separation responses show similar trends, beginning with a rapid
increase to peak force (peaking on the 5-10 angstroms of displacement), and followed by a
gradual decrease in force with increasing graphene separation to full separation. However, it
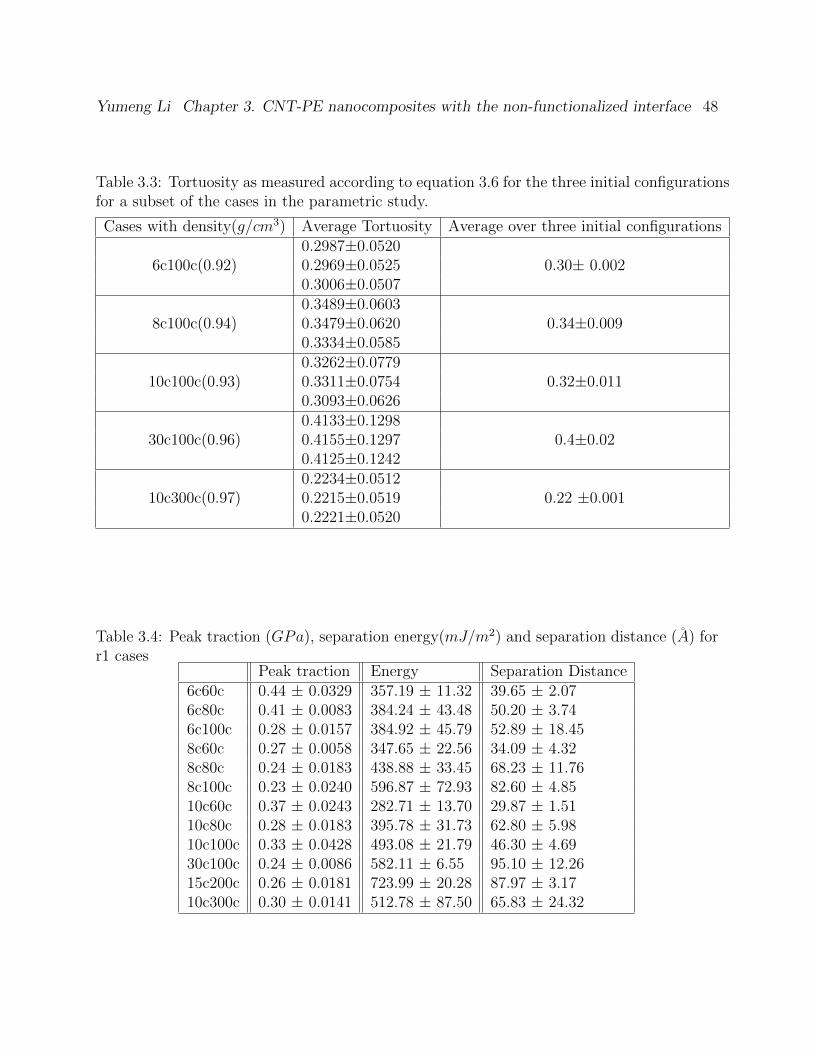
Yumeng Li Chapter 3. CNT-PE nanocomposites with the non-functionalized interface 48
Table 3.3: Tortuosity as measured according to equation 3.6 for the three initial configurationsfor a subset of the cases in the parametric study.
Cases with density(g/cm3) Average Tortuosity Average over three initial configurations
6c100c(0.92)0.2987±0.05200.2969±0.0525 0.30± 0.0020.3006±0.0507
8c100c(0.94)0.3489±0.06030.3479±0.0620 0.34±0.0090.3334±0.0585
10c100c(0.93)0.3262±0.07790.3311±0.0754 0.32±0.0110.3093±0.0626
30c100c(0.96)0.4133±0.12980.4155±0.1297 0.4±0.020.4125±0.1242
10c300c(0.97)0.2234±0.05120.2215±0.0519 0.22 ±0.0010.2221±0.0520
Table 3.4: Peak traction (GPa), separation energy(mJ/m2) and separation distance (A) forr1 cases
Peak traction Energy Separation Distance6c60c 0.44 ± 0.0329 357.19 ± 11.32 39.65 ± 2.076c80c 0.41 ± 0.0083 384.24 ± 43.48 50.20 ± 3.746c100c 0.28 ± 0.0157 384.92 ± 45.79 52.89 ± 18.458c60c 0.27 ± 0.0058 347.65 ± 22.56 34.09 ± 4.328c80c 0.24 ± 0.0183 438.88 ± 33.45 68.23 ± 11.768c100c 0.23 ± 0.0240 596.87 ± 72.93 82.60 ± 4.8510c60c 0.37 ± 0.0243 282.71 ± 13.70 29.87 ± 1.5110c80c 0.28 ± 0.0183 395.78 ± 31.73 62.80 ± 5.9810c100c 0.33 ± 0.0428 493.08 ± 21.79 46.30 ± 4.6930c100c 0.24 ± 0.0086 582.11 ± 6.55 95.10 ± 12.2615c200c 0.26 ± 0.0181 723.99 ± 20.28 87.97 ± 3.1710c300c 0.30 ± 0.0141 512.78 ± 87.50 65.83 ± 24.32
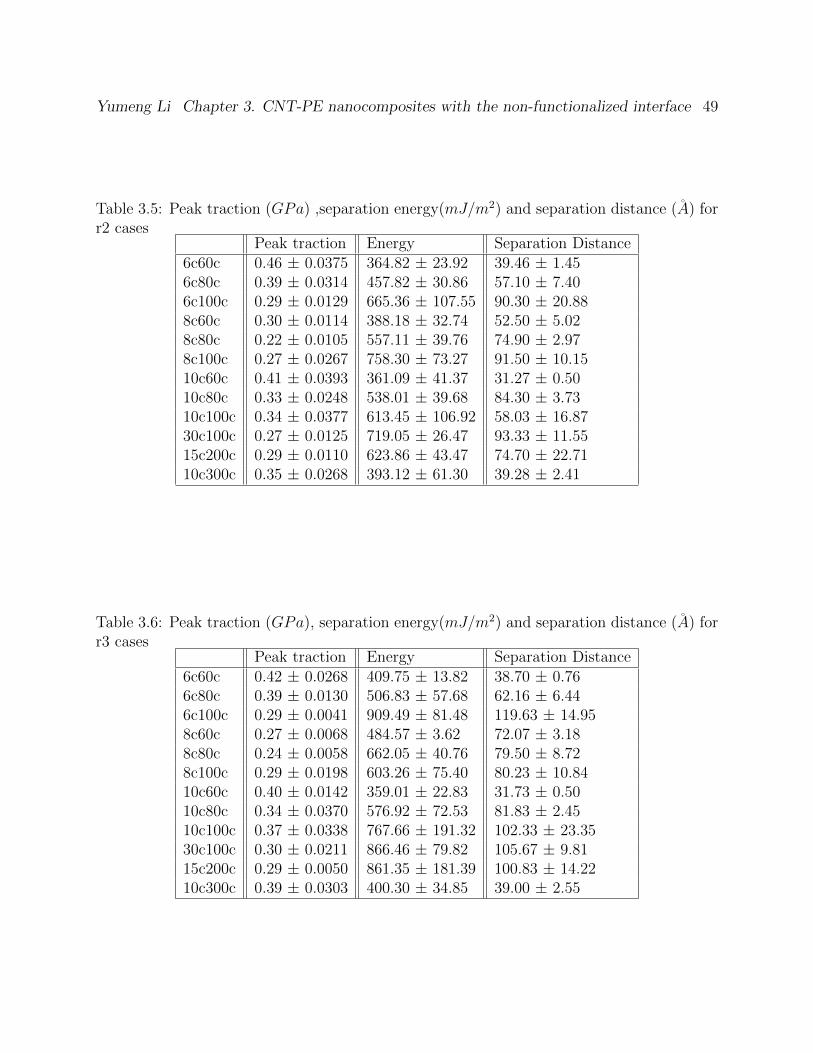
Yumeng Li Chapter 3. CNT-PE nanocomposites with the non-functionalized interface 49
Table 3.5: Peak traction (GPa) ,separation energy(mJ/m2) and separation distance (A) forr2 cases
Peak traction Energy Separation Distance6c60c 0.46 ± 0.0375 364.82 ± 23.92 39.46 ± 1.456c80c 0.39 ± 0.0314 457.82 ± 30.86 57.10 ± 7.406c100c 0.29 ± 0.0129 665.36 ± 107.55 90.30 ± 20.888c60c 0.30 ± 0.0114 388.18 ± 32.74 52.50 ± 5.028c80c 0.22 ± 0.0105 557.11 ± 39.76 74.90 ± 2.978c100c 0.27 ± 0.0267 758.30 ± 73.27 91.50 ± 10.1510c60c 0.41 ± 0.0393 361.09 ± 41.37 31.27 ± 0.5010c80c 0.33 ± 0.0248 538.01 ± 39.68 84.30 ± 3.7310c100c 0.34 ± 0.0377 613.45 ± 106.92 58.03 ± 16.8730c100c 0.27 ± 0.0125 719.05 ± 26.47 93.33 ± 11.5515c200c 0.29 ± 0.0110 623.86 ± 43.47 74.70 ± 22.7110c300c 0.35 ± 0.0268 393.12 ± 61.30 39.28 ± 2.41
Table 3.6: Peak traction (GPa), separation energy(mJ/m2) and separation distance (A) forr3 cases
Peak traction Energy Separation Distance6c60c 0.42 ± 0.0268 409.75 ± 13.82 38.70 ± 0.766c80c 0.39 ± 0.0130 506.83 ± 57.68 62.16 ± 6.446c100c 0.29 ± 0.0041 909.49 ± 81.48 119.63 ± 14.958c60c 0.27 ± 0.0068 484.57 ± 3.62 72.07 ± 3.188c80c 0.24 ± 0.0058 662.05 ± 40.76 79.50 ± 8.728c100c 0.29 ± 0.0198 603.26 ± 75.40 80.23 ± 10.8410c60c 0.40 ± 0.0142 359.01 ± 22.83 31.73 ± 0.5010c80c 0.34 ± 0.0370 576.92 ± 72.53 81.83 ± 2.4510c100c 0.37 ± 0.0338 767.66 ± 191.32 102.33 ± 23.3530c100c 0.30 ± 0.0211 866.46 ± 79.82 105.67 ± 9.8115c200c 0.29 ± 0.0050 861.35 ± 181.39 100.83 ± 14.2210c300c 0.39 ± 0.0303 400.30 ± 34.85 39.00 ± 2.55
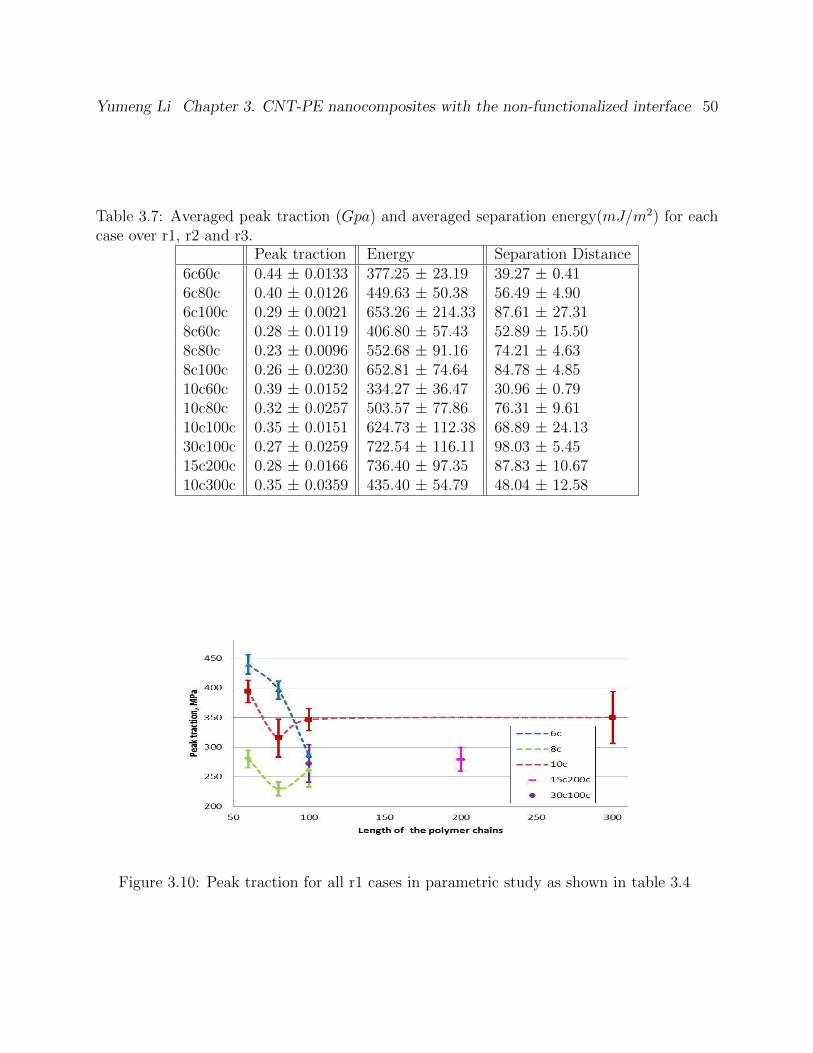
Yumeng Li Chapter 3. CNT-PE nanocomposites with the non-functionalized interface 50
Table 3.7: Averaged peak traction (Gpa) and averaged separation energy(mJ/m2) for eachcase over r1, r2 and r3.
Peak traction Energy Separation Distance6c60c 0.44 ± 0.0133 377.25 ± 23.19 39.27 ± 0.416c80c 0.40 ± 0.0126 449.63 ± 50.38 56.49 ± 4.906c100c 0.29 ± 0.0021 653.26 ± 214.33 87.61 ± 27.318c60c 0.28 ± 0.0119 406.80 ± 57.43 52.89 ± 15.508c80c 0.23 ± 0.0096 552.68 ± 91.16 74.21 ± 4.638c100c 0.26 ± 0.0230 652.81 ± 74.64 84.78 ± 4.8510c60c 0.39 ± 0.0152 334.27 ± 36.47 30.96 ± 0.7910c80c 0.32 ± 0.0257 503.57 ± 77.86 76.31 ± 9.6110c100c 0.35 ± 0.0151 624.73 ± 112.38 68.89 ± 24.1330c100c 0.27 ± 0.0259 722.54 ± 116.11 98.03 ± 5.4515c200c 0.28 ± 0.0166 736.40 ± 97.35 87.83 ± 10.6710c300c 0.35 ± 0.0359 435.40 ± 54.79 48.04 ± 12.58
Figure 3.10: Peak traction for all r1 cases in parametric study as shown in table 3.4
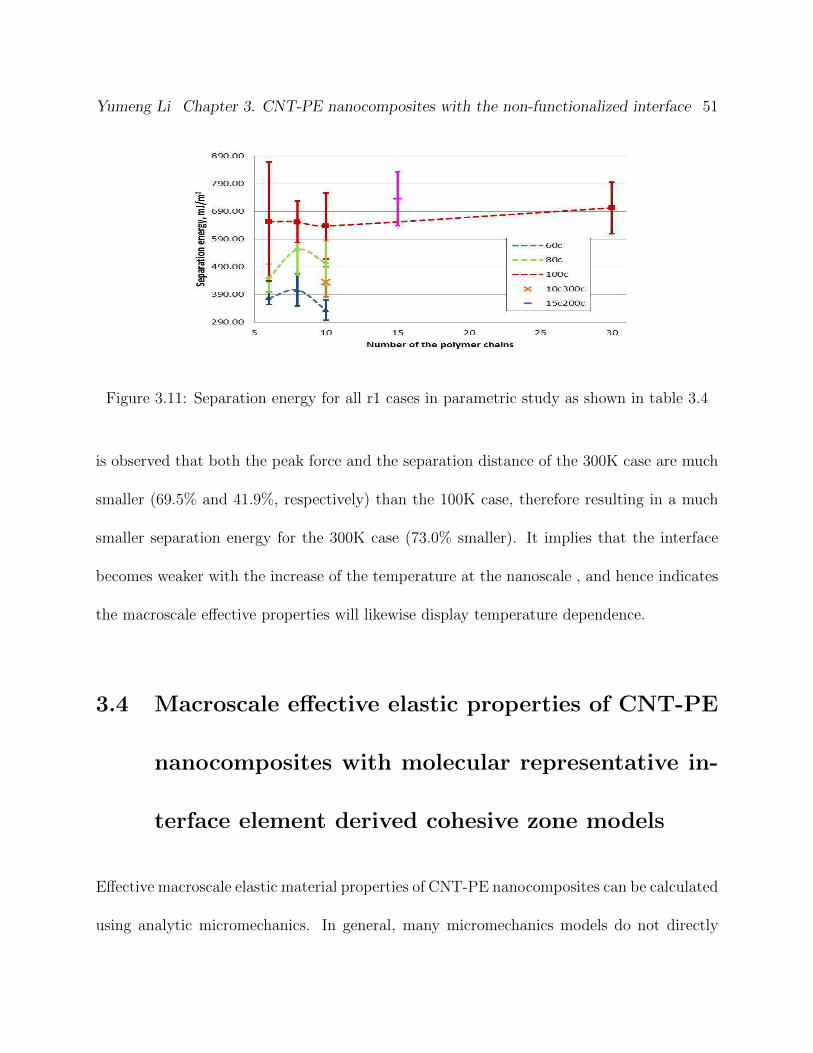
Yumeng Li Chapter 3. CNT-PE nanocomposites with the non-functionalized interface 51
Figure 3.11: Separation energy for all r1 cases in parametric study as shown in table 3.4
is observed that both the peak force and the separation distance of the 300K case are much
smaller (69.5% and 41.9%, respectively) than the 100K case, therefore resulting in a much
smaller separation energy for the 300K case (73.0% smaller). It implies that the interface
becomes weaker with the increase of the temperature at the nanoscale , and hence indicates
the macroscale effective properties will likewise display temperature dependence.
3.4 Macroscale effective elastic properties of CNT-PE
nanocomposites with molecular representative in-
terface element derived cohesive zone models
Effective macroscale elastic material properties of CNT-PE nanocomposites can be calculated
using analytic micromechanics. In general, many micromechanics models do not directly
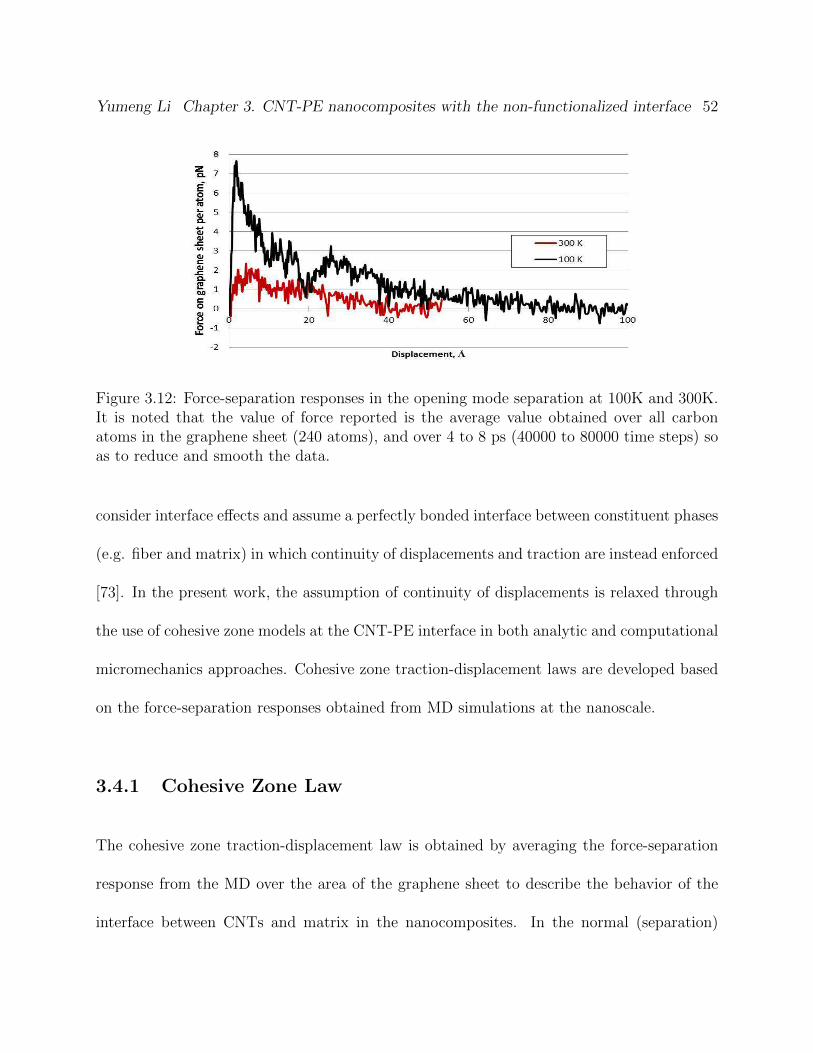
Yumeng Li Chapter 3. CNT-PE nanocomposites with the non-functionalized interface 52
Figure 3.12: Force-separation responses in the opening mode separation at 100K and 300K.It is noted that the value of force reported is the average value obtained over all carbonatoms in the graphene sheet (240 atoms), and over 4 to 8 ps (40000 to 80000 time steps) soas to reduce and smooth the data.
consider interface effects and assume a perfectly bonded interface between constituent phases
(e.g. fiber and matrix) in which continuity of displacements and traction are instead enforced
[73]. In the present work, the assumption of continuity of displacements is relaxed through
the use of cohesive zone models at the CNT-PE interface in both analytic and computational
micromechanics approaches. Cohesive zone traction-displacement laws are developed based
on the force-separation responses obtained from MD simulations at the nanoscale.
3.4.1 Cohesive Zone Law
The cohesive zone traction-displacement law is obtained by averaging the force-separation
response from the MD over the area of the graphene sheet to describe the behavior of the
interface between CNTs and matrix in the nanocomposites. In the normal (separation)
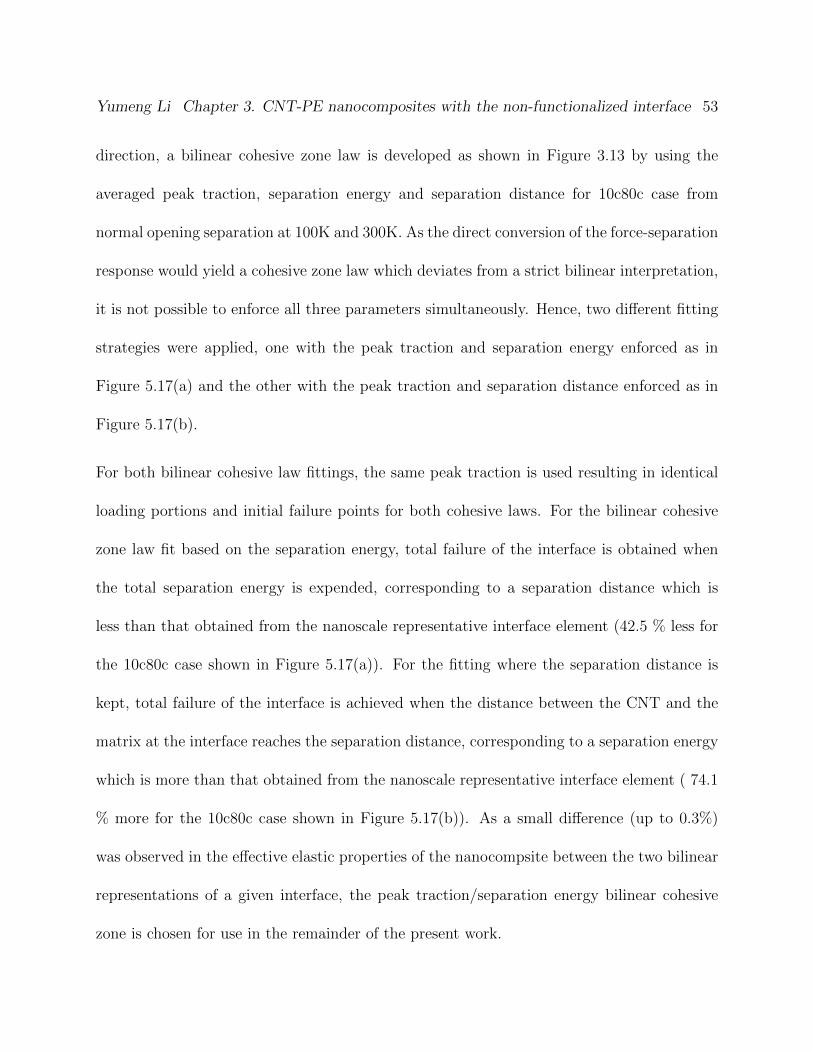
Yumeng Li Chapter 3. CNT-PE nanocomposites with the non-functionalized interface 53
direction, a bilinear cohesive zone law is developed as shown in Figure 3.13 by using the
averaged peak traction, separation energy and separation distance for 10c80c case from
normal opening separation at 100K and 300K. As the direct conversion of the force-separation
response would yield a cohesive zone law which deviates from a strict bilinear interpretation,
it is not possible to enforce all three parameters simultaneously. Hence, two different fitting
strategies were applied, one with the peak traction and separation energy enforced as in
Figure 5.17(a) and the other with the peak traction and separation distance enforced as in
Figure 5.17(b).
For both bilinear cohesive law fittings, the same peak traction is used resulting in identical
loading portions and initial failure points for both cohesive laws. For the bilinear cohesive
zone law fit based on the separation energy, total failure of the interface is obtained when
the total separation energy is expended, corresponding to a separation distance which is
less than that obtained from the nanoscale representative interface element (42.5 % less for
the 10c80c case shown in Figure 5.17(a)). For the fitting where the separation distance is
kept, total failure of the interface is achieved when the distance between the CNT and the
matrix at the interface reaches the separation distance, corresponding to a separation energy
which is more than that obtained from the nanoscale representative interface element ( 74.1
% more for the 10c80c case shown in Figure 5.17(b)). As a small difference (up to 0.3%)
was observed in the effective elastic properties of the nanocompsite between the two bilinear
representations of a given interface, the peak traction/separation energy bilinear cohesive
zone is chosen for use in the remainder of the present work.
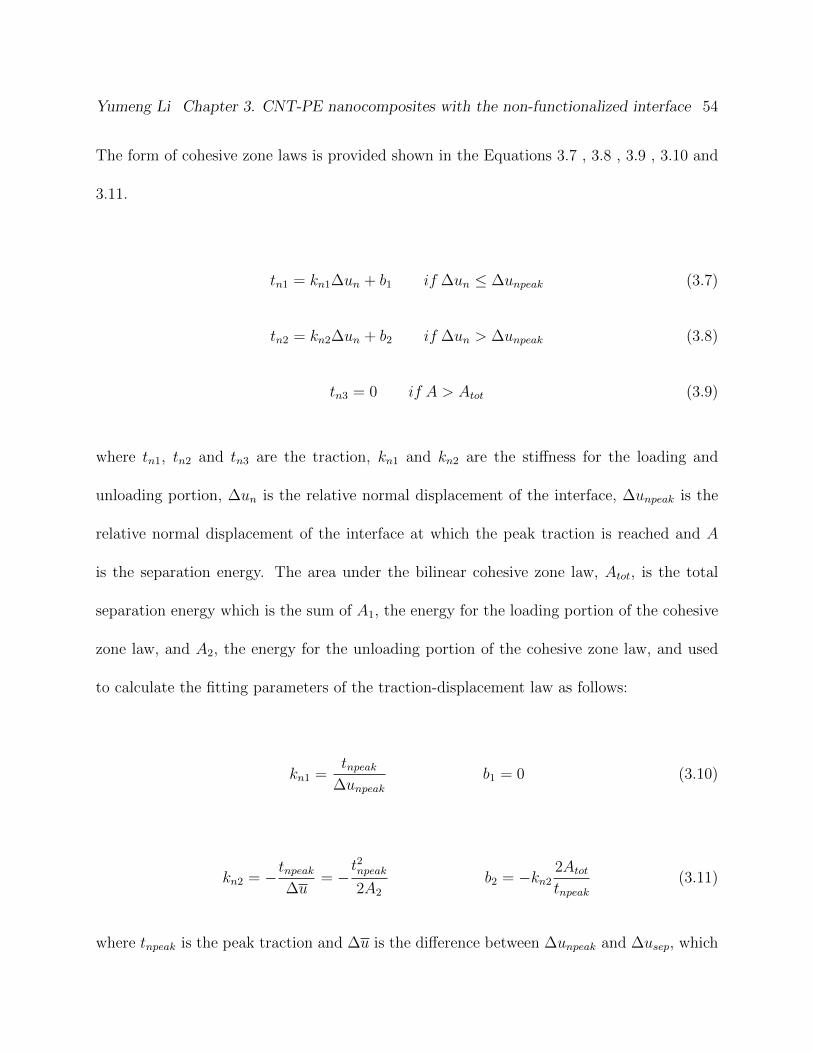
Yumeng Li Chapter 3. CNT-PE nanocomposites with the non-functionalized interface 54
The form of cohesive zone laws is provided shown in the Equations 3.7 , 3.8 , 3.9 , 3.10 and
3.11.
tn1 = kn1∆un + b1 if ∆un ≤ ∆unpeak (3.7)
tn2 = kn2∆un + b2 if ∆un > ∆unpeak (3.8)
tn3 = 0 if A > Atot (3.9)
where tn1, tn2 and tn3 are the traction, kn1 and kn2 are the stiffness for the loading and
unloading portion, ∆un is the relative normal displacement of the interface, ∆unpeak is the
relative normal displacement of the interface at which the peak traction is reached and A
is the separation energy. The area under the bilinear cohesive zone law, Atot, is the total
separation energy which is the sum of A1, the energy for the loading portion of the cohesive
zone law, and A2, the energy for the unloading portion of the cohesive zone law, and used
to calculate the fitting parameters of the traction-displacement law as follows:
kn1 =tnpeak
∆unpeakb1 = 0 (3.10)
kn2 = −tnpeak∆u
= −t2npeak2A2
b2 = −kn22Atottnpeak
(3.11)
where tnpeak is the peak traction and ∆u is the difference between ∆unpeak and ∆usep, which
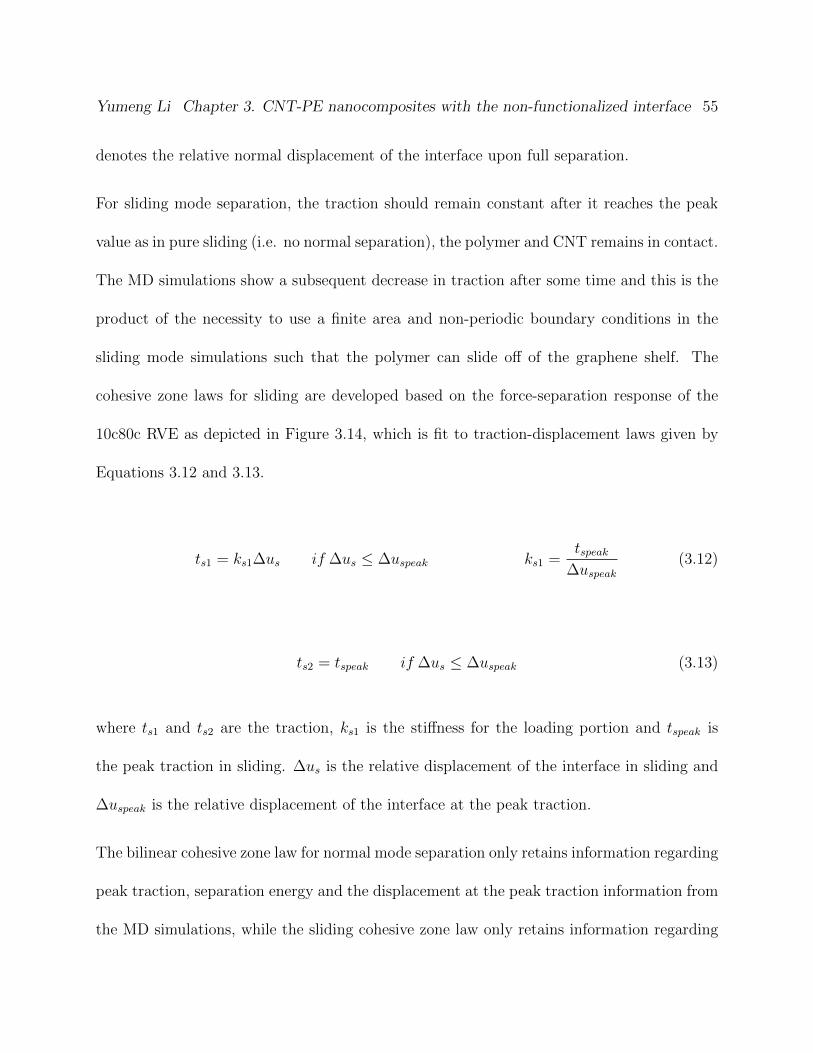
Yumeng Li Chapter 3. CNT-PE nanocomposites with the non-functionalized interface 55
denotes the relative normal displacement of the interface upon full separation.
For sliding mode separation, the traction should remain constant after it reaches the peak
value as in pure sliding (i.e. no normal separation), the polymer and CNT remains in contact.
The MD simulations show a subsequent decrease in traction after some time and this is the
product of the necessity to use a finite area and non-periodic boundary conditions in the
sliding mode simulations such that the polymer can slide off of the graphene shelf. The
cohesive zone laws for sliding are developed based on the force-separation response of the
10c80c RVE as depicted in Figure 3.14, which is fit to traction-displacement laws given by
Equations 3.12 and 3.13.
ts1 = ks1∆us if ∆us ≤ ∆uspeak ks1 =tspeak
∆uspeak(3.12)
ts2 = tspeak if ∆us ≤ ∆uspeak (3.13)
where ts1 and ts2 are the traction, ks1 is the stiffness for the loading portion and tspeak is
the peak traction in sliding. ∆us is the relative displacement of the interface in sliding and
∆uspeak is the relative displacement of the interface at the peak traction.
The bilinear cohesive zone law for normal mode separation only retains information regarding
peak traction, separation energy and the displacement at the peak traction information from
the MD simulations, while the sliding cohesive zone law only retains information regarding
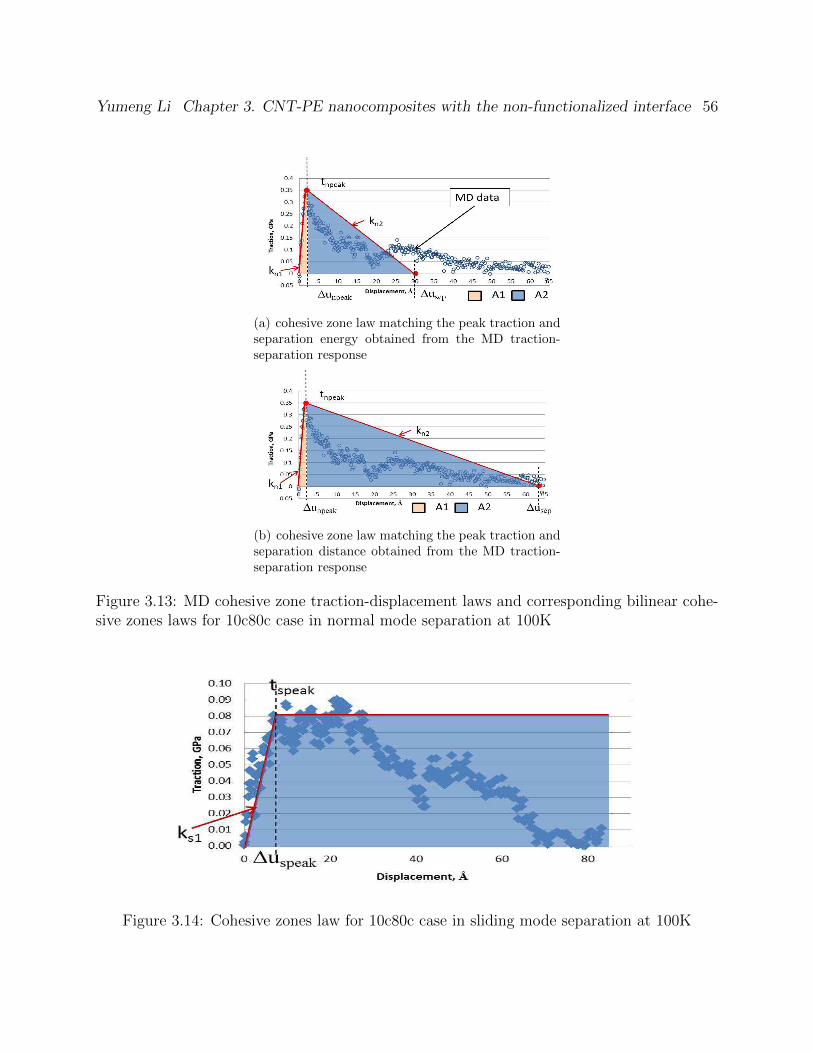
Yumeng Li Chapter 3. CNT-PE nanocomposites with the non-functionalized interface 56
(a) cohesive zone law matching the peak traction andseparation energy obtained from the MD traction-separation response
(b) cohesive zone law matching the peak traction andseparation distance obtained from the MD traction-separation response
Figure 3.13: MD cohesive zone traction-displacement laws and corresponding bilinear cohe-sive zones laws for 10c80c case in normal mode separation at 100K
Figure 3.14: Cohesive zones law for 10c80c case in sliding mode separation at 100K
Yumeng Li Chapter 3. CNT-PE nanocomposites with the non-functionalized interface 57
peak traction and the displacement at the peak traction information. Therefore only through
these retained values does the influence of atomistic details such number and length of
polymer chains, tortuosity, and temperature get transferred to the higher continuum scales.
All other atomistic details, e.g. which polymer chain was closest to the graphene interface
and how entangled it was with other polymer chains, is not directly retained, though they
contribute to the error bars on the retained parameters. The big advantage in transferring
a reduced set of MD information to the continuum scale through the cohesive zones is that
the continuum simulations do not become restricted to atomistic time scales.
3.4.2 Application of Bilinear Cohesive Zone Law in Analytic Mi-
cromechanics Approach
A composite cylinder model (CCM) ([42, 43]) with an innermost layer corresponding to
the hollow CNT and outermost layer consisting of the matrix material is used to obtain
the effective elastic properties for CNT-PE nanocomposites with aligned, high aspect ration
CNTs. Between the CNT and PE layers the traction-displacement law for the fit cohesive
zone is applied. Here we summarize the application of the model towards obtaining the
macroscale effective in-plane bulk modulus (K23). For this case, the ith layer displacement
field is given by:
u(i)r = D(i)1 r +
D(i)2
r(3.14)
Yumeng Li Chapter 3. CNT-PE nanocomposites with the non-functionalized interface 58
u(i)θ = 0 (3.15)
u(i)z = 0 (3.16)
where D(i)1 and D
(i)2 are constants determined from the boundary and matching conditions.
The boundary conditions are given by:
u(N)r (r = rN) = ε0rN (3.17)
σ(1)rr (r = r0) = 0 (3.18)
where r0 is the CNT inner radius, N and 1 denote the matrix layer and CNT layer of the
N=2 composite cylinder assemblage as in Figure 3.15, respectively, and where rN is obtained
in terms of CNT outer radius and volume fraction, vf , from:
rN =
√(r1)2
vf(3.19)
These boundary conditions correspond to a uniform radial strain at the outer boundary and
a traction-free condition within the hollow of the CNT. For the perfect bonding case, the
matching conditions are given by:
u(j)r (r = ri) = u(j+1)r (r = ri) (3.20)
Yumeng Li Chapter 3. CNT-PE nanocomposites with the non-functionalized interface 59
σ(j)rr (r = ri) = σ(j+1)
rr (r = ri) (3.21)
where j ranges from 1 to N-1. These matching conditions correspond to continuity of dis-
placements and tractions at the CNT-PE interface. In the present work, the continuity of
displacement condition is relaxed such that the interface condition becomes
u(1)r (r = r1) = u(2)r (r = r1)−∆u (3.22)
where the relative displacement (∆u) of the interface is given by the auxiliary equation
describing the bilinear cohesive zone as:
σ(1)rr (r = r1) = σ(2)
rr (r = r1) = tnm = knm∆un + bm (3.23)
where m takes a value of 1 or 2 depending on the cohesive zone in the loading or unloading
region of the bilinear cohesive zone law for normal mode separation. It is noted that the
axisymmetric nature of the assemblage geometry and boundary conditions result in the
interface only being subject to normal separation so that the sliding mode need not be
considered. In both the perfectly bonded and cohesive zone interfaces, the effective in-plane
bulk modulus can be obtained from the strain energy equivalency between the composite
cylinder assemblage and an effective homogeneous cylinder. It can be expressed in terms of
the radial stress and displacement at the outer boundary of the matrix as:
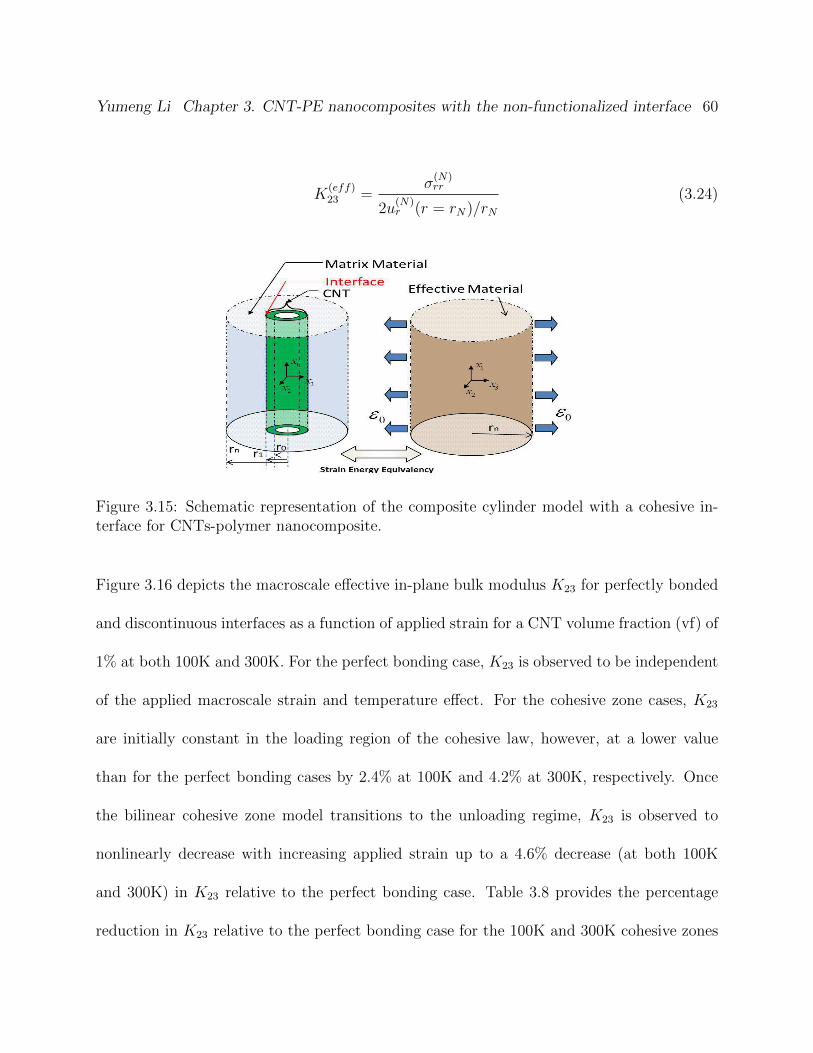
Yumeng Li Chapter 3. CNT-PE nanocomposites with the non-functionalized interface 60
K(eff)23 =
σ(N)rr
2u(N)r (r = rN)/rN
(3.24)
Figure 3.15: Schematic representation of the composite cylinder model with a cohesive in-terface for CNTs-polymer nanocomposite.
Figure 3.16 depicts the macroscale effective in-plane bulk modulus K23 for perfectly bonded
and discontinuous interfaces as a function of applied strain for a CNT volume fraction (vf) of
1% at both 100K and 300K. For the perfect bonding case, K23 is observed to be independent
of the applied macroscale strain and temperature effect. For the cohesive zone cases, K23
are initially constant in the loading region of the cohesive law, however, at a lower value
than for the perfect bonding cases by 2.4% at 100K and 4.2% at 300K, respectively. Once
the bilinear cohesive zone model transitions to the unloading regime, K23 is observed to
nonlinearly decrease with increasing applied strain up to a 4.6% decrease (at both 100K
and 300K) in K23 relative to the perfect bonding case. Table 3.8 provides the percentage
reduction in K23 relative to the perfect bonding case for the 100K and 300K cohesive zones
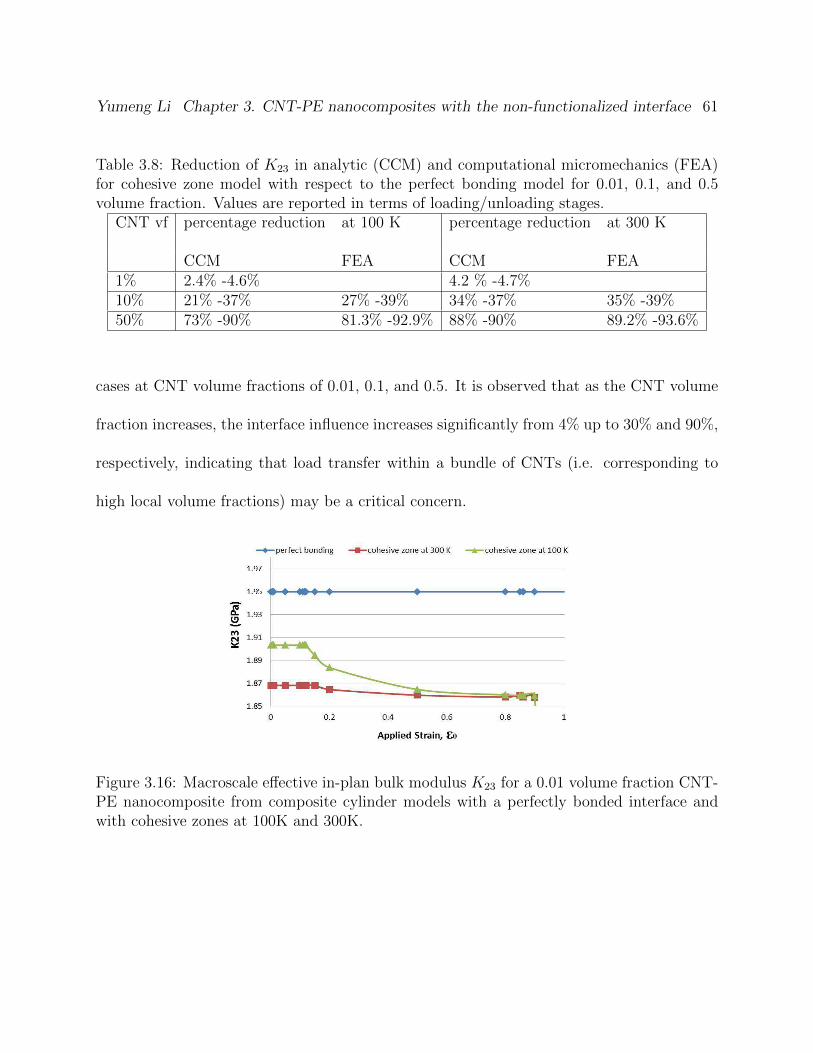
Yumeng Li Chapter 3. CNT-PE nanocomposites with the non-functionalized interface 61
Table 3.8: Reduction of K23 in analytic (CCM) and computational micromechanics (FEA)for cohesive zone model with respect to the perfect bonding model for 0.01, 0.1, and 0.5volume fraction. Values are reported in terms of loading/unloading stages.
CNT vf percentage reduction at 100 K percentage reduction at 300 K
CCM FEA CCM FEA1% 2.4% -4.6% 4.2 % -4.7%10% 21% -37% 27% -39% 34% -37% 35% -39%50% 73% -90% 81.3% -92.9% 88% -90% 89.2% -93.6%
cases at CNT volume fractions of 0.01, 0.1, and 0.5. It is observed that as the CNT volume
fraction increases, the interface influence increases significantly from 4% up to 30% and 90%,
respectively, indicating that load transfer within a bundle of CNTs (i.e. corresponding to
high local volume fractions) may be a critical concern.
Figure 3.16: Macroscale effective in-plan bulk modulus K23 for a 0.01 volume fraction CNT-PE nanocomposite from composite cylinder models with a perfectly bonded interface andwith cohesive zones at 100K and 300K.
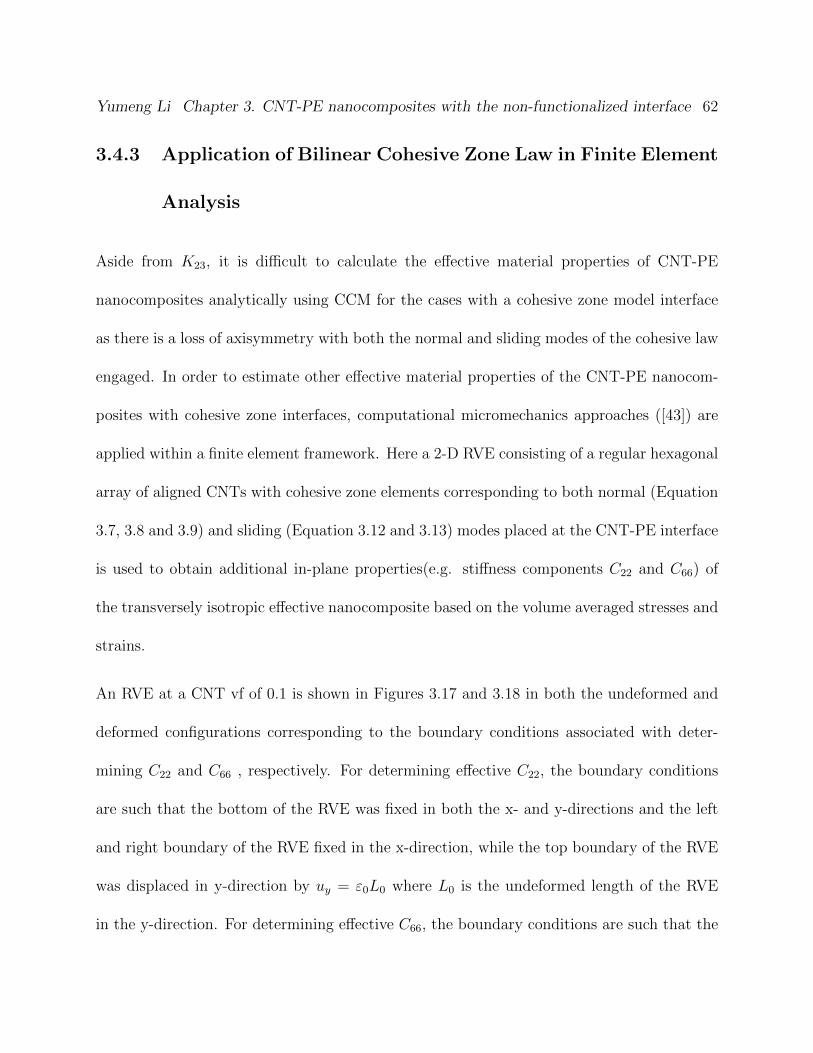
Yumeng Li Chapter 3. CNT-PE nanocomposites with the non-functionalized interface 62
3.4.3 Application of Bilinear Cohesive Zone Law in Finite Element
Analysis
Aside from K23, it is difficult to calculate the effective material properties of CNT-PE
nanocomposites analytically using CCM for the cases with a cohesive zone model interface
as there is a loss of axisymmetry with both the normal and sliding modes of the cohesive law
engaged. In order to estimate other effective material properties of the CNT-PE nanocom-
posites with cohesive zone interfaces, computational micromechanics approaches ([43]) are
applied within a finite element framework. Here a 2-D RVE consisting of a regular hexagonal
array of aligned CNTs with cohesive zone elements corresponding to both normal (Equation
3.7, 3.8 and 3.9) and sliding (Equation 3.12 and 3.13) modes placed at the CNT-PE interface
is used to obtain additional in-plane properties(e.g. stiffness components C22 and C66) of
the transversely isotropic effective nanocomposite based on the volume averaged stresses and
strains.
An RVE at a CNT vf of 0.1 is shown in Figures 3.17 and 3.18 in both the undeformed and
deformed configurations corresponding to the boundary conditions associated with deter-
mining C22 and C66 , respectively. For determining effective C22, the boundary conditions
are such that the bottom of the RVE was fixed in both the x- and y-directions and the left
and right boundary of the RVE fixed in the x-direction, while the top boundary of the RVE
was displaced in y-direction by uy = ε0L0 where L0 is the undeformed length of the RVE
in the y-direction. For determining effective C66, the boundary conditions are such that the
Yumeng Li Chapter 3. CNT-PE nanocomposites with the non-functionalized interface 63
left and right boundary of the RVE was fixed in y-direction with the bottom still fixed in
both direction and a displacement boundary condition of ux = 2ε0L0 in x-direction along
the top boundary.
From the deformed configurations in Figure 3.17(a) and 3.18(a) corresponding to the C22
and C66 boundary conditions, respectively, at a applied strain level of 0.75 one can note
the influence of the cohesive zones on the interface separation and stress distribution in the
polymer matrix and CNT. It is noted that some of the cohesive zones in the interface regions
have achieved complete failure, i.e. have fully separated. Table 3.9 provides the percentage
reduction of C22 and C66 relative to perfect bonding case for the 100K and 300K cohesive
zone cases at CNT volume fraction of 0.1 and 0.5 in FEA. Effective C22 and C66 at 100K
and 300K are provided in Figure3.19 with applied strain for CNT-PE nanocomposites with
a CNT volume fraction of 0.1. For small range of strain, constant C22 and C66 are given for
perfect bonding cases at both 100K and 300K. For cohesive zone models, C22 is constant in
the strain range of 0-0.12 and then begins to nonlinearly decrease with further increasing
of the applied load in an analogous manner as was observed for the composite cylinder K23
results. This transition corresponds to the loading and unloading regimes of the normal
opening cohesive zone law and therefore indicates that normal separation of the cohesive
zones dominates the effective property response for C22. In contrast to C22 , the effective
C66 results do not demonstrate a clear loading region. Instead, the effective C66 begins with
an increasing region which reaches a maximum near the transition strain level observed in
the C22 results and subsequently decays. This markedly different behavior is believed to be
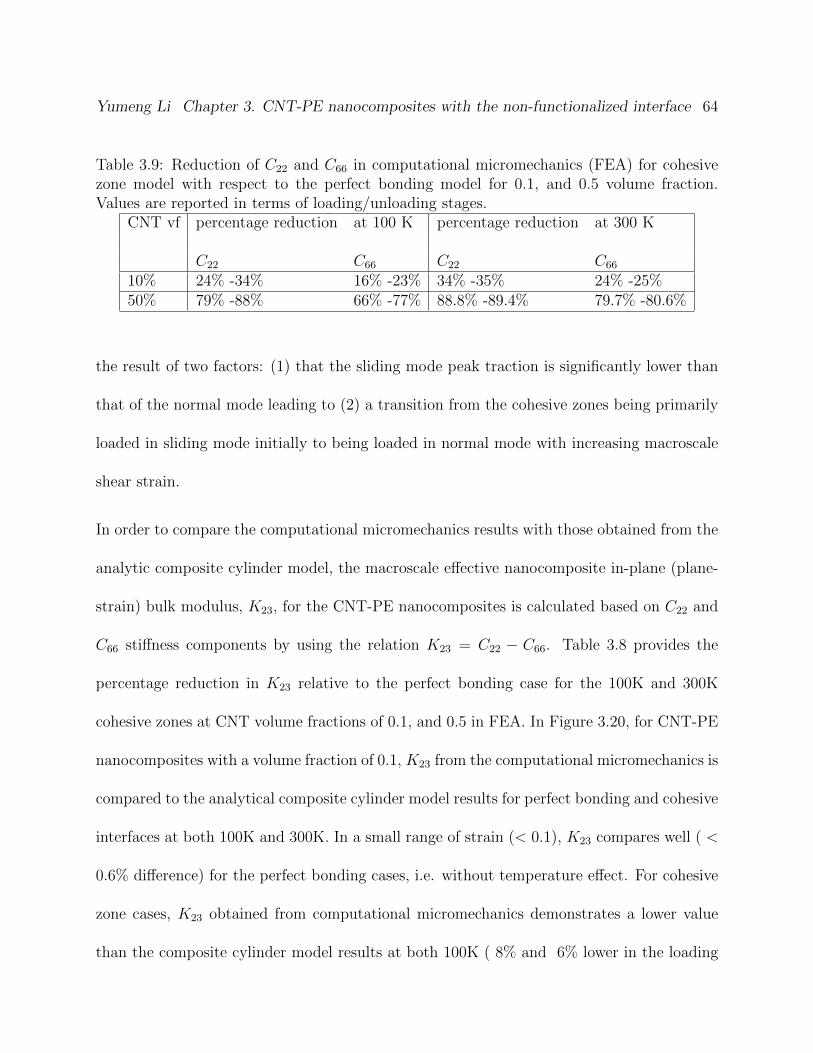
Yumeng Li Chapter 3. CNT-PE nanocomposites with the non-functionalized interface 64
Table 3.9: Reduction of C22 and C66 in computational micromechanics (FEA) for cohesivezone model with respect to the perfect bonding model for 0.1, and 0.5 volume fraction.Values are reported in terms of loading/unloading stages.
CNT vf percentage reduction at 100 K percentage reduction at 300 K
C22 C66 C22 C66
10% 24% -34% 16% -23% 34% -35% 24% -25%50% 79% -88% 66% -77% 88.8% -89.4% 79.7% -80.6%
the result of two factors: (1) that the sliding mode peak traction is significantly lower than
that of the normal mode leading to (2) a transition from the cohesive zones being primarily
loaded in sliding mode initially to being loaded in normal mode with increasing macroscale
shear strain.
In order to compare the computational micromechanics results with those obtained from the
analytic composite cylinder model, the macroscale effective nanocomposite in-plane (plane-
strain) bulk modulus, K23, for the CNT-PE nanocomposites is calculated based on C22 and
C66 stiffness components by using the relation K23 = C22 − C66. Table 3.8 provides the
percentage reduction in K23 relative to the perfect bonding case for the 100K and 300K
cohesive zones at CNT volume fractions of 0.1, and 0.5 in FEA. In Figure 3.20, for CNT-PE
nanocomposites with a volume fraction of 0.1, K23 from the computational micromechanics is
compared to the analytical composite cylinder model results for perfect bonding and cohesive
interfaces at both 100K and 300K. In a small range of strain (< 0.1), K23 compares well ( <
0.6% difference) for the perfect bonding cases, i.e. without temperature effect. For cohesive
zone cases, K23 obtained from computational micromechanics demonstrates a lower value
than the composite cylinder model results at both 100K ( 8% and 6% lower in the loading
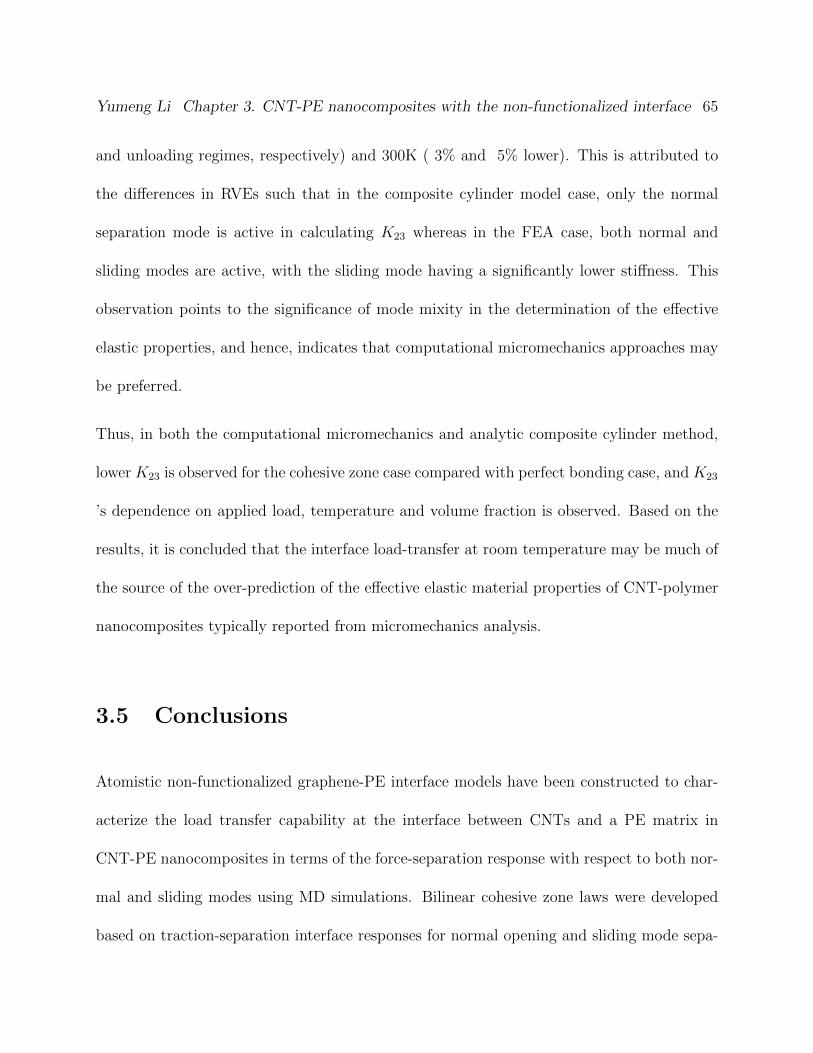
Yumeng Li Chapter 3. CNT-PE nanocomposites with the non-functionalized interface 65
and unloading regimes, respectively) and 300K ( 3% and 5% lower). This is attributed to
the differences in RVEs such that in the composite cylinder model case, only the normal
separation mode is active in calculating K23 whereas in the FEA case, both normal and
sliding modes are active, with the sliding mode having a significantly lower stiffness. This
observation points to the significance of mode mixity in the determination of the effective
elastic properties, and hence, indicates that computational micromechanics approaches may
be preferred.
Thus, in both the computational micromechanics and analytic composite cylinder method,
lower K23 is observed for the cohesive zone case compared with perfect bonding case, and K23
’s dependence on applied load, temperature and volume fraction is observed. Based on the
results, it is concluded that the interface load-transfer at room temperature may be much of
the source of the over-prediction of the effective elastic material properties of CNT-polymer
nanocomposites typically reported from micromechanics analysis.
3.5 Conclusions
Atomistic non-functionalized graphene-PE interface models have been constructed to char-
acterize the load transfer capability at the interface between CNTs and a PE matrix in
CNT-PE nanocomposites in terms of the force-separation response with respect to both nor-
mal and sliding modes using MD simulations. Bilinear cohesive zone laws were developed
based on traction-separation interface responses for normal opening and sliding mode sepa-
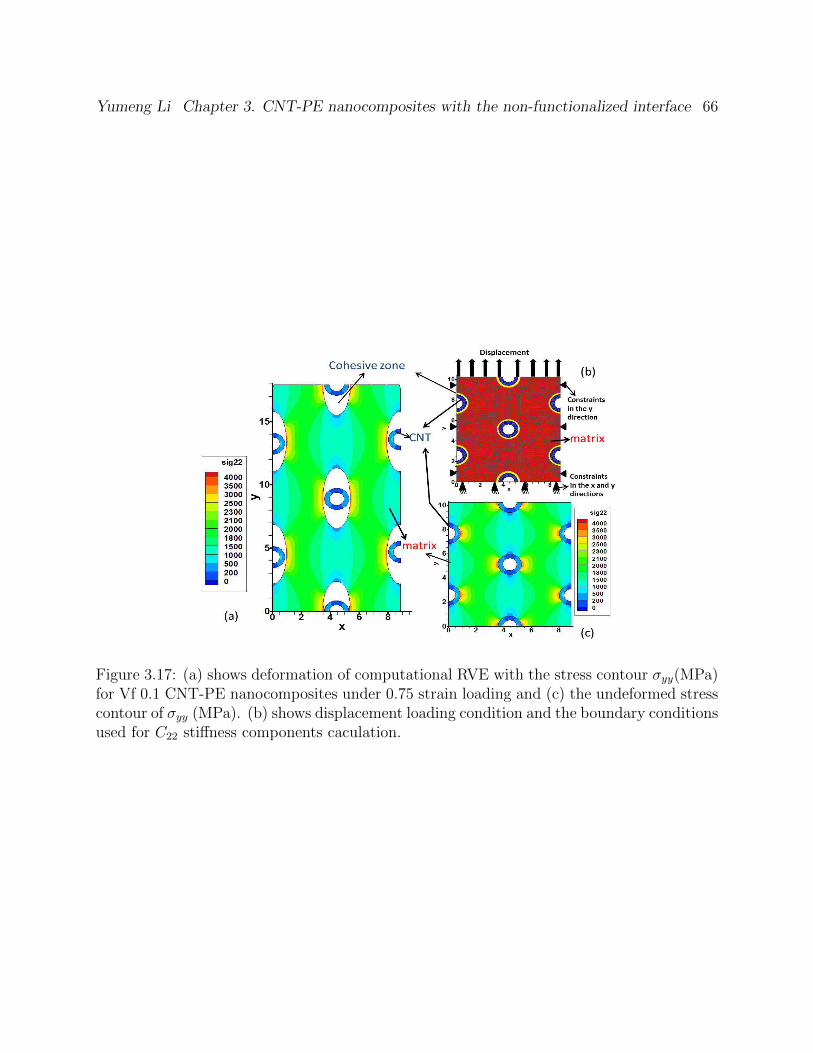
Yumeng Li Chapter 3. CNT-PE nanocomposites with the non-functionalized interface 66
Figure 3.17: (a) shows deformation of computational RVE with the stress contour σyy(MPa)for Vf 0.1 CNT-PE nanocomposites under 0.75 strain loading and (c) the undeformed stresscontour of σyy (MPa). (b) shows displacement loading condition and the boundary conditionsused for C22 stiffness components caculation.
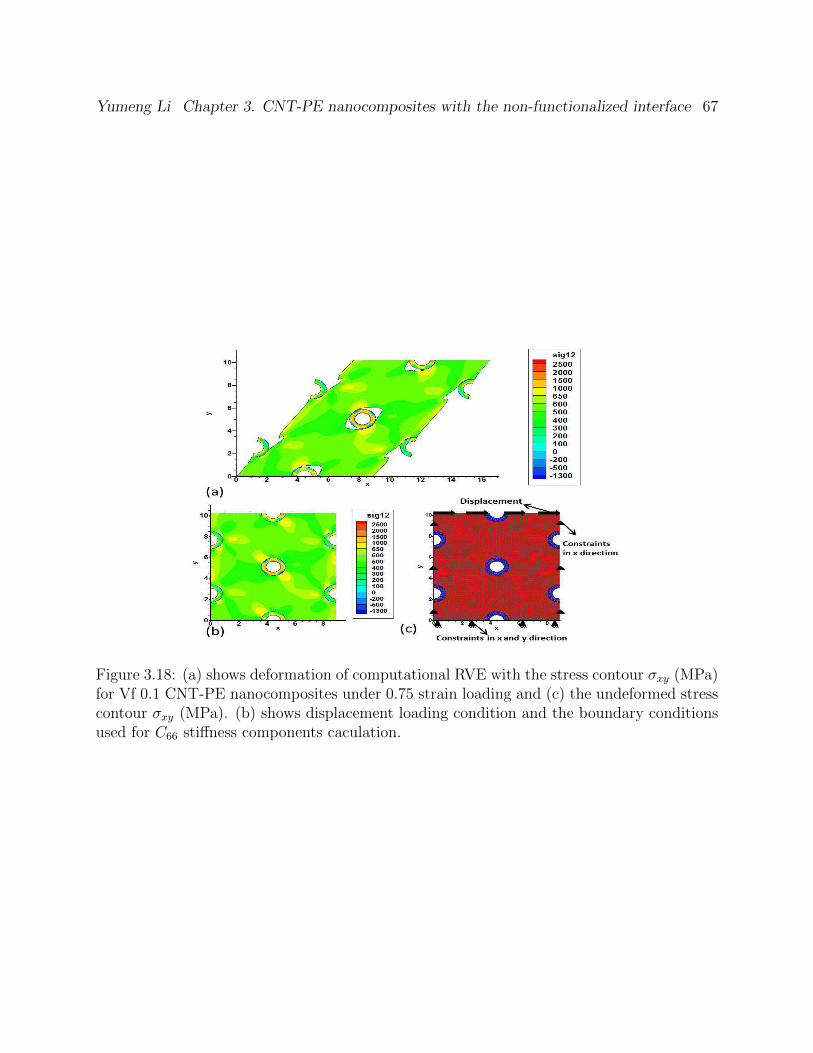
Yumeng Li Chapter 3. CNT-PE nanocomposites with the non-functionalized interface 67
Figure 3.18: (a) shows deformation of computational RVE with the stress contour σxy (MPa)for Vf 0.1 CNT-PE nanocomposites under 0.75 strain loading and (c) the undeformed stresscontour σxy (MPa). (b) shows displacement loading condition and the boundary conditionsused for C66 stiffness components caculation.
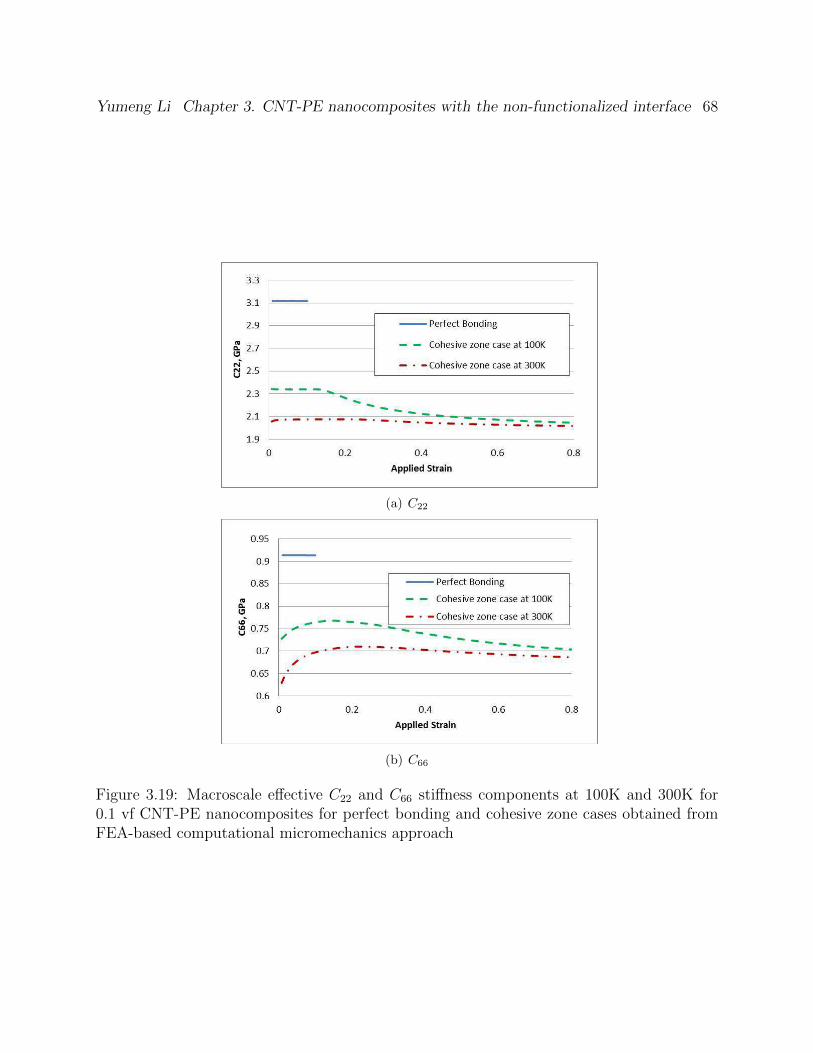
Yumeng Li Chapter 3. CNT-PE nanocomposites with the non-functionalized interface 68
(a) C22
(b) C66
Figure 3.19: Macroscale effective C22 and C66 stiffness components at 100K and 300K for0.1 vf CNT-PE nanocomposites for perfect bonding and cohesive zone cases obtained fromFEA-based computational micromechanics approach
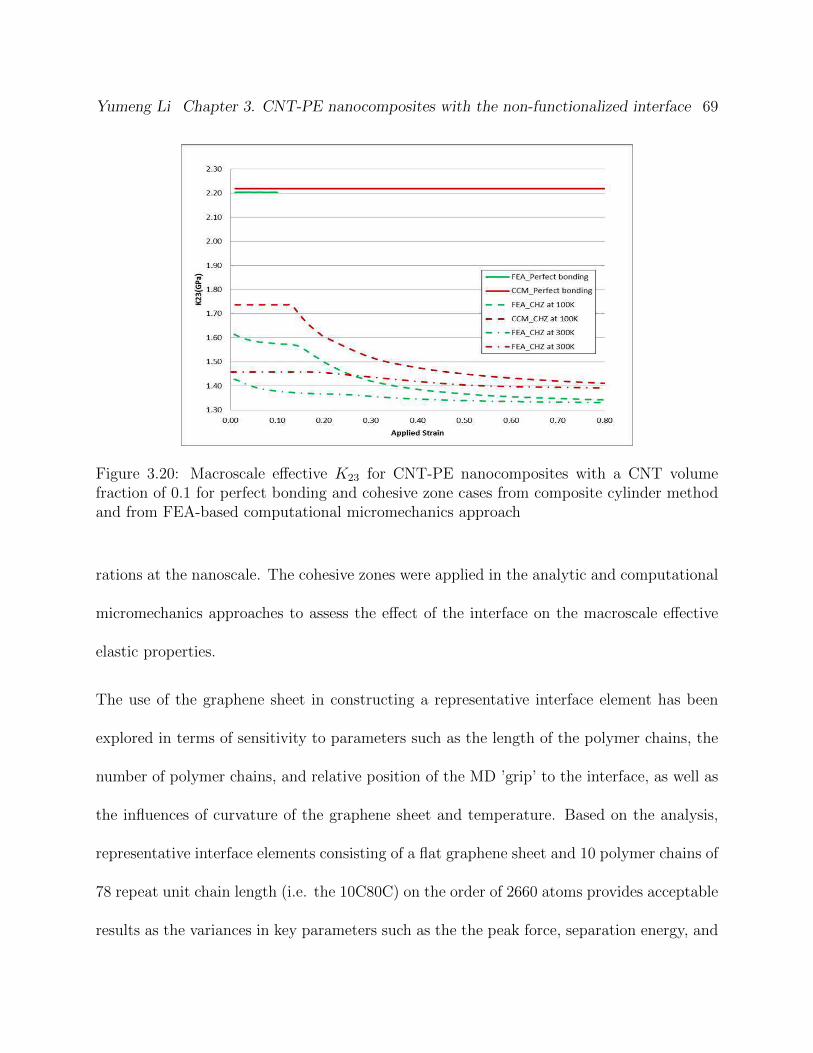
Yumeng Li Chapter 3. CNT-PE nanocomposites with the non-functionalized interface 69
Figure 3.20: Macroscale effective K23 for CNT-PE nanocomposites with a CNT volumefraction of 0.1 for perfect bonding and cohesive zone cases from composite cylinder methodand from FEA-based computational micromechanics approach
rations at the nanoscale. The cohesive zones were applied in the analytic and computational
micromechanics approaches to assess the effect of the interface on the macroscale effective
elastic properties.
The use of the graphene sheet in constructing a representative interface element has been
explored in terms of sensitivity to parameters such as the length of the polymer chains, the
number of polymer chains, and relative position of the MD ’grip’ to the interface, as well as
the influences of curvature of the graphene sheet and temperature. Based on the analysis,
representative interface elements consisting of a flat graphene sheet and 10 polymer chains of
78 repeat unit chain length (i.e. the 10C80C) on the order of 2660 atoms provides acceptable
results as the variances in key parameters such as the the peak force, separation energy, and
Yumeng Li Chapter 3. CNT-PE nanocomposites with the non-functionalized interface 70
separation distance at given temperature did not lead to significant variance in the effective
elastic property calculations. It was also observed that in general, the sliding mode peak
force at 100K is much smaller (73% lower) than that of normal opening mode separation.
It is observed that the peak force and separation energy decreased at 300K compared with
100K by as much as 69.5% and 73.0%, respectively, which indicates a weaker stiffness of
interface for CNT-PE nanocomposites at higher temperature.
It was observed that the macroscale effective properties determined from the micromechanics
approaches experienced significant depreciation compared to the perfect bonding cases when
the interface model was included. This was observed to be the case both before and after
the peak traction was obtained, with the latter also demonstrating strain dependent effective
properties. The temperature sensitivity of the interface was observed to directly transfer to
the effective property calculations, which were also observed to be highly sensitive to the
CNT volume fraction. In short, the results show that the interface may be the source of
overprediction of the material properties of CNT based nanocomposites.
Chapter 4
Characterization of nanoscale load
transfer at the functionalized
CNT-polyethylene interface using
molecular dynamic simulation
4.1 Introduction
The covalent functionalization of CNTs is considered to be one of the most promising options
for improving the load-transfer properties of the interface, as it can bind CNTs to the
polymer chains during the polymerization [74]. Experimental results demonstrate significant
71
Yumeng Li Chapter 4. CNT-PE nanocomposites with the functionalized interface 72
improvement of the performance of the CNT-polymer nanocomposites with functionalized
interfaces with respect to the nanocomposites with pristine CNTs [75, 33]. Experimental
efforts have sought to characterize the interface in CNTs-based nanocomposites [36, 31,
37]. Given the challenges associated with directly probing CNTs with extremely small size,
only few experiments directly exploring the load transfer at the CNT-polymer interface in
nanocomposites have been reported and the results exhibit wide variations [37]. In addition,
it is extremely hard to investigate the bonding information of the interface between the
CNTs and the polymer matrix experimentally. Hence, there is growing interest in and
reliance on computational materials science techniques to study the interface between the
CNTs and polymer matrix using atomistic simulation and/or continuum models [53, 54, 55].
However, limited studies has been conducted to characterize the functionalized interface
between CNTs and the polymer matrix, which has covalent bonding interactions in addition
to vdW interactions, in both sliding and normal mode separation. More work is needed to
fully understand the mechanism behind the improvement of the mechanical properties of
the nanocomposites due to the functionalization of the interface in order to help develop
techniques for tailoring the interface aiming at producing the nanocomposites with required
properties.
In this chapter, the functionalized CNT-PE interface is assessed in terms of both normal
and sliding mode separations at the nanoscale by conducting classic atomistic MD simula-
tions. A simple side chain with two PE monomers is adopted as functional groups. Special
emphasis is placed on assessing the load transfer of the functionalized interface with various
Yumeng Li Chapter 4. CNT-PE nanocomposites with the functionalized interface 73
functionalization densities in terms of force-separation responses of the graphene-PE inter-
face in normal and sliding modes at a given temperature. Two force field potentials, CVFF
and AIREBO potential, are applied to simulate the interactions between the atoms in the
polymer matrix and the functional groups. CVFF potential is modified to allow the bond
breaking and hence damage of the interface for the damage of the interface by introducing
a strain energy criteria. Comparison of the two potentials is conducted by comparing the
MD simulation results where it is found that two potentials give different force-separation
responses, but that in both cases, there is significant increase in load transfer capability
and toughness of the interface with increasing degree of functionalization of the interface.
By including longer polymer chains in the amorphous polymer matrix, it is noted that the
entanglements between the polymer chains can improve the efficiency of load transfer to
the functional groups and the graphene sheet. It is anticipated that, as in [76], the force-
separation responses of the functionalized nanoscale interfaces can be transferred to higher
level continuum model for obtaining better prediction of the effective material properties of
the functionalized CNT-polymer nanocomposites, which in turn may contribute to develop
techniques of engineering the interface for producing the CNT-reinforced nanocomposites
with better mechanical performance.
Yumeng Li Chapter 4. CNT-PE nanocomposites with the functionalized interface 74
4.2 Description of Atomistic Potentials
The two potentials used in this paper for comparison purposes are the CVFF potential
[60] and the adaptive intermolecular reactive empirical bond order(AIREBO) potential [63].
CVFF is properly calibrated for the carbon-carbon and carbon-hydrogen interactions and
consists of four energy components which are associated with bond stretching, angle bending,
torsion and non-bonded pairwise potential associated with van der Waals interaction as
introduced above.
CVFF potential has been introduced in detail in Chapter III. The specific parameters of
CVFF used in the present work are given in Table A.1. It is noted that the classical force
field CVFF does not account for dissipation effects such as bond breaking. As it was antici-
pated that bond breaking would be a significant factor governing the ultimate load transfer
capabilities of the functionalized interface, a strain energy based failure criteria for covalent
carbon-carbon bonds was introduced to the CVFF potential in the present work, i.e.
Eib = Ki
b(ri − ri0)2 >= Ecriteria (4.1)
The strain energy criteria are draw from reference [77] and are applied to the potential
energy of the covalent carbon-carbon bonds calculated by Equation 3.1. The stiffness of the
covalent bonds is held constant, which means no degradation of the bonds before the bond
breaking. The ith covalent bond and the associating angles and dihedrals are broken once
Yumeng Li Chapter 4. CNT-PE nanocomposites with the functionalized interface 75
Equation 4.1 is satisfied.
As an alternative to modifying the CVFF potential, one can make use of reactive force fields
which have been developed to account for both bond breaking and bond formation during the
MD simulation without having to concurrently consult computationally intensive quantum
mechanics calculations. As it is parameterized for modeling condensed-phase hydrocarbon
systems as well as the breaking and the formation of chemical bonds, the AIREBO potential
is also considered herein in assessing the load transfer capabilities of the functionalized
graphene-PE interface, the results of which are compared to the modified CVFF simulations.
The AIREBO potential includes three energy components, the REBO potential, a torsional
interaction potential and an intermolecular interaction potential. The function form for the
REBO portion of the potential is given in Equation 4.2 as bellows, which involves repulsive
V Rrij
and attractive V Arij
pairwise parts as well as many-body terms bij which control the
relative contribution of the two parts. The repulsive V Rrij
and attractive V Arij
potentials depend
on the atom types of the ith and jth atoms and the distance rij between them. The total
REBO potential energy also depends on the local atomistic environment, i.e. the positions
and types of atoms surrounding the i − j bond, by introducing the bond-order term bij,
which accounts for the chemical effects affecting the strength of covalent bonds.
EREBOij = V R
ij (rij) + bijVAij (rij) (4.2)
The torsional interaction potential of the AIREBO potential depends on the dihedral angles
Yumeng Li Chapter 4. CNT-PE nanocomposites with the functionalized interface 76
formed by sets of four covalently bonded atoms and is given by,
Etorsijkl = wij(rij)wjk(rjk)wkl(rkl)ε[
256
405cos10(
φ
2)− 0.1] (4.3)
where ε is barrier height, wmn(rmn) is a bond weight term between 0 and 1, which is based
on the distance between mth and nth atoms.
The intermolecular interaction potential between two atoms are modeled with a weighted
Lennard-Jones 12-6 potential given by Equation 4.4.
ELJij (rij) = S(tr(rij))S(tb(bij))CijV
LJij (rij) + [1− S(tr(rij))]CijV
LJij (rij) (4.4)
where S(t) is a universal switching function, tr(rij) and tb(bij) are scaling functions, Cij is a
connectivity switch function and V LJij (rij) has the same form as Equation 3.4.
Adaptive decisions about whether two atoms are experiencing the LJ interaction are made by
using switching functions which generally dictate that two atoms have a LJ interaction when
(1) there is no chemical bond between them and (2) they are not part of a dihedral(torsional)
bond.
The total potential energy of the system is the summation of the three parts, the REBO,
torsion and Lennard-Jones contribution in Equations 4.2, 4.3 and 4.4. It is noted that the
individual contributions to the sum carry with them information regarding the local atomistic
environment thereby allowing for changes in bond stiffness to simulate bond breaking and
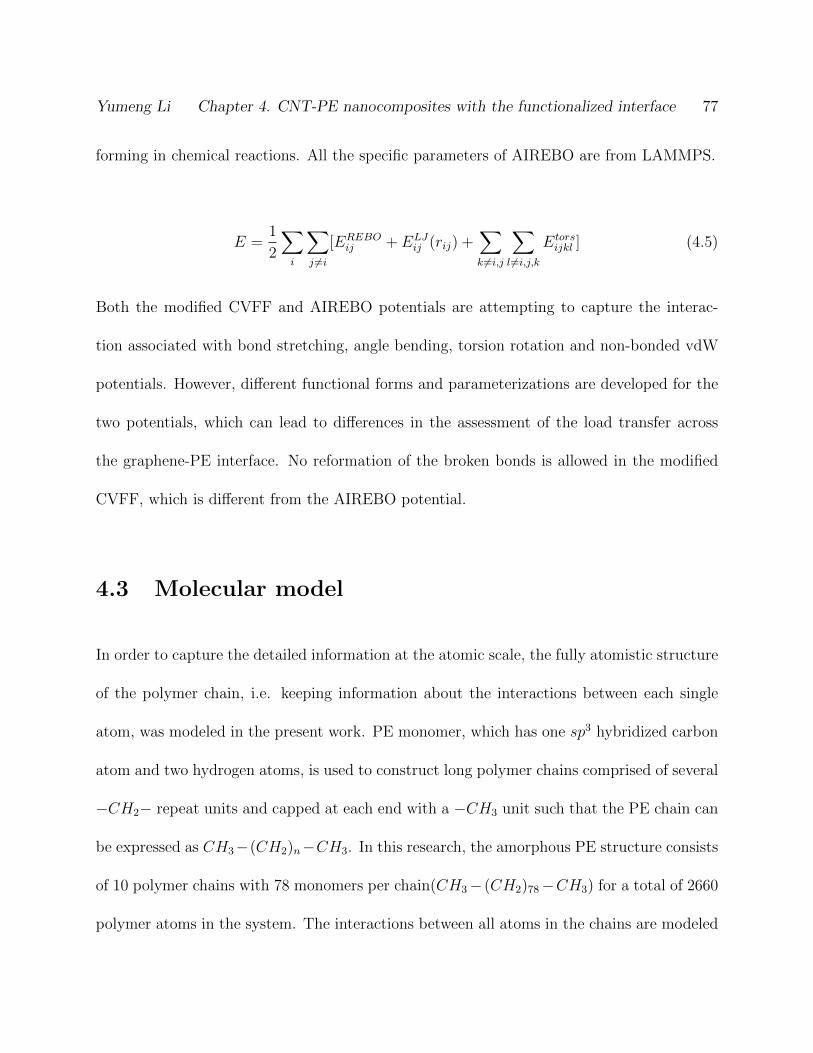
Yumeng Li Chapter 4. CNT-PE nanocomposites with the functionalized interface 77
forming in chemical reactions. All the specific parameters of AIREBO are from LAMMPS.
E =1
2
∑i
∑j 6=i
[EREBOij + ELJ
ij (rij) +∑k 6=i,j
∑l 6=i,j,k
Etorsijkl ] (4.5)
Both the modified CVFF and AIREBO potentials are attempting to capture the interac-
tion associated with bond stretching, angle bending, torsion rotation and non-bonded vdW
potentials. However, different functional forms and parameterizations are developed for the
two potentials, which can lead to differences in the assessment of the load transfer across
the graphene-PE interface. No reformation of the broken bonds is allowed in the modified
CVFF, which is different from the AIREBO potential.
4.3 Molecular model
In order to capture the detailed information at the atomic scale, the fully atomistic structure
of the polymer chain, i.e. keeping information about the interactions between each single
atom, was modeled in the present work. PE monomer, which has one sp3 hybridized carbon
atom and two hydrogen atoms, is used to construct long polymer chains comprised of several
−CH2− repeat units and capped at each end with a −CH3 unit such that the PE chain can
be expressed as CH3−(CH2)n−CH3. In this research, the amorphous PE structure consists
of 10 polymer chains with 78 monomers per chain(CH3− (CH2)78−CH3) for a total of 2660
polymer atoms in the system. The interactions between all atoms in the chains are modeled
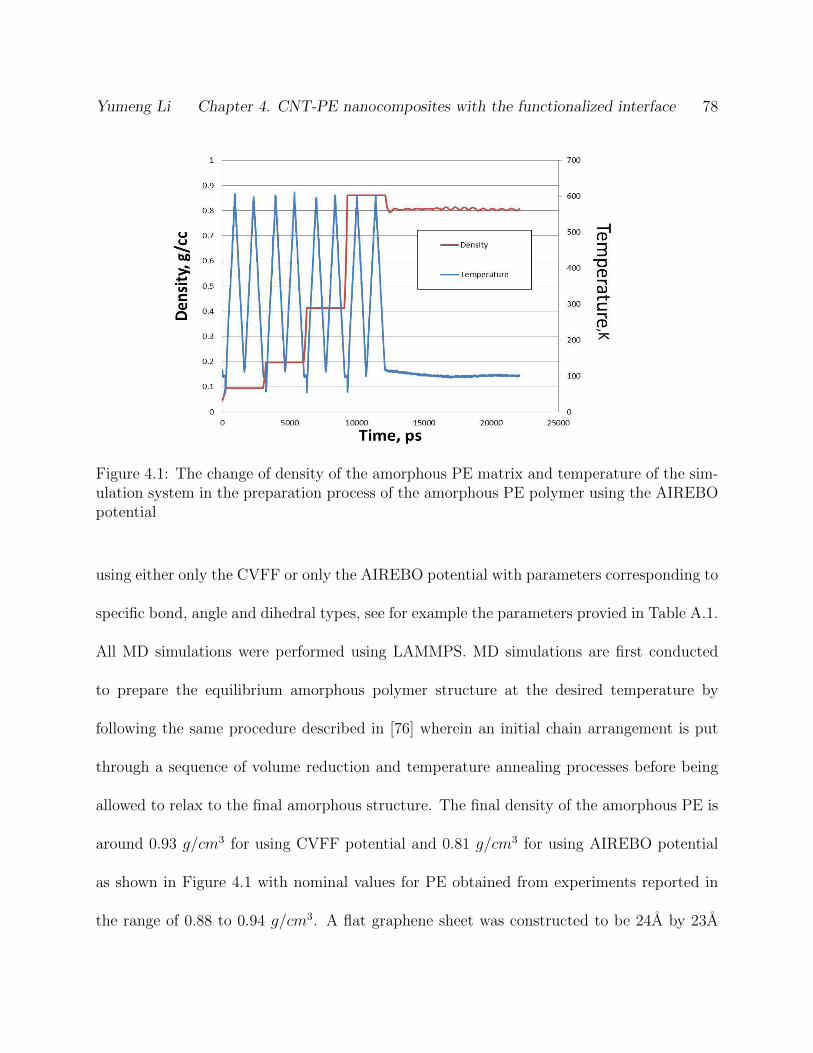
Yumeng Li Chapter 4. CNT-PE nanocomposites with the functionalized interface 78
Figure 4.1: The change of density of the amorphous PE matrix and temperature of the sim-ulation system in the preparation process of the amorphous PE polymer using the AIREBOpotential
using either only the CVFF or only the AIREBO potential with parameters corresponding to
specific bond, angle and dihedral types, see for example the parameters provied in Table A.1.
All MD simulations were performed using LAMMPS. MD simulations are first conducted
to prepare the equilibrium amorphous polymer structure at the desired temperature by
following the same procedure described in [76] wherein an initial chain arrangement is put
through a sequence of volume reduction and temperature annealing processes before being
allowed to relax to the final amorphous structure. The final density of the amorphous PE is
around 0.93 g/cm3 for using CVFF potential and 0.81 g/cm3 for using AIREBO potential
as shown in Figure 4.1 with nominal values for PE obtained from experiments reported in
the range of 0.88 to 0.94 g/cm3. A flat graphene sheet was constructed to be 24A by 23A
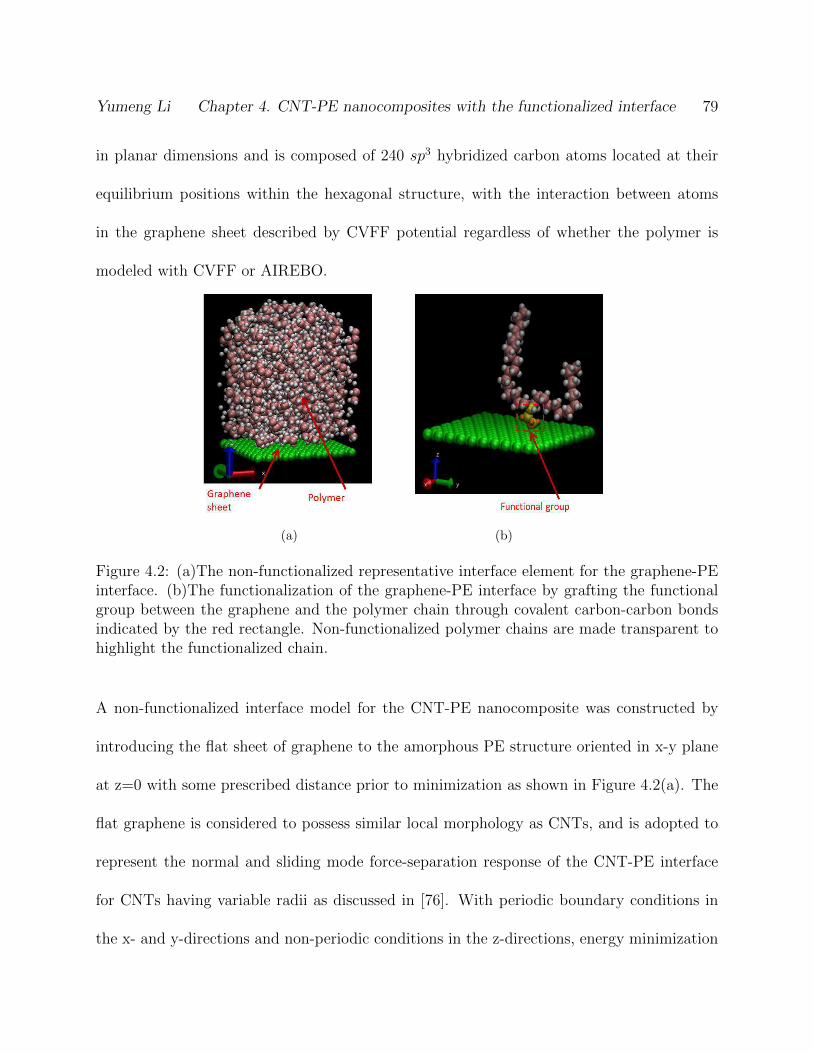
Yumeng Li Chapter 4. CNT-PE nanocomposites with the functionalized interface 79
in planar dimensions and is composed of 240 sp3 hybridized carbon atoms located at their
equilibrium positions within the hexagonal structure, with the interaction between atoms
in the graphene sheet described by CVFF potential regardless of whether the polymer is
modeled with CVFF or AIREBO.
(a) (b)
Figure 4.2: (a)The non-functionalized representative interface element for the graphene-PEinterface. (b)The functionalization of the graphene-PE interface by grafting the functionalgroup between the graphene and the polymer chain through covalent carbon-carbon bondsindicated by the red rectangle. Non-functionalized polymer chains are made transparent tohighlight the functionalized chain.
A non-functionalized interface model for the CNT-PE nanocomposite was constructed by
introducing the flat sheet of graphene to the amorphous PE structure oriented in x-y plane
at z=0 with some prescribed distance prior to minimization as shown in Figure 4.2(a). The
flat graphene is considered to possess similar local morphology as CNTs, and is adopted to
represent the normal and sliding mode force-separation response of the CNT-PE interface
for CNTs having variable radii as discussed in [76]. With periodic boundary conditions in
the x- and y-directions and non-periodic conditions in the z-directions, energy minimization
Yumeng Li Chapter 4. CNT-PE nanocomposites with the functionalized interface 80
at 0K and subsequent dynamic equilibration at 100K were conducted to allow the perfect
wetting of the polymer to the graphene sheet and establish the equilibrium distance between
them in the non-functionalized graphene-PE interface model as discussed in [76].
One of the major approaches to improve the load transfer in CNT-polymer nanocompos-
ites is to form covalent bonds between the polymer matrix and the sidewalls or end caps
of nanotubes [74]. Side chains with two CH2 monomers are usually adopted as functional
group [54, 52] for CNT-PE nanocomposites, which are also used here and are grafted be-
tween PE chains and the graphene sheet through carbon-carbon covalent bonds as shown
in Figure 4.2(b). The functionalization process used the prepared equilibrated nonfunc-
tionalized graphene-PE interface models as the initial configurations and have all atoms in
the interface model frozen in their spacial position during the process of adding functional
groups. The location of the functional group, i.e. which pair of carbon atoms (having one
in the graphene sheet and the other in the polymer chains) are grafted to form the function-
al groups, is largely governed by the distance of the paired carbon atoms. The functional
group is added and grafted between the paired carbon atoms having the minimum distance,
with subsequent functional groups also constrained to be at least 2A away from the already
grafted functional groups. With the desired number of functional groups grafted, further
dynamic equilibration under NVT ensemble (constant volume and constant temperature) is
conducted for about 100 ps in order to establish equilibrium distance between the graphene
sheet and the amorphous polymer with the addition of functional groups. The resulting
atomistic structures produced are thus taken as the representative interface elements for
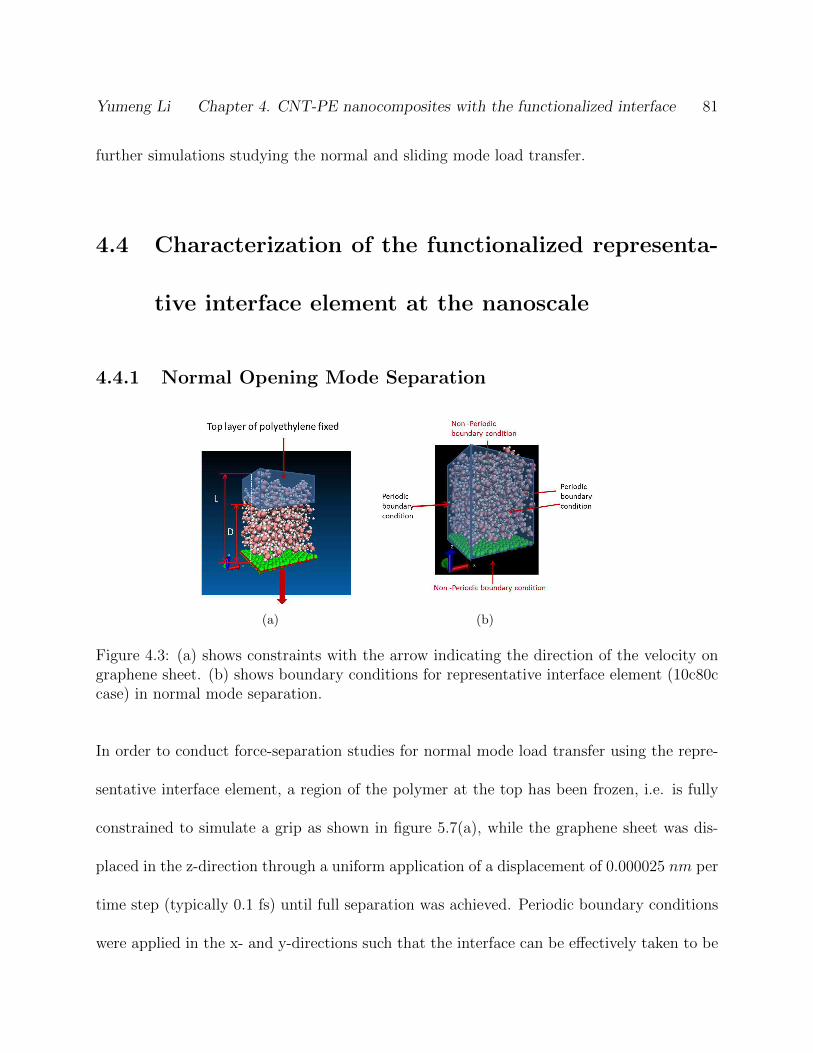
Yumeng Li Chapter 4. CNT-PE nanocomposites with the functionalized interface 81
further simulations studying the normal and sliding mode load transfer.
4.4 Characterization of the functionalized representa-
tive interface element at the nanoscale
4.4.1 Normal Opening Mode Separation
(a) (b)
Figure 4.3: (a) shows constraints with the arrow indicating the direction of the velocity ongraphene sheet. (b) shows boundary conditions for representative interface element (10c80ccase) in normal mode separation.
In order to conduct force-separation studies for normal mode load transfer using the repre-
sentative interface element, a region of the polymer at the top has been frozen, i.e. is fully
constrained to simulate a grip as shown in figure 5.7(a), while the graphene sheet was dis-
placed in the z-direction through a uniform application of a displacement of 0.000025 nm per
time step (typically 0.1 fs) until full separation was achieved. Periodic boundary conditions
were applied in the x- and y-directions such that the interface can be effectively taken to be
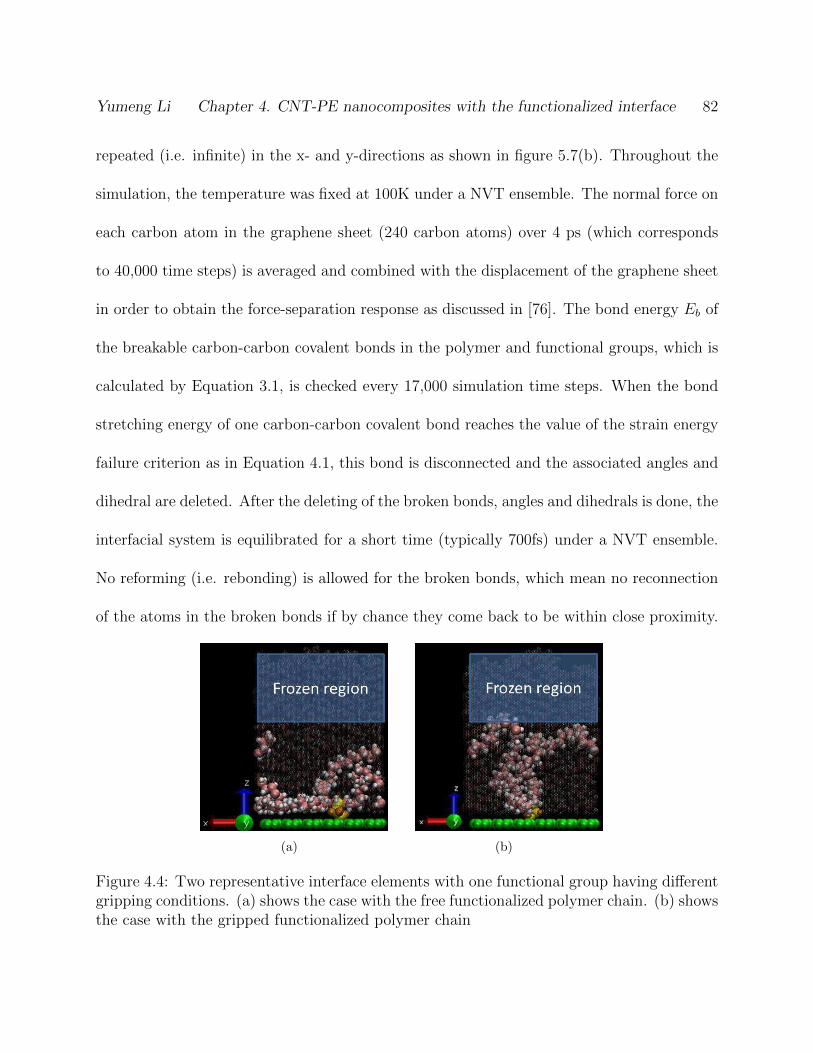
Yumeng Li Chapter 4. CNT-PE nanocomposites with the functionalized interface 82
repeated (i.e. infinite) in the x- and y-directions as shown in figure 5.7(b). Throughout the
simulation, the temperature was fixed at 100K under a NVT ensemble. The normal force on
each carbon atom in the graphene sheet (240 carbon atoms) over 4 ps (which corresponds
to 40,000 time steps) is averaged and combined with the displacement of the graphene sheet
in order to obtain the force-separation response as discussed in [76]. The bond energy Eb of
the breakable carbon-carbon covalent bonds in the polymer and functional groups, which is
calculated by Equation 3.1, is checked every 17,000 simulation time steps. When the bond
stretching energy of one carbon-carbon covalent bond reaches the value of the strain energy
failure criterion as in Equation 4.1, this bond is disconnected and the associated angles and
dihedral are deleted. After the deleting of the broken bonds, angles and dihedrals is done, the
interfacial system is equilibrated for a short time (typically 700fs) under a NVT ensemble.
No reforming (i.e. rebonding) is allowed for the broken bonds, which mean no reconnection
of the atoms in the broken bonds if by chance they come back to be within close proximity.
(a) (b)
Figure 4.4: Two representative interface elements with one functional group having differentgripping conditions. (a) shows the case with the free functionalized polymer chain. (b) showsthe case with the gripped functionalized polymer chain
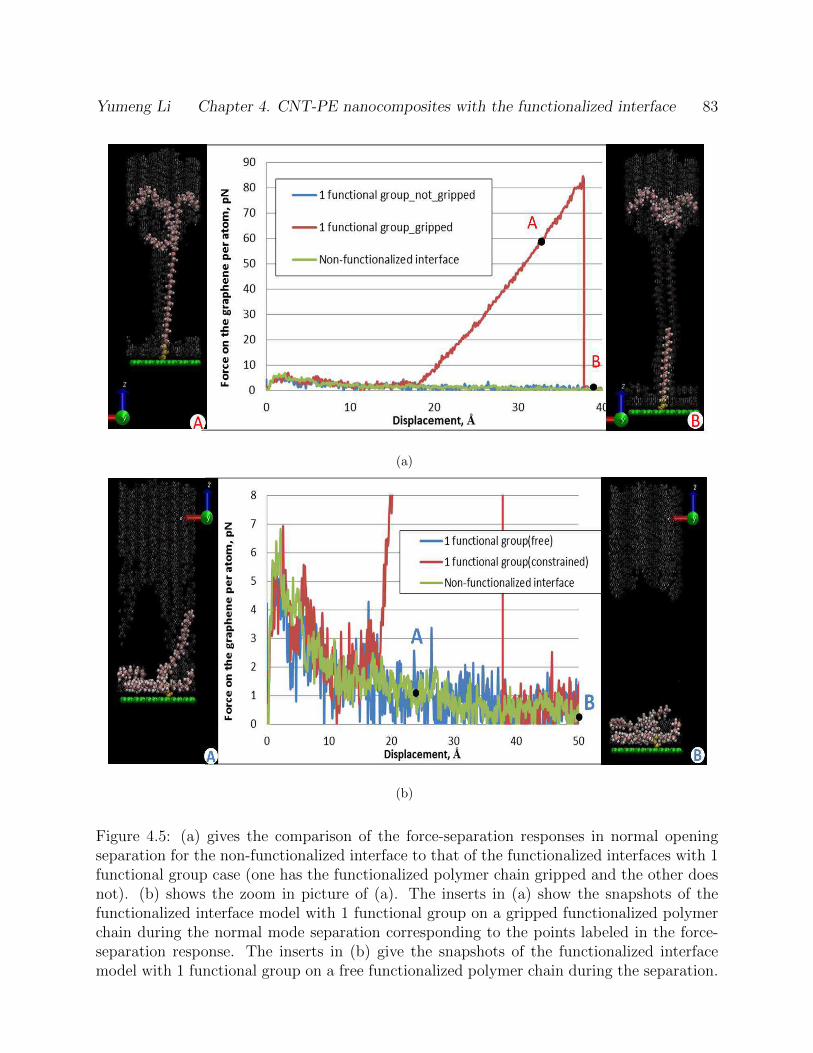
Yumeng Li Chapter 4. CNT-PE nanocomposites with the functionalized interface 83
(a)
(b)
Figure 4.5: (a) gives the comparison of the force-separation responses in normal openingseparation for the non-functionalized interface to that of the functionalized interfaces with 1functional group case (one has the functionalized polymer chain gripped and the other doesnot). (b) shows the zoom in picture of (a). The inserts in (a) show the snapshots of thefunctionalized interface model with 1 functional group on a gripped functionalized polymerchain during the normal mode separation corresponding to the points labeled in the force-separation response. The inserts in (b) give the snapshots of the functionalized interfacemodel with 1 functional group on a free functionalized polymer chain during the separation.
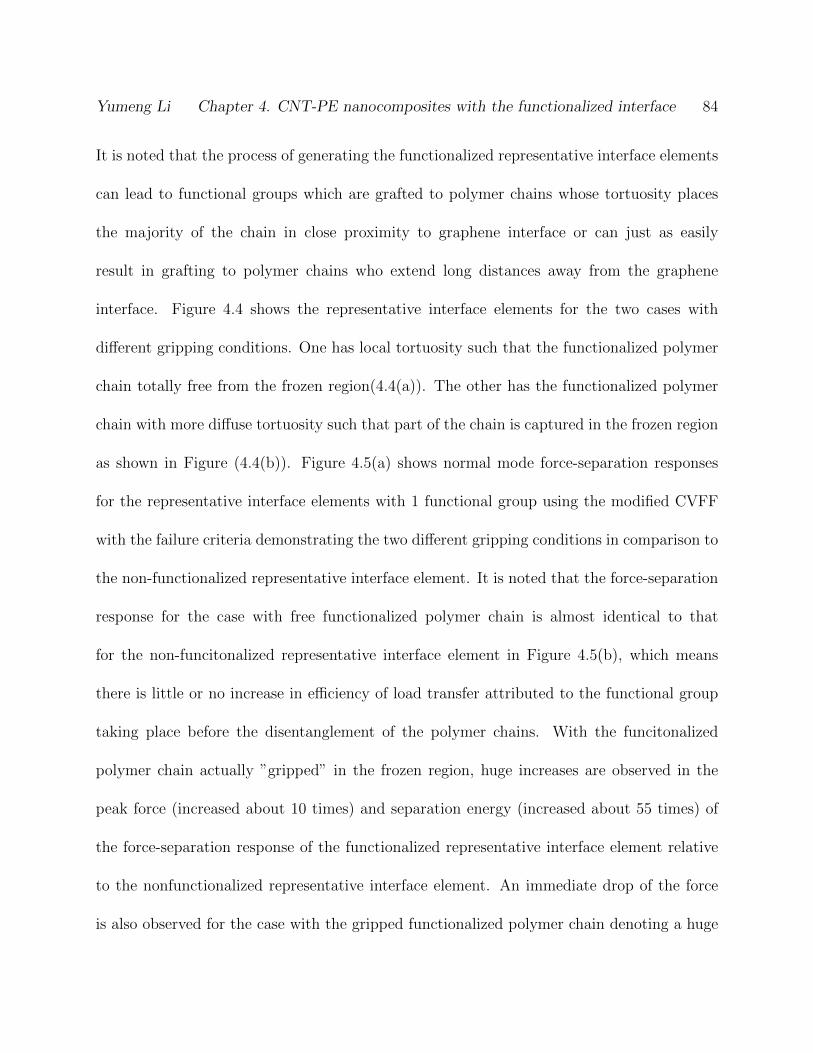
Yumeng Li Chapter 4. CNT-PE nanocomposites with the functionalized interface 84
It is noted that the process of generating the functionalized representative interface elements
can lead to functional groups which are grafted to polymer chains whose tortuosity places
the majority of the chain in close proximity to graphene interface or can just as easily
result in grafting to polymer chains who extend long distances away from the graphene
interface. Figure 4.4 shows the representative interface elements for the two cases with
different gripping conditions. One has local tortuosity such that the functionalized polymer
chain totally free from the frozen region(4.4(a)). The other has the functionalized polymer
chain with more diffuse tortuosity such that part of the chain is captured in the frozen region
as shown in Figure (4.4(b)). Figure 4.5(a) shows normal mode force-separation responses
for the representative interface elements with 1 functional group using the modified CVFF
with the failure criteria demonstrating the two different gripping conditions in comparison to
the non-functionalized representative interface element. It is noted that the force-separation
response for the case with free functionalized polymer chain is almost identical to that
for the non-funcitonalized representative interface element in Figure 4.5(b), which means
there is little or no increase in efficiency of load transfer attributed to the functional group
taking place before the disentanglement of the polymer chains. With the funcitonalized
polymer chain actually ”gripped” in the frozen region, huge increases are observed in the
peak force (increased about 10 times) and separation energy (increased about 55 times) of
the force-separation response of the functionalized representative interface element relative
to the nonfunctionalized representative interface element. An immediate drop of the force
is also observed for the case with the gripped functionalized polymer chain denoting a huge
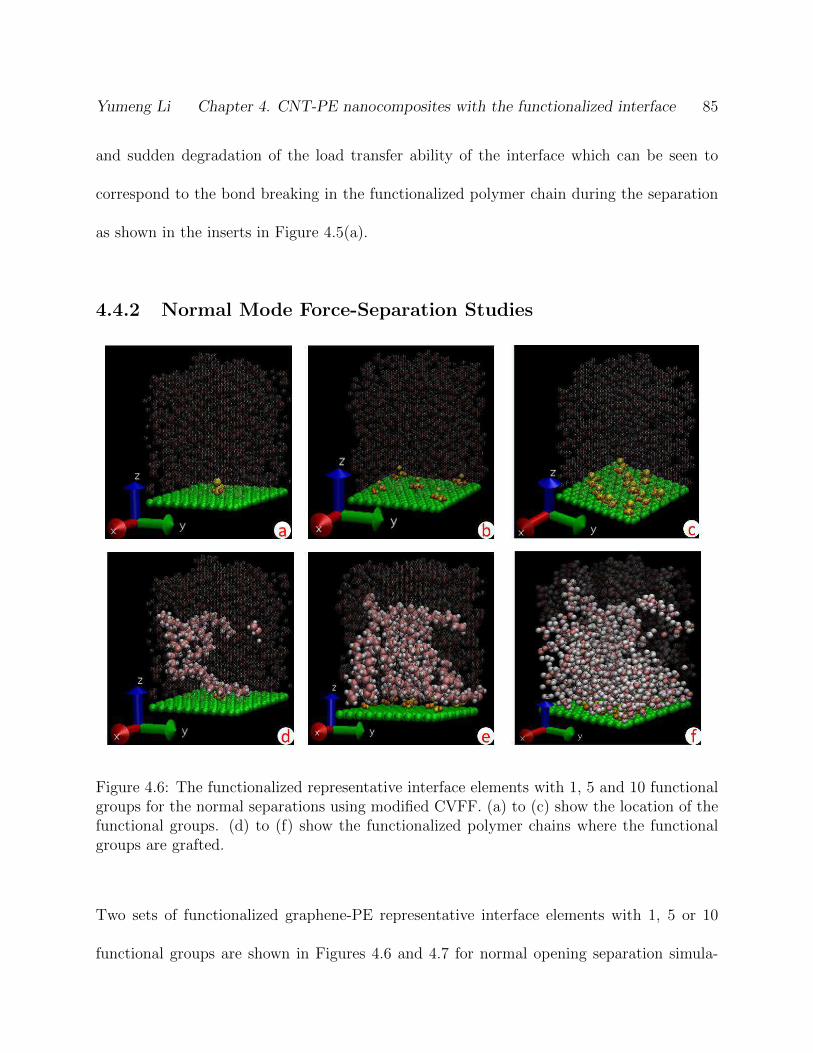
Yumeng Li Chapter 4. CNT-PE nanocomposites with the functionalized interface 85
and sudden degradation of the load transfer ability of the interface which can be seen to
correspond to the bond breaking in the functionalized polymer chain during the separation
as shown in the inserts in Figure 4.5(a).
4.4.2 Normal Mode Force-Separation Studies
Figure 4.6: The functionalized representative interface elements with 1, 5 and 10 functionalgroups for the normal separations using modified CVFF. (a) to (c) show the location of thefunctional groups. (d) to (f) show the functionalized polymer chains where the functionalgroups are grafted.
Two sets of functionalized graphene-PE representative interface elements with 1, 5 or 10
functional groups are shown in Figures 4.6 and 4.7 for normal opening separation simula-
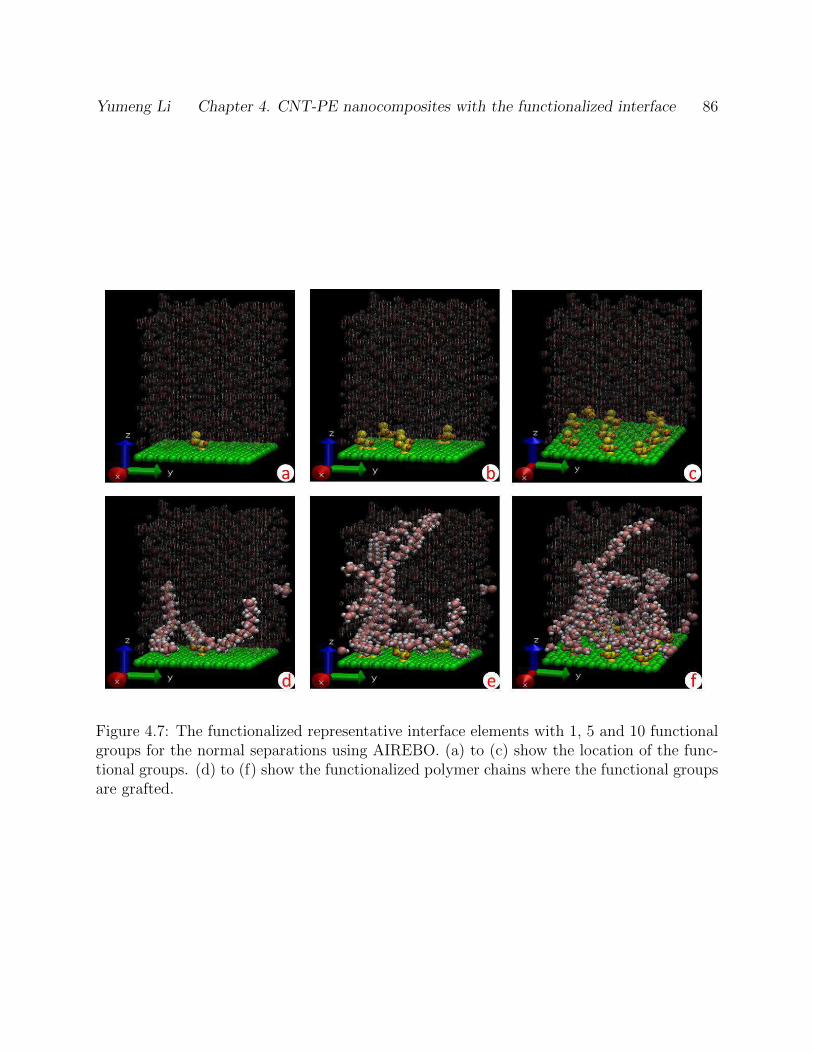
Yumeng Li Chapter 4. CNT-PE nanocomposites with the functionalized interface 86
Figure 4.7: The functionalized representative interface elements with 1, 5 and 10 functionalgroups for the normal separations using AIREBO. (a) to (c) show the location of the func-tional groups. (d) to (f) show the functionalized polymer chains where the functional groupsare grafted.
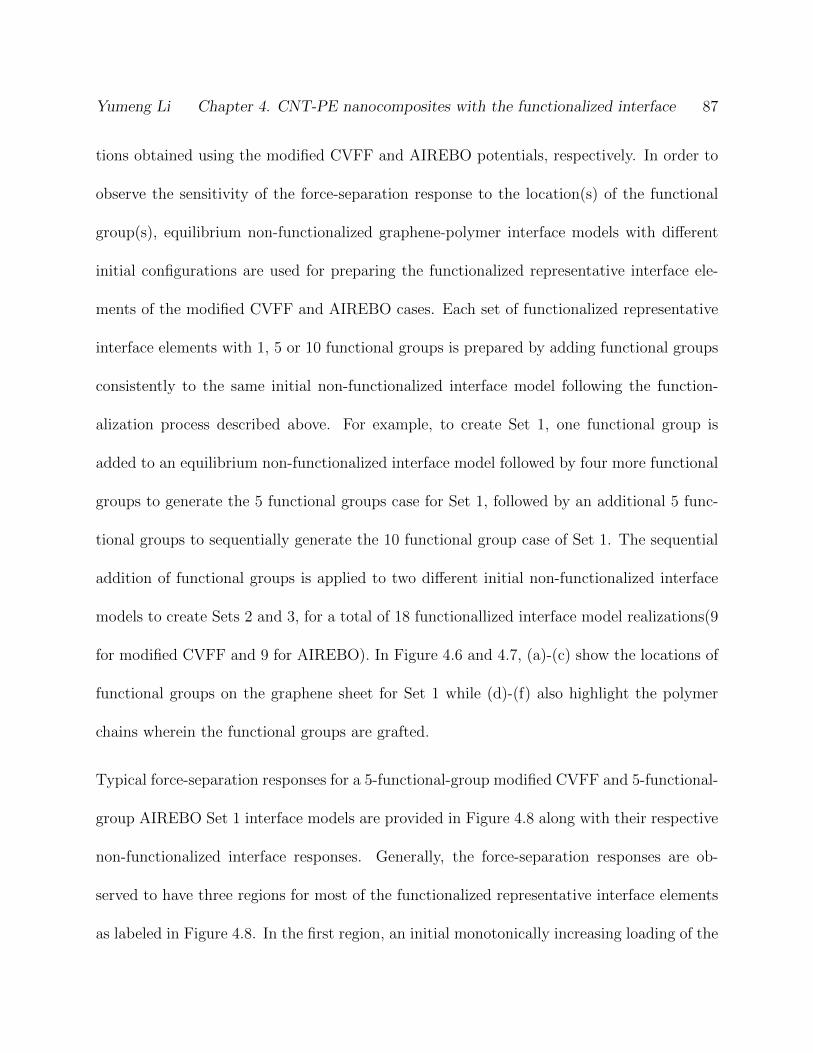
Yumeng Li Chapter 4. CNT-PE nanocomposites with the functionalized interface 87
tions obtained using the modified CVFF and AIREBO potentials, respectively. In order to
observe the sensitivity of the force-separation response to the location(s) of the functional
group(s), equilibrium non-functionalized graphene-polymer interface models with different
initial configurations are used for preparing the functionalized representative interface ele-
ments of the modified CVFF and AIREBO cases. Each set of functionalized representative
interface elements with 1, 5 or 10 functional groups is prepared by adding functional groups
consistently to the same initial non-functionalized interface model following the function-
alization process described above. For example, to create Set 1, one functional group is
added to an equilibrium non-functionalized interface model followed by four more functional
groups to generate the 5 functional groups case for Set 1, followed by an additional 5 func-
tional groups to sequentially generate the 10 functional group case of Set 1. The sequential
addition of functional groups is applied to two different initial non-functionalized interface
models to create Sets 2 and 3, for a total of 18 functionallized interface model realizations(9
for modified CVFF and 9 for AIREBO). In Figure 4.6 and 4.7, (a)-(c) show the locations of
functional groups on the graphene sheet for Set 1 while (d)-(f) also highlight the polymer
chains wherein the functional groups are grafted.
Typical force-separation responses for a 5-functional-group modified CVFF and 5-functional-
group AIREBO Set 1 interface models are provided in Figure 4.8 along with their respective
non-functionalized interface responses. Generally, the force-separation responses are ob-
served to have three regions for most of the functionalized representative interface elements
as labeled in Figure 4.8. In the first region, an initial monotonically increasing loading of the
Yumeng Li Chapter 4. CNT-PE nanocomposites with the functionalized interface 88
(a)
(b)
Figure 4.8: The force-separation responses for the functionalized interface models with 5functional groups in the normal mode separations using different potentials, M-CVFF vsAIREBO. The three regions of the force-separation responses are labeled in (a) and (b)corresponding to the initial elastic monotonically increasing loading in Region 1, the stableloading in Region 2 and the saw-toothed loading and unloading segments in Region 3. Thefirst regions are zoomed in to compare with the loading region of the force-separation responsefor the non-functionalized interface model.
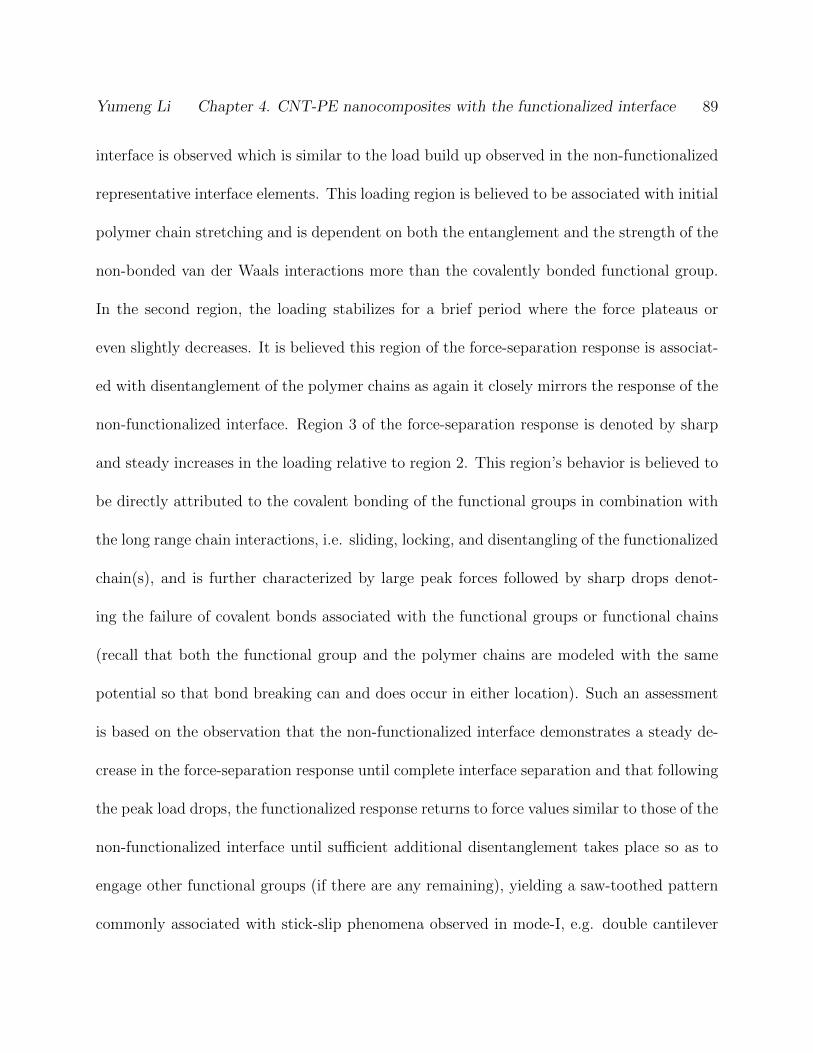
Yumeng Li Chapter 4. CNT-PE nanocomposites with the functionalized interface 89
interface is observed which is similar to the load build up observed in the non-functionalized
representative interface elements. This loading region is believed to be associated with initial
polymer chain stretching and is dependent on both the entanglement and the strength of the
non-bonded van der Waals interactions more than the covalently bonded functional group.
In the second region, the loading stabilizes for a brief period where the force plateaus or
even slightly decreases. It is believed this region of the force-separation response is associat-
ed with disentanglement of the polymer chains as again it closely mirrors the response of the
non-functionalized interface. Region 3 of the force-separation response is denoted by sharp
and steady increases in the loading relative to region 2. This region’s behavior is believed to
be directly attributed to the covalent bonding of the functional groups in combination with
the long range chain interactions, i.e. sliding, locking, and disentangling of the functionalized
chain(s), and is further characterized by large peak forces followed by sharp drops denot-
ing the failure of covalent bonds associated with the functional groups or functional chains
(recall that both the functional group and the polymer chains are modeled with the same
potential so that bond breaking can and does occur in either location). Such an assessment
is based on the observation that the non-functionalized interface demonstrates a steady de-
crease in the force-separation response until complete interface separation and that following
the peak load drops, the functionalized response returns to force values similar to those of the
non-functionalized interface until sufficient additional disentanglement takes place so as to
engage other functional groups (if there are any remaining), yielding a saw-toothed pattern
commonly associated with stick-slip phenomena observed in mode-I, e.g. double cantilever
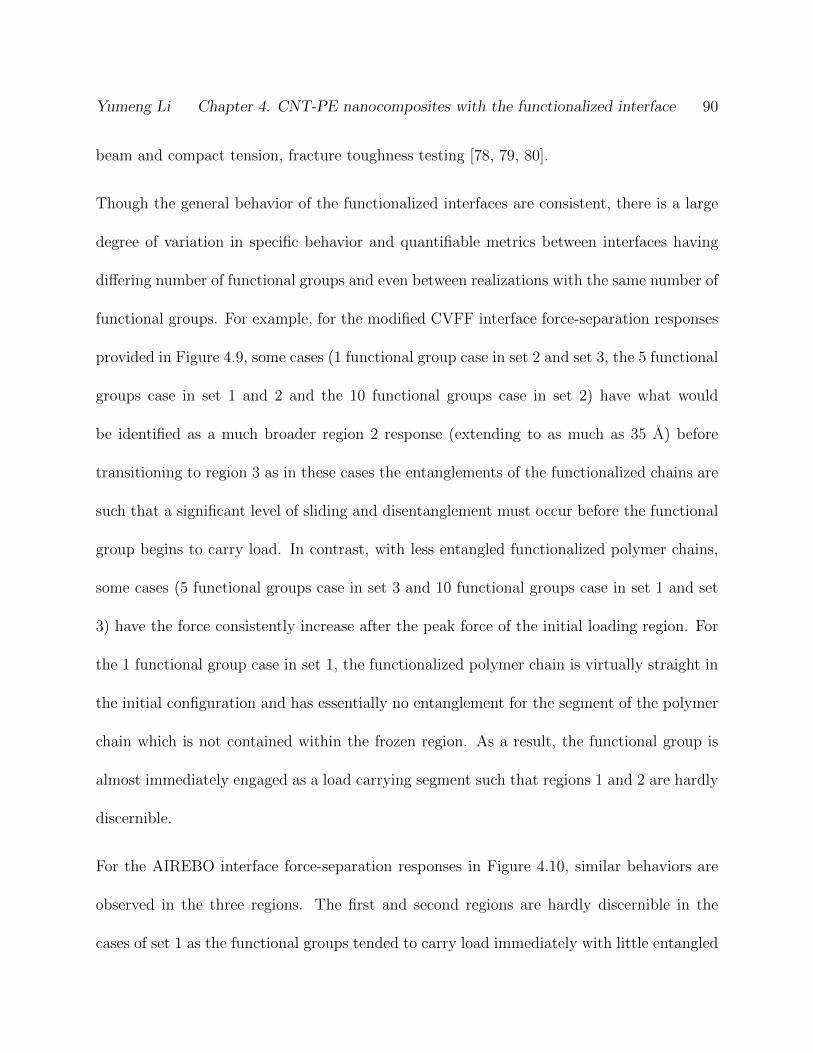
Yumeng Li Chapter 4. CNT-PE nanocomposites with the functionalized interface 90
beam and compact tension, fracture toughness testing [78, 79, 80].
Though the general behavior of the functionalized interfaces are consistent, there is a large
degree of variation in specific behavior and quantifiable metrics between interfaces having
differing number of functional groups and even between realizations with the same number of
functional groups. For example, for the modified CVFF interface force-separation responses
provided in Figure 4.9, some cases (1 functional group case in set 2 and set 3, the 5 functional
groups case in set 1 and 2 and the 10 functional groups case in set 2) have what would
be identified as a much broader region 2 response (extending to as much as 35 A) before
transitioning to region 3 as in these cases the entanglements of the functionalized chains are
such that a significant level of sliding and disentanglement must occur before the functional
group begins to carry load. In contrast, with less entangled functionalized polymer chains,
some cases (5 functional groups case in set 3 and 10 functional groups case in set 1 and set
3) have the force consistently increase after the peak force of the initial loading region. For
the 1 functional group case in set 1, the functionalized polymer chain is virtually straight in
the initial configuration and has essentially no entanglement for the segment of the polymer
chain which is not contained within the frozen region. As a result, the functional group is
almost immediately engaged as a load carrying segment such that regions 1 and 2 are hardly
discernible.
For the AIREBO interface force-separation responses in Figure 4.10, similar behaviors are
observed in the three regions. The first and second regions are hardly discernible in the
cases of set 1 as the functional groups tended to carry load immediately with little entangled
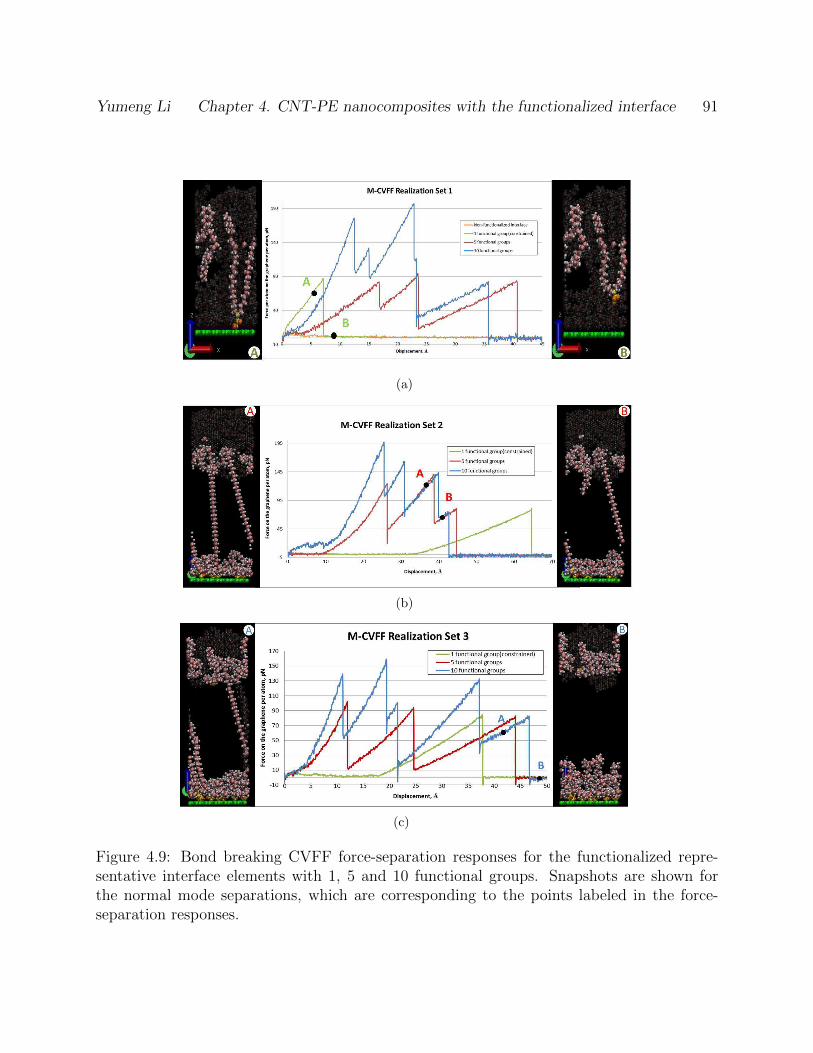
Yumeng Li Chapter 4. CNT-PE nanocomposites with the functionalized interface 91
(a)
(b)
(c)
Figure 4.9: Bond breaking CVFF force-separation responses for the functionalized repre-sentative interface elements with 1, 5 and 10 functional groups. Snapshots are shown forthe normal mode separations, which are corresponding to the points labeled in the force-separation responses.
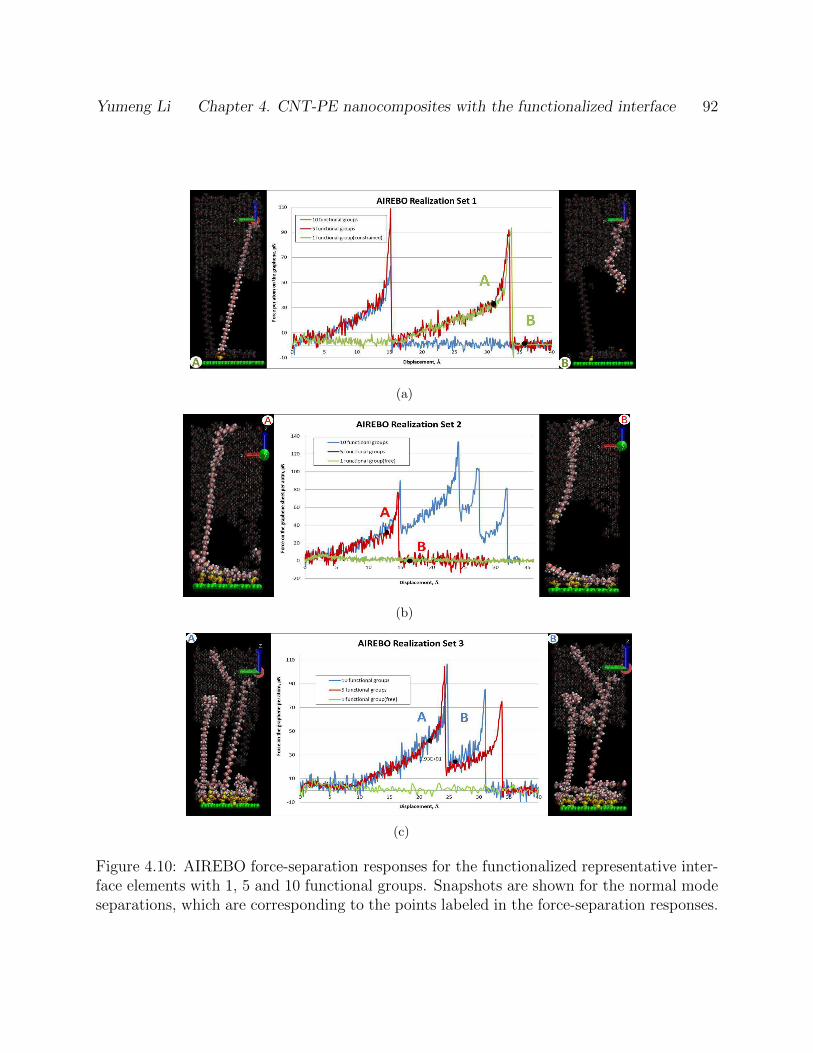
Yumeng Li Chapter 4. CNT-PE nanocomposites with the functionalized interface 92
(a)
(b)
(c)
Figure 4.10: AIREBO force-separation responses for the functionalized representative inter-face elements with 1, 5 and 10 functional groups. Snapshots are shown for the normal modeseparations, which are corresponding to the points labeled in the force-separation responses.
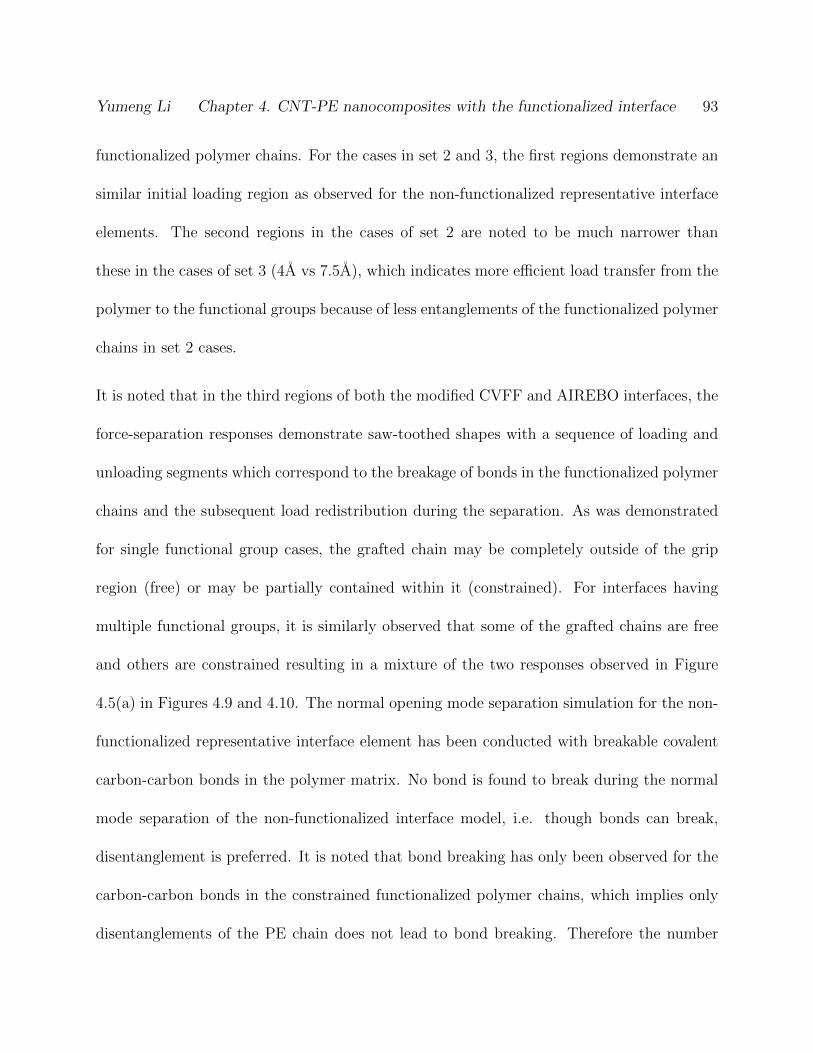
Yumeng Li Chapter 4. CNT-PE nanocomposites with the functionalized interface 93
functionalized polymer chains. For the cases in set 2 and 3, the first regions demonstrate an
similar initial loading region as observed for the non-functionalized representative interface
elements. The second regions in the cases of set 2 are noted to be much narrower than
these in the cases of set 3 (4A vs 7.5A), which indicates more efficient load transfer from the
polymer to the functional groups because of less entanglements of the functionalized polymer
chains in set 2 cases.
It is noted that in the third regions of both the modified CVFF and AIREBO interfaces, the
force-separation responses demonstrate saw-toothed shapes with a sequence of loading and
unloading segments which correspond to the breakage of bonds in the functionalized polymer
chains and the subsequent load redistribution during the separation. As was demonstrated
for single functional group cases, the grafted chain may be completely outside of the grip
region (free) or may be partially contained within it (constrained). For interfaces having
multiple functional groups, it is similarly observed that some of the grafted chains are free
and others are constrained resulting in a mixture of the two responses observed in Figure
4.5(a) in Figures 4.9 and 4.10. The normal opening mode separation simulation for the non-
functionalized representative interface element has been conducted with breakable covalent
carbon-carbon bonds in the polymer matrix. No bond is found to break during the normal
mode separation of the non-functionalized interface model, i.e. though bonds can break,
disentanglement is preferred. It is noted that bond breaking has only been observed for the
carbon-carbon bonds in the constrained functionalized polymer chains, which implies only
disentanglements of the PE chain does not lead to bond breaking. Therefore the number
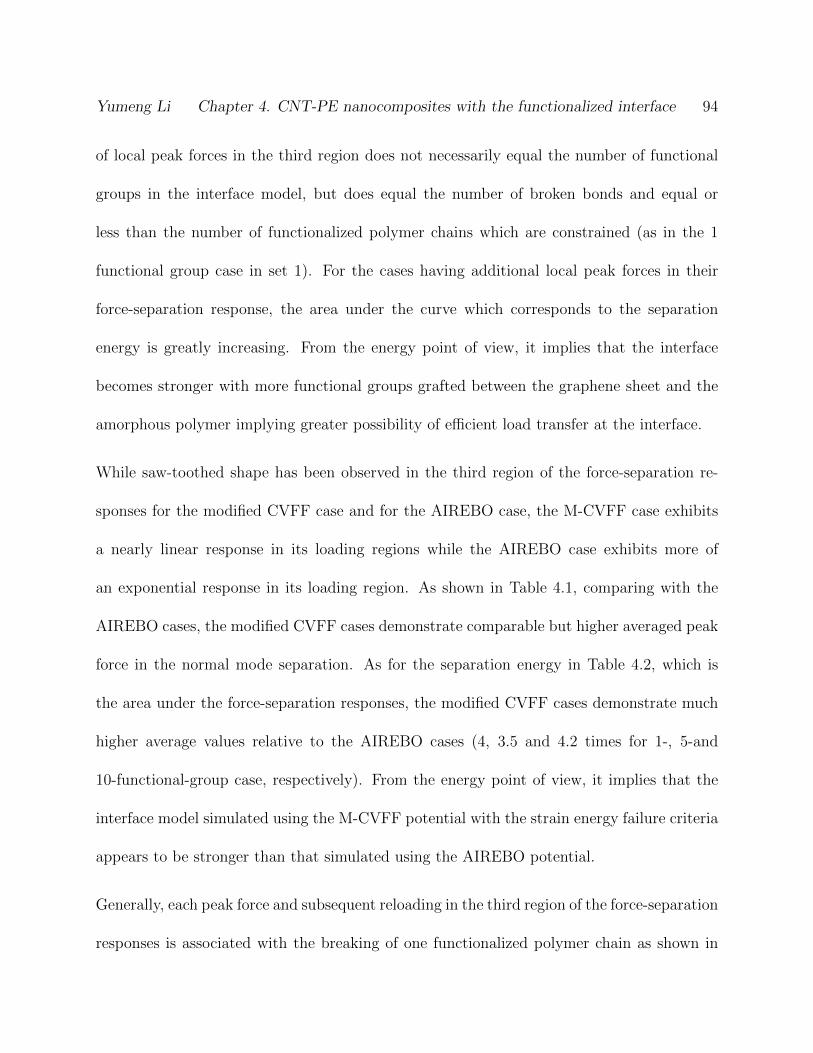
Yumeng Li Chapter 4. CNT-PE nanocomposites with the functionalized interface 94
of local peak forces in the third region does not necessarily equal the number of functional
groups in the interface model, but does equal the number of broken bonds and equal or
less than the number of functionalized polymer chains which are constrained (as in the 1
functional group case in set 1). For the cases having additional local peak forces in their
force-separation response, the area under the curve which corresponds to the separation
energy is greatly increasing. From the energy point of view, it implies that the interface
becomes stronger with more functional groups grafted between the graphene sheet and the
amorphous polymer implying greater possibility of efficient load transfer at the interface.
While saw-toothed shape has been observed in the third region of the force-separation re-
sponses for the modified CVFF case and for the AIREBO case, the M-CVFF case exhibits
a nearly linear response in its loading regions while the AIREBO case exhibits more of
an exponential response in its loading region. As shown in Table 4.1, comparing with the
AIREBO cases, the modified CVFF cases demonstrate comparable but higher averaged peak
force in the normal mode separation. As for the separation energy in Table 4.2, which is
the area under the force-separation responses, the modified CVFF cases demonstrate much
higher average values relative to the AIREBO cases (4, 3.5 and 4.2 times for 1-, 5-and
10-functional-group case, respectively). From the energy point of view, it implies that the
interface model simulated using the M-CVFF potential with the strain energy failure criteria
appears to be stronger than that simulated using the AIREBO potential.
Generally, each peak force and subsequent reloading in the third region of the force-separation
responses is associated with the breaking of one functionalized polymer chain as shown in
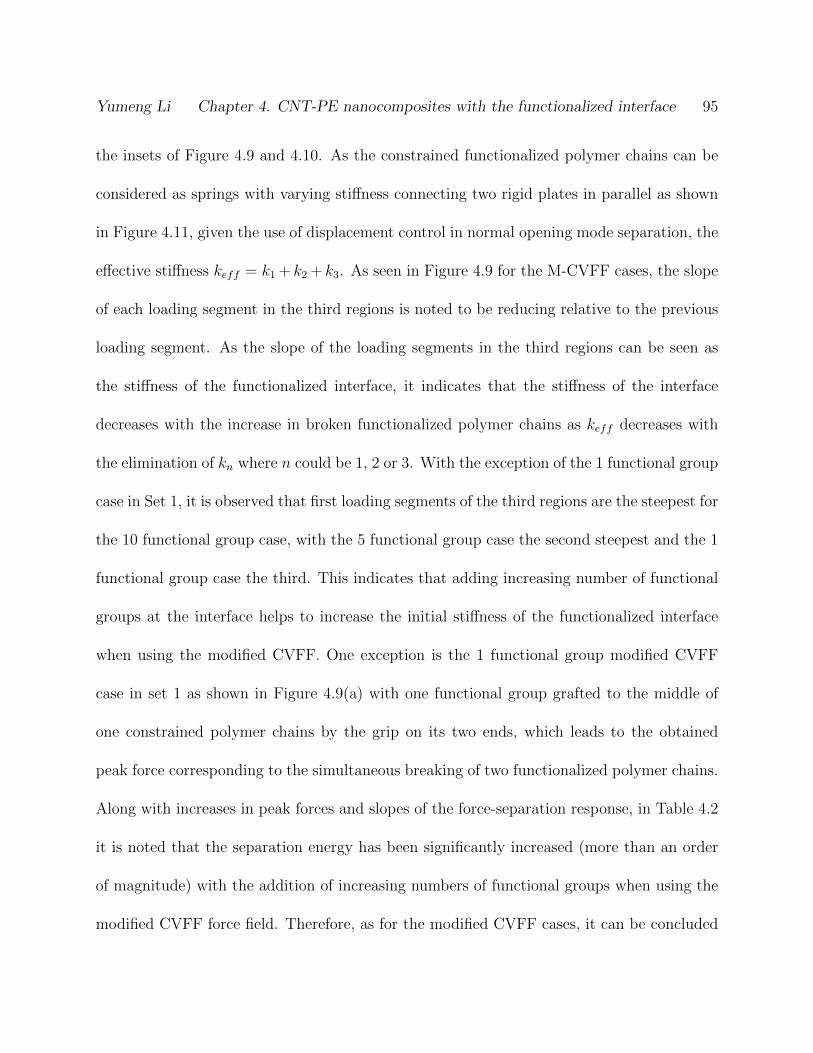
Yumeng Li Chapter 4. CNT-PE nanocomposites with the functionalized interface 95
the insets of Figure 4.9 and 4.10. As the constrained functionalized polymer chains can be
considered as springs with varying stiffness connecting two rigid plates in parallel as shown
in Figure 4.11, given the use of displacement control in normal opening mode separation, the
effective stiffness keff = k1 + k2 + k3. As seen in Figure 4.9 for the M-CVFF cases, the slope
of each loading segment in the third regions is noted to be reducing relative to the previous
loading segment. As the slope of the loading segments in the third regions can be seen as
the stiffness of the functionalized interface, it indicates that the stiffness of the interface
decreases with the increase in broken functionalized polymer chains as keff decreases with
the elimination of kn where n could be 1, 2 or 3. With the exception of the 1 functional group
case in Set 1, it is observed that first loading segments of the third regions are the steepest for
the 10 functional group case, with the 5 functional group case the second steepest and the 1
functional group case the third. This indicates that adding increasing number of functional
groups at the interface helps to increase the initial stiffness of the functionalized interface
when using the modified CVFF. One exception is the 1 functional group modified CVFF
case in set 1 as shown in Figure 4.9(a) with one functional group grafted to the middle of
one constrained polymer chains by the grip on its two ends, which leads to the obtained
peak force corresponding to the simultaneous breaking of two functionalized polymer chains.
Along with increases in peak forces and slopes of the force-separation response, in Table 4.2
it is noted that the separation energy has been significantly increased (more than an order
of magnitude) with the addition of increasing numbers of functional groups when using the
modified CVFF force field. Therefore, as for the modified CVFF cases, it can be concluded
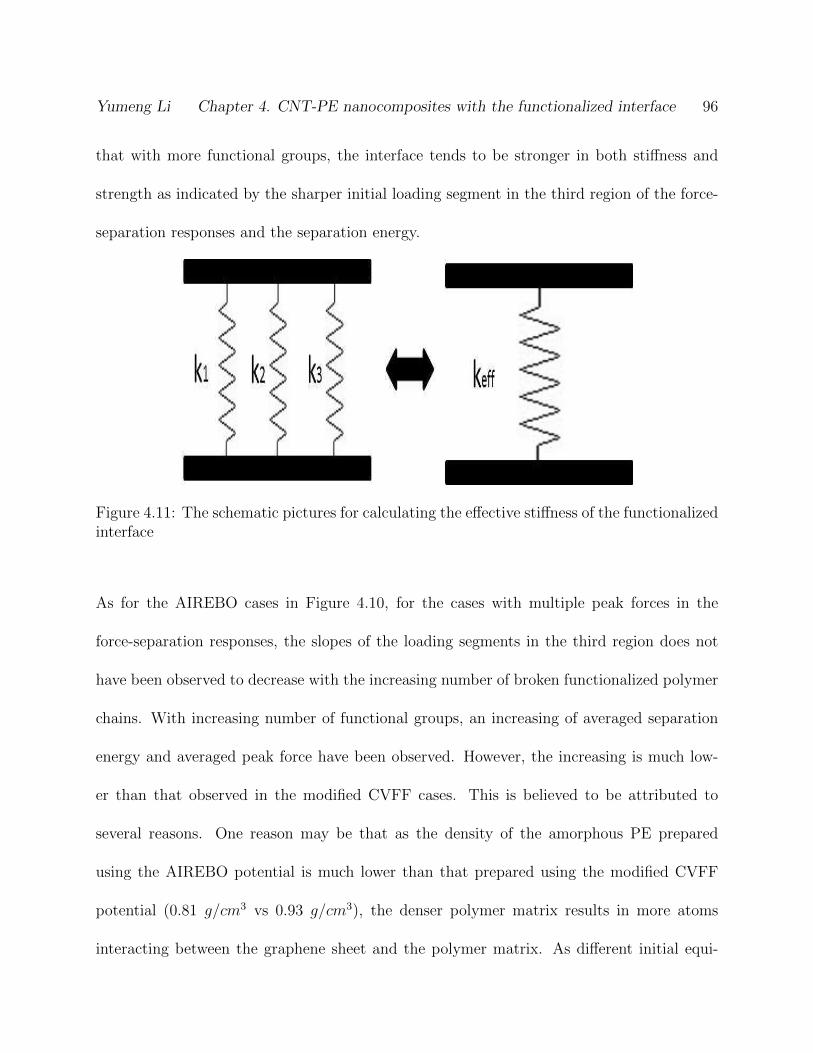
Yumeng Li Chapter 4. CNT-PE nanocomposites with the functionalized interface 96
that with more functional groups, the interface tends to be stronger in both stiffness and
strength as indicated by the sharper initial loading segment in the third region of the force-
separation responses and the separation energy.
Figure 4.11: The schematic pictures for calculating the effective stiffness of the functionalizedinterface
As for the AIREBO cases in Figure 4.10, for the cases with multiple peak forces in the
force-separation responses, the slopes of the loading segments in the third region does not
have been observed to decrease with the increasing number of broken functionalized polymer
chains. With increasing number of functional groups, an increasing of averaged separation
energy and averaged peak force have been observed. However, the increasing is much low-
er than that observed in the modified CVFF cases. This is believed to be attributed to
several reasons. One reason may be that as the density of the amorphous PE prepared
using the AIREBO potential is much lower than that prepared using the modified CVFF
potential (0.81 g/cm3 vs 0.93 g/cm3), the denser polymer matrix results in more atoms
interacting between the graphene sheet and the polymer matrix. As different initial equi-
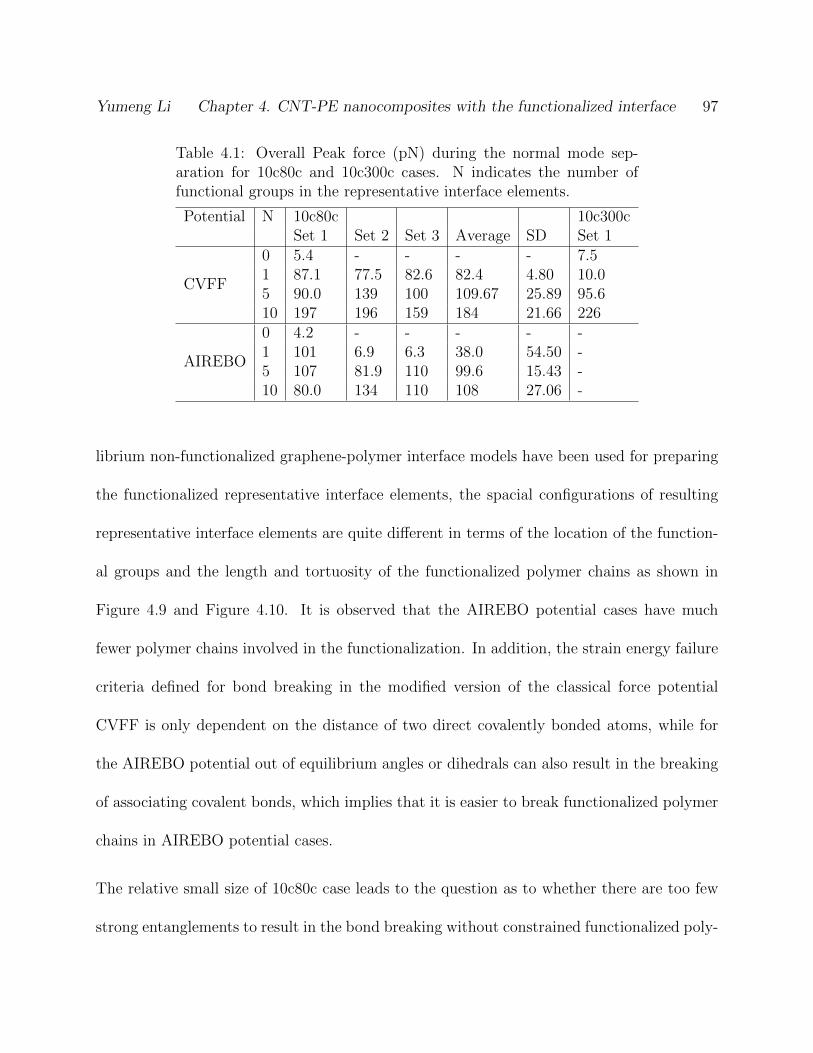
Yumeng Li Chapter 4. CNT-PE nanocomposites with the functionalized interface 97
Table 4.1: Overall Peak force (pN) during the normal mode sep-aration for 10c80c and 10c300c cases. N indicates the number offunctional groups in the representative interface elements.
Potential N 10c80c 10c300cSet 1 Set 2 Set 3 Average SD Set 1
CVFF
0 5.4 - - - - 7.51 87.1 77.5 82.6 82.4 4.80 10.05 90.0 139 100 109.67 25.89 95.610 197 196 159 184 21.66 226
AIREBO
0 4.2 - - - - -1 101 6.9 6.3 38.0 54.50 -5 107 81.9 110 99.6 15.43 -10 80.0 134 110 108 27.06 -
librium non-functionalized graphene-polymer interface models have been used for preparing
the functionalized representative interface elements, the spacial configurations of resulting
representative interface elements are quite different in terms of the location of the function-
al groups and the length and tortuosity of the functionalized polymer chains as shown in
Figure 4.9 and Figure 4.10. It is observed that the AIREBO potential cases have much
fewer polymer chains involved in the functionalization. In addition, the strain energy failure
criteria defined for bond breaking in the modified version of the classical force potential
CVFF is only dependent on the distance of two direct covalently bonded atoms, while for
the AIREBO potential out of equilibrium angles or dihedrals can also result in the breaking
of associating covalent bonds, which implies that it is easier to break functionalized polymer
chains in AIREBO potential cases.
The relative small size of 10c80c case leads to the question as to whether there are too few
strong entanglements to result in the bond breaking without constrained functionalized poly-
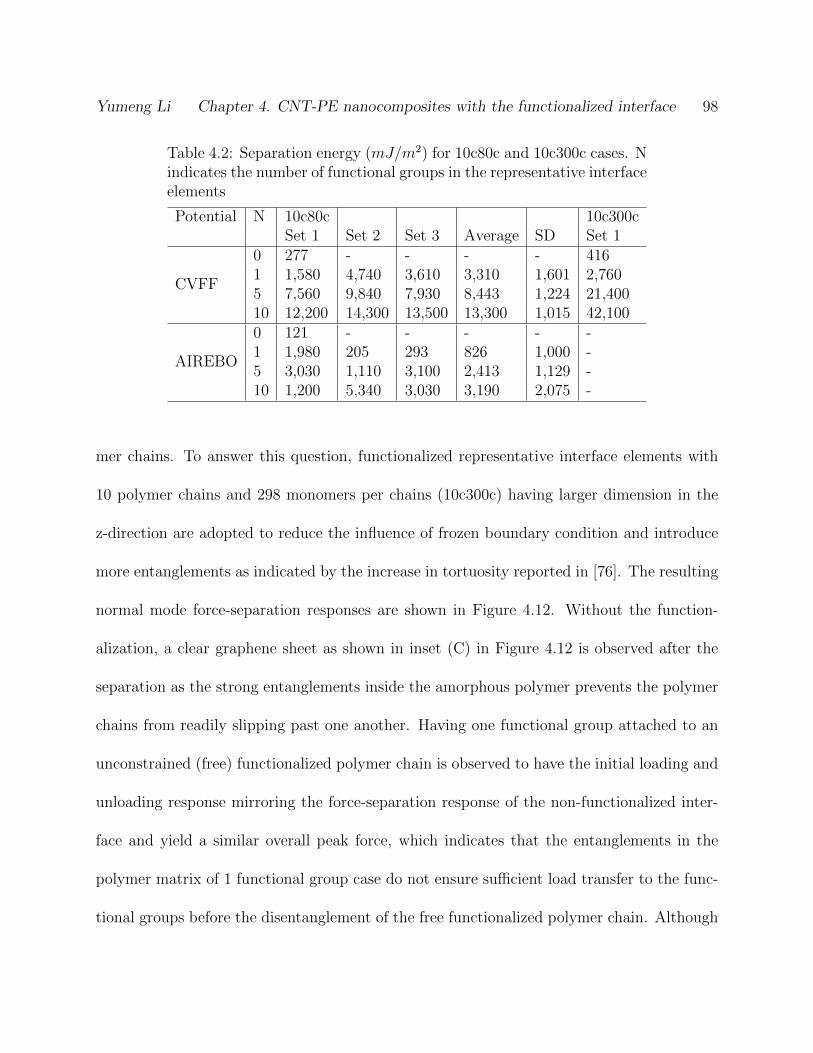
Yumeng Li Chapter 4. CNT-PE nanocomposites with the functionalized interface 98
Table 4.2: Separation energy (mJ/m2) for 10c80c and 10c300c cases. Nindicates the number of functional groups in the representative interfaceelements
Potential N 10c80c 10c300cSet 1 Set 2 Set 3 Average SD Set 1
CVFF
0 277 - - - - 4161 1,580 4,740 3,610 3,310 1,601 2,7605 7,560 9,840 7,930 8,443 1,224 21,40010 12,200 14,300 13,500 13,300 1,015 42,100
AIREBO
0 121 - - - - -1 1,980 205 293 826 1,000 -5 3,030 1,110 3,100 2,413 1,129 -10 1,200 5,340 3,030 3,190 2,075 -
mer chains. To answer this question, functionalized representative interface elements with
10 polymer chains and 298 monomers per chains (10c300c) having larger dimension in the
z-direction are adopted to reduce the influence of frozen boundary condition and introduce
more entanglements as indicated by the increase in tortuosity reported in [76]. The resulting
normal mode force-separation responses are shown in Figure 4.12. Without the function-
alization, a clear graphene sheet as shown in inset (C) in Figure 4.12 is observed after the
separation as the strong entanglements inside the amorphous polymer prevents the polymer
chains from readily slipping past one another. Having one functional group attached to an
unconstrained (free) functionalized polymer chain is observed to have the initial loading and
unloading response mirroring the force-separation response of the non-functionalized inter-
face and yield a similar overall peak force, which indicates that the entanglements in the
polymer matrix of 1 functional group case do not ensure sufficient load transfer to the func-
tional groups before the disentanglement of the free functionalized polymer chain. Although
Yumeng Li Chapter 4. CNT-PE nanocomposites with the functionalized interface 99
there is no large improvement of the peak force in the 1 functional group case comparing
with the non-functionalzied interface, a reloading near 73.6A is observed to plateau around
10A for a while, which is believed to be attributed to the functional group getting engaged in
taking load. However, as the free functionalized polymer chain easily slip off of the rest of the
polymer chains, the peak force of the reloading is low compared to the 5 and 10 functional
groups cases. But the reloading of the 1 functional group case does lead to an increase in
separation energy relative to the non-functionalized interface and therefore a interface with
improved strength. For the 5 and 10 functional groups cases, there is no discernable region 2
observed in the force-separation responses as there is no decrease or plateau in the force fol-
lowing the initial loading segment. Instead, the force immediately continues to significantly
increase indicating the engagement of functional groups in the load transfer. Such enhance-
ment of the load transfer efficiency is believed to reflect the larger degree of entanglement
and therefore load transfer to the functional group. For the 10 functional groups case, it is
noted that the peak force and subsequent dropping labeled in the saw-toothed third region
correspond to the bond breaking in one constrained non-functionalized polymer chain locked
with one of the functionalized polymer chains as shown in the inset (A) and (B) in Figure
4.12, which demonstrates that strong entanglements such as knots in the polymer matrix can
lead to sufficient load transfer to the functional groups. For both 5 and 10 functional groups
cases, a significant long plateau region is observed before the complete failure of the interface
indicated by the force dropping to zero, which demonstrates the moderate load transfer to
the functional groups through the random network of disentangling entanglements prior to
Yumeng Li Chapter 4. CNT-PE nanocomposites with the functionalized interface 100
the complete disentanglement of functionalized polymer chains from the constrained poly-
mer chains. As shown in Table 4.2 and 4.1, 10c300c cases demonstrate comparable overall
peak force and larger separation energy compared with the corresponding 10c80c cases with
same number of functional groups. The increasing in separation energy derives from the
longer polymer chains in 10c300c cases which introduce much stronger entanglements in the
polymer matrix and lead to much longer separation distance. Recognizing that 300 repeat
units in a polymer chain, which is computational large, is till very short compared with
realistic polymer chain lengths, it is anticipated that the realistic entanglements are much
stronger in the polymer matrix of the nanocomposites, which can improve the load transfer
of the functionalized interface.
4.4.3 Sliding Mode Separation
In addition to the normal mode separation, the sliding mode separation is simulated to char-
acterize the load transfer at the functionalized interface in the sliding direction. The sliding
mode separation simulations are performed using modified CVFF or AIREBO potentials
for the functionalized graphene-PE interface with 5 functional groups. As with the normal
mode separation, a region of polymer at the top of the representative interface element is
frozen to simulate a grip while the graphene sheet is displaced at constant velocity until
full separation occurs, only here this velocity is in the y-direction as opposed to the z. In
order to simulate sliding, periodic boundary conditions are retained in the x-direction while
non-periodic boundary conditions are applied in the y-and z-directions as shown in Figure
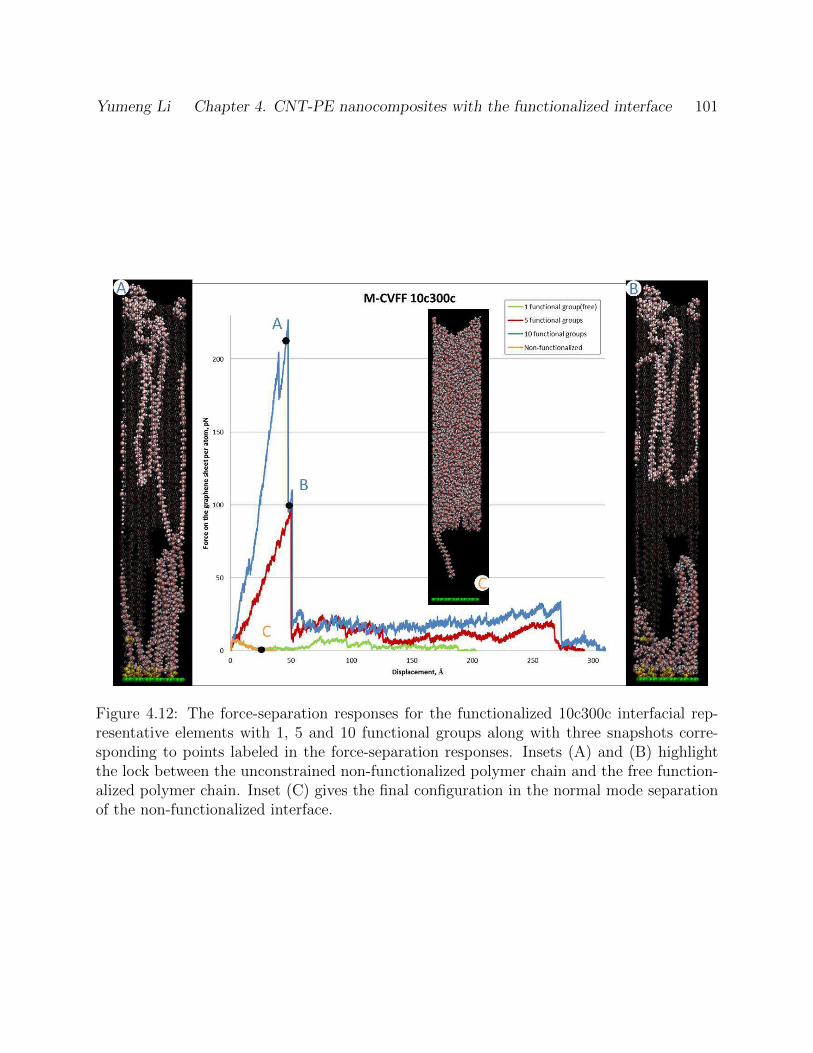
Yumeng Li Chapter 4. CNT-PE nanocomposites with the functionalized interface 101
Figure 4.12: The force-separation responses for the functionalized 10c300c interfacial rep-resentative elements with 1, 5 and 10 functional groups along with three snapshots corre-sponding to points labeled in the force-separation responses. Insets (A) and (B) highlightthe lock between the unconstrained non-functionalized polymer chain and the free function-alized polymer chain. Inset (C) gives the final configuration in the normal mode separationof the non-functionalized interface.
Yumeng Li Chapter 4. CNT-PE nanocomposites with the functionalized interface 102
4.13(a) and 4.13(b). During the separation process, the averaged force on graphene sheet
has been monitored in y direction.
The typical sliding mode force-separation responses are provided in Figure 4.14(a), along
with three snapshots highlighting functionalized polymer chain response in the Figure 4.14
corresponding to the points labeled A)(the starting configuration), B)(a loading segment)
and C)(an unloading segment) in the force-separation response for the modified CVFF case.
It is noted that similar profiles as the normal mode force-separation responses are observed,
i.e. there are discernible regions 1,2 and 3 as well as an observable saw-toothed pattern in
region 3 associated with functionalized polymer chains loading and then breaking resulting in
load redistribution. The initial increasing of the force in region 1 corresponds to the disentan-
glements of the polymer chains surrounding the graphene sheet. Then as the functionalized
polymer chains begin to participate in the load transfer, the force greatly increases in a linear
way for the modified CVFF case and in a more exponential manner for the AIREBO case.
This response is believed to be mostly associated with the stretching of the covalent bonds
in the functionalized polymer chains as shown in the snapshot in Figure 4.14(b). The peak
force and the separation energy are approximately 88.8 pN and 8,250 mJ/m2 (increased of
43 and 99.6 times relative to the non-functionalized interface) for the modified CVFF case
and approximately 40.0 pN and 1,040 mJ/m2 (increases of 4.87 and 10.4 times relative to
the non-functionalized interface) for the AIREBO case. In fact, the functionalized interface
models have the peak force and separation energy in the sliding mode separation compara-
ble with those of normal separations, thus leading to a nearly equal load carrying capability
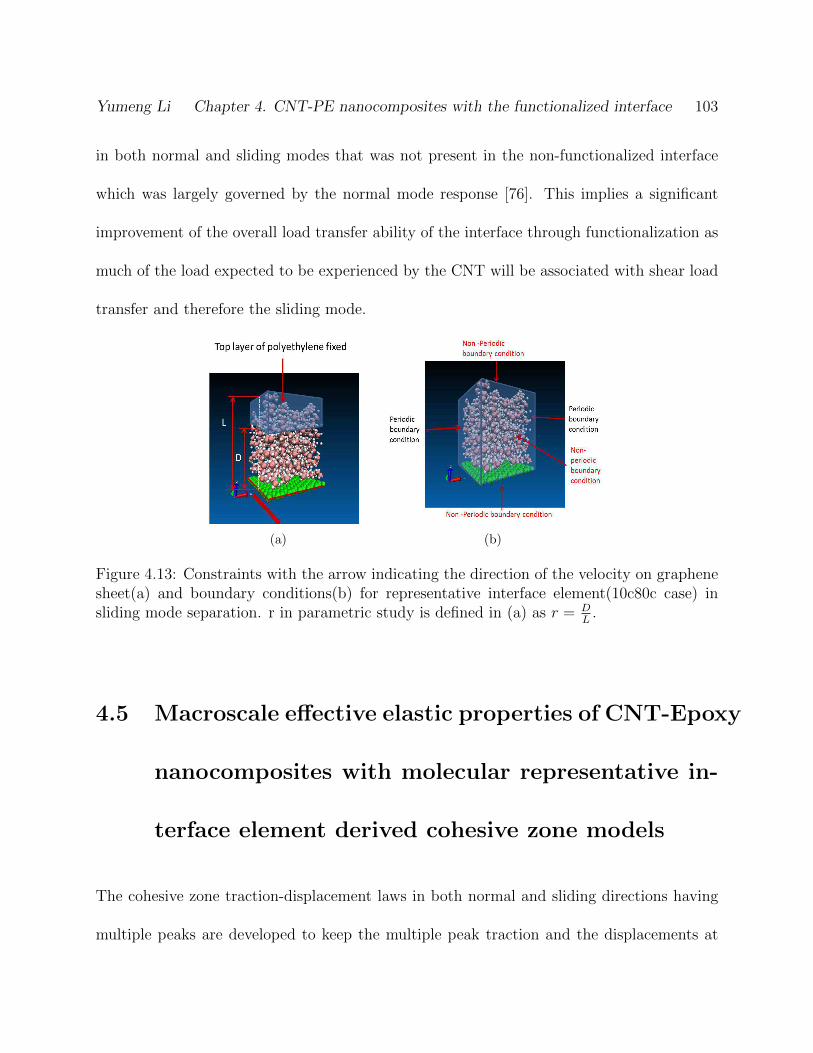
Yumeng Li Chapter 4. CNT-PE nanocomposites with the functionalized interface 103
in both normal and sliding modes that was not present in the non-functionalized interface
which was largely governed by the normal mode response [76]. This implies a significant
improvement of the overall load transfer ability of the interface through functionalization as
much of the load expected to be experienced by the CNT will be associated with shear load
transfer and therefore the sliding mode.
(a) (b)
Figure 4.13: Constraints with the arrow indicating the direction of the velocity on graphenesheet(a) and boundary conditions(b) for representative interface element(10c80c case) insliding mode separation. r in parametric study is defined in (a) as r = D
L.
4.5 Macroscale effective elastic properties of CNT-Epoxy
nanocomposites with molecular representative in-
terface element derived cohesive zone models
The cohesive zone traction-displacement laws in both normal and sliding directions having
multiple peaks are developed to keep the multiple peak traction and the displacements at
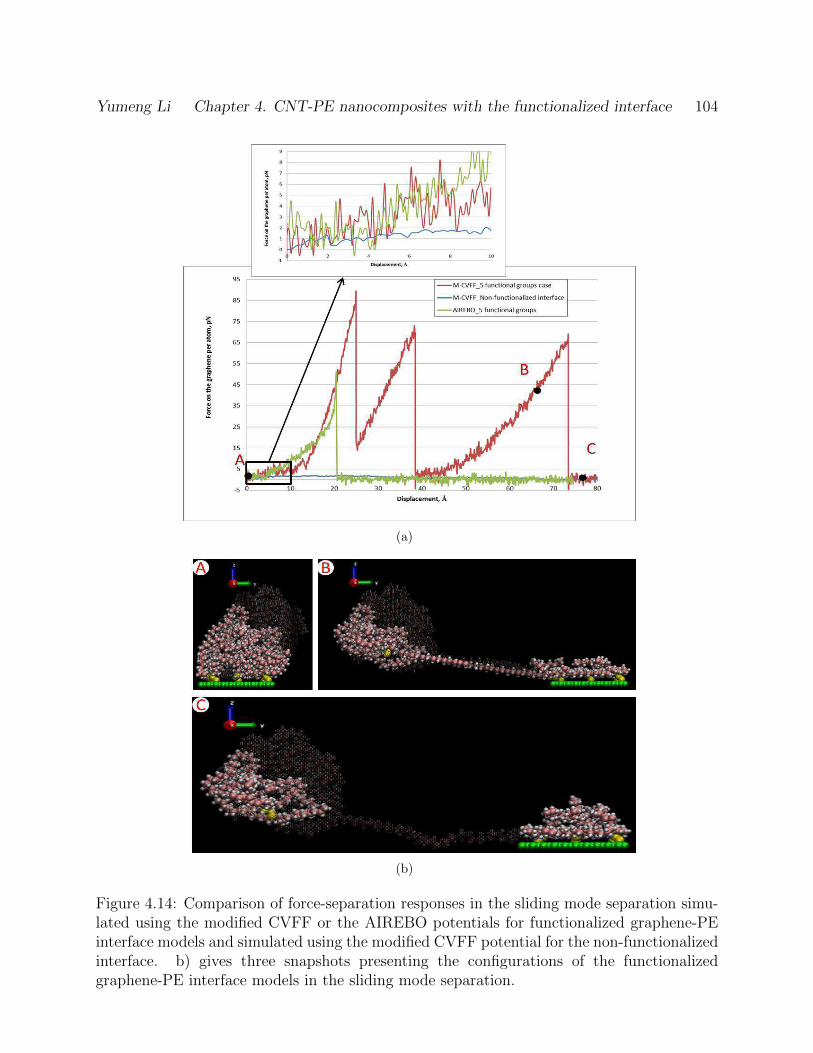
Yumeng Li Chapter 4. CNT-PE nanocomposites with the functionalized interface 104
(a)
(b)
Figure 4.14: Comparison of force-separation responses in the sliding mode separation simu-lated using the modified CVFF or the AIREBO potentials for functionalized graphene-PEinterface models and simulated using the modified CVFF potential for the non-functionalizedinterface. b) gives three snapshots presenting the configurations of the functionalizedgraphene-PE interface models in the sliding mode separation.
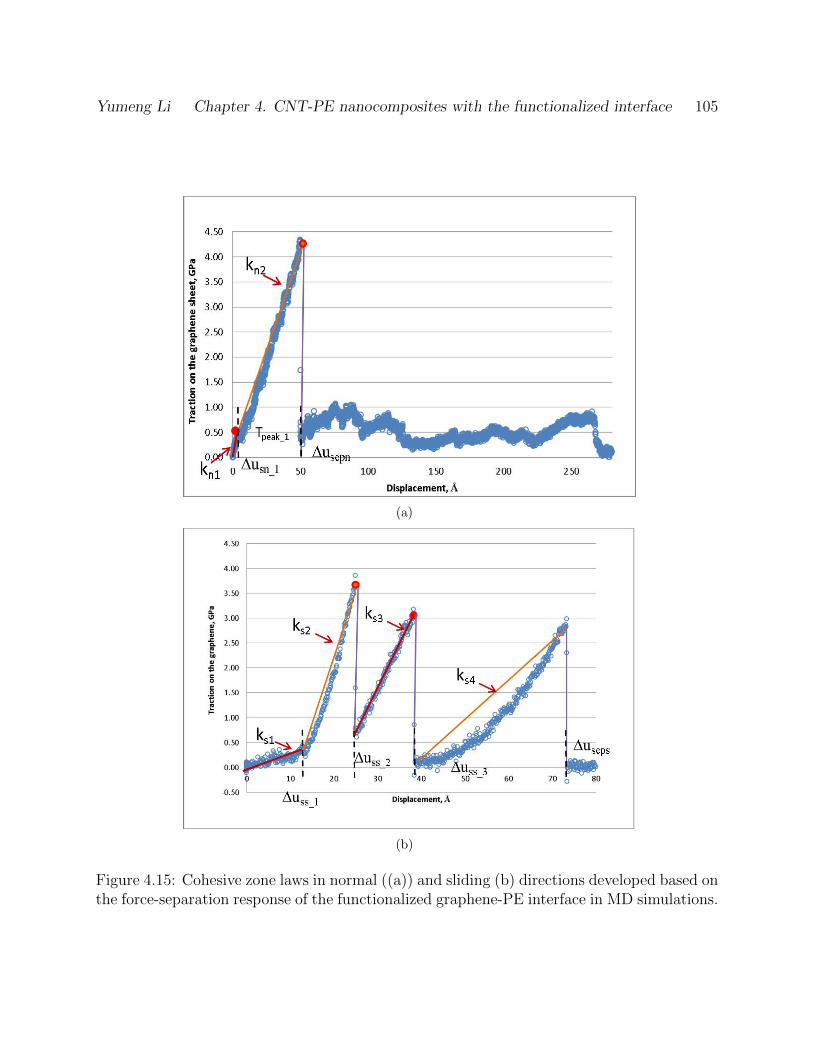
Yumeng Li Chapter 4. CNT-PE nanocomposites with the functionalized interface 105
(a)
(b)
Figure 4.15: Cohesive zone laws in normal ((a)) and sliding (b) directions developed based onthe force-separation response of the functionalized graphene-PE interface in MD simulations.
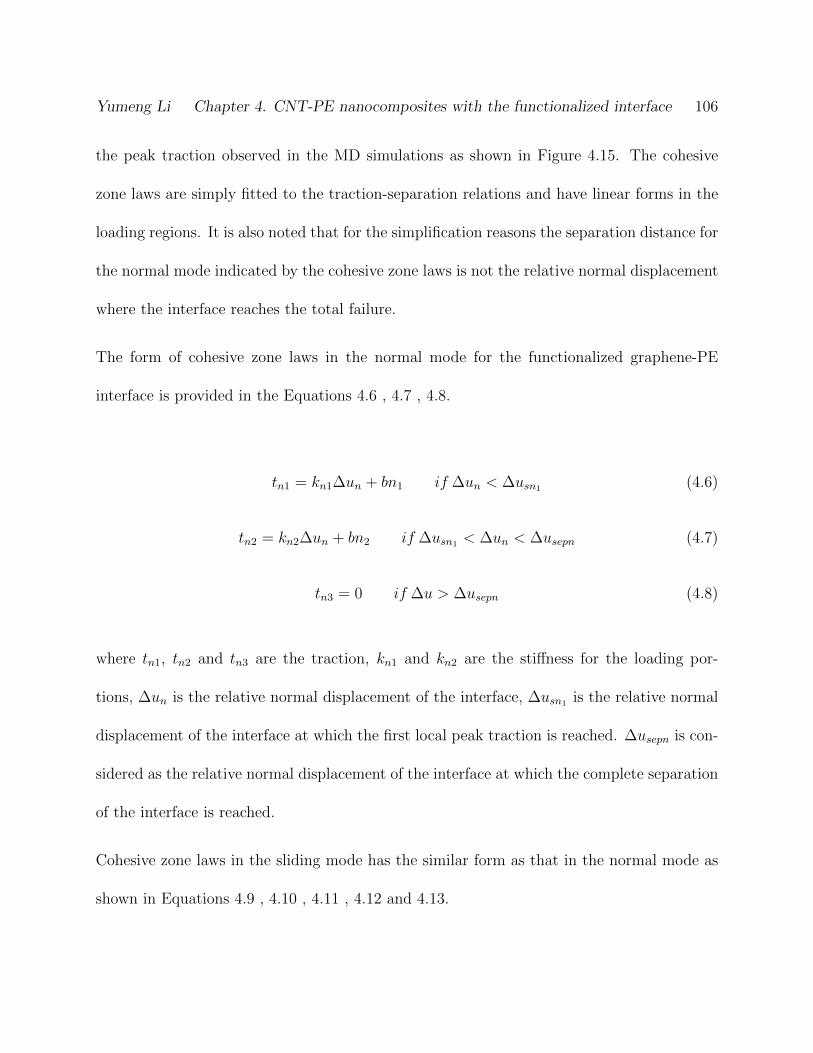
Yumeng Li Chapter 4. CNT-PE nanocomposites with the functionalized interface 106
the peak traction observed in the MD simulations as shown in Figure 4.15. The cohesive
zone laws are simply fitted to the traction-separation relations and have linear forms in the
loading regions. It is also noted that for the simplification reasons the separation distance for
the normal mode indicated by the cohesive zone laws is not the relative normal displacement
where the interface reaches the total failure.
The form of cohesive zone laws in the normal mode for the functionalized graphene-PE
interface is provided in the Equations 4.6 , 4.7 , 4.8.
tn1 = kn1∆un + bn1 if ∆un < ∆usn1 (4.6)
tn2 = kn2∆un + bn2 if ∆usn1 < ∆un < ∆usepn (4.7)
tn3 = 0 if ∆u > ∆usepn (4.8)
where tn1, tn2 and tn3 are the traction, kn1 and kn2 are the stiffness for the loading por-
tions, ∆un is the relative normal displacement of the interface, ∆usn1 is the relative normal
displacement of the interface at which the first local peak traction is reached. ∆usepn is con-
sidered as the relative normal displacement of the interface at which the complete separation
of the interface is reached.
Cohesive zone laws in the sliding mode has the similar form as that in the normal mode as
shown in Equations 4.9 , 4.10 , 4.11 , 4.12 and 4.13.
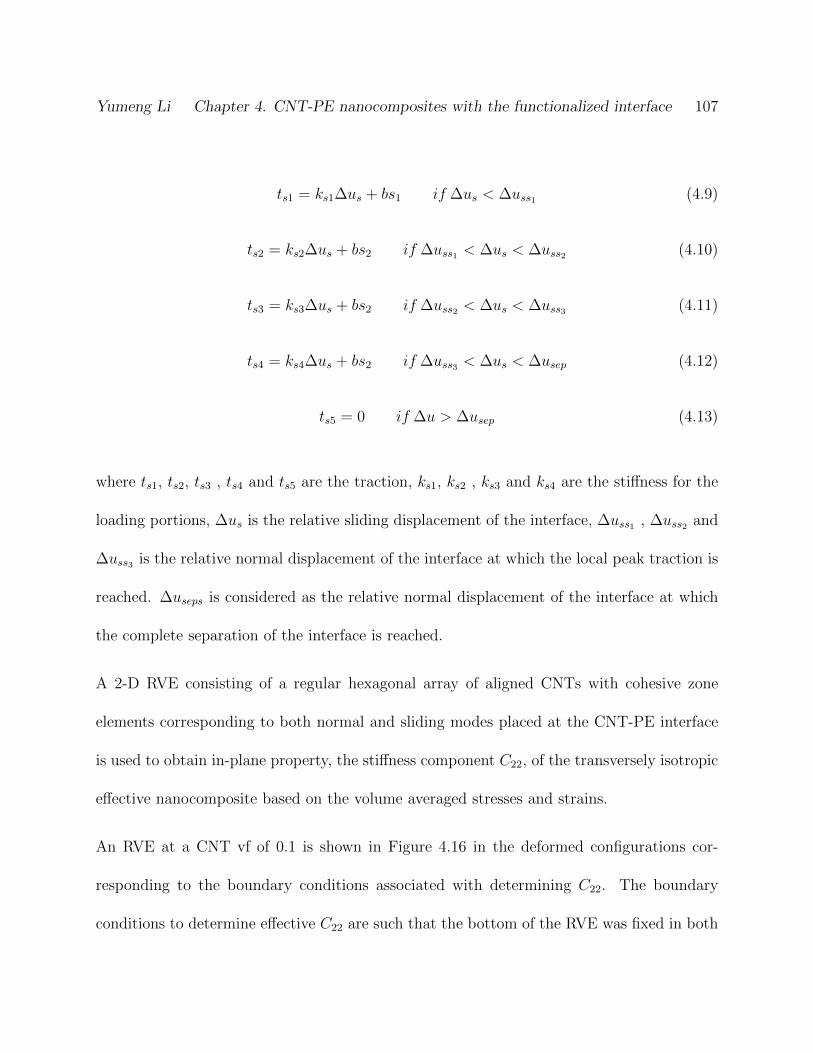
Yumeng Li Chapter 4. CNT-PE nanocomposites with the functionalized interface 107
ts1 = ks1∆us + bs1 if ∆us < ∆uss1 (4.9)
ts2 = ks2∆us + bs2 if ∆uss1 < ∆us < ∆uss2 (4.10)
ts3 = ks3∆us + bs2 if ∆uss2 < ∆us < ∆uss3 (4.11)
ts4 = ks4∆us + bs2 if ∆uss3 < ∆us < ∆usep (4.12)
ts5 = 0 if ∆u > ∆usep (4.13)
where ts1, ts2, ts3 , ts4 and ts5 are the traction, ks1, ks2 , ks3 and ks4 are the stiffness for the
loading portions, ∆us is the relative sliding displacement of the interface, ∆uss1 , ∆uss2 and
∆uss3 is the relative normal displacement of the interface at which the local peak traction is
reached. ∆useps is considered as the relative normal displacement of the interface at which
the complete separation of the interface is reached.
A 2-D RVE consisting of a regular hexagonal array of aligned CNTs with cohesive zone
elements corresponding to both normal and sliding modes placed at the CNT-PE interface
is used to obtain in-plane property, the stiffness component C22, of the transversely isotropic
effective nanocomposite based on the volume averaged stresses and strains.
An RVE at a CNT vf of 0.1 is shown in Figure 4.16 in the deformed configurations cor-
responding to the boundary conditions associated with determining C22. The boundary
conditions to determine effective C22 are such that the bottom of the RVE was fixed in both
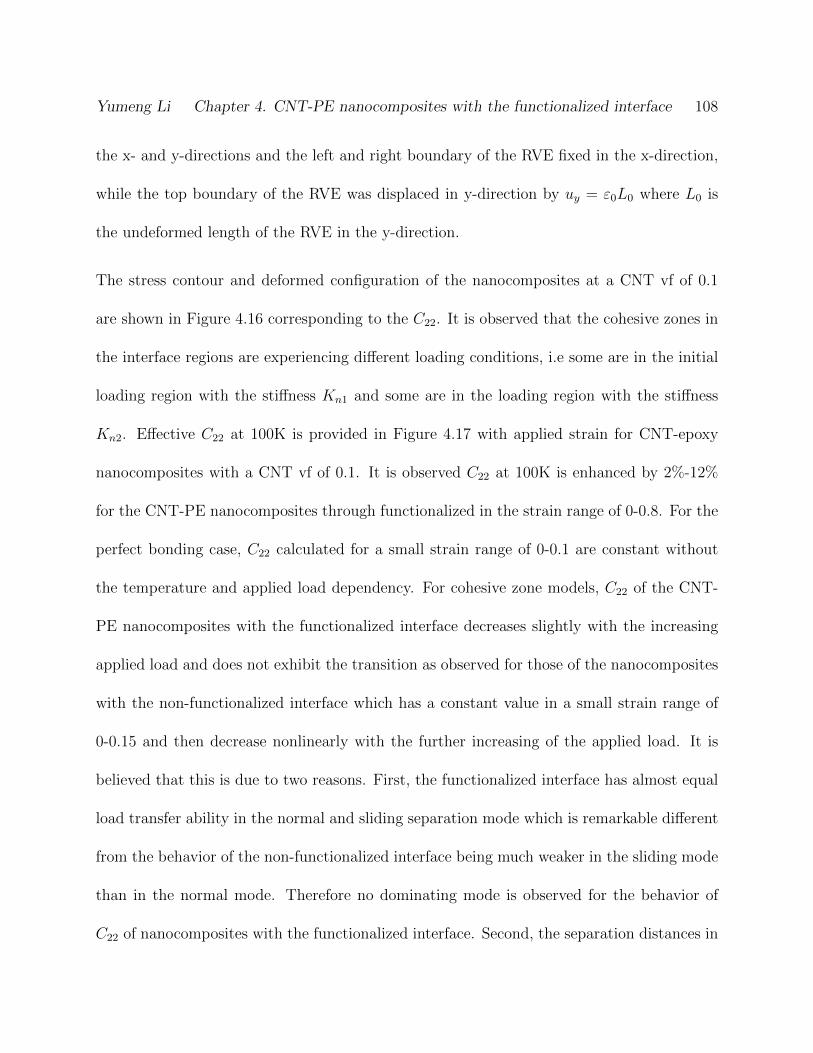
Yumeng Li Chapter 4. CNT-PE nanocomposites with the functionalized interface 108
the x- and y-directions and the left and right boundary of the RVE fixed in the x-direction,
while the top boundary of the RVE was displaced in y-direction by uy = ε0L0 where L0 is
the undeformed length of the RVE in the y-direction.
The stress contour and deformed configuration of the nanocomposites at a CNT vf of 0.1
are shown in Figure 4.16 corresponding to the C22. It is observed that the cohesive zones in
the interface regions are experiencing different loading conditions, i.e some are in the initial
loading region with the stiffness Kn1 and some are in the loading region with the stiffness
Kn2. Effective C22 at 100K is provided in Figure 4.17 with applied strain for CNT-epoxy
nanocomposites with a CNT vf of 0.1. It is observed C22 at 100K is enhanced by 2%-12%
for the CNT-PE nanocomposites through functionalized in the strain range of 0-0.8. For the
perfect bonding case, C22 calculated for a small strain range of 0-0.1 are constant without
the temperature and applied load dependency. For cohesive zone models, C22 of the CNT-
PE nanocomposites with the functionalized interface decreases slightly with the increasing
applied load and does not exhibit the transition as observed for those of the nanocomposites
with the non-functionalized interface which has a constant value in a small strain range of
0-0.15 and then decrease nonlinearly with the further increasing of the applied load. It is
believed that this is due to two reasons. First, the functionalized interface has almost equal
load transfer ability in the normal and sliding separation mode which is remarkable different
from the behavior of the non-functionalized interface being much weaker in the sliding mode
than in the normal mode. Therefore no dominating mode is observed for the behavior of
C22 of nanocomposites with the functionalized interface. Second, the separation distances in
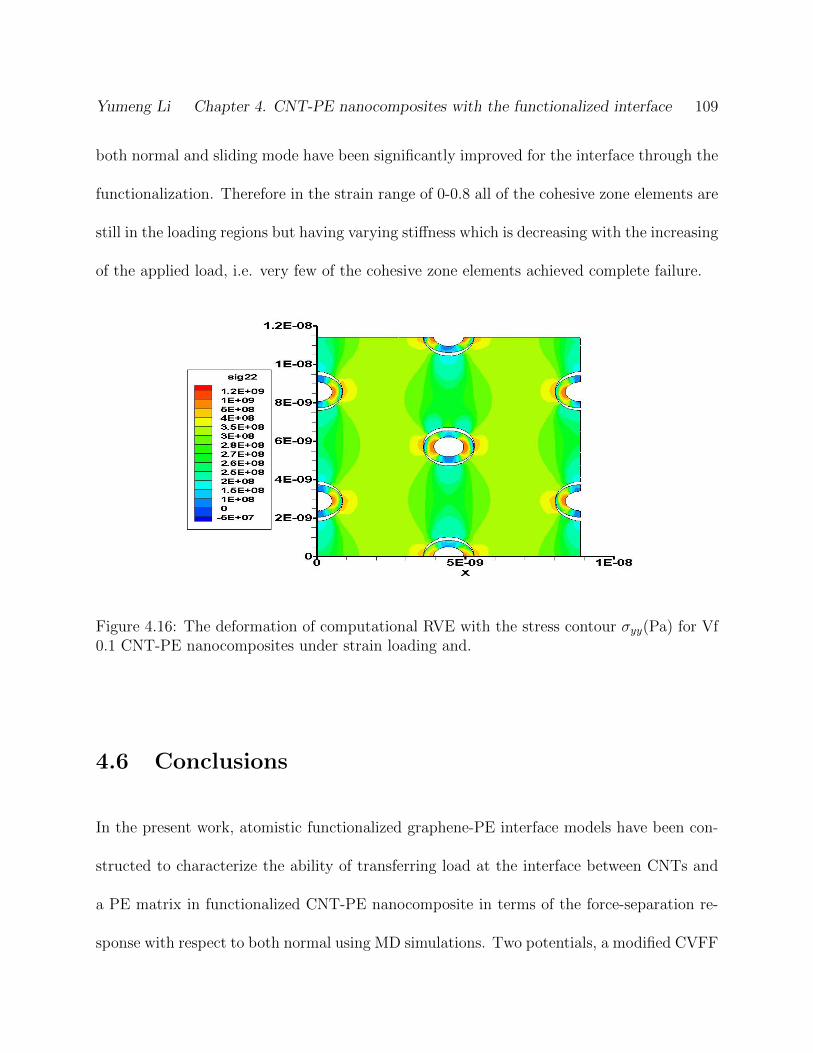
Yumeng Li Chapter 4. CNT-PE nanocomposites with the functionalized interface 109
both normal and sliding mode have been significantly improved for the interface through the
functionalization. Therefore in the strain range of 0-0.8 all of the cohesive zone elements are
still in the loading regions but having varying stiffness which is decreasing with the increasing
of the applied load, i.e. very few of the cohesive zone elements achieved complete failure.
Figure 4.16: The deformation of computational RVE with the stress contour σyy(Pa) for Vf0.1 CNT-PE nanocomposites under strain loading and.
4.6 Conclusions
In the present work, atomistic functionalized graphene-PE interface models have been con-
structed to characterize the ability of transferring load at the interface between CNTs and
a PE matrix in functionalized CNT-PE nanocomposite in terms of the force-separation re-
sponse with respect to both normal using MD simulations. Two potentials, a modified CVFF
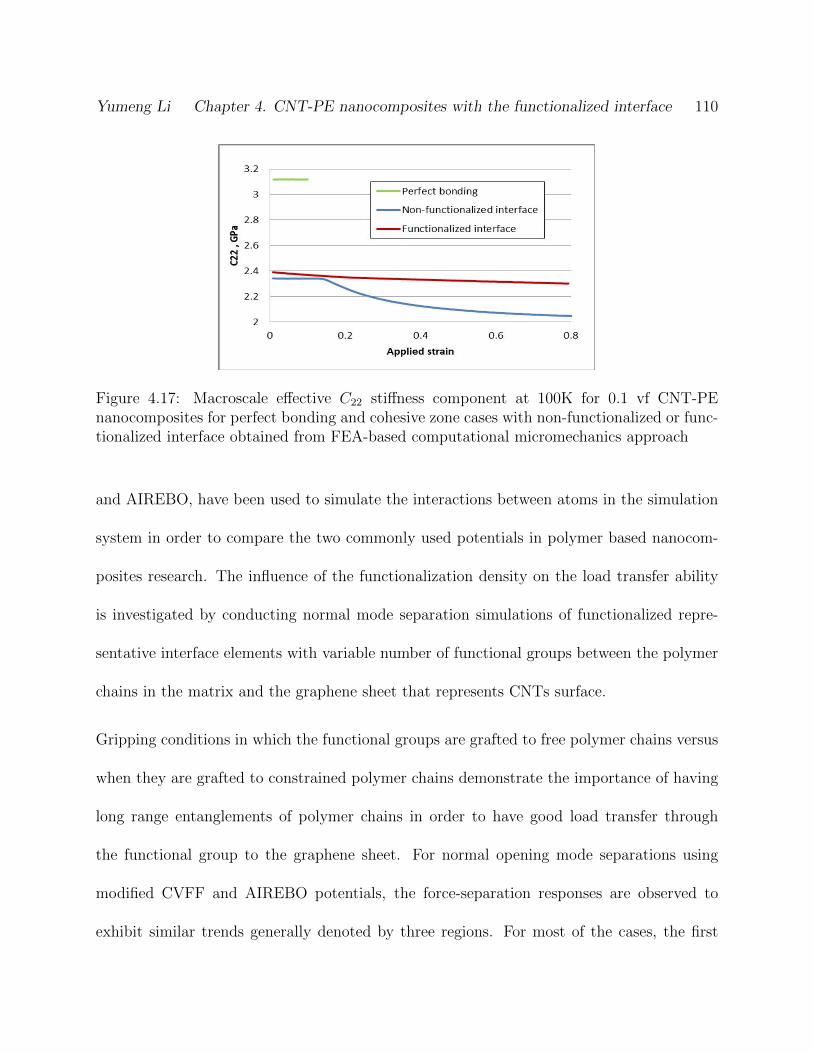
Yumeng Li Chapter 4. CNT-PE nanocomposites with the functionalized interface 110
Figure 4.17: Macroscale effective C22 stiffness component at 100K for 0.1 vf CNT-PEnanocomposites for perfect bonding and cohesive zone cases with non-functionalized or func-tionalized interface obtained from FEA-based computational micromechanics approach
and AIREBO, have been used to simulate the interactions between atoms in the simulation
system in order to compare the two commonly used potentials in polymer based nanocom-
posites research. The influence of the functionalization density on the load transfer ability
is investigated by conducting normal mode separation simulations of functionalized repre-
sentative interface elements with variable number of functional groups between the polymer
chains in the matrix and the graphene sheet that represents CNTs surface.
Gripping conditions in which the functional groups are grafted to free polymer chains versus
when they are grafted to constrained polymer chains demonstrate the importance of having
long range entanglements of polymer chains in order to have good load transfer through
the functional group to the graphene sheet. For normal opening mode separations using
modified CVFF and AIREBO potentials, the force-separation responses are observed to
exhibit similar trends generally denoted by three regions. For most of the cases, the first
Yumeng Li Chapter 4. CNT-PE nanocomposites with the functionalized interface 111
regions are associated with initial disentanglement of the amorphous PE chains as observed
in the normal opening force-separation responses for the non-functionalized graphene-PE
interface models. In the third regions saw-toothed patterns are observed and it is noted that
the peak force is increased by 15.3-21.6 times for the CVFF cases and 9.06-25.7 times for the
AIREBO cases as compared to the non-functionalized graphene-PE interface model, both
of which indicate an large improvements in the load transfer ability of the funcitonalized
interface. Larger separation energy has also been observed for the interface with more
functional groups in the normal mode separation which demonstrates higher functionlaization
density can lead to the better load transfer ability of the functionalized interface. For the
sliding mode separations, 5 functional groups cases demonstrates increased overall peak force
and separation energy ( 43 and 99.6 times for the modified CVFF case and 4.87 and 10.4 times
for the AIREBO case). It shows that the functionalized interface model has a nearly equal
load carrying capability in both normal and sliding modes, which indicates the significant
improved overall load transfer ability of the interface through the functionalization. For
the functionalized interface in the 10c300c cases, the strong entanglements resulting from
the long polymer chains in the matrix is observed to have significant contribution on the
enhanced strength of the functionalized interface, which indicates the functionalization is
able to significantly improve the load transfer of the interface in the nanocomposites.
While the enhancement of the load transfer has been observed for the functionalized interface
simulated using both the modified CVFF and the AIREBO potentials, it is noted that due to
differences in the formulation of the potentials as well as the resulting amorphous structure
Yumeng Li Chapter 4. CNT-PE nanocomposites with the functionalized interface 112
derived from it, the modified CVFF cases obtained higher peak force, longer separation
distance and therefore larger separation energy in the normal opening and sliding mode
separation relative to the AIREBO cases. For the normal mode separation using the modified
CVFF cases, in the third region, it is noted that the slope of first loading segment varies
with the number of broken bonds in the separation, which is less observable for the AIREBO
cases. As another parameter describing the properties of the interface, a sharper slope of the
loading region should correspond to a stiffer interface, which is consistent to the observation
for the modified CVFF cases with multiple functional groups. Therefore for the modified
CVFF cases, the interface is stronger while a sharper slope and a larger separation energy are
observed in the force-separation responses. The modified CVFF demonstrates that the load
transfer ability of the functionalized interface is sensitive to the number of the functional
groups. Therefore it is more meaningful to characterize the load transfer capability of the
functionalized interface using the modified CVFF. Considering the expensive computational
cost of the AIREBO potential as it is sensitive to the size of time step, it is also more efficient
to use the modified CVFF potential.
It has been shown ([76]) that due to the present of a weak non-functionalized interface
between CNTs and the polymer matrix, the macroscale effective properties of the CNT-
PE nanocomposites experienced significant depreciation compared to the micromechanics
predictions with perfect bonding assumptions. As observed for CNT pull-out in the work
of [54], this study shows that functionalization can greatly enhance the load transfer at
the CNT-polymer interface. Observing herein that the normal and sliding modes both
Yumeng Li Chapter 4. CNT-PE nanocomposites with the functionalized interface 113
yield significantly improved interfacial load transfer, the latter more so relative to its non-
functionalized counterpart, it is expected that all effective elastic properties, especially those
relying on shear load transfer, will be enhanced along with their durability under load.
The finite element implementation of cohesive zone model is applied to calculate macroscale
effective mechanical property of the CNT-PE nanocomposites with the functionalized inter-
face, which demonstrates improved C(22) relative to the CNT-PE nanocomposites with the
non-functionalized interface. It indicates that the functionalization of the interface helps to
improve the effective mechanical properties of the CNT-reinforced polymer nanocomposites.
Chapter 5
Characterization of nanoscale load
transfer at the CNT-epoxy interface
using molecular dynamic simulation
5.1 Introduction
Epoxy is an important engineering resin as it is easy to process and has excellent mechanical
properties. Epoxy is widely used as the matrix material in the fabrication of carbon and glass
fiber composites for the aerospace industry. As such, CNT reinforced epoxy polymer compos-
ites have attracted great interest for supplementing the existing matrix material for increased
stiffness with minimal if any weight penalty and the potential for multi-functionalization.
114
Yumeng Li Chapter 5. CNT-epoxy nanocomposites 115
Many attempts have been made to develop surface treatments techniques to enhance the
adhesion between CNTs and the polymer matrix through improved dispersion of the CNTs
in the polymer matrix and/or through bonding of the CNT-polymer interface. For example,
in [30] authors applied amino-functionalization to CNTs and observed a better dispersion
and integration of CNTs in the polymer matrix and the resulting remarkable improvement in
mechanical properties, 24.6% increases for the elastic modulus with only 0.5 wt% addition of
functionalized CNTs in contrast to only 3.2% increases of non-functionalized CNT reinforced
nanocomposites. In [35] authors fabricated epoxy-based nanocomposites reinforced by C-
NTs with covalently attached amino groups which can react with the resin monomers in the
matrix and lead to a fully integrated nanocomposites structure. They reported 30-70% in-
crease in ultimate strength and modulus of the nanocomposites with 1-4 wt% functionalized
SWNTs and an increased strain to failure. Although the experimental results provide strong
evidence that the reinforcement efficiency of CNTs in the epoxy polymer nanocomposites is
affected by the interfacial interactions and can be largely enhanced by the application of the
functionalization, the interfacial mechanism behind these is still not fully understood. The
improved fabrication of CNT-reinforced epoxy polymer nanocomposites possessing enhanced
mechanical performance can benefit from better understanding of the interface properties
and their effects on the macroscale effective material properties.
In the present work, a graphene-epoxy interface model is adopted to investigate the load
transfer properties of the non-functionalized and functionalized interface in the CNT-epoxy
nanocomposites by conducting the atomistic MD simulations. A dynamic crosslinking al-
Yumeng Li Chapter 5. CNT-epoxy nanocomposites 116
gorithm is developed to construct the atomistic structure of croslinked epoxy matrices with
various crosslink densities. The functionalized graphene-epoxy interface is modeled by graft-
ing functional groups to the graphene sheet, which enable the direct covalent interaction of
the graphene sheet with the crosslinked network of the epoxy polymer matrix by crosslinking
with the Epon resin. Separations in normal and sliding directions are simulated to assess the
interfacial load transfer characteristics for the non-functionalized and functionalized inter-
face models at specified temperatures. Parametric study is applied towards investigating the
influence of the temperature and the crosslinking density on the load transfer ability of the
interface. The effective material properties of CNT-epoxy nanocomposites were calculated
using finite element analysis embedded with cohesive zone models, which behaviors following
cohesive zone laws developed based on traction-separation responses from MD simulations.
It is anticipated that the results of the parametric study can provide possible reasons behind
the low experimental values of effective material properties of the CNT-reinforced polymer
nanocomposites and the improvement in mechanical properties obtained through functional-
ization. This in turn may offer insights has to how to improve the design of nanocomposites.
5.2 Description of Potential Energy
The OPLS All-Atom(AA) force field, which was developed by Jorgensen and coworkers [64]
based on the Assisted Model Building and Energy Refinement(AMBER) potential for organic
molecules, was used to simulate the intra and intermolecular forces in the epoxy matrix of
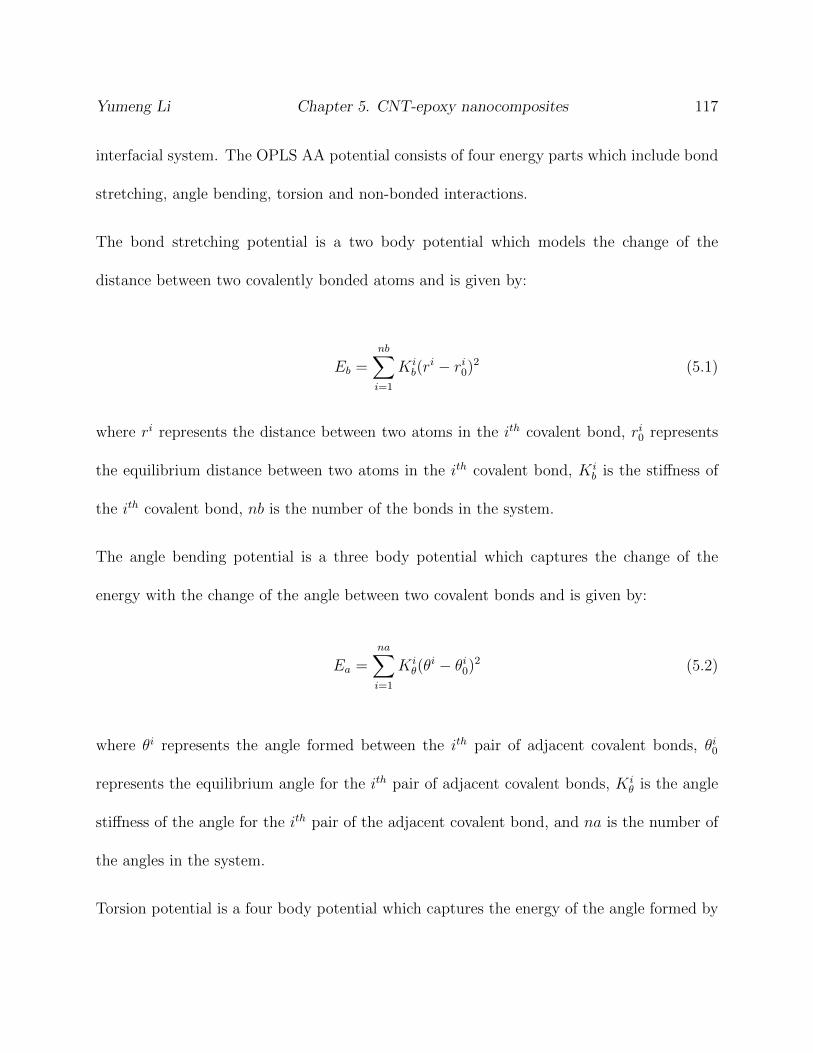
Yumeng Li Chapter 5. CNT-epoxy nanocomposites 117
interfacial system. The OPLS AA potential consists of four energy parts which include bond
stretching, angle bending, torsion and non-bonded interactions.
The bond stretching potential is a two body potential which models the change of the
distance between two covalently bonded atoms and is given by:
Eb =nb∑i=1
Kib(r
i − ri0)2 (5.1)
where ri represents the distance between two atoms in the ith covalent bond, ri0 represents
the equilibrium distance between two atoms in the ith covalent bond, Kib is the stiffness of
the ith covalent bond, nb is the number of the bonds in the system.
The angle bending potential is a three body potential which captures the change of the
energy with the change of the angle between two covalent bonds and is given by:
Ea =na∑i=1
Kiθ(θ
i − θi0)2 (5.2)
where θi represents the angle formed between the ith pair of adjacent covalent bonds, θi0
represents the equilibrium angle for the ith pair of adjacent covalent bonds, Kiθ is the angle
stiffness of the angle for the ith pair of the adjacent covalent bond, and na is the number of
the angles in the system.
Torsion potential is a four body potential which captures the energy of the angle formed by
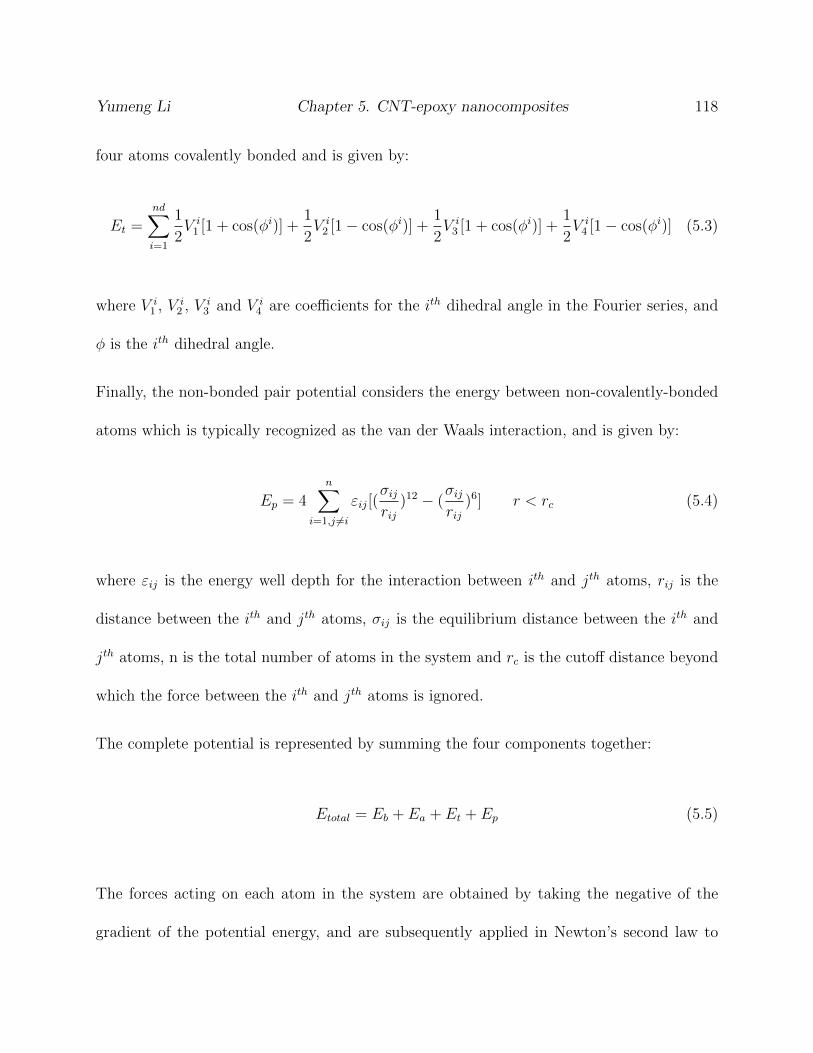
Yumeng Li Chapter 5. CNT-epoxy nanocomposites 118
four atoms covalently bonded and is given by:
Et =nd∑i=1
1
2V i1 [1 + cos(φi)] +
1
2V i2 [1− cos(φi)] +
1
2V i3 [1 + cos(φi)] +
1
2V i4 [1− cos(φi)] (5.3)
where V i1 , V i
2 , V i3 and V i
4 are coefficients for the ith dihedral angle in the Fourier series, and
φ is the ith dihedral angle.
Finally, the non-bonded pair potential considers the energy between non-covalently-bonded
atoms which is typically recognized as the van der Waals interaction, and is given by:
Ep = 4n∑
i=1,j 6=i
εij[(σijrij
)12 − (σijrij
)6] r < rc (5.4)
where εij is the energy well depth for the interaction between ith and jth atoms, rij is the
distance between the ith and jth atoms, σij is the equilibrium distance between the ith and
jth atoms, n is the total number of atoms in the system and rc is the cutoff distance beyond
which the force between the ith and jth atoms is ignored.
The complete potential is represented by summing the four components together:
Etotal = Eb + Ea + Et + Ep (5.5)
The forces acting on each atom in the system are obtained by taking the negative of the
gradient of the potential energy, and are subsequently applied in Newton’s second law to
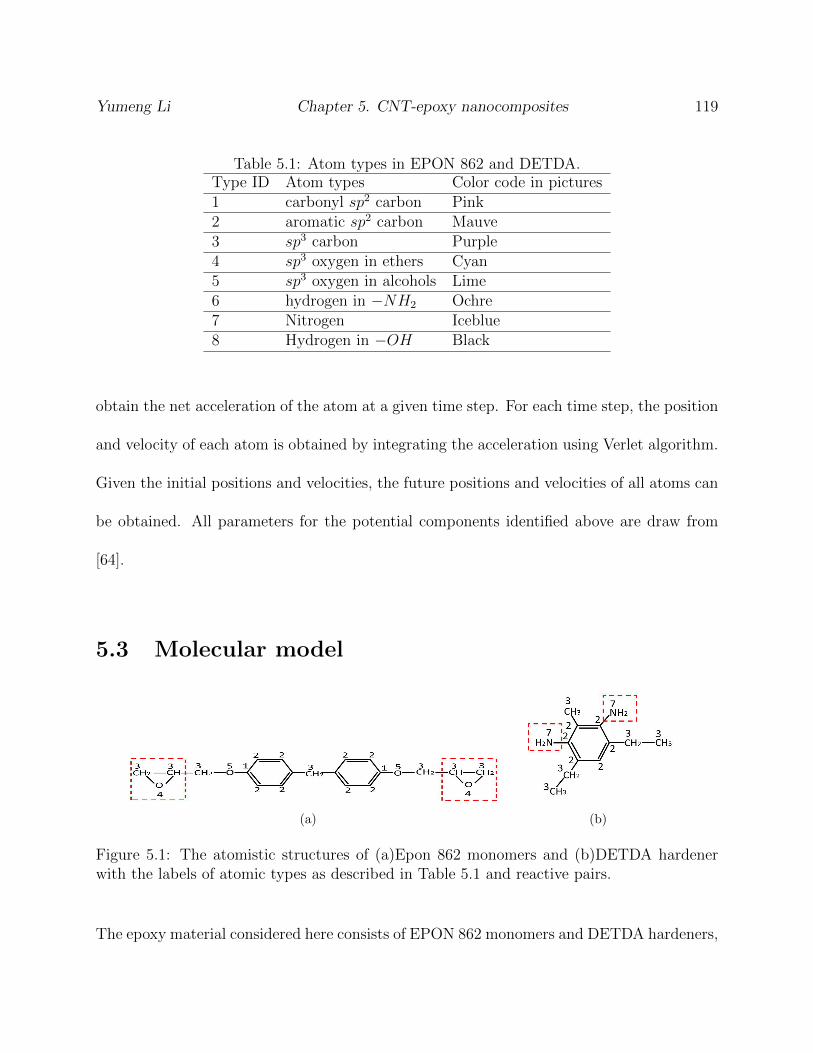
Yumeng Li Chapter 5. CNT-epoxy nanocomposites 119
Table 5.1: Atom types in EPON 862 and DETDA.Type ID Atom types Color code in pictures1 carbonyl sp2 carbon Pink2 aromatic sp2 carbon Mauve3 sp3 carbon Purple4 sp3 oxygen in ethers Cyan5 sp3 oxygen in alcohols Lime6 hydrogen in −NH2 Ochre7 Nitrogen Iceblue8 Hydrogen in −OH Black
obtain the net acceleration of the atom at a given time step. For each time step, the position
and velocity of each atom is obtained by integrating the acceleration using Verlet algorithm.
Given the initial positions and velocities, the future positions and velocities of all atoms can
be obtained. All parameters for the potential components identified above are draw from
[64].
5.3 Molecular model
(a) (b)
Figure 5.1: The atomistic structures of (a)Epon 862 monomers and (b)DETDA hardenerwith the labels of atomic types as described in Table 5.1 and reactive pairs.
The epoxy material considered here consists of EPON 862 monomers and DETDA hardeners,
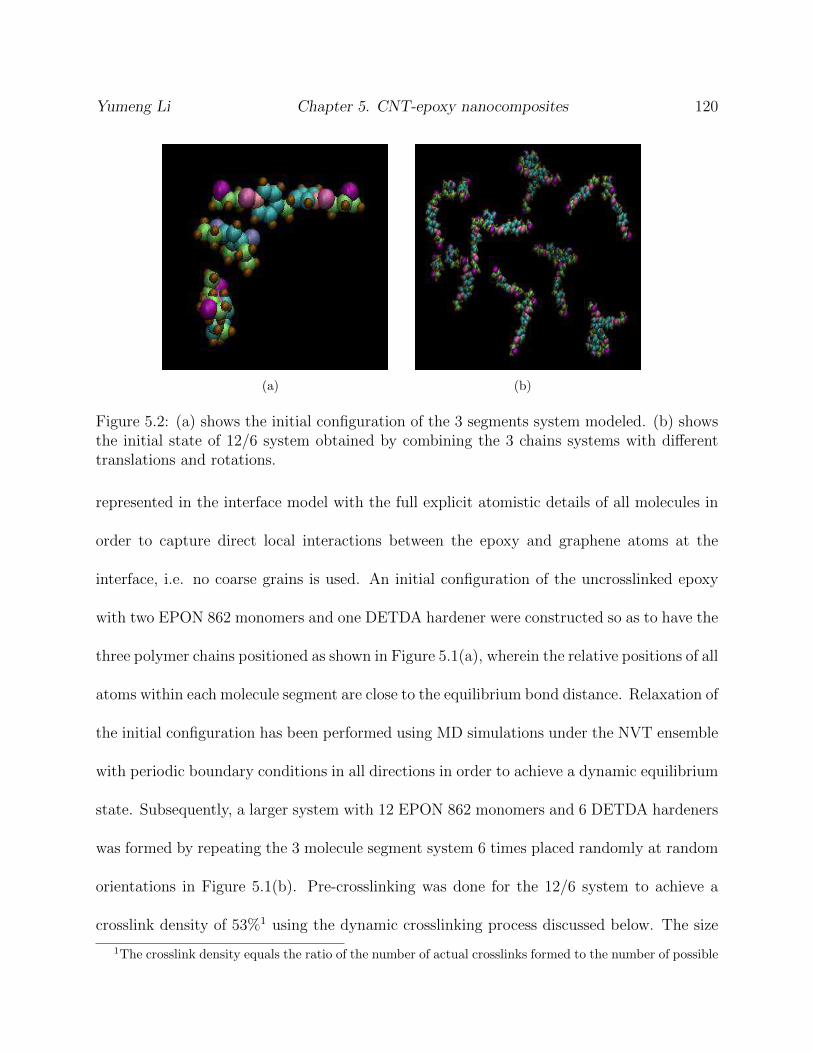
Yumeng Li Chapter 5. CNT-epoxy nanocomposites 120
(a) (b)
Figure 5.2: (a) shows the initial configuration of the 3 segments system modeled. (b) showsthe initial state of 12/6 system obtained by combining the 3 chains systems with differenttranslations and rotations.
represented in the interface model with the full explicit atomistic details of all molecules in
order to capture direct local interactions between the epoxy and graphene atoms at the
interface, i.e. no coarse grains is used. An initial configuration of the uncrosslinked epoxy
with two EPON 862 monomers and one DETDA hardener were constructed so as to have the
three polymer chains positioned as shown in Figure 5.1(a), wherein the relative positions of all
atoms within each molecule segment are close to the equilibrium bond distance. Relaxation of
the initial configuration has been performed using MD simulations under the NVT ensemble
with periodic boundary conditions in all directions in order to achieve a dynamic equilibrium
state. Subsequently, a larger system with 12 EPON 862 monomers and 6 DETDA hardeners
was formed by repeating the 3 molecule segment system 6 times placed randomly at random
orientations in Figure 5.1(b). Pre-crosslinking was done for the 12/6 system to achieve a
crosslink density of 53%1 using the dynamic crosslinking process discussed below. The size
1The crosslink density equals the ratio of the number of actual crosslinks formed to the number of possible
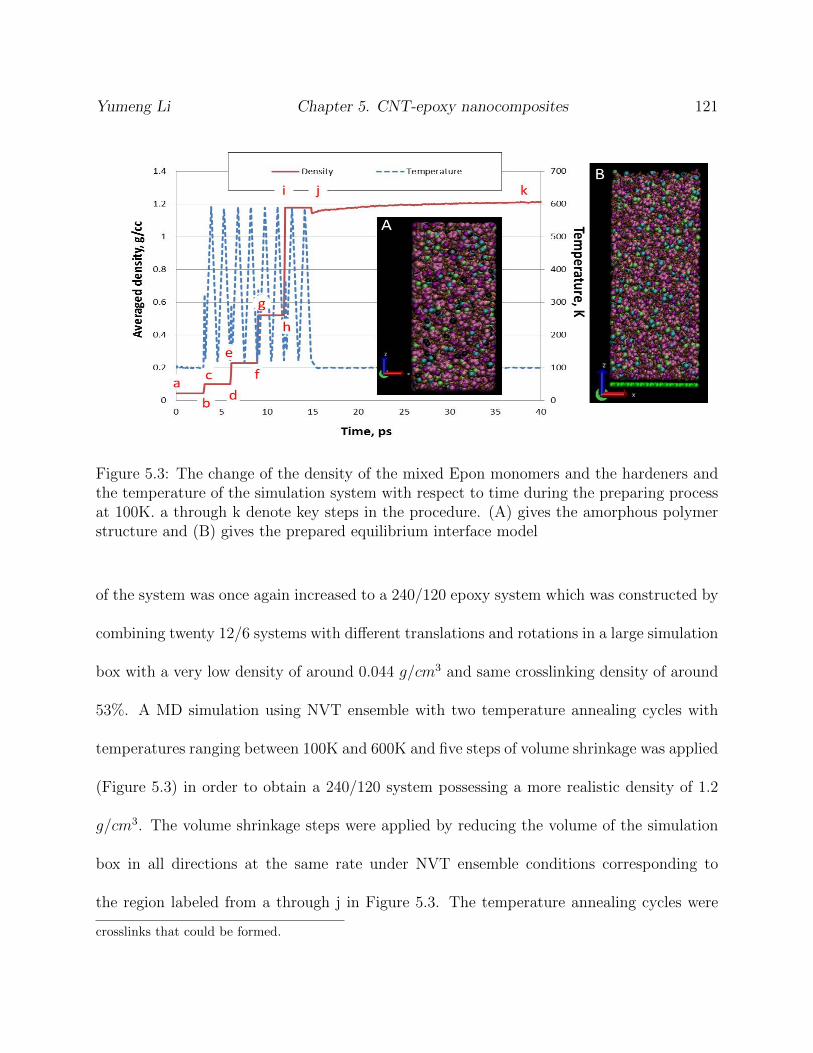
Yumeng Li Chapter 5. CNT-epoxy nanocomposites 121
Figure 5.3: The change of the density of the mixed Epon monomers and the hardeners andthe temperature of the simulation system with respect to time during the preparing processat 100K. a through k denote key steps in the procedure. (A) gives the amorphous polymerstructure and (B) gives the prepared equilibrium interface model
of the system was once again increased to a 240/120 epoxy system which was constructed by
combining twenty 12/6 systems with different translations and rotations in a large simulation
box with a very low density of around 0.044 g/cm3 and same crosslinking density of around
53%. A MD simulation using NVT ensemble with two temperature annealing cycles with
temperatures ranging between 100K and 600K and five steps of volume shrinkage was applied
(Figure 5.3) in order to obtain a 240/120 system possessing a more realistic density of 1.2
g/cm3. The volume shrinkage steps were applied by reducing the volume of the simulation
box in all directions at the same rate under NVT ensemble conditions corresponding to
the region labeled from a through j in Figure 5.3. The temperature annealing cycles were
crosslinks that could be formed.
Yumeng Li Chapter 5. CNT-epoxy nanocomposites 122
conducted between two volume shrinkage steps to relax the stresses in the polymer system
resulting from the volume shrinkage by fixing the volume of the simulation box and using
a Nose-Hoover thermostat to control and change the temperature in the simulation system.
Subsequent to point j, the simulation box was switched from the NVT ensemble conditions
to NPT at 1 atm of pressure at the desired temperature allowing the relaxation of the
simulation system in approaching a steady state density at point k. During the whole
process, periodic boundary conditions are applied in all directions of the simulation box.The
interactions between atoms inside the simulation system are simulated by using unmodified
OPLS potential, i.e. without bond breaking. All MD simulations were performed using
LAMMPS.
In the present work, a flat graphene sheet is used to study the interfacial load transfer as it has
been observed to have similar local morphology as CNTs and to yield comparatively similar
force-separation response as CNTs with reasonably large radii [76, 47]. Such a representation
has advantages in computation efficiency than the more straight-forward models including
individual CNTs or a subset of the bundle along with the locally enveloping polymer applied
in other references (see for example [50]) in that characteristic normal and sliding separation
modes associated with the local interface can be simulated with fewer atoms.
An interface model for the CNT-Epoxy nanocomposite was constructed by introducing the
flat graphene sheet to the Epoxy polymer structure oriented in x-y plane at z=0 with some
prescribed distance prior to minimization. With periodic boundary conditions in the x-
and y-directions and non-periodic conditions in the z-directions, energy minimization at 0K
Yumeng Li Chapter 5. CNT-epoxy nanocomposites 123
and following dynamic equilibration with the NVT ensemble at the required temperature
was accomplished to allow for the perfect wetting of the polymer to the graphene sheet
and thereby establish the equilibrium distance between the graphene and the epoxy in the
graphene-epoxy interface model. By performing the dynamic equilibration for a sufficient
amount of time, an equilibrium graphene-epoxy representative interface element was obtained
as shown in Figure 5.3(B). The representative interface elements with the epoxy polymer
crosslinked at different levels are prepared to conduct normal opening mode and sliding mode
separation simulations using the dynamic crosslinking algorithm described below.
5.4 Dynamic Crosslinking Process
In order to capture the complex interactions within the epoxy network and to study the in-
fluence of crosslink density on the interfacial load transfer, a dynamic crosslinking procedure
was developed which allowed for the degree of crosslinking to be specified.
The reactive pairs in EPON 862 monomers and DETDA hardeners, i.e. the epoxide ends
and amines, are highlighted in Figure 5.4. Crosslinks were formed statically based on the
distance between the C atoms in epoxide ends of the EPON 862 molecules and N atoms in the
amines of the DETDA hardeners either in the 12/6 systems having mixed EPON monomers
and DETDA hardeners (establishing the baseline of 53% crosslinked) or in the equilibrated
structure of the representative interface element (allowing for crosslinking densities greater
than 53%). An active N atom in the amine could form a crosslink with the active C in
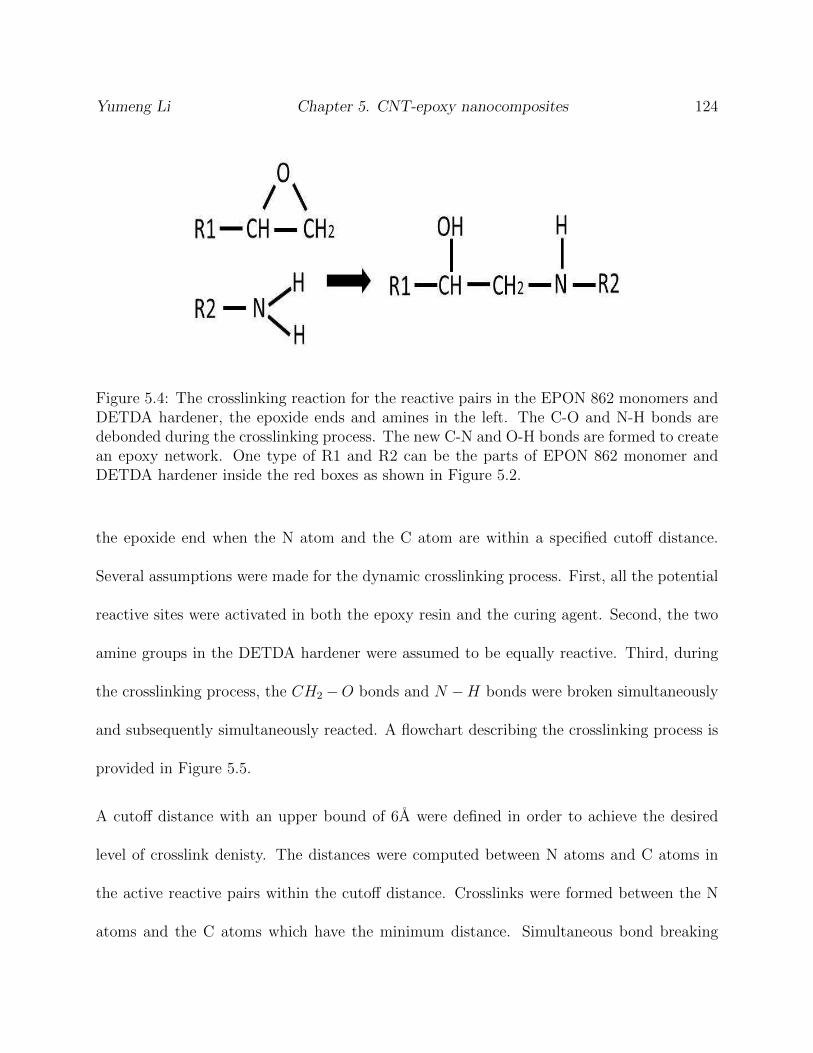
Yumeng Li Chapter 5. CNT-epoxy nanocomposites 124
Figure 5.4: The crosslinking reaction for the reactive pairs in the EPON 862 monomers andDETDA hardener, the epoxide ends and amines in the left. The C-O and N-H bonds aredebonded during the crosslinking process. The new C-N and O-H bonds are formed to createan epoxy network. One type of R1 and R2 can be the parts of EPON 862 monomer andDETDA hardener inside the red boxes as shown in Figure 5.2.
the epoxide end when the N atom and the C atom are within a specified cutoff distance.
Several assumptions were made for the dynamic crosslinking process. First, all the potential
reactive sites were activated in both the epoxy resin and the curing agent. Second, the two
amine groups in the DETDA hardener were assumed to be equally reactive. Third, during
the crosslinking process, the CH2 −O bonds and N −H bonds were broken simultaneously
and subsequently simultaneously reacted. A flowchart describing the crosslinking process is
provided in Figure 5.5.
A cutoff distance with an upper bound of 6A were defined in order to achieve the desired
level of crosslink denisty. The distances were computed between N atoms and C atoms in
the active reactive pairs within the cutoff distance. Crosslinks were formed between the N
atoms and the C atoms which have the minimum distance. Simultaneous bond breaking

Yumeng Li Chapter 5. CNT-epoxy nanocomposites 125
Table 5.2: The stiffness and the equilibrium bond lengthes of the newly formed C-N bondsand O-H bonds in each step of the multiple-step relaxation.
Step Stiffness of the bonds Equilibrium bond lengthC-N bond O-H bond C-N bond O-H bond
step 1 169 276 4 4step 2 260 400 3 3step 3 303 500 2 2step 4 337 553 1.34 0.96
in the corresponding N − H bonds and CH2 − O bonds were enacted which would result
in the H+ ions and O− atoms. Then the H+ ions are reacted with the O− atoms 2 in
the broken epoxide ends restoring the neutrality of the EPON 862-DETDA system. At the
moment while breaking and forming bonds, all of the atoms in the simulation system were
held stationary before the being re-equilibrated with the new crosslinked topology. It is
noted that in forming the crosslinked covalent bonds, that the associated angle and dihedral
multi-atom interactions were also deleted.
If there were crosslinks formed, multiple relaxation steps were applied in order to prevent
instability of the system with the new topology as the new bonds may be formed at distances
much greater than that of equilibrium [81]. The multiple relaxation steps were used in order
to prevent suddenly spatial changes in the vicinity near the newly formed bonds in the new
topology by gradually increasing the stiffness of the new bonds and gradually decreasing the
bond length of the new bonds to their actual values in a series of steps as indicated in Table
5.2. After the interface system with the new topology achieved equilibrium, the associated
2The ions are not actually simulated here as no electrostatic potential is included to account for theCoulombic interactions between charged atoms.
Yumeng Li Chapter 5. CNT-epoxy nanocomposites 126
new angles and dihedrals were created for the newly formed bonds.
Whether or not new crosslinks are formed, a MD simulation under the NVT ensemble at
the specified temperature was conducted to further relax the system as well as to dissipate
the unreacted reactive species, thereby preparing the system for the next crosslinking step.
Temperature annealing cycles were applied in order to put energy into the simulation system
by raising the temperature well above the transition temperature (144◦ ) thereby aiding in
the diffusion induced dispersion of the crosslinking entities before returning the temperature
back to the required temperature.
After the equilibration of the newly crosslinked system, if the required crosslinking density
is reached, the algorithm is stopped and the topology information of the new structure is
output; else the algorithm returns to the crosslinking step and proceeds with additional inner
loops as indicated in Figure 5.5.
5.5 Functionalization
It is noted that large improvements in the load transfer ability of a functionalized CNT-
polymer interface have been observed in MD studies of CNT-PE nanocomposites study [76].
However, as the amorphous thermoplastic PE did not contain crosslinks and therefore did
not form a network structure, the efficiency of the functionalization depends on the entan-
glements of the functionalized polymer chains. Functionalized polymer chains which were
sufficiently entangled with the bulk polymer would indeed provide additional load trans-
Yumeng Li Chapter 5. CNT-epoxy nanocomposites 127
fer (interface strength and toughness) until either a bond broke or the chains disentangled.
However, those functionalized polymer chains which were not sufficiently entangled sim-
ply disentangled and provided little to no improvement of the interface. In contrast, as a
crosslinked thermoset polymer, epoxy forms a dense covalently bonded network structure.
As such, functionalization of the CNT surface so as to covalently bond to any segment of the
network structure is expected to consistently improve interfacial load transfer until loads be-
come sufficiently large enough to break covalent bonds in the functional group or surrounding
network structure.
For CNT-reinforced epoxy nanocomposites, directly grafting amino groups to the nanotube
surfaces has been observed to be an efficient approach to improve the interfacial bonding
of CNTs to the polymer matrix [30, 82]. By using the scheme depicted in Figure 1 in
reference [82], the DETDA molecule is able to be grafted to the surface of the outer wall of
CNTs thereby serving as the functional groups. Because a graphene sheet is utilized herein
to represent CNTs in our representative interface element, DETDA molecules as functional
groups were covalently attached to the surface of the graphene sheet by carbon-carbon bonds
as shown in Figure 5.6. In the functionalized graphene sheet, there is one amine group
(labeled by the boxes in Figure 5.6) left in each functional group which can participate in
the crosslinking process of the EPON 862/DETDA epoxy polymer to form covalent bonds
between the graphene sheet and the polymer matrix network. As the main interest here is
the final configuration of the functionalized CNTs, the specific details about the process of
the amino-grafting functionalization are not discussed or modeled here.
Yumeng Li Chapter 5. CNT-epoxy nanocomposites 128
A functionalized graphene-epoxy representative interface element is constructed by introduc-
ing the functionalized graphene sheet to the 240/120 epoxy system with 53% crosslinking
density. The dynamic crosslinking process described in the previous section was performed
to obtain the functionalized graphene-epoxy representative interface element with higher
crosslinking density, e.g. 83% crosslinked. First, only the amine ends in the functional
groups and the epoxy ends in the polymer matrix were allowed to form crosslinks. Sub-
sequently, crosslinking within the epoxy polymer matrix was performed in order to obtain
different realizations of the funcitionalized graphene-epoxy representative interface element
with various crosslinking densities higher than 53%.
5.6 Characterizing Load Transfer in the Nanoscale Rep-
resentative Interface Element
Load transfer of both the nonfunctionalized and functionalized representative interface ele-
ments with varying crosslink densities was characterized by conducting normal opening and
sliding mode separation studies at 100K and 300K using MD simulations.
5.6.1 Normal Opening Mode Separation
In order to conduct normal mode load transfer studies on the representative interface element,
a region of the polymer at the top of the representative interface has been frozen, i.e. is
Yumeng Li Chapter 5. CNT-epoxy nanocomposites 129
fully constrained to simulate a grip as shown in figure 5.7(a), while the graphene sheet was
displaced in the z- direction through a uniform application of a velocity of 2.5 m/s. Periodic
boundary conditions were applied in the x- and y-directions such that the interface can be
effectively taken to be repeated (i.e. infinite) in the x- and y-directions as shown in figure
5.7(b). Throughout the simulation, which was continued until full separation was achieved,
the temperature was fixed at the certain temperature under NVT ensemble conditions. The
force on each of carbon atoms in the graphene sheet (576 carbon atoms) over 4 ps is averaged
and combined with the displacement of the graphene sheet to obtain the force-separation
response.
In Figure 5.8(a), typical force-separation responses are depicted for the normal mode sep-
aration of the non-functionalized interface models with crosslink densities of 53% and 86%
at 100K. The normal mode force-separation responses for the functionalized interface model
are discussed in the following section separately. It is observed that there are three regions
in a typical normal mode force-separation response for the non-functionalized interface. The
first region has a sharp initial loading corresponding to the increasing of the force in a nearly
linear fashion with the separation of the graphene sheet from the gripped polymer matrix
which is believed to be associated with the stretching of the epoxy polymer network. The
second is an unloading region after reaching the peak force, which corresponds to a gradual
decreasing of the force on the graphene sheet with further increase in displacement of the
graphene sheet. The unloading region is a much slower process with respect to the loading
region and is believed to correspond to failure initiating in the matrix. The third region is
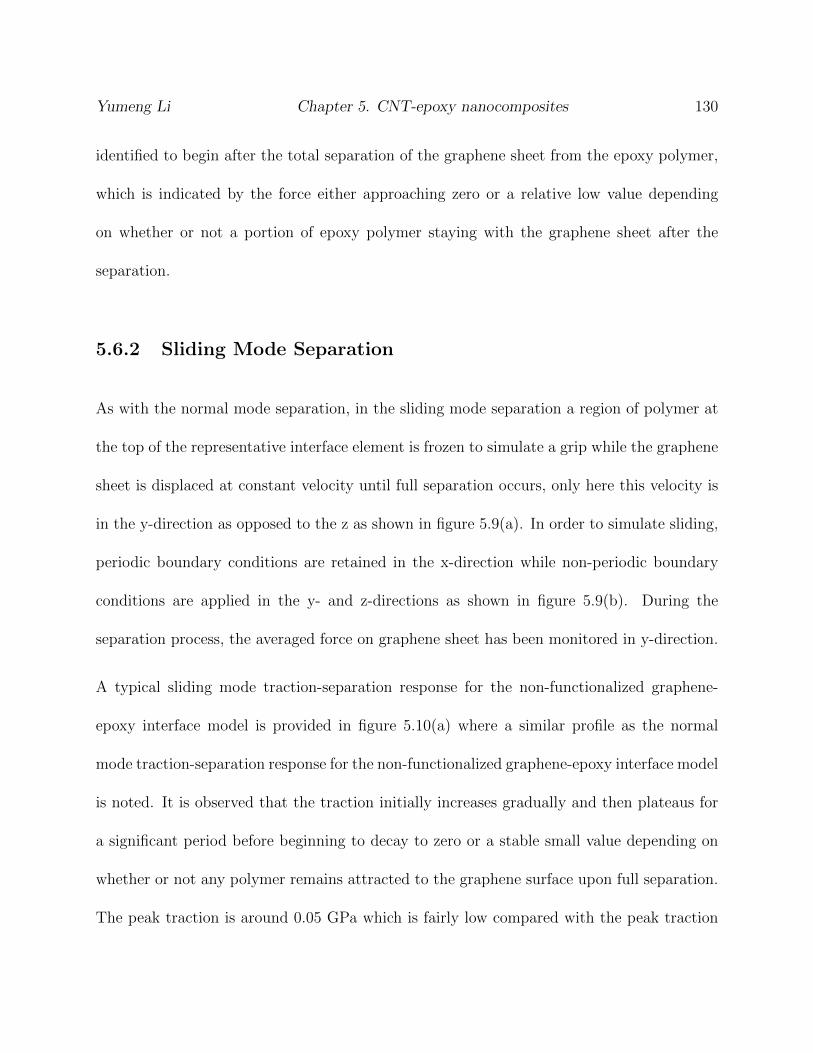
Yumeng Li Chapter 5. CNT-epoxy nanocomposites 130
identified to begin after the total separation of the graphene sheet from the epoxy polymer,
which is indicated by the force either approaching zero or a relative low value depending
on whether or not a portion of epoxy polymer staying with the graphene sheet after the
separation.
5.6.2 Sliding Mode Separation
As with the normal mode separation, in the sliding mode separation a region of polymer at
the top of the representative interface element is frozen to simulate a grip while the graphene
sheet is displaced at constant velocity until full separation occurs, only here this velocity is
in the y-direction as opposed to the z as shown in figure 5.9(a). In order to simulate sliding,
periodic boundary conditions are retained in the x-direction while non-periodic boundary
conditions are applied in the y- and z-directions as shown in figure 5.9(b). During the
separation process, the averaged force on graphene sheet has been monitored in y-direction.
A typical sliding mode traction-separation response for the non-functionalized graphene-
epoxy interface model is provided in figure 5.10(a) where a similar profile as the normal
mode traction-separation response for the non-functionalized graphene-epoxy interface model
is noted. It is observed that the traction initially increases gradually and then plateaus for
a significant period before beginning to decay to zero or a stable small value depending on
whether or not any polymer remains attracted to the graphene surface upon full separation.
The peak traction is around 0.05 GPa which is fairly low compared with the peak traction
Yumeng Li Chapter 5. CNT-epoxy nanocomposites 131
of normal separation. Three snapshots of sliding mode separation are shown in the Figure
5.10(b) and correspond to the points labeled a),b) and c) in the traction-separation response.
The low force-separation response in sliding mode separation is critical to the overall load
transfer of the interface between CNTs of high aspect ratio and the polymer matrix in a
nanocomposites because much of the load expected to be experienced by the CNT will be
associated with shear load transfer.
5.7 Parametric Study on the Crosslink Density
To study the influence of the crosslink density on the performance of the interface, normal
mode separations were simulated for the non-functionalized epoxy-graphene representative
interface elements with equilibrium non-functionalized representative interface elements hav-
ing the crosslink densities of 53% and 86% prepared using the dynamic crosslinking process
introduced above. To insure there are no biases resulting from the dynamic crosslinking
process, the mass densities of the crosslinked epoxy polymer with various crosslink den-
sities in the non-functionalized interface element were calculated along the z-axis. The
non-functionalized representative interface elements were divided into slices of a specified
thickness of approximately 0.2A along the z-axis. The density was calculated for each slice
by summing up per-atom masses and then averaged over the volume of the slice yielding
the distribution of the molecules in the crosslinked epoxy away from the graphene surface
oriented in the x-y plane. The traditional mass density is a parameter on the continuum level
Yumeng Li Chapter 5. CNT-epoxy nanocomposites 132
and is considered to be nearly constant over the spatial domain of the studied volume. As we
are studying the properties of atomistic models, the local density is strongly sensitive to and
reflecting the spatial distribution of the molecules in the simulation system, while the overall
global density (i.e. averaged over the total simulation space) remains comparable to the
bulk mass density. Figure 5.11 shows the local mass density profile of the non-functionalized
representative interface elements with various crosslink densities along the z direction. As
the graphene sheet was oriented in the x-y plane at z=0, a peak density is found at z=0
corresponding to the presence of the graphene sheet. Then a trough with a width around
2.5-3.0 A is observed which is believed to be associated with the equilibrium distance be-
tween the graphene sheet and the epoxy polymer as set by the vdW interactions at the given
temperature and is reflective of the interface. Immediately following the trough, the local
mass density of the epoxy polymer in the vicinity of the graphene sheet is different from
the bulk mass density. This difference in the local polymer morphology near the graphene
interface can be viewed as an interphase region, where local mechanical properties may also
differ from those of the bulk. It is noted that the peak mass density of the epoxy polymer
above the bulk density is followed by a trough below the bulk density before the mass density
approaches the bulk density and fluctuates around it. Similar increase and decrease in local
mass density before obtaining the bulk mass density was likewise observed in [50]. In the
present work, the thickness over which the local polymer density differs significantly from
the bulk mass density of the polymer is around 7-8 A away from the graphene sheet before
approaching the mass density in bulk, which suggests the effective surface polymer thickness
Yumeng Li Chapter 5. CNT-epoxy nanocomposites 133
of the interphase region. It is further noted that with increasing crosslink density, there is
no discernible change observed for the magnitude of the peak and the trough in the profile
of the mass density of the epoxy matrix in the vicinity of the graphene sheet. This implies
that the crosslink density does not have a big influence on the distribution of the epoxy
polymer molecules surrounding the graphene sheet, and therefore any difference observed in
load transfer as a function of crosslink density are associated with the load distribution in
the extended polymer network.
In addition to looking at the local mass distribution in the representative interface, the
distribution of crosslinks within the epoxy was observed. The number of C − N bonds
formed within 3A thick slices in the z-direction were obtained and plotted versus the distance
from the graphene sheet in Figure 5.12. It is noted that for both crosslinking densities
considered here that the distribution of crosslinks appears uniform relative to the graphene
sheet, indicating that the presence of the graphene sheet did not have significant influence
on the long range crosslinking within the epoxy network.
Figure 5.13 gives the normal mode traction-separation responses for the nonfunctionalized
graphene-PE and graphene-epoxy interface models at 100K. As the graphene sheets used in
the representative interface elements have different dimensions for different material systems,
the traction on the graphene sheet was calculated by averaging the force over the area of
the graphene sheet for comparison purposes. For the graphene-PE interfacial system, the
traction-separation responses are given for two cases with different length of polymer chains
in the amorphous polymer matrix. Both of the cases have 10 polymer chains but one has 78
Yumeng Li Chapter 5. CNT-epoxy nanocomposites 134
monomers per chain (10c80c case) and the other has 298 monomers per chains (10c300c case).
In comparing the two polymer systems, it is noted that similar behavior is observed in the
normal mode traction-separation responses of the graphene-PE and graphene-epoxy interface
models. For example, both include an initial sharp loading region followed by a relative slow
unloading region after the peak traction. However, the graphene-epoxy interface models
with various crosslinking densities demonstrate only slightly higher peak traction (0.43 vs
0.3 GPa). In addition, it is observed that the displacement of the graphene sheet at the peak
traction and the final separation distance for the graphene-epoxy interface model is around
4.5A and 50A on average, respectively, which is closer to those for the 10c300c case ( 4.3A
and 48A) than those for the 10c80c case ( 2.4A and 80A). As was observed via tortuosity
measurements in [76], the longer chains of the 10c300c case has a greater potential for forming
strong entanglements than the 10c80c case. As the crosslinks between the Epon monomers
and the hardeners are analogous (though more frequent) to the entanglements between the
PE chains hindering the movements of the polymer molecules during the separation, it
is believed that more entanglements, and therefore by analogy more of crosslink network,
becomes engaged in transferring the load to the interface, resulting in the increase in peak
force before separating from the interface in more of a block network and thereby leading to
a narrow force-separation response.
The observations of the similarity between the epoxy and entangled PE extend to understand-
ing the slight differences between the epoxies of different crosslink densities. For example, as
in Figure 5.13, the peak traction in the normal mode separation is observed to be higher for
Yumeng Li Chapter 5. CNT-epoxy nanocomposites 135
the graphene-epoxy interface models with a higher crosslink density than that with a lower
crosslink densities. The crosslinks between the Epon monomers and the hardeners create
a more connected network of epoxy polymer wherein the polymer molecules interact with
each other by strong covalent bonding forces in addition to the weaker vdW forces. The
non-functionalized graphene-epoxy interface model with higher crosslink density has less
polymer molecules moving freely and therefore more fixed in the network. As such, there
are more portions of the network which remain within van der Waals interaction range and
better distribute that load through the network such that increasing crosslink density leads
to higher peak traction in the normal mode separation and increased averaged separation
energy. This demonstrates that increasing the crosslink density of the epoxy polymer matrix,
a better load transfer ability of the graphene-epoxy interface can be obtained.
5.8 Influence of Temperature Effects on the Non-functionalized
Interface
In addition to the 100K results presented in Figure 5.8(a), opening mode separation simula-
tions have been conducted at 300K in order to investigate the influence of temperature on
the force-separation response for the non-functionalized CNT-epoxy interface. The opening
mode force vs displacement curves at 100K and 300K for cases with different crosslink densi-
ties are provided in Figure 5.14. The 100K and 300K force-separation responses show similar
trends, beginning with a rapid increase to peak force (peaking at 4-13 angstroms of displace-
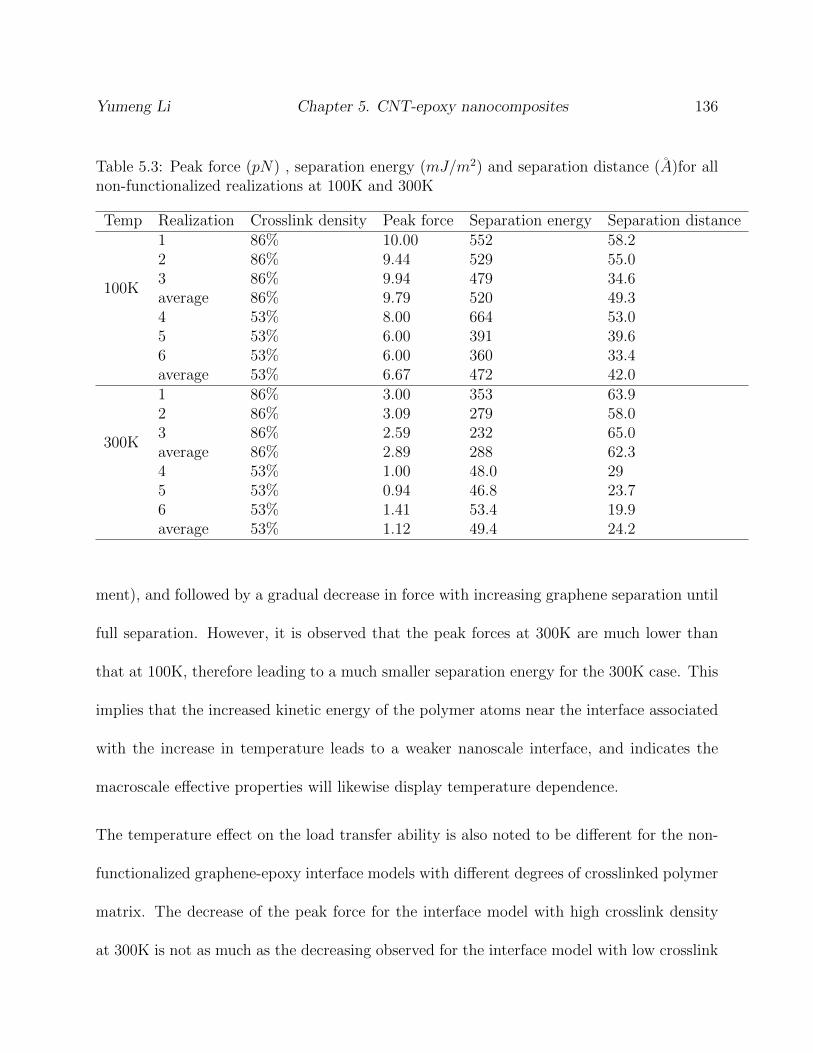
Yumeng Li Chapter 5. CNT-epoxy nanocomposites 136
Table 5.3: Peak force (pN) , separation energy (mJ/m2) and separation distance (A)for allnon-functionalized realizations at 100K and 300K
Temp Realization Crosslink density Peak force Separation energy Separation distance
100K
1 86% 10.00 552 58.22 86% 9.44 529 55.03 86% 9.94 479 34.6average 86% 9.79 520 49.34 53% 8.00 664 53.05 53% 6.00 391 39.66 53% 6.00 360 33.4average 53% 6.67 472 42.0
300K
1 86% 3.00 353 63.92 86% 3.09 279 58.03 86% 2.59 232 65.0average 86% 2.89 288 62.34 53% 1.00 48.0 295 53% 0.94 46.8 23.76 53% 1.41 53.4 19.9average 53% 1.12 49.4 24.2
ment), and followed by a gradual decrease in force with increasing graphene separation until
full separation. However, it is observed that the peak forces at 300K are much lower than
that at 100K, therefore leading to a much smaller separation energy for the 300K case. This
implies that the increased kinetic energy of the polymer atoms near the interface associated
with the increase in temperature leads to a weaker nanoscale interface, and indicates the
macroscale effective properties will likewise display temperature dependence.
The temperature effect on the load transfer ability is also noted to be different for the non-
functionalized graphene-epoxy interface models with different degrees of crosslinked polymer
matrix. The decrease of the peak force for the interface model with high crosslink density
at 300K is not as much as the decreasing observed for the interface model with low crosslink
Yumeng Li Chapter 5. CNT-epoxy nanocomposites 137
density, 69% decrease vs 90.9% decrease in peak force for 86% and 53% crosslink densities,
respectively. In addition, an increasing separation distance is also observed for the 86%
crosslinked case at 300K. This implies that the load transfer ability of the interface becomes
less sensitive to the temperature effects by increasing the crosslink density in the thermoset
polymer matrix(58% decreased separation energy for 86% crosslink density case vs 91.5%
decreasing for 53% crosslink density case).
5.9 The influence of functionalization of the interface
at varying temperature
As the OPLS potential does not generally include bond breaking, strain energy failure criteria
are defined for certain covalent bonds in the polymer matrix and the functional groups as
identified in Table 5.4 in order to enable bond breaking during the separation. The bond
energy Eib of the ith covalent bond is checked every certain number of time steps, e.g. 10000
in a simulation involving 0.1 femtosecond(fs) time steps. Once the bond energy for a given
covalent bond reaches the strain energy failure criterion, the bond is disconnected and the
associated angles and dihedral bonds are deleted.
Normal mode force-separation simulations have been conducted for the functionalized repre-
sentative interface elements with 2 functional groups at both 100K and 300K to investigate
the influence of functionalization on the load transfer ability of the interface at the different
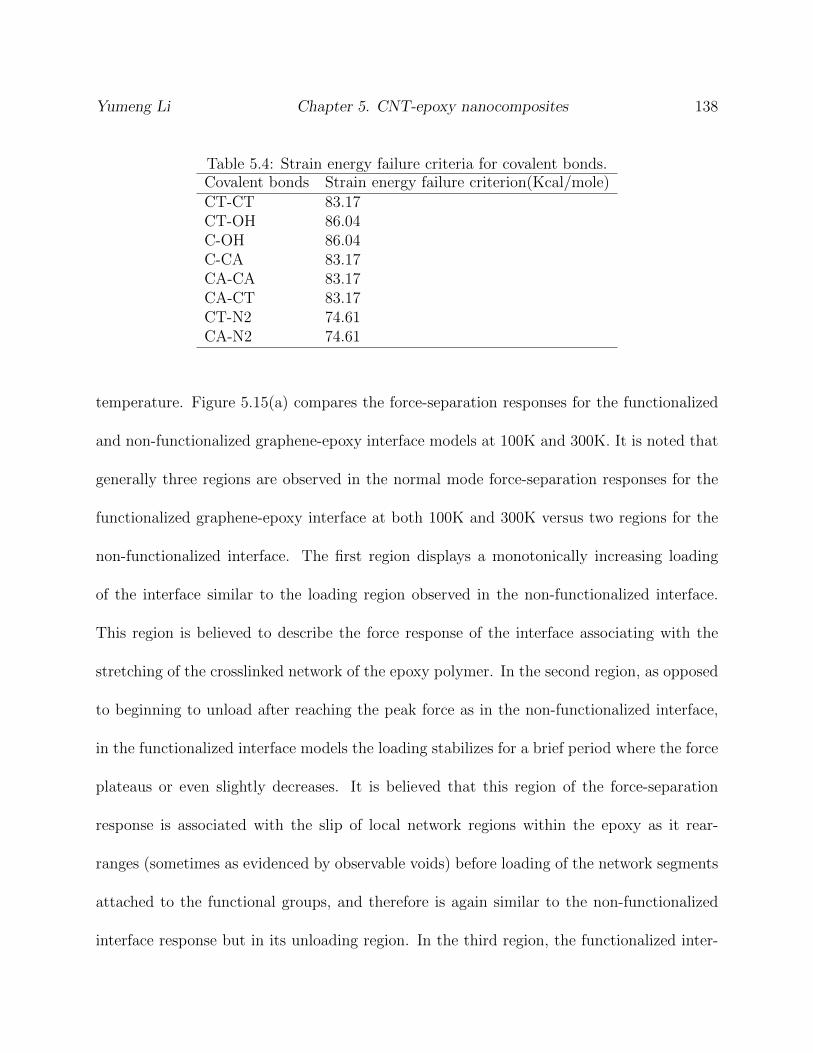
Yumeng Li Chapter 5. CNT-epoxy nanocomposites 138
Table 5.4: Strain energy failure criteria for covalent bonds.Covalent bonds Strain energy failure criterion(Kcal/mole)CT-CT 83.17CT-OH 86.04C-OH 86.04C-CA 83.17CA-CA 83.17CA-CT 83.17CT-N2 74.61CA-N2 74.61
temperature. Figure 5.15(a) compares the force-separation responses for the functionalized
and non-functionalized graphene-epoxy interface models at 100K and 300K. It is noted that
generally three regions are observed in the normal mode force-separation responses for the
functionalized graphene-epoxy interface at both 100K and 300K versus two regions for the
non-functionalized interface. The first region displays a monotonically increasing loading
of the interface similar to the loading region observed in the non-functionalized interface.
This region is believed to describe the force response of the interface associating with the
stretching of the crosslinked network of the epoxy polymer. In the second region, as opposed
to beginning to unload after reaching the peak force as in the non-functionalized interface,
in the functionalized interface models the loading stabilizes for a brief period where the force
plateaus or even slightly decreases. It is believed that this region of the force-separation
response is associated with the slip of local network regions within the epoxy as it rear-
ranges (sometimes as evidenced by observable voids) before loading of the network segments
attached to the functional groups, and therefore is again similar to the non-functionalized
interface response but in its unloading region. In the third region, the functionalized inter-
Yumeng Li Chapter 5. CNT-epoxy nanocomposites 139
face demonstrates the force-separation responses having saw tooth shapes with sharp and
steady increasing loading and subsequent dramatic drops while the non-functionalized in-
terface is observed to have the force gradually decrease and eventually go to zero implying
the degradation and final failure of the interface. Therefore, it is believed that region 3 in
the functionalized interface is attributed to the functional groups participating in the load
transfer as shown in the snapshots in Figure 5.15(c), and is characterized by the large peak
force with following sharp drops denoting the failure of the covalent bonds inside the epoxy
polymer or the functional groups. As the epoxy polymer has a crosslinked network, it is
noted that both functional groups grafted between the graphene sheet and the epoxy matrix
participate in the load transferring at the interface which corresponds to the two loading and
subsequent unloading segments in the third region of the force-separation responses. At both
100K and 300K, significant increasing has been observed for peak force(5.7 times at 100K
and 11.1 times at 300K), separation energy(21.6 times at 100K and 14.9 times at 300K) and
separation distance(1.5 times at 100K and 0.5 times at 300K) in the normal mode separa-
tion of the functionalized interface relative to the non-functionalized interface. This indicates
that theoretically the interface does become stronger by the functionalization treatment at
various temperature, which leads to improved load transfer ability at the interface.
In Figure 5.15(a), the effects of temperature effect have been observed on the response
of the functionalized interface in the normal mode separation. Region 1 mirrors the non-
functionalized interface behavior in the normal mode separation where the temperature
effect has been observed to result in a decrease in the peak force of region 1 with increase in
Yumeng Li Chapter 5. CNT-epoxy nanocomposites 140
temperature. In region 3, both peak force and separation distance demonstrates decreasing
with the increasing temperature for the functionalized interface and therefore the decreasing
total separation energy, which indicates the elevated temperature also reduces the strength
of the functionalized interface.
Comparison has been done of the load transfer abilities of the functionalized graphene-PE
interface and the functionalized graphene-epoxy interface both having 5 functional groups in
Figure 5.16 . The traction-separation relations show that the functionalized graphene-epoxy
interface demonstrates a higher peak traction (4.23 GPa), much longer separation distance
(179A) and therefore significantly increased separation energy (16600 mJ/m2) compared to
the functionalized graphene-PE interface (4.03 GPa, 40.8A and 7560mJ/m2). This is in stark
contrast to the comparison of the non-functionalized interface response of the two material
system, which demonstrated very similar normal mode force-separation responses. This
indicates that the load transfer ability of the graphene-epoxy interface can be improved more
efficiently through functionalization relative to the graphene-PE interface as we expected due
to the crosslinked network of epoxy polymer matrix.
Yumeng Li Chapter 5. CNT-epoxy nanocomposites 141
5.10 Macroscale effective elastic properties of CNT-
epoxy nanocomposites with non-functionalized in-
terface
It is observed that the force-separation responses of the graphene-epoxy interface at varying
temperature exhibits similar trends as those of the graphene-PE interface. As shown in Fig-
ure 5.17, the cohesive zone traction-displacement laws developed for the non-functionalized
graphene-epoxy interface have a bilinear form in the normal direction keeping the separation
energy obtained from MD simulations while in the sliding direction the cohesive zone law
rises to the peak traction and then stay at the peak value as the interface is assumed to stay
contact in the sliding separation.
Adopting the 2-D RVE as in Chapter II, the in-plane properties, i.e. the stiffness compo-
nents C22, of the transversely isotropic effective nanocomposites is calculated using finite
element analysis based on the volume averaged stresses and strains. The stress contour and
deformed configuration of the nanocomposites at a CNT vf of 0.1 are shown in Figure 5.18
corresponding to the C22 and C66 boundary conditions, respectively. It is observed that
the cohesive zones in the interface regions are experiencing different loading conditions, i.e
some are in the initial loading region and some have fully separated. Table 5.5 gives the
percentage reduction of C22 and C66 relative to their counterpart perfect bonding values at
100K and 300K for the CNT-epoxy nanocomposites at CNT vfs of 0.1 and 0.5. Effective C22
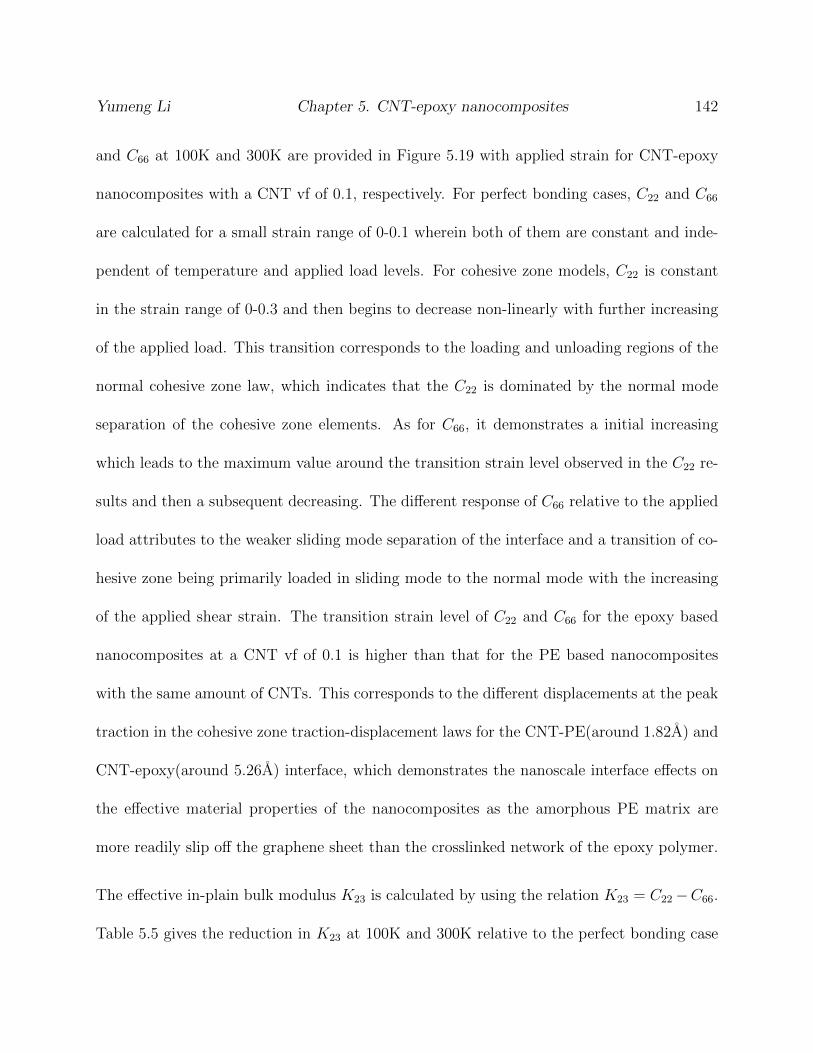
Yumeng Li Chapter 5. CNT-epoxy nanocomposites 142
and C66 at 100K and 300K are provided in Figure 5.19 with applied strain for CNT-epoxy
nanocomposites with a CNT vf of 0.1, respectively. For perfect bonding cases, C22 and C66
are calculated for a small strain range of 0-0.1 wherein both of them are constant and inde-
pendent of temperature and applied load levels. For cohesive zone models, C22 is constant
in the strain range of 0-0.3 and then begins to decrease non-linearly with further increasing
of the applied load. This transition corresponds to the loading and unloading regions of the
normal cohesive zone law, which indicates that the C22 is dominated by the normal mode
separation of the cohesive zone elements. As for C66, it demonstrates a initial increasing
which leads to the maximum value around the transition strain level observed in the C22 re-
sults and then a subsequent decreasing. The different response of C66 relative to the applied
load attributes to the weaker sliding mode separation of the interface and a transition of co-
hesive zone being primarily loaded in sliding mode to the normal mode with the increasing
of the applied shear strain. The transition strain level of C22 and C66 for the epoxy based
nanocomposites at a CNT vf of 0.1 is higher than that for the PE based nanocomposites
with the same amount of CNTs. This corresponds to the different displacements at the peak
traction in the cohesive zone traction-displacement laws for the CNT-PE(around 1.82A) and
CNT-epoxy(around 5.26A) interface, which demonstrates the nanoscale interface effects on
the effective material properties of the nanocomposites as the amorphous PE matrix are
more readily slip off the graphene sheet than the crosslinked network of the epoxy polymer.
The effective in-plain bulk modulus K23 is calculated by using the relation K23 = C22−C66.
Table 5.5 gives the reduction in K23 at 100K and 300K relative to the perfect bonding case
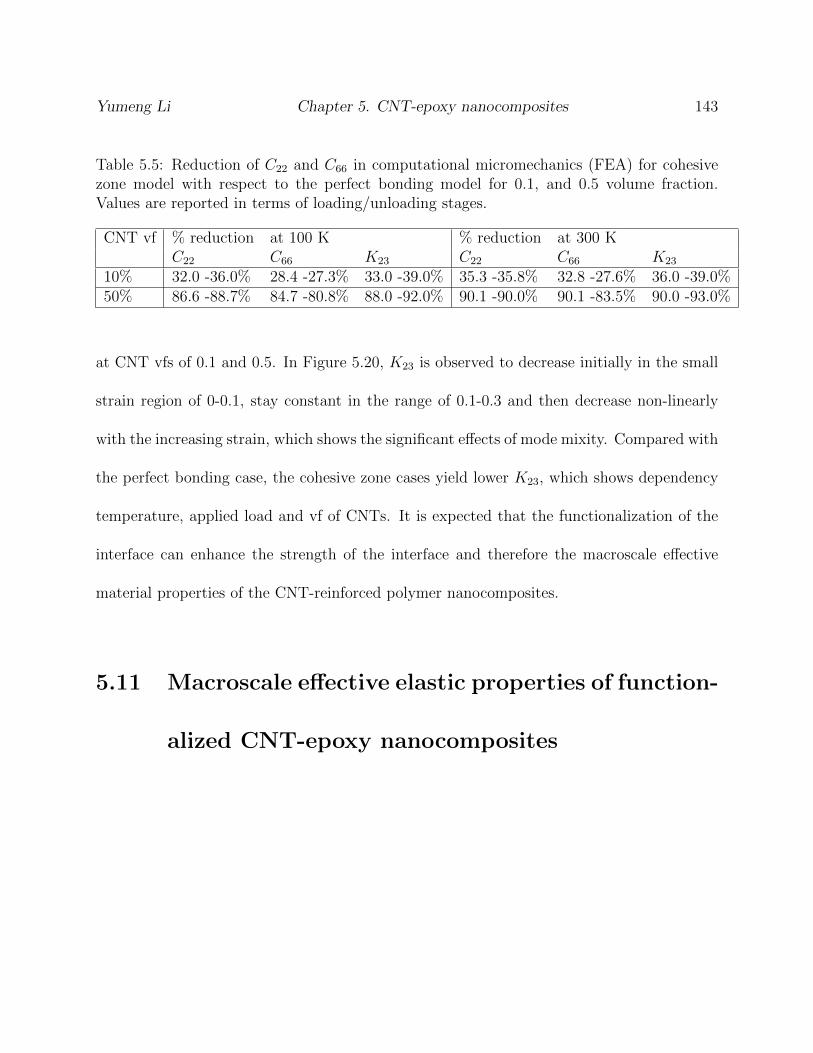
Yumeng Li Chapter 5. CNT-epoxy nanocomposites 143
Table 5.5: Reduction of C22 and C66 in computational micromechanics (FEA) for cohesivezone model with respect to the perfect bonding model for 0.1, and 0.5 volume fraction.Values are reported in terms of loading/unloading stages.
CNT vf % reduction at 100 K % reduction at 300 KC22 C66 K23 C22 C66 K23
10% 32.0 -36.0% 28.4 -27.3% 33.0 -39.0% 35.3 -35.8% 32.8 -27.6% 36.0 -39.0%50% 86.6 -88.7% 84.7 -80.8% 88.0 -92.0% 90.1 -90.0% 90.1 -83.5% 90.0 -93.0%
at CNT vfs of 0.1 and 0.5. In Figure 5.20, K23 is observed to decrease initially in the small
strain region of 0-0.1, stay constant in the range of 0.1-0.3 and then decrease non-linearly
with the increasing strain, which shows the significant effects of mode mixity. Compared with
the perfect bonding case, the cohesive zone cases yield lower K23, which shows dependency
temperature, applied load and vf of CNTs. It is expected that the functionalization of the
interface can enhance the strength of the interface and therefore the macroscale effective
material properties of the CNT-reinforced polymer nanocomposites.
5.11 Macroscale effective elastic properties of function-
alized CNT-epoxy nanocomposites
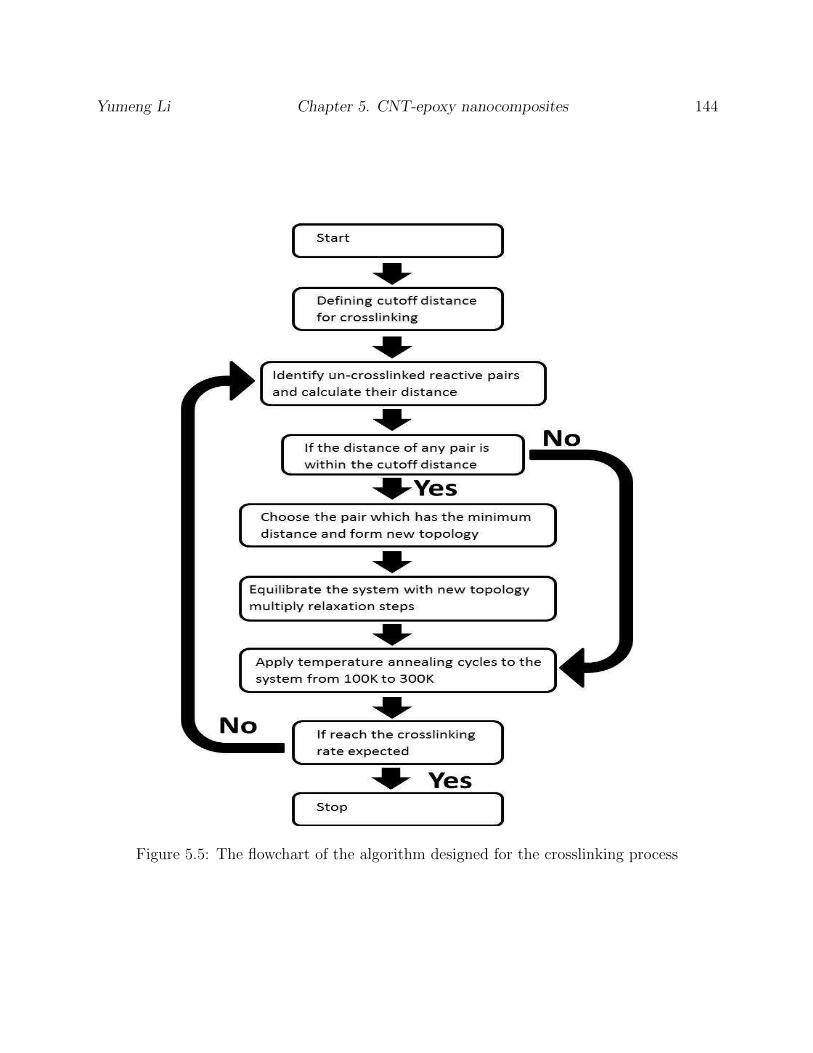
Yumeng Li Chapter 5. CNT-epoxy nanocomposites 144
Figure 5.5: The flowchart of the algorithm designed for the crosslinking process
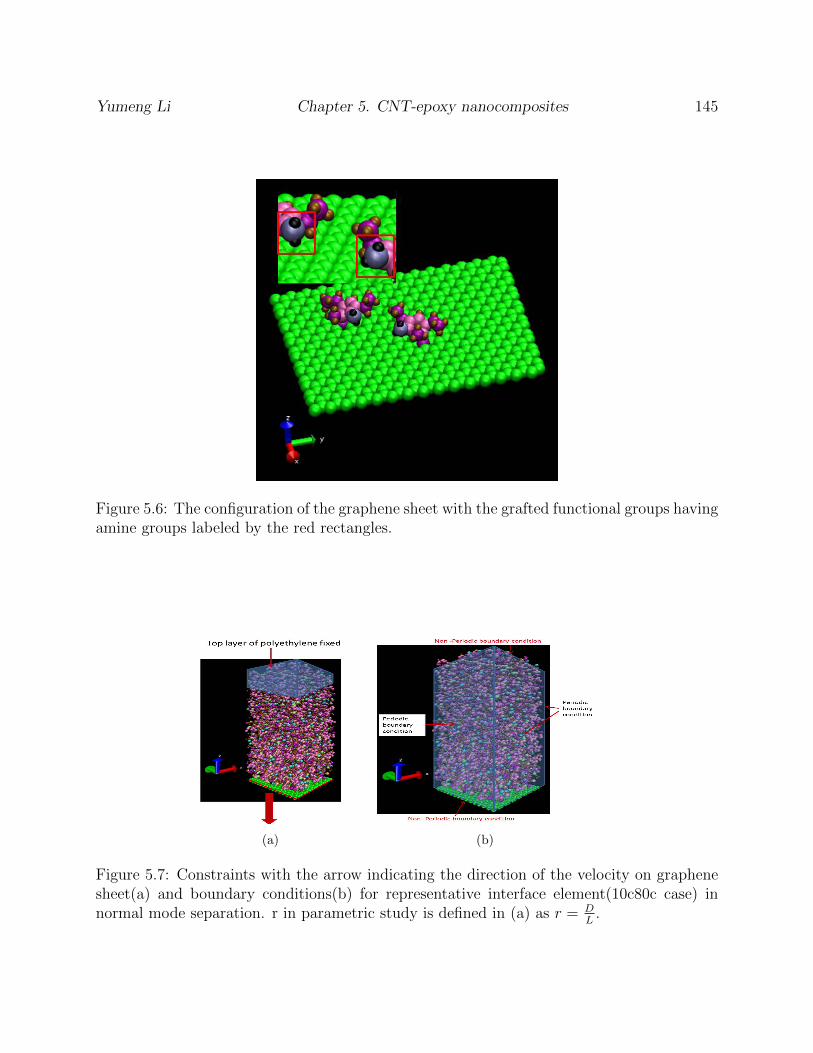
Yumeng Li Chapter 5. CNT-epoxy nanocomposites 145
Figure 5.6: The configuration of the graphene sheet with the grafted functional groups havingamine groups labeled by the red rectangles.
(a) (b)
Figure 5.7: Constraints with the arrow indicating the direction of the velocity on graphenesheet(a) and boundary conditions(b) for representative interface element(10c80c case) innormal mode separation. r in parametric study is defined in (a) as r = D
L.
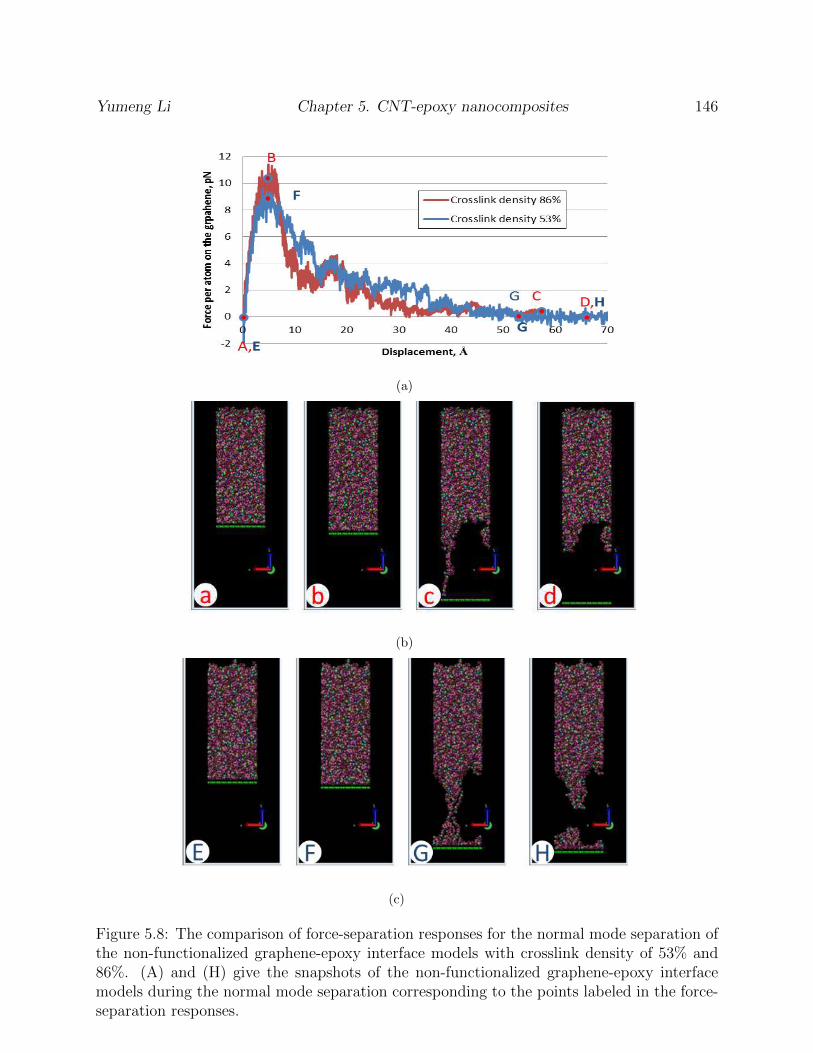
Yumeng Li Chapter 5. CNT-epoxy nanocomposites 146
(a)
(b)
(c)
Figure 5.8: The comparison of force-separation responses for the normal mode separation ofthe non-functionalized graphene-epoxy interface models with crosslink density of 53% and86%. (A) and (H) give the snapshots of the non-functionalized graphene-epoxy interfacemodels during the normal mode separation corresponding to the points labeled in the force-separation responses.
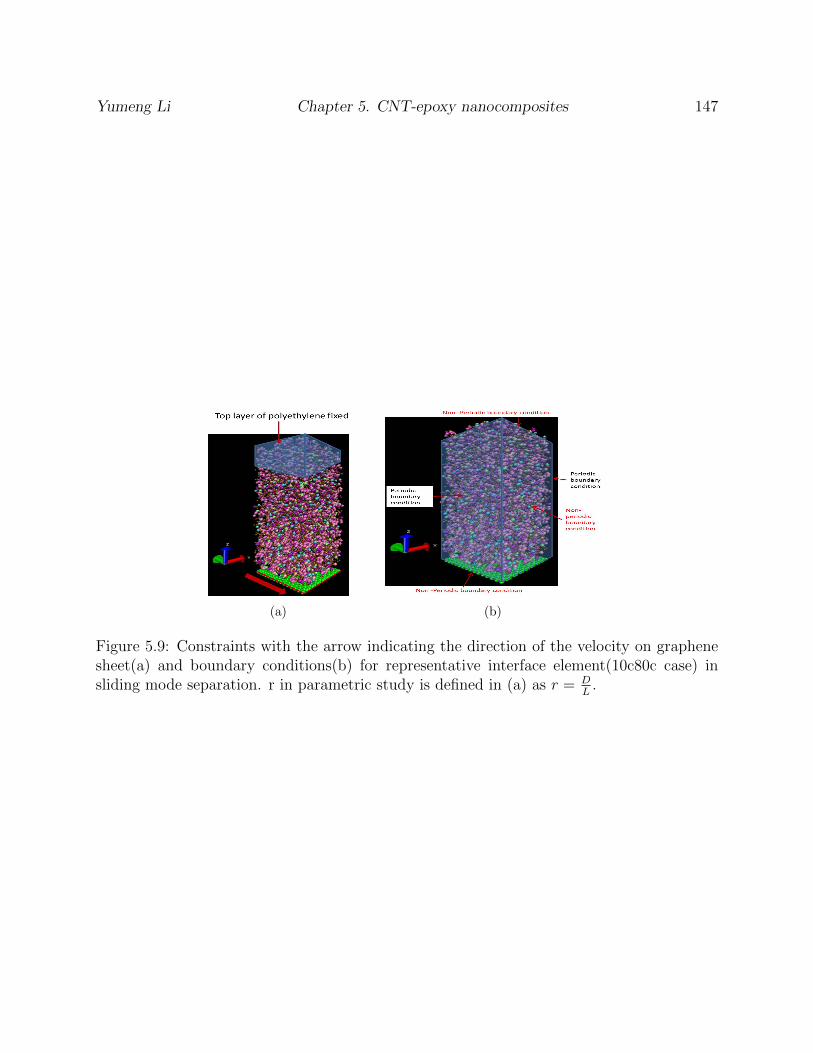
Yumeng Li Chapter 5. CNT-epoxy nanocomposites 147
(a) (b)
Figure 5.9: Constraints with the arrow indicating the direction of the velocity on graphenesheet(a) and boundary conditions(b) for representative interface element(10c80c case) insliding mode separation. r in parametric study is defined in (a) as r = D
L.
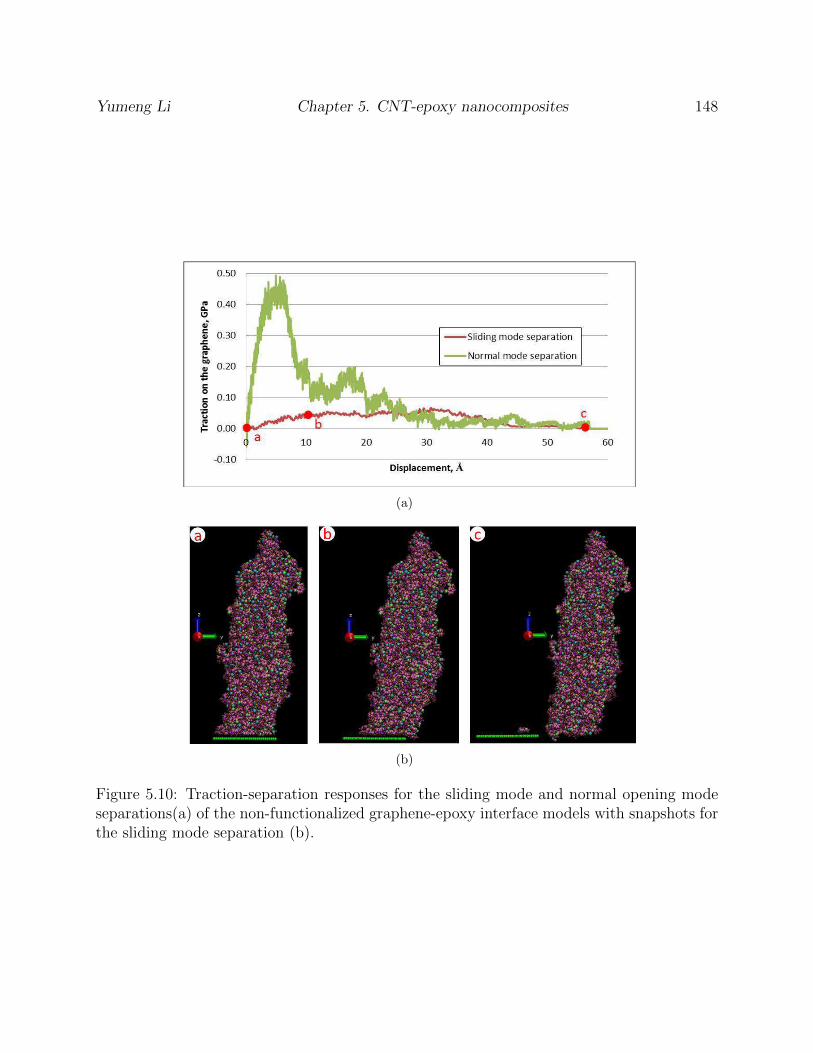
Yumeng Li Chapter 5. CNT-epoxy nanocomposites 148
(a)
(b)
Figure 5.10: Traction-separation responses for the sliding mode and normal opening modeseparations(a) of the non-functionalized graphene-epoxy interface models with snapshots forthe sliding mode separation (b).
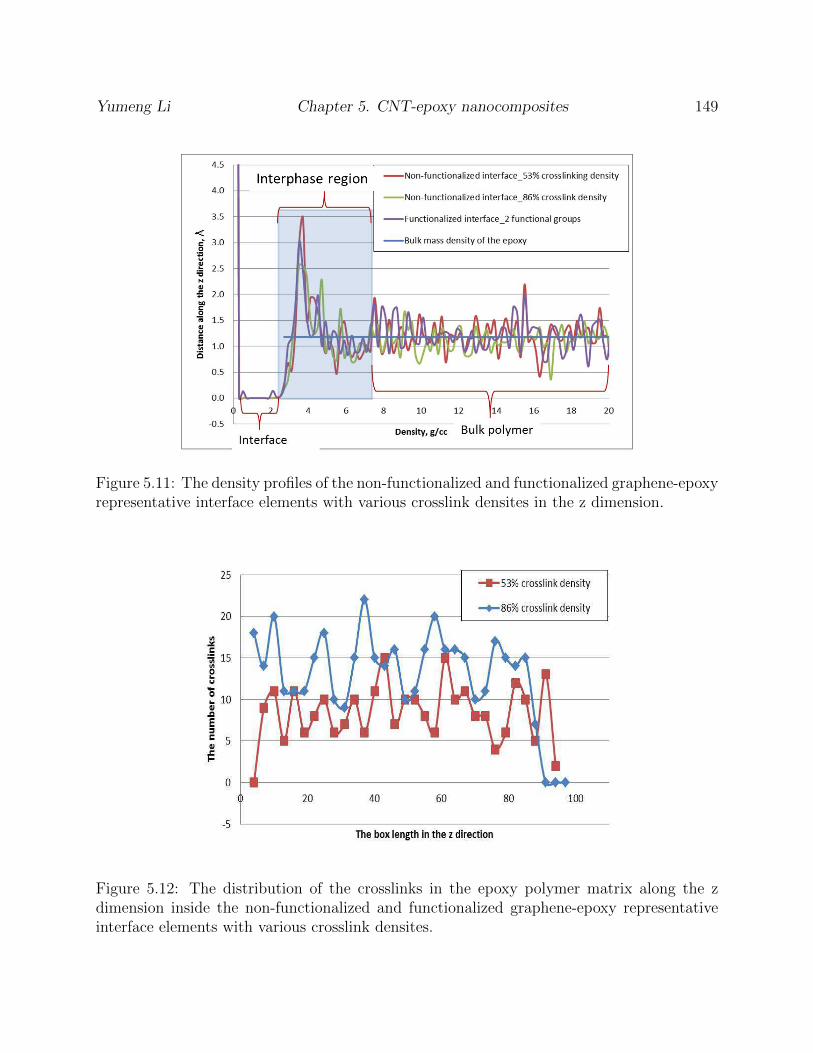
Yumeng Li Chapter 5. CNT-epoxy nanocomposites 149
Figure 5.11: The density profiles of the non-functionalized and functionalized graphene-epoxyrepresentative interface elements with various crosslink densites in the z dimension.
Figure 5.12: The distribution of the crosslinks in the epoxy polymer matrix along the zdimension inside the non-functionalized and functionalized graphene-epoxy representativeinterface elements with various crosslink densites.
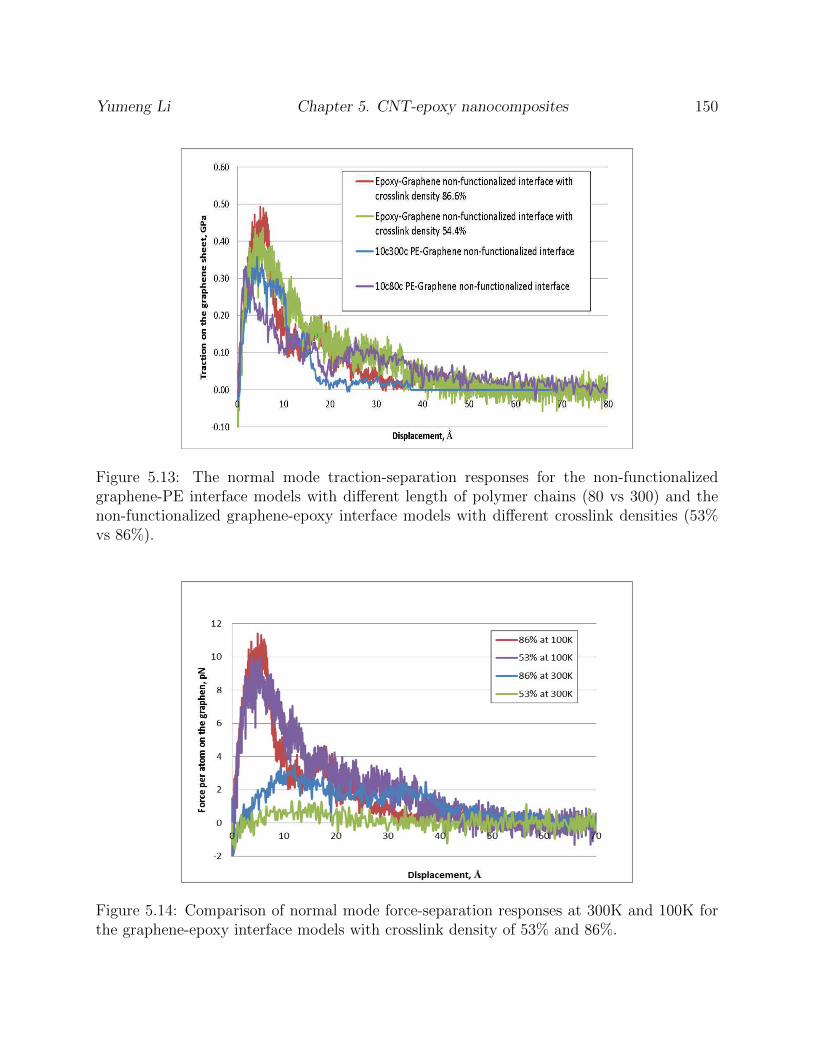
Yumeng Li Chapter 5. CNT-epoxy nanocomposites 150
Figure 5.13: The normal mode traction-separation responses for the non-functionalizedgraphene-PE interface models with different length of polymer chains (80 vs 300) and thenon-functionalized graphene-epoxy interface models with different crosslink densities (53%vs 86%).
Figure 5.14: Comparison of normal mode force-separation responses at 300K and 100K forthe graphene-epoxy interface models with crosslink density of 53% and 86%.
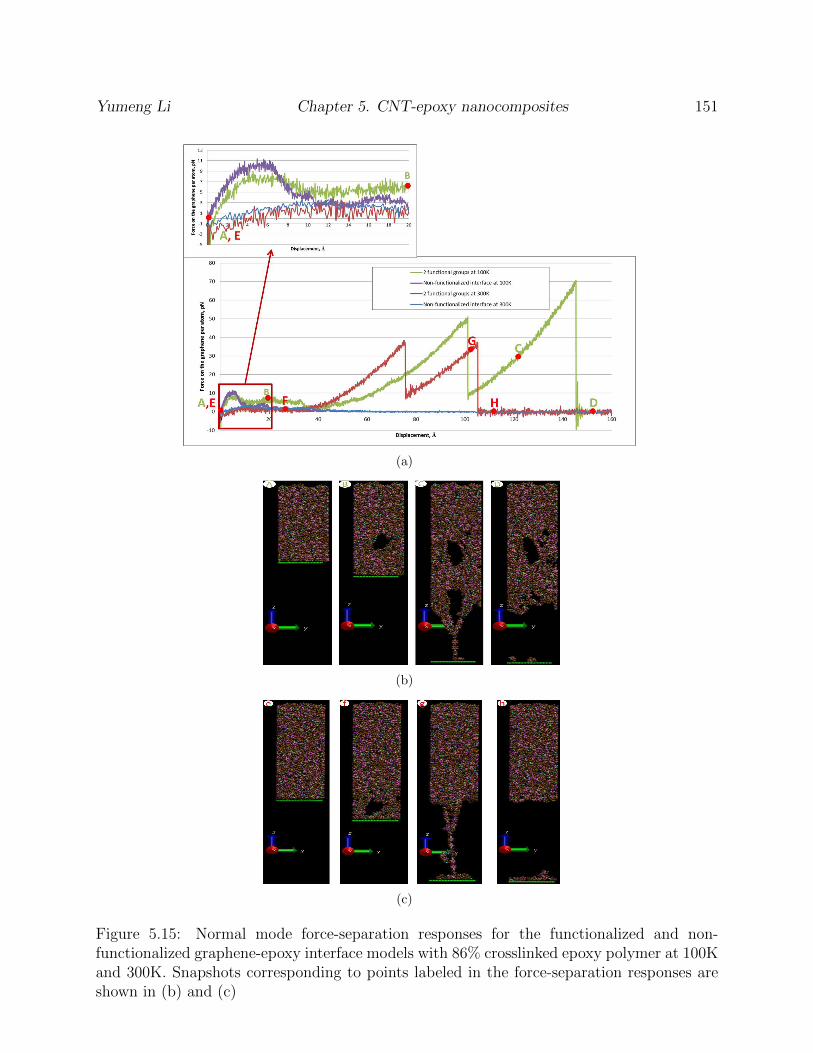
Yumeng Li Chapter 5. CNT-epoxy nanocomposites 151
(a)
(b)
(c)
Figure 5.15: Normal mode force-separation responses for the functionalized and non-functionalized graphene-epoxy interface models with 86% crosslinked epoxy polymer at 100Kand 300K. Snapshots corresponding to points labeled in the force-separation responses areshown in (b) and (c)
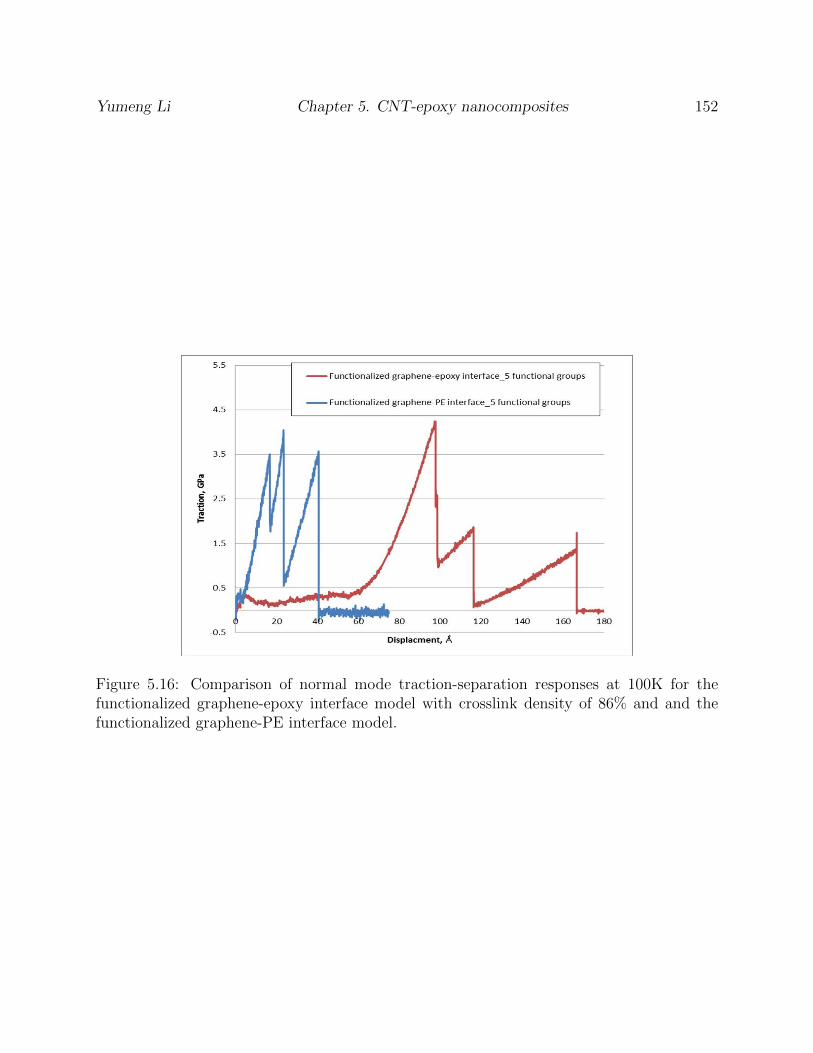
Yumeng Li Chapter 5. CNT-epoxy nanocomposites 152
Figure 5.16: Comparison of normal mode traction-separation responses at 100K for thefunctionalized graphene-epoxy interface model with crosslink density of 86% and and thefunctionalized graphene-PE interface model.
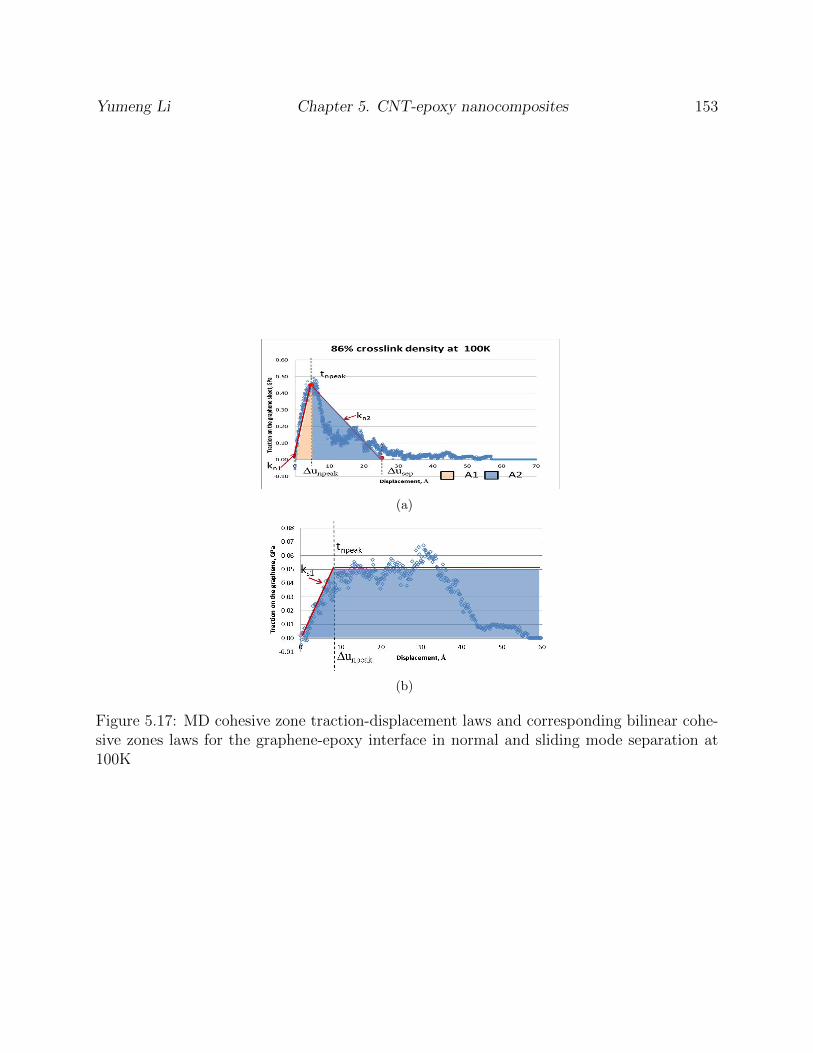
Yumeng Li Chapter 5. CNT-epoxy nanocomposites 153
(a)
(b)
Figure 5.17: MD cohesive zone traction-displacement laws and corresponding bilinear cohe-sive zones laws for the graphene-epoxy interface in normal and sliding mode separation at100K
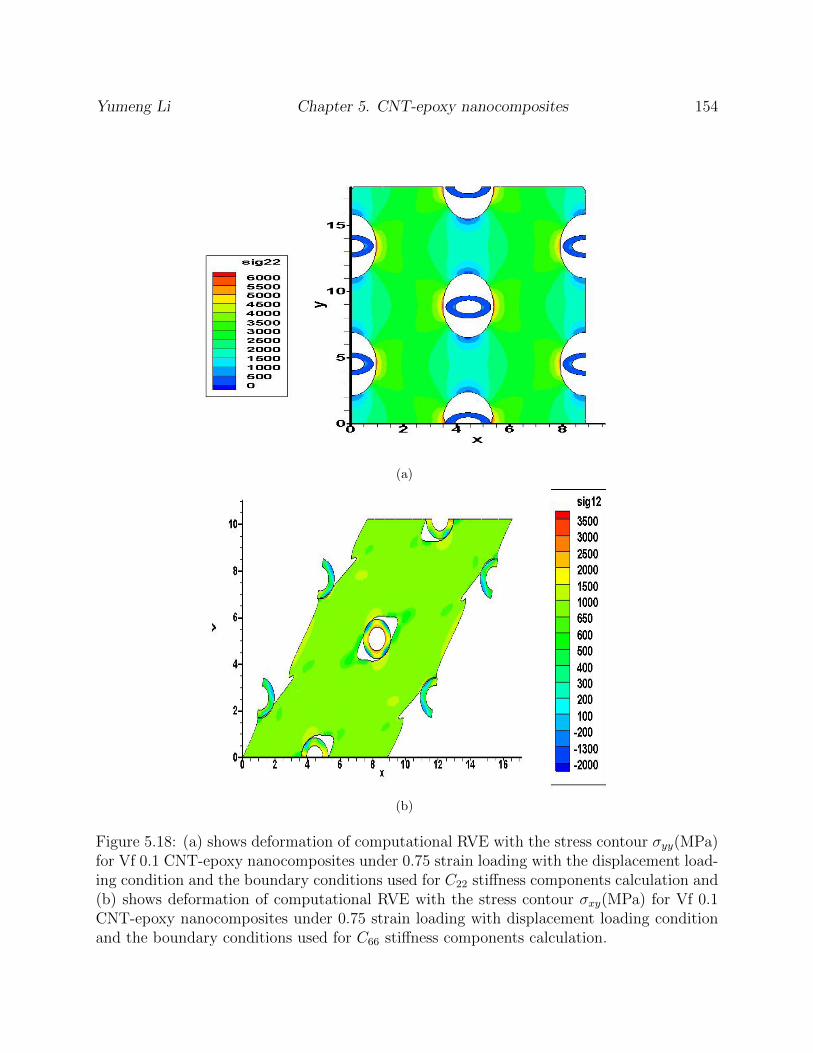
Yumeng Li Chapter 5. CNT-epoxy nanocomposites 154
(a)
(b)
Figure 5.18: (a) shows deformation of computational RVE with the stress contour σyy(MPa)for Vf 0.1 CNT-epoxy nanocomposites under 0.75 strain loading with the displacement load-ing condition and the boundary conditions used for C22 stiffness components calculation and(b) shows deformation of computational RVE with the stress contour σxy(MPa) for Vf 0.1CNT-epoxy nanocomposites under 0.75 strain loading with displacement loading conditionand the boundary conditions used for C66 stiffness components calculation.
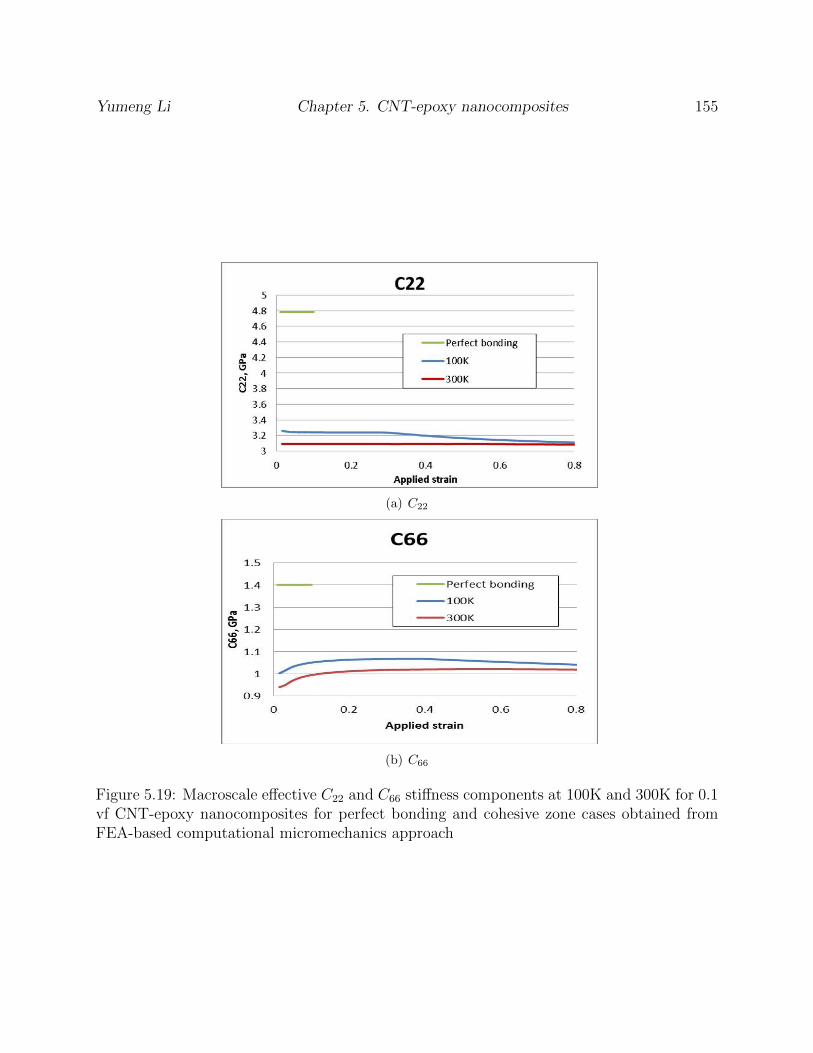
Yumeng Li Chapter 5. CNT-epoxy nanocomposites 155
(a) C22
(b) C66
Figure 5.19: Macroscale effective C22 and C66 stiffness components at 100K and 300K for 0.1vf CNT-epoxy nanocomposites for perfect bonding and cohesive zone cases obtained fromFEA-based computational micromechanics approach
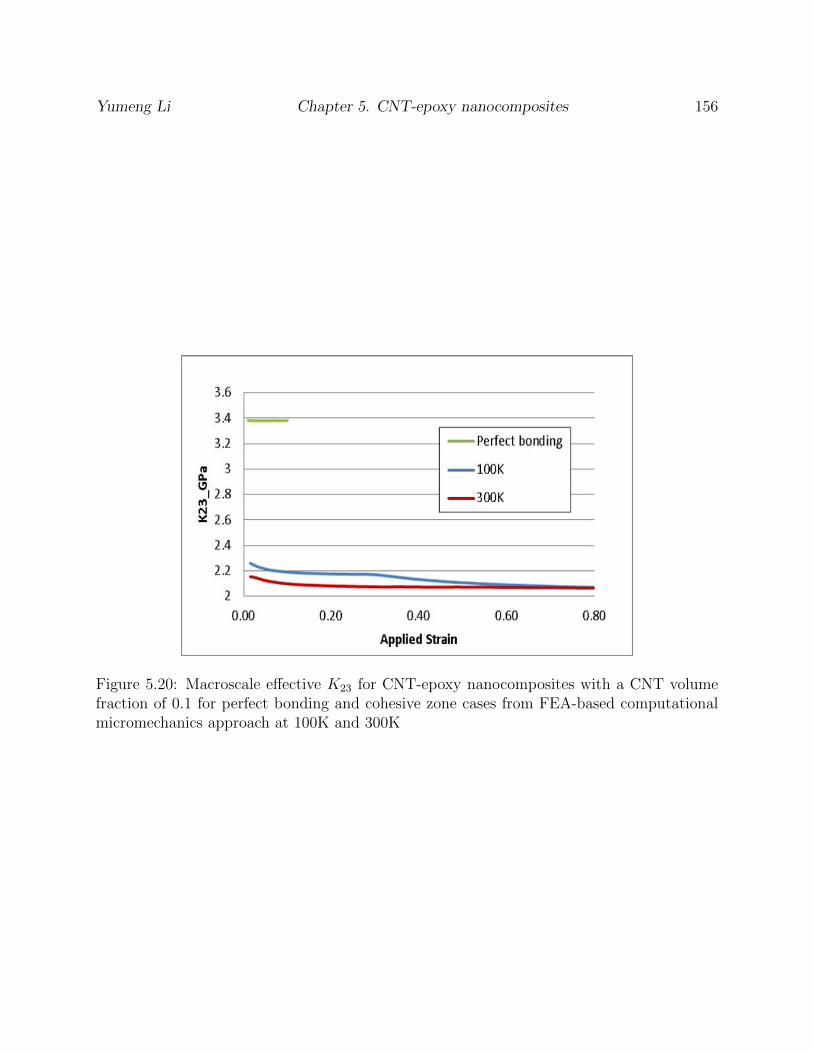
Yumeng Li Chapter 5. CNT-epoxy nanocomposites 156
Figure 5.20: Macroscale effective K23 for CNT-epoxy nanocomposites with a CNT volumefraction of 0.1 for perfect bonding and cohesive zone cases from FEA-based computationalmicromechanics approach at 100K and 300K
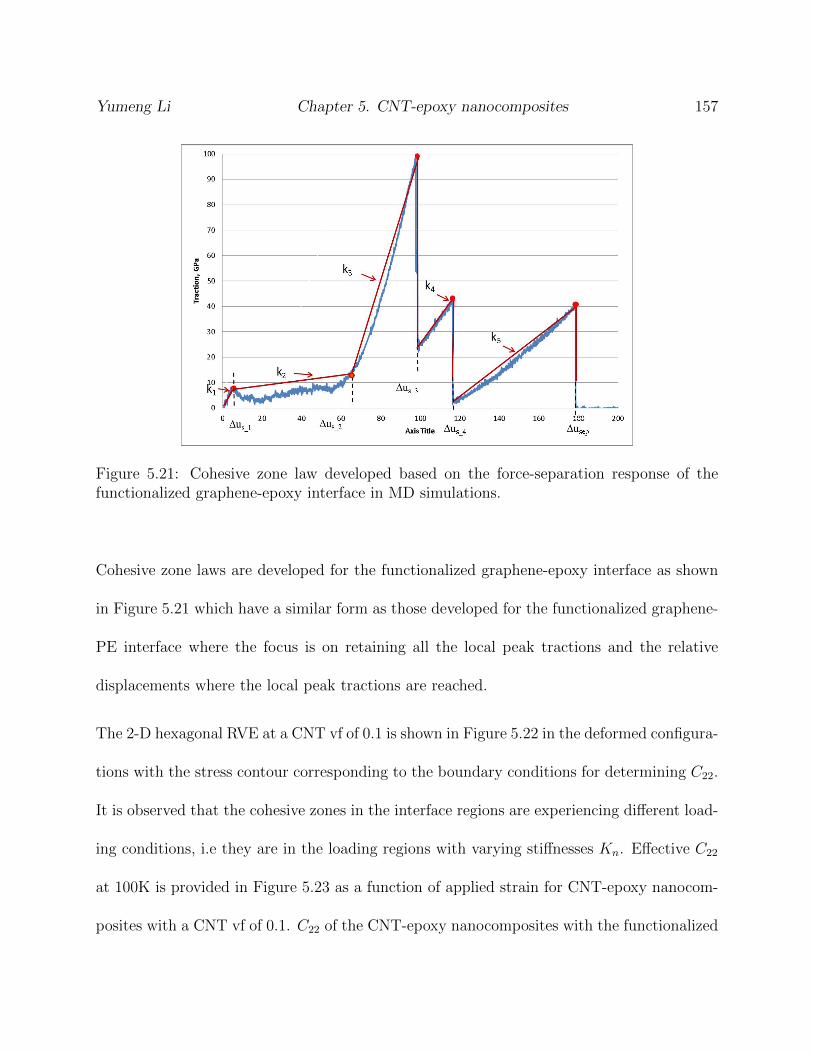
Yumeng Li Chapter 5. CNT-epoxy nanocomposites 157
Figure 5.21: Cohesive zone law developed based on the force-separation response of thefunctionalized graphene-epoxy interface in MD simulations.
Cohesive zone laws are developed for the functionalized graphene-epoxy interface as shown
in Figure 5.21 which have a similar form as those developed for the functionalized graphene-
PE interface where the focus is on retaining all the local peak tractions and the relative
displacements where the local peak tractions are reached.
The 2-D hexagonal RVE at a CNT vf of 0.1 is shown in Figure 5.22 in the deformed configura-
tions with the stress contour corresponding to the boundary conditions for determining C22.
It is observed that the cohesive zones in the interface regions are experiencing different load-
ing conditions, i.e they are in the loading regions with varying stiffnesses Kn. Effective C22
at 100K is provided in Figure 5.23 as a function of applied strain for CNT-epoxy nanocom-
posites with a CNT vf of 0.1. C22 of the CNT-epoxy nanocomposites with the functionalized
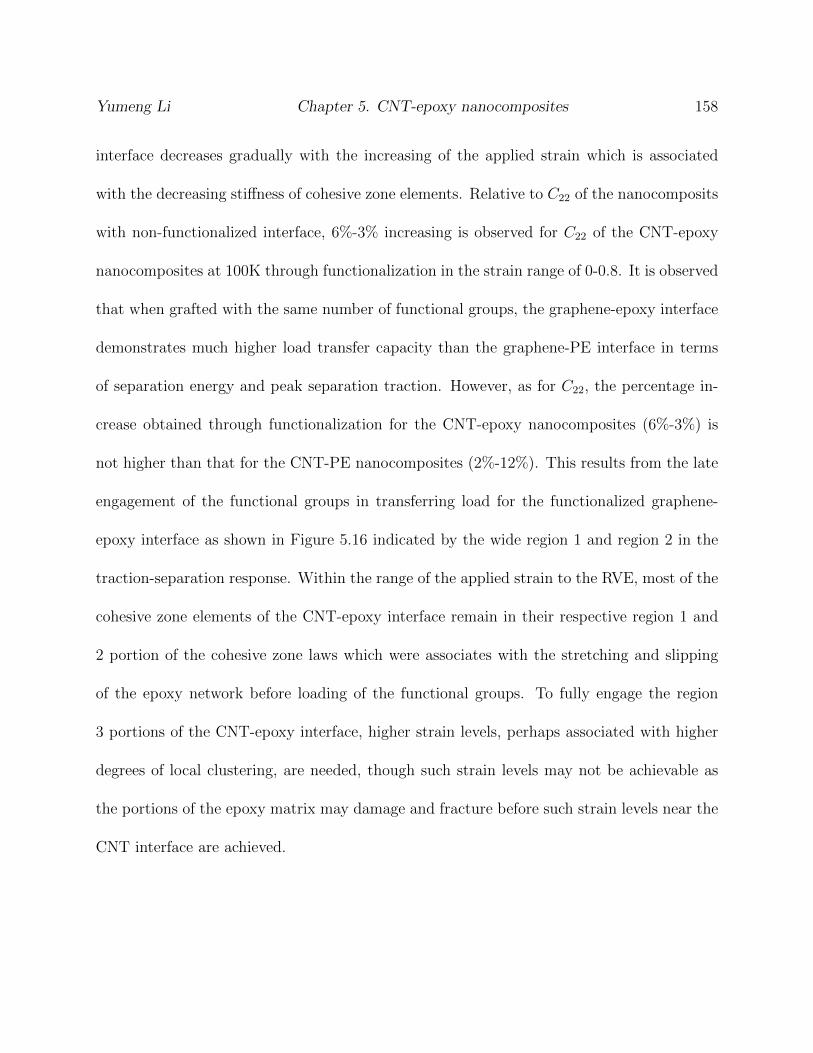
Yumeng Li Chapter 5. CNT-epoxy nanocomposites 158
interface decreases gradually with the increasing of the applied strain which is associated
with the decreasing stiffness of cohesive zone elements. Relative to C22 of the nanocomposits
with non-functionalized interface, 6%-3% increasing is observed for C22 of the CNT-epoxy
nanocomposites at 100K through functionalization in the strain range of 0-0.8. It is observed
that when grafted with the same number of functional groups, the graphene-epoxy interface
demonstrates much higher load transfer capacity than the graphene-PE interface in terms
of separation energy and peak separation traction. However, as for C22, the percentage in-
crease obtained through functionalization for the CNT-epoxy nanocomposites (6%-3%) is
not higher than that for the CNT-PE nanocomposites (2%-12%). This results from the late
engagement of the functional groups in transferring load for the functionalized graphene-
epoxy interface as shown in Figure 5.16 indicated by the wide region 1 and region 2 in the
traction-separation response. Within the range of the applied strain to the RVE, most of the
cohesive zone elements of the CNT-epoxy interface remain in their respective region 1 and
2 portion of the cohesive zone laws which were associates with the stretching and slipping
of the epoxy network before loading of the functional groups. To fully engage the region
3 portions of the CNT-epoxy interface, higher strain levels, perhaps associated with higher
degrees of local clustering, are needed, though such strain levels may not be achievable as
the portions of the epoxy matrix may damage and fracture before such strain levels near the
CNT interface are achieved.
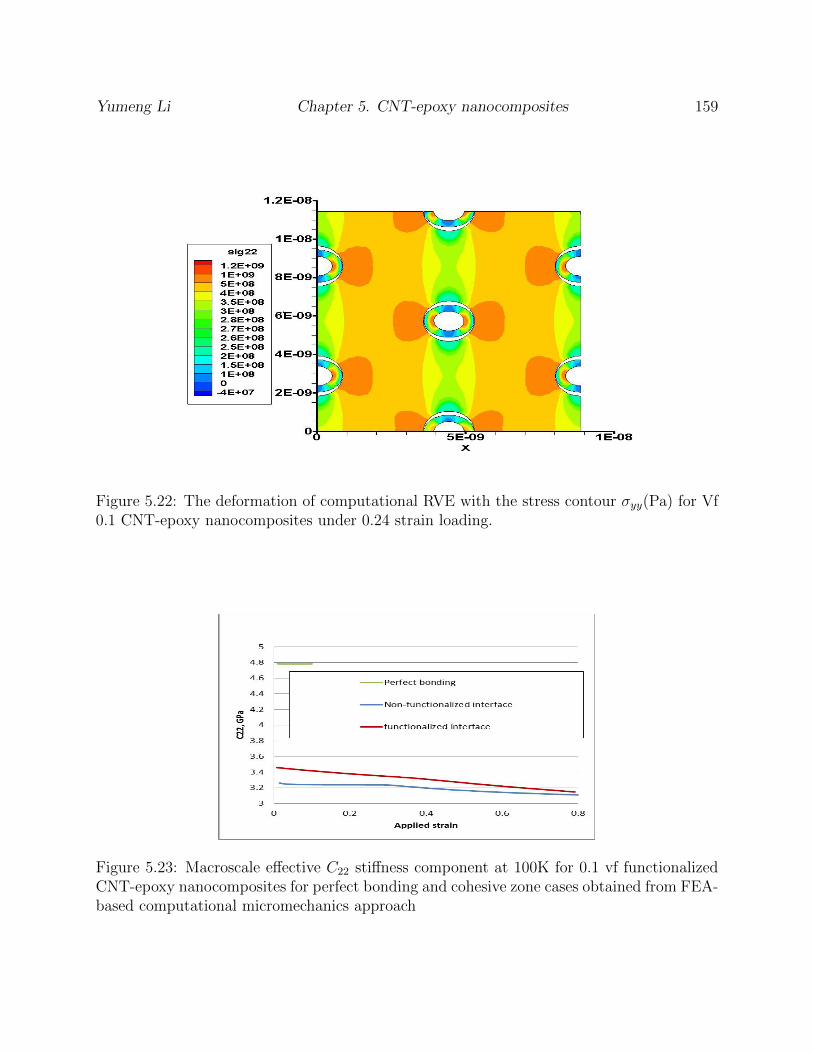
Yumeng Li Chapter 5. CNT-epoxy nanocomposites 159
Figure 5.22: The deformation of computational RVE with the stress contour σyy(Pa) for Vf0.1 CNT-epoxy nanocomposites under 0.24 strain loading.
Figure 5.23: Macroscale effective C22 stiffness component at 100K for 0.1 vf functionalizedCNT-epoxy nanocomposites for perfect bonding and cohesive zone cases obtained from FEA-based computational micromechanics approach
Yumeng Li Chapter 5. CNT-epoxy nanocomposites 160
5.12 Conclusions
MD simulations were conducted to characterize the behavior of the non-functionalzied and
functionalized interface between CNTs and the epoxy matrix in both normal opening and
sliding separations in terms of force-separation responses in order to investigate the load
transfer ability at the interface in the CNT reinforced epoxy nanocomposites. With ther-
moset polymer matrix material, the influence of the crosslink density and the system temper-
ature have been investigated on the load transfer ability of the non-functionalized interface
during the separations. The effect of functionalization on the load transfer ability at the
graphene-epoxy interface is explored at varying temperature.
A dynamic crosslinking process was developed to prepare the epoxy matrix with various
crosslink densities in order to investigate the influence of the crosslink level of the epoxy
matrix on the load transfer ability at the interface between CNTs and the epoxy matrix. In
order to verify the interface model, the distributions of the crosslinks and the local density
in the epoxy matrix with varying crosslink densities were studied with the presence of the
graphene sheet. No bias is observed for the distribution of the crosslinks inside the epoxy
matrix along the z-direction. The profile of the local density along the z-direction for the
epoxy matrix, which is related to the interaction between the graphene sheet and the epoxy
matrix, is consistent with the observations in the literature. These observations indicated
that a reasonable configuration of the crosslinked epoxy matrix was obtained from the devel-
oped dynamic crosslinking process. For the normal mode separation of the nonfunctionalized
Yumeng Li Chapter 5. CNT-epoxy nanocomposites 161
interface, the typical force-separation responses are observed to have two regions, which have
a sharp initial loading region and subsequent slow unloading region after reaching the peak
force. The nonfunctionalized interfacial force-separation response in the sliding direction
has a plateau region with a value around the peak force after an initial loading region and
followed by a relative shorter unloading region. The peak force is much lower in the slid-
ing direction than in the normal direction, which indicates a weaker interface in the sliding
direction.
The non-functionalized graphene-epoxy interface models with 53% crosslinked and 86%
crosslinked epoxy matrix were characterized and compared in order to study the influ-
ence of the crosslink density on the behavior of the non-functionalized interface. It was
observed that the non-functionalized interface with 86% crosslink density has a higher av-
eraged peak force and averaged separation energy in the normal mode separation com-
paring to the non-functionalized interface with 53% crosslink density. This indicated that
the epoxy matrix with higher crosslink density can contribute to forming a stronger non-
functionalized graphene-epoxy interface. Comparison of the force-separation responses of the
non-functionalized graphene-PE interface and the non-functionalized graphene-epoxy inter-
face were also made which demonstrates that higher peak traction and larger separation
energy were observed for the non-functionalized graphene-epoxy interface. This observation
implies the application of the thermoset polymer matrix can attribute to stronger interfacial
interactions in the CNT-reinforced nanocomposites. Temperature effect on the load transfer
ability of the non-functionalized graphene-epoxy interface was investigated and a 69-90%
Yumeng Li Chapter 5. CNT-epoxy nanocomposites 162
decreased peak force and 58-91.5% decreased separation energy were observed, which indi-
cated that the elevated temperature can reduce the strength of the interface significantly. It
was also noted that the non-functionalized graphene-epoxy interface with 53% crosslinked
epoxy matrix has peak force and separation energy decreased by 90.8% and 91.5% respec-
tively, while only 69% and 58% decrease were observed for those of the non-functionalized
graphene-epoxy interface with 86% crosslinked epoxy matrix. This demonstrated that in-
creasing the crosslink density of the epoxy matrix can weaken the temperature effect, i.e.
reduce the reduction of the strength of the interface at the elevated temperature.
Significant enhancement of the load transfer was observed for the functionalized graphene-
epoxy interface in the normal opening separation at both 100K and 300K. As a result of
the crosslinked polymer matrix, both of 2 functional groups are observed to engaged un-
der load and are associated with the two sharp loading segments and subsequent dramatic
drops in the third region of the functionalized interface response. For the functionalized
graphene-epoxy interface, peak force and separation energy in the normal mode separation
have been increased by 5.6 and 21.6 times at 100K, and by 11.1 and 14.9 times at 300K,
which demonstrates functionalization can improve the load transfer ability at the interface
significantly.
Finite element implementation of cohesive zone models was used to investigate the nanoscale
interface effects on the macroscale mechanical performance of the non-functionalized/functionalized
CNT-epoxy nanocomposites. It is observed that relative to the perfect bonding case, the
inclusion of the interface effects by embedding cohesive zone models in FEM yields lower
Yumeng Li Chapter 5. CNT-epoxy nanocomposites 163
K23 for the CNT-epoxy nanocomposites, and a macroscale effective elastic property re-
sponse which demonstrates temperature dependency, volume fraction and load dependency.
Through functionalization, it was noted that enhanced C22 was obtained for the CNT-epoxy
nanocomposites when compared to the nanocomposites with the non-functionalized inter-
face.
The load transfer ability of the non-functionalized graphene-epoxy interface has been ob-
served to have dependence on the crosslink density of the epoxy matrix, the temperature
and the separation mode. Through functionalization, improvement has been noted for the
load transfer ability associating with a stronger interface and the effective material proper-
ties of the CNT-epoxy nanocomposites, which is consistent with the experimental results in
the literature [30, 35].
Chapter 6
Conclusions and summations
In the present work, a multiscale model is provided to investigate the macroscale effective ma-
terial performance of the CNT-reinforce polymer nanocomposites under the nanoscale load
transfer ability of the non-functionalized or functionalized interface by bridging the atomistic
modeling with continuum micromechanics approaches using cohesive zone models. A brief
review of molecular dynamic simulations and cohesive zone models has been provided. The
atomistic interface models have been constructed to characterize the load transfer capability
at the interface between CNTs and the polymer matrix in CNT-reinforced nanocomposites in
terms of sensitivity to parameters such as temperature, sliding mode, the length of polymer
chains and numbers for the thermoplastic polymer matrix and the crosslink density for the
thermoset polymer matrix. Cohesive zone laws were developed based on traction-separation
interface responses for normal opening and sliding mode separations at the nanoscale. The
cohesive zones were applied in the analytic and computational micromechanics approaches
164
Yumeng Li Chapter 5. CNT-epoxy nanocomposites 165
to predict the macroscale effective elastic properties under the influence of the nanoscale
load transfer ability of the interface.
The use of the graphene sheet in constructing a representative interface element for the non-
functionalized graphene-PE interface has been explored in terms of sensitivity to parameters
such as the length of the polymer chains, the number of polymer chains, and relative position
of the MD ’grip’ to the interface, as well as the influences of curvature of the graphene sheet
and temperature. The MD results demonstrated that at the nanoscale the load transfer
ability of the interface is much lower in the sliding direction than in the normal direction
and decrease with the elevated temperature, which indicates a dependence on the separation
mode and the system temperature. The macroscale effective properties determined from the
micromechanics approaches was observed to experience significant depreciation compared
to the perfect bonding cases when the interface model was included and exhibit strain,
temperature and CNT volume fraction dependence. This indicates the interface may be
the source of overprediction of the material properties of CNT based nanocomposites in the
literatures.
The effects of functionalization were investigated on the effective mechanical material prop-
erties of CNT-PE nanocomposites. CVFF is modified by adding strain energy criteria for all
carbon-carbon covalent bonds to allow for bond breaking. Significant improvement has been
observed for the load transfer ability of the functionalized interface in both modified CVFF
and AIREBO cases with the peak force increased by 15.3-21.6 times for the modified CVF-
F cases and 9.06-25.7 times for the AIREBO cases as compared to the non-functionalized
Yumeng Li Chapter 5. CNT-epoxy nanocomposites 166
graphene-PE interface model. Larger separation energy has also been observed for the inter-
face with more functional groups in the normal mode separation which demonstrates higher
functionlaization density can lead to the better load transfer ability of the functionalized in-
terface. For the sliding mode separations, 5 functional groups cases demonstrated increased
overall peak force and separation energy ( 43 and 99.6 times for the modified CVFF case
and 4.87 and 10.4 times for the AIREBO case). Such observations suggest that the func-
tionalized interface model has a nearly equal load carrying capability in both normal and
sliding modes, which indicates significantly improved overall load transfer ability of the in-
terface through the functionalization. The finite element implementation of cohesive zone
model was applied to calculate macroscale effective mechanical property of the CNT-PE
nanocomposites with the functionalized interface where improved C22 (2%-12%) relative to
the CNT-PE nanocomposites with the non-functionalized interface was observed.
For nanocomposites with thermoset polymer matrix, a dynamic crosslinking process was de-
veloped to construct the epoxy matrix with various crosslink densities in order to investigate
the influence of the crosslink level of the epoxy matrix on the load transfer ability at the
interface between CNTs and the epoxy matrix. Comparison of the force-separation responses
of the non-functionalized graphene-PE interface and the non-functionalized graphene-epoxy
interface was made which demonstrates that higher peak traction and larger separation en-
ergy were observed for the non-functionalized graphene-epoxy interface. It was also observed
that the non-functionalized interface with 86% crosslink density had a higher averaged peak
force and averaged separation energy in the normal mode separation compared to the non-
Yumeng Li Chapter 5. CNT-epoxy nanocomposites 167
functionalized interface with 53% crosslink density. It infers that the epoxy matrix with
high crosslink density can contribute to form a stronger non-functionalized graphene-epoxy
interface. Temperature effect on the load transfer ability at the non-functionalized graphene-
epoxy interface was investigated and the 69-90% decreased peak force and 58-91.5% decreased
separation energy were observed, which indicates that the elevated temperature can reduce
the strength of the interface significantly. It was also noted that the non-functionalized
graphene-epoxy interface with 53% crosslinked epoxy matrix had peak force and separa-
tion energy decreased by 90.8% and 91.5% respectively, while only 69% and 58% decreasing
has been observed for those of the non-functionalized graphene-epoxy interface with 86%
crosslinked epoxy matrix. It demonstrated that increasing the crosslink density of the epoxy
matrix can weaken the temperature effect, i.e. reduce the reduction of the strength of the
interface at the elevated temperature. Significant enhancement of the load transfer has been
observed for the functionalized graphene-epoxy interface in the normal opening separation
at both 100K and 300K. For the functionalized graphene-epoxy interface, peak force and
separation energy in the normal mode separation have been increased by 5.6 and 21.6 times
at 100K, and by 11.1 and 14.9 times at 300K, which demonstrated functionalization can
improve the load transfer ability at the interface significantly. Applying cohesive zone mod-
els in the finite element framework, it was noted that C22 was increased by 6%-3% through
functionalization for the CNT-epoxy nanocomposites when compared to the nanocomposites
with the non-functionalized interface.
It was observed that the macroscale effective properties of non-functionalized CNT-polymer
Yumeng Li Chapter 5. CNT-epoxy nanocomposites 168
nanocomposites determined from the micromechanics approaches experienced significant de-
preciation compared to the perfect bonding cases when the interface model was included.
The temperature sensitivity of the interface was observed to directly transfer to the ef-
fective property calculations, which were also observed to be highly sensitive to the CNT
volume fraction and applied load. For the functionalized interface, observing herein that
the normal and sliding modes both yield significantly improved interfacial load transfer, the
latter more so relative to its non-functionalized counterpart, it is expected that all effective
elastic properties, especially those relying on shear load transfer, will be enhanced along
with their durability under load. Improved C22 relative to the nanocomposites with the
non-functionalized interface was observed for both functionlaized CNT-PE and CNT-epoxy
nanocomposites, which indicates that the treatment of functionalization helps to improve
the effective mechanical properties of the CNT-reinforced polymer nanocomposites.

Chapter 7
Bibliography
169
Bibliography
[1] Coleman, J., Khan, U., Blau, W., and Gun’ko, Y., “Small but strong: A review of the
mechanical properties of carbon nanotube-polymer composites,” Carbon, Vol. 44, No. 9,
2006, pp. 1624–1652.
[2] Falvo, M., Clary, G., Taylor II, R., Chi, V., Brooks Jr, F., Washburn, S., and Superfine,
R., “Bending and buckling of carbon nanotubes under large strain,” Nature, Vol. 389,
1997, pp. 582–584.
[3] Wong, E., Sheehan, P., and Lieber, C., “Nanobeam mechanics: elasticity, strength, and
toughness of nanorods and nanotubes,” Science, Vol. 277, 1997, pp. 1971–1975.
[4] McEuen, P., Fuhrer, M., and Park, H., “Single-walled carbon nanotube electronics,”
IEEE Transaction on Nanotechnology , Vol. 1, No. 1, 2002, pp. 78–85.
[5] Hone, J., Llaguno, M., Biercuk, M., Johnson, A., Batlogg, B., and Fischer, J., “Thermal
properties of carbon nanotubes and nanotube-based materials,” Applied Physics A,
Vol. 74, 2002, pp. 339–343.
170
Yumeng Li Chapter 5. CNT-epoxy nanocomposites 171
[6] Thostenson, E., ZF., R., and Chou, T., “Advances in the science and technology of
carbon nanotubes and their composites: a review,” Compos. Sci. Technol., Vol. 61,
2001, pp. 1899–912.
[7] Awasthi, K., Srivastava, A., and Srivastava, O. N., “Synthesis of carbon nanotubes,”
Journal of Nanoscience and Nanotechnology , Vol. 5, 2005, pp. 1616–1636.
[8] Collins, P. and Avouris, P., “Nanotubes for Electronics,” Scientific American, Vol. 283,
2000, pp. 62–69.
[9] Treacy, M., Ebbesen, T., and Gibson, J., “Exceptionally high Young’s modulus observed
for individual carbon nanotubes,” Nature, Vol. 381, 1996, pp. 678–680.
[10] Cadek, M., Coleman, J., Barron, V., Hedicke, K., and Blau, W., “Morphological and me-
chanical properties of carbon-nanotube-reinforced semicrystalline and amorphous poly-
mer composites,” Applied Physics Letters , Vol. 81, No. 27, 2002, pp. 5123–5125.
[11] Qian, D., Dickey, E., Andrews, R., and Rantell, T., “Load transfer and deforma-
tion mechanisms in carbon nanotube-polystyrene composites,” Applied Physics Letters ,
Vol. 76, No. 20, 2000, pp. 2868–2870.
[12] Tibbetts, G. and Mchugh, J., “Mechanical properties of vapor-grown carbon fiber com-
posites with thermoplastic matrices,” Journal of Materials Research, Vol. 14, 1999,
pp. 2871–2880.
Yumeng Li Chapter 5. CNT-epoxy nanocomposites 172
[13] Xiao, K., Zhang, L., and Zarudi, I., “Mechanical and rheological properties of car-
bon nanotube-reinforced polyethylene composites,” Composites Science and Technolo-
gy , Vol. 67, 2007, pp. 177–182.
[14] Kanagaraj, S., Varanda, F. R., Zhil’tsova, T., Oliveira, M., and Simoes, J., “Mechan-
ical properties of high density polyethylene/carbon nanotube composites,” Composites
Science and Technology , Vol. 67, 2007, pp. 3071–3077.
[15] Yang, Z., McElrath, K., Bahr, J., and D’Souza, N. A., “Effect of matrix glass transition
on reinforcement efficiency of epoxy-matrix composites with single walled carbon nan-
otubes, multi-walled carbon nanotubes, carbon nanofibers and graphite,” Composites:
Part B , Vol. 43, 2012, pp. 2079–2086.
[16] Inam, F., Vo, T., Jones, J. P., and Lee, X., “Effect of carbon nanotube lengths on the
mechanical properties of epoxy resin: An experimental study,” Journal of Composite
Materials , Vol. 47, No. 19, 2012, pp. 2321–2330.
[17] Haggenmueller, R., Zhou, W., Fischer, J., and Winey, K., “Production and characteri-
zation of polymer nanocomposites with highly aligned single-walled carbon nanotubes,”
Journal of nanoscience and nanotechnology , Vol. 3, No. 1/2, 2003, pp. 105–110.
[18] Mahfuz, H., Adnan, A., Rangari, V., and Jeelani, S., “Manufacturing and Charac-
terization of Carbon Nanotube/Polyethylene Composites,” International Journal of
Nanoscience, Vol. 4, No. 1, 2005, pp. 55–72.
Yumeng Li Chapter 5. CNT-epoxy nanocomposites 173
[19] Haggenmueller, R., Gommans, H. H., Rinzler, A. G., Fischer, J. E., and Winey, K. I.,
“Aligned single-wall carbon nanotubes in composites by melt processing methods,”
Chemical Physics Letters , Vol. 330, 2000, pp. 219–225.
[20] Tang, W., Santare, M. H., and Advani, S. G., “Melt processing and mechanical proper-
ty characterization of multi-walled carbon nanotube/high density polyethylene (MWN-
T/HDPE) composite films,” Carbon, Vol. 41, 2003, pp. 2779–2785.
[21] Zou, Y., Feng, Y. amd Wang, L., and Liu, X., “Processing and properties of MWN-
T/HDPE composites,” Carbon, Vol. 41, 2004, pp. 271–277.
[22] McNally, T., Poetschke, P., Halley, P., and et. al., “Polyethylene multiwalled carbon
nanotube composites,” Carbon, Vol. 46, 2005, pp. 8222–8232.
[23] Park, S., Yoon, S. W., Choi, H., Lee, J. S., Cho, W. K., Kim, J., Park, H. J., Yun,
W. S., Choi, C. H., Do, Y., and Choi, I. S., “Pristine Multiwalled Carbon Nan-
otube/Polyethylene Nanocomposites by Immobilized Catalysts,” Chemistry of Mate-
rials , Vol. 20, 2008, pp. 4588–4594.
[24] Zhang, X., Liu, T.a nd Sreekumar, T., Kumar, S., Moore, V., Hauge, R., and Smalley,
R., “Poly(vinyl alcohol)/SWNT Composite Film,” Nano Letters , Vol. 3, No. 9, 2003,
pp. 1285–1288.
[25] Dyke, C. and Tour, J., “Overcomi ng the Insolubility of Carbon Nanotubes Through
High Degrees of Sidewall Functionalization,” Chem. Eur. J., Vol. 10, 2004, pp. 812–817.
Yumeng Li Chapter 5. CNT-epoxy nanocomposites 174
[26] Cadek, M., Coleman, J., Ryan, K., Nicolosi, V., Bister, G., Fonseca, A., Nagy, J.,
Szostak, K., Beguin, F., and Blau, W., “Reinforcement of Polymers with Carbon Nan-
otubes: The Role of Nanotube Surface Area,” Nano Letters , Vol. 4, No. 2, 2004, p-
p. 353–356.
[27] Wagner, H. and Vaia, R., “Nanocomposites: issues at the interface,” Materials Today ,
Vol. 7, No. 11, 2004, pp. 38–42.
[28] Desai, A. and Haque, M., “Mechanics of the interface for carbon nanotubepolymer
composites,” Thin-Walled Structures , Vol. 43, 2005, pp. 1787–1803.
[29] Rahmat, M. and Hubert, P., “Carbon nanotube-polymer interactions in nanocompos-
ites: A review,” Composites Science and Technology , Vol. 72, 2011, pp. 72–84.
[30] Wang, S., Liang, Z., Liu, T., Wang, B., and Zhang, C., “Effective amino-
functionalization of carbon nanotubes for reinforcing epoxy polymer composites,” Nan-
otechnology , Vol. 17, 2006, pp. 1551–1557.
[31] Ma, P., Zheng, Q., Mader, E., and Kim, J., “Behavior of load transfer in functionalized
carbon nanotube/epoxy nanocomp osites,” Polymer , Vol. 53, 2012, pp. 6081–6088.
[32] Zhu, J., Peng, H., Rodriguez-Macias, F., Margrave, J. L., Khabashesku, V. N., I-
mam, A. M., Lozano, K., and Barrera, E. V., “Reinforcing epoxy polymer composites
through covalent integration of functionalized nanotubes,” Advanced functional materi-
als , Vol. 14, No. 7, 2004, pp. 643–648.
Yumeng Li Chapter 5. CNT-epoxy nanocomposites 175
[33] Gong, X., Liu, J., Baskaran, S., Voise, R., and Young, J., “Surfactant-assisted processing
of carbon nanotube/polymer composites,” Chemistry of Materials , Vol. 12, No. 1049-
1052, 2000.
[34] Coleman, J., Cadek, M., Blake, R., Nicolosi, V., Ryan, K., and Belton, C., “High-
performance nanotube-reinforced plastics: understanding the mechanism of strength
increase,” Advanced functional materials , Vol. 14, No. 8, August 2004, pp. 791–798.
[35] Zhu, J., Peng, H., Rodriguez-Macias, F., Margrave, J., Khabashesku, V., Imam, A.,
Lozano, K., and Barrera, E., “Reinforcing epoxy polymer composites through covalent
integration of functionalized nanotubes,” Advanced Functional Materials , Vol. 14, No. 7,
2004, pp. 643–648.
[36] Barber, A., Cohen, S., and Wagner, H., “Measurement of Carbon Nanotube-Polymer
Interfacial Strength,” Applied Physics Letters , Vol. 82, No. 23, June 2003, pp. 4140–
4142.
[37] Tsuda, T., Ogasawara, T., Deng, F., and Takeda, N., “Direct measurements of inter-
facial shear strength of multi-walled carbon nanotube/PEEK composite using a nano-
pullout method,” Composites Science and Technology , Vol. 71, 2011, pp. 1295–1300.
[38] Rafiee, R., Rabczuk, T., Pourazizi, R., Zhao, J., and Zhang, Y., “Challenges of the Mod-
eling Methods for Investigating the Interaction between the CNT and the Surrounding
Polymer,” Advances in Materials Science and Engineering , Vol. 2013, 2013.
Yumeng Li Chapter 5. CNT-epoxy nanocomposites 176
[39] Chen, X. and Liu, Y., “Square representative volume elements for evaluating the effec-
tive material properties of carbon nanotube-based composites,” Computational Materi-
als Science, Vol. 29, No. 1, 2004, pp. 1–11.
[40] Liu, Y. and Chen, X., “Evaluations of the effective material properties of carbon
nanotube-based composites using a nanoscale representative volume element,” Mechan-
ics of Materials , Vol. 35, 2003, pp. 69–81.
[41] Liu, Y., Nishimura, N., and Otani, Y., “Large-scale modeling of carbon-nanotube com-
posites by a fast multipole boundary element method,” Computational Materials Sci-
ence, Vol. 34, 2005, pp. 173–187.
[42] Seidel, G. and Lagoudas, D., “Micromechanical analysis of the effective elastic properties
of carbon nanotube reinforced composites,” Mechanics of Materials , Vol. 38, 2006,
pp. 884–907.
[43] Hammerand, D., Seidel, G., and Lagoudas, D., “Computational micromechanics of clus-
tering and interphase effects in carbon nanotube composites,” Mechanics of Advanced
Materials and Structures , Vol. 14, 2007, pp. 277–294.
[44] Seidel, G., Lagoudas, D., Frankland, S., and Gates, T., “Modeling functionally grad-
ed interphase regions in carbon nanotube reinforced composites,” Proceedings of the
20th ASC Technical Conference, American Society for Composites, Drexel University,
Philadelphia, PA, September 7-9 2005.
Yumeng Li Chapter 5. CNT-epoxy nanocomposites 177
[45] Frankland, S., Harik, V., Odegard, G., Brenner, D., and Gates, T., “The stress-strain
behavior of polymer-nanotube composites from molecular dynamics simulation,” Com-
posites Science and Technology , Vol. 63, 2003, pp. 1655–1661.
[46] Haghighatpanah, S. and Bolton, K., “Molecular-Level Computational Studies of Single
Wall Carbon Nanotube-Polyethylene Composites,” Computational Materials Science,
Vol. 69, No. 443-454, 2013.
[47] Sul, J., Prusty, B. G., Kelly, D. W., and Christensen, S., “Application of molecular
dynamics to evaluate the design performance of low aspect ratio carbon nanotubes
infibre reinforced polymer resin,” Composites: Part A, Vol. 65, 2014, pp. 64–72.
[48] Zhou, M., “A new look at the atomic level virial stress: on continuum-molecular system
equivalence,” Proc. R. Soc. Lond. A, Vol. 459, 2003, pp. 2347–2392.
[49] Mokashi, V., Qian, D., and Liu, Y., “A study on the tensile response and fracture
in carbon nanotube-based composites using molecular mechanics,” Composites Science
and Technology , Vol. 67, No. 3-4, 2007, pp. 530–540.
[50] Khare, K. S., Khabaz, F., and Khare, R., “Effect of Carbon Nanotube Functionaliza-
tion on Mechanical and Thermal Properties of Cross-Linked Epoxy-Carbon Nanotube
Nanocomposites: Role of Strengthening the Interfacial Interaction,” Applied Materials
and Interfaces , Vol. 6, 2014, pp. 6098–6110.
Yumeng Li Chapter 5. CNT-epoxy nanocomposites 178
[51] Odegard, G., Gates, T., Wise, K., Park, C., and Siochi, E., “Constitutive modeling of
nanotube-reinforced polymer composites,” Composites Science and Technology , Vol. 63,
2003, pp. 1671–1687.
[52] Odegard, G., Frankland, S., and Gates, T., “Effect of Nanotube Functionalization on
the Elastic Properties of Polyethylene Nanotube Composites,” AIAA Journal , Vol. 43,
No. 8, August 2005, pp. 1828–1835, AIAA-9468-376.
[53] Wagner, H., “Nanotube-polymer adhesion: a mechanics approach,” Chemical Physics
Letters , Vol. 361, July 2002, pp. 57–61.
[54] Frankland, S., Caglar, A., Brenner, D., and Griebel, M., “Molecular simulation of the
influence of chemical cross-links on the shear strength of carbon nanotube-polymer
interfaces,” Journal of Physical Chemistry B , Vol. 106, 2002, pp. 3046–3048.
[55] Gou, J., Minaie, B., Wang, B., Liang, Z., and Zhang, C., “Computational and exper-
imental study of interfacial bonding of single-walled nanotube reinforced composites,”
Computational Materials Science, Vol. 31, 2004, pp. 225–236.
[56] Lau, K., “Interfacial bonding characteristics of nanotube/polymer composites,” Chem-
ical Physics Letters , Vol. 370, 2003, pp. 399–405.
[57] Xian, T. and Liao, K., “A nonlinear pullout model for unidirectional carbon nanotube-
reinforced composites,” Composites: Part B , Vol. 35, 2004, pp. 211–217.
Yumeng Li Chapter 5. CNT-epoxy nanocomposites 179
[58] Jiang, L., Huang, Y., Jiang, H., Ravichandran, G., and et. al., “A cohesive law for
carbon nanotube/polymer interfaces based on the van der Waals force,” Journal of the
Mechanics and Physics of Solids , Vol. 54, 2006, pp. 2436–2452.
[59] Awasthi, A., Lagoudas, D., and Hammerand, D., “Modeling of graphene-polymer in-
terfacial mechanical behavior using molecular dynamics,” Modelling Simul. Mater. Sci.
Eng., Vol. 17, 2009, pp. 15002–37.
[60] Dauber-Osguthorpe, P., Roberts, V. A., Osguthorpe, D. J., Wolff, J., Genest, M., and
Hagler, A. T., “Structure and energetics of ligand binding to proteins: Escherichia coli
dihydrofolate reductase-trimethoprim, a drug-receptor system,” Proteins , Vol. 4, No. 1,
1988, pp. 31–47.
[61] Brenner, D., Shenderova, O., Harrison, J., Stuart, S., Ni, B., and Sinnott, S., “A
second-generation reactive empirical bond order (REBO) potential energy expression
for hydrocarbons,” Journal of Physics: Condensed Matter , Vol. 14, 2002, pp. 783–802.
[62] Brenner, D., “Empirical potential for hydrocarbons for use in simulating the chemical
vapor deposition of diamond films,” Physical Review B , Vol. 42, No. 15, 1990, pp. 9458–
9471.
[63] Stuart, S., Tutein, A., and Harrison, J., “A Reactive Potential for Hydrocarbons with
Intermolecular Interactions,” J. Chem Phys., Vol. 112, No. 14, 2000, pp. 6472–6486.
Yumeng Li Chapter 5. CNT-epoxy nanocomposites 180
[64] Jorgensen, W., Maxwell, D., and Tirado-RivesJ., “Development and Testing of the
OPLS All-Atom Force Field on Conformational Energetics and Properties of Organic
Liquids,” J. Am. Chem. Soc., Vol. 118, No. 45, 1996, pp. 11225–36.
[65] Dugdale, D., “Yielding of steel sheets containing slits,” Journal of the Mechanics and
Physics of Solids , Vol. 8, 1960, pp. 100–104.
[66] Barenblatt, G., “The mathematical theory of equilibrium cracks in brittle fracture,”
Advances in Applied Mechanics , Vol. 7, 1962, pp. 55–129.
[67] Alfano, M., Furgiuele, F., Leonardi, A., Maletta, C., and Paulina, G., “Cohesive Zone
Modeling of Mode I Fracture in Adhesive Bonded Joints,” Key Engineering Materials
Vols , Vol. 348-349, 2007, pp. 13–16.
[68] Li, S., Thouless, M., Waas, A., Schroeder, J., and Zavattieri, P., “Use of a cohesive-
zone model to analyze the fracture of a fiber-reinforced polymerCmatrix composite,”
Composites Science and Technology , Vol. 65, 2005, pp. 537–549.
[69] Bosch, M. v. d., Schreurs, P., and Geers, M., “An improved description of the expo-
nential Xu and Needleman cohesive zone law for mixed-mode decohesion,” Engineering
Fracture Mechanics , Vol. 73, 2006, pp. 1220–12.
[70] Yu, D. and Liu, F., “Synthesis of Carbon Nanotubes by Rolling up Patterned Graphene
Nanoribbons Using Selective Atomic Adsorption,” Nano Lett., Vol. 7, No. 10, 2007,
pp. 3046–3050.
Yumeng Li Chapter 5. CNT-epoxy nanocomposites 181
[71] Fan, C., Cagin, T., and Chen, Z., “Molecular Modeling of Polycarbonate. 1. Force
Field, Static Structure, and Mechanical Properties,” Macromolecules , Vol. 27, 1994,
pp. 2383–2391.
[72] Dechant, J., Polymer handbook. 3rd ed., New York: Wiley-Interscience, 1989.
[73] Liu, Y. and Chen, X., “Evaluations of the effective material properties of carbon
nanotube-based composites using nanoscale representative volume element,” Mechanics
of Materials , Vol. 35, 2003, pp. 69–81.
[74] Mittal, V., editor, Surface Modification of Nanotube Fillers , John Wiley and Sons, 2011.
[75] Blond, D., Barron, V., Ruether, M., Ryan, K., Nicolosi, V., Blau, W., and Coleman,
J., “Enhancement of Modulus, Strength, and Toughness in Poly(methyl methacrylate)-
Based Composites by the incorporation of Poly(methyl methacrylate)-Functionalized
Nanotubes,” Advanced Functional Materials , Vol. 16, No. 12, 2006, pp. 1608–1614.
[76] Li, Y. and Seidel, D., “The Multiscale Modeling of the Effects of Nanoscale Load
Transfer on the Effective Elastic Properties of Unfunctionalized Carbon Nanotube-
Polyethylene Nanocomposites,” Modelling Simul. Mater. Sci. Eng., Vol. 22, No. 025023-
50, 2014.
[77] Sanderson, R. T., Chemical bonds and bond energy , Vol. 21 of Physical chemistry, a
series of monographs , Academic, New York, 1976.
Yumeng Li Chapter 5. CNT-epoxy nanocomposites 182
[78] Nakane, K., Watanabe, N., and Iwahori, Y., “DCB Test Simulation of Stitched CFRP
Laminates using Interlaminar Tension Test Results,” Composites Science and Technol-
ogy , Vol. 69, 2009, pp. 2315–2322.
[79] Ye, Y., Chen, H., Wu, J., and Chan, C., “Interlaminar Properties of Carbon Fiber
Composites with Halloysite Nanotube-Toughened Epoxy Matrix,” Composites Science
and Technology , Vol. 71, 2011, pp. 717–723.
[80] Inam, F., Wong, D. W., Kuwata, M., and Peijs, T., “Multiscale Hybrid Micro-
Nanocomposites Based on Carbon Nanotubes and Carbon Fibers,” Journal of Nano-
materials , Vol. 2010, 2010, pp. 453420–32.
[81] Khare, K. and Khare, R., “Directed Diffusion Approach for Preparing Atomistic Models
of Crosslinked Epoxy for Use in Molecular Simulations,” Macromolecular Theory and
Simulations , Vol. 21, 2012, pp. 322–327.
[82] Wang, S., Liang, R., Wang, B., and C., Z., “Covalent Addition of Diethyltoluenedi-
amines Onto Carbon Nanotubes for Composite Application,” POLYMER COMPOS-
ITES , Vol. 30, 2009, pp. 1050–1057.
Appendix A
Parameters for CVFF
183
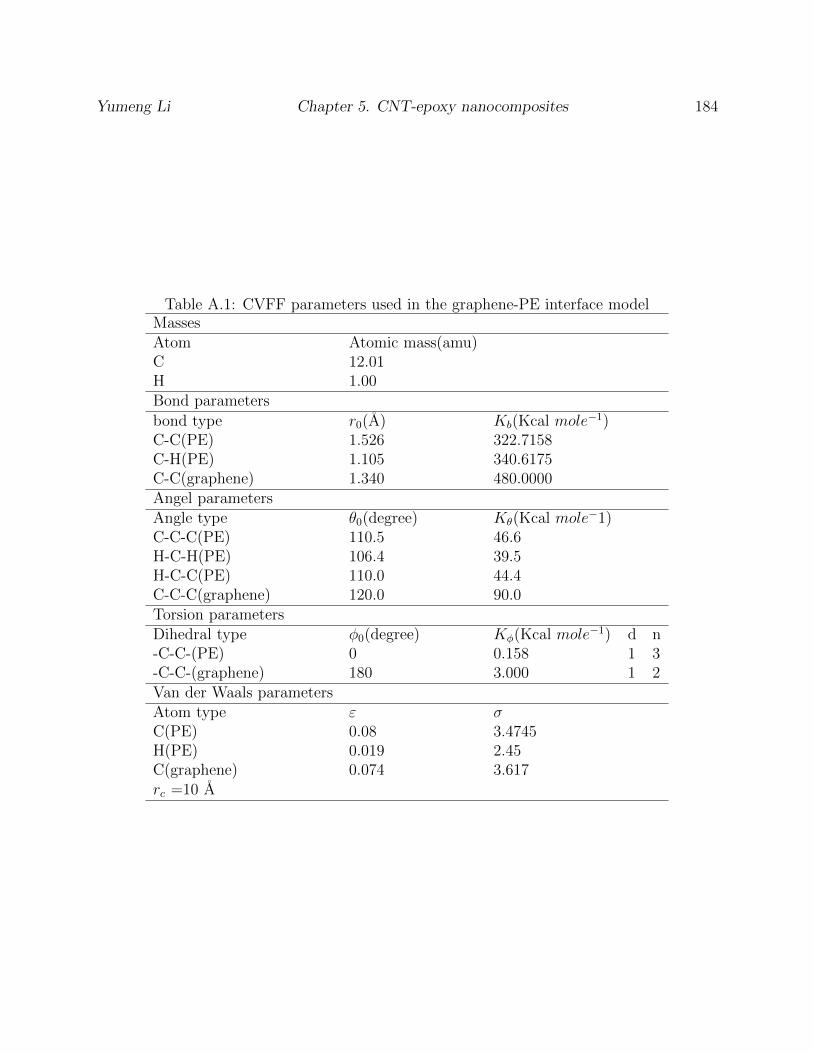
Yumeng Li Chapter 5. CNT-epoxy nanocomposites 184
Table A.1: CVFF parameters used in the graphene-PE interface modelMassesAtom Atomic mass(amu)C 12.01H 1.00Bond parameters
bond type r0(A) Kb(Kcal mole−1)C-C(PE) 1.526 322.7158C-H(PE) 1.105 340.6175C-C(graphene) 1.340 480.0000Angel parametersAngle type θ0(degree) Kθ(Kcal mole−1)C-C-C(PE) 110.5 46.6H-C-H(PE) 106.4 39.5H-C-C(PE) 110.0 44.4C-C-C(graphene) 120.0 90.0Torsion parametersDihedral type φ0(degree) Kφ(Kcal mole−1) d n-C-C-(PE) 0 0.158 1 3-C-C-(graphene) 180 3.000 1 2Van der Waals parametersAtom type ε σC(PE) 0.08 3.4745H(PE) 0.019 2.45C(graphene) 0.074 3.617rc =10 A
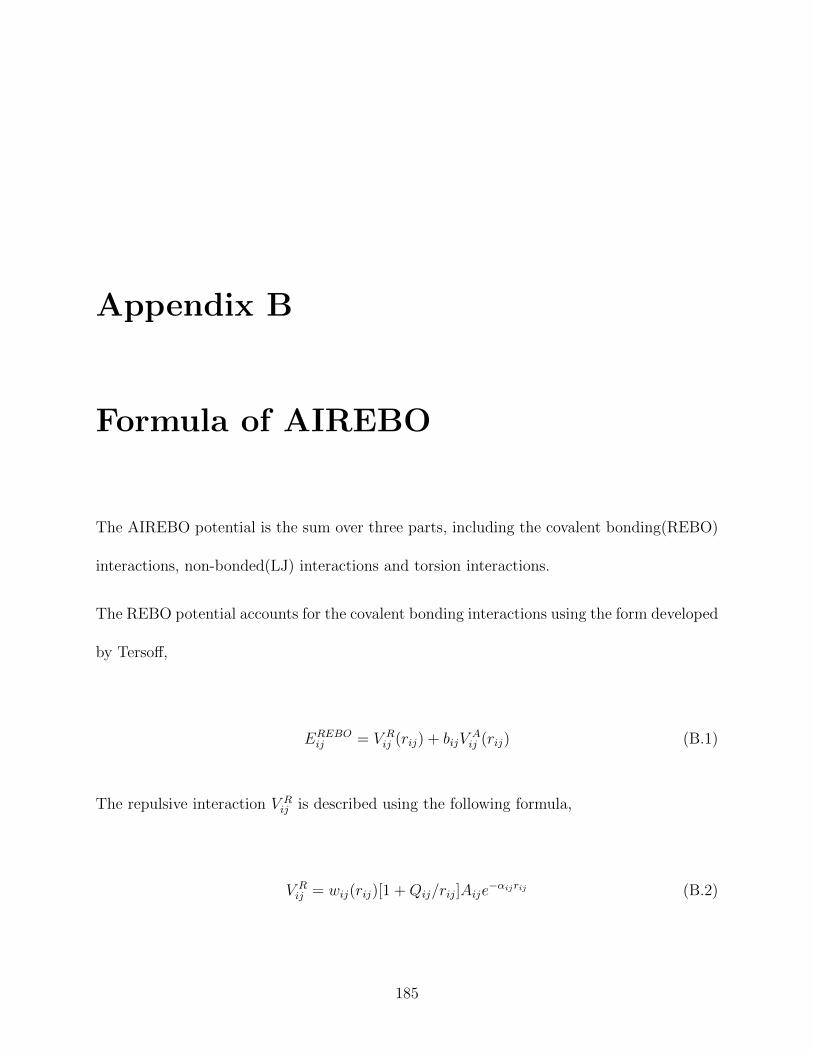
Appendix B
Formula of AIREBO
The AIREBO potential is the sum over three parts, including the covalent bonding(REBO)
interactions, non-bonded(LJ) interactions and torsion interactions.
The REBO potential accounts for the covalent bonding interactions using the form developed
by Tersoff,
EREBOij = V R
ij (rij) + bijVAij (rij) (B.1)
The repulsive interaction V Rij is described using the following formula,
V Rij = wij(rij)[1 +Qij/rij]Aije
−αijrij (B.2)
185
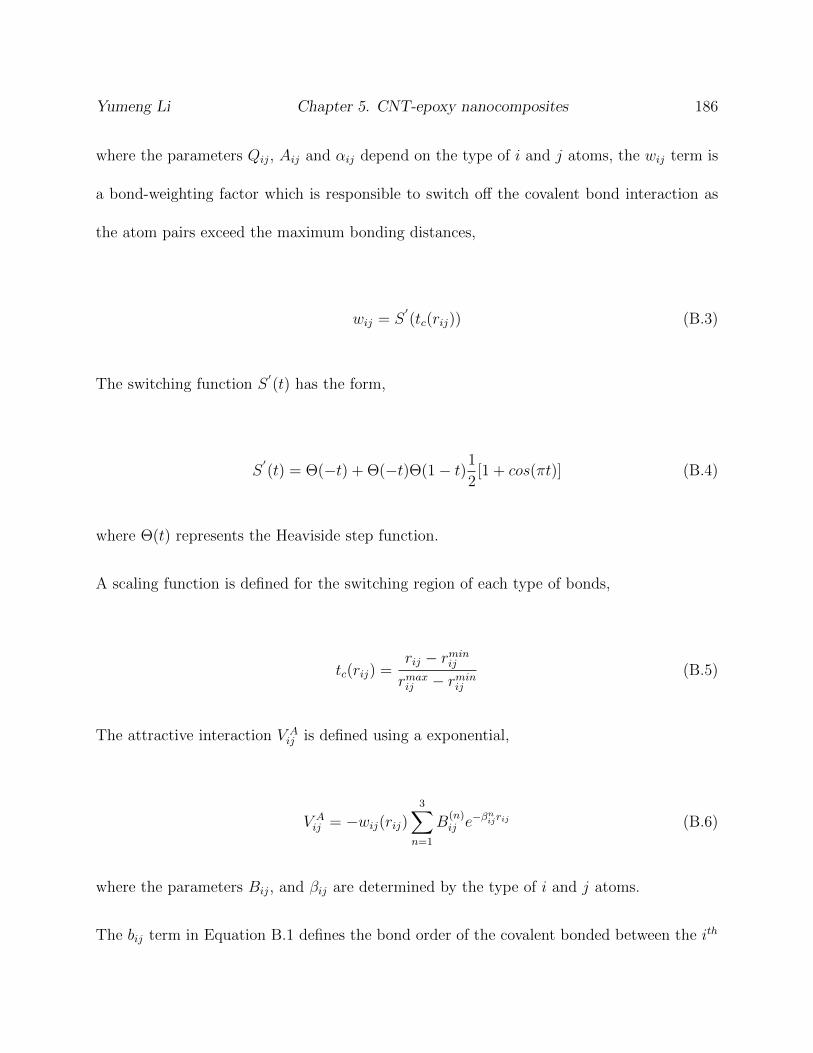
Yumeng Li Chapter 5. CNT-epoxy nanocomposites 186
where the parameters Qij, Aij and αij depend on the type of i and j atoms, the wij term is
a bond-weighting factor which is responsible to switch off the covalent bond interaction as
the atom pairs exceed the maximum bonding distances,
wij = S′(tc(rij)) (B.3)
The switching function S′(t) has the form,
S′(t) = Θ(−t) + Θ(−t)Θ(1− t)1
2[1 + cos(πt)] (B.4)
where Θ(t) represents the Heaviside step function.
A scaling function is defined for the switching region of each type of bonds,
tc(rij) =rij − rminij
rmaxij − rminij
(B.5)
The attractive interaction V Aij is defined using a exponential,
V Aij = −wij(rij)
3∑n=1
B(n)ij e
−βnijrij (B.6)
where the parameters Bij, and βij are determined by the type of i and j atoms.
The bij term in Equation B.1 defines the bond order of the covalent bonded between the ith
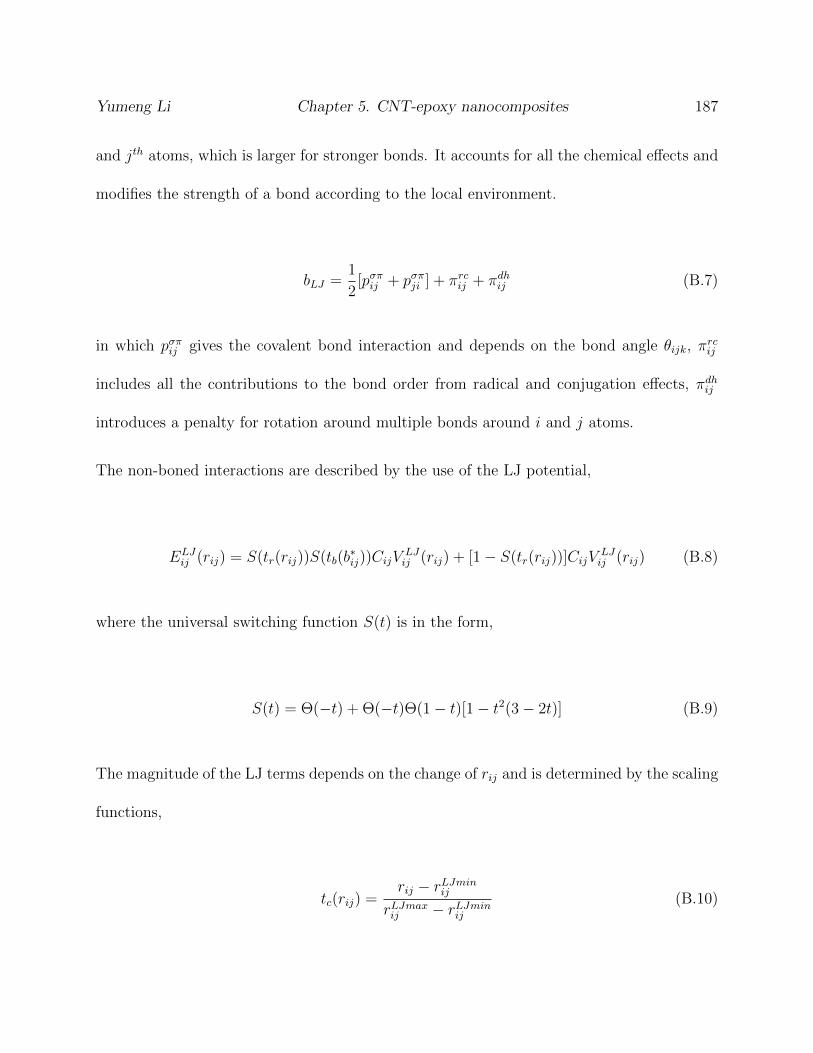
Yumeng Li Chapter 5. CNT-epoxy nanocomposites 187
and jth atoms, which is larger for stronger bonds. It accounts for all the chemical effects and
modifies the strength of a bond according to the local environment.
bLJ =1
2[pσπij + pσπji ] + πrcij + πdhij (B.7)
in which pσπij gives the covalent bond interaction and depends on the bond angle θijk, πrcij
includes all the contributions to the bond order from radical and conjugation effects, πdhij
introduces a penalty for rotation around multiple bonds around i and j atoms.
The non-boned interactions are described by the use of the LJ potential,
ELJij (rij) = S(tr(rij))S(tb(b
∗ij))CijV
LJij (rij) + [1− S(tr(rij))]CijV
LJij (rij) (B.8)
where the universal switching function S(t) is in the form,
S(t) = Θ(−t) + Θ(−t)Θ(1− t)[1− t2(3− 2t)] (B.9)
The magnitude of the LJ terms depends on the change of rij and is determined by the scaling
functions,
tc(rij) =rij − rLJminij
rLJmaxij − rLJminij
(B.10)
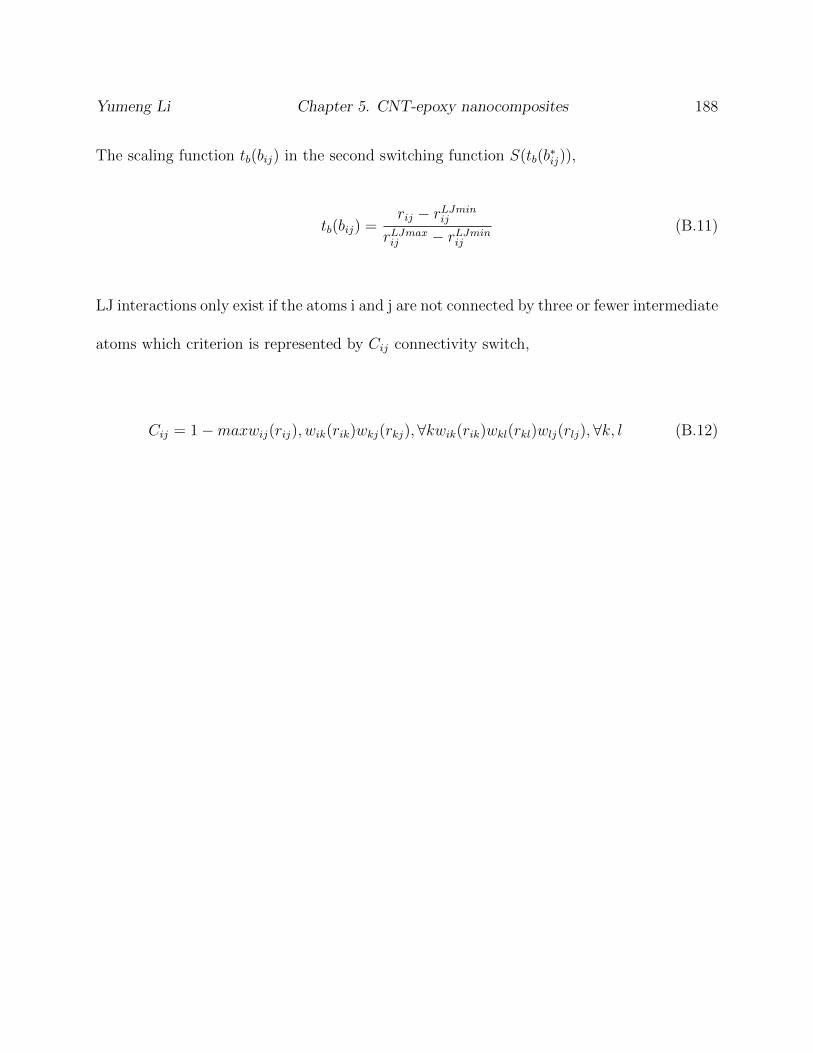
Yumeng Li Chapter 5. CNT-epoxy nanocomposites 188
The scaling function tb(bij) in the second switching function S(tb(b∗ij)),
tb(bij) =rij − rLJminij
rLJmaxij − rLJminij
(B.11)
LJ interactions only exist if the atoms i and j are not connected by three or fewer intermediate
atoms which criterion is represented by Cij connectivity switch,
Cij = 1−maxwij(rij), wik(rik)wkj(rkj), ∀kwik(rik)wkl(rkl)wlj(rlj), ∀k, l (B.12)