Embed Size (px)
Citation preview

Biophysical Letter
Multiplexed Dynamic Imaging of Genomic Lociby Combined CRISPR Imaging and DNASequential FISH
Yodai Takei,1 Sheel Shah,1,2 Sho Harvey,3 Lei S. Qi,4,5,6 and Long Cai3,*1Division of Biology and Biological Engineering, California Institute of Technology, Pasadena, California; 2UCLA-Caltech Medical ScientistTraining Program, David Geffen School of Medicine, University of California at Los Angeles, Los Angeles, California; 3Division of Chemistryand Chemical Engineering, California Institute of Technology, Pasadena, California; 4Department of Bioengineering, 5Department of Chemicaland Systems Biology, and 6ChEM-H, Stanford University, Stanford, California
ABSTRACT Visualization of chromosome dynamics allows the investigation of spatiotemporal chromatin organization and itsrole in gene regulation and other cellular processes. However, current approaches to label multiple genomic loci in live cells havea fundamental limitation in the number of loci that can be labeled and uniquely identified. Here we describe an approach we call‘‘track first and identify later’’ for multiplexed visualization of chromosome dynamics by combining two techniques: CRISPR im-aging and DNA sequential fluorescence in situ hybridization. Our approach first labels and tracks chromosomal loci in live cellswith the CRISPR-Cas9 system, then barcodes those loci by DNA sequential fluorescence in situ hybridization in fixed cells andresolves their identities. We demonstrate our approach by tracking telomere dynamics, identifying 12 unique subtelomericregions with variable detection efficiencies, and tracking back the telomere dynamics of respective chromosomes in mouseembryonic stem cells.
The three-dimensional chromatin organization in the nu-cleus plays an important role in gene regulation and othercellular processes (1,2). Visualizing spatiotemporal chro-matin organization helps to interrogate its relationshipwith biological functions. Recently developed CRISPR im-aging techniques can be a powerful and versatile tool tolabel and track genomic loci in live mammalian cells(3,4), supplementing dynamics to the static informationfrom fluorescence in situ hybridization (FISH) in fixed cells.One of the challenges of live cell imaging of genomic loci isimaging multiple loci simultaneously in individual cells. Toovercome this issue and enable multicolor CRISPR imag-ing, several methods have been developed by using orthog-onal CRISPR-Cas9 systems (5,6) or engineered single guideRNA (sgRNA) scaffolds (7–9). However, even thesemethods only allow the simultaneous imaging of two orthree loci. More recently, the color barcoding approach,using engineered sgRNA scaffolds recruiting different com-binations of spectrally distinct fluorescent proteins, hasdemonstrated simultaneous imaging of six chromosomalloci in single cells (10). Although these multicolor ap-
Submitted January 30, 2017, and accepted for publication March 23, 2017.
*Correspondence: [email protected]
Editor: Antoine van Oijen.
http://dx.doi.org/10.1016/j.bpj.2017.03.024
� 2017 Biophysical Society.
This is an open access article under the CC BY-NC-ND license (http://
creativecommons.org/licenses/by-nc-nd/4.0/).
proaches have expanded the potential of CRISPR imaging,they have a fundamental bottleneck in multiplexing due tothe limited number of available orthogonal CRISPR-Cas9systems, sgRNA scaffolds, or fluorescent proteins withspectrally distinct fluorophores.
Here we propose, to our knowledge, a new approach to la-bel and distinguish multiple genomic loci using the combi-nation of CRISPR imaging and DNA sequential FISH (DNAseqFISH), which provides large multiplexing capabilities.The principle of our approach is illustrated in Fig. 1. Multi-ple genomic loci are labeled with the CRISPR-Cas9 systemall in a single color, and tracked in individual live cells. Atthe end of the live recording, cells are fixed and the identityof each locus is resolved by the color barcodes from DNAseqFISH. In this manner, even if the identities of labeledloci are indistinguishable during the live recording, aslong as their positions are distinctly tracked in live imaging,these chromosomal loci can be subsequently identified withDNA seqFISH.
This ‘‘track first and identify later’’ approach can circum-vent the multiplexing limitations of live cell imaging. As aproof-of-principle, we applied our technique to track telo-meric loci in live mouse embryonic stem (mES) cells, anduniquely assigned 12 telomeric loci to particular chromo-somes by performing DNA seqFISH of distal subtelomericregions after the live tracking (Fig. 2 A).
Biophysical Journal 112, 1773–1776, May 9, 2017 1773

FIGURE 1 Schematic of the ‘‘track first
and identify later’’ approach with the com-
bination of the CRISPR labeling and DNA
seqFISH techniques. Nine regions in one
chromosome are illustrated in this sche-
matic. Each chromosomal position can be
identified from the DNA seqFISH step and
its motion can be backtracked from the
live imaging. To see this figure in color,
go online.
Takei et al.
To observe the dynamics of telomeric loci in live mEScells, we generated a mES cell line stably expressing Strep-tococcus pyogenes nuclease-deactivated Cas9 (dCas9) fusedto EGFP (dCas9-EGFP) and sgRNA targeting telomeric lociby following a previous study (3). The dCas9-EGFP proteincarried two nuclear localization signals for proper nuclearimport. The mouse telomeric loci are �20–30 kb with a6-bp repeat sequence TTAGGG (4), which potentially al-lows the recruitment of hundreds of dCas9-EGFP proteinsper locus with a single 22-nt sgRNA sequence (3). Usingthe clonal line, we performed live imaging over 6 min(Figs. 2 B and S1 and Movie S1), and tracked the dynamicsof telomeric loci in three-dimensional space.
Immediately after the live tracking, cells were fixed andprocessed for DNA seqFISH (Fig. 2, B–E). We quantifiedthe number of telomeric dots (Fig. 2 F) and observed thaton average, 73.0% of telomeric dots at the last frame ofthe live tracking were uniquely assigned to telomeric dotsafter the fixation (Fig. 2 G), indicating that the majority ofthe dCas9-EGFP labeled loci do not move significantlybefore and during fixing. Subtelomeric regions in respectivechromosomeswere barcoded based on a sequential barcodingmethodwe demonstrated previouslywith RNAFISH (11,12).With thismethod, the number of loci that can be distinguishedscales as FN, where F is the number of distinct fluorophoresand N is the number of hybridization rounds. Each subtelo-meric region was targeted with a set of FISH probes labeledwith a single fluorophore during each round of hybridization.Specifically, the primary probes targeting the genomic locialso contain overhang sequences that are unique to each locus.A set of adaptor probes that are dye-labeled are hybridized tothe overhang sequences (Fig. S2 A). We imaged cells, andthen treated them with 70% formamide solution to displacethe adaptor probes (Fig. S2).We imaged cells again to confirm
1774 Biophysical Journal 112, 1773–1776, May 9, 2017
the probe displacement, and subsequent rounds of hybridiza-tions were performed (Fig. S2,B andC). To cover 12 subtelo-meric regions (Table S1), we used three dyes and three roundsof hybridizations (Fig. 2 D). We also used a fourth roundof hybridization to image telomeres with DNA FISH(Fig. 2 E), and three different subtelomeric regions indepen-dently in a single channel as a control to quantify barcodingefficiency (Figs. S3 and S4 A).
We quantified 12 regions that were detected robustly inmost cells with a mean of 1.9 5 0.5 dots (5SD) per cell(Fig. S5 and Supporting Materials and Methods). Consistentwith our targeting of 12 distal subtelomeric regions out of atotal of 40 distal and proximal subtelomeric regions, weobserved that 22.9% of the dCas9-EGFP-labeled telomerespots corresponded to subtelomeric regions barcoded byDNA seqFISH (Fig. 2 G). Similarly, we observed 20.0% oftelomere DNA FISH spots corresponded to subtelomereDNA seqFISH spots (Fig. S4 B). We note that we do notexpect the telomeres and subtelomeres to colocalize perfectlybecause they can be genomically distant (Fig. S4A; Table S1).We quantified the distribution of the distance between alignedtelomeric and subtelomeric spots (Fig. S4 C).
From the barcode uniquely assigned to each subtelomericregion, we assigned a unique identity to each tracked regionin the live recording. To document the differences oftelomeric dynamics from each chromosome, we thenanalyzed the movements of telomeres assigned to each chro-mosome (Fig. 2 H) and quantified their cumulative squaredisplacements of adjacent time frames as a function oftime (Fig. 2 I). We also provided multiple quantified tracesfrom additional single cells (Fig. S6).
Based on a calculation of the optical space availablein a mammalian nucleus, the single color method couldin principle track and identify a larger number of loci

FIGURE 2 Multiplexed telomere tracking and identification of chromosomes with the ‘‘track first and identify later’’ approach in mES
cells. (A) Schematic of the approach applied to telomere in a mouse chromosome. Proximal and distal telomere were labeled by the
CRISPR-Cas9 systemwhereasonly the distal subtelomeric regionwas labeledbyDNAseqFISH. In total, 12 distal subtelomeric regions
in12chromosomeswere robustly readoutbyDNAseqFISH. (BandC) Here,weshowone-color telomere imaging in livecells atdifferent
time points (B) and after fixing cells (C), using the constructedmES cell line. (D and E) Composite digitized three-color (Alexa 647: red,
Alexa 594: green and Cy3B: yellow) DNA seqFISH data for three rounds of hybridizations targeting subtelomeric regions (D), and one-
color (Cy7)data for the fourthhybridization targeting telomeres (E) is given.Basedon thebarcode identities, chromosomenumbersare
assigned to each of the subtelomeric spots (D). Note that DNA seqFISH spots do not perfectly colocalize with CRISPR imaging spots
because they target adjacent regions in thegenome.Dotswithout colocalizationbetweenhybridizationsaredue tononspecificbinding
of probesormishybridization in the cells. Images aremaximum intensity projectionsof a z-stackof fluorescence images and the boxed
region of the cell is magnified (B–E). (F) Here, we compare the number of telomeric or subtelomeric spots detected per cell with the
CRISPR labelingandDNAseqFISHmethods. In total, 938CRISPRspots in live cells (last frameof themovie), 1138CRISPRspots infixed
cells, 909 telomeric spots by DNA FISH, and 628 subtelomeric spots by DNA seqFISH in 28 cells were analyzed. (G) Here, we compare
colocalization percentage of spots detected per cell. (Red dashed lines) Expected colocalization percentage per cell is given. (H) Tra-
jectories of telomeric loci in themagnified cell are shown. In this cell, 30 telomeric trajectorieswere detected fromCRISPR imaging and
10 of these trajectories were uniquely assigned to particular chromosomes based on the subtelomere color barcodes. Trajectories of
three loci in the magnified images (B)–(E) were also highlighted as xy projections (inset). Projected trajectories start from (0.0, 0.0).
(I) Cumulative square displacement traces (n ¼ 30) calculated with two adjacent frames as a function of time from the magnified cell
are shown. Traces of three loci in the magnified images (B)–(E) were shown as colored traces. To see this figure in color, go online.
Biophysical Letter
(Supporting Materials and Methods) to provide a valuableglobal view of the chromosomes in single cells.
However, there are a few key technological bottleneckspreventing large numbers of loci to be imaged in this fashion.Firstly, targeting nonrepetitive regions requires the delivery ofa substantial number of distinct sgRNAs to cells. Futureworkwill be focused on ameliorating this limitation as recentlydemonstrated with a single chromosome painting in live cellsby targeting nonrepetitive regions (13). As an alternative toreduce the number of sgRNAs, sets of sgRNAs targetingregion-specific repetitive DNAs (10) can be used, while adja-
cent nonrepetitive unique regions or repeat regions them-selves can be targeted by DNA seqFISH. In addition,engineering cell lines, which contain multiple target sitesrandomly integrated in the genome (14), can be an alternativeapproach to label a large number of genomic regions with asmall number of sgRNAs in live cells. The integrated regionscan be sequenced (14), targeted, and distinguished by DNAseqFISH. This approach is also applicable to other labelingmethods such as the LacI-LacO system. Secondly, physicalinteractions of distinct loci during the live tracking can pre-vent accurate position tracking and thus reduce the number
Biophysical Journal 112, 1773–1776, May 9, 2017 1775

Takei et al.
of uniquely tracked loci per cell, which can be minimized byusing multicolor CRISPR imaging (5–10). However, long-term tracking (i.e., beyond a cell-cycle) can be difficult dueto the large-scale rearrangement and crossovers of chromo-somes during mitosis. Lastly, DNA FISH signals can beimproved with a robust signal amplification method such assingle molecule hybridization chain reaction (12,15) or alter-nativeDNAFISHmethods such as CASFISH (16) to increasethe detection efficiency.
The key idea in our work is separating the tasks of dynamictracking of chromosomal loci and the unique identification ofthese loci. Previous works in multiplexed CRISPR imagingtried to accomplish bothgoals at the same time,which requiresorthogonal Cas9 systems and multiple fluorophores for liveimaging. In our approach, we use a single color channel to firsttrack the motion of the chromosomal loci and then use highlymultiplexed DNA seqFISH to identify the loci. In additionto the original seqFISH implementation (11), this strategyis another manifestation of the ‘‘noncommutative’’ approach(17,18) to experimental design that breaks experimental goalsinto distinct tasks and combines them to accomplish whatcannot be easily achieved in a single experimental step. Ourmethod combines advantages of CRISPR labeling andseqFISH for multiplexed live cell detection of genomic loci.During preparation of this article, a similar strategy wasdescribed by Guan et al. (19). Finally, we note that ourmethod can also be combined with sequential RNA FISH(11,12,18,20) and immunofluorescence to correlate transcrip-tional and epigenetic states of individual cells with spatiotem-poral chromosomal organization in a highly multiplexedmanner.
SUPPORTING MATERIAL
SupportingMaterials andMethods, six figures, one table, and one movie are
available at http://www.biophysj.org/biophysj/supplemental/S0006-3495
(17)30343-0.
AUTHOR CONTRIBUTIONS
All authors reviewed and contributed to the writing of the manuscript. L.C.,
L.S.Q., and Y.T. designed the project. Y.T. and S.H. performed experiments.
S.S. wrote analysis codes. Y.T. and S.S. performed data analysis. L.C. su-
pervised the project.
ACKNOWLEDGMENTS
We thank James Linton for kindly providing cell line and plasmids, and Eric
Lubeck for help with probe designing.
Y.T. is supported by a Graduate Fellowship from the Nakajima Foundation.
L.C. is supported by the Allen Distinguished Investigator Award, and NIH
grant No. U01-EB 021240-01.
SUPPORTING CITATIONS
Reference (21,22) appear in the Supporting Material.
1776 Biophysical Journal 112, 1773–1776, May 9, 2017
REFERENCES
1. Gorkin, D. U., D. Leung, and B. Ren. 2014. The 3D genome in tran-scriptional regulation and pluripotency. Cell Stem Cell. 14:762–775.
2. Bustin, M., and T. Misteli. 2016. Nongenetic functions of the genome.Science. 352:aad6933.
3. Chen, B., L. A. Gilbert, ., B. Huang. 2013. Dynamic imaging ofgenomic loci in living human cells by an optimized CRISPR/Cas sys-tem. Cell. 155:1479–1491.
4. Anton, T., S. Bultmann,., Y. Markaki. 2014. Visualization of specificDNA sequences in living mouse embryonic stem cells with a program-mable fluorescent CRISPR/Cas system. Nucleus. 5:163–172.
5. Ma, H., A. Naseri,., T. Pederson. 2015. Multicolor CRISPR labelingof chromosomal loci in human cells. Proc. Natl. Acad. Sci. USA.112:3002–3007.
6. Chen, B., J. Hu, ., B. Huang. 2016. Expanding the CRISPR imagingtoolset with Staphylococcus aureus Cas9 for simultaneous imaging ofmultiple genomic loci. Nucleic Acids Res. 44:e75.
7. Shao, S., W. Zhang,., Y. Sun. 2016. Long-term dual-color tracking ofgenomic loci by modified sgRNAs of the CRISPR/Cas9 system. Nu-cleic Acids Res. 44:e86.
8. Fu, Y., P. P. Rocha, ., J. A. Skok. 2016. CRISPR-dCas9 and sgRNAscaffolds enable dual-colour live imaging of satellite sequences andrepeat-enriched individual loci. Nat. Commun. 7:11707.
9. Wang, S., J. H. Su,., X. Zhuang. 2016. An RNA-aptamer-based two-color CRISPR labeling system. Sci. Rep. 6:26857.
10. Ma, H., L. C. Tu, ., T. Pederson. 2016. Multiplexed labelingof genomic loci with dCas9 and engineered sgRNAs usingCRISPRainbow. Nat. Biotechnol. 34:528–530.
11. Lubeck, E., A. F. Coskun, ., L. Cai. 2014. Single-cell in situ RNAprofiling by sequential hybridization. Nat. Methods. 11:360–361.
12. Shah, S., E. Lubeck, ., L. Cai. 2016. In situ transcription profiling ofsingle cells reveals spatial organization of cells in the mouse hippocam-pus. Neuron. 92:342–357.
13. Zhou, Y., P. Wang,., X. S. Xie. 2017. Painting a specific chromosomewith CRISPR/Cas9 for live-cell imaging. Cell Res. 27:298–301.
14. Akhtar, W., J. de Jong, ., B. van Steensel. 2013. Chromatin positioneffects assayed by thousands of reporters integrated in parallel. Cell.154:914–927.
15. Shah, S., E. Lubeck,., L. Cai. 2016. Single-molecule RNA detectionat depth by hybridization chain reaction and tissue hydrogel embeddingand clearing. Development. 143:2862–2867.
16. Deng, W., X. Shi, ., R. H. Singer. 2015. CASFISH: CRISPR/Cas9-mediated in situ labeling of genomic loci in fixed cells. Proc. Natl.Acad. Sci. USA. 112:11870–11875.
17. Letsou, W., and L. Cai. 2016. Noncommutative biology: sequentialregulation of complex networks. PLOS Comput. Biol. 12:e1005089.
18. Frieda, K. L., J. M. Linton, ., L. Cai. 2017. Synthetic recordingand in situ readout of lineage information in single cells. Nature.541:107–111.
19. Guan, J., H. Liu, ., B. Huang. 2017. Tracking multiple genomic ele-ments using correlative CRISPR imaging and sequential DNA FISH.Biophys. J. 112:1077–1084.
20. Chen, K. H., A. N. Boettiger, ., X. Zhuang. 2015. RNA imaging.Spatially resolved, highly multiplexed RNA profiling in single cells.Science. 348:aaa6090.
21. Singer, Z. S., J. Yong,., M. B. Elowitz. 2014. Dynamic heterogeneityand DNA methylation in embryonic stem cells.Mol. Cell. 55:319–331.
22. Li, V. C., A. Ballabeni, and M. W. Kirschner. 2012. Gap 1 phase lengthand mouse embryonic stem cell self-renewal. Proc. Natl. Acad. Sci.USA. 109:12550–12555.
Biophysical Journal, Volume 112
Supplemental Information
Multiplexed Dynamic Imaging of Genomic Loci
by Combined CRISPR Imaging and DNA
Sequential FISH
Yodai Takei, Sheel Shah, Sho Harvey, Lei S. Qi, and Long Cai
SupportingMaterialfor
MultiplexedDynamicImagingofGenomicLocibyCombinedCRISPRImaging
andDNASequentialFISH
YodaiTakei1,SheelShah1,2,ShoHarvey3,LeiS.Qi4,5,6,andLongCai3,*1DivisionofBiologyandBiologicalEngineering,CaliforniaInstituteofTechnology,Pasadena,CA91125,USA2UCLA-CaltechMedicalScientistTrainingProgram,DavidGeffenSchoolofMedicine,UniversityofCaliforniaatLosAngeles,LosAngeles,CA90095,USA3DivisionofChemistryandChemicalEngineering,CaliforniaInstituteofTechnology,Pasadena,CA91125,USA4DepartmentofBioengineering,StanfordUniversity,Stanford,CA94305,USA5DepartmentofChemicalandSystemsBiology,StanfordUniversity,Stanford,CA94305,USA6ChEM-H,StanfordUniversity,Stanford,CA94305,USA
*Correspondence:[email protected]
MATERIALANDMETHODSProbedesignandsynthesisTelomere59-nucleotide(nt)probefromIntegratedDNATechnology(IDT)wasdesignedwitha35-nttargetingsequenceatthe3’end,a20-ntadaptersequenceforbindingofadye-coupledadapterprobe,anda4-ntspacerinbetween.Subtelomereprobesweredesignedandgeneratedbasedonarray-basedoligopoolsynthesiswithenzymaticamplifications(1,2)explainedbelow.Themm10mousegenomicsequence(UCSCGenomeBioinformatics)wasusedtodesignsubtelomereoligonucleotideprobepoolsinthisstudy.Toselectivelylabelsubtelomericgenomicregions,100kbregionsattheendofeachchromosomewereselected(TableS1).Acrossthoseregions,asetofnon-overlapping35-ntprobesweredesignedwhichsufficeseveralconstraintsincluding40-60%GCcontent,nomorethan5contiguousidenticalnucleotides,no“CCCTAA”or“TTAGGG”sequencestoexcludethepotentialbindingtotelomeres,andatleast2-ntspacesbetweenadjacentprobes.Offtargetsagainstthemm10mousegenomewerethenevaluatedusingBLAST+.Sequenceswith18ormorecontiguousbaseshomologoustootherregionsinthegenomeweredefinedasanofftargethere,andprobesthatcontained6ormoreoftheseofftargetswereinitiallyeliminated.Probestargetingidenticalsubtelomericregionswerethenevaluatedtogether,andiftheprobesetscontainedmorethan5off-targetswithin1Mbblocksofthegenome,probesweredroppedtolowerthethreshold.Iftheprobenumberinoneprobesetexceeded400,probeswerereducedupto400basedonGCcontent.Notethatprobesetstargetingsexchromosomeswerefailedtobedesigned.Inaddition,proximaltelomeresineachchromosomeislocatedadjacenttosatellite

regionsinthemousegenome,sotheseregionswerenotusedforprobedesigning.Asaresult,19subtelomereprobesetstargetingallmouseautosomeswerepooledtogetherinthisstudy(TableS1).Atthe5’endofthe35-ntprobesets,20-ntadaptersequences,whichareidenticalineachsubtelomereprobesetbutorthogonalamongdifferentprobesets,areattachedwitha4-ntspacerin-between.Forthearray-basedoligolibrarysynthesis,universalsequenceswereattachedateither5’or3’ends.ThosesequencesincludedKpnIandEcoRIrestrictionenzymesites,3-ntspacers,and20-ntforwardandreverseprimerbindingsequences.Intotal,thissubtelomereoligonucleotideprobepool(CustomArray)contained4709probeswith117nucleotideseach.Single-strandedDNAprobesweregeneratedfromthisarray-basedoligonucleotidepoolwithlimitedcyclePCR,invitrotranscription,reversetranscription,andrestrictionenzymedigestionofprimerbindingsites.CellcultureandcelllineconstructionE14cells(E14Tg2a.4)fromMutantMouseRegionalResourceCentersweremaintainedongelatin-coateddishesat37°Cwith5%CO2inGlasgowMinimumEssentialMedium(GMEM),10%FBS(HyClone,ThermoScientific),2mML-glutamine,100units/mlpenicillin,100μg/mlstreptomycin,1mMsodiumpyruvate,1000units/mlLeukemiaInhibitoryFactor(LIF,Millipore),1xMinimumEssentialMediumNon-EssentialAminoAcids(MEMNEAA,Invitrogen)and50μMβ-Mercaptoethanolasdescribedpreviously(3).AllconstructsusedinthisstudywereclonedintoPiggyBacvectors.TheexpressionvectorfordCas9-EGFPfromStreptococcuspyogeneswasconstructedbyinsertingdCas9-EGFP(pSLQ1658fromAddgene)rightaftertheelongationfactor1alpha(EF1α)promoter.FortheguideRNAexpressionvector,amouseU6promoterandsgRNAtargetingtelomereswereobtainedfrompSLQ1651(Addgene).Thevector,whichcontainedEF1α-NLS-HA-NLS-hmKO2(hmKO2fromAmalgaam),wasalsoconstructedandusedforcellidentificationbeforethelivetracking.TransfectionswereperformedwithFuGENEHDTransfectionReagent(Promega),andthecellswereselectedwithG418(ThermoScientific)andpuromycin(ThermoScientific)sequentially.Aftertheselection,singlecloneswereisolatedmanually,andstablelabelingoftelomereswasverifiedbyimaging.LivecellimagingCellswereplatedonfibronectin-coated24-wellglassbottomplates(MatTek)for2h,priortotheliveimaging.Themicroscope(NikonEclipseTi-E)wasequippedwithaCCDcamera(AndoriKon-M934),a60xoilobjectivelens(NikonNA1.40)andastage-topincubatorheldat37°C.SnapshotsofdCas9-EGFPwereacquiredwith10μmz-stackssteppingevery0.5μmat15timepointsover6min.Notethateachtimepointshowninthefigureandmoviewasthestartingtimeofthez-stacks.ThePerfectFocussystemofthemicroscopewasusedtoautomaticallycorrectfocusdriftduringimaging.ImageacquisitionwascontrolledwithMicro-Managersoftware.DNAFISHhybridizationandimagingImmediatelyafterthelivecellimaging,cellswerefixedin4%formaldehydefor10minatroomtemperature,washedthreetimeswith1xPBS,andimagedinananti-bleachingbuffer
consistingof20mMTris-HCl,50mMNaCl,0.8%glucose,saturatedtrolox,0.5mg/mlglucoseoxidase,andcatalaseatadilutionof1/1000(SigmaC3155).Cellswerethenpermeabilizedwith70%ethanolat-20°Covernight.Thefollowingday,cellsweretreatedwithaprechilledsolutionofmethanolandaceticacidata4:1ratioatroomtemperature,andthenwith0.1mg/mlRNaseA(ThermoScientific)for1hat37°C.Sampleswerethenwashedanddriedwith1xPBS,70%ethanoland100%ethanol.Thesampleswerethenheatedfor10minat95°Cin70%formamideand2xSSC.Cellswerehybridizedwiththetelomereandthesubtelomereprobepoolfor2daysat37°C,wherethefinalconcentrationofeachprobewasestimatedas10nMinnucleasefreewaterwith50%formamide,2xSSCand0.1g/mldextransulfate.Afterincubationwiththeprobes,cellswerewashedthreetimesin50%formamide,0.1%Triton-X100and2xSSCatroomtemperature,andhybridizedwith20-ntadapterprobesetscoupledtoAlexa594,647(Lifetech),Cy3BorCy7(GEHealthcare)at10nMfinalconcentrationforatleast1hatroomtemperatureinnucleasefreewaterwith30%formamide,2xSSCand0.1g/mldextransulfate.Cellswerewashedthreetimesin30%formamide,0.1%Triton-X100and2xSSCatroomtemperature,stainedwithDAPIandimagedinanti-bleachingbuffer.Probedisplacementandre-hybridizationFollowingtheimaging,cellswerewashedwith2xSSC,incubatedin70%formamideand2xSSCfor30minatroomtemperatureforprobedisplacement,andthenwashedthreetimeswith2xSSC.Tochecktheprobedisplacement,cellswerethenimagedwithallimagingchannelsinanti-bleachingbuffer.Sampleswerere-hybridizedwithanothersetofadapterprobesaccordingtotheconditionsdescribedabove,stainedwithDAPIagainandimagedinanti-bleachingbuffer.Fourroundsofhybridizationswerecarriedoutinthisstudy.Thefirstthreeroundsofhybridizationswereusedtobarcode18subtelomericregions,andthefinalroundwasusedtolabeltelomeresandalsotoverifytheidentitiesof3subtelomerebarcodesbyreadingout3subtelomericregionswitheachregionassignedtoasingleimagingchannel.DataanalysisDataanalysiswascarriedoutusingImageJ,MATLABandPython.Eachanalysisisdetailedbelow.PointtrackingCellsweresegmentedmanuallyusingtheImageJROItool.Thebackgroundwassubtractedfromthetime-lapseimagesusingImageJ’srollingballbackgroundsubtractionalgorithmwitharadiusof3pixels.ThisprocessingwasalsousedforMovieS1.Thepointsforlinkingineachtimepointwerefoundin3DusingaLOGfilterwithsubsequentlocalmaximafinding.ThethresholdforlocalmaximafindingwassetusingOtsu’smethodforthefirstframeandadjustedslightlyforsubsequentframessuchthatthenumberofdotsdetectedonlyvariedbylessthan5%.ThesepointswerelinkedintotrajectoriesusingtheSimpleTrackerfunctionavailableontheMATLABfileexchangewith'MaxLinkingDistance'setto5and'MaxGapClosing'setto0.Anytrajectorythatdidnothaveapointinallframeswasdiscarded.Everypointineveryremainingtrajectorywasthenfitwitha2DgaussianfunctionusingtheautoGuassianSurffunctionavailableontheMATLABfileexchangetoobtainthesubpixellocationofthepoint.Eachtrack

wasthenassignedtoasegmentedcell.Thecalculatedtrajectorieswerethencorrectedtoremovethemotionofthecellsandthemicroscopebysubtractingthemeandisplacementofallpointsinacellfromeachpointinthecellforeachtimepoint.Foreachtrajectory,thecumulativesquaredisplacementofadjacentframes(CSD)asafunctionoftimewascalculatedas
CSD(𝑛𝛿𝑡) = {[𝑥((𝑖 + 1)𝛿𝑡) − 𝑥(𝑖𝛿𝑡)]2 + [𝑦((𝑖 + 1)𝛿𝑡) − 𝑦(𝑖𝛿𝑡)]2 + [𝑧((𝑖 + 1)𝛿𝑡) − 𝑧(𝑖𝛿𝑡)]2}7
89:
wherenisthenumberofframes,δtisthetimeintervalbetweentwoadjacentframes(25s),x(t),y(t)andz(t)arethecoordinatesattimet.ImageprocessingforbarcodingBasicflowoftheimageprocessingforbarcodingfollowedourrecentstudy(2).Toremovetheeffectsofchromaticandsphericalaberrationsinxy,multispectralbeadswerefirstusedtocreategeometrictransformstoalignallfluorescencechannelsusingMATLAB’sfitgeotransfunction.Next,thebackgroundilluminationprofileofeveryfluorescencechannelwasmappedusingamorphologicalimageopeningwithalargestructuringelementonasetofimagesofanemptycoverslip.Themedianvalueofeverypixelforeverychannelofopenedimageswasdividedbythemaximumvaluetofindthedivisionfactorofeverypixelineverychannel.Theimageswerecorrectedusingtheresultingintensitymapandfinallytheimagesweretransformedtoremovechromaticaberrations.ThebackgroundsignalwasthensubtractedusingtheImageJrollingballbackgroundsubtractionalgorithmwitharadiusof3pixels.ImageregistrationTheprocessedimageswereregisteredbyfirsttakingamaximumintensityprojectionalongthezdirectionineachchannel.Allofthemaximumprojectionsofthechannelsinasinglehybridizationwerethencollapsed,resultingin3compositeimagescontainingallthepointsinaparticularroundofhybridization.Eachofthesecompositeimagesofhybridizations2-3werethenregisteredtohybridization1usinganormalizedcross-correlationalgorithmwiththepositionofthemaximaofthecross-correlationsignifyingthetranslationfactortoalignhybridizations2-3tohybridization1.MATLAB’snormxcorr2functionwasusedtoaccomplishthistask.Cross-correlationbetweentheDAPIimageswasusedtoregisterthefinalcontrolhybridizationtothebarcodinghybridizations.BarcodecallingThepotentialDNAFISHsignalswerethenfoundbyLOGfilteringtheregisteredimagesandfindingpointsoflocalmaximumpixelsaboveaspecifiedthresholdvaluefoundbyinspectionoftheaccuracyofdotsfoundataparticularthresholdvalue.Onceallpotentialpointsinallchannelsinallhybridizationswereobtained,dotswerematchedtopotentialbarcodepartnersin3Dwithallotherhybridizationsusinga√6pixelsearchradius(1or2pixelperonedirection)tofindsymmetricnearestneighborswithinthegivenradius.Barcodewordswerecreatedbyseedingthesearchwithpointsfromeachhybridization.Pointcombinationsthatconstructedonlyasinglebarcodewithagivenseedwereimmediatelymatchedtotheon-targetbarcode
set.Forpointsthatmatchedtoconstructmultiplebarcodes,firstthepointsetswerefilteredbycalculatingtheresidualspatialdistanceofeachpotentialbarcodepointsetandonlythepointsetsgivingtheminimumresidualswereusedtomatchtoabarcode.Ifmultiplebarcodeswerestillpossible,thepointwasmatchedtoitscloseston-targetbarcodewithahammingdistanceof1.Ifmultipleon-targetbarcodeswerestillpossible,thenthepointwasdroppedfromtheanalysisasanambiguousbarcode.Thisprocedurewasrepeatedusingeachhybridizationasaseedforbarcodefindingandbarcodewordsthatwerecalleduniquelyinallhybridizationswereusedintheanalysis.Thelocationofthesepointsthensignifiedthecorrespondingchromosomelocations.Forthebarcodeidentificationanalysisinthiscase,fittingwasnotperformedasthespotswerefairlysparseinanygivenchannelandthereforeweresinglydetectedandmatched.DotmatchingCRISPRlabeleddotsatthelastframeofthemovieandafterthefixation,subtelomericdotsbyDNAseqFISHandtelomericdotsbyDNAFISHwerematchedbyusingthesamematchingalgorithmdescribedinthebarcodecallingsection,withasmalldifferenceofusing6pixelsinxy.Inaddition,subtelomericdotsbyDNAseqFISHandsubtelomericdotsbysinglecolorDNAFISHreadoutsinhybridization4werematchedbyusingthesamealgorithmwithmorestringentmatchingconditionofwithin3pixels.Notethatcellsdetectedwithmorethan10CRISPRlabeledspotsatthelastframeofthemoviewerefurtheranalyzedduetotheheterogeneityofCRISPRlabelingefficiencyinsinglecells,andonlycellswithincenterfieldsofviewwereanalyzedtominimizetheeffectofunevenillumination.

SupportingTextNumberoftelomericandsubtelomericspotsBasedonthecellcycledistributioninamEScellpopulation,weestimatedthedetectionefficiencyoftelomericandsubtelomericspots.TypicalcellcycledistributionofmEScellsis20%cellsinG1,50%cellsinSand30%cellsinG2/Mphase(4).Giventhenumberofchromosomallociis2inG1,3inSand4inM/S2phase,thenumberofspotsexpectedpereachregionis3.1percell.Weobserved33.5±13.8and40.6±13.8(mean±standarddeviation)CRISPRlabeleddotspercellinlive(lastframeofthemovie)andfixedcells,whichcanbeestimatedas27.0±11.1%and32.7±11.1%detectionefficiencyoftelomericspots.Thisindicatesarelativelylowefficiencyoflabelinginourexperiment,whichcanbeimprovedwithfurthercelllineengineeringasshowninpreviouspublications.NotethatwedetectedmoreCRISPRlabeledspotsinfixedcellscomparedtothoseinlivecellsbecauseoflongerimagingexposuretimeforfixedcells.WealsonotethatweusedexposuretimesthatallowedustotrackCRISPRlabeledlociovertimewithoutsignificantphotobleaching.However,westillobservedthatthenumberofspotsdetectedabovethethresholddecreasedduringthetime-lapsemovie,becauseofphotobleaching(Fig.S1A). Similarly,DNAFISHofthetelomeresshowed32.5±7.6dotspernucleiand26.2±6.1%detectionefficiencyoftelomericspots.Therelativelylowcolocalizationefficiency(49.1%)oftelomericspotsbyCRISPRlabelingandDNAFISH(Fig.S4B)canbecausedbythelowlabelingefficienciesestimatedabove. Ontheotherhand,fromourbarcodingresults,theaveragenumberofsubtelomericspotspercellwas1.9±0.5,andtheDNAseqFISHefficiencyofsubtelomericregionscanbeestimatedas61.3±16.1%.
OpticalspaceestimationinnucleusOpticalspaceforsingle-colorCRISPRlabelinginasinglenucleuscanbeestimatedbasedonourrecentstudy(2).Theestimationiscalculatedas
𝑁 = 𝐹𝑉
(3𝑝)2𝑍
whereNisthemaximumnumberofunambiguousCRISPRlabeledspotsinasinglenucleus,FisthenumberofchannelusedforCRISPRimaging,Visthevolumeofasinglenucleusinmicrons,pμmisthephysicalsizeofapixelandZμmistheresolutioninthezdirection.Inourexperimentalcondition,asinglenucleuscanaccommodateatleast1000CRISPRlabeledspotsbyapplyingasinglefluorescentchannel,thephysicalpixelsize0.3μm,zresolution0.5μmandthevolumeofmEScellnucleusas10μmx10μmx5μm.ThenumberofCRISPRlabeledspots,whichcanbeuniquelyidentifiedbyDNAseqFISHinasinglenucleus,arereducedwiththeopticalspaceconstraintarisingfromtheincompletecolocalizationbetweentwolabelingmethods.Undersuchconditions,theestimationisupdatedas
𝑁A = 𝐹𝑉(𝑟𝑝)³
whereNbisthemaximumnumberofunambiguousCRISPRlabeledspotsidentifiedbyDNAseqFISHinasinglenucleusandristhemaximumsearchingpixelsizepersingledirectionfordot

matching.Giventhesameassumptionabovewith5pixeldiametersearch,asinglenucleuscanaccommodatearound150CRISPRlabeledspotsthatcanbeuniquelyidentifiedbyDNAseqFISH.NotethatthenumberofuniquelyidentifiedlocicanbelinearlyscaledupwiththeincreaseoffluorescentchannelsavailablefortheCRISPRimaging.

SupportingTablesChrom Start End Strand Probe
numberSequencegap(bp)
hyb1 hyb2 hyb3 hyb4
chr1 195271955 195371955 + 189 8371 3 3 3
chr2 181913208 182013208 + 159 11144
chr3 159839664 159939664 + 400 638 2 3 2
chr4 156208115 156308115 + 400 152242 4 2 2
chr5 151634668 151734668 + 400 268 1 1 3
chr6 149536530 149636530 + 272 50346 1 3 1
chr7 145241443 145341443 + 400 542 1 3 2
chr8 129101212 129201212 + 100 115103 4 1 3
chr9 124395094 124495094 + 341 6138 1 1 2 3
chr10 130494977 130594977 + 105 752 3 4 2
chr11 121832542 121932542 + 186 50093 2 1 2
chr12 119929006 120029006 + 400 688 4 1 2 1
chr13 120221623 120321623 + 126 960 3 1 2
chr14 124702228 124802228 + 179 727 4 2 1
chr15 103843669 103943669 + 187 112 2 1 1
chr16 98007752 98107752 + 115 8793 1 2 2
chr17 94787255 94887255 + 105 726 2 1 3
chr18 90502623 90602623 + 400 1355 1 2 1 2
chr19 61231550 61331550 + 245 611 2 2 2
TableS1:Subtelomericregioncoordinatesinmm10mousegenome,numberofprimaryprobes,sequencegapbetweentelomereandtargetedsubtelomericregion,andbarcodingcolorcombinationsusedinthisstudy.Sequencegapwascalculatedasthelengthbetweendistaltelomerecoordinateannotatedandthemostadjacentsubtelomericprobeineachchromosome.Duetotheofftargets,chromosome2probesetwasnotincludedintheDNAseqFISH.Cy3B,Alexa594,647andCy7dyecoupledadapterprobescorrespondtothenumbers1,2,3and4inthelast4columns.Finally,12subtelomericregions(chr1,3,5,6,7,9,13,15,16,17,18and19)werereadoutrobustly.
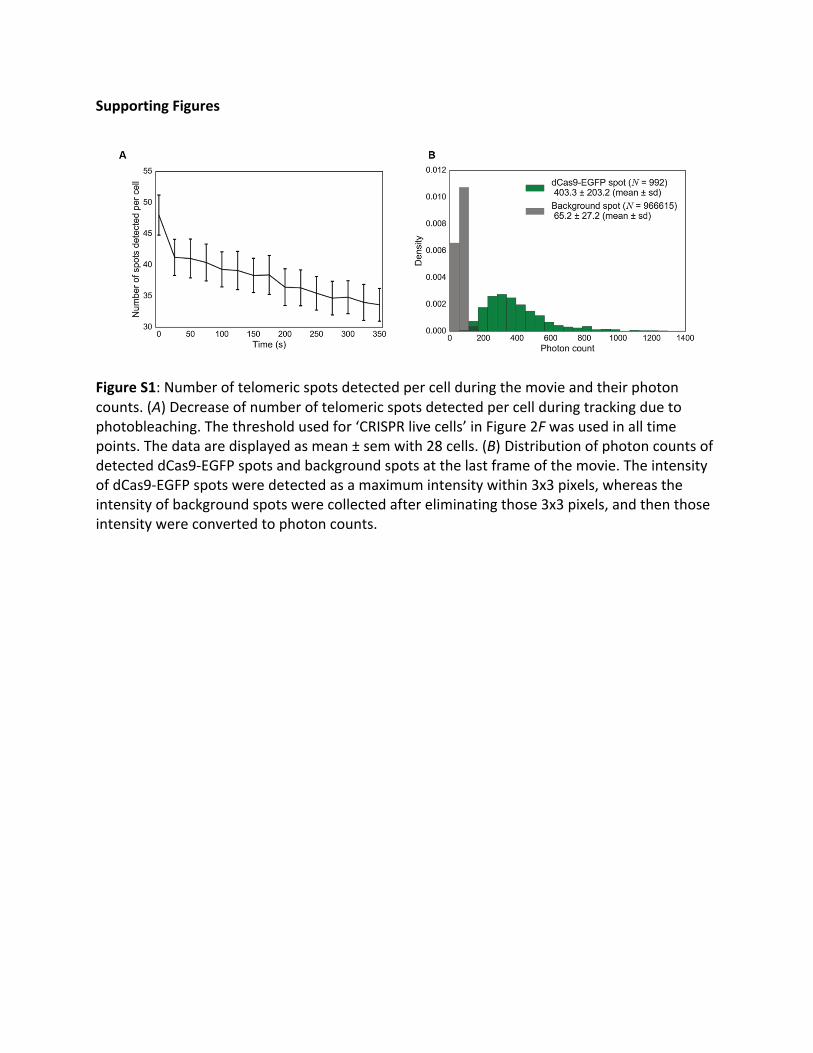
SupportingFigures
FigureS1:Numberoftelomericspotsdetectedpercellduringthemovieandtheirphotoncounts.(A)Decreaseofnumberoftelomericspotsdetectedpercellduringtrackingduetophotobleaching.Thethresholdusedfor‘CRISPRlivecells’inFigure2Fwasusedinalltimepoints.Thedataaredisplayedasmean±semwith28cells.(B) DistributionofphotoncountsofdetecteddCas9-EGFPspotsandbackgroundspotsatthelastframeofthemovie.TheintensityofdCas9-EGFPspotsweredetectedasamaximumintensitywithin3x3pixels,whereastheintensityofbackgroundspotswerecollectedaftereliminatingthose3x3pixels,andthenthoseintensitywereconvertedtophotoncounts.
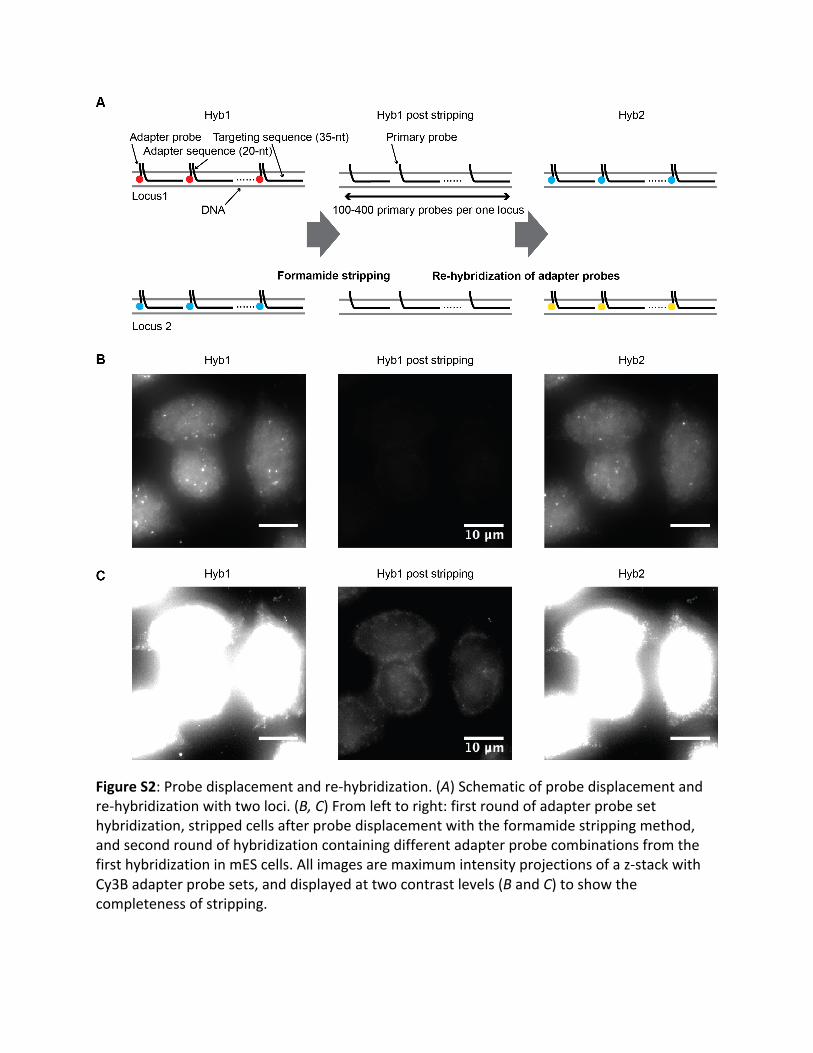
FigureS2:Probedisplacementandre-hybridization.(A)Schematicofprobedisplacementandre-hybridizationwithtwoloci.(B,C)Fromlefttoright:firstroundofadapterprobesethybridization,strippedcellsafterprobedisplacementwiththeformamidestrippingmethod,andsecondroundofhybridizationcontainingdifferentadapterprobecombinationsfromthefirsthybridizationinmEScells.Allimagesaremaximumintensityprojectionsofaz-stackwithCy3Badapterprobesets,anddisplayedattwocontrastlevels(BandC)toshowthecompletenessofstripping.

FigureS3:ComparingsinglecolorDNAFISHreadouts(hybridization4)andDNAseqFISHcolorbarcoding(hybridizations1-3)inmEScells.Imagesaremaximumprojectionsofaz-stack.Boxedregionsintheleftfigurearemagnifiedandcorrespondingregionsinhybridizations1-4aredisplayed.EachcolorrepresentsAlexa647(red),Alexa594(green),Cy3B(yellow)andDAPI(blue),respectively.Imageswithhybridizations1-3aredigitizedbasedonthebarcodecallingresults.Dotsappearinginhybridizations1-3imagesotherthanthedotscolocalizedtothehybridization4aredotscorrespondingtootherbarcodesornonspecificbinding.Weobservedthatwiththechromosome9subtelomericregion,78.7%ofthesinglecolorlabeledlociinthefourthhybridization(53spotsanalyzed)colocalizedwiththebarcodedloci(53spotsanalyzed),whereaswiththechromosome18subtelomericregion,73.7%ofthesinglecolorlabeledlociinthefourthhybridization(92spotsanalyzed)colocalizedwiththebarcodedloci(75spots),indicatingbarcodesdecodedefficientlyinourexperiments.Notethatthechromosome12subtelomericregionwasexcludedfromthisanalysisduetotheinsufficientsignalfromtheCy7dyeinDNAseqFISH.

FigureS4:ColocalizationbetweentelomericandsubtelomericspotsandtheirdistributioninmEScells.(A)Imagesaremaximumintensityprojectionsofaz-stackoffluorescenceimagescorrespondingtothefourthhybridizationoftheDNAseqFISH.Theboxedregionsaremagnified,andtelomeric(red)andsubtelomeric(green)regionsaremerged.Notethattelomericandsubtelomericregionsdonotcolocalizeperfectlybecausetargetedtelomericregionsarenon-uniquerepetitiveregionswhereastargetedsubtelomericregionsareadjacentuniqueregionsoverarangeof100kb.NotethatsequencespacesbetweentelomericandsubtelomericregionsareprovidedinTableS1.(B)Comparingcolocalizationpercentageofspotsdetectedpercell.Reddashedlinesrepresentexpectedcolocalizationpercentagepercell.(C)Distributionofxy-distancebetweenalignedtelomereCRISPRspots,subtelomereDNAseqFISHspotsandtelomereDNAFISHspots.Meanandstandarddeviationofthedistanceundereachconditionwereprovided.

FigureS5:Numberofsubtelomericspotspercellresolvedbythecolorbarcodingwiththreeroundsofhybridizations.Intotal,678subtelomericspotsin28cellswereanalyzed.Blackcirclesrepresentmeannumberofspotspercell.Duetothelowdetectionefficiencies,6subtelomericregions(chr14,chr11,chr4,chr12,chr8andchr10)wereexcludedfromtheanalysis.ThiscouldbecausedbyinefficientbindingofprimaryprobesetsorinsufficientsignalfromCy7fluorophoresas5outofthose6subtelomericregionscontainedCy7intheircode.Onaverage,thenumberofsubtelomericspotspercellwas1.9±0.5(mean±standarddeviation).
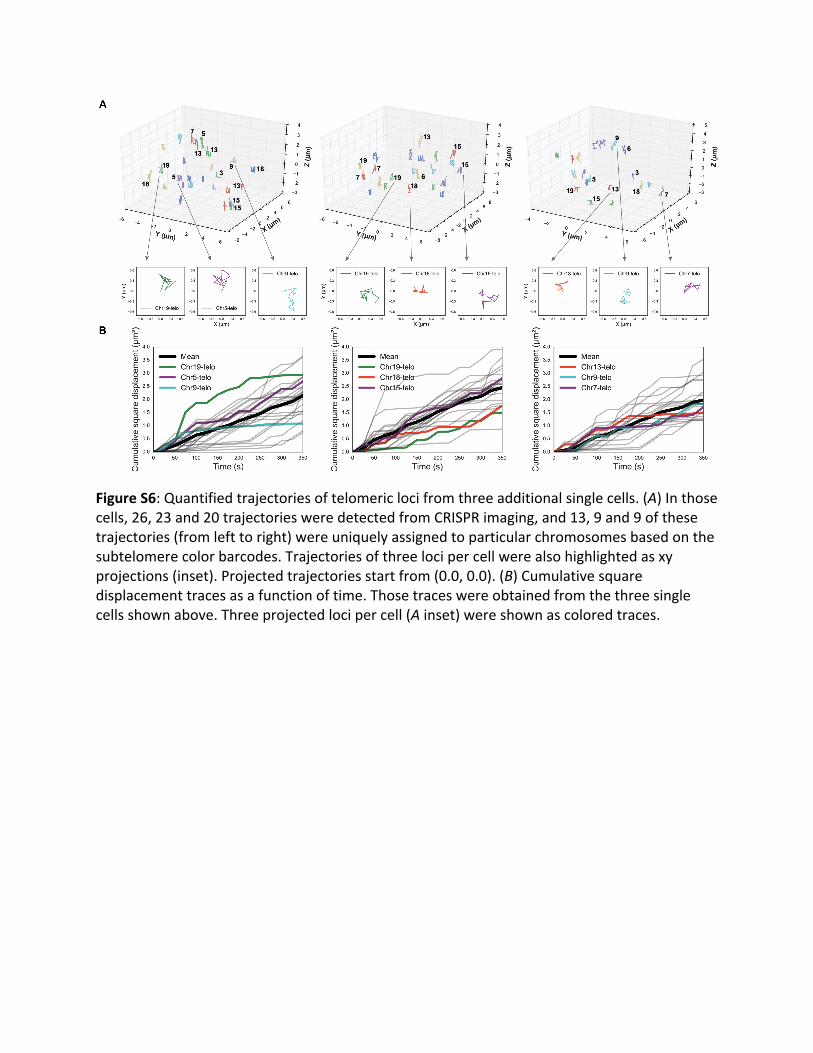
FigureS6:Quantifiedtrajectoriesoftelomericlocifromthreeadditionalsinglecells.(A)Inthosecells,26,23and20trajectoriesweredetectedfromCRISPRimaging,and13,9and9ofthesetrajectories(fromlefttoright)wereuniquelyassignedtoparticularchromosomesbasedonthesubtelomerecolorbarcodes.Trajectoriesofthreelocipercellwerealsohighlightedasxyprojections(inset).Projectedtrajectoriesstartfrom(0.0,0.0).(B)Cumulativesquaredisplacementtracesasafunctionoftime.Thosetraceswereobtainedfromthethreesinglecellsshownabove.Threeprojectedlocipercell(Ainset)wereshownascoloredtraces.

SupportingMovies
MovieS1:LiveimagingoftelomeresinmEScellsusingtheCRISPRlabeling.CellsshowninFig.2Barepresented.Imagesaremaximumintensityprojectionsofaz-stackoffluorescenceimagesineachframe.Notethatcellandstagemovementsarenotcalibratedinthismovie.Scalebarrepresents10μm.

SupportingReferences
1. Chen,K.H.,A.N.Boettiger,J.R.Moffitt,S.Wang,andX.Zhuang.2015.RNAimaging.Spatiallyresolved,highlymultiplexedRNAprofilinginsinglecells.Science348:aaa6090.
2. Shah,S.,E.Lubeck,W.Zhou,andL.Cai.2016.InSituTranscriptionProfilingofSingleCellsRevealsSpatialOrganizationofCellsintheMouseHippocampus.Neuron92:342-357.
3. Singer,Z.S.,J.Yong,J.Tischler,J.A.Hackett,A.Altinok,M.A.Surani,L.Cai,andM.B.Elowitz.2014.DynamicheterogeneityandDNAmethylationinembryonicstemcells.MolCell55:319-331.
4. Li,V.C.,A.Ballabeni,andM.W.Kirschner.2012.Gap1phaselengthandmouseembryonicstemcellself-renewal.ProceedingsoftheNationalAcademyofSciencesoftheUnitedStatesofAmerica109:12550-12555.


![MassARRAY: The Powerful Technology for genomic Analysis · Bioscience, Inc. (San Deigo, California) using the iPLEX ® biochemistry on MassArray® system [23]. A custom two-multiplexed](https://img.pdfslide.us/doc/110x75/5edc1457ad6a402d6666985e/massarray-the-powerful-technology-for-genomic-analysis-bioscience-inc-san-deigo.jpg)