Embed Size (px)
Citation preview
Multiplex Biomaterial Matrix Cues Regulate Redox Status and Stemness in Human
Mesenchymal Stem Cells
By
Spencer William Crowder
Dissertation
Submitted to the Faculty of the
Graduate School of Vanderbilt University
in partial fulfillment of the requirements
for the degree of
DOCTOR OF PHILOSOPHY
in
Biomedical Engineering
May, 2014
Nashville, Tennessee
Approved:
Hak-Joon Sung, Ph.D.
Craig L. Duvall, Ph.D.
David M. Bader, Ph.D.
Todd Giorgio, Ph.D.
Ann Richmond, Ph.D.

i
ACKNOWLEDGEMENTS
I would like to acknowledge those who have supported and guided me over the last four years,
and who will undoubtedly continue to play a major role in my life, both personally and professionally.
First and foremost, my PI, boss, mentor, and friend, Dr. Hak-Joon Sung. When I first started working
with Joon, I knew virtually nothing about laboratory work, experimental design, analysis, or
interpretation. With Joon’s patience and expertise, I have grown into an independent researcher who will
continue to explore and question the world around me to gain a better understanding of how it all works.
In addition to Joon, I would like to thank my lab mates for working with me, teaching me, and putting up
with all of my quirks: Angela Zachman, Dan Balikov, Mukesh Gupta, Lucas Hofmeister, Tim Boire,
Ricky Rath, Sue Lee, Xintong Wang, and Young Wook Chun. Also, I would like to thank the undergrads
who have worked diligently to obtain data and move these projects forward: Amanda Palmer, Yi Liang,
Chad Augusty, Holley Lewis, Caitlyn Ambrose and Kevin Jaeger.
Aside from the professional realm, the support and love that comes from one’s family and friends
is invaluable throughout the stressful time of obtaining a doctoral degree. I, of course, owe a great deal to
my family for always supporting me, being proud of me, and encouraging me in every choice that I make.
My wonderful mother, father, and sister have been blessings to me, and I cannot thank them enough for
their continued guidance and unwavering support. And last, but certainly not least, my girlfriend, Hillary,
who has stood by me and who’s been the brightest light in my everyday life. I love each of you dearly
and look to the future with genuine excitement and ambition to take on whatever this world throws at me.
And finally, I’d like to thank my committee members, Dr. Craig Duvall, Dr. Todd Giorgio, Dr.
Ann Richmond, and Dr. David Bader, for your guidance and input as this project has progressed. Each
committee member has contributed a specific point-of-view that has helped me to understand and identify
key components for developing this project. In short, I am inexplicably thankful to each and everyone
one of you, and look forward to continuing a dialogue for years to come.
ii
TABLE OF CONTENTS
Page
ACKNOWLEDGEMENTS ............................................................................................................. i
LIST OF TABLES ......................................................................................................................... iii
LIST OF FIGURES ....................................................................................................................... iv
LIST OF ABBREVIATIONS ........................................................................................................ vi
I. Chapter 1 – Introduction and Motivation.......................................................................1
II. Chapter 2 – Specific Aim #1: hMSC Passage-Dependent Response to
Carcinogenic Hypoxia ...................................................................................................7
Introduction ....................................................................................................................7
Materials and Methods ...................................................................................................8
Results ..........................................................................................................................12
Discussion ....................................................................................................................19
III. Chapter 3 – Specific Aim #2: Physicochemical Properties Modulate hMSC
Redox Status and Stemness .........................................................................................22
Introduction ..................................................................................................................22
Materials and Methods .................................................................................................23
Results ..........................................................................................................................27
Conclusions ..................................................................................................................39
IV. Chapter 4 – Specific Aim #3: Phenotypic regulation of hMSCs by polymer
substrates: implication of increased stemness and pericyte characteristics .................41
Introduction ..................................................................................................................41
Background ..................................................................................................................41
Materials and Methods .................................................................................................48
Results ..........................................................................................................................52
Conclusions ..................................................................................................................69
V. Chapter 5 – Summary and Future Work ......................................................................70
Appendix I: Antibody Information and Primer Sequences............................................................73
REFERENCES ..............................................................................................................................75

iii
LIST OF TABLES
Table Page
3.1: Thermal and mechanical properties of copolymer library ................................................................... 29
3.2: Copolymer library contact angle with water ....................................................................................... 33
iv
LIST OF FIGURES
Figure Page
1.1: hMSC expression profile during ex vivo expansion ............................................................................ 1
1.2: hMSCs in sarcomagenesis .................................................................................................................. 2
1.3: The necessity and difficulty in decoupling biomaterial matrix properties .......................................... 3
2.1: Treatment with NiSO4 under hypoxic conditions increases cell number and
stimulates expression of cancer-related proteins in hMSCs .............................................................. 12
2.2: hMSC response to the TI condition is passage-dependent. ............................................................... 14
2.3: The TI condition stimulates hMSC exit from replicative senescence and
alterations in expression of stemness markers. ................................................................................. 15
2.4: Intracellular ROS levels, redox potential, and MMP activity are passage- and
treatment-dependent. ......................................................................................................................... 16
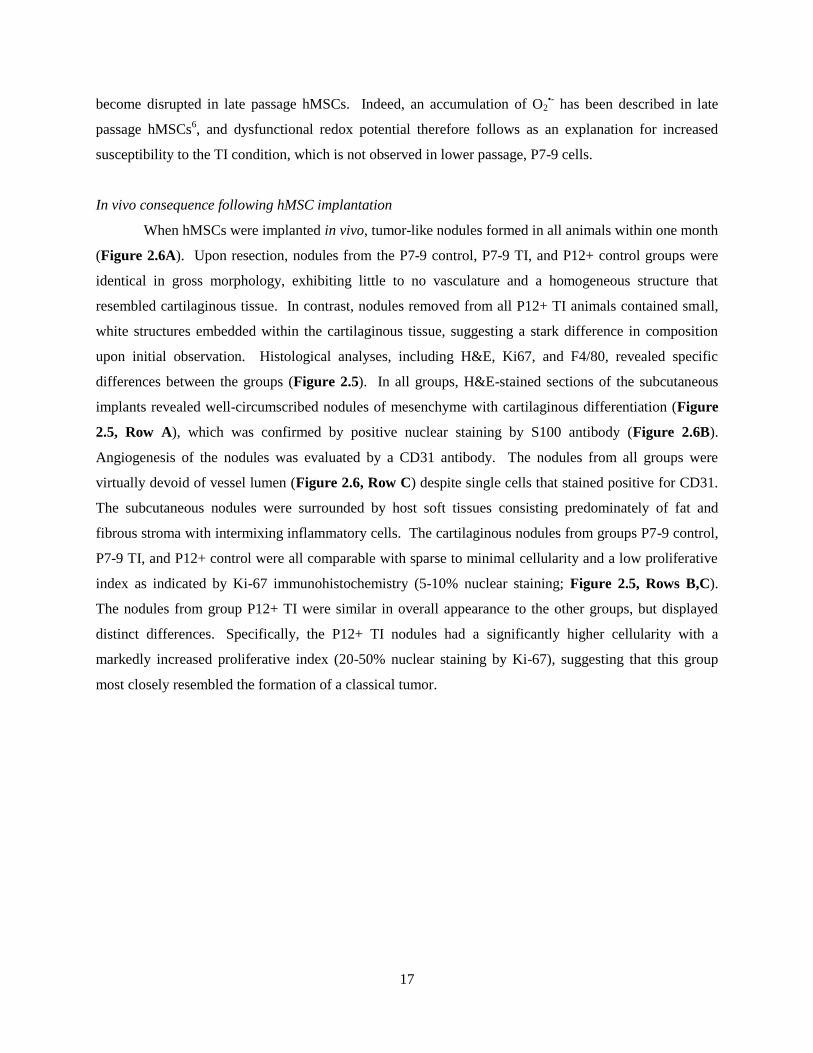
2.5: Tissue samples from in vivo implantation experiments reveals significant
differences between passage and treatment groups ........................................................................... 18
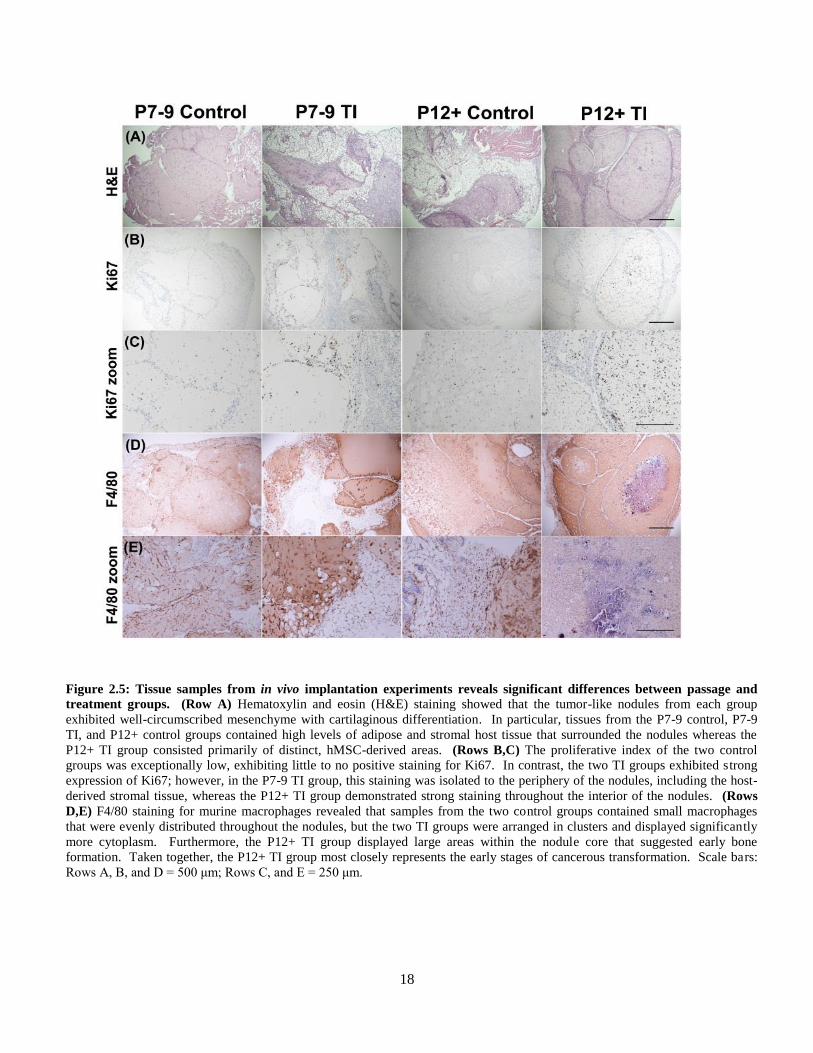
2.6: In vivo implantation of hMSCs results in tumor-like nodule formation ........................................... 19
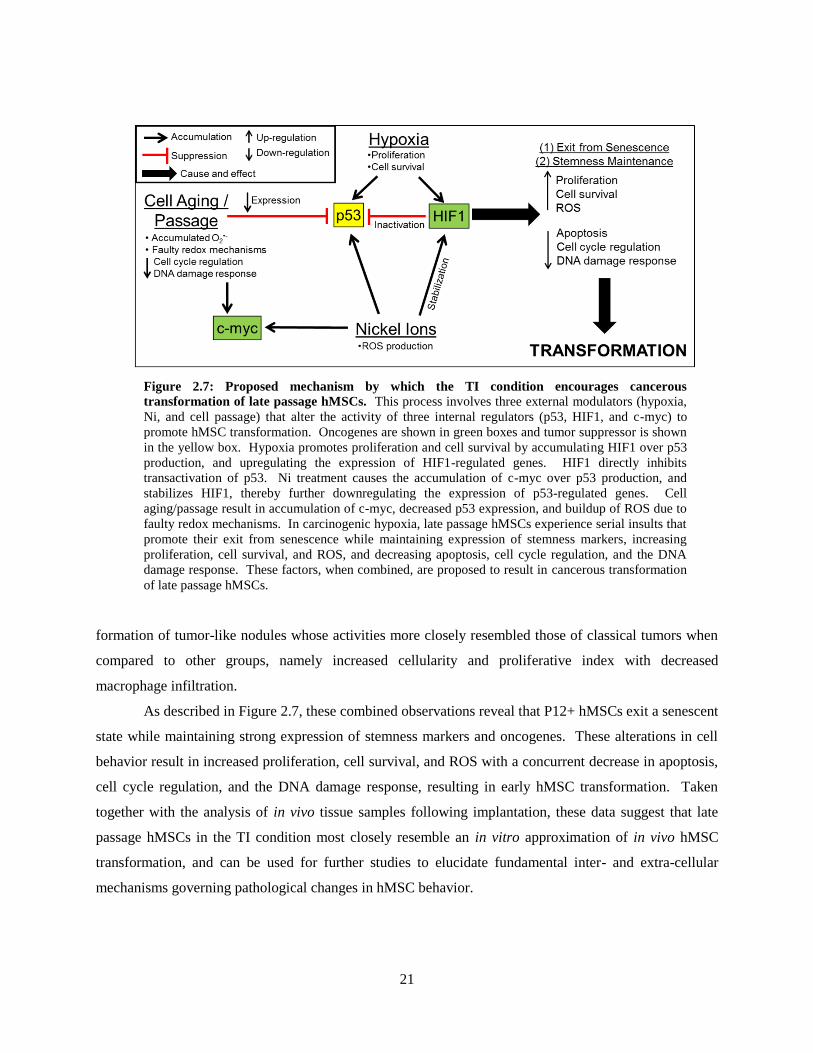
2.7: Proposed mechanism by which the TI condition encourages cancerous
transformation of late passage hMSCs ............................................................................................ 21
3.1: Synthesis scheme of PEG-PCL-cPCL copolymer library ................................................................. 23
3.2: Thermogravimetric analysis of copolymer library ............................................................................ 28
3.3: Surface and biointerface characterization of copolymer library ....................................................... 30
3.4: Surface features and protein adsorption patterns for copolymers ..................................................... 32
3.5: hMSC morphology on copolymers ................................................................................................... 34
3.6: Intracelluar ROS and proliferation are altered by the culture substrate ............................................ 36
3.7: Expression of redox-related genes and proteins on copolymer substrates ........................................ 37
3.8: Stemness gene expression is modulated by culture on the various copolymers ............................... 38
3.9: PCR array for extracellular matrix and adhesion molecules identify potential
mediators of cell-biomaterial interaction .......................................................................................... 39
4.1: Specific Aim #3 Work Flow ............................................................................................................. 47
v
4.2: Pericyte and endothelial marker expression for hMSCs on TCPS and PEG-PCL ............................ 53
4.3: Analysis of early passage Lonza hMSCs on TCPS and PEG-PCL ................................................... 54
4.4: qRT-PCR of patient-derived hMSCs on TCPS and PEG-PCL ........................................................ 55
4.5: Immunofluorescence of patient-derived hMSCs on TCPS and PEG-PCL ....................................... 56
4.6: Gene expression profile of relevant positive and negative hMSC markers for
Lonza and patient-derived hMSCs on PEG-PCL .............................................................................. 57
4.7: Expression profile for large-scale, one-week TCPS or PEG-PCL cultures ...................................... 58
4.8: Flow cytometry measurements for PECAM, ITGA2, STRO-1, and CD146 .................................... 59
4.9: In vitro effect of PEG-PCL hMSCs on HUVECs ............................................................................. 61
4.10: In vitro culture of hMSCs in three-dimensional PEG-PCL scaffolds ............................................... 62
4.11: In vivo OCT images over three weeks (all images from same animal) ............................................ 64
4.12: Quantification of in vivo OCT images .............................................................................................. 64
4.13: Effect of FBS concentration on TCPS and PEG-PCL hMSCs ......................................................... 65
4.14: Protein adsorption at TCPS or PEG-PCL surface – Quantification and
identification ..................................................................................................................................... 67
4.15: Chemically-defined media and collagen/fibronectin pre-coat .......................................................... 68
vi
LIST OF ABBREVIATIONS
ALCAM Activated leukocyte cell adhesion molecule
Ang1 Angiopoietin-1
Ang2 Angiopoietin-2
BrdU 5-bromo-2’-deoxyuridine
BSA Bovine serum albumin
CDM Chemically-defined media
cDNA Complimentary DNA
CM-H2DCFDA 5-chloromethyl-2’,7’-dichlorodihydrofluorescein diacetate
cPCL Carboxylated-PCL
CSC Cancer stem cell
DCFDA Dichlorofluorescein diacetate
DCM Dichloromethane
DHE Dihydroethidium
DMA Dynamic mechanical analysis
DSC Differential scanning calorimetry
E Young’s modulus
EC Endothelial cell
FBS Fetal bovine serum
FCM Flow cytometry
GAPDH Glyceraldehyde 3-phosphate dehydrogenase
H2O2 Hydrogen Peroxide
HIF Hypoxia-inducible factor
hMSC Human mesenchymal stem cell
HUVEC Human umbilical vein endothelial cell
vii
ID1 DNA-binding protein inhibitor 1
ID2 DNA-binding protein inhibitor 2
ITGA2 Integrin α2
ITGA6 Integrin α6
ITGB1 Integrin β1
LC-MS/MS Liquid chromatography-mass spectrometry/mass spectrometry
LDA Lithium diisopropylamide
MMP Matrix metalloproteinase
mRNA Messenger RNA
NG2 Neuron-glial antigen 2
Ni Nickel
NiSO4 Nickel sulfate
NMR Nuclear magnetic resonance
O2•- Superoxide
OCT Optical coherence tomography
PAI1 Plasminogen activator inhibitor-1
PBS Phosphate buffered saline
PCL Poly(ε-caprolactone)
PDGFRβ Platelet-derived growth factor-β
PECAM Platelet-endothelial cell adhesion molecule
PEG Poly(ethylene glycol)
PFA Paraformaldehyde
PLGA Poly(lactic-co-glycolic acid)
PLLA Poly(L-lactic acid)
QCM-D Quartz crystal microbalance with dissipation
Ra Average deviation from the arithmetic mean
viii
ROS Reactive oxygen species
RT-PCR Real-time polymerase chain reaction
SEM Scanning electron microscope
TCPS Tissue culture polystyrene
Tg Glass transition temperature
TGA Thermogravimetric analysis
TGF-β Transforming growth factor-β
THF Tetrahydrofuran
TI Transformation induction
Tie1 Tyrosine kinase with immunoglobulin-like and EGF-like domains 1
Tie2 TEK tyrosine kinase
Tm Melting temperature
VEGF Vascular endothelial growth factor
vWF von Willebrand factor
αMEM Alpha minimum essential medium
αSMA Alpha smooth muscle actin
ΔH Change in enthalpy
σu Ultimate tensile strength
1
CHAPTER 1
Introduction and Motivation
Human bone marrow-derived mesenchymal stem cells (hMSCs) are a promising cell source for
regenerative medicine due to their autologous availability, immunomodulatory effects, self-renewal
capacity, and multi-lineage differentiation potential1. hMSCs classically demonstrate osteogenic,
chondrogenic, and adipogenic differentiation capacity1, and have been used extensively in the field of
tissue engineering for regenerating lost or damaged tissue. Furthermore, hMSCs are currently undergoing
a number of clinical trials in the United States to evaluate their therapeutic efficacy for a range of
applications2, including attenuation of graft-versus-host disease
3, Crohn’s disease, repair of cardiac tissue
following heart attack4, and protection of tissue in type 1 diabetics or patients with chronic obstructive
pulmonary disease (many of these are from Osiris Therapeutics, Inc.). However, the number of hMSCs
available in the bone marrow is staggeringly low (~0.1%), indicating a requirement for ex vivo expansion
in order to achieve a relevant number of cells for clinical applications5. Unfortunately, when expanded in
vitro, hMSCs acquire senescence-associated abnormalities, including alterations in morphology,
differentiation potential, gene and protein expression patterns, and arrested proliferation5-8
, all of which
severely limit their therapeutic efficacy. Specifically, cell cycle regulation and DNA damage repair are
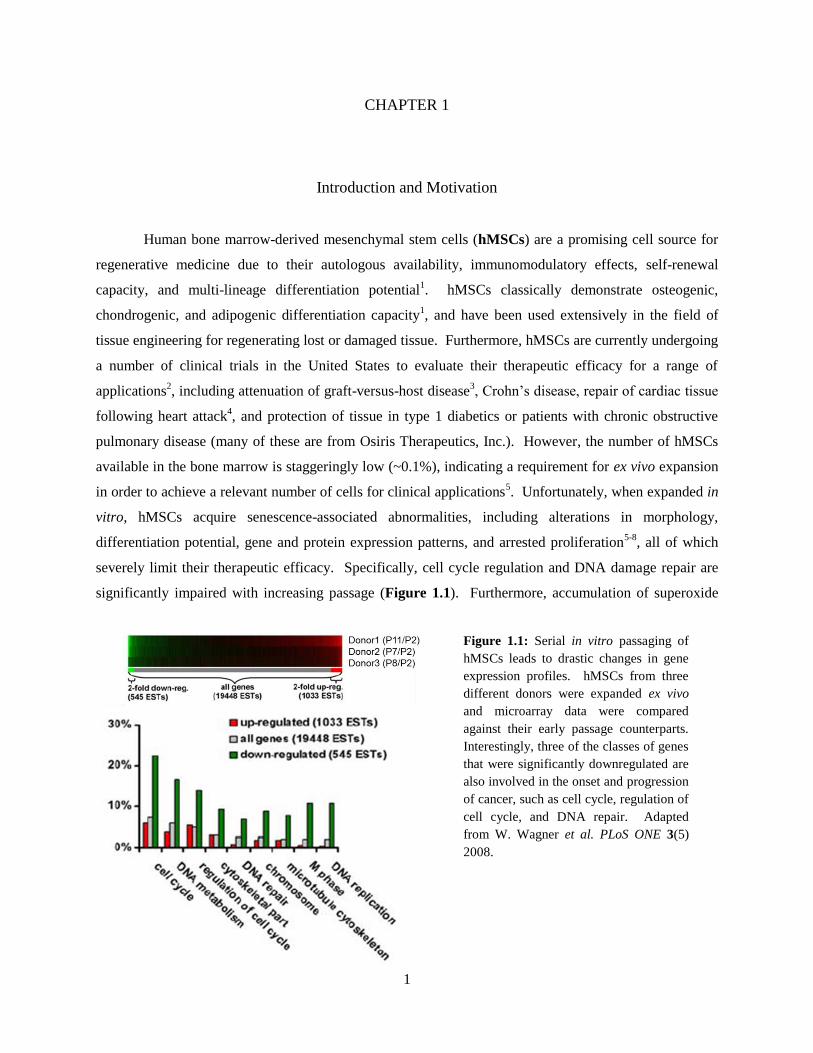
significantly impaired with increasing passage (Figure 1.1). Furthermore, accumulation of superoxide
Figure 1.1: Serial in vitro passaging of
hMSCs leads to drastic changes in gene
expression profiles. hMSCs from three
different donors were expanded ex vivo
and microarray data were compared
against their early passage counterparts.
Interestingly, three of the classes of genes
that were significantly downregulated are
also involved in the onset and progression
of cancer, such as cell cycle, regulation of
cell cycle, and DNA repair. Adapted
from W. Wagner et al. PLoS ONE 3(5)
2008.
2
(O2•-), a short-lived type of reactive oxygen species (ROS), is a hallmark of hMSC senescence due in part
to downregulated redox mechanisms6, 9
. In parallel, the number of viable hMSCs in the bone marrow, as
well as their differentiation capacity, decline with increasing donor age, while oxidative damage and ROS
tend to accumulate10
. Because many of the characteristics of in vitro senescence are also observed in
hMSCs isolated from aging patients, it is possible that in vivo aging and in vitro cell senescence share
inherent similarities10, 11
, and that in vitro studies that aim to approximate the in vivo status of hMSC
regenerative potential and/or cancer susceptibility can be best recapitulated with higher passage hMSCs.
The Role of hMSCs in Cancer
In spite of extensive clinical results supporting their safety and efficacy for therapeutic
purposes12
, hMSCs are known to play a causative role in cancer by both promoting and inhibiting tumor
growth and metastasis, depending upon factors that remain undefined13, 14
. Although studies of
spontaneous hMSC transformation in culture have been refuted15-17
, hMSCs have been implicated as the
tumor-initiating cell-of-origin in certain types of sarcomas and may represent the elusive cancer stem cell
(CSC) in these diseases18
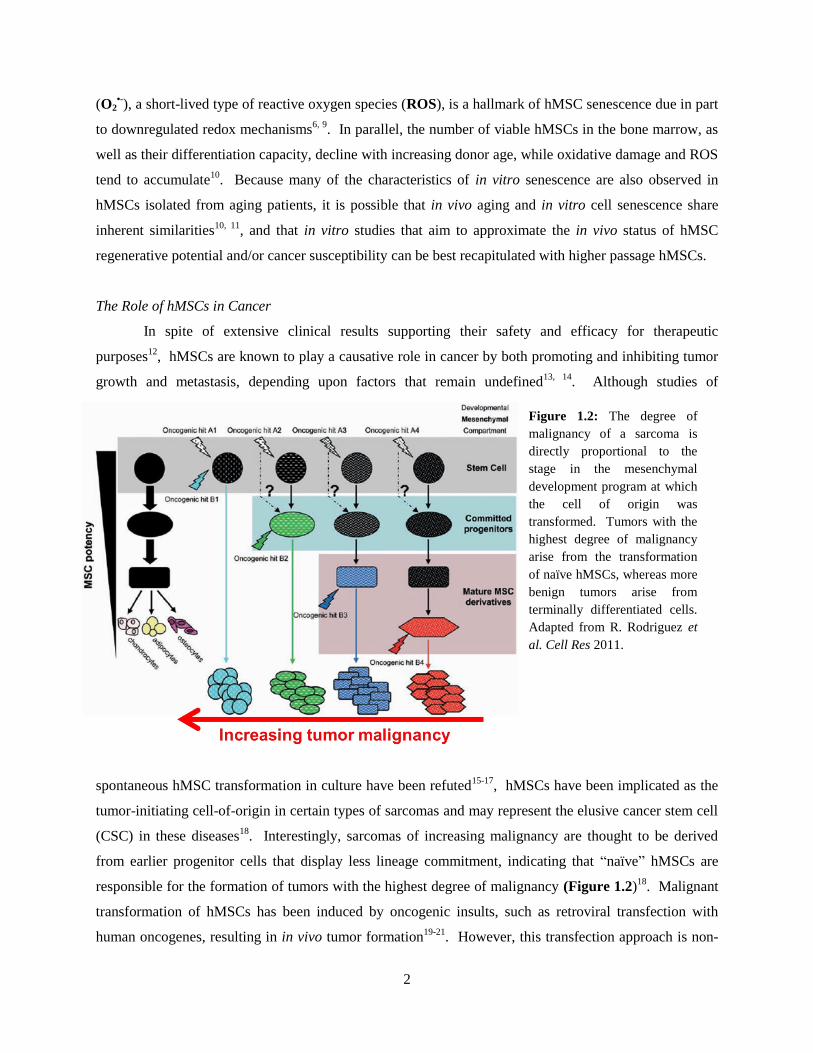
. Interestingly, sarcomas of increasing malignancy are thought to be derived
from earlier progenitor cells that display less lineage commitment, indicating that “naïve” hMSCs are
responsible for the formation of tumors with the highest degree of malignancy (Figure 1.2)18
. Malignant
transformation of hMSCs has been induced by oncogenic insults, such as retroviral transfection with
human oncogenes, resulting in in vivo tumor formation19-21
. However, this transfection approach is non-
Figure 1.2: The degree of
malignancy of a sarcoma is
directly proportional to the
stage in the mesenchymal
development program at which
the cell of origin was
transformed. Tumors with the
highest degree of malignancy
arise from the transformation
of naïve hMSCs, whereas more
benign tumors arise from
terminally differentiated cells.
Adapted from R. Rodriguez et
al. Cell Res 2011.
3
physiological and complicates a clear interpretation of how these events affect the contribution of hMSCs
to tumor formation under physiological conditions. It is therefore of great importance to develop a
physiologically-relevant in vitro model of cancerous transformation that can be used to elucidate the
mechanisms that differentially regulate pathological changes in hMSCs, and to identify alterations in
hMSC behavior that lead to enhanced susceptibility to transformation.
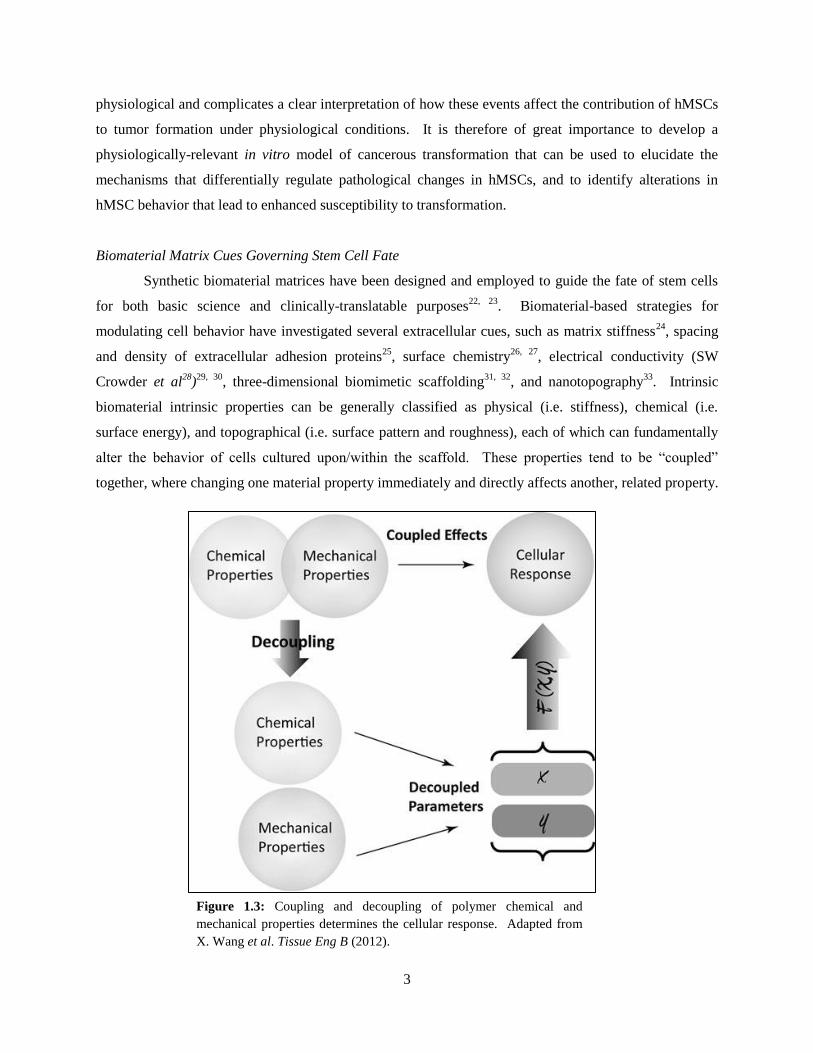
Biomaterial Matrix Cues Governing Stem Cell Fate
Synthetic biomaterial matrices have been designed and employed to guide the fate of stem cells
for both basic science and clinically-translatable purposes22, 23
. Biomaterial-based strategies for
modulating cell behavior have investigated several extracellular cues, such as matrix stiffness24
, spacing
and density of extracellular adhesion proteins25
, surface chemistry26, 27
, electrical conductivity (SW
Crowder et al28
)29, 30
, three-dimensional biomimetic scaffolding31, 32
, and nanotopography33
. Intrinsic
biomaterial intrinsic properties can be generally classified as physical (i.e. stiffness), chemical (i.e.
surface energy), and topographical (i.e. surface pattern and roughness), each of which can fundamentally
alter the behavior of cells cultured upon/within the scaffold. These properties tend to be “coupled”
together, where changing one material property immediately and directly affects another, related property.
Figure 1.3: Coupling and decoupling of polymer chemical and
mechanical properties determines the cellular response. Adapted from
X. Wang et al. Tissue Eng B (2012).
4
“De-coupling” of material properties in order to understand the effect of each individual parameter on the
resulting cell behavior remains a critical challenge in the field of biomaterials, and was the topic of a
recent review paper from the Sung laboratory34
. For example, the chemical composition of a polymer
largely determines the other resulting material characteristics, including crystallinity,
hydrophilicity/hydrophobicity and degradation. Improved crystallinity inherently correlates with
enhanced polymer chain packing, thereby resisting water penetration and hydrolytic degradation. Also,
tightly packed polymer chains usually result in increased material stiffness. These facts indicate that the
resulting cellular behavior is actually in response to the coupled material properties rather than individual
ones. Therefore, there is an unmet need to decouple the material properties so that the effect of individual
material properties on cellular functions can be clearly understood and exploited for enhanced, precise
regulation of cell behavior (Figure 1.3).
Combinatorial Polymers for Decoupling Physicochemical Biomaterial Properties (adapted from Wang et
al. 201234
)
Altering the polymer composition is considered to be an important strategy to modulate matrix
stiffness. However, a significant challenge still remains as changing the polymer composition often
results in simultaneous changes to hydrophobicity, crystallinity and water uptake. For example, varying
the blending ratio of poly(lactic-co-glycolic acid) (PLGA) and poly(L-lactic acid) (PLLA) created a
mechanical gradient to determine a “threshold stiffness” for optimal cell organization, myotubule
formation, and myoblast differentiation35
. The two polymers, however, have inherently different chemical
properties which change simultaneously with the blending ratio, indicating coupling between chemical
and mechanical properties. Similarly, PCL was blended with poly(ether sulfone) (PES) to study the
influence of polymer stiffness on the differentiation of embryonic mesenchymal progenitor cells. Stiffer
PES-PCL scaffold (modulus = 30.6 MPa) promoted osteogenesis, while the softer, pure PCL scaffold
(modulus = 7.1 MPa) promoted chondrogenesis36
. However, the change in chemical composition via
altering the blending ratio was coupled with stiffness and should also be considered.
Although copolymerizing and blending different monomers or polymers often lead to
simultaneous change in other properties, these techniques can be used to decouple the chemical and
mechanical properties by creating a combinatorial library of polymers and selecting compositions that
display similar mechanical properties. Our recent study demonstrated that the wet elastic moduli of
polymeric nanofibrous scaffolds were maintained within a tight range while altering the chemical
compositions of co- or ter-polymers through combinatorial synthesis and electrospinning techniques37
.
This unique approach enabled the synthesis of six polymer formulations with unique chemical
characteristics but similar wet moduli. When cultured with murine embryonic stem cell, they induced
5
different levels of expression of intracellular hydrogen peroxide and cardiomyocyte markers, suggesting
the effect of polymer composition on cell behavior since the mechanical strength was maintained constant
and decoupled. Additionally, the copolymerization of PCL with other polyesters, such as polyglycolic
acid (PGA) and polylactic acid (PLA), have been shown to alter degradation, hydrophobicity, and
crystallinity, while maintaining the elasticity exhibited by the pure PCL scaffold38-41
. These examples
demonstrate that the combinatorial synthesis of polymers is a promising approach for decoupling scaffold
properties. The scale of combinatorial library can be expanded to further tune a particular type of material
property while minimizing changes of other properties. A library of combinatorial polymers with 112
different compositions was produced from copolymerizing 14 different tyrosine-derived diphenols and
eight aliphatic diacid monomers42
. Changes in their chemical compositions were found to affect modulus,
glass transition temperature (Tg) and contact angle. Polymers with similar property (e.g., stiffness or Tg)
could be grouped to study the cell response affected by chemical composition, demonstrating effective
decoupling of these properties42
. Similarly, a library of poly(β-amino esters) (PBAEs) provided tunable
mechanical, degradation, and adhesion properties. Degradation and mechanical properties were decoupled
by varying Mw and branching structure43
44
. Selected PBAE macromers were also cross-linked during
electrospinning to improve the tunability of mechanical and degradation properties 45
. Such an approach
was used to elucidate polymer structure-function relationships, thereby improving the safety and efficacy
of their applications for gene delivery 46, 47
. Similar approaches have been adapted to fine-tune cellular
responses to PCL acrylates 48
and methacrylate terpolymers49
. An excellent review of combinatorial
polymer synthesis techniques, high-throughput assessment of material properties and material-cell
interactions are thoroughly covered elsewhere50
.
These combinatorial synthesis techniques offer distinct advantages over traditional synthesis used
for “one-measurement for one-sample” in terms of time, resources, and information to be obtained.
However, there are still drawbacks and challenges associated with these methodologies, including
preservation of sample purity, data handling, and availability of such resources51
. It is more challenging to
use high-throughput schemes for sophisticated syntheses that require purification, and in many cases it is
more worthwhile to test discrete polymer ratios to obtain data by a potentially more reliable method.
Polymer blends can be used to circumvent such issues with synthesis, for instance, by observing cellular
responses to gradient changes of polymer properties in a two-dimensional combinatorial library (e.g.
temperature and polymer composition). For example, Sung et al. reported that a large library of
PCL/PLGA blends with different stiffness, surface roughness and/or crystallinity have been generated by
varying PCL to PLGA ratio and the annealing temperature, which provides an applicable approach for
decoupling by selecting a group of blends similarly in one property (e.g., stiffness) while differing in
another (e.g., chemical composition). This study further demonstrated that a mid-to-high relative
6
composition of PCL in a PCL/PLGA blend was ideal for smooth muscle cell adhesion, proliferation, and
protein production52
. Similarly, biomaterial microarrays can be used to decouple stiffness, cross-linking
density, and crystallinity53
and examine other chemical and topographical influences on various cell
functions54-57
. These combinatorial approaches offer much promise in elucidating the distinct
mechanisms that govern cell-material interaction to further advance biomaterials and tissue engineering
technologies.
Objectives and Specific Aims
The behavior of hMSCs to changing material properties has been evaluated in a number of
engineering systems, but investigations of late passage, serially-expanded hMSCs as a model for in vivo
aging has been overlooked. Furthermore, the majority of studies have focused on directed differentiation,
guiding hMSCs toward specific lineage commitments, as opposed to the maintenance of an
undifferentiated phenotype, which would be most relevant for clinical applications. The mechanisms and
biological relevance of hMSC differentiation have been clearly described, but the cascade of events that
prevent lineage specification remain unknown. Through the work described in this dissertation project,
the following Specific Aims will be addressed:
Specific Aim #1: To determine the passage-dependent susceptibility of hMSCs to a harsh environment of
carcinogenic hypoxia as an in vitro model for early cancerous transformation events.
Specific Aim #2: To synthesize a new class of copolymer substrates, thoroughly characterize the
physicochemical and surface properties, and apply these materials as synthetic culture substrates for late
passage hMSCs in order to evaluate the extracellular matrix-mediated regulation of redox and stemness.
Specific Aim #3: To systematically identify the biological relevance of hMSCs cultured with increased
expression of “stemness” genes in vitro and in vivo, and to determine the structure-function relationship at
the cell-biomaterial interface that is driving the observed event.
In each Aim, additional background information is provided that will guide the reader through the
relevant points of each topic. At the end of this dissertation, a summary of the findings and a description
of the ongoing work are provided, concluding the story presented here and illustrating the impact and
novelty of the project.
7
CHAPTER 2
Specific Aim #1: hMSC passage-dependent response to carcinogenic hypoxia.
The following Chapter is adapted from SW Crowder et al. FASEB J (2013)58
.
Introduction
Hypoxia is a fundamental microenvironmental cue in both the healthy hMSC niche and malignant
tumors. The bone marrow niche where hMSCs reside experiences hypoxic conditions of 1-7% O259
whereas tumor hypoxia can be more extreme (less than 1% O2), including micro-regions of anoxia60
.
When cultured under hypoxic conditions, hMSCs exhibit increased proliferation61
, expression of
prosurvival and proangiogenic factors62
, and maintenance of an undifferentiated state that bypasses
replicative senescence63-65
. The expression of hypoxia-related genes is controlled by hypoxia inducible
factor 1 (HIF1), a transcription factor implicated in several cancers and whose activities include
regulation of angiogenesis, cell survival, and apoptosis66
. The activities of the tumor suppressor protein
p53, whose role in the DNA damage response and apoptosis is dysregulated in virtually all human
cancers67
, are directly attenuated by HIF168, 69
. The metal carcinogen nickel (Ni) also stimulates
accumulation of HIF1, further reducing the expression of p53-regulated genes70-72
. In the United States,
the average person consumes roughly 150 μg of Ni per day through food, water, and inhalation73
,
illustrating the relevance to study Ni as a prevalent environmental carcinogen. A common oncogenic
transcription factor, c-myc, regulates proliferation-associated genes74
and accumulates in immortalized,
Ni-treated human cells75
, but the role of c-myc in response to Ni has not been investigated in primary or
pre-neoplastic cells. Because Ni is highly prevalent and has been shown to effectively transform human
cells, studying its effects on hMSC transformation in the presence of hypoxia provides a novel and
physiologically-relevant paradigm for how an environmental carcinogen dysregulates stem cell functions.
Therefore, in Specific Aim #1, an environmentally-relevant model of carcinogenic hypoxia has been
developed, and the passage-dependent sensitivity of declining redox mechanisms has been determined in
terms of early transformation events.
8
Materials and Methods
Cell Culture
hMSCs (Lonza, Walkersville, MD) were maintained in α Modified Eagle’s Medium (αMEM,
Gibco Cell Culture, Carlsbad, CA, USA) with 20% fetal bovine serum (FBS, Gibco) with 1% penicillin-
streptomycin (P/S, Gibco) at 37°C and 5% CO2. For all experiments, cells were seeded at a density of
5,000 cells / cm2. Treatment conditions included sterile-filtered nickel sulfate (100 μM, Sigma Aldrich,
St. Louis, MO, USA) and/or hypoxia (0.5% O2, 5% CO2, 94.5% N2) in a hypoxia incubator chamber
(STEMCELL Technologies, Vancouver, B.C., Canada). Cells were cultured for three days before
endpoint evaluations. The two passage groups, passage 7-9 (P7-9) and passage 12+ (P12+), were selected
to represent “early” and “advanced” stages of abnormality acquisition and senescence, respectively9.
Western Blot
Western blot analysis was done according to standard protocols76
. Primary antibodies (1:1000)
include: mouse anti-human p53 (recognizes both mutant and wild-type forms of p53, Abcam, Cambridge,
MA, USA), mouse anti-human HIF1A (Abcam), rabbit anti-human c-MYC (generously provided by Dr.
Steve Hann, Vanderbilt University Medical Center), and mouse anti-human β-actin (Santa Cruz
Biotechnology, Santa Cruz, CA, USA). Horseradish peroxidase (HRP)-conjugated secondary antibodies
(1:1000, Santa Cruz Biotechnology) were used; relative protein expression against β-actin was quantified
via densitometric analysis using ImageJ software (NIH, Bethesda, MD, USA) (n ≥ 3 independent
experiments).
Cell Proliferation
Cells were incubated with 5-bromo-2’-deoxyuridine (BrdU, Sigma) at 20 μM for 16 hours, fixed
in 4% paraformaldehyde (PFA, Sigma), and blocked with 1% bovine serum albumin (BSA, Sigma).
DNA was denatured with HCl (2N for 12 minutes on ice, 1N for 20 minutes at 37°C) and neutralized with
borate buffer (pH 9.0). Incorporated BrdU in proliferating cells was detected by rat anti-BrdU antibody
overnight at 4°C (1:100, Abcam), followed by secondary DyLight594-conjugated goat anti-rat antibody
for 2 hrs at room temperature in the dark (1:50, Jackson Immunoresearch, West Grove, PA, USA).
Nuclei were counterstained with Hoechst (5 μg/mL, Sigma) and cells were imaged under a Nikon Eclipse
Ti inverted fluorescence microscope (Nikon Instruments Inc, Melville, NY, USA). Cell proliferation was
represented by the percent of BrdU-positive cells relative to the total number of cells per image (n ≥ 6
images).
9
ROS Activities
To measure intracellular hydrogen peroxide (H2O2) or O2•-, hMSCs were incubated with
dichlorofluorescein diacetate (DCFDA, Molecular Probes, Carlsbad, CA, USA) or dihydroethidium
(DHE, Molecular Probes), respectively, for 30 minutes at 5 μg/mL at 37°C. Cell nuclei were
counterstained with Hoechst. Fluorescence intensity was measured on a plate reader (Tecan Group Ltd.,
Männedorf, Switzerland) and normalized to the corresponding cell number (excitation/emission: DCFDA
490/540nm, DHE 340/535nm, Hoechst 360/488nm). To visualize and quantify mitochondrial superoxide
(mROS), cells were incubated with MitoTracker Red (CM-H2XROS, Invitrogen) for 30 min at 2.5
μg/mL. The average fluorescence intensity for individual cells was calculated using ImageJ. Reduction
potential was quantified by measuring the reduction of the resazurin sodium salt (Sigma) to resofurin,
following the manufacturer’s instructions. Cells were incubated with resazurin at 5μM for 2 hours at
37°C. Reduction activity was measured on a plate reader (Tecan, 535/595nm excitation/emission) and
normalized to cell number. For all experiments, n ≥ 3 replicates.
Caspase-3 Activity
Caspase-3 activity was quantified with a colorimetric assay kit (BioVision, Mountain View, CA,
USA) according to the manufacturer’s protocol. Experiments were conducted in triplicate and the
average normalized optical density was reported.
β-galactosidase Staining
Staining was performed with the senescence β-galactosidase staining kit from Cell Signaling Inc.
(Danvers, MA, USA) according to the manufacturer’s protocol.
Flow Cytometry
Cells were fixed with 4% PFA, blocked with 1% BSA, and incubated with fluorophore-
conjugated primary antibodies in 1%BSA for 2 hrs (1:10, eBiosciences, San Diego, CA, USA).
Antibodies included FITC-conjugated CD90 and PE-conjugated CD105. Tests were performed using a
FACScalibur flow cytometer (Becton Dickson, Franklin Lakes, NJ, USA) with an unstained hMSC
population containing both passage groups as a control. Data were analyzed with FlowJo (Tree Star,
Ashland, OR, USA) and reported percentages were calculated by gating the desired cell population on the
forward/side scatter plot and setting a fluorescence exclusion for >99% of the control population.
Reverse transcriptase polymerase chain reaction (RT-PCR)
RNA was harvested with QIAshredder (Qiagen, Valencia, CA, USA) and RNeasy column
(Qiagen) following the manufacturer’s protocol. cDNA was synthesized with the iScript cDNA synthesis
kit (Bio-Rad, Hercules, CA, USA) and RT-PCR was performed using the iQ SYBR Green supermix (Bio-
10
Rad) on a Bio-Rad CFX Real Time Instrument for: glyceraldehyde 3-phosphate dehydrogenase
(GAPDH), vascular endothelial growth factor (VEGF), HIF1A, c-MYC, matrix metalloproteinase-2
(MMP-2), membrane type I MMP (MMP-14), and tissue inhibitor of metalloproteinase-2 (TIMP-2). β-
actin was used as a reference gene. MMP sequences were obtained from a previous study77
. Primer
sequences were used as follows: GAPDH: 5’-GCCTCAAGATCATCAGCAATG-3’ (sense) and 5’
CTTCCACGATACCAAAGTTGTC-3’ (anti-sense), VEGF: 5’- CAGAAGGAGGAGGGCAGAATC-3’
(sense) and 5’- CACACAGGATGGCTTGAAGATG-3’ (anti-sense), p53 5’-
GCGTGTGGAGTATTTGGATGAC -3’ (sense) and 5’- AGTGTGATGATGGTGAGGATGG -3’ (anti-
sense), c-MYC: 5’-CGTCCTCGGATTCTCTGCTCTC-3’ (sense) and 5’-
CCTCATCTTCTTGTTCCTCCTCAG-3’ (anti-sense), HIF1A: 5’-
TACCCTAACTAGCCGAGGAAGAAC-3’ (sense) and 5’- ATCAGCACCAAGCAGGTCATAG-3’
(anti-sense), β-actin: 5’-ATCATGTTTGAGACCTTCAA-3’ (sense) and 5’-
CATCTCTTGCTCGAAGTCCA-3’ (anti-sense). Data were analyzed with CFX Manager software
(Bio-Rad) and results are presented as ΔΔC(t) expression normalized to β-actin.
Osteogenic and Adipogenic Induction
Osteogenic and adipogenic induction media were purchased from Lonza. For adipogenesis,
hMSCs were cycled between adipogenic induction and maintenance media ± the NADPH oxidase
inhibitor, diphenyleneiodinium chloride (DPI, 4 μM, Sigma) for a total of 15 days (3 days induction, 1
day maintenance, 3 days induction ± DPI, 3 days maintenance, 3 days induction ± DPI, and 2 days
maintenance). Osteogenic induction media was changed every 3-4 days for a total of 15 days, during
which time DPI treatment occurred for a total of six days. To verify differentiation, alkaline phosphatase
(ALP) activity and Nile red staining were performed for osteogenic and adipogenic differentiation,
respectively. ALP activity was quantified using the p-nitrophenyl phosphate liquid substrate system
according to the manufacturer’s instructions (Sigma, n=3). For Nile red staining, cells were fixed with
4%PFA and incubated with 100 ng/ml Nile red in 150mM NaCl for 10 min. Cells were then washed,
counterstained with Hoechst, and imaged using a Nikon Ti inverted microscope. The green fluorescence
channel is shown due to improved specificity78
.
SDS-PAGE Gelatin Zymography
The proenzyme and active forms of MMP-2 and MMP-9 were detected using SDS-PAGE gelatin
zymography in the presence of SDS in 10% polyacrylamide gels containing 0.1% (w/v) gelatin79
. Media
samples were collected from cells incubated in serum-free DMEM media 24 hours prior to collection.
Total protein concentrations were determined by Bradford assay, and the samples were diluted 1:1 in
sample buffer containing 0.14M Tris-HCl (pH6.8), 20% (v/v) glycerol, 4.5% (w/v) SDS, and 0.003%
11
Bromphenol blue. Twenty µg of protein was loaded into each well. Electrophoresis was performed in
non-reducing conditions in a BioRad Mini Protean 3 system. Proteins were renatured by washing the gels
in four 10-minute incubations in 2.5% Triton X-100. For gelatinolytic activity, the gels were incubated at
37 for 18 hours in 50 mM Tris-HCl (pH 7.3, Sigma) containing 1.47g/L CaCl2 (Sigma) and 0.05% Brij-
35 (Fisher Scientific, Pittsburgh, PA, USA). The proteins were fixed for 2 hours with gentle agitation in
30% methanol and 10% acetic acid at room temperature, followed by staining for 18 hours with 0.1%
(w/v) Brilliant Blue R-250, 0.64M ammonium sulfate (Sigma) and 25% methanol. The gels were
destained in 25% methanol for 2 hours.
In Vivo Experiments and Immunohistochemistry
Animal housing and experimentation were performed according to the Vanderbilt Institutional
Animal Care and Use Committee guidelines under an approved protocol. For experiments, 8x10⁵ hMSCs
from each group were injected subcutaneously with 200μL Matrigel (BD Biosciences, San Jose, CA,
USA) into the scapular region of athymic Foxn1nu/nu
female mice (4-6 weeks of age, n = 3 mice / group,
12 mice total, Harlan Laboratories, Indianapolis, IN, USA) and allowed to grow for one month. Each
week, animals were anesthetized with 2.5% isoflurane under steady flow, weighed, and tumor nodules
were measured with electronic calipers. After one month, animals were sacrificed by cervical dislocation
under anesthesia and tumor samples were placed in 4%PFA for 24 hours before being submitted for
embedding, sectioning, and immunohistochemistry (IHC). All IHC was performed by the Translational
Pathology Shared Resource Core at Vanderbilt University Medical Center. Slides were deparaffinized
and antigen retrieval was performed using standard methods. Slides were stained for 30-60 minutes with
primary antibodies against murine F4/80 (1:1000 dilution, Novus Biologicals, Littleton, CO, USA), Ki67
(1:100, Abcam), CD31 (1:100, Dianova, Hamburg, Germany), and human S100 (1:900, Dako,
Carpinteria, CA, USA) followed by appropriate HRP-conjugated secondary antibodies and detection with
3,3’-diaminobenzidine (DAB) substrate according to standard protocols. IHC slides were imaged under a
Nikon stereoscope.
Statistical Analysis
In all experiments, results are presented as mean ± standard error of the mean (SEM). Results
from each experiment were initially analyzed using single factor analysis of variance (ANOVA) and
comparisons between individual test groups were then performed using an unpaired Student’s t-test. p <
0.05 was considered statistically significant.
12
Results
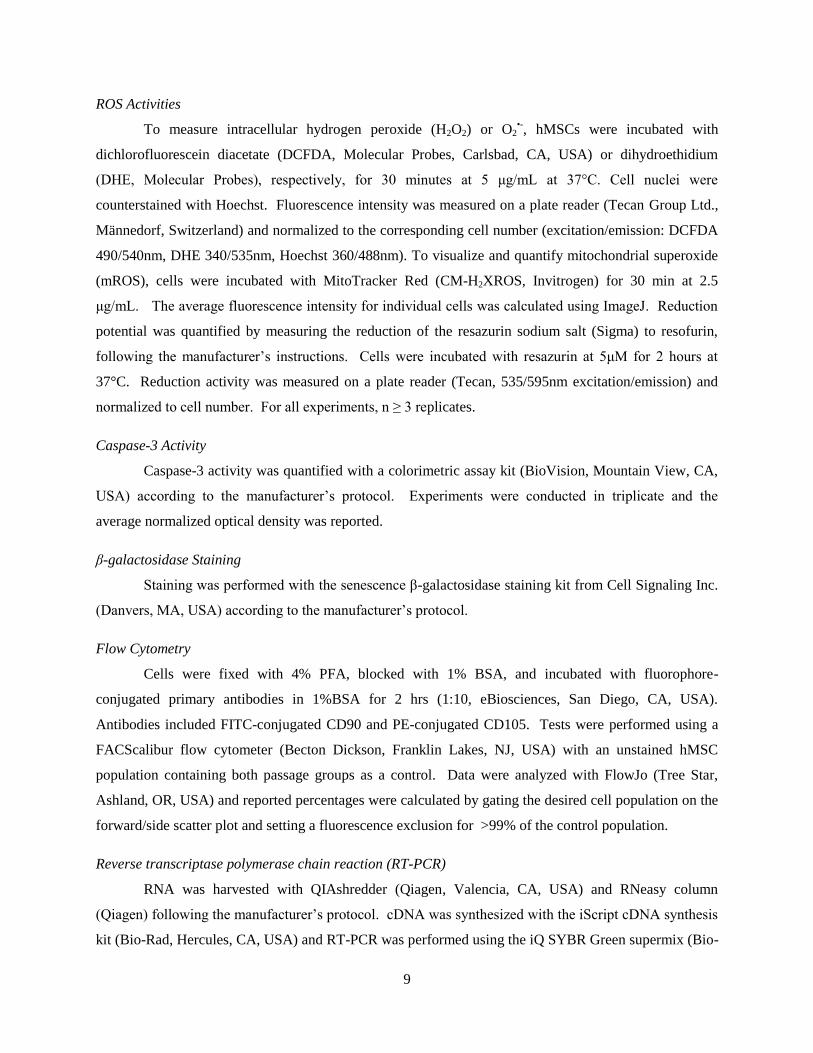
Passage-independent effects of Ni and hypoxia
In order to establish which conditions best mimic a cancerous environment, the effects of hypoxia
with or without NiSO4 treatment were first investigated (Figure 2.1). hMSCs of passage 5-15 were used
such that the effect of passage was not considered. As seen in Figure 2A, NiSO4 treatment in normoxia
(T, N) reduced cell number compared to the untreated normoxia condition (U, N). However, the
untreated hypoxic condition (U, H) increased cell number versus normoxia alone, and NiSO4 treatment in
hypoxia (T, H) led to a further increase in cell number. Interestingly, the cell number in each condition
correlated linearly with intracellular H2O2 content (R2 = 0.9474), suggesting a role of H2O2 in regulating
cell proliferation.
Expression of cancer-related proteins was evaluated in each condition (Figure 2.1B). In
untreated normoxia, expression levels for HIF1α and c-myc were very low, and p53 expression was
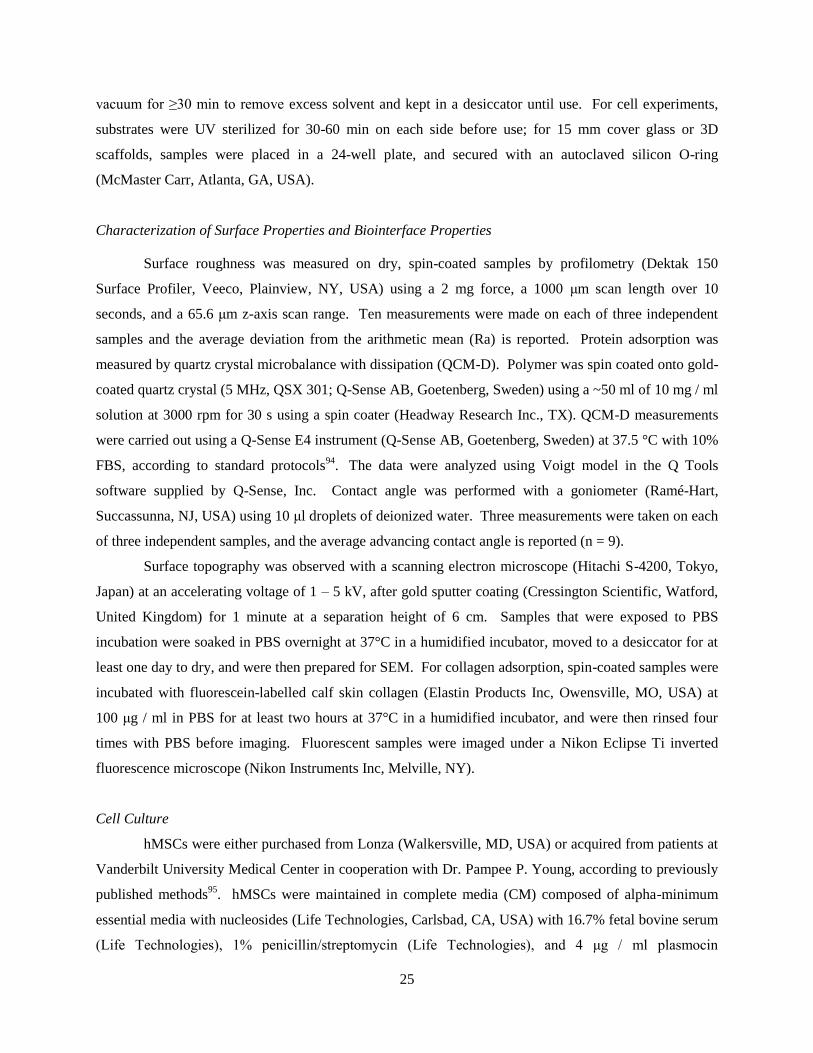
Figure 2.1: Treatment with NiSO4 under hypoxic conditions increases cell number and stimulates expression
of cancer-related proteins in hMSCs. (A) Cell number decreased with NiSO4 treatment in normoxia (T,N)
relative to untreated, normoxic control (U,N). Under hypoxic conditions, cell number increased (U,H) and
treatment with NiSO4 further enhanced this effect, suggesting that the cytotoxic effects of Ni are more tolerated
under hypoxia. Interestingly, cell number was shown to correlate with intracellular H2O2 levels. (B) Expression of
the oncogenes HIF1α and c-myc, and the tumor suppressor protein p53, were altered upon treatment with NiSO4
and/or hypoxia. (C-E) hMSCs cultured under Ni-treated hypoxia (TI condition) exhibited a protein expression
profile of that was similar to that classically seen in cancers (n ≥ 3 independent experiments). N.D. – no statistical
difference.
13
moderate. Upon treatment with NiSO4 in normoxia, the expression of c-myc and p53 increased as
compared to untreated normoxia, and this correlated with a drastic reduction in cell number (Figure
2.1A), verifying that the interplay of p53 and c-myc regulates proliferation and apoptosis. In untreated
hypoxia, HIF1α and c-myc expression were upregulated as compared to untreated normoxia, which
correlated with increased cell number and supports the role of these transcription factors in accelerating
proliferation. P53 expression did not appear to change between these two untreated conditions. Finally,
NiSO4 treatment in hypoxia stimulated a strong increase in HIF1α expression as compared to untreated
hypoxia, indicating the synergistic role of nickel and hypoxia in accumulating HIF1α. Additionally, c-
myc expression remained strong in this condition and p53 expression did not appear to change as
compared to the untreated, normoxic condition. Taken together, the NiSO4-treated hypoxia condition
most closely resembled a classical cancer profile (i.e. strong expression of HIF1α and c-myc with
moderate p53 activity). We therefore identified 100 μM NiSO4 treatment under 0.5% O2 hypoxia as the
most effective condition for transformation induction (TI). Control was defined as the normoxic
untreated condition (0 M NiSO4, 21% O2). As seen in Figure 5C-E, the relative expression levels of the
three cancer-related proteins were more rigorously investigated between the control and TI conditions (n
≥ 3 independent experiments). In the TI condition, HIF1α and c-myc expression were significantly up-
regulated while p53 expression did not statistically change (Figure 2.1C-E), validating that the hMSCs in
the TI condition exhibit an expression profile that generally mimics that of cancer cells.
ROS- and passage-dependent response to carcinogenic hypoxia
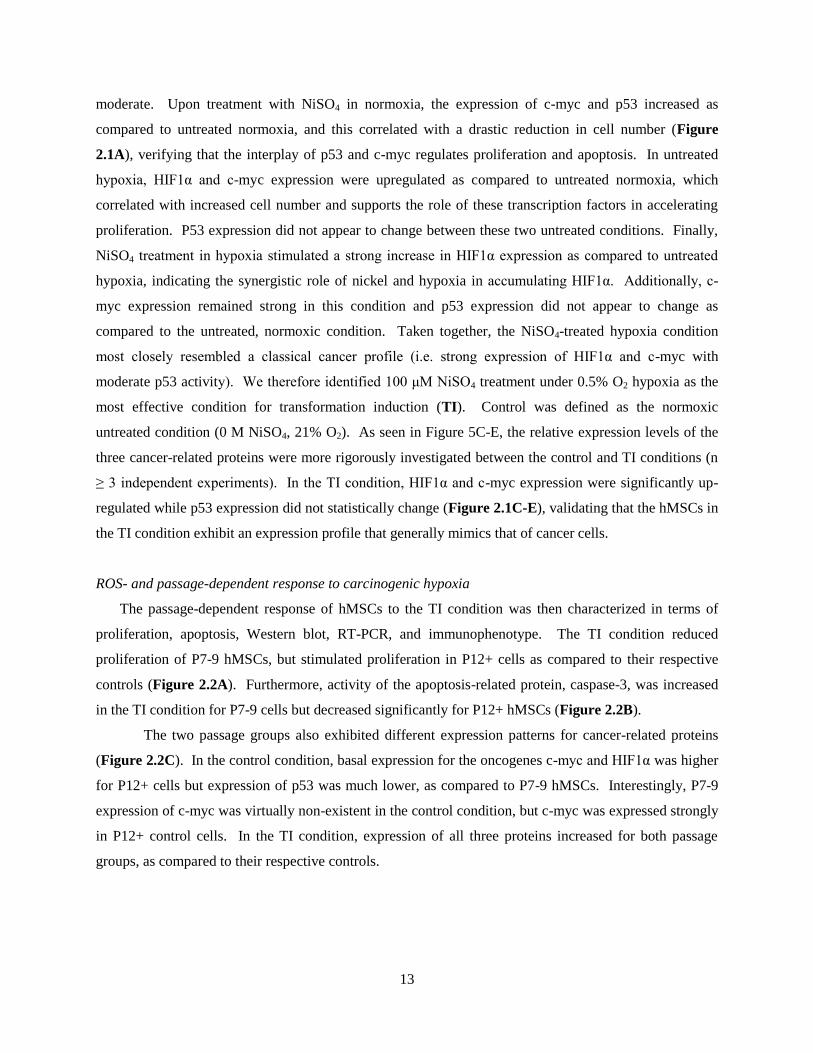
The passage-dependent response of hMSCs to the TI condition was then characterized in terms of
proliferation, apoptosis, Western blot, RT-PCR, and immunophenotype. The TI condition reduced
proliferation of P7-9 hMSCs, but stimulated proliferation in P12+ cells as compared to their respective
controls (Figure 2.2A). Furthermore, activity of the apoptosis-related protein, caspase-3, was increased
in the TI condition for P7-9 cells but decreased significantly for P12+ hMSCs (Figure 2.2B).
The two passage groups also exhibited different expression patterns for cancer-related proteins
(Figure 2.2C). In the control condition, basal expression for the oncogenes c-myc and HIF1α was higher
for P12+ cells but expression of p53 was much lower, as compared to P7-9 hMSCs. Interestingly, P7-9
expression of c-myc was virtually non-existent in the control condition, but c-myc was expressed strongly
in P12+ control cells. In the TI condition, expression of all three proteins increased for both passage
groups, as compared to their respective controls.
14
The two passage groups also exhibited substantial differences at the level of gene expression
(Figure 2.2D-H). Expression of the glycolytic enzyme GAPDH increased significantly in the TI
condition for both passage groups (Figure 2.2D), and these results agree with literature findings regarding
an increased dependence upon glycolysis by hMSCs in hypoxia65
. C-myc gene expression also increased
significantly for both passage groups in the TI condition, but p53 expression did not change (Figure
2.2E-F). Interestingly, p53 gene expression was higher for both conditions in P12+ cells, as compared to
P7-9 cells, but p53 protein expression was actually lower for P12+ cells (Figure 2.2C), suggesting a
drastic difference in post-transcriptional regulation between the two passage groups. In the TI condition,
Figure 2.2: hMSC response to the TI condition is passage-dependent. (A) Proliferation decreased in P7-9 cells in
the TI condition, but increased in P12+ cells. (B) Apoptosis increased in P7-9 cells in the TI condition, but
decreased in P12+ cells. (C) Protein expression profiles for the two passage groups showed P12+ cells to exhibit
strong basal expression of the oncogenes HIF1α and c-myc and weak expression of the tumor suppressor protein
p53. In the TI condition, expression of each of these proteins increased for both passage groups. (D-H) Gene
expression profiles for the two passage groups in control and TI conditions. Genes of interest include (D) the
glycolytic enzyme GAPDH, (E) c-myc, (F) p53, (G) HIF1α, and (H) VEGF. Statistical significance is represented
by lines connecting the conditions/groups that were compared. N.D. – no statistical difference.
15
HIF1α gene expression decreased for both passage groups compared to control (Figure 2.2G). However,
gene expression of the HIF1α-regulated VEGF did not change in the TI condition for P7-9 cells, but
increased significantly for P12+ cells (Figure 2.2H), indicating that the hypoxia-responsive expression
program was indeed activated.
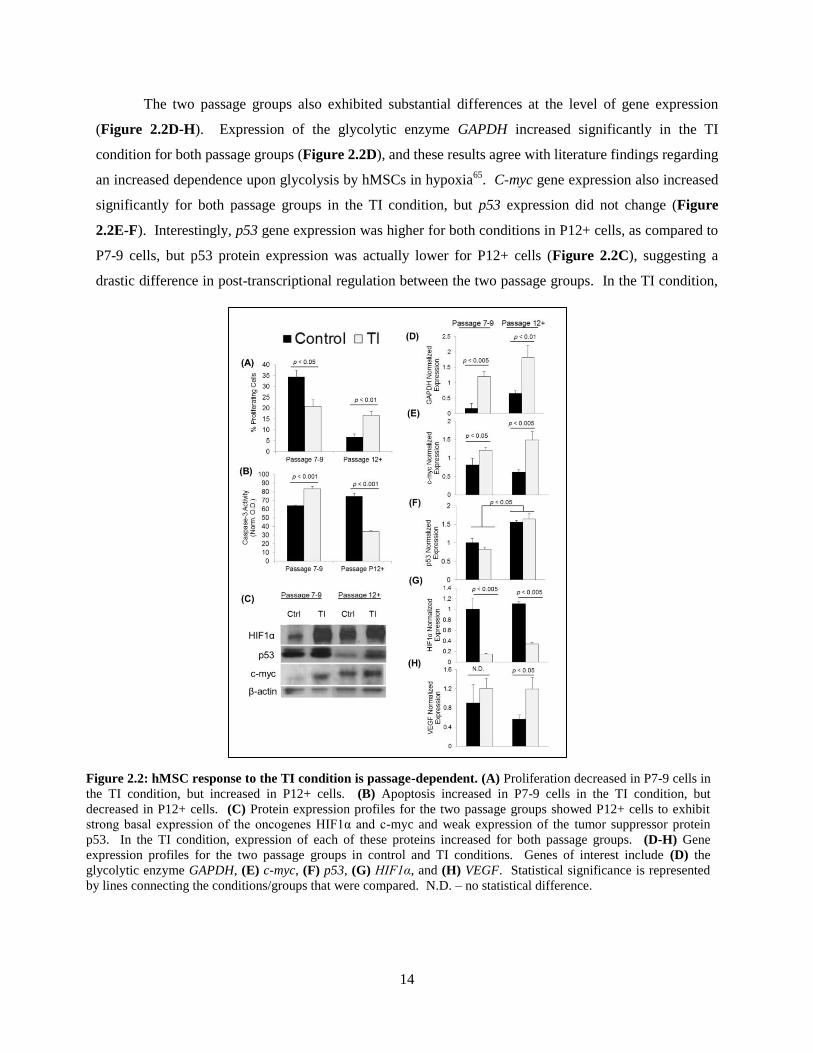
We then sought to identify the status of replicative senescence in both passage groups as well as
the role of the TI condition in modulating this behavior (Figure 2.3A). In the control condition, both
passage groups stained positive for β-galactosidase expression (blue cells), indicating replicative
senescence and supporting previous findings in the literature9. In the TI condition, hMSCs from both
passage groups effectively left the senescent state, as indicated by a drastic reduction in the number of
blue-stained cells.
The expression level of the positive hMSC markers CD90 and CD105 was then investigated by
flow cytometric analysis (Figure 2.3B-C). Unstained cells are represented by the red, leftmost curve.
Control hMSCs from both passage groups strongly expressed both markers (black outline, rightmost
Figure 2.3: The TI condition stimulates hMSC exit from replicative senescence and alterations in expression of
stemness markers. (A) hMSCs were observed to be in a state of replicative senescence in the control condition, but
culture in the TI condition stimulated their exit from senescence. Scale bars = 100 μm. (B) Graphical representation
immunophenotyping by flow cytometry (red outline - unstained control cells; black outline – control condition; grey outline
– TI condition). (C) Quantification of flow cytometry data.
16
curve). Surprisingly, when quantified, P12+ cells showed stronger expression of these markers,
indicating an effective maintenance of stemness into later passage (Figure 2.3C). In the TI condition,
CD90 and CD105 expression decreased in both passage groups (grey outline, middle curve), but when
quantified, P12+ cells were shown to retain their stemness to a higher degree than P7-9 cells. These data
indicate that the TI condition stimulated differentiation, or significant downregulation, of hMSC-positive
markers, in P7-9 cells that was not observed to the same degree in P12+ cells.
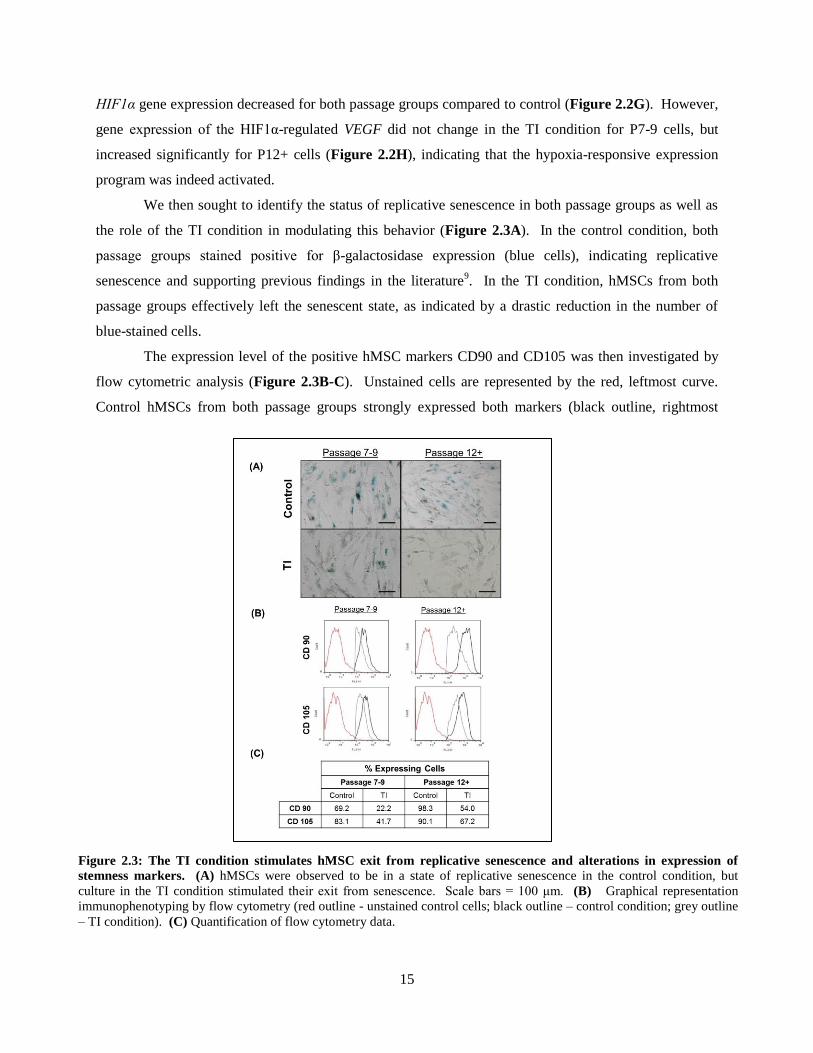
Because the two passage groups exhibited substantially different responses to the TI condition,
and ROS are known to play crucial roles in both healthy tissue maintenance and cancer80
, the oxidative
state of the two groups of cells was investigated (Figure 2.4). In the TI condition, intracellular H2O2
levels decreased for P7-9 cells but increased significantly in P12+ hMSCs (Figure 2.4A). In parallel,
mROS were decreased in the TI condition in P7-9 cells but were unaltered in P12+ cells (Figure 2.4B),
and intracellular O2•- levels were significantly higher for all P12+ cells, as compared to all P7-9 cells
(Figure 2.4C). These findings indicated that the reduction potential (i.e. anti-oxidative activities) of
P12+ cells was dysregulated as compared to P7-9 cells. As seen in Figure 8D, P7-9 cells exhibited a
significantly stronger reduction potential than did P12+ cells, suggesting that ROS-handling mechanisms
Figure 2.4: Intracellular ROS levels, redox potential, and MMP activity are passage- and treatment-
dependent. (A) H2O2 levels decreased in the TI condition for P7-9 cells but increased for P12+ cells. (B)
mROS and (C) O2•- levels were significantly higher P12+ cells versus P7-9. (D) Reduction potential was
drastically lower for P12+ cells versus P7-9. (E) Zymography revealed little change in pro-MMP-9 expression
in the three conditions, but expression of pro- and active-MMP-2 was altered in both a passage- and ROS-
dependent manner. (F-H) Analysis of gene expression for MMP-2, -14, and TIMP-2 showed passage-
dependent differences that provided insight for the discrepancies observed in zymography. * p < 0.05 and †
p < 0.01 vs. respective control condition or between groups as indicated by lines. N.D. – no statistical
difference.
17
become disrupted in late passage hMSCs. Indeed, an accumulation of O2•- has been described in late
passage hMSCs6, and dysfunctional redox potential therefore follows as an explanation for increased
susceptibility to the TI condition, which is not observed in lower passage, P7-9 cells.
In vivo consequence following hMSC implantation
When hMSCs were implanted in vivo, tumor-like nodules formed in all animals within one month
(Figure 2.6A). Upon resection, nodules from the P7-9 control, P7-9 TI, and P12+ control groups were
identical in gross morphology, exhibiting little to no vasculature and a homogeneous structure that
resembled cartilaginous tissue. In contrast, nodules removed from all P12+ TI animals contained small,
white structures embedded within the cartilaginous tissue, suggesting a stark difference in composition
upon initial observation. Histological analyses, including H&E, Ki67, and F4/80, revealed specific
differences between the groups (Figure 2.5). In all groups, H&E-stained sections of the subcutaneous
implants revealed well-circumscribed nodules of mesenchyme with cartilaginous differentiation (Figure
2.5, Row A), which was confirmed by positive nuclear staining by S100 antibody (Figure 2.6B).
Angiogenesis of the nodules was evaluated by a CD31 antibody. The nodules from all groups were
virtually devoid of vessel lumen (Figure 2.6, Row C) despite single cells that stained positive for CD31.
The subcutaneous nodules were surrounded by host soft tissues consisting predominately of fat and
fibrous stroma with intermixing inflammatory cells. The cartilaginous nodules from groups P7-9 control,
P7-9 TI, and P12+ control were all comparable with sparse to minimal cellularity and a low proliferative
index as indicated by Ki-67 immunohistochemistry (5-10% nuclear staining; Figure 2.5, Rows B,C).
The nodules from group P12+ TI were similar in overall appearance to the other groups, but displayed
distinct differences. Specifically, the P12+ TI nodules had a significantly higher cellularity with a
markedly increased proliferative index (20-50% nuclear staining by Ki-67), suggesting that this group
most closely resembled the formation of a classical tumor.
18
Figure 2.5: Tissue samples from in vivo implantation experiments reveals significant differences between passage and
treatment groups. (Row A) Hematoxylin and eosin (H&E) staining showed that the tumor-like nodules from each group
exhibited well-circumscribed mesenchyme with cartilaginous differentiation. In particular, tissues from the P7-9 control, P7-9
TI, and P12+ control groups contained high levels of adipose and stromal host tissue that surrounded the nodules whereas the
P12+ TI group consisted primarily of distinct, hMSC-derived areas. (Rows B,C) The proliferative index of the two control
groups was exceptionally low, exhibiting little to no positive staining for Ki67. In contrast, the two TI groups exhibited strong
expression of Ki67; however, in the P7-9 TI group, this staining was isolated to the periphery of the nodules, including the host-
derived stromal tissue, whereas the P12+ TI group demonstrated strong staining throughout the interior of the nodules. (Rows
D,E) F4/80 staining for murine macrophages revealed that samples from the two control groups contained small macrophages
that were evenly distributed throughout the nodules, but the two TI groups were arranged in clusters and displayed significantly
more cytoplasm. Furthermore, the P12+ TI group displayed large areas within the nodule core that suggested early bone
formation. Taken together, the P12+ TI group most closely represents the early stages of cancerous transformation. Scale bars:
Rows A, B, and D = 500 μm; Rows C, and E = 250 μm.
19
The nodules from all groups were also evaluated for the presence of macrophages by F4/80
(Figure 2.5, Rows D,E). The macrophages in control groups were small and evenly distributed
throughout both the nodules and surrounding stroma (Figure 2.5, Row D). In contrast, the macrophages
in TI groups were decreased in number, predominately arranged in clusters within the nodules, and
displayed significantly more cytoplasm (Figure 2.5, Row E). These data suggest that treatment under the
TI condition stimulated an immunomodulatory effect beyond the intrinsic capability of hMSCs cultured
under control conditions. Overall, P12+ TI hMSCs exhibited significantly increased cellularity, a higher
proliferative index, and potential bone formation in the center of the nodules while minimizing
macrophage infiltration, indicating that the in vivo result for this group could represent a neoplastic
process that closely resembles that of a classical tumor, as compared with other groups.
Discussion
The behavior of MSCs changes with increasing passage and donor age in both humans9, 10
and
mice81
. When expanded in vitro, hMSCs begin to acquire senescence-associated abnormalities between
passages 7 and 12, including changes in gene and protein expression patterns, and arrested proliferation9.
The present study sought to 1) develop and characterize a novel model for in vitro cancerous
transformation, 2) profile the hMSC passage-dependent response to carcinogenic hypoxia, 3) observe the
Figure 2.6: In vivo implantation of hMSCs results in tumor-like nodule formation.
(A) Within one month, tumor-like nodules formed in all animals and (B) the tissue
samples stained positive for S100, indicating cartilaginous differentiation. (C) Although
single cells stained positive for CD31, vessel lumen formation was not observed,
suggesting that the nodules were not vascularized. Scale bars = 250 μm.
20
differences in the in vivo consequence of the hMSC groups when implanted subcutaneously, and 4)
identify a key mechanism governing this relationship.
We found that P12+ hMSCs represented a more transformation-susceptible population than P7-9,
according to the data presented above. We have also identified a potential mechanism of action that
draws from three independent, external influences (hypoxia, nickel, and hMSC passage) that intricately
modulate the activities of three transcription factors (HIF1, p53, and c-myc) through dysregulated ROS,
ultimately resulting in early transformation as elaborated in Figure 2.7. These findings illustrate a crucial
aspect of hMSC passage-dependence: namely how cell senescence and transformation susceptibility are
altered with increasing in vitro expansion, and how these events likely mirror those that occur during
aging. To our knowledge, this is the first study to expose hMSCs to an environmentally-prevalent
carcinogen while under hypoxia to mimic the physiologically-relevant transformation microenvironment.
This study demonstrates the first step towards an experimental model of environmental carcinogen-driven
hMSC transformation and will be used to design in-depth studies that aim to build a better understanding
of the cell passage-dependent susceptibility of hMSCs to oncogenesis.
We investigated the combinatorial effects of hypoxia and nickel on the two passage groups of
hMSCs and identified their mechanistic relationship (Figure 2.7). First, hypoxia stimulates a modest
accumulation of HIF1 and p53 (Figure 2.1B), but hypoxia alone does not stimulate transactivation of
p53-regulated genes because p53 is directly inactivated by HIF168,69
. In parallel, Ni exerts its effects
through activation of the hypoxia response pathway, resulting in further accumulation and stabilization of
HIF170
. Treatment with Ni alone also stimulates the accumulation of p53 (Figure 2.1B) but accumulated
HIF1 inactivates p53 activity69
. Therefore, the cooperative effects of hypoxia and Ni treatment
synergistically amplify this cascade, resulting in a continually-increasing bias of proliferative, cell
survival genes (HIF1-regulated) relative to apoptosis, cell cycle arrest genes (p53-regulated) (Figure 2.2).
Additionally, late passage hMSCs have been shown to accumulate O2•- due to faulty redox mechanisms
6
(Figure 2.4) and downregulate genes and proteins associated with cell cycle regulation and the DNA
damage response9, 11
(i.e. decreased expression of p53, Figure 2.2C). Ni treatment has been shown to
stimulate intracellular ROS production75
, which causes an overwhelming increase in oxidative stress that
was seen in the present study to be well-tolerated by healthy P7-9 cells, but not late passage P12+ cells
(Figure 2.4). In parallel, our data show that late passage hMSCs intrinsically express a higher basal level
of the oncogenes c-myc and HIF1α with a concurrent reduction in p53 expression (Figure 2.2C).
Because Ni and hypoxia further enhance the levels of c-myc and HIF1 expression, respectively, and also
stimulate ROS production, the faulty redox mechanisms that are present in late passage cells, in
cooperation with altered oncogene and tumor suppressor expression, appear to predispose late passage
hMSCs to transformation susceptibility. Indeed, when implanted in vivo P12+ TI hMSCs resulted in the
21
formation of tumor-like nodules whose activities more closely resembled those of classical tumors when
compared to other groups, namely increased cellularity and proliferative index with decreased
macrophage infiltration.
As described in Figure 2.7, these combined observations reveal that P12+ hMSCs exit a senescent
state while maintaining strong expression of stemness markers and oncogenes. These alterations in cell
behavior result in increased proliferation, cell survival, and ROS with a concurrent decrease in apoptosis,
cell cycle regulation, and the DNA damage response, resulting in early hMSC transformation. Taken
together with the analysis of in vivo tissue samples following implantation, these data suggest that late
passage hMSCs in the TI condition most closely resemble an in vitro approximation of in vivo hMSC
transformation, and can be used for further studies to elucidate fundamental inter- and extra-cellular
mechanisms governing pathological changes in hMSC behavior.
Figure 2.7: Proposed mechanism by which the TI condition encourages cancerous
transformation of late passage hMSCs. This process involves three external modulators (hypoxia,
Ni, and cell passage) that alter the activity of three internal regulators (p53, HIF1, and c-myc) to
promote hMSC transformation. Oncogenes are shown in green boxes and tumor suppressor is shown
in the yellow box. Hypoxia promotes proliferation and cell survival by accumulating HIF1 over p53
production, and upregulating the expression of HIF1-regulated genes. HIF1 directly inhibits
transactivation of p53. Ni treatment causes the accumulation of c-myc over p53 production, and
stabilizes HIF1, thereby further downregulating the expression of p53-regulated genes. Cell
aging/passage result in accumulation of c-myc, decreased p53 expression, and buildup of ROS due to
faulty redox mechanisms. In carcinogenic hypoxia, late passage hMSCs experience serial insults that
promote their exit from senescence while maintaining expression of stemness markers, increasing
proliferation, cell survival, and ROS, and decreasing apoptosis, cell cycle regulation, and the DNA
damage response. These factors, when combined, are proposed to result in cancerous transformation
of late passage hMSCs.
22
CHAPTER 3
Specific Aim #2: Physicochemical polymer properties modulate hMSC redox and stemness
status
Introduction
The goal of this Aim is to identify the influence of physiochemical matrix cues from the synthetic
cell culture substrates on late passage hMSC behavior in terms of redox mechanisms and the expression
of stemness genes/proteins (discussed in Chapter I). These matrix cues include stiffness, protein/cell
adhesiveness, surface topography, and contact angle with water, all of which are regulated by the
chemical composition of the material. The cellular response to these properties can be considered a
“structure-function relationship” in which the material structure directly influences cellular functions, and
surveying how cells respond to test polymer culture substrates with differing properties will provide
insight for extrinsic regulation of these biological mechanisms by the polymers (“outside-in signaling”).
In previous work from the Sung laboratory, a library of block copolymers was developed as cell
culture substrates for regulating the behavior, phenotype, and oxidative activities of primary human
coronary artery endothelial and smooth muscle cells (SW Crowder et al. Acta Biomater 2012)82
.
Following from this work, the current chapter is divided into three portions:
(i) A brief discussion of the work referenced above in which the copolymers were
synthesized and characterized in terms of the physicochemical and mechanical properties;
(ii) A description and thorough characterization of the surface and biointerface
properties of the copolymers;
(iii) Observation and measurements of cellular behaviors when cultured atop the
copolymer substrates
Copolymers composed of three subunits at varying molar ratios were employed for both first- and
second-generation libraries: poly(ε-caprolactone) (PCL) is a slow degrading, hydrophobic, biocompatible
polymer that has been used in various biomedical applications52, 83, 84
; poly(ethylene glycol) (PEG) is a
hydrophilic polyether that can influence surface chemistry related to anti-adhesion of proteins and cells85
,
bulk and degradation properties86, 87
and oxidative activity88, 89
; and, carboxyl PCL (cPCL) which carries a
negative charge that improves hydrophilicity, can counteract repellent effects of PEG89
, and provides a
site for functionalization of bioactive molecules to the polymer backbone90
. Copolymers of x mole %
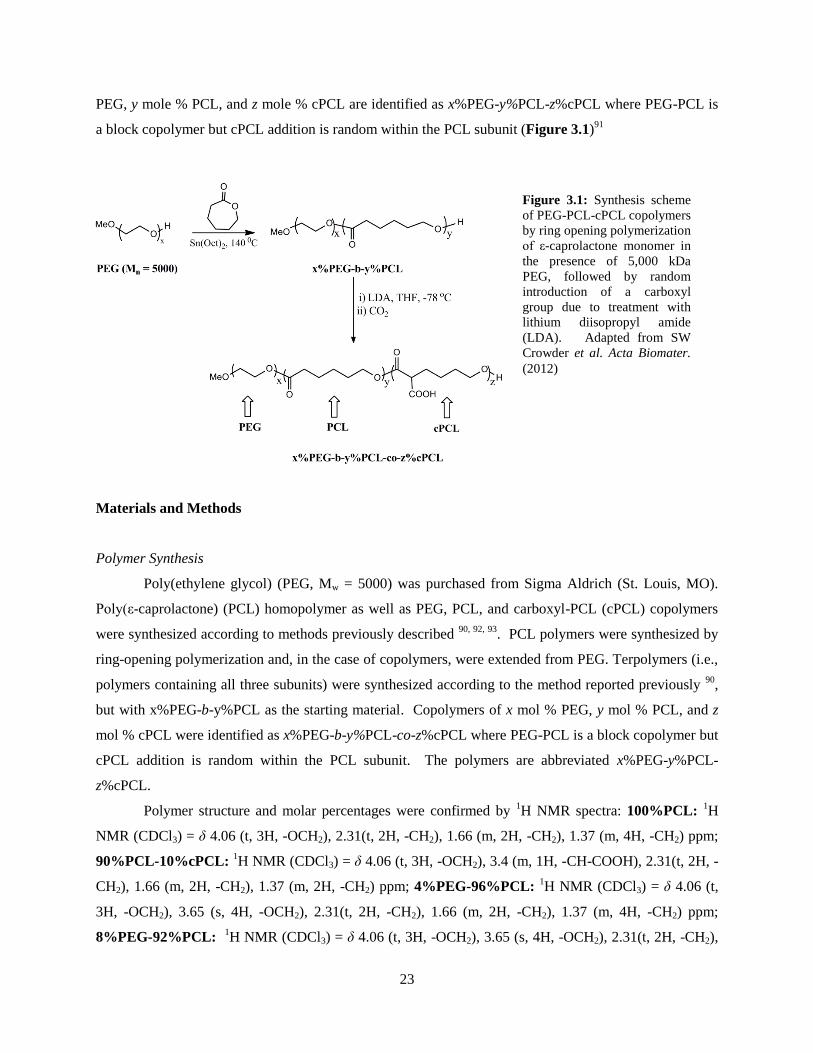
23
PEG, y mole % PCL, and z mole % cPCL are identified as x%PEG-y%PCL-z%cPCL where PEG-PCL is
a block copolymer but cPCL addition is random within the PCL subunit (Figure 3.1)91
Materials and Methods
Polymer Synthesis
Poly(ethylene glycol) (PEG, Mw = 5000) was purchased from Sigma Aldrich (St. Louis, MO).
Poly(ε-caprolactone) (PCL) homopolymer as well as PEG, PCL, and carboxyl-PCL (cPCL) copolymers
were synthesized according to methods previously described 90, 92, 93
. PCL polymers were synthesized by
ring-opening polymerization and, in the case of copolymers, were extended from PEG. Terpolymers (i.e.,
polymers containing all three subunits) were synthesized according to the method reported previously 90
,
but with x%PEG-b-y%PCL as the starting material. Copolymers of x mol % PEG, y mol % PCL, and z
mol % cPCL were identified as x%PEG-b-y%PCL-co-z%cPCL where PEG-PCL is a block copolymer but
cPCL addition is random within the PCL subunit. The polymers are abbreviated x%PEG-y%PCL-
z%cPCL.
Polymer structure and molar percentages were confirmed by 1H NMR spectra: 100%PCL:
1H
NMR (CDCl3) = δ 4.06 (t, 3H, -OCH2), 2.31(t, 2H, -CH2), 1.66 (m, 2H, -CH2), 1.37 (m, 4H, -CH2) ppm;
90%PCL-10%cPCL: 1H NMR (CDCl3) = δ 4.06 (t, 3H, -OCH2), 3.4 (m, 1H, -CH-COOH), 2.31(t, 2H, -
CH2), 1.66 (m, 2H, -CH2), 1.37 (m, 2H, -CH2) ppm; 4%PEG-96%PCL: 1H NMR (CDCl3) = δ 4.06 (t,
3H, -OCH2), 3.65 (s, 4H, -OCH2), 2.31(t, 2H, -CH2), 1.66 (m, 2H, -CH2), 1.37 (m, 4H, -CH2) ppm;
8%PEG-92%PCL: 1H NMR (CDCl3) = δ 4.06 (t, 3H, -OCH2), 3.65 (s, 4H, -OCH2), 2.31(t, 2H, -CH2),
Figure 3.1: Synthesis scheme
of PEG-PCL-cPCL copolymers
by ring opening polymerization
of ε-caprolactone monomer in
the presence of 5,000 kDa
PEG, followed by random
introduction of a carboxyl
group due to treatment with
lithium diisopropyl amide
(LDA). Adapted from SW
Crowder et al. Acta Biomater.
(2012)
24
1.66 (m, 2H, -CH2), 1.37 (m, 4H, -CH2) ppm; 4%PEG-86%PCL-10%cPCL: 1H NMR (CDCl3) = δ 4.06
(t, 3H, -OCH2), 3.4 (m, 1H, - CH-COOH), 2.31(t, 2H, -CH2), 1.66 (m, 2H, -CH2), 1.37 (m, 2H, -CH2)
ppm; 8%PEG-82%PCL-10%CPCL: 1H NMR (CDCl3) = δ 4.06 (t, 3H, -OCH2), 3.4 (m, 1H, -CH-
COOH), 2.31(t, 2H, -CH2), 1.66 (m, 2H, -CH2), 1.37 (m, 2H, -CH2) ppm.
Characterization of Physicochemical and Mechanical Properties (adapted from SW Crowder et al.
2012)82
Copolymers were characterized by thermogravimetric analysis (TGA), differential scanning
calorimetry (DSC), and dynamic mechanical analysis (DMA). For testing mechanical and thermal
properties, solvent cast films were prepared at 5% weight/volume (w/v) in dichloromethane (DCM),
poured into a 100 mm glass Petri dish, left at room temperature in air overnight, and then placed under
vacuum for two days to remove excess solvent. Differential scanning calorimetry (Q1000, TA
Instruments, New Castle, DE, USA) was performed with sample mass between 5 and 10 mg in aluminum
pans with tops. The procedure included two temperature sweeps from -80°C to 100°C with a ramp rate of
10°C / minute. The values from the second sweep were reported such that thermal history was erased (n
= 3). Thermogravimetric analysis (TGA-1000, Instrument Specialist Inc., Twin Lakes, WI) was
performed using a heating rate of 20oC / minute to a final temperature of 600
oC. Dried polymer powder
was used for DSC and TGA experiments.
Dynamic mechanical analysis (Q800 DMA, TA Instruments) was performed with samples that
were soaked in dH2O at 37°C for 2 days prior to testing. Samples were hydrated prior to testing to
evaluate the mechanical properties as they would be in physiological conditions. Wet stress and strain
were recorded using a submersion clamp containing dH2O at room temperature. A preload force of 0.1 N
was applied to each sample and force was increased at a rate of 0.1 N/minute until failure. The average
Young’s Modulus is reported (n = 3). For temperature sweeps, a tension clamp was used with dry
samples in air. The procedure included two runs from -80°C to 50°C with a ramp rate of 20 °C/minute
and a displacement of 30 μm at 1 Hz (original sample length was 25 mm). All values were calculated
using Universal Analysis software provided by TA Instruments.
Thin Film Substrate Preparation for Cell Culture, and Surface/Biointerface Characterization
Unless otherwise noted, all in vitro experiments were performed on spin-coated polymer films
that were prepared with a commercial spin-coater (Laurell Technologies, North Wales, PA, USA).
Circular glass cover slips (15 mm in diameter; Fisher Scientific) were first cleaned with 100% ethanol
(Sigma Aldrich), rinsed with dH2O, and heated to 80°C for ~20 min to dry. A 1% weight/volume (w/v)
solution of the specified polymer in tetrahydrofuran (THF, Sigma) was spun for 30 seconds at 3,000 RPM
atop the clean glass cover slip (50 μl polymer solution / sample). Samples were then exposed to constant
25
vacuum for ≥30 min to remove excess solvent and kept in a desiccator until use. For cell experiments,
substrates were UV sterilized for 30-60 min on each side before use; for 15 mm cover glass or 3D
scaffolds, samples were placed in a 24-well plate, and secured with an autoclaved silicon O-ring
(McMaster Carr, Atlanta, GA, USA).
Characterization of Surface Properties and Biointerface Properties
Surface roughness was measured on dry, spin-coated samples by profilometry (Dektak 150
Surface Profiler, Veeco, Plainview, NY, USA) using a 2 mg force, a 1000 μm scan length over 10
seconds, and a 65.6 μm z-axis scan range. Ten measurements were made on each of three independent
samples and the average deviation from the arithmetic mean (Ra) is reported. Protein adsorption was
measured by quartz crystal microbalance with dissipation (QCM-D). Polymer was spin coated onto gold-
coated quartz crystal (5 MHz, QSX 301; Q-Sense AB, Goetenberg, Sweden) using a ~50 ml of 10 mg / ml
solution at 3000 rpm for 30 s using a spin coater (Headway Research Inc., TX). QCM-D measurements
were carried out using a Q-Sense E4 instrument (Q-Sense AB, Goetenberg, Sweden) at 37.5 °C with 10%
FBS, according to standard protocols94
. The data were analyzed using Voigt model in the Q Tools
software supplied by Q-Sense, Inc. Contact angle was performed with a goniometer (Ramé-Hart,
Succassunna, NJ, USA) using 10 μl droplets of deionized water. Three measurements were taken on each
of three independent samples, and the average advancing contact angle is reported (n = 9).
Surface topography was observed with a scanning electron microscope (Hitachi S-4200, Tokyo,
Japan) at an accelerating voltage of 1 – 5 kV, after gold sputter coating (Cressington Scientific, Watford,
United Kingdom) for 1 minute at a separation height of 6 cm. Samples that were exposed to PBS
incubation were soaked in PBS overnight at 37°C in a humidified incubator, moved to a desiccator for at
least one day to dry, and were then prepared for SEM. For collagen adsorption, spin-coated samples were
incubated with fluorescein-labelled calf skin collagen (Elastin Products Inc, Owensville, MO, USA) at
100 μg / ml in PBS for at least two hours at 37°C in a humidified incubator, and were then rinsed four
times with PBS before imaging. Fluorescent samples were imaged under a Nikon Eclipse Ti inverted
fluorescence microscope (Nikon Instruments Inc, Melville, NY).
Cell Culture
hMSCs were either purchased from Lonza (Walkersville, MD, USA) or acquired from patients at
Vanderbilt University Medical Center in cooperation with Dr. Pampee P. Young, according to previously
published methods95
. hMSCs were maintained in complete media (CM) composed of alpha-minimum
essential media with nucleosides (Life Technologies, Carlsbad, CA, USA) with 16.7% fetal bovine serum
(Life Technologies), 1% penicillin/streptomycin (Life Technologies), and 4 μg / ml plasmocin
26
(InvivoGen, San Diego, CA, USA). Cells were kept in a humidified incubator at 37°C and 5% CO2, and
media was replaced twice each week. When ~80% confluent, hMSCs were detached with 0.05% trypsin-
EDTA, re-seeded at a density of 100 - 500 cell / cm2, and cultured for 7-14 before reaching confluence
(depending upon passage number). For all experiments, cells were seeded at a density of 10,000 viable
cells / cm2, as determined by exclusion of Trypan blue, and cultured for three days.
Western Blot
Western blots were performed with standard protocols, as described in Specific Aim #1. Primary
antibodies included mouse anti-human APE/Ref-1 (1:4000, Abcam) and rabbit anti-human β-actin
(1:2000, Abcam). HRP-conjugated secondary antibodies were raised in goat (1:3000, Abcam).
Immunocytochemistry
To measure cell proliferation by 5-bromo-2’-deoxyuridine (BrdU) incorporation, 20 μM BrdU
was added to hMSC culture media for 16 hours; fixed with 4% paraformaldehyde (PFA, Sigma) for 15
min; permeabilized with 0.3% Triton-X (Sigma) for 15 min; and blocked with 10% goat serum (Sigma)
for >2 hours, all at room temperature. DNA was denatured by treatment with HCl (1 N 10 min on ice, 2N
10 min at room temperature, followed by 20 min at 37°C, and neutralized with borate buffer (pH 9.0 ) for
12 min at room temperature). hMSCs were then incubated with 1:100 rat anti-BrdU primary antibodies
(Abcam, Cambridge, MA, USA) overnight at 4°C, followed by incubation with 1:200 DyLight594-
conjugated goat anti-rat secondary antibodies (Abcam) for 2 hours at room temperature, and
counterstained with Hoechst (Sigma, 2μg / ml). For staining filamentous actin, hMSCs were fixed with
4%PFA and blocked with 10% goat serum, then incubated with AlexFluor488-labelled phalloidin (Life
Technologies) in 1% bovine serum albumin (BSA) in PBS for 20 minutes, following the manufacturer’s
protocol. Cells were then washed and counterstained with Hoechst. Imaging was performed with a
Nikon Ti inverted microscope (Nikon Instruments Inc., Melville, NY, USA). Percent proliferating cells
represents the number of BrdU-positive cells out of the total number of cells in each field of view (n ≥ 12
images / group).
ROS Measurement by Flow Cytometry
hMSCs were incubated with 10 μM 5-chloromethyl-2’,7’-dichlorodihydrofluorescein diacetate
(CM-H2DCFDA, Life Technologies) for 45 min at 37°C, trypsinized and pelleted by centrifugation (500x
g, 5 min), and resuspended in 0.05% Trypan blue in PBS to quench extracellular fluorescence. Cells were
then run on a FACS Calibur flow cytometer (BD Biosciences, Franklin Lakes, NJ, USA) and data were
analyzed with FlowJo software (Tree Star Inc., Ashland, OR, USA).
27
Conventional and Quantitative Real-Time Polymerase Chain Reaction (cPCR and qRT-PCR)
hMSCs on spin-coated substrates were homogenized with the Trizol reagent (Life Technologies),
mixed with chloroform (1:5 Trizol:chloroform), and separated by centrifugation (12,000x g, 15 min,
4°C). The RNA contained within the aqueous phase was then isolated with RNeasy columns (Bio-Rad,
Hercules, CA, USA), according to the manufacturer’s instructions. cDNA was synthesized using a kit
(Applied Biosystems, Life Technologies) and qRT-PCR was performed with a SYBR Green master mix
(Bio-Rad) with 15 - 20ng cDNA and 500 nM each of forward and reverse primers, using a CFX Real-
Time PCR System (Bio-Rad). The qRT-PCR protocol included: 95°C for 3 min, followed by 40 cycles of
denaturation at 95°C for 30 sec, annealing at 58°C 30 sec, and extension at 72°C for 30 sec. PCR array
for extracellular matrix and adhesion molecules (SA Biosciences, Qiagen, Valencia, CA, USA) was
performed according to the manufacturer’s instructions. For cPCR, products were separated on a 2%
agarose gel containing ethidium bromide for 15 minutes at 100V, and bands were visualized with a gel
imaging station. For qRT-PCR, the expression of each gene of interest was normalized to expression of
glyceraldehyde 3-phosphate dehydrogenase (GAPDH) as a housekeeping gene, generating the ΔC(t)
value, and expression of 2-ΔC(t)
with n ≥ 3 biological replicates for each experiment is reported. Primer
sequences are listed in Appendix I, and only those that showed single, specific amplicons were used for
qRT-PCR experiments.
Statistical Analysis
Comparisons between two groups were performed with a Student’s unpaired t test. Comparisons
between multiple groups were performed with a one way analysis of variance (ANOVA) with a Tukey
post hoc test to adjust p-values for multiple comparisons. In all cases, p < 0.05 is considered statistically
significant. Mean ± standard deviation is reported, unless otherwise noted.
Results
Physicochemical and Mechanical Copolymer Properties
Thermal degradation of each polymer sample was first evaluated by TGA. The results reveal
stability of all polymers up to 200°C, supporting their use in physiological applications at 37°C (Figure
3.2). DSC was then used to monitor changes in the thermal properties of different polymer compositions
(Table 3.2). The enthalpy change (ΔH) and melting temperature (Tm) of 100%PEG was higher than those
of 100%PCL. Compared to 100%PCL, ΔH increased slightly upon addition of PEG to the PCL
homopolymer (i.e., 4%PEG-96%PCL and 8%PEG-92%PCL), but decreased as cPCL was generated (i.e.,
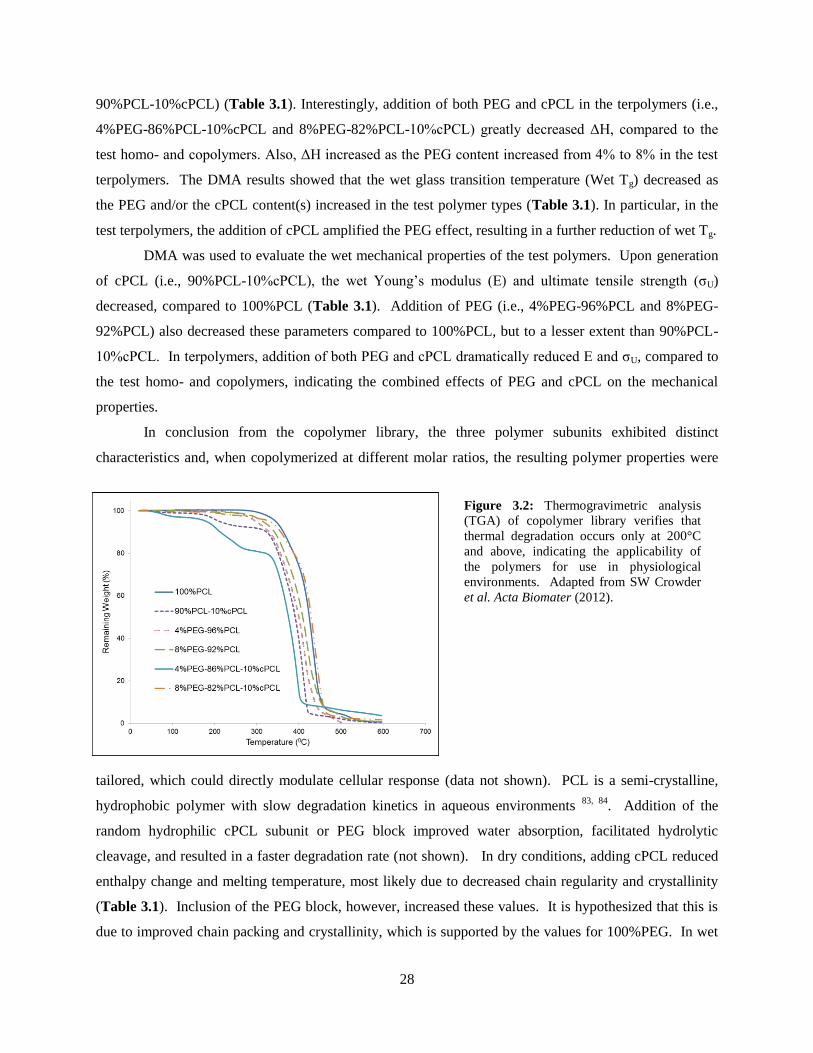
28
90%PCL-10%cPCL) (Table 3.1). Interestingly, addition of both PEG and cPCL in the terpolymers (i.e.,
4%PEG-86%PCL-10%cPCL and 8%PEG-82%PCL-10%cPCL) greatly decreased ΔH, compared to the
test homo- and copolymers. Also, ΔH increased as the PEG content increased from 4% to 8% in the test
terpolymers. The DMA results showed that the wet glass transition temperature (Wet Tg) decreased as
the PEG and/or the cPCL content(s) increased in the test polymer types (Table 3.1). In particular, in the
test terpolymers, the addition of cPCL amplified the PEG effect, resulting in a further reduction of wet Tg.
DMA was used to evaluate the wet mechanical properties of the test polymers. Upon generation
of cPCL (i.e., 90%PCL-10%cPCL), the wet Young’s modulus (E) and ultimate tensile strength (σU)
decreased, compared to 100%PCL (Table 3.1). Addition of PEG (i.e., 4%PEG-96%PCL and 8%PEG-
92%PCL) also decreased these parameters compared to 100%PCL, but to a lesser extent than 90%PCL-
10%cPCL. In terpolymers, addition of both PEG and cPCL dramatically reduced E and σU, compared to
the test homo- and copolymers, indicating the combined effects of PEG and cPCL on the mechanical
properties.
In conclusion from the copolymer library, the three polymer subunits exhibited distinct
characteristics and, when copolymerized at different molar ratios, the resulting polymer properties were
tailored, which could directly modulate cellular response (data not shown). PCL is a semi-crystalline,
hydrophobic polymer with slow degradation kinetics in aqueous environments 83, 84
. Addition of the
random hydrophilic cPCL subunit or PEG block improved water absorption, facilitated hydrolytic
cleavage, and resulted in a faster degradation rate (not shown). In dry conditions, adding cPCL reduced
enthalpy change and melting temperature, most likely due to decreased chain regularity and crystallinity
(Table 3.1). Inclusion of the PEG block, however, increased these values. It is hypothesized that this is
due to improved chain packing and crystallinity, which is supported by the values for 100%PEG. In wet
Figure 3.2: Thermogravimetric analysis
(TGA) of copolymer library verifies that
thermal degradation occurs only at 200°C
and above, indicating the applicability of
the polymers for use in physiological
environments. Adapted from SW Crowder
et al. Acta Biomater (2012).
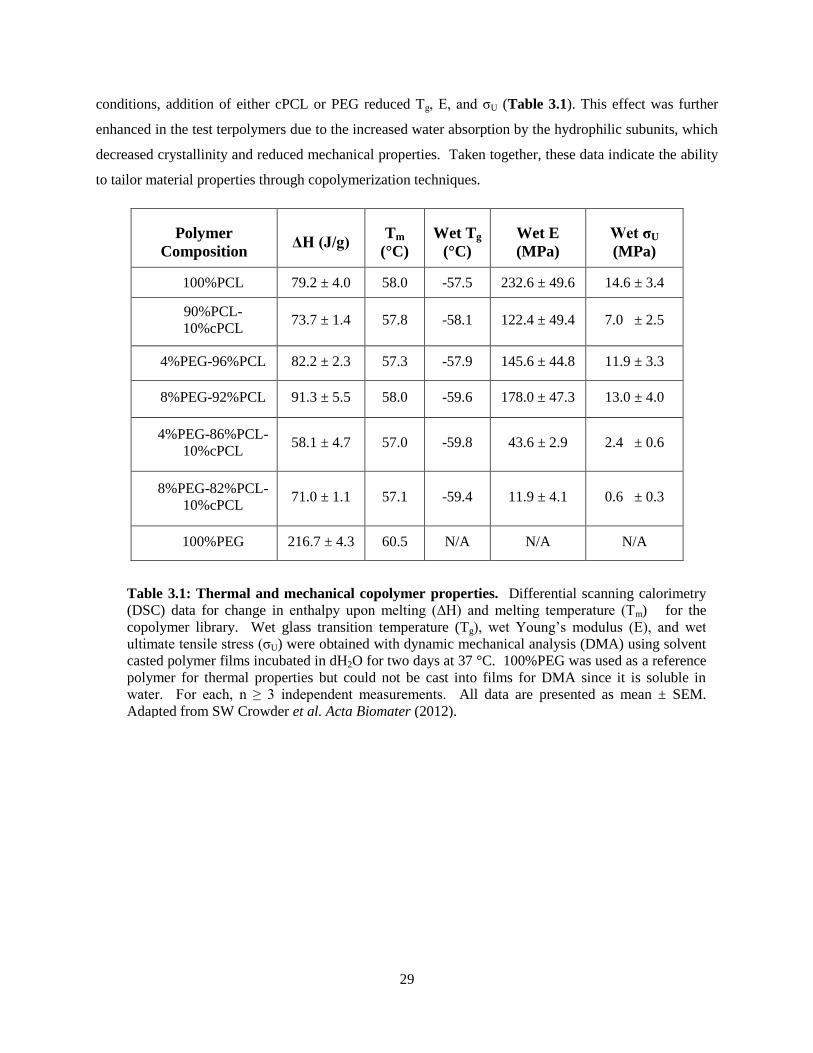
29
Table 3.1: Thermal and mechanical copolymer properties. Differential scanning calorimetry
(DSC) data for change in enthalpy upon melting (ΔH) and melting temperature (Tm) for the
copolymer library. Wet glass transition temperature (Tg), wet Young’s modulus (E), and wet
ultimate tensile stress (σU) were obtained with dynamic mechanical analysis (DMA) using solvent
casted polymer films incubated in dH2O for two days at 37 °C. 100%PEG was used as a reference
polymer for thermal properties but could not be cast into films for DMA since it is soluble in
water. For each, n ≥ 3 independent measurements. All data are presented as mean ± SEM.
Adapted from SW Crowder et al. Acta Biomater (2012).
conditions, addition of either cPCL or PEG reduced Tg, E, and σU (Table 3.1). This effect was further
enhanced in the test terpolymers due to the increased water absorption by the hydrophilic subunits, which
decreased crystallinity and reduced mechanical properties. Taken together, these data indicate the ability
to tailor material properties through copolymerization techniques.
Polymer
Composition ΔH (J/g)
Tm
(°C)
Wet Tg
(°C)
Wet E
(MPa)
Wet σU
(MPa)
100%PCL 79.2 ± 4.0 58.0 -57.5 232.6 ± 49.6 14.6 ± 3.4
90%PCL-
10%cPCL 73.7 ± 1.4 57.8 -58.1 122.4 ± 49.4 7.0 ± 2.5
4%PEG-96%PCL 82.2 ± 2.3 57.3 -57.9 145.6 ± 44.8 11.9 ± 3.3
8%PEG-92%PCL 91.3 ± 5.5 58.0 -59.6 178.0 ± 47.3 13.0 ± 4.0
4%PEG-86%PCL-
10%cPCL 58.1 ± 4.7 57.0 -59.8 43.6 ± 2.9 2.4 ± 0.6
8%PEG-82%PCL-
10%cPCL 71.0 ± 1.1 57.1 -59.4 11.9 ± 4.1 0.6 ± 0.3
100%PEG 216.7 ± 4.3 60.5 N/A N/A N/A
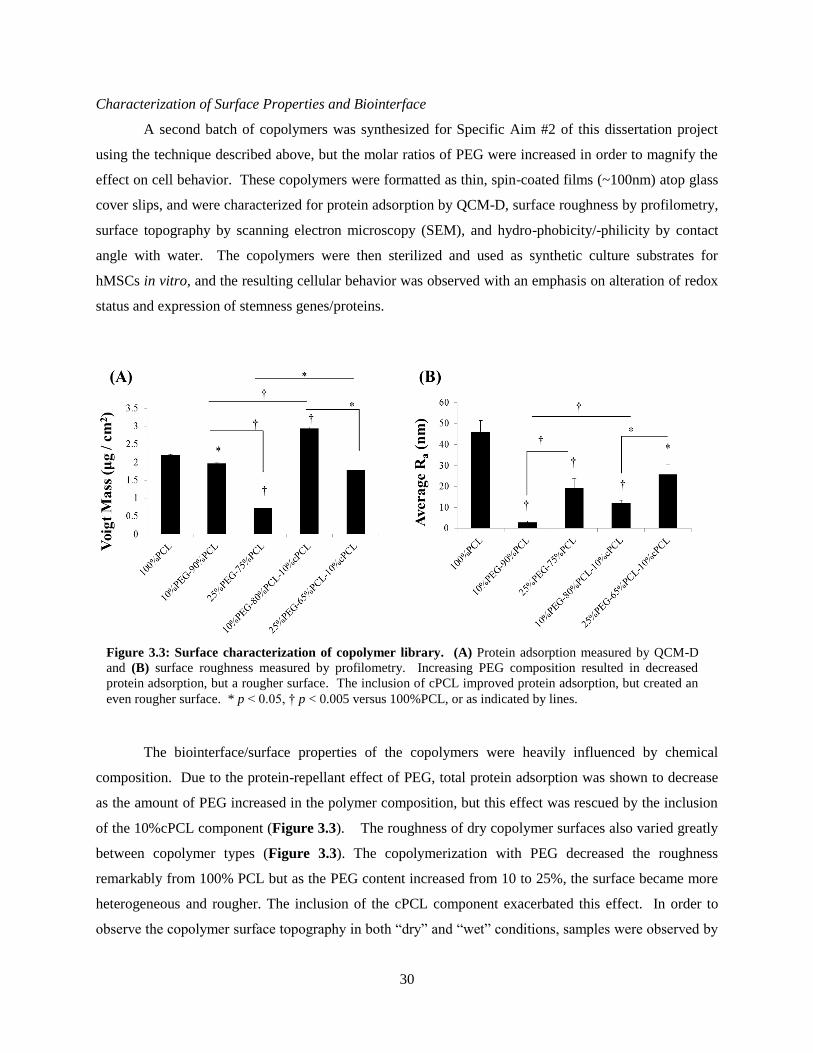
30
Characterization of Surface Properties and Biointerface
A second batch of copolymers was synthesized for Specific Aim #2 of this dissertation project
using the technique described above, but the molar ratios of PEG were increased in order to magnify the
effect on cell behavior. These copolymers were formatted as thin, spin-coated films (~100nm) atop glass
cover slips, and were characterized for protein adsorption by QCM-D, surface roughness by profilometry,
surface topography by scanning electron microscopy (SEM), and hydro-phobicity/-philicity by contact
angle with water. The copolymers were then sterilized and used as synthetic culture substrates for
hMSCs in vitro, and the resulting cellular behavior was observed with an emphasis on alteration of redox
status and expression of stemness genes/proteins.
The biointerface/surface properties of the copolymers were heavily influenced by chemical
composition. Due to the protein-repellant effect of PEG, total protein adsorption was shown to decrease
as the amount of PEG increased in the polymer composition, but this effect was rescued by the inclusion
of the 10%cPCL component (Figure 3.3). The roughness of dry copolymer surfaces also varied greatly
between copolymer types (Figure 3.3). The copolymerization with PEG decreased the roughness
remarkably from 100% PCL but as the PEG content increased from 10 to 25%, the surface became more
heterogeneous and rougher. The inclusion of the cPCL component exacerbated this effect. In order to
observe the copolymer surface topography in both “dry” and “wet” conditions, samples were observed by
Figure 3.3: Surface characterization of copolymer library. (A) Protein adsorption measured by QCM-D
and (B) surface roughness measured by profilometry. Increasing PEG composition resulted in decreased
protein adsorption, but a rougher surface. The inclusion of cPCL improved protein adsorption, but created an
even rougher surface. * p < 0.05, † p < 0.005 versus 100%PCL, or as indicated by lines.
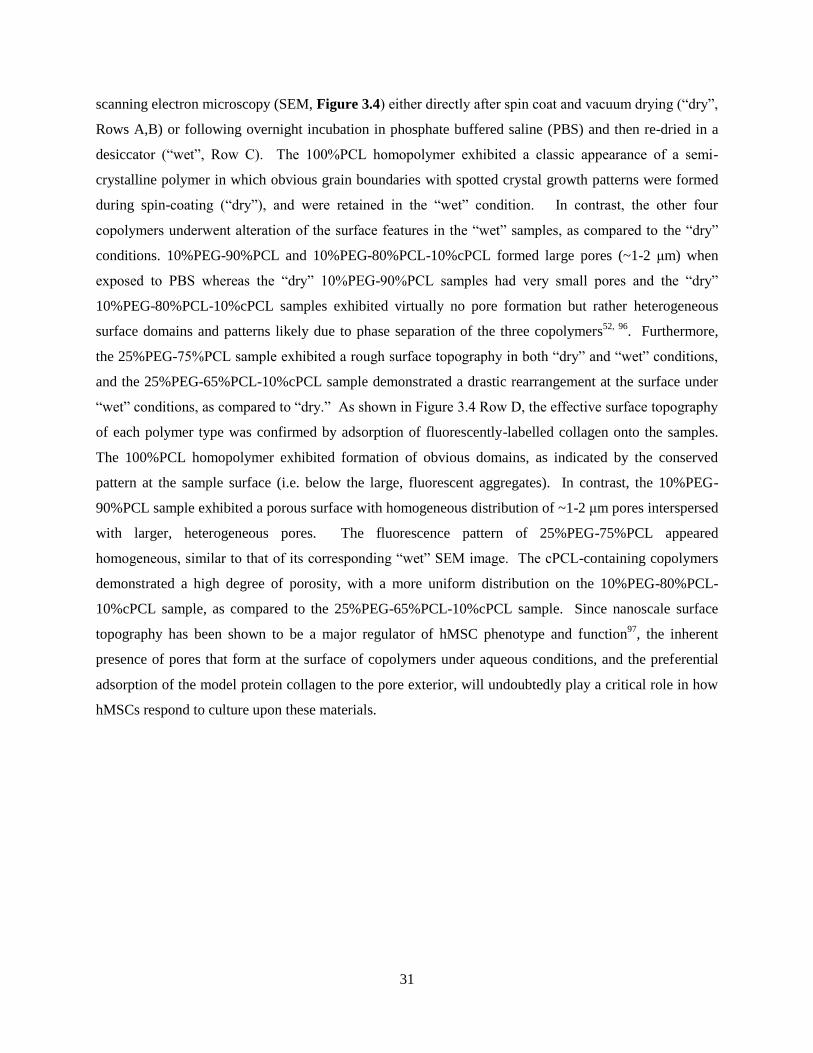
31
scanning electron microscopy (SEM, Figure 3.4) either directly after spin coat and vacuum drying (“dry”,
Rows A,B) or following overnight incubation in phosphate buffered saline (PBS) and then re-dried in a
desiccator (“wet”, Row C). The 100%PCL homopolymer exhibited a classic appearance of a semi-
crystalline polymer in which obvious grain boundaries with spotted crystal growth patterns were formed
during spin-coating (“dry”), and were retained in the “wet” condition. In contrast, the other four
copolymers underwent alteration of the surface features in the “wet” samples, as compared to the “dry”
conditions. 10%PEG-90%PCL and 10%PEG-80%PCL-10%cPCL formed large pores (~1-2 μm) when
exposed to PBS whereas the “dry” 10%PEG-90%PCL samples had very small pores and the “dry”
10%PEG-80%PCL-10%cPCL samples exhibited virtually no pore formation but rather heterogeneous
surface domains and patterns likely due to phase separation of the three copolymers52, 96
. Furthermore,
the 25%PEG-75%PCL sample exhibited a rough surface topography in both “dry” and “wet” conditions,
and the 25%PEG-65%PCL-10%cPCL sample demonstrated a drastic rearrangement at the surface under
“wet” conditions, as compared to “dry.” As shown in Figure 3.4 Row D, the effective surface topography
of each polymer type was confirmed by adsorption of fluorescently-labelled collagen onto the samples.
The 100%PCL homopolymer exhibited formation of obvious domains, as indicated by the conserved
pattern at the sample surface (i.e. below the large, fluorescent aggregates). In contrast, the 10%PEG-
90%PCL sample exhibited a porous surface with homogeneous distribution of ~1-2 μm pores interspersed
with larger, heterogeneous pores. The fluorescence pattern of 25%PEG-75%PCL appeared
homogeneous, similar to that of its corresponding “wet” SEM image. The cPCL-containing copolymers
demonstrated a high degree of porosity, with a more uniform distribution on the 10%PEG-80%PCL-
10%cPCL sample, as compared to the 25%PEG-65%PCL-10%cPCL sample. Since nanoscale surface
topography has been shown to be a major regulator of hMSC phenotype and function97
, the inherent
presence of pores that form at the surface of copolymers under aqueous conditions, and the preferential
adsorption of the model protein collagen to the pore exterior, will undoubtedly play a critical role in how
hMSCs respond to culture upon these materials.
32
Figure 3.4: Surface features and protein adsorption patterns of copolymer library. Scanning electron
microscopy images reveal surface topography for (A-B) dry and (C) wet spin-coated polymer samples. PEG-
PCL and PEG-PCL-cPCL substrates were heavily influenced by exposure to an aqueous environment, resulting
in rearrangement of the surface features. (D) Adsorption of fluorescein-labeled collagen demonstrates the
formation of adsorptive and repellant domains at the polymer surface, confirming the features observed by
SEM. Scale bars: (A) 10 μm, (B,C) 2 μm, (D) 20 μm.
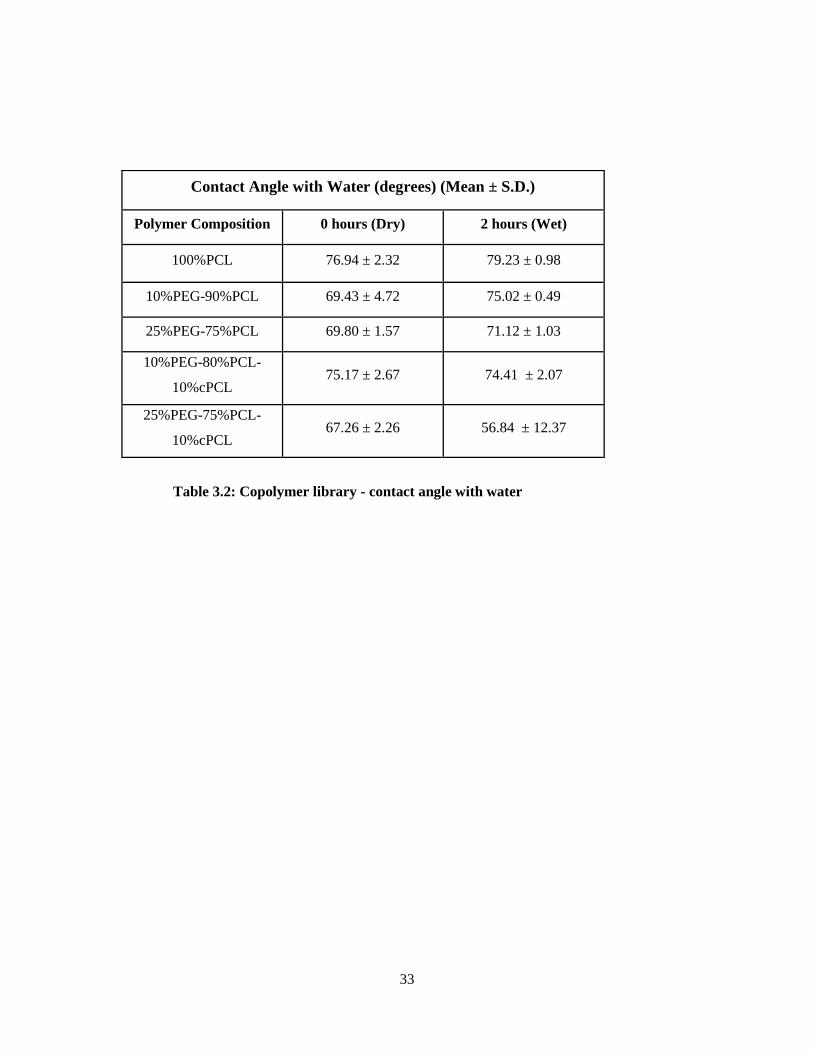
33
Table 3.2: Copolymer library - contact angle with water
Contact Angle with Water (degrees) (Mean ± S.D.)
Polymer Composition 0 hours (Dry) 2 hours (Wet)
100%PCL 76.94 ± 2.32 79.23 ± 0.98
10%PEG-90%PCL 69.43 ± 4.72 75.02 ± 0.49
25%PEG-75%PCL 69.80 ± 1.57 71.12 ± 1.03
10%PEG-80%PCL-
10%cPCL 75.17 ± 2.67 74.41 ± 2.07
25%PEG-75%PCL-
10%cPCL 67.26 ± 2.26 56.84 ± 12.37
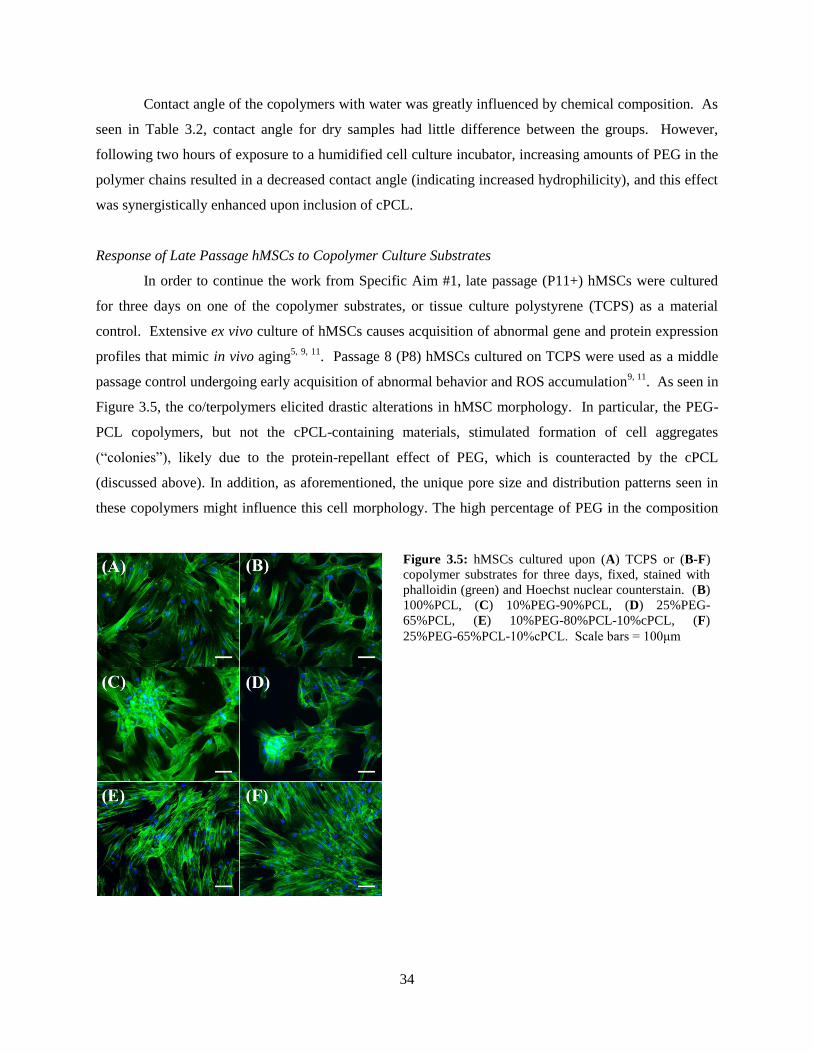
34
Contact angle of the copolymers with water was greatly influenced by chemical composition. As
seen in Table 3.2, contact angle for dry samples had little difference between the groups. However,
following two hours of exposure to a humidified cell culture incubator, increasing amounts of PEG in the
polymer chains resulted in a decreased contact angle (indicating increased hydrophilicity), and this effect
was synergistically enhanced upon inclusion of cPCL.
Response of Late Passage hMSCs to Copolymer Culture Substrates
In order to continue the work from Specific Aim #1, late passage (P11+) hMSCs were cultured
for three days on one of the copolymer substrates, or tissue culture polystyrene (TCPS) as a material
control. Extensive ex vivo culture of hMSCs causes acquisition of abnormal gene and protein expression
profiles that mimic in vivo aging5, 9, 11
. Passage 8 (P8) hMSCs cultured on TCPS were used as a middle
passage control undergoing early acquisition of abnormal behavior and ROS accumulation9, 11
. As seen in
Figure 3.5, the co/terpolymers elicited drastic alterations in hMSC morphology. In particular, the PEG-
PCL copolymers, but not the cPCL-containing materials, stimulated formation of cell aggregates
(“colonies”), likely due to the protein-repellant effect of PEG, which is counteracted by the cPCL
(discussed above). In addition, as aforementioned, the unique pore size and distribution patterns seen in
these copolymers might influence this cell morphology. The high percentage of PEG in the composition
Figure 3.5: hMSCs cultured upon (A) TCPS or (B-F)
copolymer substrates for three days, fixed, stained with
phalloidin (green) and Hoechst nuclear counterstain. (B)
100%PCL, (C) 10%PEG-90%PCL, (D) 25%PEG-
65%PCL, (E) 10%PEG-80%PCL-10%cPCL, (F)
25%PEG-65%PCL-10%cPCL. Scale bars = 100μm
35
of 25%PEG-75%PCL resulted in heterogeneity in cell seeding; in some cases, cells would adhere to the
substrate and form distinct colonies (Figure 3.5), but within the same seeding condition, wells would
exist with zero cell attachment. Because of the unpredictable nature of this substrate during experiments,
its use in these studies was limited; however, the data collected are included for sake of completeness.
Intracellular ROS levels, as measured by DCFDA fluorescence by flow cytometry (FCM), and
proliferation rate (BrdU+ cells) were mediated by cues from the copolymer substrates (Figure 3.6). Both
intracellular ROS levels (Figure 3.6A) and proliferation (Figure 3.6B) decreased for hMSCs cultured on
100%PCL, as compared to TCPS, and these levels decreased further when cultured on 10%PEG-90%PCL
and 25%PEG-75%PCL substrates, with increasing amounts of PEG in the copolymer resulting in lower
ROS levels and proliferation rates. 25%PEG-75%PCL exhibited a bimodal distribution of ROS levels,
suggesting that two, distinct populations of hMSCs with differing intracellular statuses might co-exist on
this material. Relative to the PEG-PCL copolymers, inclusion of cPCL in the polymer chain reversed the
decrease in ROS and proliferation rate, effectively reinstating the hMSCs back to levels similar to that of
TCPS. Interestingly, intracellular ROS levels correlated linearly with percent proliferating cells (R2 =
0.7832, Figure 3.6C), which agrees with data that were collected in Specific Aim #1 (Figure 2.4). Since
naïve stem cells tend to be slow-dividing with low levels of ROS98
, it is possible that the PEG-PCL
copolymers might be stimulating a reversion to a more native stem cell phenotype, effectively acting as a
synthetic niche for hMSCs.
Expression of the multifunctional APE/Ref-1 protein has been shown to decline in aging,
senescent hMSCs, and forced expression via plasmid transfection can rescue the cells from senescence
and lower intracellular ROS levels6. In order to identify how intracellular ROS are regulated by cell-
biomaterial interactions, the expression of APE/Ref-1, p53, SESN1, and SESN2 were investigated
(Figure 3.7). In agreement with previous reports6, protein-level expression of APE/Ref-1 was
downregulated in P11+ hMSCs cultured on TCPS, as compared to P8 hMSCs; however, expression was
reinstated to varying degrees on all of the polymer substrates, with the strongest expression levels on
100%PCL and 10%PEG-90%PCL, and low expression on cPCL-containing polymers. Surprisingly,
gene-level expression of all four redox-related mechanisms did not show statistical significance between
culture substrates, although trends appeared in the data. Specifically, the expression of APE/Ref-1
(Figure 3.7B) and SESN1 (Figure 3.7C) were both upregulated on copolymers with increasing PEG
content, and this effect was counteracted by cPCL. The average gene expression of APE/Ref-1 and
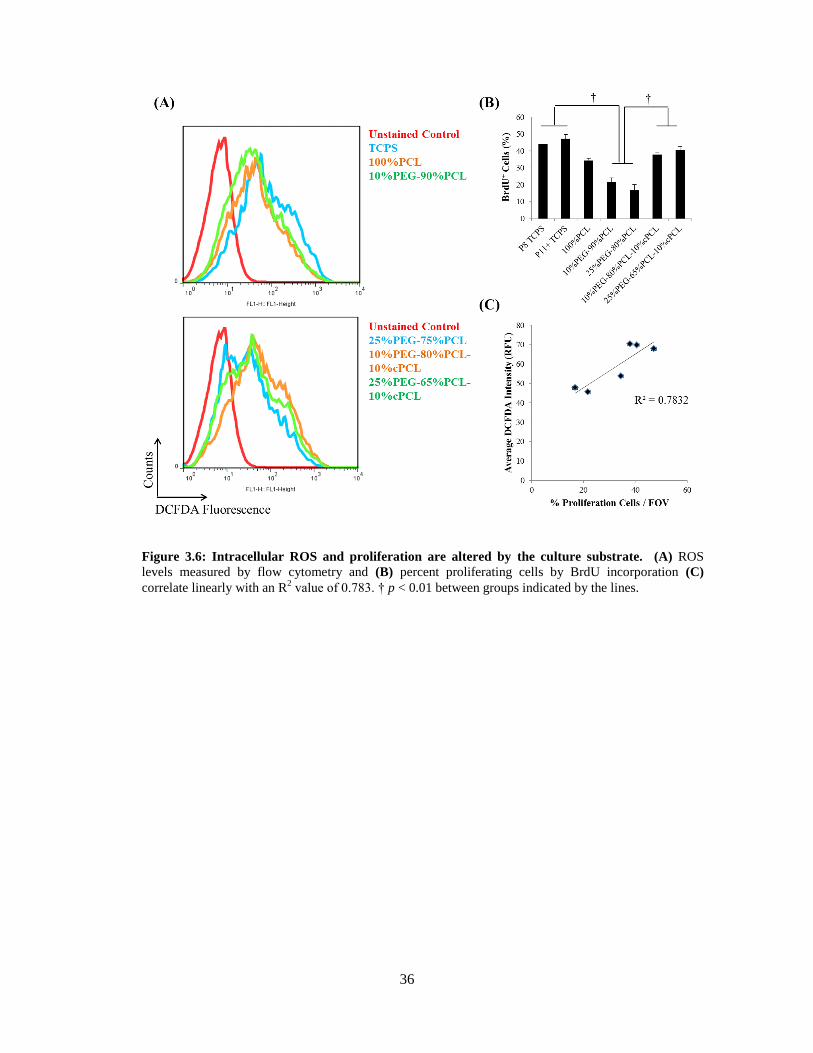
36
Figure 3.6: Intracellular ROS and proliferation are altered by the culture substrate. (A) ROS
levels measured by flow cytometry and (B) percent proliferating cells by BrdU incorporation (C)
correlate linearly with an R2 value of 0.783. † p < 0.01 between groups indicated by the lines.
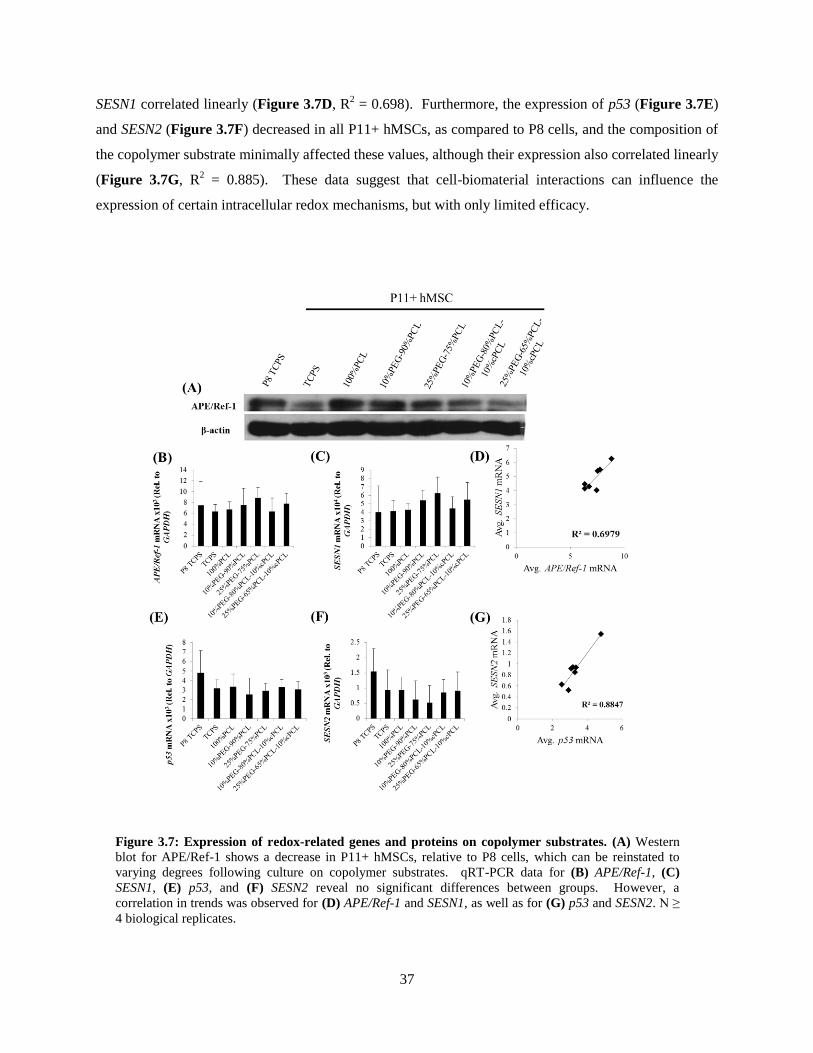
37
SESN1 correlated linearly (Figure 3.7D, R2 = 0.698). Furthermore, the expression of p53 (Figure 3.7E)
and SESN2 (Figure 3.7F) decreased in all P11+ hMSCs, as compared to P8 cells, and the composition of
the copolymer substrate minimally affected these values, although their expression also correlated linearly
(Figure 3.7G, R2 = 0.885). These data suggest that cell-biomaterial interactions can influence the
expression of certain intracellular redox mechanisms, but with only limited efficacy.
Figure 3.7: Expression of redox-related genes and proteins on copolymer substrates. (A) Western
blot for APE/Ref-1 shows a decrease in P11+ hMSCs, relative to P8 cells, which can be reinstated to
varying degrees following culture on copolymer substrates. qRT-PCR data for (B) APE/Ref-1, (C)
SESN1, (E) p53, and (F) SESN2 reveal no significant differences between groups. However, a
correlation in trends was observed for (D) APE/Ref-1 and SESN1, as well as for (G) p53 and SESN2. N ≥
4 biological replicates.
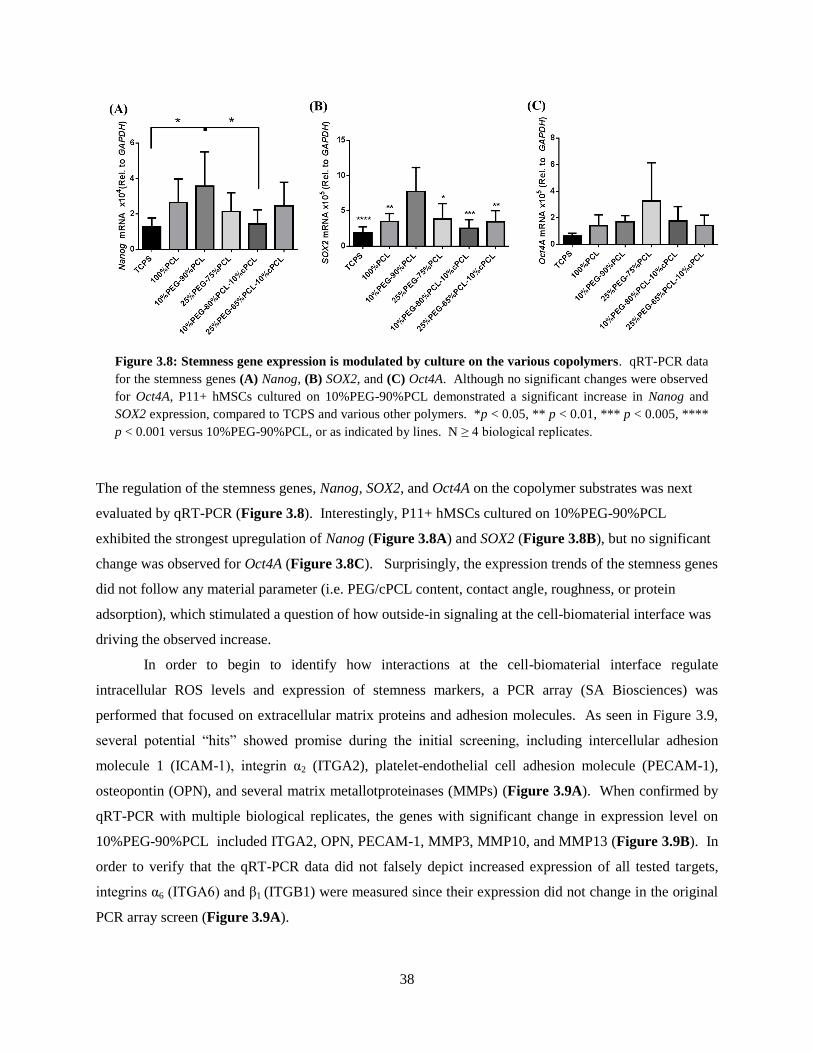
38
The regulation of the stemness genes, Nanog, SOX2, and Oct4A on the copolymer substrates was next
evaluated by qRT-PCR (Figure 3.8). Interestingly, P11+ hMSCs cultured on 10%PEG-90%PCL
exhibited the strongest upregulation of Nanog (Figure 3.8A) and SOX2 (Figure 3.8B), but no significant
change was observed for Oct4A (Figure 3.8C). Surprisingly, the expression trends of the stemness genes
did not follow any material parameter (i.e. PEG/cPCL content, contact angle, roughness, or protein
adsorption), which stimulated a question of how outside-in signaling at the cell-biomaterial interface was
driving the observed increase.
In order to begin to identify how interactions at the cell-biomaterial interface regulate
intracellular ROS levels and expression of stemness markers, a PCR array (SA Biosciences) was
performed that focused on extracellular matrix proteins and adhesion molecules. As seen in Figure 3.9,
several potential “hits” showed promise during the initial screening, including intercellular adhesion
molecule 1 (ICAM-1), integrin α2 (ITGA2), platelet-endothelial cell adhesion molecule (PECAM-1),
osteopontin (OPN), and several matrix metallotproteinases (MMPs) (Figure 3.9A). When confirmed by
qRT-PCR with multiple biological replicates, the genes with significant change in expression level on
10%PEG-90%PCL included ITGA2, OPN, PECAM-1, MMP3, MMP10, and MMP13 (Figure 3.9B). In
order to verify that the qRT-PCR data did not falsely depict increased expression of all tested targets,
integrins α6 (ITGA6) and β1 (ITGB1) were measured since their expression did not change in the original
PCR array screen (Figure 3.9A).
Figure 3.8: Stemness gene expression is modulated by culture on the various copolymers. qRT-PCR data
for the stemness genes (A) Nanog, (B) SOX2, and (C) Oct4A. Although no significant changes were observed
for Oct4A, P11+ hMSCs cultured on 10%PEG-90%PCL demonstrated a significant increase in Nanog and
SOX2 expression, compared to TCPS and various other polymers. *p < 0.05, ** p < 0.01, *** p < 0.005, ****
p < 0.001 versus 10%PEG-90%PCL, or as indicated by lines. N ≥ 4 biological replicates.
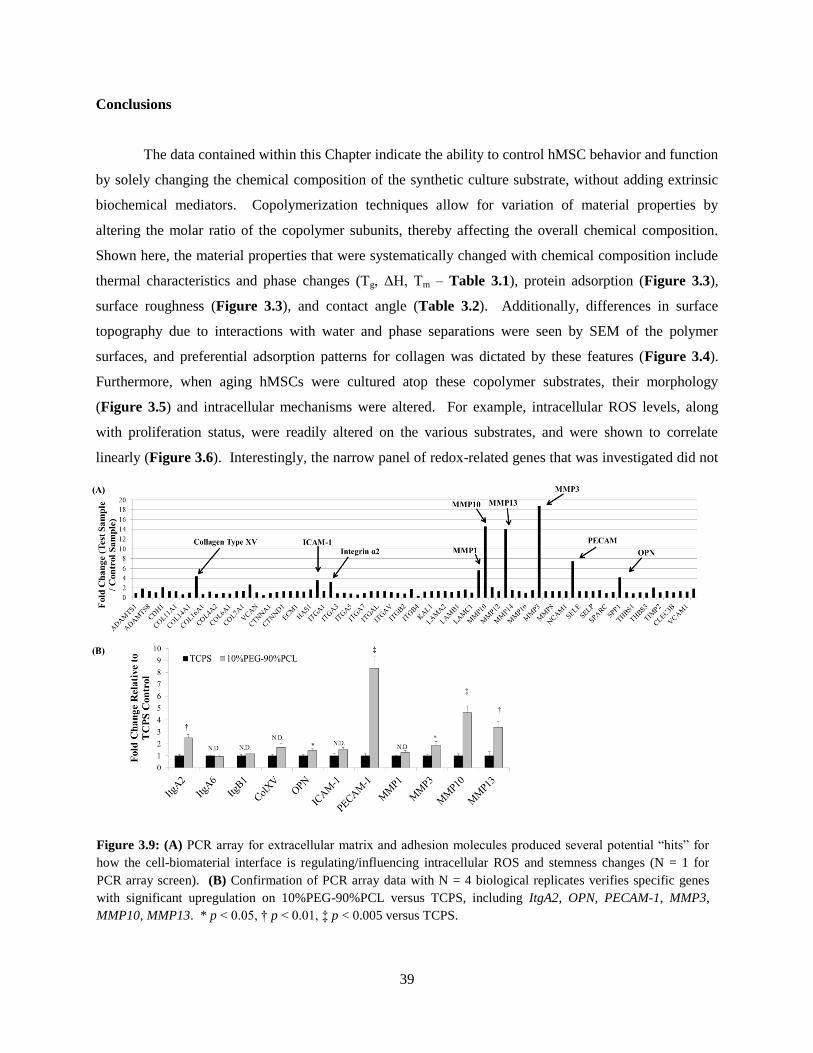
39
Conclusions
The data contained within this Chapter indicate the ability to control hMSC behavior and function
by solely changing the chemical composition of the synthetic culture substrate, without adding extrinsic
biochemical mediators. Copolymerization techniques allow for variation of material properties by
altering the molar ratio of the copolymer subunits, thereby affecting the overall chemical composition.
Shown here, the material properties that were systematically changed with chemical composition include
thermal characteristics and phase changes (Tg, ΔH, Tm – Table 3.1), protein adsorption (Figure 3.3),
surface roughness (Figure 3.3), and contact angle (Table 3.2). Additionally, differences in surface
topography due to interactions with water and phase separations were seen by SEM of the polymer
surfaces, and preferential adsorption patterns for collagen was dictated by these features (Figure 3.4).
Furthermore, when aging hMSCs were cultured atop these copolymer substrates, their morphology
(Figure 3.5) and intracellular mechanisms were altered. For example, intracellular ROS levels, along
with proliferation status, were readily altered on the various substrates, and were shown to correlate
linearly (Figure 3.6). Interestingly, the narrow panel of redox-related genes that was investigated did not
Figure 3.9: (A) PCR array for extracellular matrix and adhesion molecules produced several potential “hits” for
how the cell-biomaterial interface is regulating/influencing intracellular ROS and stemness changes (N = 1 for
PCR array screen). (B) Confirmation of PCR array data with N = 4 biological replicates verifies specific genes
with significant upregulation on 10%PEG-90%PCL versus TCPS, including ItgA2, OPN, PECAM-1, MMP3,
MMP10, MMP13. * p < 0.05, † p < 0.01, ‡ p < 0.005 versus TCPS.
40
show significant differences between groups, but revealed proportional correlations in gene-level
expression between APE/Ref-1 and SESN1, as well as p53 and SESN2 (Figure 3.7). When the expression
of the stemness genes Nanog, SOX2, and Oct4A was measured, hMSCs cultured on 10%PEG-90%PCL
exhibited a significant increase in two of these three factors, relative to TCPS (Figure 3.8). Since naïve
stem cells are known to exhibit low levels of intracellular ROS98
, reduced proliferation, and strong
expression of stemness genes, it is possible that the 10%PEG-90%PCL substrate acts as a synthetic niche
for reverting hMSCs back to a more physiologically-relevant phenotype. To identify potential
mechanisms at the cell-biomaterial interface driving the observed increase in stemness, a PCR array was
performed that focused on extracellular matrix and adhesion molecules, and a number of potential cell-
cell interaction, cell-matrix interaction, and matrix remodeling genes-of-interest were identified (Figure
3.9). To this point, the ability to regulate stem cell functions by altering material properties has been
demonstrated. In the following Chapter, the role of the copolymer substrate in regulating cell function is
investigated, with a systematic approach to identify the key mechanisms of the cell-biomaterial
interaction(s) driving this event.
41
CHAPTER 4
Specific Aim #3: Phenotypic regulation of hMSCs by polymer substrates: implication of
increased stemness and pericyte characteristics
Introduction:
In Chapter III of this dissertation, hMSC behavior was shown to be regulated by culture atop
synthetic copolymer substrates through mechanisms that remain heretofore undefined. In the current
Chapter, hMSCs cultured atop 10%PEG-90%PCL substrates will be thoroughly analyzed for their
phenotype and function by qRT-PCR, Western blot, immunocytochemical staining, flow cytometry, in
vitro functional assays, and in vivo implantation. For this portion of the study, young (i.e. low passage)
hMSCs will be used in order to evaluate the effect of the polymer in a more clinically-relevant model, as
low passage cells are usually used for therapeutic purposes. hMSCs derived from patients at Vanderbilt
University Medical Center will first be evaluated for their expression of upregulated factors that were
observed in Chapter III. Then, the gene- and protein-level expression profiles of a commercial hMSC
source will be analyzed, with regard to maintenance of hMSC stemness and pericyte phenotype. Next,
implantation of hMSCs cultured within three-dimensional, porous scaffolds fabricated from 10%PEG-
90%PCL into immunocompromised mice will be evaluated for blood vessel formation and maturation
using techniques such as optical coherence tomography (OCT). Finally, potential mechanisms driving the
outside-in signaling at the hMSC-polymer interface will be systematically identified with specific
inhibition of each mechanistic factor influencing the observed changes in hMSC behavior, eventually
leading to novel, fundamental insights regarding hMSC identity. The data generated in this dissertation,
culminating in the final points of this Aim, demonstrate a novel approach for material-mediated control
over hMSC function, providing new methodologies for generating a homogeneous hMSC population with
a pro-angiogenic, pericyte-like phenotype.
Background:
hMSCs and Pericytes
In 2008, Crisan et al. demonstrated that perivascular cells (i.e. pericytes) isolated from multiple
human organs exhibited characteristics distinctly similar to those of hMSCs99
. In particular, pericytes
were identified by a panel of markers, such as positive expression for CD146, platelet-derived growth
42
factor receptor beta (PDGFRβ), neuron-glial antigen 2 (NG2), and alpha-smooth muscle actin (αSMA),
and negative expression of vascular endothelial cadherin (VE-cadherin), Von Willebrand factor (vWF),
and PECAM. The isolated pericytes demonstrated multilineage differentiation capacity in vitro
(adipogenic, chondrogenic, osteogenic, myogenic), and exhibited an expression profile of surface proteins
identical to that of hMSCs (i.e. CD105+, CD90
+, CD146
+, CD44
+ ; CD34
-, CD133
-, CD45
-) both when
serially-expanded in vitro, as well as in the native perivascular niche in vivo. These findings raised a
fundamental question of pericyte/hMSC identity: are all hMSCs actually pericytes100
?
Pericytes, also known as mural cells, are a supportive, mesenchymal cell type that is embedded
within the vascular basement membrane of blood microvessels101, 102
. Pericytes are known to make direct
contacts with the endothelium (“peg-socket type”) and participate in the development, stabilization, and
maturation of vasculature through both physical interactions and paracrine signaling mechanisms101, 103,
104. The recruitment of pericytes to newly-formed vasculature stimulates the production of new basement
membrane in vitro105
. Furthermore, the CD146+ fraction of perivascular cells, but not unfractionated
MSCs or CD146- cells, have been shown to maintain the undifferentiated state of human hematopoietic
stem cells, suggesting a critical role for pericytes in the bone marrow niche106
. Although similar in
lineage to vascular smooth muscle cells (VSMCs), the localization and marker expression of pericytes
appear to be unique. Pericytes typically express αSMA, NG2, PDGFRβ, and regulator of G-protein
signaling 5 (RGS5)101, 104, 107
, but this expression profile can be altered in certain circumstances, such as
tumor angiogenesis and wound healing108
.
Pericytes regulate endothelial function through specific signaling pathways, including
transforming growth factor beta (TGF-β)/TGFβR, PDGF/PDGFR, and Angiopoietin-1
(Ang1)/Ang2/Tie2101, 103
. Each of these ligand/receptor combinations is tightly controlled in vivo and
represents a mutual relationship between pericytes and endothelial cells (ECs), leading to diverse and
often contradictory effects, such as pericyte recruitment, pericyte loss, vessel sprouting, or vessel
stabilization101, 103
. Of particular interest for this dissertation project is the Ang1/Ang2/Tie2 signaling
pathway. The Tie2 receptor is predominantly expressed on endothelial cells and activation by its primary
agonist, Ang1109
, leads to endothelial cell proliferation110
, vessel stabilization and pericyte coverage101
. In
vivo treatment with an Ang1-encoding plasmid enhances the formation of collateral vessels in ischemia-
induced angiogenesis111
, and in vitro Ang1 treatment of ECs results in the upregulation of proliferation,
migration, and survival genes, while downregulating proapoptotic and cycle regulatory genes112
.
Furthermore, in vitro Ang1 exposure stimulates the recruitment of smooth muscle cells through EC-
mediated release of hepatocyte growth factor113
and heparin binding EGF-like growth factor114
. In
contrast, the secondary Tie2 ligand, Ang2, antagonizes Ang1 activity by competitively binding the Tie2
receptor, but by itself is not sufficient for stimulating signal transduction115
, thereby interrupting Ang1
43
functionality101, 113
. Ang2 is, however, required for certain developmental events, such as postnatal
angiogenesis and lymphatic patterning116
, indicating that its effects are not simply redundant. Instead, it
is believed that the opposing activities of Ang1 and Ang2 support a paradigm in which constitutive
Ang1/Tie2 activity regulates fundamental vascular homeostasis, and the dynamic Ang2 activity playing a
role in short-lived processes with specific outputs. To this end, ECs are known to produce Ang2 and
maintain it in stored Weibel-Palade bodies with the ability to rapidly secrete the molecule to produce an
autocrine effect117
. Ang1, however, is produced predominantly by perivascular cells and not ECs,
maintaining steady-state vascular homeostasis118
. In the context of vessel angiogenesis, Ang1 activation
of Tie2 results in vessel stability and pericyte coverage whereas the presence of Ang2 antagonizes Ang1,
leading to lack of Tie2 activation, pericyte loss, and vessel sprouting101, 118
. Therefore, the interplay of
Ang1 and Ang2 in regards to EC homeostasis, pericyte function, and angiogenesis is complex, highly
regulated, and their balance is critically important for vascular function.
hMSCs and Pericytes in Tissue Engineering
While the use of hMSCs for regenerative therapies has exploded in the last decade, applications
of pericytes in tissue engineering remain largely uninvestigated. As expected, that majority of tissue
engineering efforts with pericytes have involved the generation and stabilization of vascular networks.
For example, one recent paper produced cell sheets from in vitro co-culture of endothelial, osteogenic,
and CD146+ perivascular cells, and showed that the stability of the vascular network was enhanced when
implanted in vivo, as evidenced by improved integration with host vasculature and increased vessel
diameter119
. In a 2010 study, a group from the University of Pittsburgh evaluated synthetic polymer
scaffolds loaded with human pericytes to generate small-diameter tissue engineered vascular grafts120
.
The authors implanted the pericyte-loaded scaffolds (or unseeded control scaffolds) as an aortic
interposition graft in a rat model for eight weeks and found that a significantly higher degree of patency
was observed with the seeded scaffolds, and a tissue architecture that resembled that of native vasculature
was present. The study possessed significant pitfalls, however, since the authors did not compare the
pericyte-loaded scaffolds with that of any other cell type, instead only an unseeded control. Furthermore,
aside from the measurement of patency, most comparisons were made between the pericyte-loaded
scaffold and the native aorta, as opposed to the control scaffold, making interpretation of the pericyte
contribution unclear.
Aside from using bona fide pericytes in tissue-engineered constructs, several investigations have
attempted to used MSCs as a pro-angiogenic supporting cell type for vascular applications121-126
,
exploiting their inherent phenotypic relationship to pericytes. One elegant study implanted hMSCs with
44
ECs in a collagen/fibronectin gel into immunodeficient mice, revealing stable vasculature formation for
more than 130 days127
. Interestingly, hMSCs alone could not form functional vasculature in vivo,
indicating that the hMSCs themselves were not undergoing EC differentiation in this context but rather
orchestrating a regulated event. The specific differences between hMSCs and pericytes tend to be
unclear in the recent literature. To address this issue, two papers were published in 2013 that have
demonstrated functional differences between the two cell types. In a short communication to Small,
Zouani et al. developed a micro-patterned system in vitro to study the ability of pericytes to stabilize EC
tubes without collapsing128
. The authors showed that pericytes, but not hMSCs, were able to migrate
through a mock basement membrane to maintain the integrity of EC tubes, whereas the MSC-supported
tubes were collapsed at 16 hours post-incubation. In parallel to these findings, a series of in vitro assays
were used to distinguish the differing abilities of pericytes and hMSCs129
. Using three different co-
culture models with human ECs, the authors demonstrated that human placenta-derived pericytes, but not
hMSCs or fibroblasts, were able to stabilize EC tubes in 2D culture atop Matrigel, promote the
spontaneous extension of angiogenic sprouts in 3D co-culture, and stimulate the formation of
interconnected, multi-layer EC cords. Furthermore, the authors showed that only the CD146+ fraction of
pericyte or hMSC populations were able to maintain EC tubes and stimulate sprouting, suggesting a
potential for overlap between the two seemingly-distinct cell types.
Maintenance of hMSC Phenotype
The majority of investigations regarding hMSC phenotype have focused on directed
differentiation toward a specific lineage. These include, but are not limited to, the classical differentiation
pathways1, such as osteogenic
32, 130-134, chondrogenic
135-138, and adipogenic
133, 139 lineages. However, as
discussed in Chapters I and II, hMSCs serially-expanded ex vivo acquire senescence-associated
abnormalities that resembles in vivo aging, thereby negating their therapeutic potential. Because of this,
some researchers have considered concepts beyond the realm of directed hMSC differentiation, instead
focusing on maintenance of stemness (an undifferentiated phenotype) in order to prevent spontaneous
differentiation. For example, a 2011 study from Nature Materials described the use of nanoscale surface
“pits” to maintain the undifferentiated state of hMSCs97
. Through a simplistic fabrication method, the
authors generated a flat poly(caprolactone) (PCL) surface with nanometer-scale pits (120nm deep) spaced
at a uniform 300nm center-to-center distance, or offset by 50nm in a random direction. The authors had
previously shown that the offset pattern generated the most effective osteogenic differentiation134
, and
took the reciprocal route in this paper by studying the surface whose properties most effectively prevented
differentiation. The equally-spaced pits were shown to retain hMSC stemness, as evidenced by the
protein-level expression of Stro-1 and ALCAM, two naïve hMSC markers, and gene-level expression of
45
CD63 and ALCAM. This study raised a fundamental question of the physiological state of hMSCs and
the in vivo niche: What is a mechanism by which the extracellular environment modulate
quiescence/maintained stemness versus proliferation/differentiation?
Extracellular Matrix Cues Influence hMSC Fate and Function
In 2006, Engler et al. published a seminal paper regarding extracellular matrix-derived cues on
hMSC fate24
. Using a crosslinked poly(acrylamide) (PA) gel system coated covalently-linked collagen,
the authors showed that hMSCs would commit to specific lineages based solely on the stiffness/elasticity
of the underlying substrate. Interestingly, the stiffness of the in vitro system appeared to correlate with
the in vivo analogue for the tissue type to which the cells were differentiating (i.e. soft matrix stimulated
neuronal differentiation, a matrix of moderate stiff stimulated myogenic differentiation, and a stiff matrix
stimulated osteogenic differentiation). This paper seemed to revolutionize how the tissue engineering and
stem cell biology communities thought about cell mechanosensing and outside-in signaling. However, in
2012 a study was released in Nature Materials that refuted the findings of Engler and colleagues, showing
that, although the same results were produced with PA gels, a similar material system composed of
poly(dimethyl siloxane) (PDMS) could not induce the same cellular response when fabricated to
corresponding stiffness values25
. Instead, the authors were able to elegantly prove that the observed effect
was, in fact, stimulated by the spacing of the tethered extracellular matrix molecules (i.e. collagen), which
was a function of PA crosslink density and effectively modulated intracellular tension. From this article,
it became clear that the events occurring at the cell-biomaterial interface are undeniably complex and
cannot be reduced to a single variable to explain large-scale, global changes within the cells.
hMSC Expression Profile in Stemness and Differentiation
The hMSC expression profile tends to be confusing as many of the markers overlap with other
cell types while other markers increase or decrease during differentiation, often in a time-dependent
manner. The commonly-accepted hMSC profile includes: CD13+, CD44
+, CD49a
+, CD49b
+, CD63
+,
CD90+, CD105
+, CD146
+ and CD11b
-, CD34
-, CD45
-, CD133
- 140. Three additional markers that are
considered to define undifferentiated, naïve hMSCs from the bone marrow include CD63 (HOP-26),
ALCAM (activated leukocyte cell adhesison molecule, CD166), and STRO-197, 141
. The STRO-1
monoclonal antibody marks the fraction of adult bone marrow that possesses osteogenic differentiation
capacity142
and colony forming potential143
. STRO-1 has been considered the best marker of hMSCs140
despite the fact that, until recently, its antigen was unknown. In 2011, the antigen to which the STRO-1
antibody binds was determined to be a 75kDa protein found in mature ECs, raising an even deeper
question of what is the nature and function of the STRO-1 antigen? Despite this lack of knowledge,
46
STRO-1 remains an important marker for isolating hMSCs and can be used to monitor the
undifferentiated status of these cells since it decreases with ex vivo expansion144
. Interestingly, pericytes
are also known to be positive for STRO-1106
which further suggests an in vivo relationship between the
two cell types that might be lost in culture.
To date, the most comprehensive phenotypic profile of the hMSC surface proteome was
performed in 2011 by Niehage and colleagues in which they identified almost 900 proteins present in the
plasma membrane by mass spectrometry and confirmed specific proteins-of-interest with flow
cytometry145
. In short, the authors verified the commonly-accepted profile of hMSCs, identified several
novel membrane-bound proteins, and were able to classify how protein expression levels changed during
osteogenic and adipogenic differentiation. Relative to uninduced hMSCs, adipogenic induction caused an
increase in expression for CD63, CD71, CD146 and CD166/ALCAM, whereas osteogenic differentiation
induced an increase in CD54 and CD166 expression. Although both CD63 and ALCAM have been used
as markers of undifferentiated hMSCs in high-impact literature97
, it is clear from this study that these
markers might not be a fair representation of stem cell status and potential. In particular, ALCAM
increased for both osteogenic and adipogenic differentiation in the Niehage study, and was shown over
fifteen years ago to be involved in osteogenesis as the Fab fragment of ALCAM antibodies to MSCs
undergoing osteogenic induction accelerated the process146
. Therefore, STRO-1, CD63, and ALCAM
appear to be useful markers for isolating naïve hMSCs, but ALCAM expression is not a clear measure of
the undifferentiated status of hMSCs during culture.
Goals of Aim3 Studies
Three critical transcription factors, Oct4A147
, Nanog, and SOX2, are known to maintain the
undifferentiated state of embryonic stem cells (ESCs) and also play a role in the maintained stemness of
hMSCs. In particular, free-floating aggregates of hMSCs have been shown to exhibit enhanced
expression of Oct4 and SOX2, which is mediated through CD49f (integrin α6)148
. Furthermore, as hMSCs
are expanded in vitro, the expression levels of Oct4 and Nanog have been shown to decrease, resulting in
spontaneous differentiation and a hyper-methylated epigenetic state149
. In regards to biomaterial culture
substrates, only a few studies have investigated the expression of hMSC stemness genes in response to
changing material cues150-152
, indicating that material-mediated control of hMSC stemness is an under-
investigated topic from which both clinical and basic science applications could benefit. Therefore, the
goals of this Aim are described in Figure 4.1, and include:
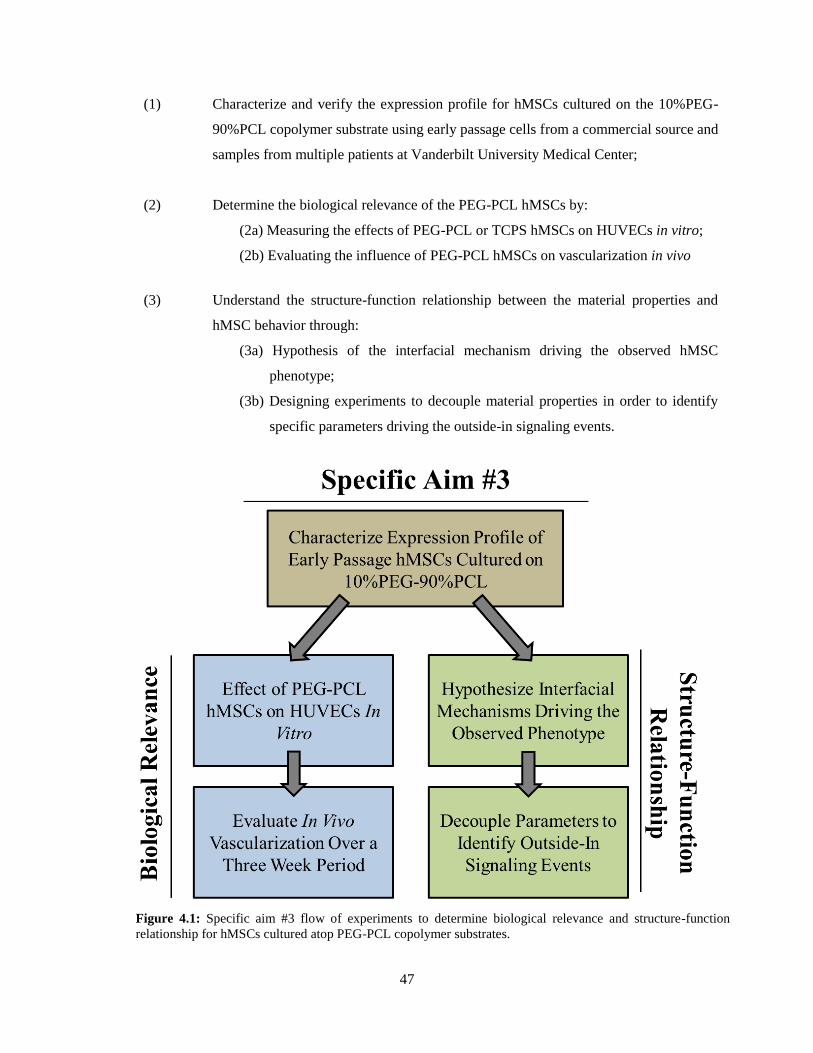
47
(1) Characterize and verify the expression profile for hMSCs cultured on the 10%PEG-
90%PCL copolymer substrate using early passage cells from a commercial source and
samples from multiple patients at Vanderbilt University Medical Center;
(2) Determine the biological relevance of the PEG-PCL hMSCs by:
(2a) Measuring the effects of PEG-PCL or TCPS hMSCs on HUVECs in vitro;
(2b) Evaluating the influence of PEG-PCL hMSCs on vascularization in vivo
(3) Understand the structure-function relationship between the material properties and
hMSC behavior through:
(3a) Hypothesis of the interfacial mechanism driving the observed hMSC
phenotype;
(3b) Designing experiments to decouple material properties in order to identify
specific parameters driving the outside-in signaling events.
Figure 4.1: Specific aim #3 flow of experiments to determine biological relevance and structure-function
relationship for hMSCs cultured atop PEG-PCL copolymer substrates.
48
Materials and Methods
Substrate Preparation for Test Polymers
Unless otherwise noted, all in vitro experiments were performed on spin-coated polymer films
that were prepared with a commercial spin-coater (Laurell Technologies, North Wales, PA, USA). 15mm
circular glass cover slips (Fisher Scientific) were first cleaned with 100% ethanol (Sigma Aldrich), rinsed
with dH2O, and heated to 80°C for ~20 min to dry. A 1% weight/volume (w/v) solution of the specified
polymer in tetrahydrofuran (THF, Sigma) was spun for 30 seconds at 3,000 RPM atop the clean glass
cover slip (50 μl polymer solution / sample). For preparation of “large-scale” Petri dish polymer films,
Pyrex Petri dishes (Corning) were cleaned as described above, and 1 mL of a 1% w/v solution of polymer
in THF was spun for 2 min at 1,500 RPM to coat the surface. All samples were then exposed to constant
vacuum for ≥30 min to remove excess solvent and kept in a desiccator until use. For preparation of salt-
leached, three-dimensional polymer scaffolds, 500 mg polymer was dissolved in 10 ml dichloromethane
(DCM) and poured over 12 g of NaCl salt crystals of specified size (size range 212 μm – 450 μm,
achieved using two different size sieves) in a Teflon dish, allowed to dry in a chemical fume hood
overnight, then further dried under vacuum for 1 hr to remove any remaining solvent. Scaffolds were cut
into the specified size (~15mm or ~6mm for 24-well or 96-well plate culture, respectively, using metal
punches) and kept in dH2O on a shaker at room temperature for 3 days to remove salts, with water
changed twice daily. Scaffolds were moved to a desiccator until use. For cell experiments, substrates
were UV sterilized for 30-60 min on each side before use; for 15mm cover glass or 3D scaffolds, samples
were placed in a 24-well plate, and secured with an autoclaved silicon O-ring (McMaster Carr, Atlanta,
GA, USA).
Cell Culture
hMSCs were either purchased from Lonza (Walkersville, MD, USA) or acquired from patients at
Vanderbilt University Medical Center in cooperation with Dr. Pampee P. Young, according to previously
published methods95
. hMSCs were used before passage 6 for this Aim, and were maintained in complete
media (CM) composed of alpha-minimum essential media with nucleosides (Life Technologies, Carlsbad,
CA, USA) with 16.7% fetal bovine serum (Life Technologies), 1% penicillin/streptomycin (Life
Technologies), and 4 μg / ml plasmocin (InvivoGen, San Diego, CA, USA). For chemically-defined
media (CDM) experiments, CDM was purchased from Lonza (TheraPEAK MSCGM-CD) and did not
contain fetuin-A (personal communication with company). For serum concentration experiments, media
with antibiotics and anti-mycoplasma agent was mixed with a predetermined amount of FBS to yield the
desired concentration. Cells were kept in a humidified incubator at 37°C and 5% CO2, and media was
49
replaced twice each week. When ~80% confluent, hMSCs were detached with 0.05% trypsin-EDTA, re-
seeded at a density of 100 - 500 cell / cm2, and cultured for 7-14 days before reaching confluence
(depending upon passage number). For all experiments, cells were seeded at a density of 10,000 viable
cells / cm2, as determined by exclusion of Trypan blue, and cultured for three or seven days, as noted.
Protein Adsorption and Liquid Chromatography-Mass Spectrometry/Mass Spectrometry (LC-MS/MS)
Complete culture media was added to wells of a 24-well plate (0.5ml / well) and proteins were
allowed to adsorb to the material surface overnight (n ≥ 3 wells / material). Media was then removed, and
the surfaces were gently washed three times with PBS to remove unadsorbed proteins. Radio
immunoprecipitation assay (RIPA) buffer containing protease and phosphatase inhibitors was then added
to each well. Eluted protein was measured by the BCA assay (Pierce, Thermo Scientific, Waltham, MA,
USA) against a bovine serum albumin (BSA) standard curve. At least three independent wells for each
substrate type were quantified and the average is reported. Proteins were then loaded onto a 10% Novex
gel (Life Technologies), resolved approximately 1 cm into the gel, and then stained with colloidal
Coomassie153
. The entire contents of each lane were subjected to in-gel trypsin digestion and resulting
peptides analyzed by a 70 minute data dependent LC-MS/MS analysis. Briefly, peptides were
autosampled onto a 200 mm by 0.1 mm (Jupiter 3 micron, 300A), self-packed analytical column coupled
directly to a linear trap quadrupole (LTQ, ThermoFisher) using a nanoelectrospray source and resolved
using an aqueous to organic gradient. A series of a full scan mass spectrum followed by 5 data-dependent
tandem mass spectra (MS/MS) was collected throughout the run and dynamic exclusion was enabled to
minimize acquisition of redundant spectra. MS/MS spectra were searched via SEQUEST against a
bovine database (UniprotKB– reference proteome set) that also contained reversed version for each of the
entries154
. Identifications were filtered and collated at the protein level using Scaffold (Proteome
Software).
Western Blot
Western blot was performed with standard protocols, as described in Specific Aim #1. Primary
antibodies are described in Appendix I, and HRP-conjugated secondary antibodies were raised in goat
(1:3000, Abcam).
Immunocytochemistry and Immunophenotyping by Flow Cytometry
hMSCs were fixed with 4% paraformaldehyde (PFA, Sigma) for 15 min, permeabilized with
0.3% Triton-X (Sigma) for 15 min when probing intracellular targets, and blocked with 10% goat serum
(Sigma) for >2 hours, all at room temperature. hMSCs were then incubated with primary antibodies in
50
1% BSA (Appendix I) overnight at 4°C, followed by incubation secondary antibodies (AlexaFluor488-,
AlexFluor-550, or AlexaFluor594-conjugated goat anti-mouse or anti-rabbit at 1:500; Abcam,
Cambridge, MA, USA) in 5% goat serum for 2 hours at room temperature, and counterstained with
Hoechst (Sigma, 2μg / ml). Imaging was performed with a Nikon Ti inverted microscope (Nikon
Instruments Inc., Melville, NY, USA) and images were processed with ImageJ (National Institutes of
Health, Bethesda, MD, USA).
For flow cytometry, unstained hMSCs were used to set voltages for the fluorescence and scatter
channels. Single-stained hMSCs were used to determine compensation values so that fluorescence signal
within one channel was definitively from a positively-stained cell. Cells were then run on a FACS
Calibur flow cytometer (BD Biosciences, Franklin Lakes, NJ, USA). Each experiment represents 10,000
gated cells, and data were analyzed by FlowJo software (Tree Star Inc., Ashland, OR, USA).
Conventional and Quantitative Real-Time Polymerase Chain Reaction (cPCR and qRT-PCR)
hMSCs on spin-coated substrates were homogenized with the Trizol reagent (Life Technologies),
mixed with chloroform (1:5 Trizol:chloroform), and separated by centrifugation (12,000x g, 15 min,
4°C). The RNA contained within the aqueous phase was then isolated with RNeasy columns (Bio-Rad,
Hercules, CA, USA), according to the manufacturer’s instructions. cDNA was synthesized using a kit
(Applied Biosystems, Life Technologies) and qRT-PCR was performed with a SYBR Green master mix
(Bio-Rad) with 15 - 20ng cDNA and 500nM each of forward and reverse primers, using a CFX Real-
Time PCR System (Bio-Rad). The qRT-PCR protocol included: 95°C for 3 min, followed by 40 cycles of
denaturation at 95°C for 30 sec, annealing at 58°C 30 sec, and extension at 72°C for 30 sec. For cPCR,
products were separated on a 2% agarose gel containing ethidium bromide for 15 minutes at 100V, and
bands were visualized with a gel imaging station. For qRT-PCR, the expression of each gene of interest
was normalized to expression of glyceraldehyde 3-phosphate dehydrogenase (GAPDH) as a
housekeeping gene, generating the ΔC(t) value, and expression of 2-ΔΔC(t)
relative to the TCPS control
with n ≥ 3 biological replicates for each experiment is reported. Primer sequences are listed in Appendix
I and only those that showed single, specific amplicons were used for qRT-PCR experiments.
In Vitro Evaluation of Conditioned Media and Lumen Formation
Red fluorescent protein (RFP)-transfected human umbilical vein endothelial cells (rHUVECs)
were purchased from Angio-Proteomie (Boston, MA, USA), maintained in MesoEndo culture media (Cell
Applications, Inc., San Diego, CA, USA) and used before passage 10. For migration experiments,
100,000 HUVECs per well were seeded in commercial transwell migration plate with 8 μm pores
(Corning Inc., Corning, NY, USA) at n ≥ 3 independent wells / group. After four hours, HUVECs that
51
had not migrated from the top layer were physically removed with a sterile cotton-tipped applicator, and
the insert was then fixed in 10% formalin, 84% methanol, and 6% water for five minutes. Cell nuclei
were then stained with Hoechst (2 μg / ml) and imaged at 10x magnification with n ≥ 6 images / sample.
The average number of migrated nuclei in each image is reported.
For co-culture studies, hMSCs were cultured on TCPS or PEG-PCL for three days, then removed
and mixed with rHUVECs (1 hMSC : 2 rHUVECs) and cultured in 1:1 MesoEndo:CM in type-I collagen
gels (1.4 mg / ml) for 48 hours before fixation (n ≥ 4 independent samples / group). Co-cultures were
then permeabilized and stained with AlexaFluor488-conjugated phalloidin (Life Technologies) and
imaged under a confocal microscope (Zeiss LSM 710). For quantification, lumen were counted and
measured (ImageJ) in each image, and the averages are reported with n ≥ 4 images / sample.
In vivo experiments
Three-dimensional scaffolds of either 100%PCL or 10%PEG-90%PCL were cut into 6 mm discs,
sterilized by UV exposure for 1 hour on each side, placed into 96-well plates, and held in place with
silicon O-rings. The bottom of the 96-well plates was first coated with 1% agarose to prevent cell
attachment, following previously published protocols148
. hMSCs were seeded at a density of 105 cells /
scaffold (or left in culture media for “blank” scaffolds) and cultured for one week in complete media
before subcutaneous implantation into the ventral region of athymic, NU/J Foxn1nu
/nu
male nude mice (6-
8 weeks of age, n = 8 animals, The Jackson Laboratory, Bar Harbor, ME, USA). Four types of scaffolds
were used for this experiment: 100%PCL without cells (“blank”), 100%PCL seeded with hMSCs,
10%PEG-90%PCL without cells (“blank”), and 10%PEG-90%PCL seeded with hMSCs. One of each
scaffold type was implanted into the same animal, totaling four scaffolds per animal into eight animals.
Speckle variance optical coherence tomography (OCT) was used for in vivo imaging155
. To
visualize projection images of the vasculature within the implanted scaffolds, volume data sets were
processed with a speckle variance technique that computes the variance in each pixel over seven repeated
A-lines at each lateral position. The resulting speckle variance images represent OCT flow signal for
perfused vessels within the imaged volume. Noise due to signal fall-off was excluded by thresholding the
corresponding structural images to create a mask, and an average signal projection over the depth (∼1
mm) of the speckle variance OCT data was used to visualize all vessels present in the volume. Images
were enhanced with an optimized, modified Frangi filter156
to enhance vessel-like features, and the
enhanced image was multiplied by the initial image to accentuate the vessels. Quantification of vessel
density was performed using MATLAB (MathWorks, Natick, MA, USA) built-in Canny edge detection157
to find edge features, and active contours to mask in edges, and the vessel density was calculated as the
mask pixels over total pixels in the image.
52
Statistical Analysis
Comparisons between two groups were performed with a Student’s unpaired t test. Comparisons
between multiple groups were performed with a one way analysis of variance (ANOVA) with a Tukey
post hoc test to adjust p-values for multiple comparisons. In all cases, p < 0.05 is considered statistically
significant. Mean ± standard deviation is reported, unless otherwise noted.
Results
Early Passage hMSC Gene and Protein Expression Profile
Specific Aims #1 and #2 focused on late passage, aging hMSCs as a model for in vivo aging, with
increased susceptibility to oncogenic insult (Aim #1) or biomaterial-mediated manipulation of cell
function (Aim #2). However, because clinical uses of hMSCs involve only brief ex vivo expansion, the
current Aim employs early passage hMSCs as a more clinically-relevant model for tissue engineering
therapies.
PECAM is expressed by all cells within the vascular compartment, including leukocytes,
platelets, and endothelial cells (ECs)158
. Classically, pericytes are considered to be negative for CD31
expression99, 107
, but debate regarding pericyte identification remains in the literature108
. Integrin α2
(ITGA2) is predominantly expressed by endothelial cells attaching to the basement membrane and is
indispensable for angiogenesis both in vitro and in vivo159, 160
. Because PECAM and ITGA2 were the
most significantly upregulated genes tested in the PCR array in Specific Aim #2 (Figure 3.9), and both of
these proteins are readily found in the vasculature, the next direction of this project focused upon
identifying the phenotype of hMSCs resulting from culture on 10%PEG-90%PCL (from here, this
polymer will be referred to as PEG-PCL). Although hMSCs demonstrate potential for vasculogenic
differentiation161, 162
, and MSCs and ECs can both originate from a common mesodermal precursor163
, the
expression of PECAM alone is not sufficient to simply assume endothelial differentiation. Therefore,
hMSCs cultured on TCPS or PEG-PCL were tested for pericyte markers at the protein level by
immunostaining and for endothelial-specific markers at the gene level in order to further clarify their
behavior.
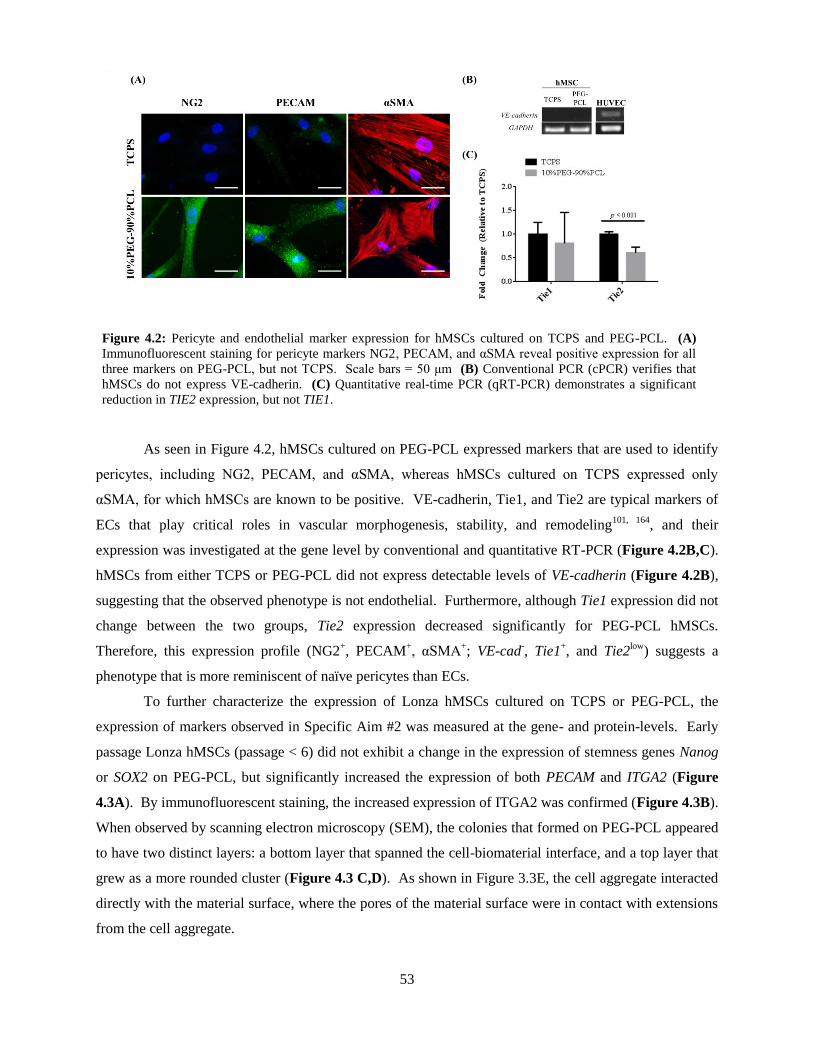
53
As seen in Figure 4.2, hMSCs cultured on PEG-PCL expressed markers that are used to identify
pericytes, including NG2, PECAM, and αSMA, whereas hMSCs cultured on TCPS expressed only
αSMA, for which hMSCs are known to be positive. VE-cadherin, Tie1, and Tie2 are typical markers of
ECs that play critical roles in vascular morphogenesis, stability, and remodeling101, 164
, and their
expression was investigated at the gene level by conventional and quantitative RT-PCR (Figure 4.2B,C).
hMSCs from either TCPS or PEG-PCL did not express detectable levels of VE-cadherin (Figure 4.2B),
suggesting that the observed phenotype is not endothelial. Furthermore, although Tie1 expression did not
change between the two groups, Tie2 expression decreased significantly for PEG-PCL hMSCs.
Therefore, this expression profile (NG2+, PECAM
+, αSMA
+; VE-cad
-, Tie1
+, and Tie2
low) suggests a
phenotype that is more reminiscent of naïve pericytes than ECs.
To further characterize the expression of Lonza hMSCs cultured on TCPS or PEG-PCL, the
expression of markers observed in Specific Aim #2 was measured at the gene- and protein-levels. Early
passage Lonza hMSCs (passage < 6) did not exhibit a change in the expression of stemness genes Nanog
or SOX2 on PEG-PCL, but significantly increased the expression of both PECAM and ITGA2 (Figure
4.3A). By immunofluorescent staining, the increased expression of ITGA2 was confirmed (Figure 4.3B).
When observed by scanning electron microscopy (SEM), the colonies that formed on PEG-PCL appeared
to have two distinct layers: a bottom layer that spanned the cell-biomaterial interface, and a top layer that
grew as a more rounded cluster (Figure 4.3 C,D). As shown in Figure 3.3E, the cell aggregate interacted
directly with the material surface, where the pores of the material surface were in contact with extensions
from the cell aggregate.
Figure 4.2: Pericyte and endothelial marker expression for hMSCs cultured on TCPS and PEG-PCL. (A)
Immunofluorescent staining for pericyte markers NG2, PECAM, and αSMA reveal positive expression for all
three markers on PEG-PCL, but not TCPS. Scale bars = 50 μm (B) Conventional PCR (cPCR) verifies that
hMSCs do not express VE-cadherin. (C) Quantitative real-time PCR (qRT-PCR) demonstrates a significant
reduction in TIE2 expression, but not TIE1.
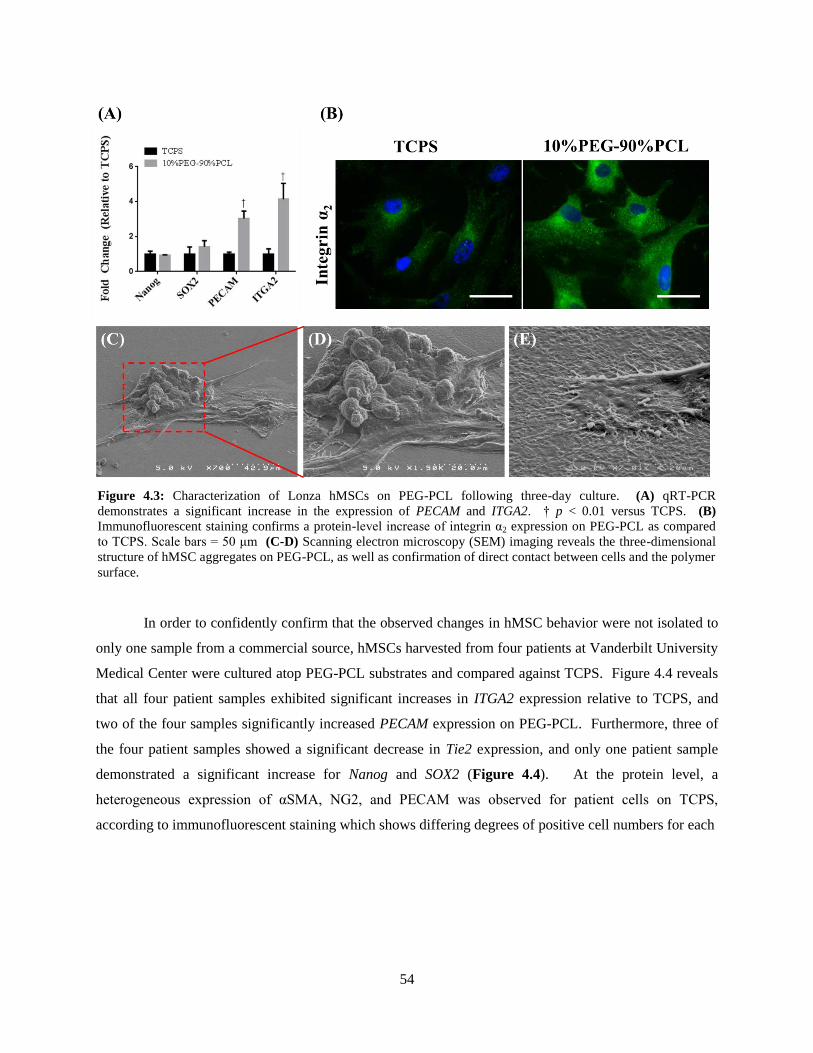
54
In order to confidently confirm that the observed changes in hMSC behavior were not isolated to
only one sample from a commercial source, hMSCs harvested from four patients at Vanderbilt University
Medical Center were cultured atop PEG-PCL substrates and compared against TCPS. Figure 4.4 reveals
that all four patient samples exhibited significant increases in ITGA2 expression relative to TCPS, and
two of the four samples significantly increased PECAM expression on PEG-PCL. Furthermore, three of
the four patient samples showed a significant decrease in Tie2 expression, and only one patient sample
demonstrated a significant increase for Nanog and SOX2 (Figure 4.4). At the protein level, a
heterogeneous expression of αSMA, NG2, and PECAM was observed for patient cells on TCPS,
according to immunofluorescent staining which shows differing degrees of positive cell numbers for each
Figure 4.3: Characterization of Lonza hMSCs on PEG-PCL following three-day culture. (A) qRT-PCR
demonstrates a significant increase in the expression of PECAM and ITGA2. † p < 0.01 versus TCPS. (B)
Immunofluorescent staining confirms a protein-level increase of integrin α2 expression on PEG-PCL as compared
to TCPS. Scale bars = 50 μm (C-D) Scanning electron microscopy (SEM) imaging reveals the three-dimensional
structure of hMSC aggregates on PEG-PCL, as well as confirmation of direct contact between cells and the polymer
surface.
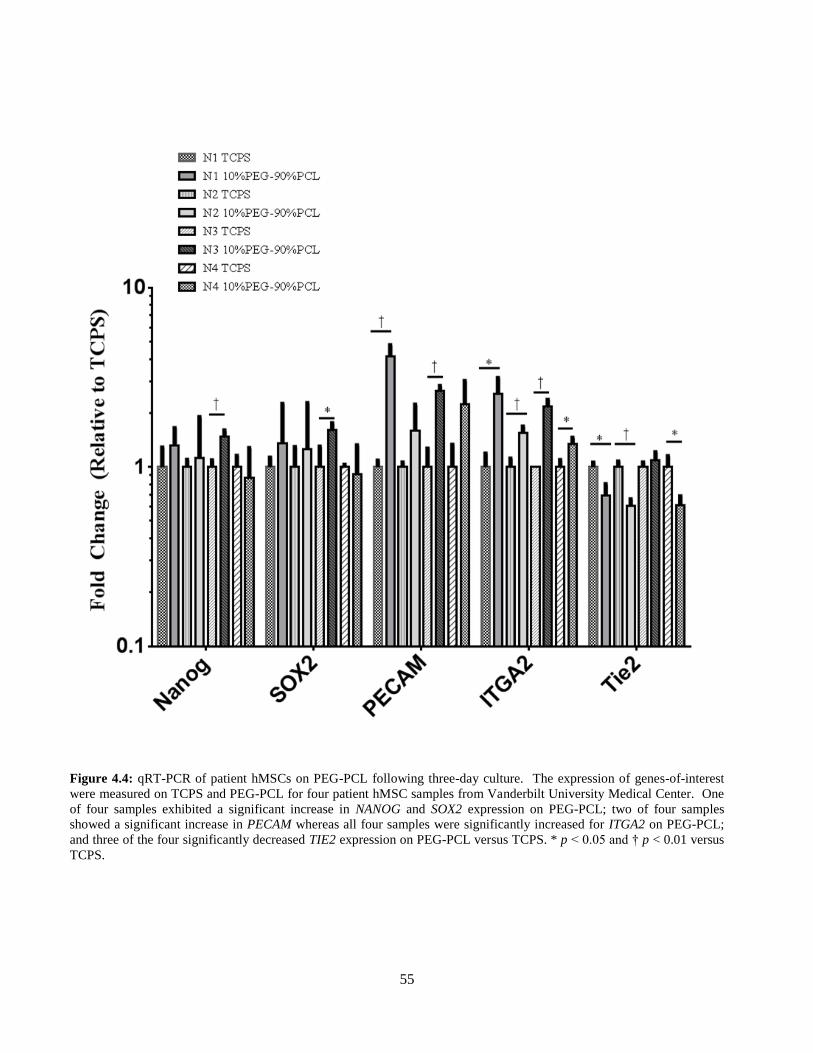
55
Figure 4.4: qRT-PCR of patient hMSCs on PEG-PCL following three-day culture. The expression of genes-of-interest
were measured on TCPS and PEG-PCL for four patient hMSC samples from Vanderbilt University Medical Center. One
of four samples exhibited a significant increase in NANOG and SOX2 expression on PEG-PCL; two of four samples
showed a significant increase in PECAM whereas all four samples were significantly increased for ITGA2 on PEG-PCL;
and three of the four significantly decreased TIE2 expression on PEG-PCL versus TCPS. * p < 0.05 and † p < 0.01 versus
TCPS.
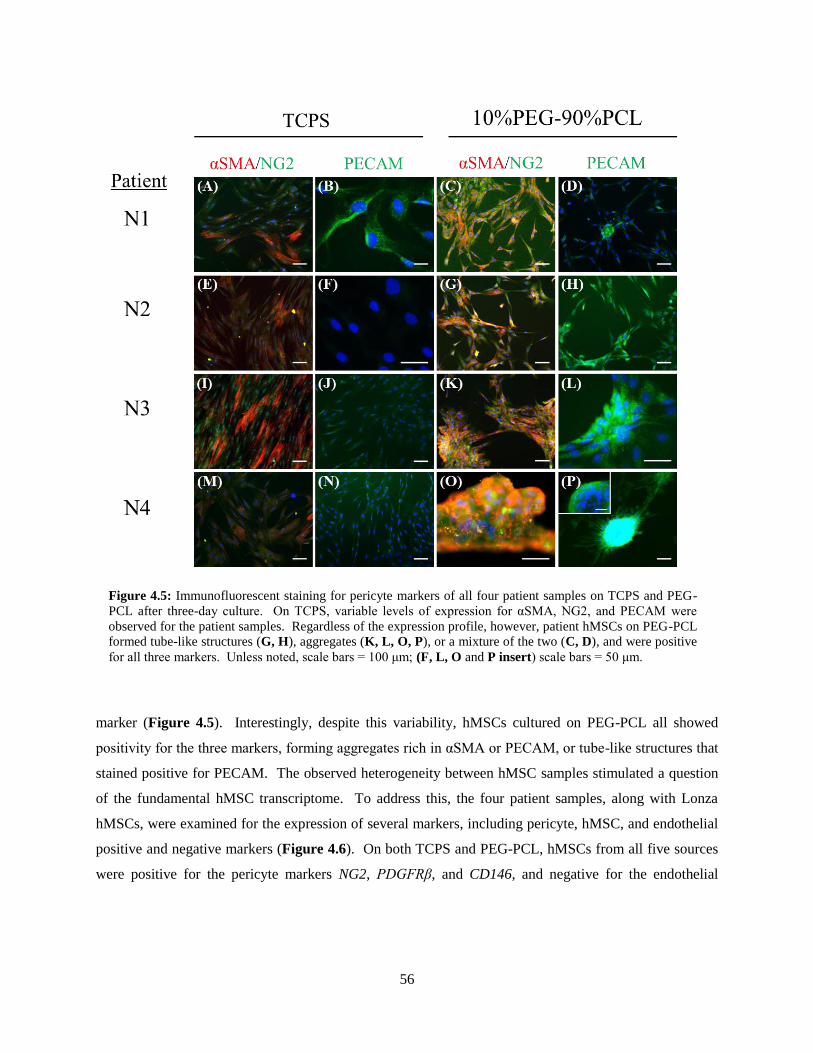
56
marker (Figure 4.5). Interestingly, despite this variability, hMSCs cultured on PEG-PCL all showed
positivity for the three markers, forming aggregates rich in αSMA or PECAM, or tube-like structures that
stained positive for PECAM. The observed heterogeneity between hMSC samples stimulated a question
of the fundamental hMSC transcriptome. To address this, the four patient samples, along with Lonza
hMSCs, were examined for the expression of several markers, including pericyte, hMSC, and endothelial
positive and negative markers (Figure 4.6). On both TCPS and PEG-PCL, hMSCs from all five sources
were positive for the pericyte markers NG2, PDGFRβ, and CD146, and negative for the endothelial
Figure 4.5: Immunofluorescent staining for pericyte markers of all four patient samples on TCPS and PEG-
PCL after three-day culture. On TCPS, variable levels of expression for αSMA, NG2, and PECAM were
observed for the patient samples. Regardless of the expression profile, however, patient hMSCs on PEG-PCL
formed tube-like structures (G, H), aggregates (K, L, O, P), or a mixture of the two (C, D), and were positive
for all three markers. Unless noted, scale bars = 100 μm; (F, L, O and P insert) scale bars = 50 μm.
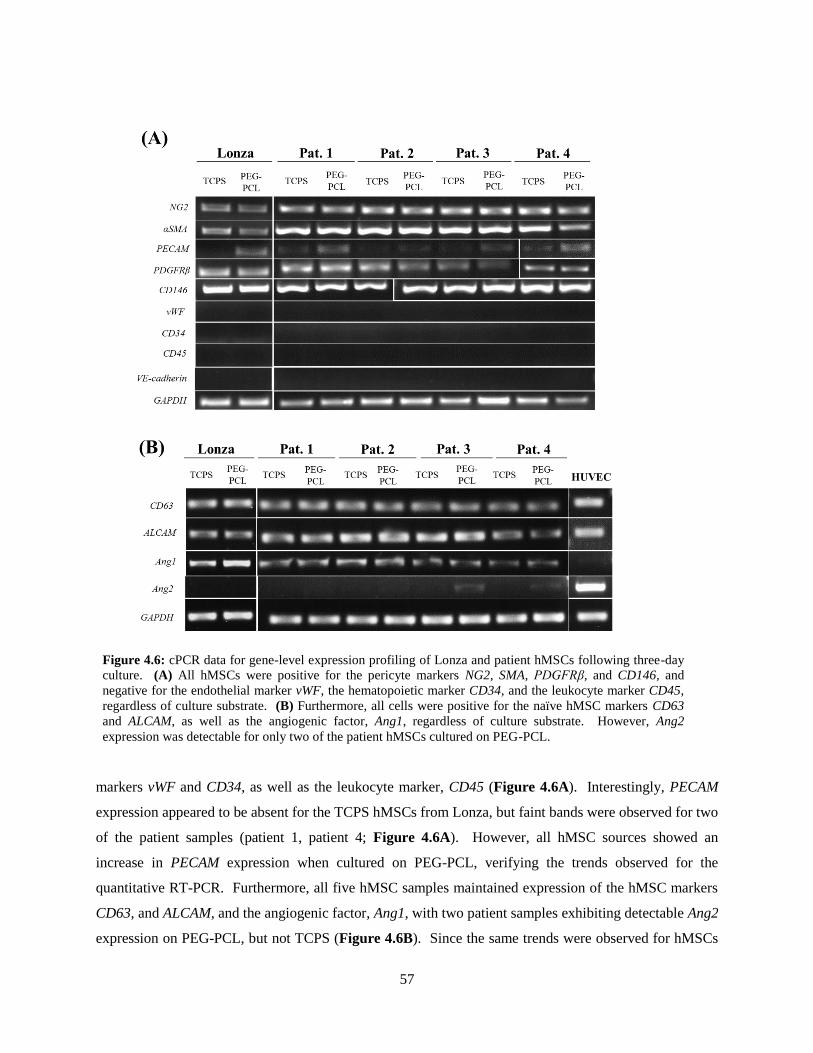
57
markers vWF and CD34, as well as the leukocyte marker, CD45 (Figure 4.6A). Interestingly, PECAM
expression appeared to be absent for the TCPS hMSCs from Lonza, but faint bands were observed for two
of the patient samples (patient 1, patient 4; Figure 4.6A). However, all hMSC sources showed an
increase in PECAM expression when cultured on PEG-PCL, verifying the trends observed for the
quantitative RT-PCR. Furthermore, all five hMSC samples maintained expression of the hMSC markers
CD63, and ALCAM, and the angiogenic factor, Ang1, with two patient samples exhibiting detectable Ang2
expression on PEG-PCL, but not TCPS (Figure 4.6B). Since the same trends were observed for hMSCs
Figure 4.6: cPCR data for gene-level expression profiling of Lonza and patient hMSCs following three-day
culture. (A) All hMSCs were positive for the pericyte markers NG2, SMA, PDGFRβ, and CD146, and
negative for the endothelial marker vWF, the hematopoietic marker CD34, and the leukocyte marker CD45,
regardless of culture substrate. (B) Furthermore, all cells were positive for the naïve hMSC markers CD63
and ALCAM, as well as the angiogenic factor, Ang1, regardless of culture substrate. However, Ang2
expression was detectable for only two of the patient hMSCs cultured on PEG-PCL.
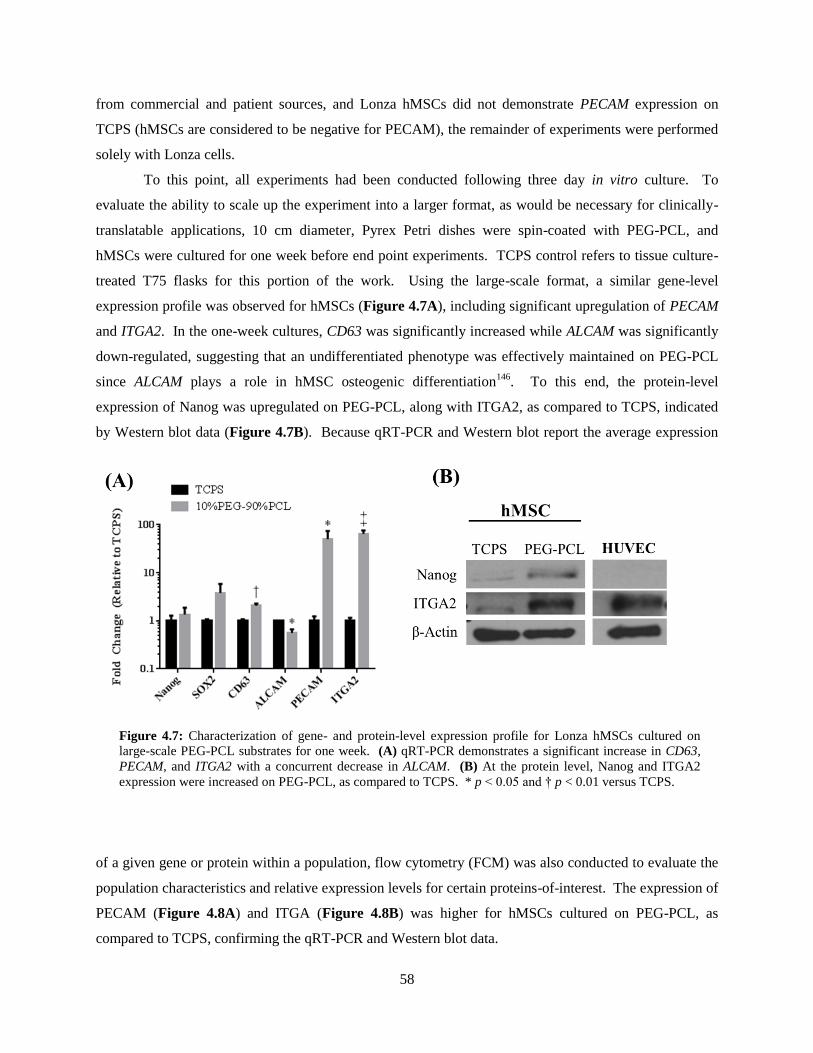
58
from commercial and patient sources, and Lonza hMSCs did not demonstrate PECAM expression on
TCPS (hMSCs are considered to be negative for PECAM), the remainder of experiments were performed
solely with Lonza cells.
To this point, all experiments had been conducted following three day in vitro culture. To
evaluate the ability to scale up the experiment into a larger format, as would be necessary for clinically-
translatable applications, 10 cm diameter, Pyrex Petri dishes were spin-coated with PEG-PCL, and
hMSCs were cultured for one week before end point experiments. TCPS control refers to tissue culture-
treated T75 flasks for this portion of the work. Using the large-scale format, a similar gene-level
expression profile was observed for hMSCs (Figure 4.7A), including significant upregulation of PECAM
and ITGA2. In the one-week cultures, CD63 was significantly increased while ALCAM was significantly
down-regulated, suggesting that an undifferentiated phenotype was effectively maintained on PEG-PCL
since ALCAM plays a role in hMSC osteogenic differentiation146
. To this end, the protein-level
expression of Nanog was upregulated on PEG-PCL, along with ITGA2, as compared to TCPS, indicated
by Western blot data (Figure 4.7B). Because qRT-PCR and Western blot report the average expression
of a given gene or protein within a population, flow cytometry (FCM) was also conducted to evaluate the
population characteristics and relative expression levels for certain proteins-of-interest. The expression of
PECAM (Figure 4.8A) and ITGA (Figure 4.8B) was higher for hMSCs cultured on PEG-PCL, as
compared to TCPS, confirming the qRT-PCR and Western blot data.
Figure 4.7: Characterization of gene- and protein-level expression profile for Lonza hMSCs cultured on
large-scale PEG-PCL substrates for one week. (A) qRT-PCR demonstrates a significant increase in CD63,
PECAM, and ITGA2 with a concurrent decrease in ALCAM. (B) At the protein level, Nanog and ITGA2
expression were increased on PEG-PCL, as compared to TCPS. * p < 0.05 and † p < 0.01 versus TCPS.
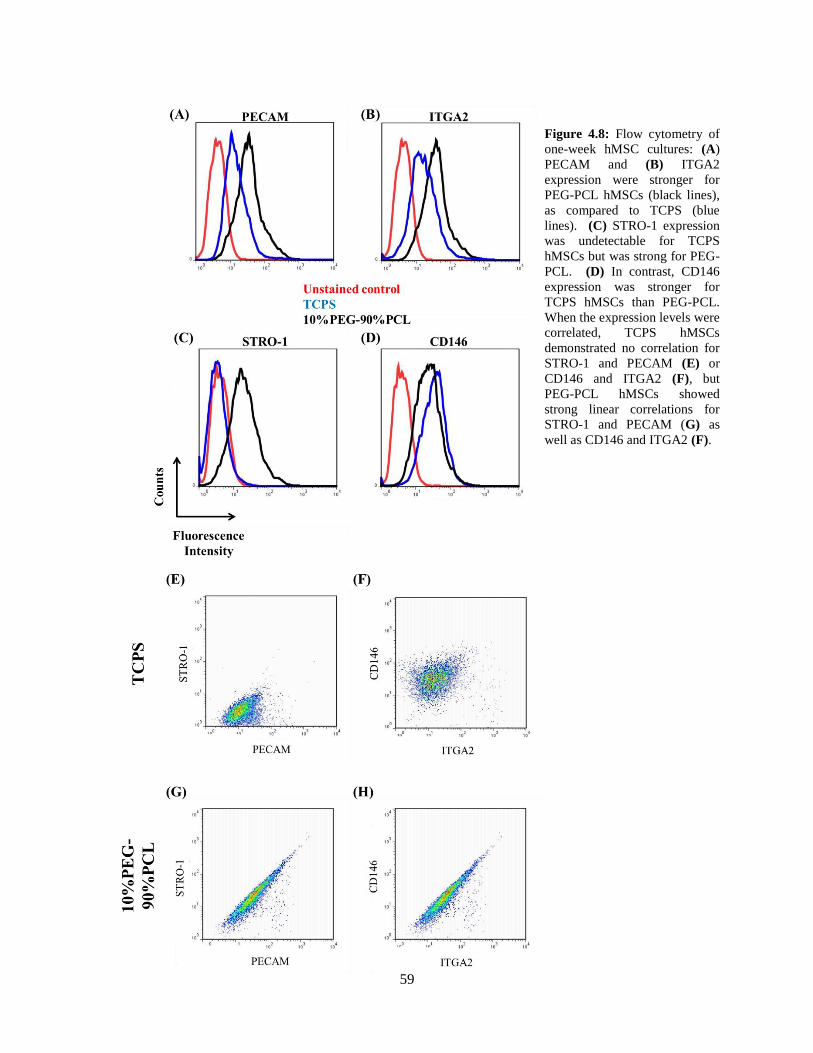
59
Figure 4.8: Flow cytometry of
one-week hMSC cultures: (A)
PECAM and (B) ITGA2
expression were stronger for
PEG-PCL hMSCs (black lines),
as compared to TCPS (blue
lines). (C) STRO-1 expression
was undetectable for TCPS
hMSCs but was strong for PEG-
PCL. (D) In contrast, CD146
expression was stronger for
TCPS hMSCs than PEG-PCL.
When the expression levels were
correlated, TCPS hMSCs
demonstrated no correlation for
STRO-1 and PECAM (E) or
CD146 and ITGA2 (F), but
PEG-PCL hMSCs showed
strong linear correlations for
STRO-1 and PECAM (G) as
well as CD146 and ITGA2 (F).
60
Strikingly, expression of STRO-1 was activated in hMSCs cultured on PEG-PCL, but was absent for
hMSCs on TCPS (Figure 4.8C). CD146, a selection marker for pericytes and hMSCs, showed slightly
stronger expression for hMSCs on TCPS, as compared to PEG-PCL, suggesting that STRO-1 and CD146,
two markers of naïve hMSCs, are not mutually inclusive (Figure 4.8D). STRO-1 has been shown to
decrease during in vitro culture as hMSCs represent, to a lessening degree, their original in vivo
phenotype; however, in this experiment, CD146 remained strongly expressed for TCPS during ex vivo
culture and was down-regulated on PEG-PCL, while STRO-1 was re-activated, suggesting that the binary
on/off for CD146 might be difficult to interpret. When the fluorescence intensities of double-stained
hMSCs were plotted against one another, a linear correlation in expression intensity was observed for
PEG-PCL hMSCs (Figure 4.8G,H), but not for TCPS (Figure 4.8E,F). Because TCPS hMSCs were
STRO-1-, there was no possibility for correlation to PECAM expression (Figure 4.8E); however, PEG-
PCL hMSCs showed a tight linear correlation for the two markers (Figure 4.8G). Furthermore, although
TCPS hMSCs expressed stronger signal for CD146, correlation with ITGA2 was not observed (Figure
4.8F) whereas PEG-PCL hMSCs again demonstrated a linear correlation for these markers (Figure
4.8H). Although the significance of these correlations is difficult to determine, in future experiments
(described in Conclusions), RNA interference of ITGA2 and PECAM will indicate if there is a functional
relationship within between these proteins.
Effect of PEG-PCL hMSCs on HUVECs In Vitro
As discussed above, hMSCs share inherent similarities with pericytes, an instrumental cell type in
the development and maintenance of vasculature. Because an increase in PECAM and ITGA2 has been
thematic throughout this Chapter, the influence of PEG-PCL hMSCs on a model EC source, human
umbilical vein endothelial cells (HUVECs), was next investigated. Despite the fact that
angiogenesis/vasculogenesis is an extremely intricate process that involves countless regulatory factors,
cell types, and cross-talk165
, focus was initially placed on the expression of angiopoietin-1 (Ang1) and
Ang2 due to changes of their role in the pericyte-EC relationship, as well as the consistent decrease in
Tie2 expression that was observed for Lonza hMSCs and all patient samples (Figures 4.2C and 4.4). As
an indicator of the heavily-influential pathway of vascular endothelial growth factor (VEGF), VEGFA
was also included in these measurements.
The gene-level angiogenic expression profile of PEG-PCL hMSCs versus cells on TCPS revealed
a significant upregulation of Ang1 with no significant change in VEGFA (Figure 4.9A,B). Interestingly,
a weak band for Ang2 was detected by conventional PCR for hMSCs on PEG-PCL, but no signal was
detected for TCPS hMSCs (Figure 4.9A). When treated with conditioned media from either TCPS
hMSCs or PEG-PCL hMSCs, significantly more HUVECs were observed to migrate through a
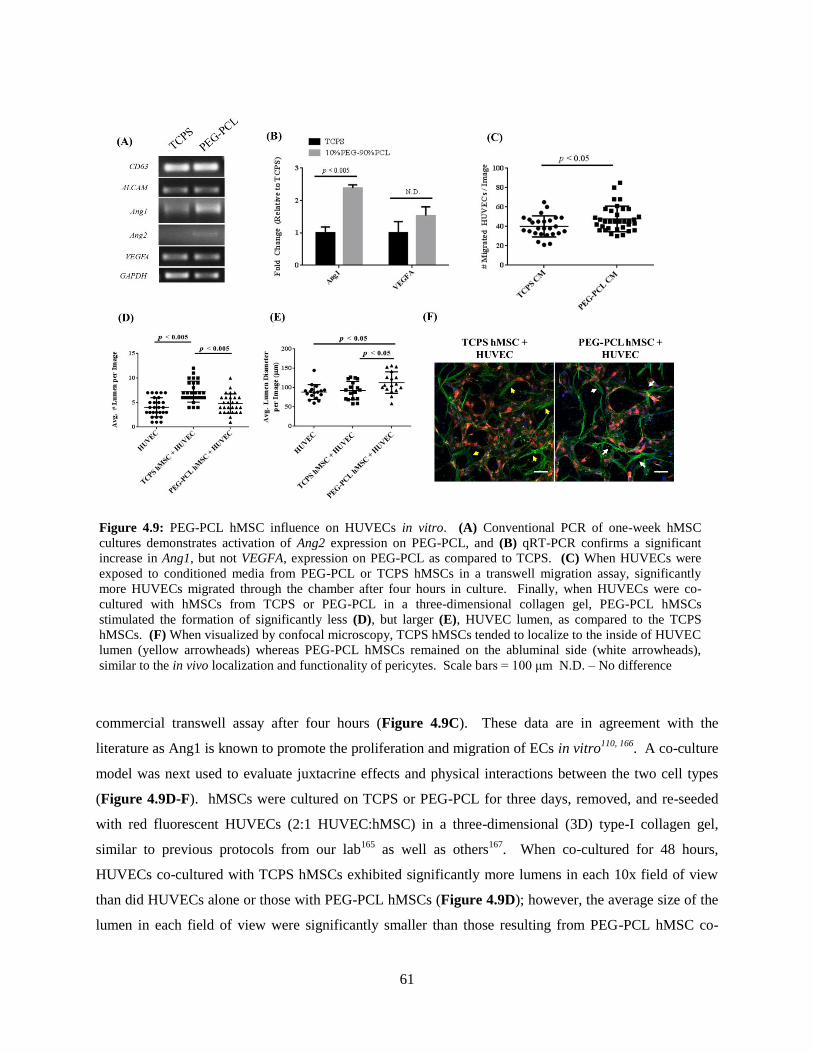
61
commercial transwell assay after four hours (Figure 4.9C). These data are in agreement with the
literature as Ang1 is known to promote the proliferation and migration of ECs in vitro110, 166
. A co-culture
model was next used to evaluate juxtacrine effects and physical interactions between the two cell types
(Figure 4.9D-F). hMSCs were cultured on TCPS or PEG-PCL for three days, removed, and re-seeded
with red fluorescent HUVECs (2:1 HUVEC:hMSC) in a three-dimensional (3D) type-I collagen gel,
similar to previous protocols from our lab165
as well as others167
. When co-cultured for 48 hours,
HUVECs co-cultured with TCPS hMSCs exhibited significantly more lumens in each 10x field of view
than did HUVECs alone or those with PEG-PCL hMSCs (Figure 4.9D); however, the average size of the
lumen in each field of view were significantly smaller than those resulting from PEG-PCL hMSC co-
Figure 4.9: PEG-PCL hMSC influence on HUVECs in vitro. (A) Conventional PCR of one-week hMSC
cultures demonstrates activation of Ang2 expression on PEG-PCL, and (B) qRT-PCR confirms a significant
increase in Ang1, but not VEGFA, expression on PEG-PCL as compared to TCPS. (C) When HUVECs were
exposed to conditioned media from PEG-PCL or TCPS hMSCs in a transwell migration assay, significantly
more HUVECs migrated through the chamber after four hours in culture. Finally, when HUVECs were co-
cultured with hMSCs from TCPS or PEG-PCL in a three-dimensional collagen gel, PEG-PCL hMSCs
stimulated the formation of significantly less (D), but larger (E), HUVEC lumen, as compared to the TCPS
hMSCs. (F) When visualized by confocal microscopy, TCPS hMSCs tended to localize to the inside of HUVEC
lumen (yellow arrowheads) whereas PEG-PCL hMSCs remained on the abluminal side (white arrowheads),
similar to the in vivo localization and functionality of pericytes. Scale bars = 100 μm N.D. – No difference
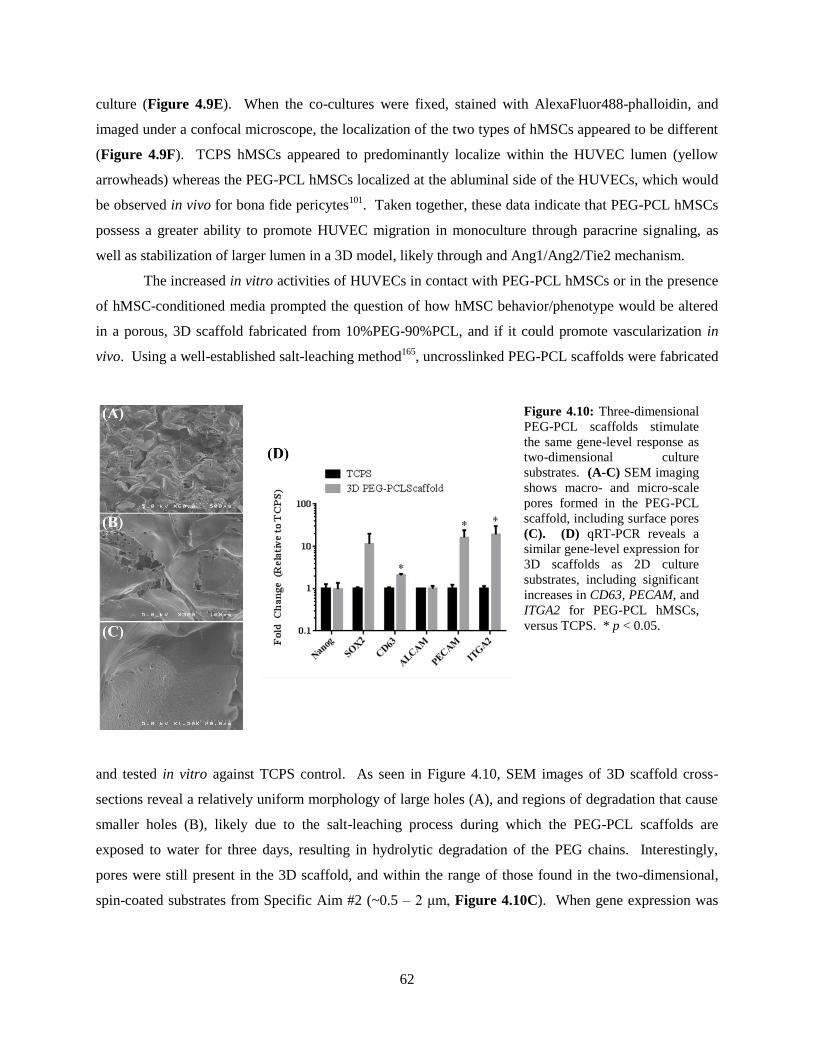
62
culture (Figure 4.9E). When the co-cultures were fixed, stained with AlexaFluor488-phalloidin, and
imaged under a confocal microscope, the localization of the two types of hMSCs appeared to be different
(Figure 4.9F). TCPS hMSCs appeared to predominantly localize within the HUVEC lumen (yellow
arrowheads) whereas the PEG-PCL hMSCs localized at the abluminal side of the HUVECs, which would
be observed in vivo for bona fide pericytes101
. Taken together, these data indicate that PEG-PCL hMSCs
possess a greater ability to promote HUVEC migration in monoculture through paracrine signaling, as
well as stabilization of larger lumen in a 3D model, likely through and Ang1/Ang2/Tie2 mechanism.
The increased in vitro activities of HUVECs in contact with PEG-PCL hMSCs or in the presence
of hMSC-conditioned media prompted the question of how hMSC behavior/phenotype would be altered
in a porous, 3D scaffold fabricated from 10%PEG-90%PCL, and if it could promote vascularization in
vivo. Using a well-established salt-leaching method165
, uncrosslinked PEG-PCL scaffolds were fabricated
and tested in vitro against TCPS control. As seen in Figure 4.10, SEM images of 3D scaffold cross-
sections reveal a relatively uniform morphology of large holes (A), and regions of degradation that cause
smaller holes (B), likely due to the salt-leaching process during which the PEG-PCL scaffolds are
exposed to water for three days, resulting in hydrolytic degradation of the PEG chains. Interestingly,
pores were still present in the 3D scaffold, and within the range of those found in the two-dimensional,
spin-coated substrates from Specific Aim #2 (~0.5 – 2 μm, Figure 4.10C). When gene expression was
Figure 4.10: Three-dimensional
PEG-PCL scaffolds stimulate
the same gene-level response as
two-dimensional culture
substrates. (A-C) SEM imaging
shows macro- and micro-scale
pores formed in the PEG-PCL
scaffold, including surface pores
(C). (D) qRT-PCR reveals a
similar gene-level expression for
3D scaffolds as 2D culture
substrates, including significant
increases in CD63, PECAM, and
ITGA2 for PEG-PCL hMSCs,
versus TCPS. * p < 0.05.
63
measured, a profile similar to that of hMSCs on PEG-PCL in 2D was observed, including significant
increases in CD63, PECAM, and ITGA2, as well as an insignificant increase in Ang1 (Figure 4.10D).
PEG-PCL/hMSC Scaffolds Promote Vascularization In Vivo
To this point, PEG-PCL has been shown to stimulate a pericyte-like phenotype in hMSCs, both in
2D and 3D formats, which can stimulate increased EC migration and promote tube stabilization. The next
step was to evaluate how hMSC-loaded, 3D scaffolds of PEG-PCL would perform when implanted in
vivo. For the implants, 100%PCL scaffolds were fabricated with the same method and used as a control.
To ensure that the scaffold itself wasn’t exerting a drastic effect on vascularization, or to simply remove
the baseline activity of the host tissue, scaffolds of both types of polymers without cells (“blank”) were
also included. Using optical coherence tomography (OCT), animals were observed for the formation of
vasculature at 3, 7, 14, and 21 days post-implantation. As seen in Figure 4.11, all scaffolds exhibited
some degree of vascularization, but this seemed to regress in in PCL scaffolds by day 7, whereas
interconnected vascular networks were evident in PEG-PCL scaffolds. By days 14 and 21, both of the
hMSC-loaded scaffolds (i.e. 100%PCL and 10%PEG-90%PCL) appeared to have enhanced
vascularization relative to the blank scaffold controls. Of note, the image panel shown in Figure 4.11 is
comprised of images from the same animal over time, as opposed to representative images for each time
point, allowing for clearer interpretation of the data set.
When the OCT images were quantified, several points became clear (Figure 4.12). First, the
hMSC-loaded PEG-PCL scaffolds stimulated significantly more vessel density than either of the blank
scaffolds, but this was not the case for PCL-loaded scaffolds (Figure 4.12A). Furthermore, PEG-PCL +
hMSCs maintained the highest degree of vessel density over the three week period, albeit without quite
reaching statistical significance relative to hMSC-loaded PCL scaffolds (p = 0.05 on days 14 and 21
versus PCL + hMSCs, Figure 4.12A). However, when the values for all time points for each scaffold
type were compared, PEG-PCL + hMSCs demonstrated a significantly higher vessel density than PCL +
hMSCs or the unloaded PCL blank (Figure 4.12B). Furthermore, when only the hMSC-loaded scaffolds
were compared, the PEG-PCL-loaded scaffolds demonstrated significance at days 14 and 21 post-
implantation (Figure 4.12C). These data suggest that the phenotype of PEG-PCL hMSCs demonstrate
increased vascularization in the first three days, and are able to maintain this effect over three weeks.
When compared with hMSCs on a more classical scaffold, such as 100%PCL, the resulting vascularity
was significantly higher at the later time points (Figure 4.12C).
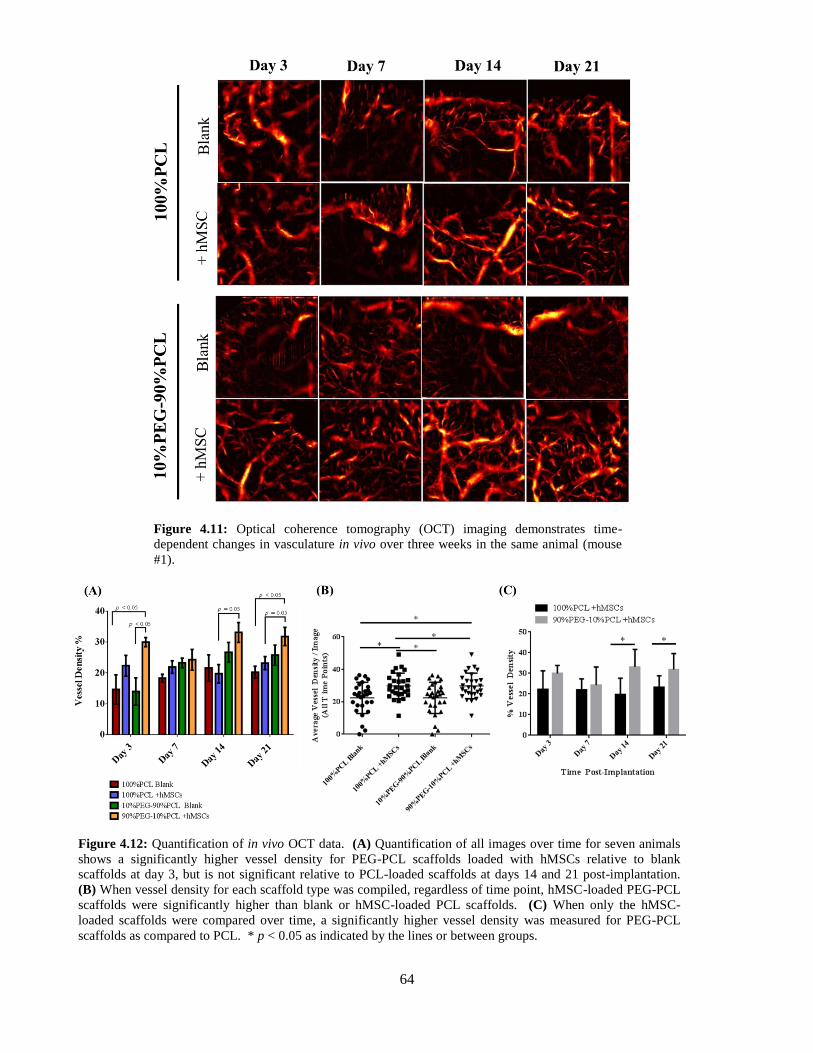
64
Figure 4.11: Optical coherence tomography (OCT) imaging demonstrates time-
dependent changes in vasculature in vivo over three weeks in the same animal (mouse
#1).
Figure 4.12: Quantification of in vivo OCT data. (A) Quantification of all images over time for seven animals
shows a significantly higher vessel density for PEG-PCL scaffolds loaded with hMSCs relative to blank
scaffolds at day 3, but is not significant relative to PCL-loaded scaffolds at days 14 and 21 post-implantation.
(B) When vessel density for each scaffold type was compiled, regardless of time point, hMSC-loaded PEG-PCL
scaffolds were significantly higher than blank or hMSC-loaded PCL scaffolds. (C) When only the hMSC-
loaded scaffolds were compared over time, a significantly higher vessel density was measured for PEG-PCL
scaffolds as compared to PCL. * p < 0.05 as indicated by the lines or between groups.
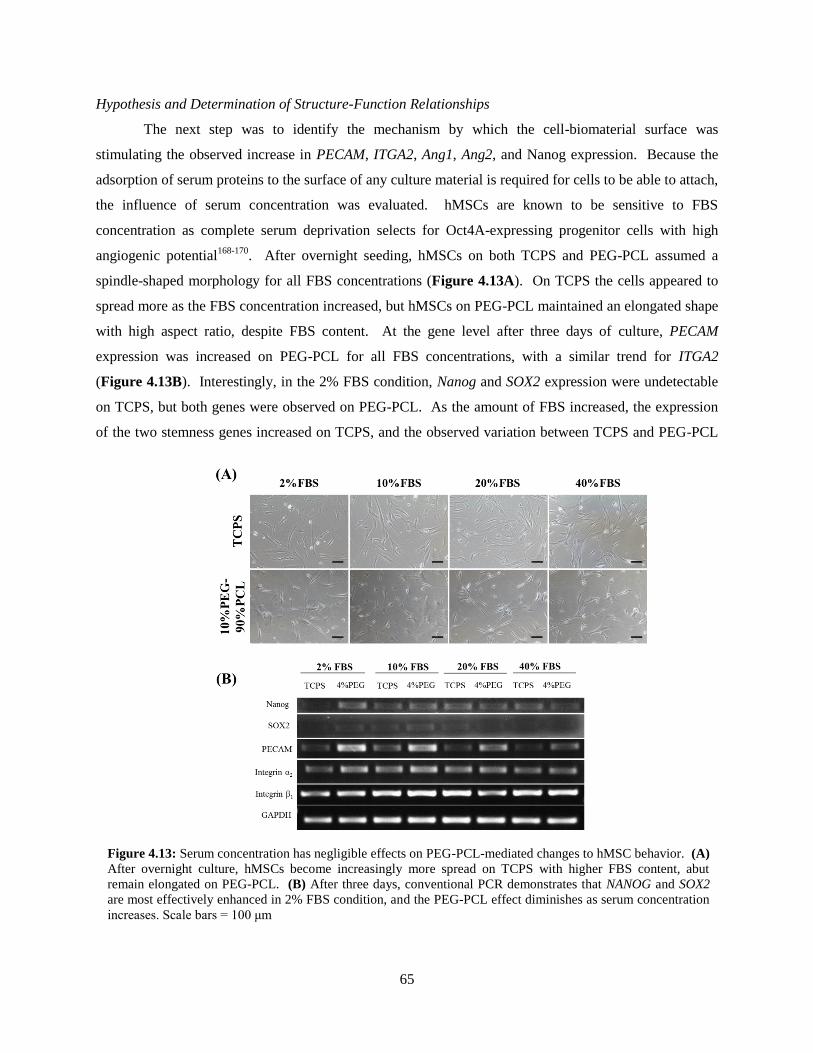
65
Hypothesis and Determination of Structure-Function Relationships
The next step was to identify the mechanism by which the cell-biomaterial surface was
stimulating the observed increase in PECAM, ITGA2, Ang1, Ang2, and Nanog expression. Because the
adsorption of serum proteins to the surface of any culture material is required for cells to be able to attach,
the influence of serum concentration was evaluated. hMSCs are known to be sensitive to FBS
concentration as complete serum deprivation selects for Oct4A-expressing progenitor cells with high
angiogenic potential168-170
. After overnight seeding, hMSCs on both TCPS and PEG-PCL assumed a
spindle-shaped morphology for all FBS concentrations (Figure 4.13A). On TCPS the cells appeared to
spread more as the FBS concentration increased, but hMSCs on PEG-PCL maintained an elongated shape
with high aspect ratio, despite FBS content. At the gene level after three days of culture, PECAM
expression was increased on PEG-PCL for all FBS concentrations, with a similar trend for ITGA2
(Figure 4.13B). Interestingly, in the 2% FBS condition, Nanog and SOX2 expression were undetectable
on TCPS, but both genes were observed on PEG-PCL. As the amount of FBS increased, the expression
of the two stemness genes increased on TCPS, and the observed variation between TCPS and PEG-PCL
Figure 4.13: Serum concentration has negligible effects on PEG-PCL-mediated changes to hMSC behavior. (A)
After overnight culture, hMSCs become increasingly more spread on TCPS with higher FBS content, abut
remain elongated on PEG-PCL. (B) After three days, conventional PCR demonstrates that NANOG and SOX2
are most effectively enhanced in 2% FBS condition, and the PEG-PCL effect diminishes as serum concentration
increases. Scale bars = 100 μm
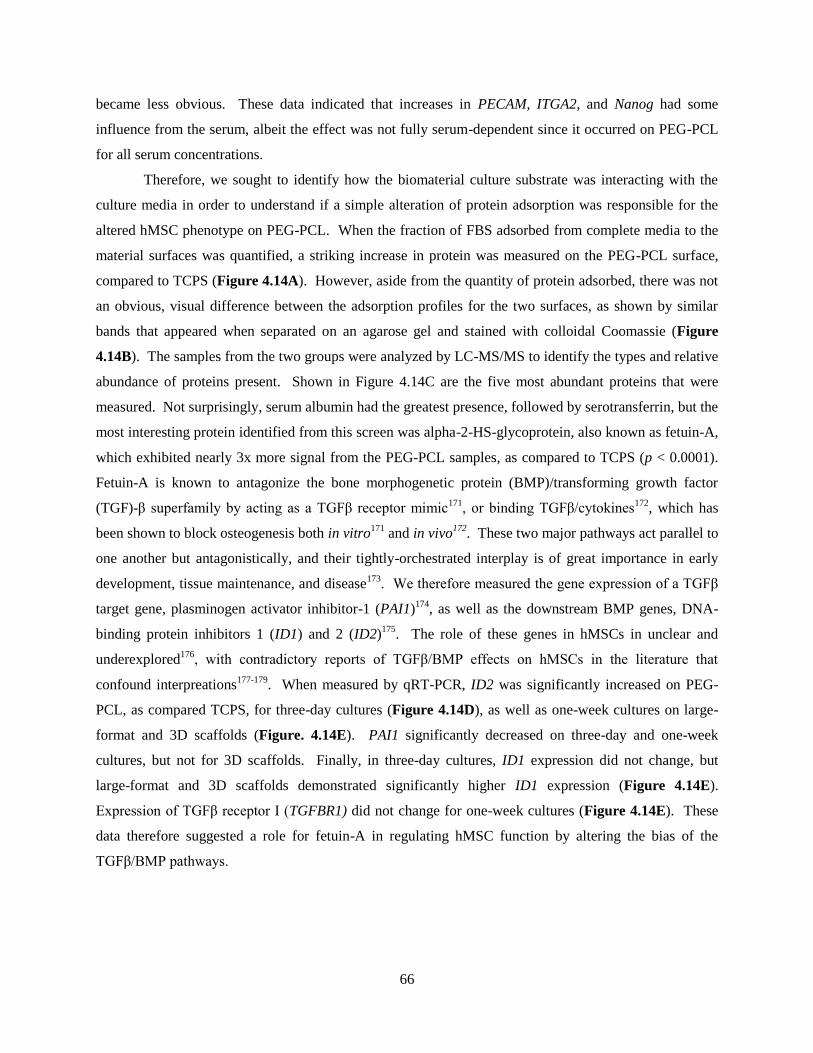
66
became less obvious. These data indicated that increases in PECAM, ITGA2, and Nanog had some
influence from the serum, albeit the effect was not fully serum-dependent since it occurred on PEG-PCL
for all serum concentrations.
Therefore, we sought to identify how the biomaterial culture substrate was interacting with the
culture media in order to understand if a simple alteration of protein adsorption was responsible for the
altered hMSC phenotype on PEG-PCL. When the fraction of FBS adsorbed from complete media to the
material surfaces was quantified, a striking increase in protein was measured on the PEG-PCL surface,
compared to TCPS (Figure 4.14A). However, aside from the quantity of protein adsorbed, there was not
an obvious, visual difference between the adsorption profiles for the two surfaces, as shown by similar
bands that appeared when separated on an agarose gel and stained with colloidal Coomassie (Figure
4.14B). The samples from the two groups were analyzed by LC-MS/MS to identify the types and relative
abundance of proteins present. Shown in Figure 4.14C are the five most abundant proteins that were
measured. Not surprisingly, serum albumin had the greatest presence, followed by serotransferrin, but the
most interesting protein identified from this screen was alpha-2-HS-glycoprotein, also known as fetuin-A,
which exhibited nearly 3x more signal from the PEG-PCL samples, as compared to TCPS (p < 0.0001).
Fetuin-A is known to antagonize the bone morphogenetic protein (BMP)/transforming growth factor
(TGF)-β superfamily by acting as a TGFβ receptor mimic171
, or binding TGFβ/cytokines172
, which has
been shown to block osteogenesis both in vitro171
and in vivo172
. These two major pathways act parallel to
one another but antagonistically, and their tightly-orchestrated interplay is of great importance in early
development, tissue maintenance, and disease173
. We therefore measured the gene expression of a TGFβ
target gene, plasminogen activator inhibitor-1 (PAI1)174
, as well as the downstream BMP genes, DNA-
binding protein inhibitors 1 (ID1) and 2 (ID2)175
. The role of these genes in hMSCs in unclear and
underexplored176
, with contradictory reports of TGFβ/BMP effects on hMSCs in the literature that
confound interpreations177-179
. When measured by qRT-PCR, ID2 was significantly increased on PEG-
PCL, as compared TCPS, for three-day cultures (Figure 4.14D), as well as one-week cultures on large-
format and 3D scaffolds (Figure. 4.14E). PAI1 significantly decreased on three-day and one-week
cultures, but not for 3D scaffolds. Finally, in three-day cultures, ID1 expression did not change, but
large-format and 3D scaffolds demonstrated significantly higher ID1 expression (Figure 4.14E).
Expression of TGFβ receptor I (TGFBR1) did not change for one-week cultures (Figure 4.14E). These
data therefore suggested a role for fetuin-A in regulating hMSC function by altering the bias of the
TGFβ/BMP pathways.
67
In order to test the role of fetuin-A in the PEG-PCL system, a chemically-defined media (CDM)
that does not contain fetuin-A was purchased from Lonza to evaluate if colony formation and alterations
Figure 4.14: Protein adsorption, identification, and effect on PEG-PCL. (A) Significantly more protein adsorbs
to PEG-PCL as compared to TCPS, but (B) no obvious difference in adsorbed composition was noticed when
separated on a gel. (C) However, protein identification with LC-MS/MS revealed several candidate proteins that
were significantly higher on PEG-PCL than TCPS, including the TGF-β antagonist, fetuin-A. (D) Three-day
and (E) one-week cultures show increased expression of ID2 with a concurrent decrease in PAI1, two
downstream TGF-β target genes with competing activities, when cultured on PEG-PCL. These data suggest that
the TGF-β pathway is inhibited during culture on PEG-PCL. * p < 0.05 and † p < 0.01 versus TCPS.
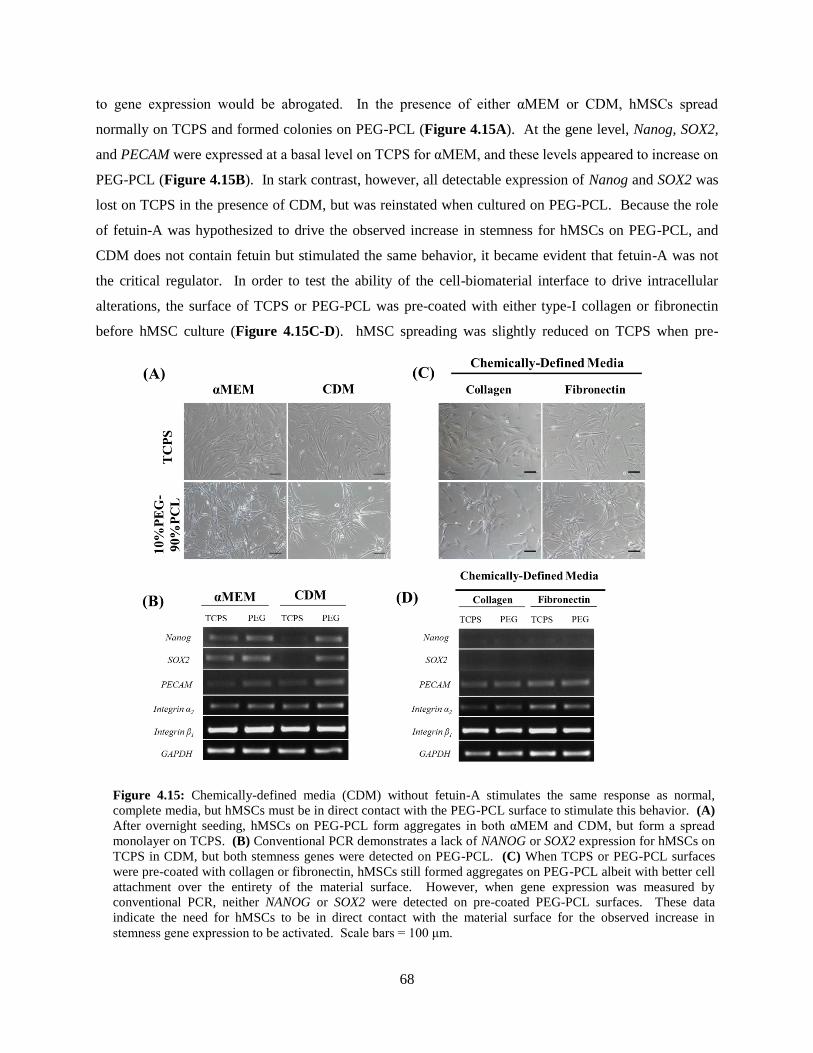
68
to gene expression would be abrogated. In the presence of either αMEM or CDM, hMSCs spread
normally on TCPS and formed colonies on PEG-PCL (Figure 4.15A). At the gene level, Nanog, SOX2,
and PECAM were expressed at a basal level on TCPS for αMEM, and these levels appeared to increase on
PEG-PCL (Figure 4.15B). In stark contrast, however, all detectable expression of Nanog and SOX2 was
lost on TCPS in the presence of CDM, but was reinstated when cultured on PEG-PCL. Because the role
of fetuin-A was hypothesized to drive the observed increase in stemness for hMSCs on PEG-PCL, and
CDM does not contain fetuin but stimulated the same behavior, it became evident that fetuin-A was not
the critical regulator. In order to test the ability of the cell-biomaterial interface to drive intracellular
alterations, the surface of TCPS or PEG-PCL was pre-coated with either type-I collagen or fibronectin
before hMSC culture (Figure 4.15C-D). hMSC spreading was slightly reduced on TCPS when pre-
Figure 4.15: Chemically-defined media (CDM) without fetuin-A stimulates the same response as normal,
complete media, but hMSCs must be in direct contact with the PEG-PCL surface to stimulate this behavior. (A)
After overnight seeding, hMSCs on PEG-PCL form aggregates in both αMEM and CDM, but form a spread
monolayer on TCPS. (B) Conventional PCR demonstrates a lack of NANOG or SOX2 expression for hMSCs on
TCPS in CDM, but both stemness genes were detected on PEG-PCL. (C) When TCPS or PEG-PCL surfaces
were pre-coated with collagen or fibronectin, hMSCs still formed aggregates on PEG-PCL albeit with better cell
attachment over the entirety of the material surface. However, when gene expression was measured by
conventional PCR, neither NANOG or SOX2 were detected on pre-coated PEG-PCL surfaces. These data
indicate the need for hMSCs to be in direct contact with the material surface for the observed increase in
stemness gene expression to be activated. Scale bars = 100 μm.
69
coated with either collagen or fibronectin, and colonies still formed on PEG-PCL in the presence of
either protein (Figure 4.15C). When the gene expression profile was measured, neither Nanog nor SOX2
was detected for hMSCs on TCPS or PEG-PCL in either coating condition although PECAM, ITGA2, and
ITGB1 were all expressed (Figure 4.15D). Potentially, the observed effect of the coatings is due to a
filling of the pore structure that is present at the PEG-PCL surface, but this question is to be addressed
with ongoing experiments. Regardless, the data shown here verify that the cell-biomaterial interface is
crucial for regulating the observed hMSC behavior because “masking” the PEG-PCL surface features by
pre-coating with collagen or fibronectin blocked the expression of the two stemness genes.
Conclusions
In this Aim, the biological relevance hMSCs cultured on PEG-PCL substrates, as well as the
structure-function relationship that regulates this behavior, was evaluated. Using patient hMSCs, the
observed increases in PECAM and ITGA2 at the gene-level, and PECAM, αSMA, and NG2 at the protein
level, were first confirmed. Then, using a large-scale polymer format, one-week cultures were used to
confirm scalability in terms of both culture size and time, as well as the pro-angiogenic effects of hMSCs
on PEG-PCL when interacting with HUVECs in vitro or when implanted in a 3D scaffold in vivo.
Finally, the observed events were shown to be independent of serum concentration and did not rely on the
activity of the protein fetuin-A, which was proven with fetuin-free, chemically-defined media.
Furthermore, by pre-coating the PEG-PCL surface, the need for direct interaction between the cells and
the biomaterial interface was illustrated because the observed phenotype was lost.
Because hMSCs are considered to be phenotypically related to pericytes, the observed increase in
stemness gene and protein expression might indicate a reversion back to a pericyte-like lineage that is lost
in traditional culture conditions. Utilizing a systematic engineering approach in which expwerimental
observations were used to develop hypotheses, followed by experiments that were designed to test these
predictions, the phenotypic regulation of hMSCs as the biointerface was confirmed. Although several
ongoing experiments remain, this work represents a fundamental step in (1) the understanding of hMSC
behavior and potential for vascular applications; (2) outside-in regulation of stem cell biology by
extracellular matrix cues; and (3) suggests an in vitro model for investigating the relationship between
hMSCs and pericytes.
70
CHAPTER 5
Summary and Future Work
The doctoral dissertation described in this document has primarily focused on the regulation of
human mesenchymal stem cell behavior through biochemical and environmental signals (Aim #1), and
extracellular matrix (ECM)-derived cues (Aims #2 and #3). Using late passage hMSCs asa model for in
vivo aging, Specific Aim #1 described the increased susceptibility of serially-expanded hMSCs to a harsh
environment of carcinogenic hypoxia due to faulty redox and pro-survival mechanisms that prevent the
cell from effectively protecting itself. The data collected in Aim #1 were used to construct a hypothesized
model for the pathways driving the observed events, and culminated in a downregulation of p53-mediated
cellular responses.
In Specific Aim #2, a library of copolymers based on poly(ε-caprolactone) (PCL), poly(ethylene
glycol) (PEG), and carboxylated-PCL (cPCL) was developed and characterized for use as synthetic cell
culture substrates. Using well-established material characterization techniques, the influence of each
particular subunit was evaluated in terms of physicochemical, mechanical, and surface/biointerfacial
properties. When aging hMSCs were cultured on the substrates, the intracellular redox levels were
modulated, which correlated with proliferative capacity. Although the specific mechanisms driving the
event remain unverified, it is thought that a the APE/Ref-1, p53, SESN1, SESN2 cascade might regulate
intracellular redox in hMSCs. However, the expression of two key stemness genes, Nanog and SOX2,
was significantly upregulated on one of the copolymers, 10%PEG-90%PCL, as compared to the tissue
culture control. When a PCR array was used to identify potential mechanisms at the cell-biomaterial
interface that were driving the observed increase, two genes-of-interest were shown to be significantly
upregulated: PECAM and ITGA2. These data were verified by qRT-PCR and used as guidance for the
third and final Aim of this project.
In Specific Aim #3, early passage hMSCs from a commercial source, as well as from four
patients at Vanderbilt University Medical Center, were used to confirm the results measured with late
passage hMSCs in Specific Aim #2. In recent years, the question of in vivo hMSC identity has been
raised, especially in regards to a landmark paper by Crisan et al in 2008 which showed that pericytes (i.e.
perivascular support cells, or mural cells) and hMSCs share inherent similarities99
. Based on this idea, the
fact that PECAM and integrin α2 (ITGA2) expression were significantly upregulated for hMSCs cultured
on PEG-PCL substrates, and that these two proteins are readily found in vascular compartment, a
71
suggested phenotypic reversion for hMSCs back to pericytes became the topic of investigation for this
Aim. Through a systematic approach, the biological relevance of the observed changes in hMSC
behavior was shown to correlate with increased endothelial cell (EC) migration in response to hMSC
conditioned media, as well as larger lumens that formed in three-dimensional (3D) co-culture, that is
hypothesized to be dependent upon the increased expression of angiopoietin (Ang)-1 and Ang-2. When
cultured in 3D, porous scaffolds fabricated from PEG-PCL, hMSCs assumed a similar phenotype to that
which was observed in 2D, and in vivo implantation of hMSC-loaded scaffolds revealed an increase in
vascularity, as determined by optical coherence tomography (OCT) imaging over a three week period.
From the standpoint of material properties, the final step of the project focused to elucidate how the
polymer surface structure was driving the observed intracellular events. First, hMSCs were cultured in a
range of serum concentrations to determine if protein concentration, or adsorption profile, played a role.
Although the different serum concentrations stimulated differing degrees of response, the overall gene
expression profile was largely unaffected. Next, the fraction of serum proteins that adsorbed to the
material surface was next quantified and characterized by mass spectrometry, and a specific protein-of-
interest was identified: fetuin-A, an antagonist of the transforming growth factor (TGF)-β/bone
morphogenetic protein (BMP) pathway. Using a chemically-defined culture media that does not contain
fetuin-A, the effect of PEG-PCL on hMSCs was still observed, remarkably to a stronger degree than the
complete culture media that had been used throughout the study. To verify that the interaction of hMSCs
and the biomaterial is critical for driving the observed effects, copolymer culture substrates were finally
pre-coated with either collagen or fibronectin, which were shown to abrogate the increase in Nanog and
SOX2. This final experiment confirms the necessity for hMSCs to be in complete contact with PEG-PCL,
and proves that the interfacial mechanism driving the observed increase is inherent to the copolymer
surface and not due to secondary effects of the material properties.
As this project has progressed, several interesting points have arisen that warrant continued
investigation. For example, the increased expression of PECAM and ITGA2 was observed throughout
Aims #2 and #3, and might play a significant role in hMSC maintenance and self-renewal in this system.
Using function-inhibiting antibodies and small hairpin RNA (shRNA) interference, the exact
requirements for each of these proteins can be determined. Because both PECAM and ITGA2 are
predominantly found in the vasculature, the functional relevance of their increased expression in hMSCs
might reveal fundamental insights for the nature of hMSCs, as well as their pro-angiogenic abilities.
Furthermore, in Aims #1 and #2, proliferation was shown to correlate with intracellular ROS levels,
suggesting a dependent relationship between the two measurements. Because this correlation has never
been reported in the literature for hMSCs, but was observed in two different systems within this
dissertation project, it would be worthwhile to look more closely at how the regulation of ROS and
72
proliferation are related. Finally, the copolymer composition 10%PEG-90%PCL (5,000 Da molecular
weight PEG block) was shown to effectively increase hMSC stemness more effectively that 0%PEG,
25%PEG, or the tissue culture control, but what about smaller increments of PEG percentage? And if the
size of the PEG block is changed, how does that affect domain formation at the material surface, and how
is hMSC behavior influenced as a result? These final questions are the focus of an ongoing project in the
Sung laboratory, headed by medical science training program (MSTP) student, Daniel Balikov, and will
be used to build upon the findings that I uncovered during my time as a graduate student.
In summary the project presented here represents an interdisciplinary engineering approach to
fundamental stem cell biology with the overall aim of improving regenerative, hMSC-based therapies.
The findings from this project add to an ongoing conversation in the literature regarding extracellular
matrix-mediated manipulation of hMSC function and elegantly identify an outside-in signaling
mechanism that drives alterations to intracellular behavior. The ongoing and future work related to this
project will be used to elucidate fundamental cell-biomaterial interfacial mechanisms in a basic science
setting that can be exploited for the design and production of next-generation tissue engineering scaffolds.
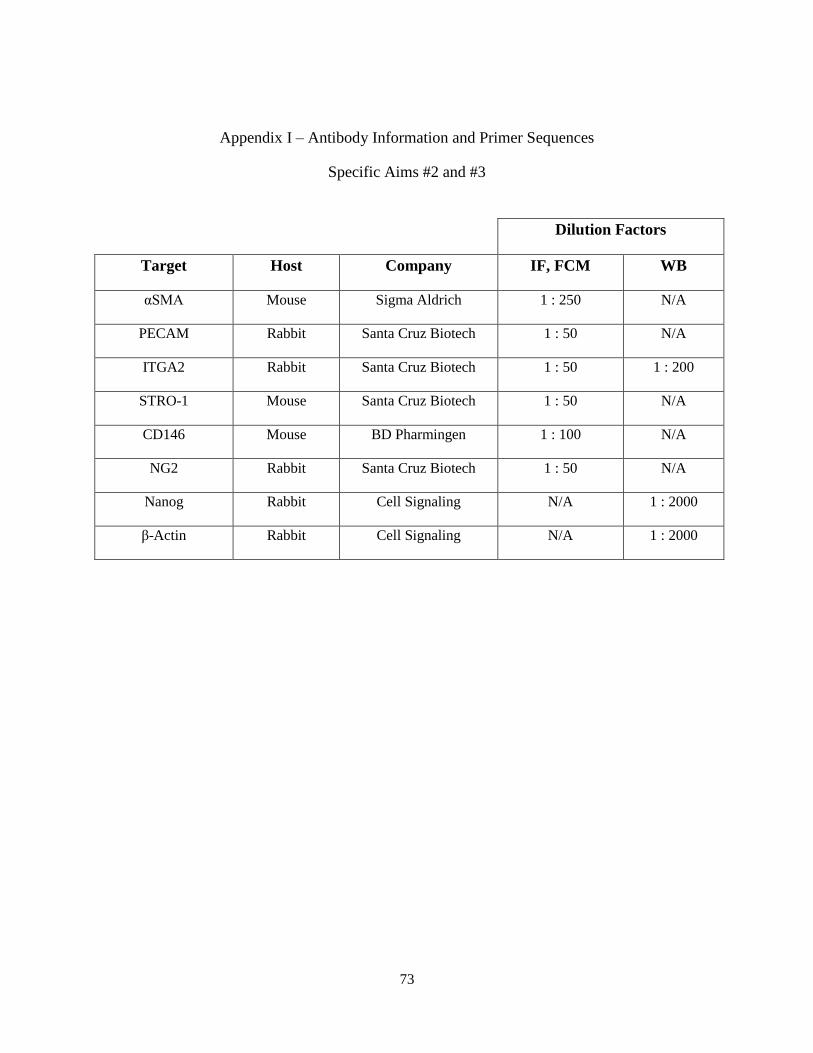
73
Appendix I – Antibody Information and Primer Sequences
Specific Aims #2 and #3
Dilution Factors
Target Host Company IF, FCM WB
αSMA Mouse Sigma Aldrich 1 : 250 N/A
PECAM Rabbit Santa Cruz Biotech 1 : 50 N/A
ITGA2 Rabbit Santa Cruz Biotech 1 : 50 1 : 200
STRO-1 Mouse Santa Cruz Biotech 1 : 50 N/A
CD146 Mouse BD Pharmingen 1 : 100 N/A
NG2 Rabbit Santa Cruz Biotech 1 : 50 N/A
Nanog Rabbit Cell Signaling N/A 1 : 2000
β-Actin Rabbit Cell Signaling N/A 1 : 2000
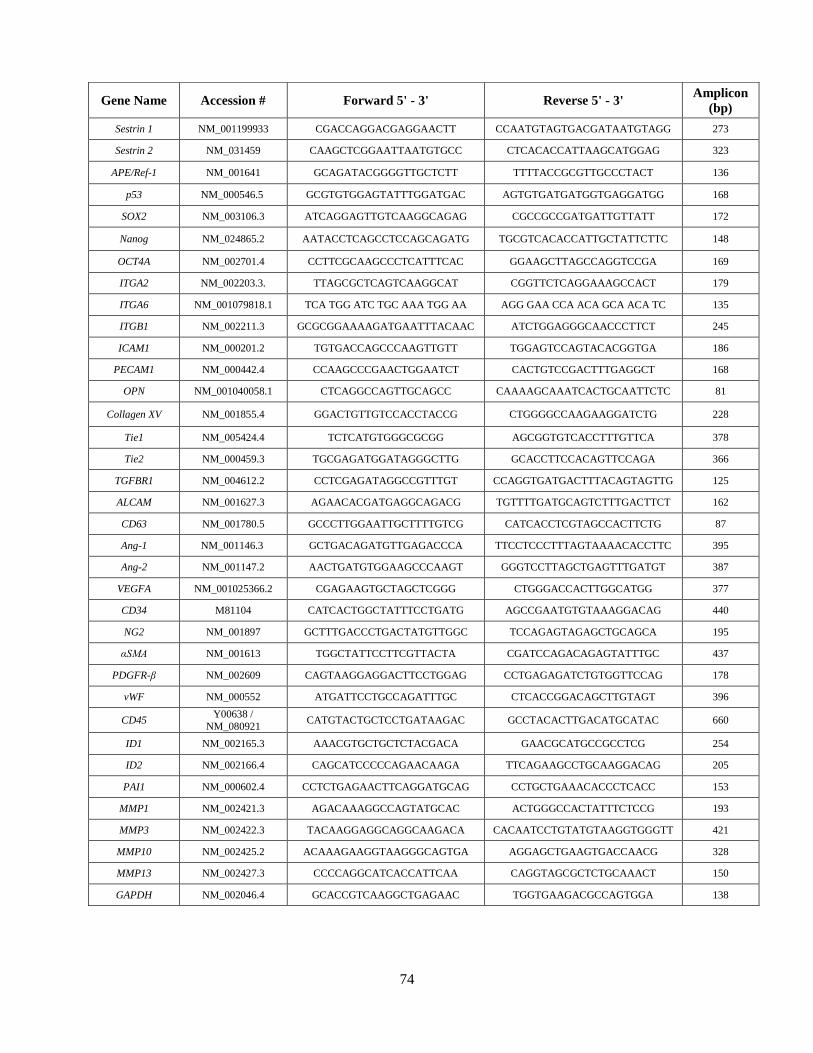
74
Gene Name Accession # Forward 5' - 3' Reverse 5' - 3' Amplicon
(bp)
Sestrin 1 NM_001199933 CGACCAGGACGAGGAACTT CCAATGTAGTGACGATAATGTAGG 273
Sestrin 2 NM_031459 CAAGCTCGGAATTAATGTGCC CTCACACCATTAAGCATGGAG 323
APE/Ref-1 NM_001641 GCAGATACGGGGTTGCTCTT TTTTACCGCGTTGCCCTACT 136
p53 NM_000546.5 GCGTGTGGAGTATTTGGATGAC AGTGTGATGATGGTGAGGATGG 168
SOX2 NM_003106.3 ATCAGGAGTTGTCAAGGCAGAG CGCCGCCGATGATTGTTATT 172
Nanog NM_024865.2 AATACCTCAGCCTCCAGCAGATG TGCGTCACACCATTGCTATTCTTC 148
OCT4A NM_002701.4 CCTTCGCAAGCCCTCATTTCAC GGAAGCTTAGCCAGGTCCGA 169
ITGA2 NM_002203.3. TTAGCGCTCAGTCAAGGCAT CGGTTCTCAGGAAAGCCACT 179
ITGA6 NM_001079818.1 TCA TGG ATC TGC AAA TGG AA AGG GAA CCA ACA GCA ACA TC 135
ITGB1 NM_002211.3 GCGCGGAAAAGATGAATTTACAAC ATCTGGAGGGCAACCCTTCT 245
ICAM1 NM_000201.2 TGTGACCAGCCCAAGTTGTT TGGAGTCCAGTACACGGTGA 186
PECAM1 NM_000442.4 CCAAGCCCGAACTGGAATCT CACTGTCCGACTTTGAGGCT 168
OPN NM_001040058.1 CTCAGGCCAGTTGCAGCC CAAAAGCAAATCACTGCAATTCTC 81
Collagen XV NM_001855.4 GGACTGTTGTCCACCTACCG CTGGGGCCAAGAAGGATCTG 228
Tie1 NM_005424.4 TCTCATGTGGGCGCGG AGCGGTGTCACCTTTGTTCA 378
Tie2 NM_000459.3 TGCGAGATGGATAGGGCTTG GCACCTTCCACAGTTCCAGA 366
TGFBR1 NM_004612.2 CCTCGAGATAGGCCGTTTGT CCAGGTGATGACTTTACAGTAGTTG 125
ALCAM NM_001627.3 AGAACACGATGAGGCAGACG TGTTTTGATGCAGTCTTTGACTTCT 162
CD63 NM_001780.5 GCCCTTGGAATTGCTTTTGTCG CATCACCTCGTAGCCACTTCTG 87
Ang-1 NM_001146.3 GCTGACAGATGTTGAGACCCA TTCCTCCCTTTAGTAAAACACCTTC 395
Ang-2 NM_001147.2 AACTGATGTGGAAGCCCAAGT GGGTCCTTAGCTGAGTTTGATGT 387
VEGFA NM_001025366.2 CGAGAAGTGCTAGCTCGGG CTGGGACCACTTGGCATGG 377
CD34 M81104 CATCACTGGCTATTTCCTGATG AGCCGAATGTGTAAAGGACAG 440
NG2 NM_001897 GCTTTGACCCTGACTATGTTGGC TCCAGAGTAGAGCTGCAGCA 195
αSMA NM_001613 TGGCTATTCCTTCGTTACTA CGATCCAGACAGAGTATTTGC 437
PDGFR-β NM_002609 CAGTAAGGAGGACTTCCTGGAG CCTGAGAGATCTGTGGTTCCAG 178
vWF NM_000552 ATGATTCCTGCCAGATTTGC CTCACCGGACAGCTTGTAGT 396
CD45 Y00638 /
NM_080921 CATGTACTGCTCCTGATAAGAC GCCTACACTTGACATGCATAC 660
ID1 NM_002165.3 AAACGTGCTGCTCTACGACA GAACGCATGCCGCCTCG 254
ID2 NM_002166.4 CAGCATCCCCCAGAACAAGA TTCAGAAGCCTGCAAGGACAG 205
PAI1 NM_000602.4 CCTCTGAGAACTTCAGGATGCAG CCTGCTGAAACACCCTCACC 153
MMP1 NM_002421.3 AGACAAAGGCCAGTATGCAC ACTGGGCCACTATTTCTCCG 193
MMP3 NM_002422.3 TACAAGGAGGCAGGCAAGACA CACAATCCTGTATGTAAGGTGGGTT 421
MMP10 NM_002425.2 ACAAAGAAGGTAAGGGCAGTGA AGGAGCTGAAGTGACCAACG 328
MMP13 NM_002427.3 CCCCAGGCATCACCATTCAA CAGGTAGCGCTCTGCAAACT 150
GAPDH NM_002046.4 GCACCGTCAAGGCTGAGAAC TGGTGAAGACGCCAGTGGA 138
75
REFERENCES
1. Pittenger MF, Mackay AM, Beck SC, et al. Multilineage potential of adult human
mesenchymal stem cells. Science. 1999;284:143-147.
2. Mendicino M, Bailey AM, Wonnacott K, et al. MSC-Based Product Characterization for
Clinical Trials: An FDA Perspective. Cell Stem Cell.14:141-145.
3. LeBlanc K, Frassoni F, Ball L, et al. Mesenchymal stem cells for treatment of steroid-
resistant, severe, acute graft-versus-host disease: a phase II study. Lancet.
2008;371:1579-1586.
4. Ranganath SH, Levy O, Inamdar MS, et al. Harnessing the mesenchymal stem cell
secretome for the treatment of cardiovascular disease. Cell Stem Cell.10:244-258.
5. Madeira A, da Silva CL, dos Santos F, et al. Human mesenchymal stem cell expression
program upon extended ex-vivo cultivation, as revealed by 2-DE-based quantitative
proteomics. PLoS One.7:e43523.
6. Heo JY, Jing K, Song KS, et al. Downregulation of APE1/Ref-1 is involved in the
senescence of mesenchymal stem cells. Stem Cells. 2009;27:1455-1462.
7. Izadpanah R, Kaushal D, Kriedt C, et al. Long-term in vitro expansion alters the biology
of adult mesenchymal stem cells. Cancer Res. 2008;68:4229-4238.
8. Zaim M, Karaman S, Cetin G, et al. Donor age and long-term culture affect
differentiation and proliferation of human bone marrow mesenchymal stem cells. Ann
Hematol.91:1175-1186.
9. Wagner W, Horn P, Castoldi M, et al. Replicative senescence of mesenchymal stem cells:
a continuous and organized process. PLoS One. 2008;3:e2213.
10. Stolzing A, Jones E, McGonagle D, et al. Age-related changes in human bone marrow-
derived mesenchymal stem cells: consequences for cell therapies. Mech Ageing Dev.
2008;129:163-173.
11. Wagner W, Bork S, Horn P, et al. Aging and replicative senescence have related effects
on human stem and progenitor cells. PLoS One. 2009;4:e5846.
12. Giordano A, Galderisi U, Marino IR. From the laboratory bench to the patient's bedside:
an update on clinical trials with mesenchymal stem cells. J Cell Physiol. 2007;211:27-35.
13. Klopp AH, Gupta A, Spaeth E, et al. Concise review: Dissecting a discrepancy in the
literature: do mesenchymal stem cells support or suppress tumor growth? Stem
Cells.29:11-19.
14. Bergfeld SA, DeClerck YA. Bone marrow-derived mesenchymal stem cells and the
tumor microenvironment. Cancer Metastasis Rev.29:249-261.
15. Bernardo ME, Zaffaroni N, Novara F, et al. Human bone marrow derived mesenchymal
stem cells do not undergo transformation after long-term in vitro culture and do not
exhibit telomere maintenance mechanisms. Cancer Res. 2007;67:9142-9149.
16. Torsvik A, Rosland GV, Svendsen A, et al. Spontaneous malignant transformation of
human mesenchymal stem cells reflects cross-contamination: putting the research field on
track - letter. Cancer Res.70:6393-6396.
17. Choumerianou DM, Dimitriou H, Perdikogianni C, et al. Study of oncogenic
transformation in ex vivo expanded mesenchymal cells, from paediatric bone marrow.
Cell Prolif. 2008;41:909-922.
76
18. Rodriguez R, Rubio R, Menendez P. Modeling sarcomagenesis using multipotent
mesenchymal stem cells. Cell Res.
19. Li N, Yang R, Zhang W, et al. Genetically transforming human mesenchymal stem cells
to sarcomas: changes in cellular phenotype and multilineage differentiation potential.
Cancer. 2009;115:4795-4806.
20. Serakinci N, Guldberg P, Burns JS, et al. Adult human mesenchymal stem cell as a target
for neoplastic transformation. Oncogene. 2004;23:5095-5098.
21. Funes JM, Quintero M, Henderson S, et al. Transformation of human mesenchymal stem
cells increases their dependency on oxidative phosphorylation for energy production.
Proc Natl Acad Sci U S A. 2007;104:6223-6228.
22. Lutolf MP, Gilbert PM, Blau HM. Designing materials to direct stem-cell fate. Nature.
2009;462:433-441.
23. Discher DE, Mooney DJ, Zandstra PW. Growth factors, matrices, and forces combine
and control stem cells. Science. 2009;324:1673-1677.
24. Engler AJ, Sen S, Sweeney HL, et al. Matrix elasticity directs stem cell lineage
specification. Cell. 2006;126:677-689.
25. Trappmann B, Gautrot JE, Connelly JT, et al. Extracellular-matrix tethering regulates
stem-cell fate. Nat Mater.11:642-649.
26. Wang Y, Lee WC, Manga KK, et al. Fluorinated Graphene for Promoting Neuro-
Induction of Stem Cells. Advanced Materials. 2012;24:4285-+.
27. Curran JM, Chen R, Hunt JA. Controlling the phenotype and function of mesenchymal
stem cells in vitro by adhesion to silane-modified clean glass surfaces. Biomaterials.
2005;26:7057-7067.
28. Crowder SW, Liang Y, Rath R, et al. Poly(epsilon-caprolactone)-carbon nanotube
composite scaffolds for enhanced cardiac differentiation of human mesenchymal stem
cells. Nanomedicine (Lond).8:1763-1776.
29. Serena E, Figallo E, Tandon N, et al. Electrical stimulation of human embryonic stem
cells: cardiac differentiation and the generation of reactive oxygen species. Exp Cell Res.
2009;315:3611-3619.
30. Tian B, Liu J, Dvir T, et al. Macroporous nanowire nanoelectronic scaffolds for synthetic
tissues. Nat Mater.11:986-994.
31. Chu C, Schmidt JJ, Carnes K, et al. Three-dimensional synthetic niche components to
control germ cell proliferation. Tissue Eng Part A. 2009;15:255-262.
32. Benoit DS, Schwartz MP, Durney AR, et al. Small functional groups for controlled
differentiation of hydrogel-encapsulated human mesenchymal stem cells. Nat Mater.
2008;7:816-823.
33. Kim DH, Provenzano PP, Smith CL, et al. Matrix nanotopography as a regulator of cell
function. J Cell Biol.197:351-360.
34. Wang X, Boire TC, Bronikowski C, et al. Decoupling polymer properties to elucidate
mechanisms governing cell behavior. Tissue Eng Part B Rev.18:396-404.
35. Levy-Mishali M, Zoldan J, Levenberg S. Effect of scaffold stiffness on myoblast
differentiation. Tissue Eng Part A. 2009;15:935-944.
36. Nam J, Johnson J, Lannutti JJ, et al. Modulation of embryonic mesenchymal progenitor
cell differentiation via control over pure mechanical modulus in electrospun nanofibers.
Acta Biomater. 2011;7:1516-1524.
77
37. Gupta MK, Walthall JM, Venkataraman R, et al. Combinatorial polymer electrospun
matrices promote physiologically-relevant cardiomyogenic stem cell differentiation.
PLoS One. 2011;6:e28935.
38. He W, Ma Z, Teo WE, et al. Tubular nanofiber scaffolds for tissue engineered small-
diameter vascular grafts. J Biomed Mater Res A. 2009;90:205-216.
39. Zhang K, Wang H, Huang C, et al. Fabrication of silk fibroin blended P(LLA-CL)
nanofibrous scaffolds for tissue engineering. J Biomed Mater Res A. 2010;93:984-993.
40. Engelhardt EM, Micol LA, Houis S, et al. A collagen-poly(lactic acid-co-varepsilon-
caprolactone) hybrid scaffold for bladder tissue regeneration. Biomaterials.
2011;32:3969-3976.
41. Liu JJ, Wang CY, Wang JG, et al. Peripheral nerve regeneration using composite
poly(lactic acid-caprolactone)/nerve growth factor conduits prepared by coaxial
electrospinning. J Biomed Mater Res A. 2011;96:13-20.
42. Brocchini S, James K, Tangpasuthadol V, et al. Structure-property correlations in a
combinatorial library of degradable biomaterials. J Biomed Mater Res. 1998;42:66-75.
43. Brey DM, Erickson I, Burdick JA. Influence of macromer molecular weight and
chemistry on poly(β-amino ester) network properties and initial cell interactions. Journal
of Biomedical Materials Research Part A. 2008;85A:731-741.
44. Brey DM, Ifkovits JL, Mozia RI, et al. Controlling poly(β-amino ester) network
properties through macromer branching. Acta Biomater. 2008;4:207-217.
45. Metter RB, Ifkovits JL, Hou K, et al. Biodegradable fibrous scaffolds with diverse
properties by electrospinning candidates from a combinatorial macromer library. Acta
Biomater. 2010;6:1219-1226.
46. JORDAN J. GREEN RL, AND DANIEL G. ANDERSON. A Combinatorial Polymer
Library Approach Yields Insight into Nonviral Gene Delivery. Accounts of Chemical
Research. 2008;41:749-759.
47. Eltoukhy AA, Siegwart DJ, Alabi CA, et al. Effect of molecular weight of amine end-
modified poly(β-amino ester)s on gene delivery efficiency and toxicity. Biomaterials.
2012;33:3594-3603.
48. Cai L, Wang S. Poly(ɛ-caprolactone) acrylates synthesized using a facile method for
fabricating networks to achieve controllable physicochemical properties and tunable cell
responses. Polymer. 2010;51:164-177.
49. Joy A, Cohen DM, Luk A, et al. Control of Surface Chemistry, Substrate Stiffness, and
Cell Function in a Novel Terpolymer Methacrylate Library. Langmuir. 2011;27:1891-
1899.
50. Peters A, Brey DM, Burdick JA. High-Throughput and Combinatorial Technologies for
Tissue Engineering Applications. Tissue Eng Part B-Re. 2009;15:225-239.
51. Webster D, Meier M. Polymer Libraries: Preparation and Applications
Polymer Libraries. In: Meier MAR, Webster DC, eds: Springer Berlin / Heidelberg; 2009:1-15.
52. Sung HJ, Su J, Berglund JD, et al. The use of temperature-composition combinatorial
libraries to study the effects of biodegradable polymer blend surfaces on vascular cells.
Biomaterials. 2005;26:4557-4567.
53. Anderson DG, Putnam D, Lavik EB, et al. Biomaterial microarrays: rapid, microscale
screening of polymer–cell interaction. Biomaterials. 2005;26:4892-4897.
78
54. Dolatshahi-Pirouz A, Nikkhah M, Kolind K, et al. Micro- and Nanoengineering
Approaches to Control Stem Cell-Biomaterial Interactions. Journal of Functional
Biomaterials. 2011;2:88-106.
55. Spokoyny AM, Kim D, Sumrein A, et al. Infinite coordination polymer nano- and
microparticle structures. Chem Soc Rev. 2009;38:1218-1227.
56. Simon Jr CG, Eidelman N, Kennedy SB, et al. Combinatorial screening of cell
proliferation on poly(l-lactic acid)/poly(d,l-lactic acid) blends. Biomaterials.
2005;26:6906-6915.
57. Chatterjee K, Sun L, Chow LC, et al. Combinatorial screening of osteoblast response to
3D calcium phosphate/poly(ε-caprolactone) scaffolds using gradients and arrays.
Biomaterials. 2011;32:1361-1369.
58. Crowder SW, Horton LW, Lee SH, et al. Passage-dependent cancerous transformation of
human mesenchymal stem cells under carcinogenic hypoxia. FASEB J.27:2788-2798.
59. Das R, Jahr H, van Osch GJ, et al. The role of hypoxia in bone marrow-derived
mesenchymal stem cells: considerations for regenerative medicine approaches. Tissue
Eng Part B Rev.16:159-168.
60. Hockel M, Vaupel P. Tumor hypoxia: definitions and current clinical, biologic, and
molecular aspects. J Natl Cancer Inst. 2001;93:266-276.
61. Grayson WL, Zhao F, Bunnell B, et al. Hypoxia enhances proliferation and tissue
formation of human mesenchymal stem cells. Biochem Biophys Res Commun.
2007;358:948-953.
62. Chacko SM, Ahmed S, Selvendiran K, et al. Hypoxic preconditioning induces the
expression of prosurvival and proangiogenic markers in mesenchymal stem cells. Am J
Physiol Cell Physiol.299:C1562-1570.
63. Tsai CC, Chen YJ, Yew TL, et al. Hypoxia inhibits senescence and maintains
mesenchymal stem cell properties through down-regulation of E2A-p21 by HIF-TWIST.
Blood.117:459-469.
64. Basciano L, Nemos C, Foliguet B, et al. Long term culture of mesenchymal stem cells in
hypoxia promotes a genetic program maintaining their undifferentiated and multipotent
status. BMC Cell Biol.12:12.
65. Estrada JC, Albo C, Benguria A, et al. Culture of human mesenchymal stem cells at low
oxygen tension improves growth and genetic stability by activating glycolysis. Cell Death
Differ.
66. Semenza GL. Targeting HIF-1 for cancer therapy. Nat Rev Cancer. 2003;3:721-732.
67. Vogelstein B, Lane D, Levine AJ. Surfing the p53 network. Nature. 2000;408:307-310.
68. Koumenis C, Alarcon R, Hammond E, et al. Regulation of p53 by hypoxia: dissociation
of transcriptional repression and apoptosis from p53-dependent transactivation. Mol Cell
Biol. 2001;21:1297-1310.
69. Achison M, Hupp TR. Hypoxia attenuates the p53 response to cellular damage.
Oncogene. 2003;22:3431-3440.
70. Salnikow K, An WG, Melillo G, et al. Nickel-induced transformation shifts the balance
between HIF-1 and p53 transcription factors. Carcinogenesis. 1999;20:1819-1823.
71. Rani AS, Qu DQ, Sidhu MK, et al. Transformation of immortal, non-tumorigenic
osteoblast-like human osteosarcoma cells to the tumorigenic phenotype by nickel sulfate.
Carcinogenesis. 1993;14:947-953.
79
72. Oller AR, Costa M, Oberdorster G. Carcinogenicity assessment of selected nickel
compounds. Toxicol Appl Pharmacol. 1997;143:152-166.
73. Garg S, Serruys P. Biodegradable stents and non-biodegradable stents. Minerva
Cardioangiol. 2009;57:537-565.
74. Evan GI, Vousden KH. Proliferation, cell cycle and apoptosis in cancer. Nature.
2001;411:342-348.
75. Cameron KS, Buchner V, Tchounwou PB. Exploring the molecular mechanisms of
nickel-induced genotoxicity and carcinogenicity: a literature review. Rev Environ
Health.26:81-92.
76. Sung HJ, Yee A, Eskin SG, et al. Cyclic strain and motion control produce opposite
oxidative responses in two human endothelial cell types. Am J Physiol Cell Physiol.
2007;293:C87-94.
77. Giambernardi TA, Grant GM, Taylor GP, et al. Overview of matrix metalloproteinase
expression in cultured human cells. Matrix Biol. 1998;16:483-496.
78. Listenberger LL, Brown DA. Fluorescent detection of lipid droplets and associated
proteins. Curr Protoc Cell Biol. 2007;Chapter 24:Unit 24 22.
79. Galis ZS, Muszynski M, Sukhova GK, et al. Cytokine-stimulated human vascular smooth
muscle cells synthesize a complement of enzymes required for extracellular matrix
digestion. Circ Res. 1994;75:181-189.
80. Valko M, Leibfritz D, Moncol J, et al. Free radicals and antioxidants in normal
physiological functions and human disease. Int J Biochem Cell Biol. 2007;39:44-84.
81. Kretlow JD, Jin YQ, Liu W, et al. Donor age and cell passage affects differentiation
potential of murine bone marrow-derived stem cells. BMC Cell Biol. 2008;9:60.
82. Crowder SW, Gupta MK, Hofmeister LH, et al. Modular polymer design to regulate
phenotype and oxidative response of human coronary artery cells for potential stent
coating applications. Acta Biomaterialia. 2012;8:559-569.
83. Zhang LL, Xiong CD, Deng XM. Biodegradable polyester blends for biomedical
application. J Appl Pol Sci. 1995;56:103-122.
84. Tang ZG, Black RA, Curran JM, et al. Surface properties and biocompatibility of
solvent-cast poly[-caprolactone] films. Biomaterials. 2004;25:4741-4748.
85. Bergstrom K, Holmberg K, Safranj A, et al. Reduction of fibrinogen adsorption on PEG-
coated polystyrene surfaces. J Biomed Mater Res. 1992;26:779-790.
86. Deschamps AA, van Apeldoorn AA, Hayen H, et al. In vivo and in vitro degradation of
poly(ether ester) block copolymers based on poly(ethylene glycol) and poly(butylene
terephthalate). Biomaterials. 2004;25:247-258.
87. Sun G, Zhang XZ, Chu CC. Effect of the molecular weight of polyethylene glycol (PEG)
on the properties of chitosan-PEG-poly(N-isopropylacrylamide) hydrogels. J Mater Sci
Mater Med. 2008;19:2865-2872.
88. Sung HJ, Chandra P, Treiser MD, et al. Synthetic polymeric substrates as potent pro-
oxidant versus anti-oxidant regulators of cytoskeletal remodeling and cell apoptosis. J
Cell Physiol. 2009;218:549-557.
89. Sung H-J, Luk A, Murthy S, et al. Poly(ethylene glycol) as a sensitive regulator of cell
survival fate on polymeric biomaterials: the interplay of cell adhesion and pro-oxidant
signaling mechanisms. Soft Matter. 2010;6:5196-5205.
90. Gimenez S, Ponsart S, Coudane J, et al. Synthesis, properties and in vitro degradation of
carboxyl-bearing PCL. Journal of Bioactive and Compatible Polymers. 2001;16:32-46.
80
91. Crowder SW, Gupta MK, Hofmeister LH, et al. Modular polymer design to regulate
phenotype and oxidative response of human coronary artery cells for potential stent
coating applications. Acta Biomater. 2012;8:559-569.
92. Dong CM, Qiu KY, Cu ZW, et al. Synthesis of star-shaped poly(epsilon-caprolactone)-b-
poly(DL-lactic acid-alt-glycolic acid) with multifunctional initiator and stannous octoate
catalyst. Macromolecules. 2001;34:4691-4696.
93. Sosnik A, Cohn D. Poly(ethylene glycol)-poly(epsilon-caprolactone) block oligomers as
injectable materials. Polymer. 2003;44:7033-7042.
94. Weber N, Wendel HP, Kohn J. Formation of viscoelastic protein layers on polymeric
surfaces relevant to platelet adhesion. J Biomed Mater Res A. 2005;72:420-427.
95. Deskins DL, Bastakoty D, Saraswati S, et al. Human mesenchymal stromal cells:
identifying assays to predict potency for therapeutic selection. Stem Cells Transl
Med.2:151-158.
96. Sung HJ, Luk A, Murthy NS, et al. Poly(ethylene glycol) as a sensitive regulator of cell
survival fate on polymeric biomaterials: the interplay of cell adhesion and pro-oxidant
signaling mechanisms. Soft Matter. 2010;6:5196-5205.
97. McMurray RJ, Gadegaard N, Tsimbouri PM, et al. Nanoscale surfaces for the long-term
maintenance of mesenchymal stem cell phenotype and multipotency. Nat Mater.10:637-
644.
98. Wang K, Zhang T, Dong Q, et al. Redox homeostasis: the linchpin in stem cell self-
renewal and differentiation. Cell Death Dis.4:e537.
99. Crisan M, Yap S, Casteilla L, et al. A perivascular origin for mesenchymal stem cells in
multiple human organs. Cell Stem Cell. 2008;3:301-313.
100. Caplan AI. All MSCs are pericytes? Cell Stem Cell. 2008;3:229-230.
101. Armulik A, Genove G, Betsholtz C. Pericytes: developmental, physiological, and
pathological perspectives, problems, and promises. Dev Cell.21:193-215.
102. Armulik A, Abramsson A, Betsholtz C. Endothelial/pericyte interactions. Circ Res.
2005;97:512-523.
103. Ribatti D, Nico B, Crivellato E. The role of pericytes in angiogenesis. Int J Dev
Biol.55:261-268.
104. Stratman AN, Davis GE. Endothelial cell-pericyte interactions stimulate basement
membrane matrix assembly: influence on vascular tube remodeling, maturation, and
stabilization. Microsc Microanal.18:68-80.
105. Stratman AN, Malotte KM, Mahan RD, et al. Pericyte recruitment during vasculogenic
tube assembly stimulates endothelial basement membrane matrix formation. Blood.
2009;114:5091-5101.
106. Corselli M, Chin CJ, Parekh C, et al. Perivascular support of human hematopoietic
stem/progenitor cells. Blood.121:2891-2901.
107. Bailey AS, Willenbring H, Jiang S, et al. Myeloid lineage progenitors give rise to
vascular endothelium. Proc Natl Acad Sci U S A. 2006;103:13156-13161.
108. Kim SJ, Kim JS, Papadopoulos J, et al. Circulating monocytes expressing CD31:
implications for acute and chronic angiogenesis. Am J Pathol. 2009;174:1972-1980.
109. Davis S, Aldrich TH, Jones PF, et al. Isolation of angiopoietin-1, a ligand for the TIE2
receptor, by secretion-trap expression cloning. Cell. 1996;87:1161-1169.
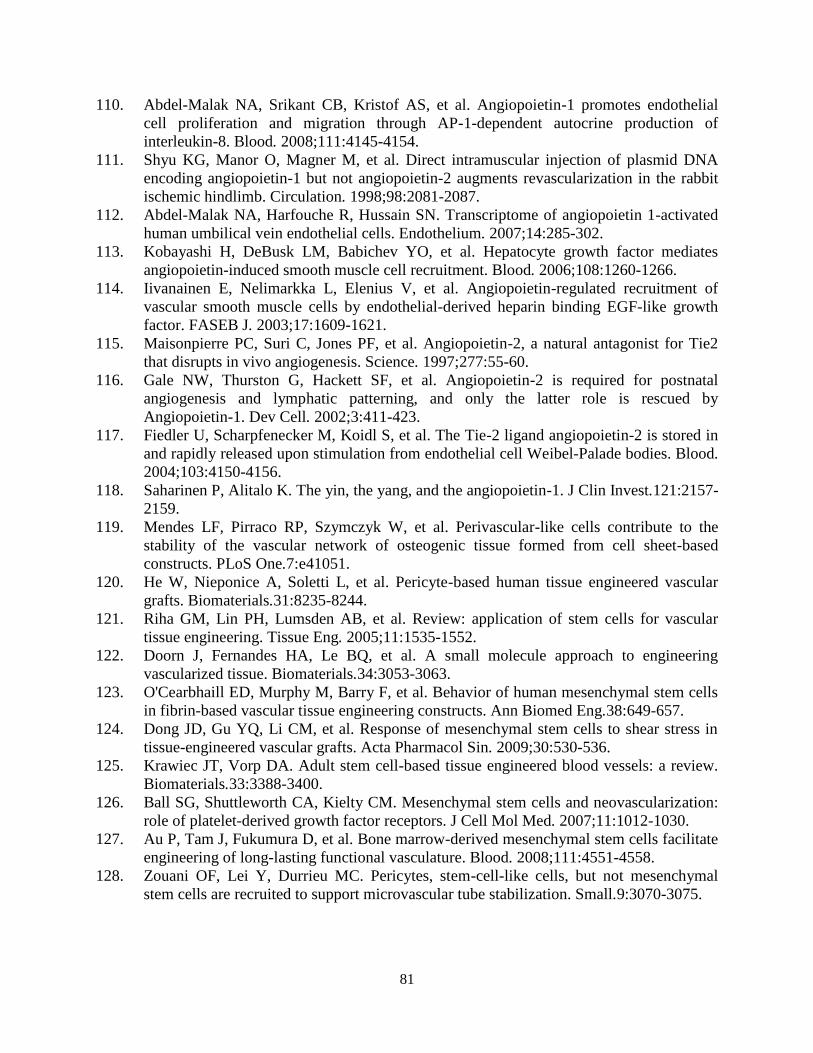
81
110. Abdel-Malak NA, Srikant CB, Kristof AS, et al. Angiopoietin-1 promotes endothelial
cell proliferation and migration through AP-1-dependent autocrine production of
interleukin-8. Blood. 2008;111:4145-4154.
111. Shyu KG, Manor O, Magner M, et al. Direct intramuscular injection of plasmid DNA
encoding angiopoietin-1 but not angiopoietin-2 augments revascularization in the rabbit
ischemic hindlimb. Circulation. 1998;98:2081-2087.
112. Abdel-Malak NA, Harfouche R, Hussain SN. Transcriptome of angiopoietin 1-activated
human umbilical vein endothelial cells. Endothelium. 2007;14:285-302.
113. Kobayashi H, DeBusk LM, Babichev YO, et al. Hepatocyte growth factor mediates
angiopoietin-induced smooth muscle cell recruitment. Blood. 2006;108:1260-1266.
114. Iivanainen E, Nelimarkka L, Elenius V, et al. Angiopoietin-regulated recruitment of
vascular smooth muscle cells by endothelial-derived heparin binding EGF-like growth
factor. FASEB J. 2003;17:1609-1621.
115. Maisonpierre PC, Suri C, Jones PF, et al. Angiopoietin-2, a natural antagonist for Tie2
that disrupts in vivo angiogenesis. Science. 1997;277:55-60.
116. Gale NW, Thurston G, Hackett SF, et al. Angiopoietin-2 is required for postnatal
angiogenesis and lymphatic patterning, and only the latter role is rescued by
Angiopoietin-1. Dev Cell. 2002;3:411-423.
117. Fiedler U, Scharpfenecker M, Koidl S, et al. The Tie-2 ligand angiopoietin-2 is stored in
and rapidly released upon stimulation from endothelial cell Weibel-Palade bodies. Blood.
2004;103:4150-4156.
118. Saharinen P, Alitalo K. The yin, the yang, and the angiopoietin-1. J Clin Invest.121:2157-
2159.
119. Mendes LF, Pirraco RP, Szymczyk W, et al. Perivascular-like cells contribute to the
stability of the vascular network of osteogenic tissue formed from cell sheet-based
constructs. PLoS One.7:e41051.
120. He W, Nieponice A, Soletti L, et al. Pericyte-based human tissue engineered vascular
grafts. Biomaterials.31:8235-8244.
121. Riha GM, Lin PH, Lumsden AB, et al. Review: application of stem cells for vascular
tissue engineering. Tissue Eng. 2005;11:1535-1552.
122. Doorn J, Fernandes HA, Le BQ, et al. A small molecule approach to engineering
vascularized tissue. Biomaterials.34:3053-3063.
123. O'Cearbhaill ED, Murphy M, Barry F, et al. Behavior of human mesenchymal stem cells
in fibrin-based vascular tissue engineering constructs. Ann Biomed Eng.38:649-657.
124. Dong JD, Gu YQ, Li CM, et al. Response of mesenchymal stem cells to shear stress in
tissue-engineered vascular grafts. Acta Pharmacol Sin. 2009;30:530-536.
125. Krawiec JT, Vorp DA. Adult stem cell-based tissue engineered blood vessels: a review.
Biomaterials.33:3388-3400.
126. Ball SG, Shuttleworth CA, Kielty CM. Mesenchymal stem cells and neovascularization:
role of platelet-derived growth factor receptors. J Cell Mol Med. 2007;11:1012-1030.
127. Au P, Tam J, Fukumura D, et al. Bone marrow-derived mesenchymal stem cells facilitate
engineering of long-lasting functional vasculature. Blood. 2008;111:4551-4558.
128. Zouani OF, Lei Y, Durrieu MC. Pericytes, stem-cell-like cells, but not mesenchymal
stem cells are recruited to support microvascular tube stabilization. Small.9:3070-3075.
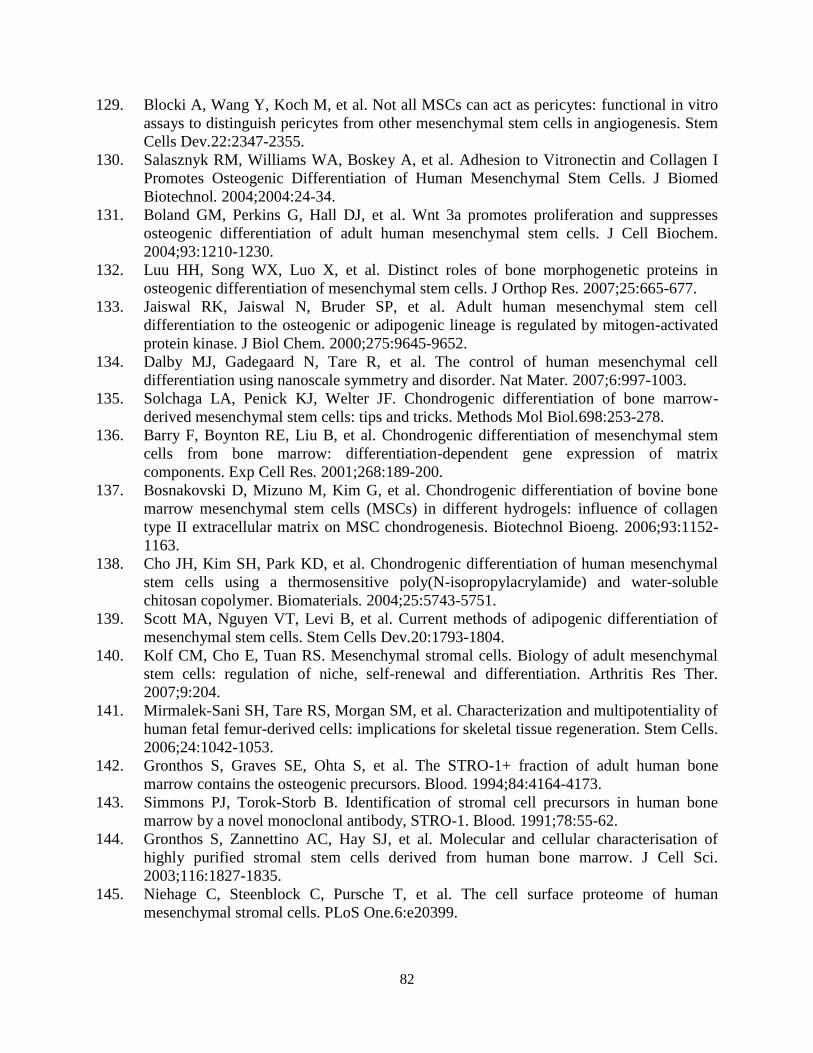
82
129. Blocki A, Wang Y, Koch M, et al. Not all MSCs can act as pericytes: functional in vitro
assays to distinguish pericytes from other mesenchymal stem cells in angiogenesis. Stem
Cells Dev.22:2347-2355.
130. Salasznyk RM, Williams WA, Boskey A, et al. Adhesion to Vitronectin and Collagen I
Promotes Osteogenic Differentiation of Human Mesenchymal Stem Cells. J Biomed
Biotechnol. 2004;2004:24-34.
131. Boland GM, Perkins G, Hall DJ, et al. Wnt 3a promotes proliferation and suppresses
osteogenic differentiation of adult human mesenchymal stem cells. J Cell Biochem.
2004;93:1210-1230.
132. Luu HH, Song WX, Luo X, et al. Distinct roles of bone morphogenetic proteins in
osteogenic differentiation of mesenchymal stem cells. J Orthop Res. 2007;25:665-677.
133. Jaiswal RK, Jaiswal N, Bruder SP, et al. Adult human mesenchymal stem cell
differentiation to the osteogenic or adipogenic lineage is regulated by mitogen-activated
protein kinase. J Biol Chem. 2000;275:9645-9652.
134. Dalby MJ, Gadegaard N, Tare R, et al. The control of human mesenchymal cell
differentiation using nanoscale symmetry and disorder. Nat Mater. 2007;6:997-1003.
135. Solchaga LA, Penick KJ, Welter JF. Chondrogenic differentiation of bone marrow-
derived mesenchymal stem cells: tips and tricks. Methods Mol Biol.698:253-278.
136. Barry F, Boynton RE, Liu B, et al. Chondrogenic differentiation of mesenchymal stem
cells from bone marrow: differentiation-dependent gene expression of matrix
components. Exp Cell Res. 2001;268:189-200.
137. Bosnakovski D, Mizuno M, Kim G, et al. Chondrogenic differentiation of bovine bone
marrow mesenchymal stem cells (MSCs) in different hydrogels: influence of collagen
type II extracellular matrix on MSC chondrogenesis. Biotechnol Bioeng. 2006;93:1152-
1163.
138. Cho JH, Kim SH, Park KD, et al. Chondrogenic differentiation of human mesenchymal
stem cells using a thermosensitive poly(N-isopropylacrylamide) and water-soluble
chitosan copolymer. Biomaterials. 2004;25:5743-5751.
139. Scott MA, Nguyen VT, Levi B, et al. Current methods of adipogenic differentiation of
mesenchymal stem cells. Stem Cells Dev.20:1793-1804.
140. Kolf CM, Cho E, Tuan RS. Mesenchymal stromal cells. Biology of adult mesenchymal
stem cells: regulation of niche, self-renewal and differentiation. Arthritis Res Ther.
2007;9:204.
141. Mirmalek-Sani SH, Tare RS, Morgan SM, et al. Characterization and multipotentiality of
human fetal femur-derived cells: implications for skeletal tissue regeneration. Stem Cells.
2006;24:1042-1053.
142. Gronthos S, Graves SE, Ohta S, et al. The STRO-1+ fraction of adult human bone
marrow contains the osteogenic precursors. Blood. 1994;84:4164-4173.
143. Simmons PJ, Torok-Storb B. Identification of stromal cell precursors in human bone
marrow by a novel monoclonal antibody, STRO-1. Blood. 1991;78:55-62.
144. Gronthos S, Zannettino AC, Hay SJ, et al. Molecular and cellular characterisation of
highly purified stromal stem cells derived from human bone marrow. J Cell Sci.
2003;116:1827-1835.
145. Niehage C, Steenblock C, Pursche T, et al. The cell surface proteome of human
mesenchymal stromal cells. PLoS One.6:e20399.
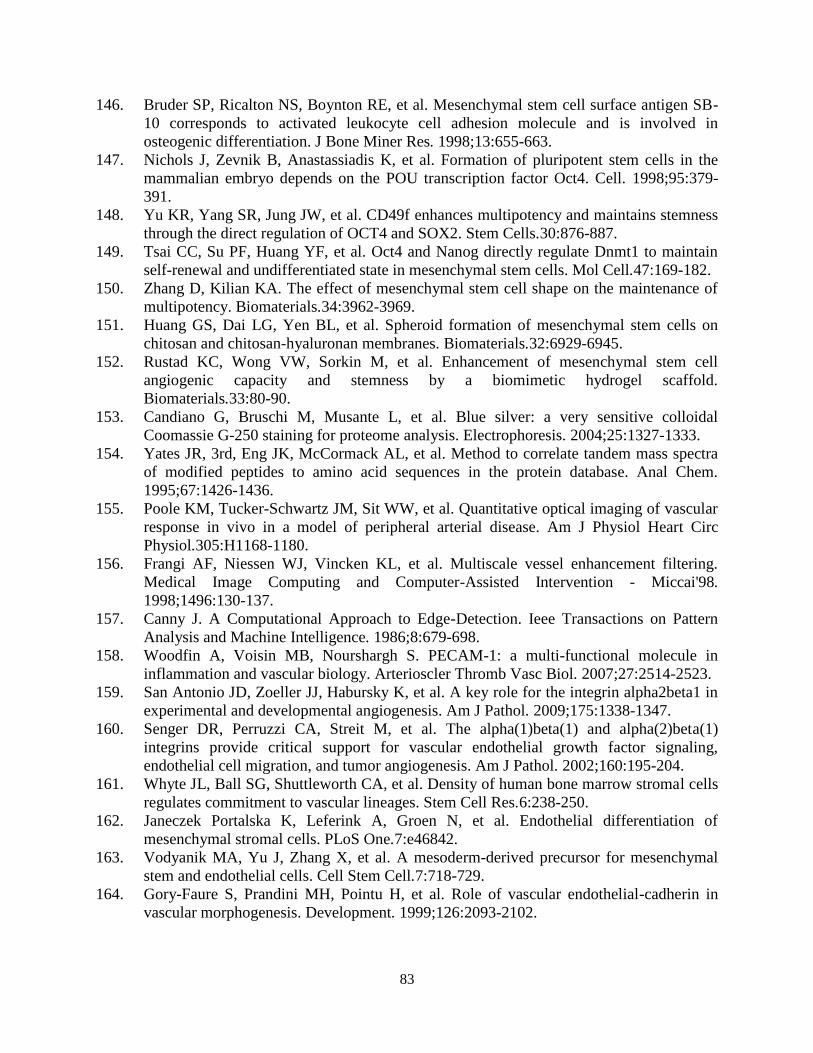
83
146. Bruder SP, Ricalton NS, Boynton RE, et al. Mesenchymal stem cell surface antigen SB-
10 corresponds to activated leukocyte cell adhesion molecule and is involved in
osteogenic differentiation. J Bone Miner Res. 1998;13:655-663.
147. Nichols J, Zevnik B, Anastassiadis K, et al. Formation of pluripotent stem cells in the
mammalian embryo depends on the POU transcription factor Oct4. Cell. 1998;95:379-
391.
148. Yu KR, Yang SR, Jung JW, et al. CD49f enhances multipotency and maintains stemness
through the direct regulation of OCT4 and SOX2. Stem Cells.30:876-887.
149. Tsai CC, Su PF, Huang YF, et al. Oct4 and Nanog directly regulate Dnmt1 to maintain
self-renewal and undifferentiated state in mesenchymal stem cells. Mol Cell.47:169-182.
150. Zhang D, Kilian KA. The effect of mesenchymal stem cell shape on the maintenance of
multipotency. Biomaterials.34:3962-3969.
151. Huang GS, Dai LG, Yen BL, et al. Spheroid formation of mesenchymal stem cells on
chitosan and chitosan-hyaluronan membranes. Biomaterials.32:6929-6945.
152. Rustad KC, Wong VW, Sorkin M, et al. Enhancement of mesenchymal stem cell
angiogenic capacity and stemness by a biomimetic hydrogel scaffold.
Biomaterials.33:80-90.
153. Candiano G, Bruschi M, Musante L, et al. Blue silver: a very sensitive colloidal
Coomassie G-250 staining for proteome analysis. Electrophoresis. 2004;25:1327-1333.
154. Yates JR, 3rd, Eng JK, McCormack AL, et al. Method to correlate tandem mass spectra
of modified peptides to amino acid sequences in the protein database. Anal Chem.
1995;67:1426-1436.
155. Poole KM, Tucker-Schwartz JM, Sit WW, et al. Quantitative optical imaging of vascular
response in vivo in a model of peripheral arterial disease. Am J Physiol Heart Circ
Physiol.305:H1168-1180.
156. Frangi AF, Niessen WJ, Vincken KL, et al. Multiscale vessel enhancement filtering.
Medical Image Computing and Computer-Assisted Intervention - Miccai'98.
1998;1496:130-137.
157. Canny J. A Computational Approach to Edge-Detection. Ieee Transactions on Pattern
Analysis and Machine Intelligence. 1986;8:679-698.
158. Woodfin A, Voisin MB, Nourshargh S. PECAM-1: a multi-functional molecule in
inflammation and vascular biology. Arterioscler Thromb Vasc Biol. 2007;27:2514-2523.
159. San Antonio JD, Zoeller JJ, Habursky K, et al. A key role for the integrin alpha2beta1 in
experimental and developmental angiogenesis. Am J Pathol. 2009;175:1338-1347.
160. Senger DR, Perruzzi CA, Streit M, et al. The alpha(1)beta(1) and alpha(2)beta(1)
integrins provide critical support for vascular endothelial growth factor signaling,
endothelial cell migration, and tumor angiogenesis. Am J Pathol. 2002;160:195-204.
161. Whyte JL, Ball SG, Shuttleworth CA, et al. Density of human bone marrow stromal cells
regulates commitment to vascular lineages. Stem Cell Res.6:238-250.
162. Janeczek Portalska K, Leferink A, Groen N, et al. Endothelial differentiation of
mesenchymal stromal cells. PLoS One.7:e46842.
163. Vodyanik MA, Yu J, Zhang X, et al. A mesoderm-derived precursor for mesenchymal
stem and endothelial cells. Cell Stem Cell.7:718-729.
164. Gory-Faure S, Prandini MH, Pointu H, et al. Role of vascular endothelial-cadherin in
vascular morphogenesis. Development. 1999;126:2093-2102.
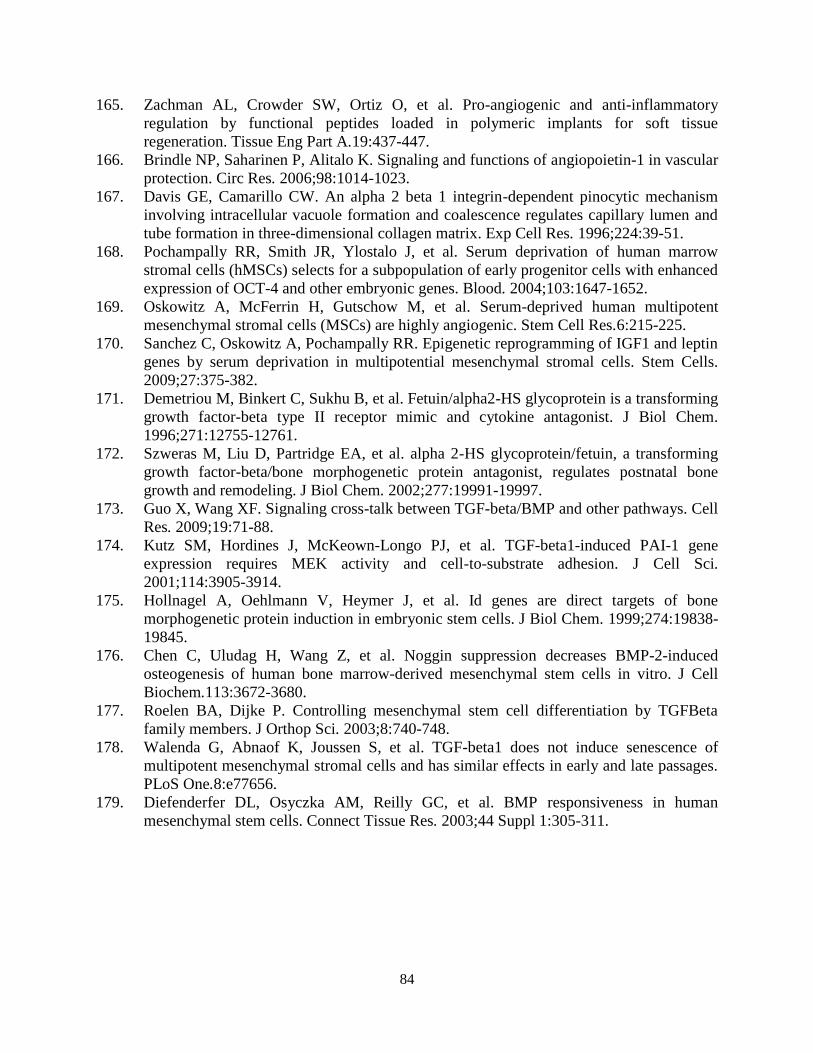
84
165. Zachman AL, Crowder SW, Ortiz O, et al. Pro-angiogenic and anti-inflammatory
regulation by functional peptides loaded in polymeric implants for soft tissue
regeneration. Tissue Eng Part A.19:437-447.
166. Brindle NP, Saharinen P, Alitalo K. Signaling and functions of angiopoietin-1 in vascular
protection. Circ Res. 2006;98:1014-1023.
167. Davis GE, Camarillo CW. An alpha 2 beta 1 integrin-dependent pinocytic mechanism
involving intracellular vacuole formation and coalescence regulates capillary lumen and
tube formation in three-dimensional collagen matrix. Exp Cell Res. 1996;224:39-51.
168. Pochampally RR, Smith JR, Ylostalo J, et al. Serum deprivation of human marrow
stromal cells (hMSCs) selects for a subpopulation of early progenitor cells with enhanced
expression of OCT-4 and other embryonic genes. Blood. 2004;103:1647-1652.
169. Oskowitz A, McFerrin H, Gutschow M, et al. Serum-deprived human multipotent
mesenchymal stromal cells (MSCs) are highly angiogenic. Stem Cell Res.6:215-225.
170. Sanchez C, Oskowitz A, Pochampally RR. Epigenetic reprogramming of IGF1 and leptin
genes by serum deprivation in multipotential mesenchymal stromal cells. Stem Cells.
2009;27:375-382.
171. Demetriou M, Binkert C, Sukhu B, et al. Fetuin/alpha2-HS glycoprotein is a transforming
growth factor-beta type II receptor mimic and cytokine antagonist. J Biol Chem.
1996;271:12755-12761.
172. Szweras M, Liu D, Partridge EA, et al. alpha 2-HS glycoprotein/fetuin, a transforming
growth factor-beta/bone morphogenetic protein antagonist, regulates postnatal bone
growth and remodeling. J Biol Chem. 2002;277:19991-19997.
173. Guo X, Wang XF. Signaling cross-talk between TGF-beta/BMP and other pathways. Cell
Res. 2009;19:71-88.
174. Kutz SM, Hordines J, McKeown-Longo PJ, et al. TGF-beta1-induced PAI-1 gene
expression requires MEK activity and cell-to-substrate adhesion. J Cell Sci.
2001;114:3905-3914.
175. Hollnagel A, Oehlmann V, Heymer J, et al. Id genes are direct targets of bone
morphogenetic protein induction in embryonic stem cells. J Biol Chem. 1999;274:19838-
19845.
176. Chen C, Uludag H, Wang Z, et al. Noggin suppression decreases BMP-2-induced
osteogenesis of human bone marrow-derived mesenchymal stem cells in vitro. J Cell
Biochem.113:3672-3680.
177. Roelen BA, Dijke P. Controlling mesenchymal stem cell differentiation by TGFBeta
family members. J Orthop Sci. 2003;8:740-748.
178. Walenda G, Abnaof K, Joussen S, et al. TGF-beta1 does not induce senescence of
multipotent mesenchymal stromal cells and has similar effects in early and late passages.
PLoS One.8:e77656.
179. Diefenderfer DL, Osyczka AM, Reilly GC, et al. BMP responsiveness in human
mesenchymal stem cells. Connect Tissue Res. 2003;44 Suppl 1:305-311.


![BIOMATERIAL [XRD and FTIR analysis]nuristianah.lecture.ub.ac.id/files/2016/09/Biomaterial-13.pdf · BIOMATERIAL [XRD and FTIR analysis] ... • Historical retrospective CHAPTER 3:](https://img.pdfslide.us/doc/110x75/5b0d75de7f8b9a952f8d8c05/biomaterial-xrd-and-ftir-analysis-xrd-and-ftir-analysis-historical-retrospective.jpg)
![BIOMATERIAL [SEM and TEM analysis]nuristianah.lecture.ub.ac.id/files/2016/09/Biomaterial-12.pdf · BIOMATERIAL [SEM and TEM analysis] NurIstianah, ST.,MT.,M.Eng. Scale of Structure](https://img.pdfslide.us/doc/110x75/5e618afba57d6d7f196476ae/biomaterial-sem-and-tem-analysis-biomaterial-sem-and-tem-analysis-nuristianah.jpg)