Embed Size (px)
Citation preview

MULTIPLE VOLTAGE DISTURBANCE RIDE-THROUGH CAPABILITY
JUSTIFICATION OF AEMO’S PROPOSAL
March 2018

MULTIPLE VOLTAGE DISTURBANCE RIDE-THROUGH CAPABILITY
Australian Energy Market Operator Ltd ABN 94 072 010 327 www.aemo.com.au [email protected]
NEW SOUTH WALES QUEENSLAND SOUTH AUSTRALIA VICTORIA AUSTRALIAN CAPITAL TERRITORY TASMANIA WESTERN AUSTRALIA
IMPORTANT NOTICE
Purpose
AEMO has prepared this document to provide information about multiple-fault ride-through performance
requirements of generators, as at the date of publication.
Disclaimer This document or the information in it may be subsequently updated or amended. This document does
not constitute legal or business advice, and should not be relied on as a substitute for obtaining detailed
advice about the National Electricity Law, the National Electricity Rules, or any other applicable laws,
procedures or policies. AEMO has made every effort to ensure the quality of the information in this
document but cannot guarantee its accuracy or completeness.
Accordingly, to the maximum extent permitted by law, AEMO and its officers, employees and
consultants involved in the preparation of this document:
make no representation or warranty, express or implied, as to the currency, accuracy, reliability or
completeness of the information in this document; and
are not liable (whether by reason of negligence or otherwise) for any statements or representations
in this document, or any omissions from it, or for any use or reliance on the information in it.
Copyright © 2018 Australian Energy Market Operator Limited. The material in this publication may be used in
accordance with the copyright permissions on AEMO’s website.

MULTIPLE VOLTAGE DISTURBANCE RIDE-THROUGH CAPABILITY
© AEMO 2018 1
EXECUTIVE SUMMARY
AEMO has proposed new requirements (access standards) for all types of generation to ride through
multiple disturbances (faults) as part of its proposed rule change on generator technical performance
standards. These new access standards aim to balance power system security requirements and
maintenance of plant integrity.
The criteria forming the basis of an assessment against the proposed access standards were:
The total number of disturbances within pre-defined sliding time windows (NF);
The accumulated disturbance duration (Δt); and
The sum of changes in voltage by the duration of the disturbance (ΔV x Δt).
A detailed description of how these criteria are to be assessed is provided in Section 3.
Power system modelling and analysis demonstrated that the proposed access standards can be met by
a range of new and existing synchronous and asynchronous generation.
The simulation results showed a range of OEM technologies can ride through the required number of
disturbances (NF). Δt and ΔV x Δt are calculated for each case, where the proposed Δt criterion is met
in some cases, and the proposed ΔV x Δt criterion is met for long, shallow disturbances.
These results showed the proposed access standards are practical and achievable.
Where a generating system failed to ride through multiple disturbances simulation results showed that
the disturbance sequence exceeded the requirements of the proposed access standards.
These results showed the proposed access standards have fully considered the limitations of the power
system and the generating system. AEMO, therefore, proposes that a generating system is not required
to ride through a combination of disturbances if it leads to one proposed criterion being exceeded.
The simulation studies presented in this document have provided sufficient evidence to demonstrate the
proposed access standards strike a balance between power system security and generating system
safety, and can be met by various generation technologies.

MULTIPLE VOLTAGE DISTURBANCE RIDE-THROUGH CAPABILITY
© AEMO 2018 2
GLOSSARY
The acronyms, symbols and abbreviations in Table 1 have the meanings set out opposite them when
used in this document.
Table 1 Defined terms
Symbol Definition
#p #-phase fault, i.e. 1p = one phase, 2p = two phase, 3p = three phase
dT See Δt
dV See ΔV
dV x dT See ΔV x Δt
NF Total number of disturbances
Δ|VN| Voltage drop at the connection point, referenced from 90% of the normal voltage
Δt Accumulated disturbance duration (Change in time)
ΔV Change in voltage
ΔV x Δt Sum of changes in voltage by the duration of the disturbance
Acronym Definition
AEMO Australian Energy Market Operator
DEG Degrees
DNSP Distribution Network Service Provider
GPS Generator Performance Standards
kV Kilo-Volt
LVRT Low Voltage Ride-Through
ms milliseconds
MVA Mega Volt Ampere
MW Megawatt
NEM National Electricity Market
NER National Electricity Rules
NSP Network Service Provider
OEM Original Equipment Manufacturer
PSCAD™/EMTDC™ Power System Computer Aided Design / Electromagnetic Transient with Direct Current
PSS®E Power System Simulator for Engineering
pu per unit
pu.s Per-unit Seconds
QLD Queensland
RMS Root Mean Square
s seconds
SA South Australia
SCR Short Circuit Ratio
SMIB Single Machine Infinite Bus
WSCR Weighted Short Circuit Ratio

MULTIPLE VOLTAGE DISTURBANCE RIDE-THROUGH CAPABILITY
© AEMO 2018 3
CONTENTS
EXECUTIVE SUMMARY 1
GLOSSARY 2
PROPOSED STANDARD 5
1. PURPOSE 8
2. THE NEED TO RIDE THROUGH MULTIPLE FAULTS 8
3. ASSESSMENT CRITERIA 9
4. APPLICATION OF PROPOSED REQUIREMENTS DURING GPS NEGOTIATION STAGE 11
5. SIMULATION CASE STUDIES TO SUPPORT THE PROPOSED REQUIREMENTS 11
6. CONCLUSION 16
APPENDIX A. PSS®E SIMULATION RESULTS 18
APPENDIX B. CONTROL SYSTEM INTERACTION AND LOW VOLTAGE RIDE-THROUGH RE-
TRIGGERING 37
APPENDIX C. DETAILED DEFINITIONS 42
C.1 Sliding window reset time 42
C.2 Considered disturbances 43
C.3 Deep disturbance (fault) threshold 44
APPENDIX D. PSCAD™/EMTDC™ SIMULATION RESULTS FOR SYNCHRONOUS
GENERATING UNITS AUXILIARY SUPPLIES 45
APPENDIX E. COMPARISON OF PSCAD™/EMTDC™ AND PSS®E MODEL PERFORMANCE
FOR MULTIPLE DISTURBANCE RIDE THROUGH 47
TABLES
Table 1 Defined terms 2
Table 2 Proposed access standards for multiple-disturbance ride-through requirement 5
Table 3 Definitions of terms used in the proposed access standards 7
Table 4 Generating systems investigated in the assessment 12
Table 5 Simulation results for generation successfully riding through multiple disturbances 13
Table 6 Simulation results of generator failing to ride through multiple disturbances 15
FIGURES
Figure 1 Example disturbance sequence with long fault duration 7
Figure 2 South Australian power system faults per period 8

MULTIPLE VOLTAGE DISTURBANCE RIDE-THROUGH CAPABILITY
© AEMO 2018 4
Figure 3 Queensland power system faults per period 9
Figure 4 Calculation of ΔV x Δt 10
Figure 5 Case 1a-1 Synchronous Generating System 1 Stable Case 1 18
Figure 6 Case 1a-2 Synchronous Generating System 1 Stable Case 2 19
Figure 7 Case 1a-3 Synchronous Generating System 1 Stable Case 3 20
Figure 8 Case 2-1 Synchronous Generating System 2 stable Case 1 21
Figure 9 Case 2-2 Synchronous Generating System 2 stable Case 2 22
Figure 10 Case 2-3 Synchronous Generating System 2 stable Case 3 23
Figure 11 Case 3-1 Asynchronous Generating System 1 stable Case 1 24
Figure 12 Case 3-2 Asynchronous Generating System 1 stable Case 2 25
Figure 13 Case 3-3 Asynchronous Generating System 1 stable Case 3 26
Figure 14 Case 4-1 Asynchronous Generating System 2 stable Case 1 27
Figure 15 Case 4-2 Asynchronous Generating System 2 stable Case 2 28
Figure 16 Case 4-3 Asynchronous Generating System 2 Stable Case 3 29
Figure 17 Case 5-1 Asynchronous Generating System 3 Stable Case 1 30
Figure 18 Case 5-2 Asynchronous Generating System 3 Stable Case 2 31
Figure 19 Case 5-3 Asynchronous Generating System 3 Stable Case 3 32
Figure 20 Case 6-1 Asynchronous Generating System 4 Stable Case 33
Figure 21 Case 1b-1 Synchronous Generating System 1 unstable Case 1 34
Figure 22 Case 1b-2 Synchronous Generating System 1 unstable Case 2 35
Figure 23 Case 1b-3 Synchronous Generating System 1 unstable Case 3 36
Figure 24 Connection point voltage drops to 85%, no LVRT re-triggering 38
Figure 25 Connection point voltage drops to 80%, LVRT re-triggering 39
Figure 26 Connection point voltage drops to 75%, LVRT re-triggering 40
Figure 27 Connection point voltage drops to 70%, no LVRT re-triggering 41
Figure 28 Concept of sliding window 42
Figure 29 Example of disturbance sequence for the proposed automatic access standard 43
Figure 30 Example of disturbance sequence for the proposed minimum access standard 43
Figure 31 Fault voltage – Phase RMS voltage 44
Figure 32 Fault voltage – Positive sequence voltage 44
Figure 33 Auxiliary supplies terminal voltages 45
Figure 34 Auxiliary supplies performance – motor speed 45
Figure 35 Auxiliary supplies performance – motor torque 46
Figure 36 Wind farm active power comparison between PSCAD™/EMTDC™ and PSS®E models 47
Figure 37 Wind farm reactive power comparison between PSCAD™/EMTDC™ and PSS®E models 47

MULTIPLE VOLTAGE DISTURBANCE RIDE-THROUGH CAPABILITY
© AEMO 2018 5
PROPOSED STANDARD
The proposed multiple-disturbance ride-through requirement is summarised in Table 2, with specific
terminology definitions in Table 3.
Table 2 Proposed access standards for multiple-disturbance ride-through requirement
Elements Automatic access standards Minimum access standards
Total no. of disturbances 15 6
Sliding window reset time 5 minutes 30 minutesA
Accumulated disturbance duration (millisecond) B
1800 1000
Sum of ΔV x Δt (pu.second) 1.0 0.5C
Number of deep disturbances
(connection point voltage during disturbance < 50%)
6 3
Minimum time difference between successive disturbances
No minimumD 200 ms
Type of disturbances to be consideredE
One disturbance cleared by breaker-fail protection system
One long-duration shallow disturbance, e.g. 80% residual voltage for 2 s as per clause S5.2.5.4
One deep three-phase disturbance (or two deep three-phase disturbances in parts of network where a three-phase auto-reclosing is permitted)
Remaining disturbances are unbalanced
An unsuccessful auto-reclosure is counted as two disturbances
One disturbance cleared by breaker-fail protection system
One long-duration shallow disturbance, e.g. 80% residual voltage for 2 s as per clause S5.2.5.4
All disturbances are unbalanced
An unsuccessful auto-reclosure is counted as two disturbances
A. This means that the generating system must withstand the same number of voltage disturbances within a five-minute interval. However, no further ride-through capability is required until the 30-minute interval expires. For further details see Appendix C.1. B. These requirements are applied in additional to the NER clause S5.2.5.4 requirements. C. Any non-credible contingency, or any individual contingency causing a synchronous generating system to exceed its critical fault clearance time is excluded from assessment of the proposed access standard. D. Meaning that two successive disturbances can occur one after another with practically zero time difference. However, it is recognised that in reality not all 15 faults will occur with 0 ms separation in between. Randomly distributed time differences between successive disturbances, ranging from 0 to 200 ms, may be applied by the Applicant. The sequence studied should include at least two pairs of successive disturbances with 0 ms time difference in between. E. Disturbances should not result in the generating system under consideration being islanded, or cause large sections of the transmission or distribution network being lost.
Time between disturbances
The proposed automatic access standard does not specify any value or range of values for the
minimum time difference between successive disturbances, because it is not possible to control or
anticipate the next disturbance due to its inherent randomness. Any two successive disturbances could
be zero seconds apart. Assessment should, therefore, be made on this basis, with intervals between
fault clearance and inception as low as zero seconds provided that the power system to which the
generating system is connected remains stable. The proposed minimum access standard allows for a
200 ms time difference between the clearance of a preceding disturbance and the occurrence of the
succeeding disturbance.
Applicable access standards versus generating technologies
Synchronous machines are directly coupled to the power system and their primary components are,
therefore, exposed to various impacts of disturbances, including thermal, mechanical, and electrical
adverse impacts.

MULTIPLE VOLTAGE DISTURBANCE RIDE-THROUGH CAPABILITY
© AEMO 2018 6
Asynchronous generating systems generally have components that are more susceptible to
disturbances fully or partially decoupled from the power system disturbance with their fast control
systems further minimising the impact of disturbances.
Given these inherent technology differentiators, it is proposed that an acceptable performance standard
for asynchronous generating systems should be at, or as close as possible to, the proposed automatic
access standard, whereas a wider range of negotiated outcomes may be acceptable for synchronous
machines considering the key technological differentiators discussed above.
Diversity in physical locations and severity of disturbances
The proposed access standards acknowledge that the occurrence of a large number of deep voltage
disturbances in close proximity to a generating system could result in the generating system being
islanded and inoperable, or large sections of adjacent transmission or distribution network being out of
service. The proposed access standards specify the maximum number of deep disturbances (with a
connection point voltage of less than 50%) that needs to be considered, with the remaining shallower
disturbances resulting in a residual voltage of greater than 50%. For each connection, the selection of
the number of deep and shallow disturbances must consider the characteristics of the surrounding
power system, thereby applying the disturbances at a wide variety of physical locations not to cause the
generating system being islanded.
Fault type and duration
Applicants must only apply the disturbances listed in “Type of disturbances to be considered” in
Table 2 to assess whether they can meet the proposed generator performance standards with respect
to multiple voltage disturbances.
The fault clearance time for each fault in isolation must be within the relevant primary protection or
circuit breaker failure clearance time for the specific faults appropriate to the generating system under
consideration, and as specified in the generator performance standards for that facility.
The fault clearance times applied to synchronous machines for this assessment must be below the
respective critical clearing time. Longer duration faults must not be applied.
Some generating systems connected to remote distribution systems can be subject to deep faults with
fault clearance times in the order of several seconds with possible auto-reclosure. Such long duration
disturbances are outside the scope of the proposed access standards, as these types of disturbances
affect a very limited part of the network. Therefore, an inability to ride through a number of such
disturbances will have a limited impact on power system security. In recognition of this limitation, and
that a 1-second clearance time for a deep fault would exceed the minimum access standard Sum of ΔV
x Δt criteria, the maximum fault duration to be applied in multiple fault ride-through assessments should
not exceed 1 s.
An example of such a disturbance sequence is illustrated in Figure 1.
Note that assessment against single contingency and reclose events for the purposes of assessing
whether the requirement in NER clause S5.2.5.5 can be met must still occur considering the actual
clearance times for long duration disturbances.

MULTIPLE VOLTAGE DISTURBANCE RIDE-THROUGH CAPABILITY
© AEMO 2018 7
Figure 1 Example disturbance sequence with long fault duration
In the above example, the generating system had successfully ridden through the first four
disturbances. The fifth disturbance caused the connection point voltage to drop below 50% for five
seconds. The generating system is not, therefore, required to ride through the fifth long duration
disturbance.
Definitions
The following table provides the meanings of certain terms used in the proposed access standards.
Table 3 Definitions of terms used in the proposed access standards
Term Definition
Accumulated disturbance duration (Δt)
The total time in which the connection point voltage is below the lower nominal operating band of 0.9 per unit. More details in Section 3.1.1.
Deep disturbance When the connection point voltage is below 50%. This is generally the lowest of the three-phase voltages. When a fault ride-through strategy uses the positive-sequence voltage for initiating the ride-through sequence, the positive-sequence voltage will be used for assessing the number of deep voltage disturbances in Table 2. More details in Appendix C.3.
Sliding window reset time The total time from the first disturbance in a sequence of disturbances (as per Table 2) that must expire before a generating system is required to withstand further faults. More details in Appendix C.1.
Sum of ΔV x Δt (ΔV x Δt) The time integral of the connection point voltage and 0.9 per unit, when the voltage is below 0.9 per unit. More details in Section 3.1.3.

MULTIPLE VOLTAGE DISTURBANCE RIDE-THROUGH CAPABILITY
© AEMO 2018 8
1. PURPOSE
This report provides supporting evidence on the suitability of the proposed access standards for
multiple voltage disturbances in quick succession, with simulation results confirming that the proposed
range of access standards are practical, and can be met by various generation technologies.
2. THE NEED TO RIDE THROUGH MULTIPLE
FAULTS
To determine the number of voltage disturbances for the proposed automatic and minimum access
standards, fault records from the South Australian (SA) and Queensland (QLD) power systems were
analysed to determine the maximum historical number of faults within pre-defined time windows.
Figure 2 shows the maximum number of historical faults for a 10-year period between 2006 and 2016
(including the black system event) for the SA transmission and distribution network (66 kV only). Where
a fault occurred in the Victorian transmission network but was reflected into part of the SA transmission
and distribution network, this was not considered as an SA network fault in this figure. In practice, some
of these faults, especially those at or near the Heywood Interconnector, will also be seen as a fault by
some of the generating systems in SA. This results in a further increase in the total number of faults
seen by SA generating systems compared to considering faults originating from within the SA network
only.
Figure 2 South Australian power system faults per period
Figure 3 shows the maximum number of historical faults for a 10-year period between 2007 and 2017
(including when Cyclone Yasi hit Queensland) for the Queensland transmission and distribution
networks. This data includes all events that resulted in a Powerlink item of plant being unexpectedly
removed from service, and events where third party equipment (DNSP or Generator) had tripped but
also impacted Powerlink’s plant.

MULTIPLE VOLTAGE DISTURBANCE RIDE-THROUGH CAPABILITY
© AEMO 2018 9
Figure 3 Queensland power system faults per period
It should be noted the historical fault data in Queensland does not consider an auto-reclosing event as
a second disturbance, whereas SA’s historical fault data does.
The data shows that a large number of voltage disturbances in quick succession occurred in the past
and can occur in multiple regions. It is, therefore, expected that all types of generation technologies
should support power system security by being able to withstand a sufficient number of voltage
disturbances of various types and duration without disconnection, or ceasing to inject active and
reactive currents during and after each disturbance.
3. ASSESSMENT CRITERIA
The inability of generation to withstand multiple faults in quick succession could result from electrical,
mechanical, or thermal limitations (or failures) of primary plant components, or settings of control and
protection systems. This can, in turn, trigger a rapid cessation of energy generation.
The limitations are generally an accumulation of the effect of each individual disturbance on the
generating systems. The sudden loss of numerous generating facilities across the network leads to
potential risk of cascaded failure across parts of the power system.
Recognising this, and the need to strike a balance between power system security and maintaining
plant integrity due to multiple voltage disturbances in quick succession, the following assessment
criteria for determining whether a proposed generating system can meet the multiple-fault ride-through
access standards are proposed:
a) An accumulated disturbance duration (Δt).
b) A total number of disturbances within pre-defined sliding time windows (NF).
c) Sum of changes in voltage by the duration of the disturbance (ΔV x Δt).
AEMO will be satisfied that a generating system can meet the proposed access standards when at least
one of these criteria is met.
In proposing these criteria, AEMO has taken into consideration the physical and design limits of various
generation technologies, and the types of disturbances (by reference to severity and accumulated

MULTIPLE VOLTAGE DISTURBANCE RIDE-THROUGH CAPABILITY
© AEMO 2018 10
duration) a generating system must ride through to maintain power system security in a practical
Australian environment1.
More information about how each of the criteria is to be assessed is in the following sections.
3.1.1 Accumulated disturbance duration (Δt)
This is the cumulative amount of time where the connection point voltage is below 90% of the normal
voltage (Δ|VN| > 0.1 per unit [pu]), where Δ|VN| is defined as the voltage drop at the connection point
from 90% of the normal voltage.
3.1.2 Number of disturbances (NF)
This is the total number of power system disturbances calculated in a sliding time window of five or 30
minutes, for the automatic and minimum access standards, respectively. These disturbances would
result in a voltage drop at the generating system’s connection point. The only disturbances to be
considered are voltage disturbances resulting from natural power system disturbances, excluding any
voltage disturbances due to the incorrect design of a control system2.
3.1.3 Sum of changes in voltage by the duration of the disturbance (ΔV x Δt)
This is the time integral of voltage difference between 90% of the normal connection point voltage and
the connection point voltage during disturbances when the connection point voltage is lower than 90%.
The (ΔV x Δt) is measured in per-unit seconds (pu.s) where 90% normal voltage represents 0.9 per
unit. This is shown in Figure 4.
Figure 4 Calculation of ΔV x Δt
1 Note that to assess whether a generating system is subject to realistic operational conditions during and after multiple voltage disturbances, the system strength as measured by the short circuit ratio (SCR) is calculated before and after the application of all disturbances to ensure that the post-contingency SCR is above the minimum SCR withstand capability of the generating system and its constituent generating units. Any sequence of disturbances resulting in the post-contingency SCR to drop below the minimum SCR withstand capability of the generating system was not studied. 2 This phenomenon is discussed further in Appendix B.

MULTIPLE VOLTAGE DISTURBANCE RIDE-THROUGH CAPABILITY
© AEMO 2018 11
The blue curve is the connection point voltage profile, while the red dashed horizontal line indicates
90% normal voltage. The shaded area is defined as Sum of ΔV x Δt for this particular example, in pu.s.
For long, shallow faults, this criterion could be the first met.
4. APPLICATION OF PROPOSED REQUIREMENTS
DURING GPS NEGOTIATION STAGE
A series of power system simulation studies should be performed by the Applicant, forming the basis of
their proposed generator performance standards (GPS).
These simulation studies must include a range of power system operating scenarios, under which the
proposed generating system’s capability to ride through multiple disturbances is to be assessed,
including different power system load levels and different generation dispatch patterns. These scenarios
must at least include typical power system loading profile and dispatch patterns, which can be found in
system snapshot data obtained from AEMO3. The Applicant must also consult with the connecting NSP
regarding whether other specific network conditions must be included in these assessments.
For each simulation study, disturbances applied should be consistent with those described in the
“Types of disturbances to be considered” in Table 2. Region and site-specific fault clearance times,
including auto-reclose times, should be used in these simulations.
The Applicant may apply a random combination of fault locations, and fault types subject to meeting
the criteria set out in Table 2. AEMO and the connecting NSP may advise on the appropriateness of
any selected fault combinations, and require the Applicant to include specific fault combinations in
the assessment.
5. SIMULATION CASE STUDIES TO SUPPORT THE
PROPOSED REQUIREMENTS
AEMO conducted PSS®E simulation4 case studies to confirm that the proposed access standards can
be met by new and existing generating systems. The simulations were conducted using actual data and
simulation models sourced from proposed and existing generation.
It is understood that simulation models of synchronous and, in particular, asynchronous generating
systems might not account for all susceptibility mechanisms with respect to multiple voltage
disturbances in quick succession. The focus of simulation studies presented in this section is to
demonstrate that the power system to which these generating systems are connected will remain stable
and operable in response to a number of voltage disturbances in quick succession, and to confirm the
suitability and practicality of the levels of the three assessment criteria set out in Section 3.
Each assessment applied the maximum number of disturbances permitted by the proposed access
standards, which can be manually or randomly applied during the simulation. In the simulation, the deep
disturbances were manually selected and applied, while the remaining disturbances were randomly
selected using simulation scripts. Where the disturbances were randomly applied, they were selected
3 Provision of Network Data policies, and Data Provision Request Forms are available at: https://www.aemo.com.au/Electricity/National-Electricity-
Market-NEM/Data/Network-Data/Policy-on-provision-of-network-data. 4 The use of an EMT-type simulation tool such as PSCAD™/EMTDC™ will provide a more accurate representation of the response of generating
systems under unbalanced network fault conditions. This will be particularly valid under low system strength conditions. The overall integrated models of all regions in such simulation tools are not currently available, but are expected to be developed within 12 months following the publication of Power System Model Guidelines. To gain confidence in the accuracy of PSS®E simulation studies for assessing the response of various generating systems to multiple voltage disturbances, a benchmarking study was conducted for a wind farm under medium system strength conditions for a region where AEMO has already developed the full integrated EMT-type model in PSCAD. This analysis is presented in Appendix E.

MULTIPLE VOLTAGE DISTURBANCE RIDE-THROUGH CAPABILITY
© AEMO 2018 12
according to the “Type of disturbance to be considered” in Table 2. Disturbances were selected to avoid
islanding.
For wind and solar farm assessments, the post-contingency weighted SCR at the connection point
was calculated to ensure the SCR, accounting for the impact of nearby generating systems, is above
the minimum SCR withstand capability of the generating units assessed.
For all simulations, the disturbance clearance and auto-reclose times were consistent with the fault
clearance times and auto-reclosure requirements in different regions. It should be noted that all active
and reactive power values in the simulation plots are based on a 100 MVA base. For example, a 2.0 pu
active power is equal to 200 MW.
5.1.1 Simulation results summary
Table 4 presents the generating systems reported on, and which criteria (as proposed in Section 3) are
met following assessment of each generating system.
The results show that the generating systems investigated can meet the Total number of disturbances
(NF) criterion in simulation, with some cases simultaneously meeting the Accumulated disturbance
duration (Δt) criterion. One case shows the Sum of ΔV x Δt (ΔV x Δt) criterion is met. Hence, with at
least one of the criteria being met in every case, the generating systems can meet at least the
minimum proposed access standard, with the asynchronous generating systems meeting the
automatic access standard.
To ensure the power system to which the generating system under consideration is connected will
remain stable, and that there is a sufficient margin between system stability limits and the proposed
assessment criteria, several simulation case studies were conducted where at least one of the three
criteria was increased above the proposed level for the respective access standards.
For example, in Case 5-3 (presented in Table 5) the Accumulated disturbance duration (Δt) was
increased to 2309 ms as opposed to 1800 ms as defined in the proposed automatic access standard.
Table 4 Generating systems investigated in the assessment
Technology Project Status Connection System
StrengthA
Levels of Inter-
connectionB
Limiting
FactorC
Synchronous generating system
in highly interconnected
transmission network
Existing Transmission N/AD 6 NF, Δt of minimum access standard
Synchronous generating system
in transmission network with little
interconnection
Existing Transmission N/AD 1 NF of minimum access standard
Solar farm in distribution network
with little interconnection
Committed Distribution Medium 1 NF, Δt of automatic access standard
Solar farm in highly
interconnected transmission
network
Committed Transmission High 6 NF of minimum access standard
Wind farm in transmission
network with little interconnection
Committed Transmission Medium 2 NF, Δt of minimum access standard
Solar farm in distribution network
(with highly interconnected
transmission network upstream)
Committed Distribution Low 4 ΔV x Δt of automatic access standard

MULTIPLE VOLTAGE DISTURBANCE RIDE-THROUGH CAPABILITY
© AEMO 2018 13
A. System strength is calculated as the pre-contingency Weighted Short Circuit Ratio (WSCR) at the connection point of the generating system. When the generating system is a committed project, the WSCR calculation only considers the committed project and nearby existing generating systems. No other committed project is considered in these aggregate SCR calculations. A WSCR>5 is considered as high, 3<WSCR<5 as medium, and WSCR<3 as low system strength conditions. B. The level of interconnection is defined as the number of circuits connecting a transmission busbar (110 kV and above) into which the generating system connects, to the rest of the power system. Double circuits mounted on the same tower are considered as two circuits. C. These are the assessment criteria met by the generating system under consideration. D. This is because the instability mechanism associated with synchronous machines is generally manifested through rotor angle instability and loss of synchronism, as opposed to low SCR conditions. For this reason, the use of SCR is not the most appropriate metric for assessing instability of synchronous machines under varying levels of system strength conditions.
The Total number of disturbances (NF), the Accumulated disturbance duration (Δt), and the Sum of ΔV
x Δt (ΔV x Δt) are calculated for each simulation case and presented in Table 5.
Table 5 Simulation results for generation successfully riding through multiple disturbances
Generator Case ID
Sum of ΔV x Δt
Total disturbance duration
Total no. of disturbances
No. of deep disturbances
Pre-contingency aggregate SCR
Post-contingency aggregate SCR
Synchronous generator in highly interconnected transmission network
1a-1 0.306 0.971 6 3
N/AB
N/AB
1a-2 0.321 0.987 6 3
1a-3 0.371 1.162 6 3
Synchronous generator in transmission network with little interconnection
2-1 0.377 0.912 6 3
N/AB
N/AB
2-2 0.430 0.987 6 3
2-3 0.366 0.891 6 3
Solar farm in distribution network with little interconnection
3-1 0.525 2.071 15 6
3.52
3.32
3-2 0.512 1.923 15 6 3.21
3-3 0.574 2.016 15 6 3.19
Solar farm in highly interconnected transmission network
4-1 0.492 1.578 15 5
7.77
4.41
4-2 0.533 1.749 15 5 5.72
4-3 0.552 1.767 15 5 5.43
Wind farm in transmission network with little interconnection
5-1 0.573 1.764 15 6
3.73
1.45
5-2 0.572 1.815 15 6 1.73
5-3 0.573 2.309 15 6 1.76
Solar farm in distribution network connecting into highly interconnected transmission network
6-1 1.013 1.705 5 5 1.99A 1.80
A. Although the upstream transmission network is highly interconnected, the solar farm is radially fed from the distribution network to which the solar farm is connected, thus making the SCR very low. B. This is because the instability mechanism associated with synchronous machines is generally manifested through rotor angle instability and loss of synchronism, as opposed to low SCR conditions. For this reason, the use of SCR is not the most appropriate metric for assessing instability of synchronous machines under varying levels of system strength conditions.
The following sections discuss the detailed results for each simulation case.

MULTIPLE VOLTAGE DISTURBANCE RIDE-THROUGH CAPABILITY
© AEMO 2018 14
5.1.2 Synchronous generating system in highly interconnected transmission network
Cases 1a-1, 1a-2, and 1a-3 (Figure 5, Figure 6, and Figure 7 in Appendix A) investigated the multiple-
fault ride-through performance of a synchronous generating system connected to a highly
interconnected transmission network.
This generating system was assessed against the proposed minimum access standard, where it is
required to ride through six disturbances, three of which would be deep disturbances. The generating
system rode through six disturbances in all three cases. Since it met the proposed Total number of
disturbances criterion, it can meet the proposed minimum access standard.
No case exceeded the proposed Sum of ΔV x Δt criterion, therefore, the capability to meet this criterion
was not tested. Assessment against this criterion was unnecessary as the other criteria were satisfied.
The rotor angles presented in the simulation results in Appendix A are relative angles, calculated using
the actual rotor angle of a nearby large synchronous generating system as a reference. These relative
rotor angles are to show whether the generating system under investigation is in synchronism with the
rest of the power system.
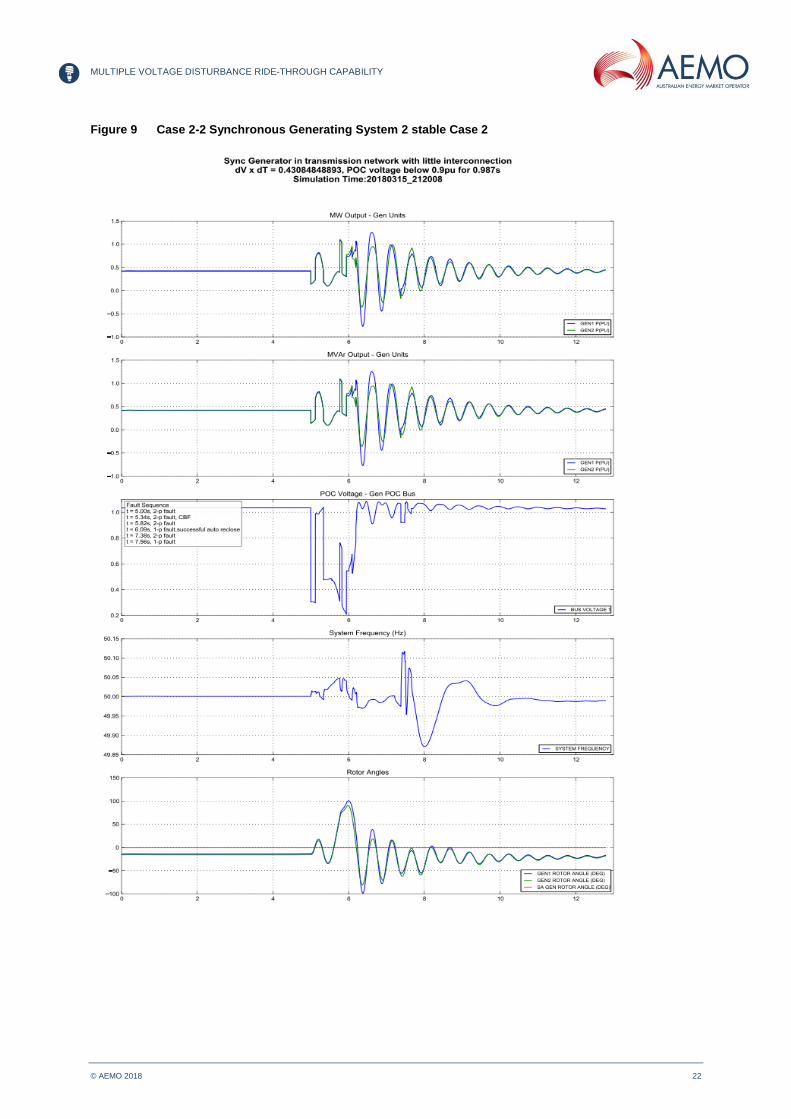
5.1.3 Synchronous generator in transmission network with little interconnection
Cases 2-1, 2-2, and 2-3 (Figure 8, Figure 9, and Figure 10 in Appendix A) investigated the multiple-fault
ride-through performance of a synchronous generating system connecting to a transmission network,
with little interconnection to the rest of the power system.
As with Case 1a, this generating system can meet the proposed minimum access standard, with the
proposed Total number of disturbances criterion met in all three cases.
5.1.4 Solar farm in distribution network with little interconnection
Cases 3-1, 3-2, and 3-3 (Figure 11, Figure 12, and Figure 13 in Appendix A) investigated the multiple-
fault ride-through performance of a solar farm connecting to a distribution network.
This solar farm was assessed against the proposed automatic access standard, where it is required to
ride through 15 disturbances, six of which would be deep disturbances. The solar farm rode through 15
disturbances in all three cases, and can meet the proposed automatic access standard. For each case,
the aggregate SCR was calculated after all disturbances, and was confirmed to be above the
generating system’s minimum SCR withstand capability.
5.1.5 Solar farm in highly interconnected transmission network
Cases 4-1, 4-2, and 4-3 (Figure 14, Figure 15, and Figure 16 in Appendix A) investigated the multiple-
fault ride-through performance of a solar farm connecting to a highly interconnected transmission
network.
In all cases, the solar farm rode through 15 disturbances, however only five deep disturbances can be
applied without islanding the solar farm or a large section of the transmission network. For each case,
the SCR was calculated after all disturbances, and was confirmed to be well above the solar farm’s
minimum SCR withstand capability.
No case exceeded the proposed Sum of ΔV x Δt, or the proposed Accumulated disturbance duration
criteria. Nevertheless, the solar farm can meet the proposed automatic access standard, as it met the
proposed Total number of disturbances criterion.
5.1.6 Wind farm in transmission network with little interconnection
Cases 5-1, 5-2, and 5-3 (Figure 17, Figure 18, and Figure 19 in Appendix A) investigated the multiple-
fault ride-through performance of a wind farm connecting to a transmission network with little
interconnection to the rest of the power system.

MULTIPLE VOLTAGE DISTURBANCE RIDE-THROUGH CAPABILITY
© AEMO 2018 15
This wind farm was assessed against the proposed automatic access standard, where it is required to
ride through 15 disturbances, six of which would be deep disturbances. The wind farm rode through 15
disturbances in all three cases, and can meet the proposed automatic access standard. For each case,
the aggregate SCR was calculated after all disturbances, and was confirmed to be above the
generating system’s minimum SCR withstand capability.
5.1.7 Solar farm in distribution network with highly interconnected transmission network upstream (meeting ΔV x Δt criteria)
Case 6-1 (Figure 20 in Appendix A) is presented to demonstrate that the proposed Sum of ΔV x Δt
criterion can be met by this type of generating system.
This case investigated a solar farm connecting into a distribution network connecting into a highly
interconnected transmission network. The results showed only five disturbances can be applied, all of
which are deep disturbances. The resulting Sum of ΔV x Δt is 1.013 pu.s (meeting the proposed
1.0 pu.s threshold), while the Accumulated disturbance duration is 1.705 s, not meeting the proposed
1.8 s threshold. Since this solar farm met the proposed Sum of ΔV x Δt criterion, it can meet the
proposed automatic access standard.
5.1.8 Failure to ride through multiple disturbances
The suite of PSS®E simulations also showed that, in some cases, the generating system failed to ride
through multiple disturbances. Example case results are provided in Figure 21, Figure 22, and Figure
23 of Appendix A. These results were examined to check whether any of the criteria were violated.
Table 6 summarises the results.
Table 6 Simulation results of generator failing to ride through multiple disturbances
Generator Case ID
Sum of ΔV x Δt
Total Disturbance Duration(s)
Total no. of disturbances
No. of deep disturbances
Comments
Synchronous generator in highly interconnected transmission network
1b-1 0.513 1.301 6 3 Criteria violated:
Sum of ΔV x Δt
Total disturbance duration
1b-2 0.588 1.405 6 3
1b-3 0.505 1.224 6 3
Where the generating system failed to ride through multiple disturbances, both the Sum of ΔV x Δt
(0.5 pu.s) and Accumulated disturbance duration (1 s) were violated, in which case the generating
system is not required to ride through such a disturbance sequence.
Under such a scenario, the synchronous generating system would be disconnected by its protection
system to prevent damage to it.
It should be noted that the case presented in Table 6 was assessed with a maximum 100 ms time
difference between two successive disturbances. This is shorter than the maximum 200 ms time
difference between two successive disturbances proposed in the minimum access standard.
A shorter time difference was used to fully simulate a synchronous generating systems’ susceptibility to
loss of synchronism conditions due to faults in quick succession. In these cases, even though the
synchronous generating system failed to ride through the disturbance sequence, it does not mean the
generating system cannot meet the proposed minimum access standard. This is because the same
generating system was able to successfully ride through the faults when subjected to sequence of
disturbances consistent with the assessment criteria for the proposed minimum access standard (these
scenarios are discussed in case studies 1a-1, 1a-2 and 1a-3).

MULTIPLE VOLTAGE DISTURBANCE RIDE-THROUGH CAPABILITY
© AEMO 2018 16
5.1.9 Impact on synchronous generating systems’ auxiliary supplies
The impact on synchronous generating system auxiliary supplies from riding through multiple
disturbances has been investigated to assess whether their withstand capability could be a limiting
factor to the generating units’ multiple disturbance ride-through capability.
As auxiliary supplies are not typically modelled in PSS®E, site-specific PSCAD™/EMTDC™ models
have been used to simulate the performance of auxiliary supplies under a multiple-disturbance
ride-through scenario.
The simulation results can be found in Appendix D.
The results indicated that no auxiliary load under investigation was tripped or stalled while the
generating unit rode through multiple disturbances. This is an expected result, because the motors’
under-voltage protection is typically in the order of 2-3 s, while the total disturbance duration in the
proposed multiple-disturbance ride-through requirement is less than that. Thus, the limitations of
auxiliary supplies for existing synchronous generating units will likely not be a key determining factor for
their capability to ride through multiple disturbances.
For future synchronous generating systems, it will be the responsibility of the plant owners and
equipment manufacturers to design the auxiliary supplies and the protection systems appropriately to
meet the multiple-disturbance ride-through requirement.
5.1.10 Performance comparison between PSCAD™/EMTDC™ and PSS®E models
To gain confidence in the accuracy of the PSS®E simulation results, AEMO compared the
multiple-disturbance ride-through performance of the PSCAD™/EMTDC™ model and the PSS®E
model of a wind farm connecting into the transmission network with medium system strength conditions
prior to the application of disturbances. A medium system strength condition was chosen to ensure
the PSS®E simulation tool remained reasonably accurate for assessing the performance of the
generating system.
In both the PSCAD™/EMTDC™ and PSS®E simulations, the same disturbance sequence, consisting
of 15 disturbances, was applied to the wind farm model. In both simulations, the pre- and
post-contingency SCR is above the wind turbines’ minimum SCR withstand capability. The active power
and the reactive power output of both wind farm models was compared, and is presented in Figure 36
and Figure 37 in Appendix E.
The results show similar performance in both the PSCAD™/EMTDC™ and PSS®E simulations for a
multiple-disturbance ride-through event, and that the wind farm can ride through 15 disturbances, thus
meeting the proposed automatic access standard.
6. CONCLUSION
The simulation results described in this report show that the proposed access standards for
multiple-fault ride-through can be met by the generating systems considered in the assessment, using
the proposed assessment methodology and criteria described in Section 3.
Where a generating system failed to ride through multiple disturbances, simulation results showed that
such a disturbance sequence would result in violation of both the proposed Sum of ΔV x Δt and the
Accumulated disturbance duration criteria. Generating systems, however, are not required to ride
through such multiple disturbance sequences.
In all simulation cases, the total number of disturbances required by the proposed access standards
has been met, which appears to be the most common restrictive criterion. The Accumulated
disturbance duration and Sum of ΔV x Δt criteria could be the most restrictive criteria, where long and
shallow disturbances would have a material impact on the connection point voltage.
MULTIPLE VOLTAGE DISTURBANCE RIDE-THROUGH CAPABILITY
© AEMO 2018 17
Based on these findings, it is concluded the proposed access standards are practical, and can be met
by various generation technologies.

MULTIPLE VOLTAGE DISTURBANCE RIDE-THROUGH CAPABILITY
© AEMO 2018 18
APPENDIX A. PSS®E SIMULATION RESULTS
Figure 5 Case 1a-1 Synchronous Generating System 1 Stable Case 1

MULTIPLE VOLTAGE DISTURBANCE RIDE-THROUGH CAPABILITY
© AEMO 2018 19
Figure 6 Case 1a-2 Synchronous Generating System 1 Stable Case 2

MULTIPLE VOLTAGE DISTURBANCE RIDE-THROUGH CAPABILITY
© AEMO 2018 20
Figure 7 Case 1a-3 Synchronous Generating System 1 Stable Case 3

MULTIPLE VOLTAGE DISTURBANCE RIDE-THROUGH CAPABILITY
© AEMO 2018 21
Figure 8 Case 2-1 Synchronous Generating System 2 stable Case 1
MULTIPLE VOLTAGE DISTURBANCE RIDE-THROUGH CAPABILITY
© AEMO 2018 22
Figure 9 Case 2-2 Synchronous Generating System 2 stable Case 2

MULTIPLE VOLTAGE DISTURBANCE RIDE-THROUGH CAPABILITY
© AEMO 2018 23
Figure 10 Case 2-3 Synchronous Generating System 2 stable Case 3

MULTIPLE VOLTAGE DISTURBANCE RIDE-THROUGH CAPABILITY
© AEMO 2018 24
Figure 11 Case 3-1 Asynchronous Generating System 1 stable Case 1

MULTIPLE VOLTAGE DISTURBANCE RIDE-THROUGH CAPABILITY
© AEMO 2018 25
Figure 12 Case 3-2 Asynchronous Generating System 1 stable Case 2

MULTIPLE VOLTAGE DISTURBANCE RIDE-THROUGH CAPABILITY
© AEMO 2018 26
Figure 13 Case 3-3 Asynchronous Generating System 1 stable Case 3

MULTIPLE VOLTAGE DISTURBANCE RIDE-THROUGH CAPABILITY
© AEMO 2018 27
Figure 14 Case 4-1 Asynchronous Generating System 2 stable Case 1

MULTIPLE VOLTAGE DISTURBANCE RIDE-THROUGH CAPABILITY
© AEMO 2018 28
Figure 15 Case 4-2 Asynchronous Generating System 2 stable Case 2

MULTIPLE VOLTAGE DISTURBANCE RIDE-THROUGH CAPABILITY
© AEMO 2018 29
Figure 16 Case 4-3 Asynchronous Generating System 2 Stable Case 3

MULTIPLE VOLTAGE DISTURBANCE RIDE-THROUGH CAPABILITY
© AEMO 2018 30
Figure 17 Case 5-1 Asynchronous Generating System 3 Stable Case 1

MULTIPLE VOLTAGE DISTURBANCE RIDE-THROUGH CAPABILITY
© AEMO 2018 31
Figure 18 Case 5-2 Asynchronous Generating System 3 Stable Case 2

MULTIPLE VOLTAGE DISTURBANCE RIDE-THROUGH CAPABILITY
© AEMO 2018 32
Figure 19 Case 5-3 Asynchronous Generating System 3 Stable Case 3

MULTIPLE VOLTAGE DISTURBANCE RIDE-THROUGH CAPABILITY
© AEMO 2018 33
Figure 20 Case 6-1 Asynchronous Generating System 4 Stable Case

MULTIPLE VOLTAGE DISTURBANCE RIDE-THROUGH CAPABILITY
© AEMO 2018 34
Figure 21 Case 1b-1 Synchronous Generating System 1 unstable Case 1

MULTIPLE VOLTAGE DISTURBANCE RIDE-THROUGH CAPABILITY
© AEMO 2018 35
Figure 22 Case 1b-2 Synchronous Generating System 1 unstable Case 2

MULTIPLE VOLTAGE DISTURBANCE RIDE-THROUGH CAPABILITY
© AEMO 2018 36
Figure 23 Case 1b-3 Synchronous Generating System 1 unstable Case 3

MULTIPLE VOLTAGE DISTURBANCE RIDE-THROUGH CAPABILITY
© AEMO 2018 37
APPENDIX B. CONTROL SYSTEM INTERACTION AND
LOW VOLTAGE RIDE-THROUGH RE-TRIGGERING
Generation control systems that are not well tuned can result in voltage oscillations. Such an interaction
may be triggered by a change in grid conditions, and voltage oscillations can occur if certain conditions
are met.
One such phenomenon is the Low Voltage Ride-Through (LVRT) mode re-triggering in asynchronous
generation, where a generating system is constantly switching operation modes between normal
operation mode and LVRT mode.
In a Single Machine Infinite Bus (SMIB) type simulation, LVRT mode re-triggering is usually observed
when the connection point voltage is reduced to a LVRT threshold level and is held constant at that
level. Simulation examples of such performance are provided below.
In NEM-wide simulations, LVRT re-triggering can also usually be observed under specific power system
and disturbance conditions.
While LVRT re-triggering is less likely to occur during system-wide simulations or real power system
operation, it highlights underlying problems within the generation control system tuning. These
problems are mostly due to improper selection of LVRT entry thresholds, lack of appropriate hysteresis,
and/or aggressive reactive current contributions during a disturbance. Simulation results indicated that
with proper tuning, this type of LVRT re-triggering can be eliminated.
When voltage oscillations are caused by the control system, such as LVRT re-triggering, they should
not be considered when assessing performance against the proposed access standard for multiple-
disturbance ride-through. The purpose of the proposed access standard is for generating systems to
ride through multiple disturbances and the subsequent connection point voltage profile, where the
voltage profile is imposed on the generating system due to actual power system disturbances (for
example, faults), rather than voltage profiles created by the control system, especially when it is not
properly tuned.
It is also noted in simulation that when LVRT re-triggering occurs, the generating system connection
point voltage is always below 0.9 pu, effectively behaving similarly to failed voltage recovery, rather
than acting like a multiple-disturbance occurrence. Such a phenomenon is not relevant to multiple
disturbance ride-through capability assessment, and should be addressed as part of the controller
tuning process. This is because such a response can be eliminated by judicious design of control
systems, and as such, controllable compared to natural power system disturbances.

MULTIPLE VOLTAGE DISTURBANCE RIDE-THROUGH CAPABILITY
© AEMO 2018 38
Figure 24 Connection point voltage drops to 85%, no LVRT re-triggering

MULTIPLE VOLTAGE DISTURBANCE RIDE-THROUGH CAPABILITY
© AEMO 2018 39
Figure 25 Connection point voltage drops to 80%, LVRT re-triggering

MULTIPLE VOLTAGE DISTURBANCE RIDE-THROUGH CAPABILITY
© AEMO 2018 40
Figure 26 Connection point voltage drops to 75%, LVRT re-triggering

MULTIPLE VOLTAGE DISTURBANCE RIDE-THROUGH CAPABILITY
© AEMO 2018 41
Figure 27 Connection point voltage drops to 70%, no LVRT re-triggering

MULTIPLE VOLTAGE DISTURBANCE RIDE-THROUGH CAPABILITY
© AEMO 2018 42
APPENDIX C. DETAILED DEFINITIONS
C.1 Sliding window reset time The concept of the sliding window, and the requirement to ride through multiple disturbances within a
sliding window, is illustrated in the following chart:
Figure 28 Concept of sliding window
In Figure 28, a sliding window is defined as the time between Point A and C, where Point A starts
immediately when the first disturbance occurs. The size of the sliding window might vary between
5 minutes and 30 minutes for different generating systems, and a value within this range must be
determined in the generating system’s performance standards.
In Figure 28, the generating system has met the multiple-disturbance ride-through requirement between
Point A and B. Hence, it is not required to ride through any disturbance between Point B and C, where
such a disturbance would cause the connection point voltage to exceed +/-10% of its nominal voltage.
The sliding window is reset immediately from Point C onwards. All multiple-disturbance ride-through
requirements are reset, and the generating system will need to ride through further disturbances in the
new sliding window until these requirements are met.

MULTIPLE VOLTAGE DISTURBANCE RIDE-THROUGH CAPABILITY
© AEMO 2018 43
C.2 Considered disturbances
Only disturbances in the “Types of disturbances to be considered” are to be included in the assessment
for multiple-disturbance ride-through requirement. Examples of disturbances sequence for the proposed
automatic and minimum access standards are illustrated in the following figures.
Figure 29 Example of disturbance sequence for the proposed automatic access standard
Figure 30 Example of disturbance sequence for the proposed minimum access standard

MULTIPLE VOLTAGE DISTURBANCE RIDE-THROUGH CAPABILITY
© AEMO 2018 44
C.3 Deep disturbance (fault) threshold
As defined in Table 3, the delineation between a shallow and deep fault is proposed to be 50% of the
connection point voltage, where any voltage below 50% is considered to be a deep fault.
However, the voltage that initiates fault ride-through can be measured in different ways (primarily per
phase RMS and positive sequence), and is often design-dependent. Figure 31 and Figure 32 show two
different voltage measurement methods for the same fault, resulting in different outcomes as to whether
the fault is considered deep (residual voltage<50%) or shallow (residual voltage>50%). Generally, fault
ride-through mechanisms will use the lowest of the three-phase voltages. When a design has been
demonstrated to use the positive-sequence voltage for initiating the ride-through sequence, however,
the positive sequence voltage will be used for assessing the number of deep voltage disturbances.
Figure 31 Fault voltage – Phase RMS voltage
Figure 32 Fault voltage – Positive sequence voltage

MULTIPLE VOLTAGE DISTURBANCE RIDE-THROUGH CAPABILITY
© AEMO 2018 45
APPENDIX D. PSCAD™/EMTDC™ SIMULATION
RESULTS FOR SYNCHRONOUS GENERATING UNITS
AUXILIARY SUPPLIES
Figure 33 Auxiliary supplies terminal voltages
Figure 34 Auxiliary supplies performance – motor speed

MULTIPLE VOLTAGE DISTURBANCE RIDE-THROUGH CAPABILITY
© AEMO 2018 46
Figure 35 Auxiliary supplies performance – motor torque

MULTIPLE VOLTAGE DISTURBANCE RIDE-THROUGH CAPABILITY
© AEMO 2018 47
APPENDIX E. COMPARISON OF PSCAD™/EMTDC™
AND PSS®E MODEL PERFORMANCE FOR MULTIPLE
DISTURBANCE RIDE THROUGH
Figure 36 Wind farm active power comparison between PSCAD™/EMTDC™ and PSS®E models
Figure 37 Wind farm reactive power comparison between PSCAD™/EMTDC™ and PSS®E models