Embed Size (px)
Citation preview
Multiple risk factor interventions for primary prevention of
coronary heart disease (Review)
Ebrahim S, Taylor F, Ward K, Beswick A, Burke M, Davey Smith G
This is a reprint of a Cochrane review, prepared and maintained by The Cochrane Collaboration and published in The Cochrane Library2011, Issue 1
http://www.thecochranelibrary.com
Multiple risk factor interventions for primary prevention of coronary heart disease (Review)
Copyright © 2011 The Cochrane Collaboration. Published by John Wiley & Sons, Ltd.
T A B L E O F C O N T E N T S
1HEADER . . . . . . . . . . . . . . . . . . . . . . . . . . . . . . . . . . . . . . .
1ABSTRACT . . . . . . . . . . . . . . . . . . . . . . . . . . . . . . . . . . . . . .
2PLAIN LANGUAGE SUMMARY . . . . . . . . . . . . . . . . . . . . . . . . . . . . . .
2BACKGROUND . . . . . . . . . . . . . . . . . . . . . . . . . . . . . . . . . . . .
3OBJECTIVES . . . . . . . . . . . . . . . . . . . . . . . . . . . . . . . . . . . . .
3METHODS . . . . . . . . . . . . . . . . . . . . . . . . . . . . . . . . . . . . . .
4RESULTS . . . . . . . . . . . . . . . . . . . . . . . . . . . . . . . . . . . . . . .
Figure 1. . . . . . . . . . . . . . . . . . . . . . . . . . . . . . . . . . . . . . 7
Figure 2. . . . . . . . . . . . . . . . . . . . . . . . . . . . . . . . . . . . . . 8
Figure 3. . . . . . . . . . . . . . . . . . . . . . . . . . . . . . . . . . . . . . 9
Figure 4. . . . . . . . . . . . . . . . . . . . . . . . . . . . . . . . . . . . . . 10
Figure 5. . . . . . . . . . . . . . . . . . . . . . . . . . . . . . . . . . . . . . 11
Figure 6. . . . . . . . . . . . . . . . . . . . . . . . . . . . . . . . . . . . . . 12
13DISCUSSION . . . . . . . . . . . . . . . . . . . . . . . . . . . . . . . . . . . . .
14AUTHORS’ CONCLUSIONS . . . . . . . . . . . . . . . . . . . . . . . . . . . . . . .
15ACKNOWLEDGEMENTS . . . . . . . . . . . . . . . . . . . . . . . . . . . . . . . .
15REFERENCES . . . . . . . . . . . . . . . . . . . . . . . . . . . . . . . . . . . . .
28CHARACTERISTICS OF STUDIES . . . . . . . . . . . . . . . . . . . . . . . . . . . . .
68DATA AND ANALYSES . . . . . . . . . . . . . . . . . . . . . . . . . . . . . . . . . .
Analysis 1.1. Comparison 1 Multiple risk factor intervention versus control, Outcome 1 Total mortality. . . . . . 73
Analysis 1.2. Comparison 1 Multiple risk factor intervention versus control, Outcome 2 Total mortality (individual analysis
or cluster). . . . . . . . . . . . . . . . . . . . . . . . . . . . . . . . . . . . 74
Analysis 1.3. Comparison 1 Multiple risk factor intervention versus control, Outcome 3 Total mortality (by allocation
concealment). . . . . . . . . . . . . . . . . . . . . . . . . . . . . . . . . . . 76
Analysis 1.4. Comparison 1 Multiple risk factor intervention versus control, Outcome 4 Total mortality (by co-
morbidity). . . . . . . . . . . . . . . . . . . . . . . . . . . . . . . . . . . . 77
Analysis 1.5. Comparison 1 Multiple risk factor intervention versus control, Outcome 5 Total mortality (by drug
treatment). . . . . . . . . . . . . . . . . . . . . . . . . . . . . . . . . . . . 78
Analysis 1.6. Comparison 1 Multiple risk factor intervention versus control, Outcome 6 Total mortality (by era). . . 80
Analysis 1.7. Comparison 1 Multiple risk factor intervention versus control, Outcome 7 Total mortality (by age of study). 81
Analysis 1.8. Comparison 1 Multiple risk factor intervention versus control, Outcome 8 Coronary heart disease mortality. 82
Analysis 1.9. Comparison 1 Multiple risk factor intervention versus control, Outcome 9 Coronary heart disease mortality
(individual analysis or cluster). . . . . . . . . . . . . . . . . . . . . . . . . . . . . 83
Analysis 1.10. Comparison 1 Multiple risk factor intervention versus control, Outcome 10 Coronary heart disease mortality
(by allocation concealment). . . . . . . . . . . . . . . . . . . . . . . . . . . . . . 84
Analysis 1.11. Comparison 1 Multiple risk factor intervention versus control, Outcome 11 Coronary heart disease mortality
(by co-morbidity). . . . . . . . . . . . . . . . . . . . . . . . . . . . . . . . . 85
Analysis 1.12. Comparison 1 Multiple risk factor intervention versus control, Outcome 12 Coronary heart disease (by drug
treatment). . . . . . . . . . . . . . . . . . . . . . . . . . . . . . . . . . . . 86
Analysis 1.13. Comparison 1 Multiple risk factor intervention versus control, Outcome 13 Coronary heart disease (by
era). . . . . . . . . . . . . . . . . . . . . . . . . . . . . . . . . . . . . . 87
Analysis 1.14. Comparison 1 Multiple risk factor intervention versus control, Outcome 14 Coronary heart disease mortality
(by study age). . . . . . . . . . . . . . . . . . . . . . . . . . . . . . . . . . 88
Analysis 1.15. Comparison 1 Multiple risk factor intervention versus control, Outcome 15 Stroke mortality. . . . 89
Analysis 1.16. Comparison 1 Multiple risk factor intervention versus control, Outcome 16 Stroke mortality (by allocation
concealment). . . . . . . . . . . . . . . . . . . . . . . . . . . . . . . . . . . 90
Analysis 1.17. Comparison 1 Multiple risk factor intervention versus control, Outcome 17 Stroke mortality (by co-
morbidity). . . . . . . . . . . . . . . . . . . . . . . . . . . . . . . . . . . . 91
Analysis 1.18. Comparison 1 Multiple risk factor intervention versus control, Outcome 18 Stroke mortality (by drug
treatment). . . . . . . . . . . . . . . . . . . . . . . . . . . . . . . . . . . . 92
Analysis 1.19. Comparison 1 Multiple risk factor intervention versus control, Outcome 19 Stroke mortality (by era). 93
iMultiple risk factor interventions for primary prevention of coronary heart disease (Review)
Copyright © 2011 The Cochrane Collaboration. Published by John Wiley & Sons, Ltd.
Analysis 1.20. Comparison 1 Multiple risk factor intervention versus control, Outcome 20 Stroke mortality (by study
age). . . . . . . . . . . . . . . . . . . . . . . . . . . . . . . . . . . . . . 94
Analysis 1.21. Comparison 1 Multiple risk factor intervention versus control, Outcome 21 Fatal and non-fatal clinical
events. . . . . . . . . . . . . . . . . . . . . . . . . . . . . . . . . . . . . 95
Analysis 1.22. Comparison 1 Multiple risk factor intervention versus control, Outcome 22 Fatal and non-fatal clinical
events (individual analysis or cluster). . . . . . . . . . . . . . . . . . . . . . . . . . . 96
Analysis 1.23. Comparison 1 Multiple risk factor intervention versus control, Outcome 23 Fatal and non-fatal clinical
events (by allocation concealment). . . . . . . . . . . . . . . . . . . . . . . . . . . 97
Analysis 1.24. Comparison 1 Multiple risk factor intervention versus control, Outcome 24 Fatal and non-fatal clinical
events (by co-morbidity). . . . . . . . . . . . . . . . . . . . . . . . . . . . . . . 98
Analysis 1.25. Comparison 1 Multiple risk factor intervention versus control, Outcome 25 Fatal and non-fatal clinical
events (by drug treatment). . . . . . . . . . . . . . . . . . . . . . . . . . . . . . 99
Analysis 1.26. Comparison 1 Multiple risk factor intervention versus control, Outcome 26 Fatal and non-fatal clinical
events (by era). . . . . . . . . . . . . . . . . . . . . . . . . . . . . . . . . . 100
Analysis 1.27. Comparison 1 Multiple risk factor intervention versus control, Outcome 27 Fatal and non-fatal clinical
events (by age of study). . . . . . . . . . . . . . . . . . . . . . . . . . . . . . . 101
Analysis 1.28. Comparison 1 Multiple risk factor intervention versus control, Outcome 28 Smoking prevalence. . . 102
Analysis 1.29. Comparison 1 Multiple risk factor intervention versus control, Outcome 29 Smoking prevalence (individual
analysis or cluster). . . . . . . . . . . . . . . . . . . . . . . . . . . . . . . . . 103
Analysis 1.30. Comparison 1 Multiple risk factor intervention versus control, Outcome 30 Smoking prevalence (by
allocation concealment). . . . . . . . . . . . . . . . . . . . . . . . . . . . . . . 104
Analysis 1.31. Comparison 1 Multiple risk factor intervention versus control, Outcome 31 Smoking prevalence (by co-
morbidity). . . . . . . . . . . . . . . . . . . . . . . . . . . . . . . . . . . . 106
Analysis 1.32. Comparison 1 Multiple risk factor intervention versus control, Outcome 32 Smoking prevalence (by drug
treatment). . . . . . . . . . . . . . . . . . . . . . . . . . . . . . . . . . . . 107
Analysis 1.33. Comparison 1 Multiple risk factor intervention versus control, Outcome 33 Smoking prevalence (by era). 109
Analysis 1.34. Comparison 1 Multiple risk factor intervention versus control, Outcome 34 Smoking prevalence (by age of
study). . . . . . . . . . . . . . . . . . . . . . . . . . . . . . . . . . . . . 110
Analysis 1.35. Comparison 1 Multiple risk factor intervention versus control, Outcome 35 Systolic blood pressure. . 112
Analysis 1.36. Comparison 1 Multiple risk factor intervention versus control, Outcome 36 Systolic blood pressure
(individual analysis or cluster). . . . . . . . . . . . . . . . . . . . . . . . . . . . . 114
Analysis 1.37. Comparison 1 Multiple risk factor intervention versus control, Outcome 37 Systolic blood pressure (by
allocation concealment). . . . . . . . . . . . . . . . . . . . . . . . . . . . . . . 116
Analysis 1.38. Comparison 1 Multiple risk factor intervention versus control, Outcome 38 Systolic blood pressure (by co-
morbidity). . . . . . . . . . . . . . . . . . . . . . . . . . . . . . . . . . . . 119
Analysis 1.39. Comparison 1 Multiple risk factor intervention versus control, Outcome 39 Systolic blood pressure (by drug
treatment). . . . . . . . . . . . . . . . . . . . . . . . . . . . . . . . . . . . 121
Analysis 1.40. Comparison 1 Multiple risk factor intervention versus control, Outcome 40 Systolic blood pressure (by
era). . . . . . . . . . . . . . . . . . . . . . . . . . . . . . . . . . . . . . 124
Analysis 1.41. Comparison 1 Multiple risk factor intervention versus control, Outcome 41 Systolic blood pressure (by age
of study). . . . . . . . . . . . . . . . . . . . . . . . . . . . . . . . . . . . 126
Analysis 1.42. Comparison 1 Multiple risk factor intervention versus control, Outcome 42 Diastolic blood pressure. 129
Analysis 1.43. Comparison 1 Multiple risk factor intervention versus control, Outcome 43 Diastolic blood pressure
(individual analysis or cluster). . . . . . . . . . . . . . . . . . . . . . . . . . . . . 131
Analysis 1.44. Comparison 1 Multiple risk factor intervention versus control, Outcome 44 Diastolic blood pressure (by
allocation concealment). . . . . . . . . . . . . . . . . . . . . . . . . . . . . . . 133
Analysis 1.45. Comparison 1 Multiple risk factor intervention versus control, Outcome 45 Diastolic blood pressure (by co-
morbidity). . . . . . . . . . . . . . . . . . . . . . . . . . . . . . . . . . . . 136
Analysis 1.46. Comparison 1 Multiple risk factor intervention versus control, Outcome 46 Diastolic blood pressure (by
drug treatment). . . . . . . . . . . . . . . . . . . . . . . . . . . . . . . . . . 138
Analysis 1.47. Comparison 1 Multiple risk factor intervention versus control, Outcome 47 Diastolic blood pressure (by
era). . . . . . . . . . . . . . . . . . . . . . . . . . . . . . . . . . . . . . 141
iiMultiple risk factor interventions for primary prevention of coronary heart disease (Review)
Copyright © 2011 The Cochrane Collaboration. Published by John Wiley & Sons, Ltd.
Analysis 1.48. Comparison 1 Multiple risk factor intervention versus control, Outcome 48 Diastolic blood pressure (by age
of study). . . . . . . . . . . . . . . . . . . . . . . . . . . . . . . . . . . . 143
Analysis 1.49. Comparison 1 Multiple risk factor intervention versus control, Outcome 49 Blood cholesterol. . . . 146
Analysis 1.50. Comparison 1 Multiple risk factor intervention versus control, Outcome 50 Blood cholesterol (individual
analysis or cluster). . . . . . . . . . . . . . . . . . . . . . . . . . . . . . . . . 148
Analysis 1.51. Comparison 1 Multiple risk factor intervention versus control, Outcome 51 Blood cholesterol (by allocation
concealment). . . . . . . . . . . . . . . . . . . . . . . . . . . . . . . . . . . 150
Analysis 1.52. Comparison 1 Multiple risk factor intervention versus control, Outcome 52 Blood cholesterol (by co-
morbidity). . . . . . . . . . . . . . . . . . . . . . . . . . . . . . . . . . . . 153
Analysis 1.53. Comparison 1 Multiple risk factor intervention versus control, Outcome 53 Blood cholesterol (by drug
treatment). . . . . . . . . . . . . . . . . . . . . . . . . . . . . . . . . . . . 155
Analysis 1.54. Comparison 1 Multiple risk factor intervention versus control, Outcome 54 Blood cholesterol (by era). 158
Analysis 1.55. Comparison 1 Multiple risk factor intervention versus control, Outcome 55 Blood cholesterol (by age of
study). . . . . . . . . . . . . . . . . . . . . . . . . . . . . . . . . . . . . 160
162APPENDICES . . . . . . . . . . . . . . . . . . . . . . . . . . . . . . . . . . . . .
169WHAT’S NEW . . . . . . . . . . . . . . . . . . . . . . . . . . . . . . . . . . . . .
169HISTORY . . . . . . . . . . . . . . . . . . . . . . . . . . . . . . . . . . . . . . .
170CONTRIBUTIONS OF AUTHORS . . . . . . . . . . . . . . . . . . . . . . . . . . . . .
170DECLARATIONS OF INTEREST . . . . . . . . . . . . . . . . . . . . . . . . . . . . . .
170SOURCES OF SUPPORT . . . . . . . . . . . . . . . . . . . . . . . . . . . . . . . . .
171INDEX TERMS . . . . . . . . . . . . . . . . . . . . . . . . . . . . . . . . . . . .
iiiMultiple risk factor interventions for primary prevention of coronary heart disease (Review)
Copyright © 2011 The Cochrane Collaboration. Published by John Wiley & Sons, Ltd.
[Intervention Review]
Multiple risk factor interventions for primary prevention ofcoronary heart disease
Shah Ebrahim1, Fiona Taylor1, Kirsten Ward1, Andrew Beswick2, Margaret Burke3, George Davey Smith3
1Department of Epidemiology and Population Health, London School of Hygiene and Tropical Medicine, London, UK. 2MRC Health
Services Research Collaboration, University of Bristol, Bristol, UK. 3Department of Social Medicine, University of Bristol, Bristol, UK
Contact address: Shah Ebrahim, Department of Epidemiology and Population Health, London School of Hygiene and Tropical
Medicine, Keppel Street, London, WC1E 7HT, UK. [email protected].
Editorial group: Cochrane Heart Group.
Publication status and date: New search for studies and content updated (conclusions changed), published in Issue 1, 2011.
Review content assessed as up-to-date: 21 December 2006.
Citation: Ebrahim S, Taylor F, Ward K, Beswick A, Burke M, Davey Smith G. Multiple risk factor interventions for pri-
mary prevention of coronary heart disease. Cochrane Database of Systematic Reviews 2011, Issue 1. Art. No.: CD001561. DOI:
10.1002/14651858.CD001561.pub3.
Copyright © 2011 The Cochrane Collaboration. Published by John Wiley & Sons, Ltd.
A B S T R A C T
Background
Multiple risk factor interventions using counselling and educational methods assumed to be efficacious and cost-effective in reducing
coronary heart disease (CHD) mortality and morbidity and that they should be expanded. Trials examining risk factor changes have
cast doubt on the effectiveness of these interventions.
Objectives
To assess the effects of multiple risk factor interventions for reducing total mortality, fatal and non-fatal events from CHD and
cardiovascular risk factors among adults assumed to be without prior clinical evidence CHD..
Search strategy
We updated the original search BY SEARCHING CENTRAL (2006, Issue 2), MEDLINE (2000 to June 2006) and EMBASE (1998
to June 2006), and checking bibliographies.
Selection criteria
Randomised controlled trials of more than six months duration using counselling or education to modify more than one cardiovascular
risk factor in adults from general populations, occupational groups or specific risk factors (i.e. diabetes, hypertension, hyperlipidaemia,
obesity).
Data collection and analysis
Two authors extracted data independently. We expressed categorical variables as odds ratios (OR) with 95% confidence intervals (CI).
Where studies published subsequent follow-up data on mortality and event rates, we updated these data.
Main results
We found 55 trials (163,471 participants) with a median duration of 12 month follow up. Fourteen trials (139,256 participants) with
reported clinical event endpoints, the pooled ORs for total and CHD mortality were 1.00 (95% CI 0.96 to 1.05) and 0.99 (95% CI
0.92 to 1.07), respectively. Total mortality and combined fatal and non-fatal cardiovascular events showed benefits from intervention
1Multiple risk factor interventions for primary prevention of coronary heart disease (Review)
Copyright © 2011 The Cochrane Collaboration. Published by John Wiley & Sons, Ltd.
when confined to trials involving people with hypertension (16 trials) and diabetes (5 trials): OR 0.78 (95% CI 0.68 to 0.89) and
OR 0.71 (95% CI 0.61 to 0.83), respectively. Net changes (weighted mean differences) in systolic and diastolic blood pressure (53
trials) and blood cholesterol (50 trials) were -2.71 mmHg (95% CI -3.49 to -1.93), -2.13 mmHg (95% CI -2.67 to -1.58 ) and -
0.24 mmol/l (95% CI -0.32 to -0.16), respectively. The OR for reduction in smoking prevalence (20 trials) was 0.87 (95% CI 0.75 to
1.00). Marked heterogeneity (I2 > 85%) for all risk factor analyses was not explained by co-morbidities, allocation concealment, use of
antihypertensive or cholesterol-lowering drugs, or by age of trial.
Authors’ conclusions
Interventions using counselling and education aimed at behaviour change do not reduce total or CHD mortality or clinical events in
general populations but may be effective in reducing mortality in high-risk hypertensive and diabetic populations. Risk factor declines
were modest but owing to marked unexplained heterogeneity between trials, the pooled estimates are of dubious validity. Evidence
suggests that health promotion interventions have limited use in general populations.
P L A I N L A N G U A G E S U M M A R Y
Multiple risk factor interventions for coronary heart disease
In many countries, there is enthusiasm for ’healthy heart programmes’ that use counselling and educational methods to encourage
people to reduce their risks for developing heart disease. These risk factors include high cholesterol, excessive salt intake, high blood
pressure, excess weight, a high-fat diet, smoking, diabetes and a sedentary lifestyle. This review is an update of all relevant randomised
trials that have evaluated an intervention that aimed to reduce more than one risk factor (multiple risk factor intervention) in people
without evidence of cardiovascular disease. The findings are from 55 trials of between six months and 12 years duration conducted
in several countries over the course of four decades. The median duration of follow up was 12 months (with a range of six months
to 12 years). Multiple risk factor intervention does result in small reductions in risk factors including blood pressure, cholesterol and
smoking. Contrary to expectations, multiple risk factor interventions had little or no impact on the risk of coronary heart disease
mortality or morbidity. This could be because these small risk factor changes were not maintained in the long term. Alternatively, the
small reductions in risk factors may be caused by biases in some of the studies. The methods of attempting behaviour change in the
general population are limited and do not appear to be effective. Different approaches to behaviour change are needed and should
be tested empirically before being widely promoted, particularly in developing countries where cardiovascular disease rates are rising.
Further trials may be warranted.
B A C K G R O U N D
As the incidence of cardiovascular disease is largely explained by
modifiable risk factors (serum cholesterol and reduced high-den-
sity lipoprotein (HDL) cholesterol, blood pressure and cigarette
smoking), reducing risk factors through health promotion focus-
ing on lifestyles is a logical way of preventing disease. Randomised
controlled trials of the effectiveness of multiple risk factor interven-
tion using counselling and education in addition to, or instead of,
pharmacological treatments to modify major cardiovascular risk
factors have been carried out in primary care and in the workplace.
The findings of these trials have been equivocal; effectiveness in
reducing cardiovascular disease incidence appears to be associated
with the degree of risk factor control achieved (Editorial 1982a;
Editorial 1982b; Appel 2004). Taken with evidence from quasi-
experimental studies, such as the North Karelia project (Puska
1976; Puska 1981) and the Stanford Heart Disease Prevention Pro-
gramme (Farquhar 1977; Farquhar 1990; Fortmann 1993), it is
widely believed that multiple risk factor intervention using coun-
selling and educational methods is both effective and cost-effec-
tive and should be expanded. Recently this idea has been extended
to people with diabetes (Davey Smith 2005; Sartorelli 2005) and
hypertension (Pickering 2003; Little 2004; Svetkey 2005).
In many countries multiple risk factor counselling and health edu-
cation is embodied in guidelines produced by professional groups
(NSF-CHD 2000; AHA 2002; NSF-CHD 2006; European Task
Force 2007) and government (Kickbush 1988; NSF-CHD 2000;
Muto 2001) recommending use of behavioural counselling for
stopping smoking tobacco, making healthy food choices and in-
creasing physical activity.
2Multiple risk factor interventions for primary prevention of coronary heart disease (Review)
Copyright © 2011 The Cochrane Collaboration. Published by John Wiley & Sons, Ltd.
Alongside the guidelines, health services have acted by developing
health promotion as a specialty (Editorial 1984) and in the UK
extra payments are now made for the routine collection of data on
cardiovascular risk factors in primary care, and issuing of primary
prevention policy (NSF-CHD 2000).
Non-systematic reviews have promoted the notion that mul-
tiple risk factor intervention is effective (McCormick 1988;
Schoenberger 1990). However, a systematic review of the ran-
domised trial evidence involving almost a million person-years of
observation, using Cochrane Collaboration methodology, demon-
strated no impact of multiple risk factor intervention on coronary
heart disease mortality (Ebrahim 1997). Since this systematic re-
view was published in 1997 more randomised trials and commu-
nity evaluations have been published, predominantly with disap-
pointing findings (Tudor-Smith 1998; Berglund 2000; Pickering
2004). A recent non-systematic review has again claimed benefits
for multiple risk factor intervention (Daviglus 2006). With the
rising burden of cardiovascular diseases in developing countries,
there has been a strong view that multiple risk factor intervention
should be the cornerstone of primary prevention (Ebrahim 2008;
Vartiainen 2009), although it is acknowledged that interpretation
of the findings from the randomised trials makes this problem-
atic in poor countries (Ebrahim 2001; Lim 2007). In view of the
continued policy importance of multiple risk factor intervention
a further update of the review was needed to incorporate several
new trials.
O B J E C T I V E S
To assess the effectiveness of multiple risk factor intervention us-
ing counselling or educational approaches (or both) aimed at be-
haviour change, with or without pharmacological interventions,
in adults assumed to be without prior clinical evidence of heart
attacks, stroke or peripheral vascular disease in reducing:
1. total (all-cause), CHD and stroke mortality;
2. non-fatal CHD and stroke events;
3. systolic and diastolic blood pressure;
4. blood cholesterol levels; and
5. smoking rates.
M E T H O D S
Criteria for considering studies for this review
Types of studies
Randomised controlled trials (RCTs) of at least six months dura-
tion of follow up with parallel-group design. Trials could be ran-
domised by individual or by group (e.g. family, workplace site).
Types of participants
We included trials which recruited an adult population whose
mean age was 35 or above.
General populations included workforce populations and high-
risk groups (hypertension, obesity, hyperlipidaemia, type 2 dia-
betes or a combination of these) as well as subjects that did not
have a high risk of developing CHD. We excluded trials where the
percentage of participants with evidence of CHD was more than
25%.
Types of interventions
A health promotion activity to achieve behaviour change; more
specifically counselling or educational interventions, with or with-
out pharmacological treatments, which aim to alter more than one
cardiovascular risk factor (i.e. diet, reduce blood pressure, smok-
ing, total blood cholesterol or increase physical activity).
Types of outcome measures
Primary outcomes
Total (all-cause) mortality, fatal CHD and fatal stroke events.
Secondary outcomes
Non-fatal CHD (including myocardial infarction, unstable
angina, need for coronary bypass grafting and or percutaneous
coronary intervention) and stroke events requiring hospital ad-
mission, net change in blood pressure, total blood cholesterol and
smoking.
Search methods for identification of studies
For the original review we searched MEDLINE from 1966 to April
1995 using a RCT filter (Dickersin 1994) (see Appendix 3). We
checked reference lists of identified papers, sought expert advice
and undertook citation searches.
We updated these searches by searching the Cochrane Central
Register of Controlled Trials (CENTRAL) in The Cochrane Li-brary (2006, Issue 2), MEDLINE (2000 to June 2006) and EM-
BASE (1998 to June 2006), using a RCT filter for MEDLINE
(Dickersin 1994) and EMBASE (Lefebvre 1996) (see Appendix
1 and Appendix 2). Reports of RCTs from MEDLINE and EM-
BASE are added to CENTRAL on a regular basis; to avoid dupli-
cation of effort we did not search earlier years of these databases.
3Multiple risk factor interventions for primary prevention of coronary heart disease (Review)
Copyright © 2011 The Cochrane Collaboration. Published by John Wiley & Sons, Ltd.
We checked references of identified studies and made searches for
additional follow-up papers if the studies published up until 2006
did not provide all of the data required for the review. We applied
no language restrictions.
Data collection and analysis
For the searches in 1997 and in 2006, two review authors checked
all titles and abstracts obtained through the searches independently
to eliminate studies that were definitely not relevant to the re-
view. In the 2001 update, one review author checked the results of
searches and eliminated all those definitely not relevant to the re-
view. Two review authors checked the remaining papers indepen-
dently. For all versions, two review authors obtained and read each
paper thought to be of possible relevance to determine whether it
fitted the specified inclusion criteria. We discussed disagreements
and resolved them with a third review author.
Two review authors performed independent data abstraction using
a data extraction form and resolved disagreements by discussion or
by consultation with a third review author. We contacted chief in-
vestigators to provide additional relevant information where nec-
essary.
We attempted to contact study authors. However, when informa-
tion was not available from trialists, we assumed missing data to
occur at random.
The main aspects of quality which were formally assessed included
the adequacy of concealment of randomisation, comparability of
baseline characteristics, blinding of outcome assessors and com-
pleteness of follow up. It was not possible to include blinding of
intervention allocation since this is not possible in lifestyle inter-
ventions.
For continuous variables (i.e. blood pressure, blood cholesterol)
we used mean differences with 95% confidence intervals (CI) to
ascertain net changes (i.e. control group minus intervention group
differences). We used the longest duration of follow up that was
reported in the primary publications. For studies where subse-
quent follow-up data were published, we did not update data on
continuous variables since it was considered likely that long-term
findings would reflect attrition bias, effects of co-treatments with
drugs and possibly publication bias (publication of positive find-
ings). Similarly, we used smoking levels from the primary publica-
tion of the trial and did not use any subsequent published follow-
up data in analyses.
We expressed categorical variables (e.g. mortality, clinical event
rates and smoking) as odds ratios (OR) with 95% CI. We used
fixed-effect models except in instances where there was significant
heterogeneity of effects, where we applied a random-effects model.
For studies where subsequent follow-up data on mortality and
event rates were published, we updated these data in the review.
We applied intention-to-treat analysis to these outcomes.
We quantified statistical heterogeneity using the I2statistic which
describes the percentage of total variation across studies that is due
to heterogeneity rather than sampling error (Higgins 2008). We
summarised the findings using a fixed-effect model unless there
was significant heterogeneity (I2 statistic > 75%) in which case we
applied a random-effects model. In case of significant heterogene-
ity we sought to identify and explain possible causes by exploring
the effect of participant, drug treatment, era of study and study
design characteristics.
We confined subgroup analysis to co-morbidity (diabetes, hyper-
tension, hyperlipidaemia and obesity and one other co-morbidity
(e.g. obesity and diabetes), no co-morbidity), and evidence of pre-
scribed drug treatment (prescribed medication during trial and no
prescribed medication or drug treatment not stated).
We used meta-regression methods to examine the effects of age
and blood pressure and cholesterol-lowering drug treatments on
outcomes. We also examined the effect of level of coronary heart
disease risk using the control group incidence rates to determine
whether trials recruiting higher-risk participants were more likely
to demonstrate beneficial effects.
We confined sensitivity analysis to method of randomisation (clus-
ter, cluster analysed as individual, individual), allocation of con-
cealment (adequate, unclear, inadequate) and age of trial (publi-
cation of trial before 2000 and after 2000). We used funnel plots
to ascertain publication bias for each outcome.
R E S U L T S
Description of studies
See: Characteristics of included studies; Characteristics of excluded
studies; Characteristics of ongoing studies.
Results of the search
The updated search (2001 to 2006) resulted in 3926 references,
after removal of duplicates. From these we excluded 3844 and
obtained 82 full-text papers for further inspection. Of these we
excluded 55 papers reporting on 50 studies. Thus in total, includ-
ing studies already listed as excluded in previous versions of the
review, we excluded 128 references, reporting on 117 studies (see
Characteristics of excluded studies). One additional paper was a
design paper for an ongoing study (Roderigues 2005)
Citation searching of included studies identified two further pa-
pers for these studies (Look AHEAD 2003; Toobert (MLP) 2005)
thus we added 29 papers reporting on 16 studies to those studies
already included in previous versions. In total we included 55 trials
(reported in 91 papers). Details of these studies are shown in the
table of Characteristics of included studies.
4Multiple risk factor interventions for primary prevention of coronary heart disease (Review)
Copyright © 2011 The Cochrane Collaboration. Published by John Wiley & Sons, Ltd.
Included studies
We found a total of 55 trials of multiple risk factor interven-
tion, comprising 61 distinct study groups; a dramatic increase on
the 14 trials identified for the original review. The total number
of patients recruited amounted to 163,471 with data on clinical
endpoint for 139,256 participants. The trials with clinical end-
points comprised approximately 909,500 patient-years of obser-
vation and those with risk factor endpoints 321,000 patient-years
of observation. The duration of follow up ranged from six months
to 12 years; the median follow-up time was one year. Sixteen stud-
ies (with 17 arms) recruited patients with hypertension and five
trials were of patients with diabetes.
Fourteen trials reported total or coronary heart disease mortality
as outcomes and two trials from the original review (the Swedish
RIS 1994 study and the WHLP 1998) reported extended mor-
tality follow up. Only four trials were sufficiently large to have
adequate power to show meaningful changes in total or coronary
heart disease mortality (HDFP trial 1970; MRFIT Study 1982;
Gothenberg Study 1986; WHO Factories 1986). In the Rachmani
2005 trial the number of fatal and non-fatal clinical events out-
numbered the number of participants recruited to the study. For
the purpose of this review, we used the number of participants
who experienced one or more events in this analysis. However,
most recent trials did not include clinical event endpoints but fo-
cused on the following outcomes: blood pressure, serum choles-
terol, physical activity, diet, control of diabetes and weight loss.
In general, the trials compared an intervention comprising some
form of counselling and education with control groups, which ei-
ther received usual care or nothing was described. The type and
intensity of behavioural intervention used was seldom reported in
the older trials. Very few studies reported the theoretical approach
used to underpin the intervention. When stated, the Stages of
Change model (Prochaska 1983; DiClemente 1991) was the most
common approach used. A person-centred and self-directed psy-
chological approach was used by one study (Meichenbaum 1993)
and another one relied on a combination of social cognitive theory,
goal systems theory and social ecological theory (Toobert (MLP)
2005). Most education and counselling intervention strategies tar-
geted a combination of risk factors including diet, exercise, weight
loss, salt intake, alcohol use, stress management, smoking cessa-
tion, adherence to medication or specific clinical regimens, par-
ticularly in patients with hypertension or diabetes.
Interventions included workshops, lectures, individual sessions,
personal counselling, provision of written material, assignments,
shopping tours and cooking sessions. Some studies required fam-
ily members, partners or both to participate in the intervention.
The intervention strategies were commonly provided by a variety
of health professionals including physicians, nurses, nutritionists,
dieticians, nurses, exercise trainers, cooks, psychotherapists and
physiotherapists. The intensity varied and ranged from four to
54 sessions over periods of time ranging from two weeks to three
years.
With the exception of two studies recruiting men and women over
the age of 60 years (Applegate 1992; Garcia-Pena 2001), the oldest
subjects included in the trials were 75 years of age. The majority
of trials randomised only middle-aged adults, although younger
adults were recruited by some studies. The mean age in all the
trials was 50 years.
Few studies looked at quality of life (Oslo Diet Exercise; Toobert
(MLP) 2005) and only one examined cost-effectiveness of the in-
tervention; in this case a nurse-led intervention for elderly hyper-
tensive patients (Garcia-Pena 2001).
Excluded studies
We excluded 116 trials identified as involving multiple risk fac-
tor interventions from consideration for the following reasons: no
relevant risk factor changes measured and/or reported (n = 159),
non-random allocation to intervention and control groups (n =
315), no specific multiple risk factor intervention (n = 6), control
group received substantial intervention (n = 210), follow up to
at least six months was not reported (n = 12), the mean age of
participants was less than 35 (n = 88), over 25% of participants
had CHD (n = 110), numbers in groups were not reported (n =
1), baseline or follow-up data were not provided (n = 6), or no
comparable control group was identified (n = 6). A large number
of older studies were set up in what was then the Soviet Union but
it appeared that allocation to intervention and control groups was
not random. Attempts to trace the investigators were unsuccessful.
Three studies appeared suitable in the latest update but missing
data precluded them from inclusion in the review update, as at-
tempts to request data from the original authors were unsuccessful
(Boylan 2003; Kisioglu 2004; Elliot 2007).
Risk of bias in included studies
The quality of the trials examined deserves comment. Very few
of the older published trials provided sufficient detail to replicate
the intervention used, and in several trials the intervention varied
between sites and over time. It is likely that the quality of the
intervention, in terms of intensity and frequency, person carrying
out activities, and the theoretical framework of behavioural change
used, will determine the impact of the intervention. One third
of studies (n = 18) used an intention-to-treat analysis on both
categorical and continuous variables. Some explained that the last
available reported measurement was used for the final endpoint
measurement. Of these 18 studies, the loss to follow up ranged
from 1% to 42% (median 13%). As such, losses to follow up were
a particular problem as changes in risk factors cannot be reliably
assessed in an intention-to-treat analysis.
Random allocation methods were not usually reported. In only
13 out of 55 trials we considered the methods used as adequate
and in nine they were inadequate. We made specific enquiries of
investigators for the original review predominantly to obtain event
5Multiple risk factor interventions for primary prevention of coronary heart disease (Review)
Copyright © 2011 The Cochrane Collaboration. Published by John Wiley & Sons, Ltd.
data but did not make these in this update as most of the new trials
had measured clinical events. In the large trials it is unlikely that
the allocation method was suspect but was simply inadequately
reported.
Blinding of intervention allocation for the participants is not pos-
sible in lifestyle interventions and this inevitably raises the pos-
sibility of bias. Only 12 out of 55 trials blinded the assessors to
treatment allocation. As such outcomes were usually assessed with
knowledge of treatment allocation and this too makes biased as-
sessment of some outcomes possible. It seems unlikely that lack of
blinding may have had any effect on clinical event outcomes, but
it is possible that participants randomised to a control or usual care
group might have been more likely to take health preventive activ-
ity as they may have felt they were missing potential benefits. Lack
of blinding in assessment and or relying on self-reported smoking
histories may have resulted in a reporting bias with those allocated
to interventions more likely to say they had stopped smoking, as
seen in previous studies (West 2007). Validation of self-reported
smoking outcomes using biochemical assay of serum thiocyanate
was reported in only three of the older trials and none of the new
trials.
Effects of interventions
Total (all-cause), coronary heart disease (CHD) and
stroke mortality
Total (all-cause) mortality
From the 14 studies that reported total mortality, there was no
strong evidence of any reduction in the pooled analysis (RR 1.00;
95% CI 0.96 to 1.05) using a fixed-effect model (Analysis 1.1).
Follow up of mortality ranged from six months to 12 years.
A significant reduction in all-cause mortality was seen in trials
where patients were recruited with either hypertension or diabetes
(RR 0.78; 95% 0.68 to 0.89) (Analysis 1.4) and in those trials
where patients were being prescribed either antihypertensive or
lipid-lowering drugs during the trial period (RR 0.86; 95% CI
0.78 to 0.96) (Analysis 1.5) using a fixed-effect model.
Coronary heart disease mortality
Eleven trials reported on coronary heart disease mortality; the
pooled OR was 0.99 (95% CI 0.92 to 1.07) using a fixed-effect
model (Analysis 1.8).
Stroke mortality
Six trials reported on stroke mortality (HDFP trial 1970; Finnish
men 1985; Gothenberg Study 1986; Oslo Diet Antismoking;
Swedish RIS 1994; Rachmani 2005). Only one of these trials
reported a significant reduction in stroke mortality but the pooled
relative risk favoured intervention (RR 0.75; 95% CI 0.60 to 0.95)
(Analysis 1.15) using a fixed-effect model. This may be explained
by better monitoring and adherence of drug treatment as five of
the six trials were given drug treatment during the study.
For total and coronary heart disease mortality, funnel plots sug-
gested no evidence of small study bias in trials (Figure 1; Figure
2). Evidence of significant statistical heterogeneity was not appar-
ent in the pooled RR for total mortality, coronary heart disease
mortality or stroke mortality.
6Multiple risk factor interventions for primary prevention of coronary heart disease (Review)
Copyright © 2011 The Cochrane Collaboration. Published by John Wiley & Sons, Ltd.
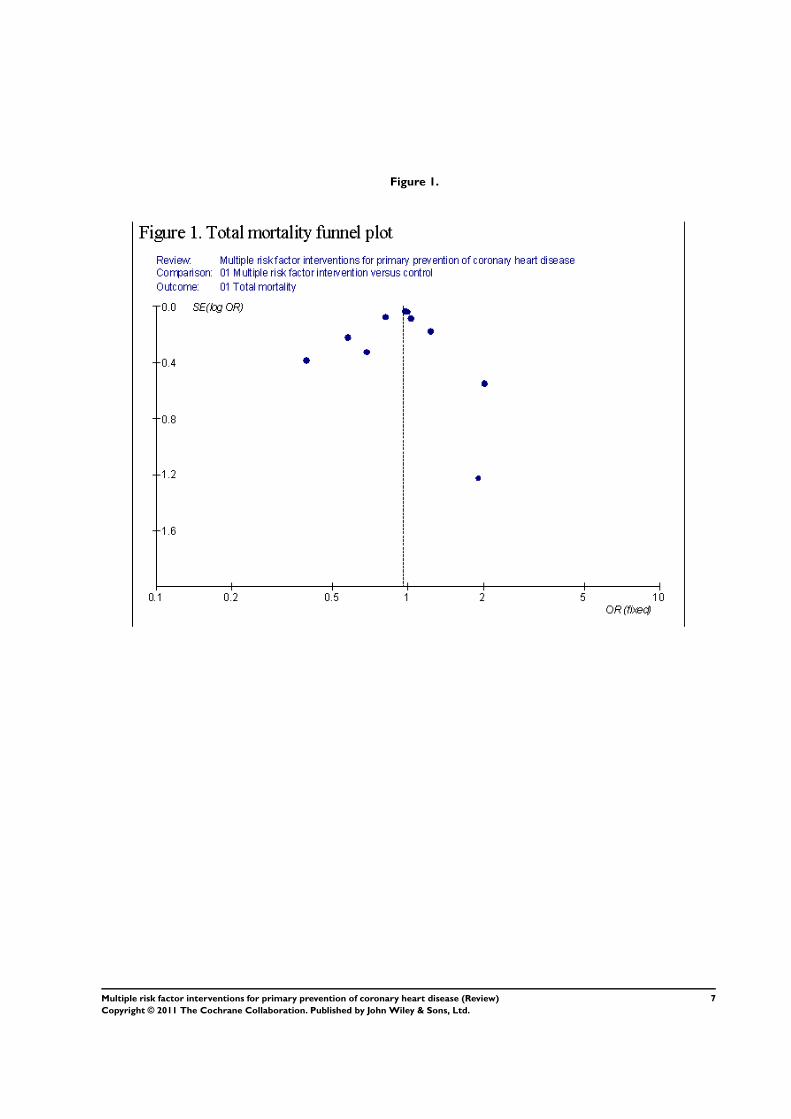
Figure 1.
7Multiple risk factor interventions for primary prevention of coronary heart disease (Review)
Copyright © 2011 The Cochrane Collaboration. Published by John Wiley & Sons, Ltd.
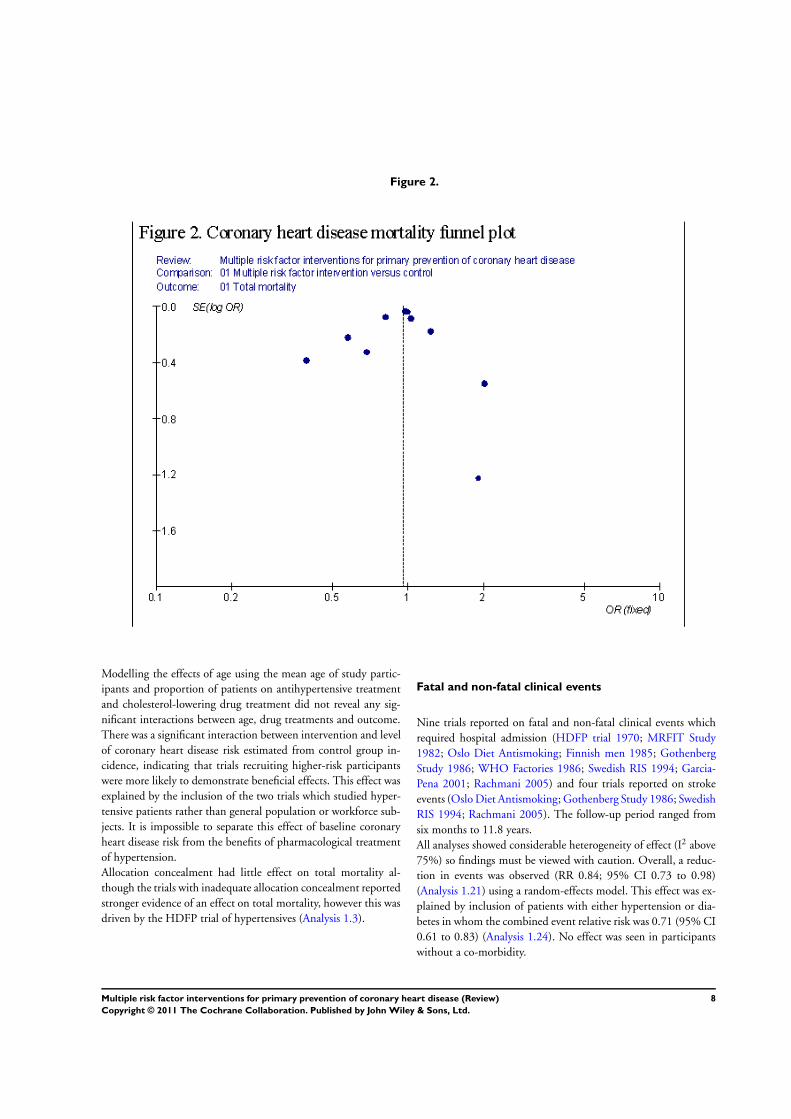
Figure 2.
Modelling the effects of age using the mean age of study partic-
ipants and proportion of patients on antihypertensive treatment
and cholesterol-lowering drug treatment did not reveal any sig-
nificant interactions between age, drug treatments and outcome.
There was a significant interaction between intervention and level
of coronary heart disease risk estimated from control group in-
cidence, indicating that trials recruiting higher-risk participants
were more likely to demonstrate beneficial effects. This effect was
explained by the inclusion of the two trials which studied hyper-
tensive patients rather than general population or workforce sub-
jects. It is impossible to separate this effect of baseline coronary
heart disease risk from the benefits of pharmacological treatment
of hypertension.
Allocation concealment had little effect on total mortality al-
though the trials with inadequate allocation concealment reported
stronger evidence of an effect on total mortality, however this was
driven by the HDFP trial of hypertensives (Analysis 1.3).
Fatal and non-fatal clinical events
Nine trials reported on fatal and non-fatal clinical events which
required hospital admission (HDFP trial 1970; MRFIT Study
1982; Oslo Diet Antismoking; Finnish men 1985; Gothenberg
Study 1986; WHO Factories 1986; Swedish RIS 1994; Garcia-
Pena 2001; Rachmani 2005) and four trials reported on stroke
events (Oslo Diet Antismoking; Gothenberg Study 1986; Swedish
RIS 1994; Rachmani 2005). The follow-up period ranged from
six months to 11.8 years.
All analyses showed considerable heterogeneity of effect (I2 above
75%) so findings must be viewed with caution. Overall, a reduc-
tion in events was observed (RR 0.84; 95% CI 0.73 to 0.98)
(Analysis 1.21) using a random-effects model. This effect was ex-
plained by inclusion of patients with either hypertension or dia-
betes in whom the combined event relative risk was 0.71 (95% CI
0.61 to 0.83) (Analysis 1.24). No effect was seen in participants
without a co-morbidity.
8Multiple risk factor interventions for primary prevention of coronary heart disease (Review)
Copyright © 2011 The Cochrane Collaboration. Published by John Wiley & Sons, Ltd.
Changes in risk factors
For all analyses of risk factor changes very high levels of hetero-
geneity of effect were found (I2 between 85% and 97%). Although
we applied random-effects, we cannot draw conclusions regard-
ing the consistency of effects on risk factors. We explored this
heterogeneity and it could not be attributed fully to the effects
of pharmacological treatment or study design effects. There was
some evidence of possible regression to the mean effects as risk
factor net changes were strongly correlated with the initial level of
blood pressure, smoking and blood cholesterol. The sample size
weighted correlation coefficients between initial level and magni-
tude of risk factor reduction for diastolic blood pressure, smoking
and blood cholesterol were 0.73 (P = 0.006), 0.63 (P = 0.01) and
0.74 (P = 0.004), respectively. In other words, those studies with
the highest baseline diastolic blood pressure, smoking prevalence
and blood cholesterol levels demonstrated larger falls in these risk
factors at follow up.
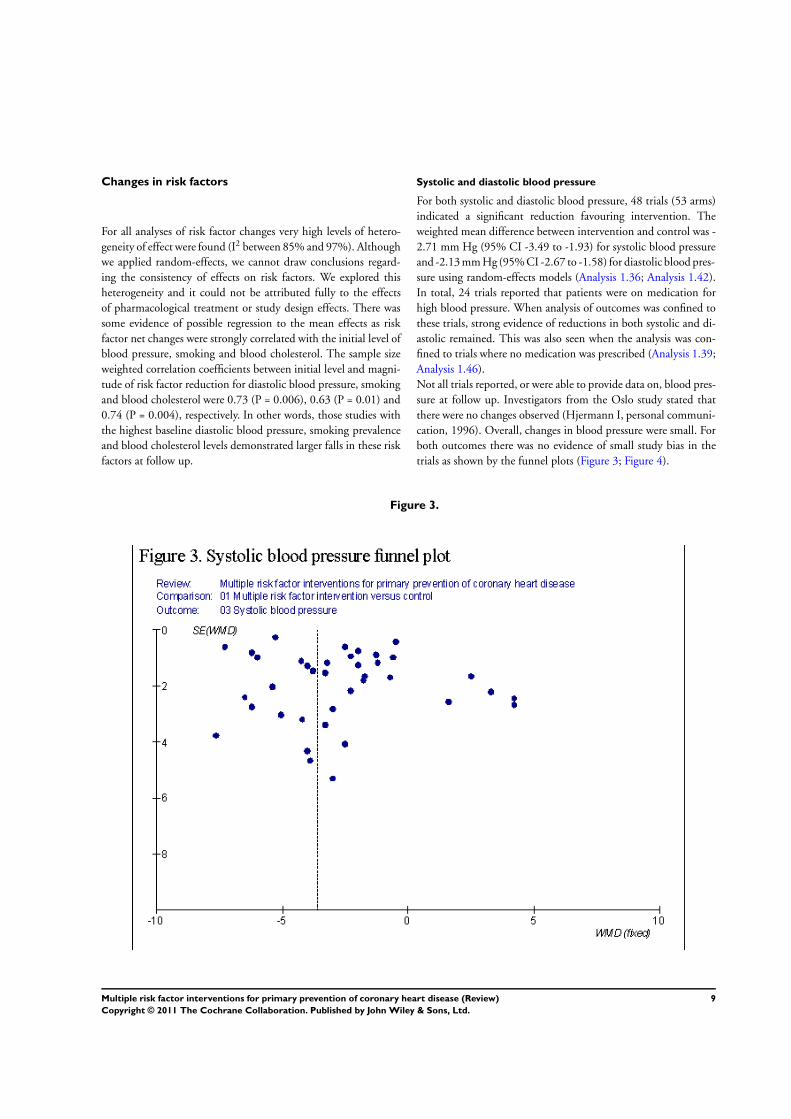
Systolic and diastolic blood pressure
For both systolic and diastolic blood pressure, 48 trials (53 arms)
indicated a significant reduction favouring intervention. The
weighted mean difference between intervention and control was -
2.71 mm Hg (95% CI -3.49 to -1.93) for systolic blood pressure
and -2.13 mm Hg (95% CI -2.67 to -1.58) for diastolic blood pres-
sure using random-effects models (Analysis 1.36; Analysis 1.42).
In total, 24 trials reported that patients were on medication for
high blood pressure. When analysis of outcomes was confined to
these trials, strong evidence of reductions in both systolic and di-
astolic remained. This was also seen when the analysis was con-
fined to trials where no medication was prescribed (Analysis 1.39;
Analysis 1.46).
Not all trials reported, or were able to provide data on, blood pres-
sure at follow up. Investigators from the Oslo study stated that
there were no changes observed (Hjermann I, personal communi-
cation, 1996). Overall, changes in blood pressure were small. For
both outcomes there was no evidence of small study bias in the
trials as shown by the funnel plots (Figure 3; Figure 4).
Figure 3.
9Multiple risk factor interventions for primary prevention of coronary heart disease (Review)
Copyright © 2011 The Cochrane Collaboration. Published by John Wiley & Sons, Ltd.
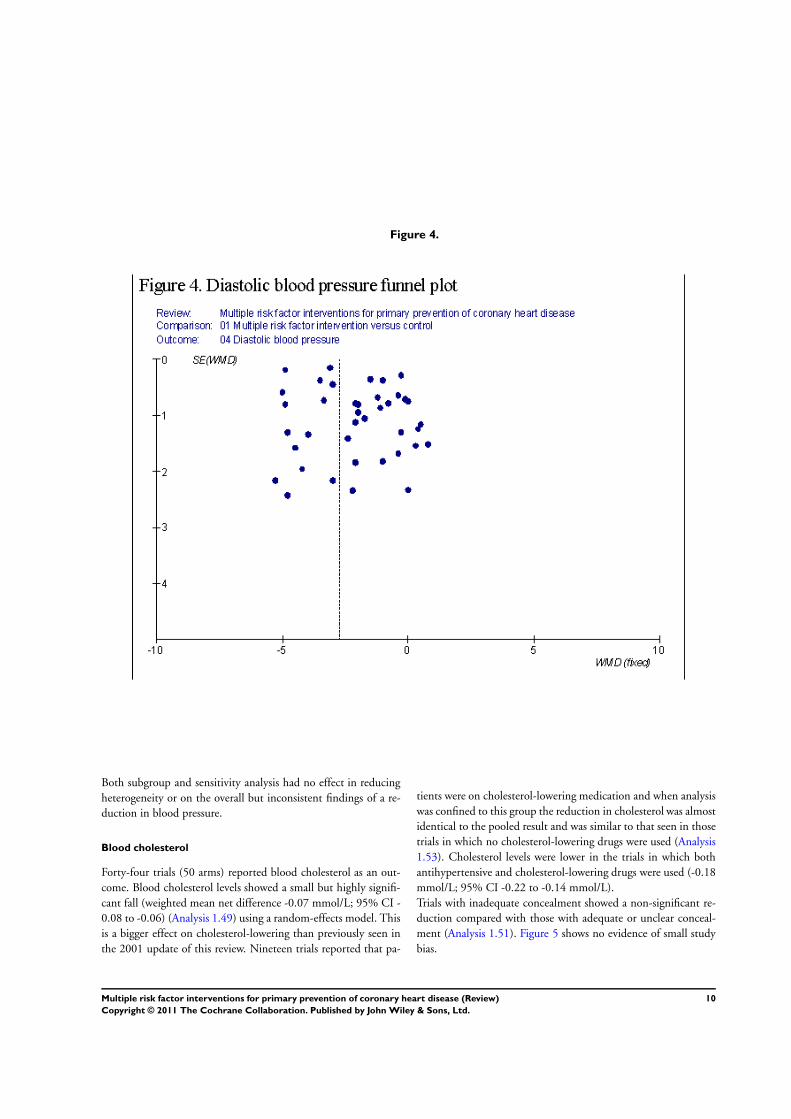
Figure 4.
Both subgroup and sensitivity analysis had no effect in reducing
heterogeneity or on the overall but inconsistent findings of a re-
duction in blood pressure.
Blood cholesterol
Forty-four trials (50 arms) reported blood cholesterol as an out-
come. Blood cholesterol levels showed a small but highly signifi-
cant fall (weighted mean net difference -0.07 mmol/L; 95% CI -
0.08 to -0.06) (Analysis 1.49) using a random-effects model. This
is a bigger effect on cholesterol-lowering than previously seen in
the 2001 update of this review. Nineteen trials reported that pa-
tients were on cholesterol-lowering medication and when analysis
was confined to this group the reduction in cholesterol was almost
identical to the pooled result and was similar to that seen in those
trials in which no cholesterol-lowering drugs were used (Analysis
1.53). Cholesterol levels were lower in the trials in which both
antihypertensive and cholesterol-lowering drugs were used (-0.18
mmol/L; 95% CI -0.22 to -0.14 mmol/L).
Trials with inadequate concealment showed a non-significant re-
duction compared with those with adequate or unclear conceal-
ment (Analysis 1.51). Figure 5 shows no evidence of small study
bias.
10Multiple risk factor interventions for primary prevention of coronary heart disease (Review)
Copyright © 2011 The Cochrane Collaboration. Published by John Wiley & Sons, Ltd.
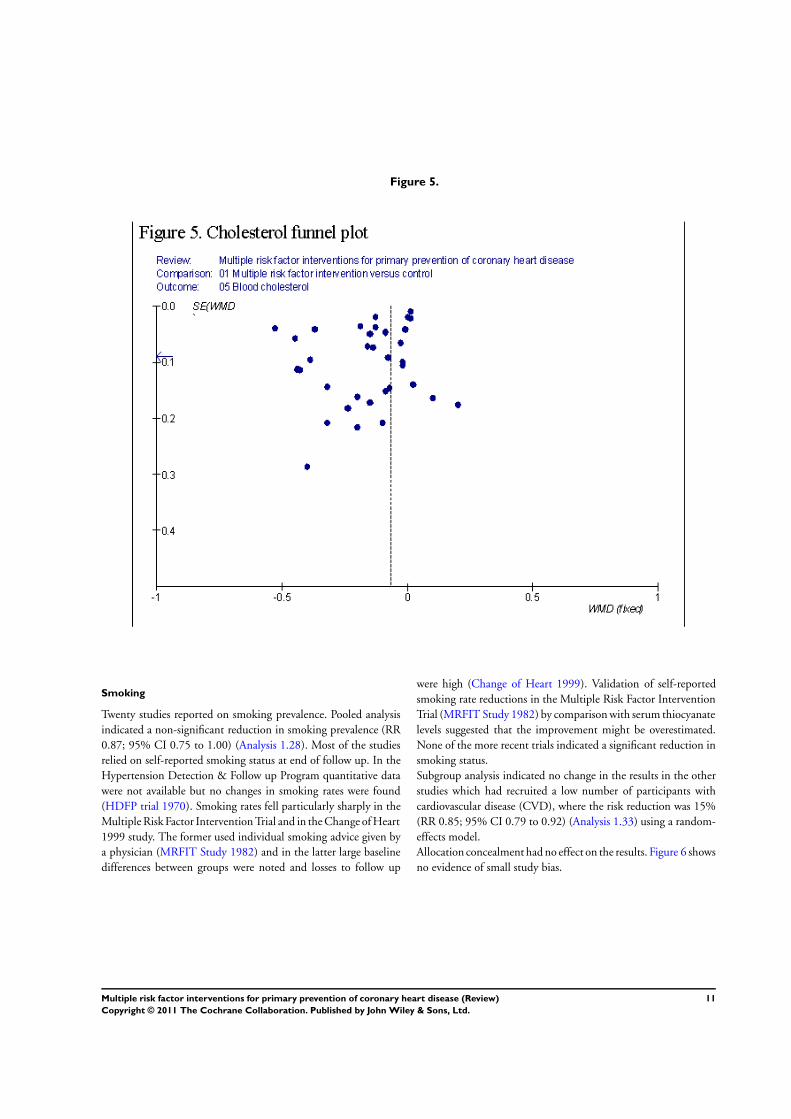
Figure 5.
Smoking
Twenty studies reported on smoking prevalence. Pooled analysis
indicated a non-significant reduction in smoking prevalence (RR
0.87; 95% CI 0.75 to 1.00) (Analysis 1.28). Most of the studies
relied on self-reported smoking status at end of follow up. In the
Hypertension Detection & Follow up Program quantitative data
were not available but no changes in smoking rates were found
(HDFP trial 1970). Smoking rates fell particularly sharply in the
Multiple Risk Factor Intervention Trial and in the Change of Heart
1999 study. The former used individual smoking advice given by
a physician (MRFIT Study 1982) and in the latter large baseline
differences between groups were noted and losses to follow up
were high (Change of Heart 1999). Validation of self-reported
smoking rate reductions in the Multiple Risk Factor Intervention
Trial (MRFIT Study 1982) by comparison with serum thiocyanate
levels suggested that the improvement might be overestimated.
None of the more recent trials indicated a significant reduction in
smoking status.
Subgroup analysis indicated no change in the results in the other
studies which had recruited a low number of participants with
cardiovascular disease (CVD), where the risk reduction was 15%
(RR 0.85; 95% CI 0.79 to 0.92) (Analysis 1.33) using a random-
effects model.
Allocation concealment had no effect on the results. Figure 6 shows
no evidence of small study bias.
11Multiple risk factor interventions for primary prevention of coronary heart disease (Review)
Copyright © 2011 The Cochrane Collaboration. Published by John Wiley & Sons, Ltd.
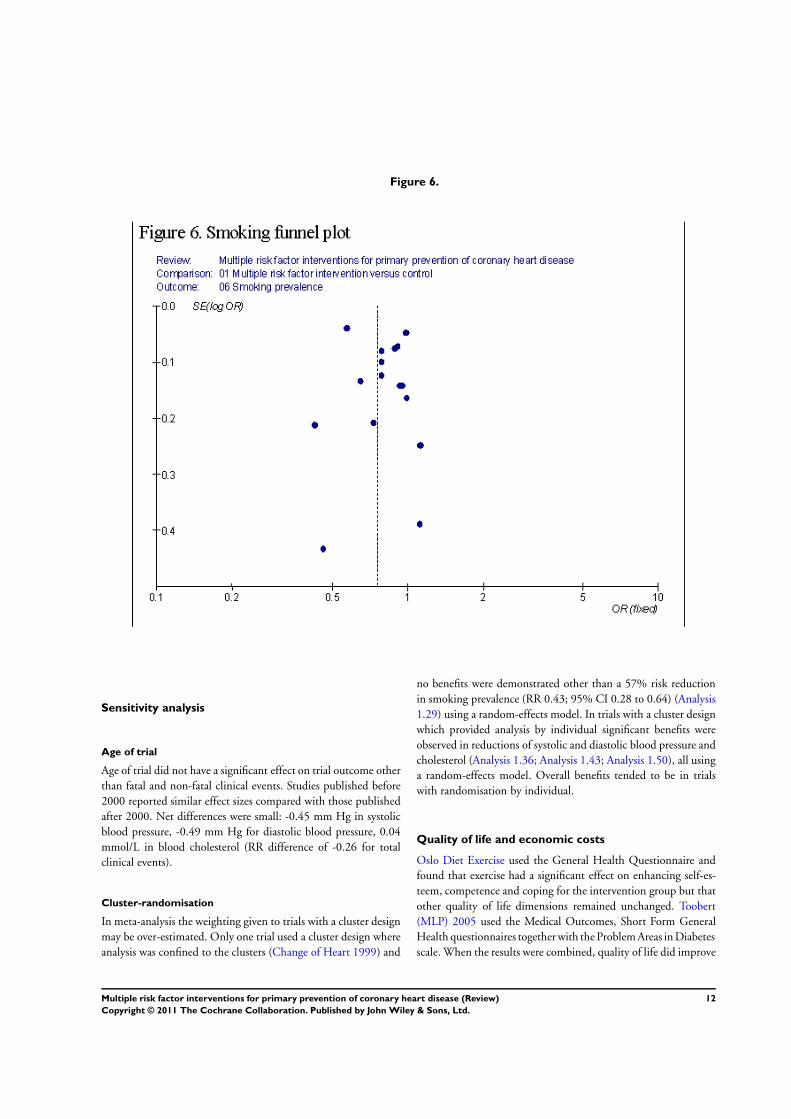
Figure 6.
Sensitivity analysis
Age of trial
Age of trial did not have a significant effect on trial outcome other
than fatal and non-fatal clinical events. Studies published before
2000 reported similar effect sizes compared with those published
after 2000. Net differences were small: -0.45 mm Hg in systolic
blood pressure, -0.49 mm Hg for diastolic blood pressure, 0.04
mmol/L in blood cholesterol (RR difference of -0.26 for total
clinical events).
Cluster-randomisation
In meta-analysis the weighting given to trials with a cluster design
may be over-estimated. Only one trial used a cluster design where
analysis was confined to the clusters (Change of Heart 1999) and
no benefits were demonstrated other than a 57% risk reduction
in smoking prevalence (RR 0.43; 95% CI 0.28 to 0.64) (Analysis
1.29) using a random-effects model. In trials with a cluster design
which provided analysis by individual significant benefits were
observed in reductions of systolic and diastolic blood pressure and
cholesterol (Analysis 1.36; Analysis 1.43; Analysis 1.50), all using
a random-effects model. Overall benefits tended to be in trials
with randomisation by individual.
Quality of life and economic costs
Oslo Diet Exercise used the General Health Questionnaire and
found that exercise had a significant effect on enhancing self-es-
teem, competence and coping for the intervention group but that
other quality of life dimensions remained unchanged. Toobert
(MLP) 2005 used the Medical Outcomes, Short Form General
Health questionnaires together with the Problem Areas in Diabetes
scale. When the results were combined, quality of life did improve
12Multiple risk factor interventions for primary prevention of coronary heart disease (Review)
Copyright © 2011 The Cochrane Collaboration. Published by John Wiley & Sons, Ltd.
for the intervention group particularly in enhancing competence
in self-care. Garcia-Pena 2001 evaluated a programme whereby a
nurse made weekly or fortnightly home visits to elderly patients
with hypertension. In applying a cost-effectiveness analysis, the
authors concluded that the reduction in blood pressure obtained
may justify the small incremental cost of the intervention.
D I S C U S S I O N
As reported in the earlier review, multiple risk factor interventions
comprising counselling, education aimed at behaviour change and
drug therapies for the primary prevention of coronary heart disease
were ineffective in achieving reductions in total or cardiovascular
disease mortality when used in general or workforce populations
of middle-aged adults. The pooled effects of intervention were
statistically insignificant but a potentially useful benefit of treat-
ment (about a 8% reduction in coronary heart disease mortality)
may have been missed despite the very large sample sizes in several
of the trials. It is surprising that despite the continued popular-
ity of these interventions no further large-scale randomised stud-
ies, powered to detect clinical event endpoints, have been carried
out. Any coronary heart disease (CHD) mortality benefits of these
multiple risk factor interventions was confined to those trials re-
cruiting people with hypertension and diabetes. Similarly, benefits
in stroke mortality were confined to those trials recruiting patients
with hypertension and taking drug treatments. Such participants
may well be more highly motivated to act on counselling and edu-
cation interventions and may also benefit because they were more
likely to adhere to their drug medications.
Our rationale for focusing on mortality outcomes rather than non-
fatal event outcomes is that counting deaths and comparing them
by random allocation group is unlikely to be biased, but once
attribution of causes of death is involved there is some potential for
bias to occur as events were not necessarily assigned causes blind
to random allocation group, particularly in the older, large trials.
Similar potential biases arise in counting and assigning causes to
non-fatal events.
The risk factor changes associated with interventions were modest
but are probably optimistic estimates as changes could only be
measured in those remaining in the trials. All risk factor change
analyses were heterogeneous, making pooled estimates of effect
questionable. Habituation to blood pressure measurement and
self-reports of smoking will also tend to exaggerate the changes
observed. It is, however, not possible to separate participants’ level
of risk from the use of antihypertensives in the present set of trials,
as studies with high-risk participants tended to be the ones which
included participants with high levels of antihypertensive drug use.
Furthermore, there are many problems in relating trial outcome to
a risk measure which is itself dependent on the outcome in meta-
analysis (Egger 1995). We are cautious in our interpretations of
these risk factor changes because, if these effects were real, they
would have been reflected in reductions in CHD mortality given
the size of some of the trials. Furthermore, as the average duration
of follow up was 12 months, the risk factor changes that were
observed are unlikely to be mirrors of the broad secular trends
occurring over much longer time periods. Our conclusions are
that observed risk factor changes are likely to be over-estimates
and are probably, in the main, due to bias in design and effects of
pharmacological treatments.
Although we did observe weak evidence of benefits on combined
fatal and non-fatal cardiovascular disease (CVD) events, this was
explained by trials which included hypertensives and diabetics,
supporting the conclusions based on the mortality findings. Het-
erogeneity of intervention effects on non-fatal clinical endpoints
is probably caused by two factors: the participants included in the
trials and the use of pharmacological treatments. Hypertensives,
at highest risk, were more likely to benefit from counselling and
education, and effective drugs. We stand by our interpretation
that these interventions are not beneficial in general populations.
These findings suggest that targeting of current health promotion
activities to high-risk individuals might be of more value than
more general health promotion for everyone.
Our findings are relevant to middle-aged adults who are seen in
general practice or occupational health practices. Although our
inclusion criteria were focused on trials of primary prevention
we found that some studies had recruited participants with some
evidence of prior heart attack, stroke or peripheral vascular disease.
These trials contribute important data to our analyses so we did
not wish to exclude them but decided to reject trials that comprised
more than 25% of participants with prior CVD events. These
trials did not report findings by prior CVD and even if they had
the comparisons would not be by randomisation as none of the
trials deliberately set out to randomise patients with prior diseases.
However, their inclusion in this review would tend to bias our
findings towards finding positive effects of intervention given that
these health promotion interventions appear to be more effective
in people with established cardiovascular disease (Oldridge 1988;
O’Connor 1989; Mullen 1992).
Although missing data could affect the conclusions of this review,
we consider that the proportion of loss at follow up was not that
substantial, and its impact on fatal events (primary outcomes) is
perhaps lower than that observed for non-fatal events.
The interventions used
The benefits of drug treatments for lowering blood pressure and
cholesterol are clear (Davey Smith 1993; Collins 1994; CTT
2005). However, those people at highest risk of disease in both
hypertension control (Mulrow 1995) and cholesterol-lowering
(Davey Smith 1993) benefit most. Treatment of low-risk popu-
lations may result in small treatment benefits being outweighed
13Multiple risk factor interventions for primary prevention of coronary heart disease (Review)
Copyright © 2011 The Cochrane Collaboration. Published by John Wiley & Sons, Ltd.
by small treatment risks (Davey Smith 1994), which may have
occurred in both the Multiple Risk Factor Intervention Trial and
the Finnish businessmen’s trial (MRFIT Study 1982; Finnish men
1985). There were strong associations between baseline levels of
risk factors and net falls experienced, suggesting that intervention
may be more effective in populations with particularly adverse
risk-factor profiles.
More intensive interventions might be expected to produce bet-
ter effects although those used in many of the trials would far
exceed what is feasible in routine practice. A meta-analysis of di-
etary modifications found that increasing intensity of dietary in-
tervention was associated with greater falls in blood cholesterol
levels in high-risk participants (Brunner 1997). In the Minnesota
Heart Health Programme, a non-randomised community trial of
intensive health promotion, both risk-factor and mortality changes
showed virtually no difference between intervention and con-
trol communities (Luepker 1996). The continued enthusiasm for
health promotion practices given the failure of these community
intervention trials is curious, especially given the huge resources
which have been put into them.
Latency of effects
It is possible that benefits cannot be detected in the early stages
but emerge over time. Longer-term follow up of the Multiple
Risk Factor Intervention Trial participants has demonstrated in-
creased divergence between control and intervention group mor-
tality rates (MRFITRG 1990) which has also been found in the
Tromso Family Trial (Professor S. Knutson, personal communi-
cation). However, evidence from pharmacological trials suggests
benefits from reduction of blood pressure and blood cholesterol
are observed within two to four years (Collins 1994; Scandinavian
1994). The effects of giving up smoking vary depending on the
clinical outcome considered: stroke risk falls rapidly after stopping
(Wannamethee 1995), but coronary heart disease risk may be less
reversible (Cook 1986; Ben-Shlomo 1994).
Evidence of benefit
The quasi-experimental North Karelia study has been very influen-
tial in supporting multiple risk factor intervention. Examination
of the trends in both risk factors (Puska 1985; Vartiainen 1994)
and coronary heart disease mortality (Valkonen 1992) observed
in North Karelia and comparison regions shows similar patterns
occurring at the same time, suggesting that the interventions in
North Karelia were not instrumental in causing the improvements
observed (Ebrahim 2001). Indeed, the North Karelia and similar
projects may be viewed as effects, or epiphenomena, of the very
high coronary heart disease mortality rates experienced in many
countries in the 1960s.
In secondary prevention following myocardial infarction and
angina, trials of multiple and single risk factor interventions have
suggested substantial benefits (Oldridge 1988; O’Connor 1989;
Mullen 1992). It is probable that intervention aimed at lifestyle
modification following myocardial infarction is effective because
participants are much more likely to change their behaviours.
Limitations of randomised controlled trials
The interventions reviewed were essentially individual (49 trials),
family (three trials) or work site (three trials) approaches. Ran-
domised controlled trials impose limitations on the nature of in-
terventions that may be tested and are of more value in examining
high-risk rather than population and social approaches to preven-
tion (Rose 1992).
Context
The majority of included trials (47%) were undertaken in Europe
and in the USA (29%) whilst the remaining were undertaken in
other countries including Australia, Japan, Brazil, Mexico, Israel
and Taiwan. Over the past decades, whilst there has been a de-
cline in deaths from heart disease and stroke in developed coun-
tries, especially in Europe and the US, increasing trends are be-
ing experienced in developing countries, particularly in India and
China (Callow 2006). The US alone has experienced a decline
in deaths from CHD by as much as 60% to 63% during 1965
to 1998 and a decline in cerebrovascular death by 59% to 63%
during the same time period. In Europe similar trends have been
observed: a decline in deaths from CHD of 30% to 32% and a
decline in cerebrovascular death by 55% to 57% between 1965
and 1998 (Levi 2002). These declines have been attributed to low-
ering of risk factor distributions and better treatment (Bejot 2007;
Ellekjaer 2007; Fang 2007). Our results must be viewed within
the context of the falling trends seen in CHD and stroke deaths.
Replication of these multiple risk factor intervention studies in
countries where the cardiovascular disease is increasing should be
a high research priority.
A U T H O R S ’ C O N C L U S I O N S
Implications for practice
The use of ’health promotion’ techniques for one-to-one, work site
or family-orientated information and advice on a range of lifestyles
(exercise, smoking cessation, diet) given to people at relatively low
risk of cardiovascular disease is not particularly effective in terms of
reducing the risk of clinical events. The costs of such interventions
are high and it seems likely that these resources and techniques
14Multiple risk factor interventions for primary prevention of coronary heart disease (Review)
Copyright © 2011 The Cochrane Collaboration. Published by John Wiley & Sons, Ltd.
may be better used in people at high risk of cardiovascular disease
and those with established cardiovascular disease, where evidence
of effectiveness is much stronger.
Policy implications
Health protection through national fiscal and legislative changes
that aim to reduce smoking, dietary consumption of fats, ’hidden’
salt and calories, and increase facilities and opportunities for ex-
ercise, should have a higher priority than health promotion inter-
ventions applied to general and workforce populations. It is essen-
tial that the current concepts and practices of multiple risk factor
intervention, primarily through individual risk factor counselling,
are not exported to poorer countries as the best policy option for
dealing with existing and projected burdens of cardiovascular dis-
ease (Pearson 1993). Health protection should be promoted as
the mainstay of chronic disease prevention in poorer countries
(Ebrahim 2001; Asaria 2007).
Implications for research
It is unlikely that any further large-scale multiple risk factor in-
tervention trials will be mounted in high-income countries in the
future. It is also unlikely that uncontrolled or quasi-experimental
study designs will produce more robust answers to questions about
the effectiveness of multiple risk factor intervention by means of
individual or family health information and advice.
Research on the effects and costs of health protection (i.e. fiscal and
legislative approaches) and primary prevention would be of direct
policy relevance, particularly in low and middle-income countries.
Qualitative studies examining how participants perceived and re-
sponded to the advice and treatment given in these randomised
controlled trials could be very helpful in shaping future interven-
tions. For example, the availability of foods and better access to
recreational and sporting facilities may have a greater impact on
dietary and exercise patterns respectively, than health professional
advice. The effects of new approaches need to be examined in a
wide range of people and in different contexts as it seems likely
that the poor, socially excluded, specific ethnic groups and older
people may all react in different ways and that interventions of-
fered in developing countries where cardiovascular disease rates
are increasing dramatically may be accepted more readily.
A C K N O W L E D G E M E N T S
We are extremely grateful to the following investigators who
provided us with data: M. Shipley (WHO Factories 1986), L.
Wilhelmsen (Gothenberg Study 1986), I. Hjermann (Oslo Diet
Antismoking), J. Shaten (MRFIT Study 1982), T. Miettinen
(Finnish men 1985), J. Muir and T. Lancaster (OXCHECK 1994),
J. Baron (Abingdon 1990), S. Pyke (Family Heart 1994 M), S.
Boles (Take Heart 1995), T. Ekbom (CELL Study 1995), A. Goble
and M. Worcester (FARIS). The following investigators replied to
our request but were unable to provide us with further data for
various reasons: G. Payne (HDFP trial 1970), D. Morisky (Johns
Hopkins), R. Stamler (Stamler 1989), S. Knutson (Tromso 1991
M), C. Connell (Connell 1995), P. Whelton and M. Espelund
(TONE 1998), A. Steptoe (Change of Heart 1999), G. Berglund
(Persson 1996) and K. Emmons (WHP 1999). We would also like
to thank M. Napoli (Center for Medical Consumers) for her help
with the plain language summary.
We would also like to thank the following people for their help
with the translation of papers so that we could complete the data
extraction from non-English papers: M. Podinovskaia (Immunol-
ogy Unit at the London School of Hygiene and Tropical Medicine)
- Russian translation, C. To (CRASH Trials Co-ordinating Centre
at the London School of Hygiene and Tropical Medicine) - Chi-
nese Translation, E. Gohil (Global Change and Health at the Lon-
don School of Hygiene and Tropical Medicine) - Polish Transla-
tion, C. Pizzi (Medical Statistics Unit at the London School of Hy-
giene and Tropical Medicine) - Italian Translation and R. Houben
(Infectious Disease Epidemiology Unit at the London School of
Hygiene and Tropical Medicine) - Dutch Translation.
R E F E R E N C E S
References to studies included in this review
Aberg 1989 F {published data only}
Aberg H, Tibblin G. Addition of non-pharmacological methods of
treatment in patients on antihypertensive drugs: results of previous
medication, laboratory tests and life quality. Journal of InternalMedicine 1989;226:39–46.
Aberg 1989 M {published data only}
Aberg H, Tibblin G. Addition of non-pharmacological methods of
treatment in patients on antihypertensive drugs: results of previous
medication, laboratory tests and life quality. Journal of InternalMedicine 1989;226:39–46.
Abingdon 1990 {published data only}
Baron J, Gleason R, Crowe B, Mann J. Preliminary trial of the
effect of general practice based nutritional advice. British Journal ofGeneral Practice 1990;40:137–41. [MEDLINE: 90321680]
ADAPT 2005 {published data only}
Burke V, Beilin L, Cutt H, Mansour J, Wilson A, Mori TA. Effects
of a lifestyle programme on ambulatory blood pressure and drug
dosage in treated hypertensive patients: a randomised trial. Journal
15Multiple risk factor interventions for primary prevention of coronary heart disease (Review)
Copyright © 2011 The Cochrane Collaboration. Published by John Wiley & Sons, Ltd.
of Hypertension 2005;23:1241–9.
Burke V, Mansour J, Beilin L, Mori T. Long-term follow-up of
participants in a health promotion program for treated
hypertensives (ADAPT). Nutrition, Metabolism & CardiovascularDiseases 2006;December:1–9.
Aldana (CHIP) 2005 {published data only}
Aldana SG, Greenlaw R, Diehl H, Salberg A, Merrill R, Ohmine S.
The effects of a worksite chronic disease prevention program.
Journal of Occupational Environmental Medicine 2005;47:558–64.
Applegate 1992 {published data only}
Applegate WB, Miller ST, Elam JT, Cushman WC, El Derwi D,
Brewer A, et al.Nonpharmacologic intervention to reduce blood
pressure in older patients with mild hypertension. Archives ofInternal Medicine 1992;152:1162–6.
Blumenthal 2000 {published data only}∗ Blumenthal JA, Sherwood A, Gullette ECD, Babyak M, Waugh
R, Georgiades A, et al.Exercise and weight loss reduce blood
pressure in men and women with mild hypertension. Archives of
Internal Medicine 2000;160(13):1947–58.
Steffen PR, Sherwood A, Gullette EC, Georgiades A, Hinderliter A,
Blumenthal JA. Effects of exercise and weight loss on blood pressure
during daily life. Medicine & Science in Sports & Exercise 2001;33
(10):1635–40.
Brekke 2005a {published data only}
Brekke HK, Jansson PA, Lenner R. Long-term (1-and 2-year)
effects of lifestyle intervention in type 2 diabetes relatives. Diabetes
Research and Clinical Practice 2005;70:225–40.
Cakir 2006 {published data only}
Cakir H, Pinar R. Randomised controlled trial on lifestyle
modification in hypertensive patients. Western Journal of NursingResearch 2006;28(2):190–209.
CELL Study 1995 {published data only}∗ Lindholm LH, Ekbom T, Dash C, Eriksson M, Tibblin G,
Schersten B. The impact of health care advice given in primary care
on cardiovascular risk. BMJ 1995;310:1105–9. [MEDLINE:
95261214]
Lindholm LH, Ekbom T, Dash C, Isacsson A, Schersten B.
Changes in cardiovascular risk factors by combined
pharmacological and nonpharmacological strategies: the main
results of the CELL Study. Journal of Internal Medicine 1996;240
(1):13–22. [MEDLINE: 96332304 EMBASE 96235936]
Change of Heart 1999 {published data only}
Hilton S, Doherty S, Kendrick T, Kerry S, Rink E, Steptoe A.
Promotion of healthy behaviour among adults at increased risk of
coronary heart disease in general practice: methodology and
baseline data from the Change of Heart study. Health Education
Journal 1999;58:3–16.∗ Steptoe A, Doherty S, Rink E, Kerry S, Kendrick T, Hilton S.
Behavioural counselling in general practice for the promotion of
healthy behaviour among adults at increased risk of coronary heart
disease: randomised trial. BMJ 1999;319:943–8.
Steptoe A, Kerry S, Rink E, Hilton S. The impact of behavioral
counseling on stage of change in fat intake, physical activity, and
cigarette smoking in adults at increased risk of coronary heart
disease. American Journal of Public Health 2001;91(2):265–9.
Steptoe A, Rink E, Kerry S. Psychosocial predictors of changes in
physical activity in overweight sedentary adults following
counseling in primary care. Preventive Medicine 2000;31(2 Pt 1):
183–94. [MEDLINE: 20398370]
Connell 1995 {published data only}
Connell CM, Sharpe PA, Gallabt MP. Effect of health risk appraisal
on health outcomes in a university worksite health promotion trial.
Health Education Research 1995;10:199–209.
Esposito 2004 {published data only}
Esposito K, Giugliano F, Di Palo C, Giugliano G, Marfella R,
D’Andrea F, et al.Effect of lifestyle changes on erectile dysfunction
in obese men. JAMA 2004;291:2978–84.
Family Heart 1994 M {published and unpublished data}
Family Heart Study Group. Randomised controlled trial evaluating
cardiovascular screening and intervention in general practice:
principal results of British family heart study. BMJ 1994;308:
313–20. [MEDLINE: 94169709]
Family Heart 1994 F {published and unpublished data}
Family Heart Study Group. Randomised controlled trial evaluating
cardiovascular screening and intervention in general practice:
principal results of British family heart study. BMJ 1994;308:
313–20.
FARIS 1997 F {published data only}
Goble A, Jackson B, Phillips P, Race E, Oliver RG, Worcester MC.
The Family Atherosclerosis Risk Intervention Study (FARIS): risk
factor profiles of patients and their relatives following an acute
cardiac event. Australian and New Zealand Journal of Medicine
1997;27(5):568–77. [MEDLINE: 98068400]
FARIS 1997 M {published data only}
Goble A, Jackson B, Phillips P, Race E, Oliver RG, Worcester MC.
The Family Atherosclerosis Risk Intervention Study (FARIS): risk
factor profiles of patients and their relatives following an acute
cardiac event. Australian and New Zealand Journal of Medicine1997;27(5):568–77. [MEDLINE: 98068400]
Finnish DPS 2001 {published data only}
Eriksson J, Lindström J, Valle T, Aunola S, Hamalainen H, Ilanne-
Parikka P, et al.Prevention of type II diabetes in subjects with
impaired glucose tolerance: the Diabetes Prevention Study (DPS)
in Finland. Study design and 1-year interim report on the
feasibility of the lifestyle intervention programme. Diabetologia
1999;42(7):793–801. [MEDLINE: 99366732]
Lindström J, Louheranta A, Mannelin M, Rastas M, Salminen V,
Eriksson J, et al.The Finnish Diabetes Prevention Study: lifestyle
intervention and 3 year results on diet and physical activity.
Diabetes Care 2003;26(12):3230–6.∗ Tuomilehto J, Lindström J, Eriksson JG, Valle TT, Hamalainen
H, Ilanne-Parikka P, et al.Prevention of type 2 diabetes mellitus by
changes in lifestyle among subjects with impaired glucose tolerance.
New England Journal of Medicine 2001;344:1343–50.
Uusitupa M, Louheranta A, Lindström J, Valle T, Sundvall J,
Eriksson J, et al.The Finnish Diabetes Prevention Study. BritishJournal of Nutrition 2000;83(Suppl 1):S137–42. [MEDLINE:
20348280]
16Multiple risk factor interventions for primary prevention of coronary heart disease (Review)
Copyright © 2011 The Cochrane Collaboration. Published by John Wiley & Sons, Ltd.
Finnish men 1985 {published and unpublished data}∗ Miettinen T, Huttunen J, Naukkarinen V, Strandberg T, Mattila
S, Kundin T, et al.Multifactorial primary prevention of
cardiovascular diseases in middle-aged men. Risk factor changes,
incidence, and mortality. JAMA 1985;254:2097–102.
[MEDLINE: 86011756]
Strandberg T, Salomaa V, Naukkarinen V, Vanhanen, Sarna S,
Miettinen T. Long-term mortality after 5-year multifactorial
primary prevention of cardiovascular diseases in middle-aged men.
JAMA 1991;266:1225–9. [MEDLINE: 91333101]
Strandberg TE, Salomaa VV, Vanhanen, HT, Naukkarinen VA,
Sarna SJ, Miettinen TA. Mortality in participants and non-
participants of a multifactorial prevention study of cardiovascular
diseases: a 28 year follow up of the Helsinki Businessmen Study.
British Heart Journal 1995;74:449–54. [MEDLINE: 96095992]
Garcia-Pena 2001 {published data only}
Garcia-Pena C, Thorogood M, Armstrong B, Reyes-Frausto S, et
al.Pragmatic randomised trial of home visits by a nurse to elderly
people with hypertension in Mexico. International Journal of
Epidemiology 2001;30:1485–91.
Given 1984 {published data only}
Given CW, Given BA, Coyle BW. The effects of patient
characteristics and beliefs on responses to behavioral interventions
for control of chronic diseases. Patient Education and Counseling
1984;6:131–140.
Gothenberg Study 1986 {published and unpublished data}
Wilhelmsen L, Berglund G, Elmfeldt D, Tibblin G, Wedel H,
Pennert K, et al.The multifactor primary prevention trial in
Goteborg, Sweden. European Heart Journal 1986;7:279–88.
[MEDLINE: 86247180]
HDFP trial 1970 {published data only}
Hypertension Detection and Follow-up Program Cooperative
Group. Five-year findings of the Hypertension Detection and
Follow-up Program. 1. Reduction in mortality of persons with
high blood pressure, including mild hypertension. JAMA 1979;
242:2562–71. [MEDLINE: 97144577]
Hellenius 1993 {published data only}
Hellenius M-L, de Faire U, Berglund B, Hamsten A, Krakau I. Diet
and exercise are equally effective in reducing risk for cardiovascular
disease. Results of a randomized controlled study in men with
slightly to moderately raised cardiovascular risk factors.
Atherosclerosis 1993;103:81–91. [MEDLINE: 94107385]
Iso 1994 {published data only}
Iso H, Shimamato T, Yokota K, Sankai T, Jacobs DR, Komachi Y.
Community-based education classes for hypertension control.
Hypertension 1996;27:968–74.∗ Iso H, Shimamoto T, Sankai T, Imano H, Koike K, Yokota K, et
al.A randomized controlled trail of intensive and usual community-
based education for blood pressure control [Japanese]. NipponKoshu Eisei Zasshi [Japanese Journal of Public Health] 1994;41(10):
1015–26. [MEDLINE: 1301]
Iso 2002 {published data only}
Iso H, Imano H, Nakagawa Y, Kiyama M, Kitamura A, Sato S, et
al.One year community-based education program for
hypercholesterolemia in middle aged Japanese: a long-term
outcome at 8 years follow-up. Atherosclerosis 2002;164:195–202.
Jalkanen 1991 {published data only}
Jalkanen L. The effect of a weight reduction program on
cardiovascular risk factors among overweight hypertensives in
primary health care. Scandinavian Journal of Social Medicine 1991;
19:66–71.
Johns Hopkins {published data only}
Morisky D, Levine D, Green L, Shapiro S, Russell R, Smith C.
Five-year blood pressure control and mortality following health
education for hypertensive patients. American Journal of PublicHealth 1983;73:153–62. [MEDLINE: 83098083]
Kastarinen 2002 {published data only}
Kastarinen M, Puska P, Korhonen M, Mustonen J, Salomaa VV,
Sundvall JE, et al.Non-pharmacological treatment of hypertension
in primary health care: a 2 year open randomised controlled trial of
lifestyle intervention against hypertension in eastern Finland.
Journal of Hypertension 2002;20:2505–12.
Lin 1996 {published data only}
Lin T, Chen C-H, Chou P. A hypertension control program in Yu-
Chi, Taiwan: preliminary results. Journal of the Formosan Medical
Association 1997;96:613–20.
Lindahl 1999 {published data only}
Lindahl B, Nilsson TK, Jansson J-H, Asplund K, Hallmans G.
Improved fibrinolysis by intense lifestyle intervention. A
randomized trial in subjects with impaired glucose tolerance.
Journal of Internal Medicine 1999;246:105–12.
Look AHEAD 2003 {published data only}
The Look AHEAD Research Group. Baseline characteristics of the
randomised cohort from the Look AHEAD study. Diabetes and
Vascular Disease Research 2006;3:202–15.∗ The Look AHEAD Research Group. Look AHEAD (Action for
Health in Diabetes): design and methods for a clinical trial of
weight loss for the prevention of cardiovascular disease in type 2
diabetes. Controlled Clinical Trials 2003;24:610–28.
The Look AHEAD Research Group. Reduction in weight and
cardiovascular disease risk factors in individuals with type 2
diabetes. One year results of the Look AHEAD trial. Diabetes Care
2007;30(6):1374–83.
The Look AHEAD Research Group. The Look AHEAD Study: a
description of the lifestyle intervention and evidence supporting it.
Obesity 2006;14(5):737–52.
Mattila 2003 {published data only}
Mattila R, Malmivaara A, Kastarinen M, Kivelä SL, Nissinen A.
Effectiveness of multidisciplinary lifestyle intervention for
hypertension: a randomised controlled trial. Journal of Human
Hypertension 2003;17:199–205.
Meland 1997 {published data only}∗ Meland E, Laerum E, Ulvik RJ. Effectiveness of two preventive
interventions for coronary heart disease in primary care.
Scandinavian Journal of Primary Health Care 1997;15:57–64.
Meland E, Maeland JG, Laerum E. The importance of self-efficacy
in cardiovascular risk factor change. Scandinavian Journal of PublicHealth 1999;27(1):11–17. [MEDLINE: 20304315]
MRFIT Study 1982 {published and unpublished data}
Multiple Risk Factor Intervention Trial Research Group. Mortality
rates after 10.5 years for participants in the multiple risk factor
17Multiple risk factor interventions for primary prevention of coronary heart disease (Review)
Copyright © 2011 The Cochrane Collaboration. Published by John Wiley & Sons, Ltd.
intervention trial. Findings related to a priori hypotheses of the
trial. JAMA 1990;263:1795–801. [MEDLINE: 90189406]∗ Multiple Risk Factor Intervention Trial Research Group. Multiple
Risk Factor Intervention Trial. Risk factor changes and mortality
results. JAMA 1982;248:1465–77. [MEDLINE: 82269405]
Muto 2001 {published data only}
Muto T, Yamauchi K. Evaluation of a multicomponent workplace
health promotion program conducted in Japan for improving
employees’ cardiovascular disease risk factors. Preventative Medicine
2001;33:571–7.
Nilsson 1992 {published data only}
Nilsson PM, Lindholm LH, Schersten BF. Life style changes
improve insulin resistance in hyperinsulinaemic subjects: a one-year
intervention study of hypertensives and normotensives in Dalby.
Journal of Hypertension 1992;10(9):1071–8. [MEDLINE:
93017836]
Nilsson 2001 {published data only}
Nilsson PM, Klasson E-B, Nyberg P. Life-style intervention at the
worksite - reduction of cardiovascular risk factors in a randomized
study. Scandinavian Journal of Work and Environmental Health
2001;27:57–62.
Okayama 2004 {published data only}
Okayama A, Chiba N, Ueshima H. Non-pharmacological
intervention study of hypercholesterolemia among middle-aged
people. Environmental Health and Preventative Medicine 2004;9:
165–9.
Oldroyd 2001 {published data only}
Oldroyd JC, Unwin NC, White M, Imrie K, Mathers JC, Alberti
KGMM. Randomised controlled trial evaluating the effectiveness of
behavioural interventions to modify cardiovascular risk factors in
men and women with impaired glucose tolerance: outcomes at 6
months. Diabetes Research and Clinical Practice 2001;52:29–43.
Oslo Diet Antismoking {published data only}
Ellingsen I, Hjerkinn E, Arnesen H, Seljeflot I, Hjermann I,
Tonstad S. Follow-up of diet and cardiovascular risk factors 20 years
after cessation of the intervention in the Oslo Diet and Antismoking
Study. European Journal of Clinical Nutrition 2006;60:378–85.
Hjermann I, Holme I, Leren P. Oslo Study Diet and Antismoking
Trial. American Journal of Medicine 1986;80(Suppl 2A):7–11.
[MEDLINE: 86127401]∗ Hjermann I, Holme I, Velve Byre K, Leren P. Effect of diet and
smoking on the incidence of coronary heart disease. Report from
the Oslo Study Group of a randomised trial in healthy men. Lancet
1981;ii:1303–10. [MEDLINE: 82079715]
Holme I, Hjermann I, Helgeland A, Leren P. The Oslo Study; diet
and antismoking advice. Additional results from a 5-year primary
preventive trial in middle-aged men. Preventive Medicine 1985;14:
279–92. [MEDLINE: 86042569]
Oslo Diet Exercise {published data only}
Anderssen SA, Haaland A, Hjerman I, Urdal P, Gjesdal K, Holme I.
Oslo diet and exercise study: a one year randomized intervention
trial. Effect on haemostatic variables and other coronary risk factors.
Nutrition Metabolism & Cardiovascular Diseases 1995;5:189–200.
OXCHECK 1994 {published and unpublished data}
Imperial Cancer Research Fund OXCHECK Study Group.
Effectiveness of health checks conducted by nurses in primary care:
results of the OXCHECK study after one year. BMJ 1994;308:
308–12. [MEDLINE: 94169708]
Perez-Stable 1995 no prop {published data only}
Perez-Stable EJ, Coates TJ, Baron RB, Biro BS, Hauck WW,
McHenry KS, et al.Comparison of a lifestyle modification program
with propanolol use in the management of diastolic hypertension.
Journal of General Internal Medicine 1995;10:419–28.
Perez-Stable 1995 prop {published data only}
Perez-Stable EJ, Coates TJ, Baron RB, Biro BS, Hauck WH,
McHenry KS, et al.Comparison of a lifestyle modification program
with propanolol use in the management of diastolic hypertension.
Journal of General Internal Medicine 1995;10:419–28.
Proper 2003 {published data only}
Proper K, Hildebrandt V, Van der Beek A, Twisk J, Van Mechelen
W. Effect of individual counselling on physical activity fitness and
health. A randomised controlled trial in a workplace setting.
American Journal of Preventative Medicine 2003;24(3):218–26.
Rachmani 2005 {published data only}
Rachmani R, Levi Z, Slavachevski I, Avin M, Ravid M. Teaching
patients to monitor their risk factors retards the progression of
vascular complications in high risk patients with type 2 diabetes - a
randomised prospective study. Diabetic Medicine 2002;19:385–92.∗ Rachmani R, Slavachevski I, Berla M, Frommer-Shapira, Ravid
M. Teaching and motivating patients to control their risk factors
retards progression of cardiovascular as well as microvascular
sequelae of type 2 diabetes mellitus - a randomised prospective 8
year follow-up. Diabetic Medicine 2005;22:410–14.
Sartorelli 2005 {published data only}
Sartorelli D, Sciarra E, Franco LJ, Cardoso MA. Beneficial effects of
short-term nutritional counselling at primary health care level
among Brazilian adults. Public Health Nutrition Journal 2005;8(7):
820–5.
Sone (JDCS) 2002 {published data only}
Sone H, Katagiri A, Ishibashi S, Abe R, Saito Y, Murase T, et
al.Effects of lifestyle modifications on patients with type 2 diabetes:
the Japan diabetes complications study (JDCS) study design,
baseline analysis and three year interim report. Hormone and
Metabolic Research 2002;34:509–15.
Stamler 1989 {published data only}
Stamler R, Stamler J, Gosch F, Civinelli J, Fishman J, McKeever P,
et al.Primary prevention of hypertension by nutritional hygienic
means: final report of a randomized controlled trial. JAMA 1989;
262:1801–7. [MEDLINE: 89382841]
Stefanick 1998 F {published data only}
Stefanick ML, Mackey S, Sheehan M, Ellsworth N, Haskell WL,
Wood PD. Effects of diet and exercise in men and postmenopausal
women with low levels of HDL cholesterol and high levels of LDL
cholesterol. New England Journal of Medicine 1998;339:12–20.
Stefanick 1998 M {published data only}
Stefanick ML, Mackey S, Sheehan M, Ellsworth N, Haskell WL,
Wood PD. Effects of diet and exercise in men and postmenopausal
women with low levels of HDL cholesterol and high levels of LDL
cholesterol. New England Journal of Medicine 1998;339:12–20.
Swedish RIS 1994 {published data only}∗ Agewall S, Wikstrand J, Samuelsson O, Persson B, Andersson
OK, Fagerberg B. The efficacy of multiple risk factor intervention
18Multiple risk factor interventions for primary prevention of coronary heart disease (Review)
Copyright © 2011 The Cochrane Collaboration. Published by John Wiley & Sons, Ltd.
in treated hypertensive men during long-term follow up. Journal of
Internal Medicine 1994;236:651–9. [MEDLINE: 95081756]
Agewell S, Fagerberg B, Berglund G, Schmidt C, Wendelhag I,
Wikstrand J, et al.Multiple risk factor intervention trial in high risk
hypertensive men: comparison of ultrasound intima-media
thickness and clinical outcome during 6 years follow-up. Journal ofInternal Medicine 2001;249:305–14.
Fagerberg B, Wikstrand J, Berglund G, Samuelsson O, Agewall S.
Mortality rates in treated hypertensive men with additional risk
factors are high but can be reduced. A randomized intervention
study. American Journal of Hypertension 1998;11:14–22.
Schmidt C, Fagerberg B, Wikstrand J, Hulthe J. Multiple risk
factor intervention reduces cardiovascular risk in hypertensive
patients with echolucent plaques in the carotid artery. Journal ofInternal Medicine 2003;253:430–8.
Suurkula M, Agewell S, Fagerberg B, Wendelhag, et al.Multiple risk
factor intervention in high risk hypertensive patients.
Arteriosclerosis, Thrombosis and Vascular Biology 1996;16:462–70.
Take Heart 1995 {published data only}
Glasgow RE, Terborg JR, Hollis JF, Severson HH, Boles SM. Take
heart: results from the initial phase of a work-site wellness program.
American Journal of Public Health 1995;85(2):209–16.
Toobert (MLP) 2005 {published data only}
Toobert D, Glasgow R, Strycker L, Barrera M, Ritzwoller DP,
Weidner G. Long-term effects of the Mediterranean lifestyle
program: a randomised clinical trial for post menopausal women
with type 2 diabetes. International Journal of Behavioural
Nutritional and Physical Activity 2007;4(1):1–12.
Toobert DJ, Glasgow RE, Strycker LA, Barrera M, Radcliffe JL,
Wander RC, et al.Biologic and quality of life outcomes from the
Mediterranean lifestyle program. Diabetes Care 2003;26(8):
2288–93.
Toobert DJ, Strycker LA, Glasgow RE, Barrera M, Bagdade JD.
Enhancing support for health behaviour change among women at
risk for heart disease: the Mediterranean lifestyle program. Health
Education Research 2002;17(5):574–85.∗ Toobert DJ, Strycker LA, Glasgow RE, Barrera M, Bagdade JD, et
al.Effects of the Mediterranean lifestyle program on multiple risk
behaviours and psychosocial outcomes among women at risk for
heart disease. Annals of Behavioural Medicine 2005;29(2):128–37.
Tromso 1991 F {published and unpublished data}
Knutsen S, Knutsen R. The Tromso Survey: The Family
Intervention Study - The effect of intervention on some coronary
risk factors and dietary habits, a 6-year follow-up. PreventiveMedicine 1991;20:197–212. [MEDLINE: 91279734]
Tromso 1991 M {published and unpublished data}
Knutsen S, Knutsen R. The Tromso Survey: The Family
Intervention Study - The effect of intervention on some coronary
risk factors and dietary habits, a 6-year follow-up. PreventiveMedicine 1991;20:197–212. [MEDLINE: 91279734]
Uusitupa 1993 {published data only}
Laitinen JH, Ahola IE, Sarkkinen ES, Winberg RL, Harmaakorpi-
Iivonen PA, Uusitupa MI. Impact of intensified dietary therapy on
energy and nutrient intakes and fatty acid composition of serum
lipids in patients with recently diagnosed non-insulin-dependent
diabetes mellitus. Journal of the American Dietetic Association 1993;
93(3):276–83. [MEDLINE: 93179637]∗ Uusitupa M, Laitinen J, Siitonen O, Vanninen E, Pyorala K. The
maintenance of improved metabolic control after intensified diet
therapy in recent type 2 diabetes. Diabetes Research & Clinical
Practice 1993;19(3):227–38. [MEDLINE: 93307030]
Uusitupa MIJ. Early lifestyle intervention in patients with non-
insulin-dependent diabetes mellitus and impaired glucose tolerance.
Annals of Internal Medicine 1996;28:445–9.
Vanninen E, Uusitupa M, Siitonen O, Laitinen J, Lansimies E.
Habitual physical activity, aerobic capacity and metabolic control in
patients with newly-diagnosed type 2 (non-insulin-dependent)
diabetes mellitus: effect of 1-year diet and exercise intervention.
Diabetologia 1992;35(4):340–6. [EMBASE: 92117529]
WHLP 1998 {published data only}∗ Kuller LH, Simkin-Silverman LR, Wing RR, Meilahn EN, Ives
DG. Women’s healthy lifestyle project: a randomized clinical trial.
Circulation 2001;103:32–7.
Simkin-Silverman L, Wing R, Boraz M, Kuller L. Lifestyle
intervention can prevent wight gain during menopause: results
from a 5-year randomised clinical trial. Annals of BehavioralMedicine 2003;26(3):212–20.
Simkin-Silverman L, Wing RR, Hansen DH, Klem ML, Pasagian-
Macaulay AP, Meilahn EN, et al.Prevention of cardiovascular risk
factor elevations in healthy premenopausal women. PreventiveMedicine 1995;24(5):509–17. [MEDLINE: 96089880]
Simkin-Silverman LR, Wing RR, Boraz MA, Meilahn EN, Kuller
LH. Maintenance of cardiovascular risk factor changes among
middle-aged women in a lifestyle intervention trial. Women’s Health1998;4(3):255–71. [MEDLINE: 99003919]
WHO Factories 1986 {published and unpublished data}
World Health Organization European Collaborative Group. WHOEuropean collaborative trial in the multifactorial prevention of
coronary heart disease. Copenhagen: World Health Organization,
1989. [MEDLINE: 91122807]
World Health Organization European Collaborative Group.
European collaborative trial of multifactorial prevention of
coronary heart disease: final report on the 6-year results. Lancet1986;i:869–75. [MEDLINE: 86173760]
World Health Organization European Collaborative Group.
Multifactorial trial in the prevention of coronary heart disease: 2.
Risk factor changes at two and four years. European Heart Journal1982;3:184–90. [MEDLINE: 82210760]
Wing 1998 {published data only}
Wing RR, Polley BA, Venditti E, Lang W, Jakicic JM. Lifestyle
intervention in overweight individuals with a family history of
diabetes. Diabetes Care 1998;21:350–9.
References to studies excluded from this review
Aldana (DPS) 2005 {published data only}
Aldana SG, Barlow M, Smith R, Yanowitz FG, Adams T, Loveday
L, et al.The Diabetes Prevention Program. AAOHN Journal 2005;
53(11):499–505.
Andersen 1999 {published data only}
Andersen RE, Wadden TA, Bartlett SJ, Zemel B, Verde TJ,
Franckowiak SC. Effects of lifestyle activity vs structured aerobic
19Multiple risk factor interventions for primary prevention of coronary heart disease (Review)
Copyright © 2011 The Cochrane Collaboration. Published by John Wiley & Sons, Ltd.

exercise in obese women: a randomized trial [see comments].
JAMA 1999;281(4):335–40. [MEDLINE: 99126166]
Bakx 1997 {published data only}
Bakx JC, Stafleu A, van Staveren WA, van den Hoogen HJ, van
Weel C. Long-term effect of nutritional counseling; a study in
family medicine. American Journal of Nutrition 1997;65(Suppl):
1946S–50S.
Basler 1985 {published data only}
Basler H-D, Brinkmeier U, Buser K, Haehn K-D, Molders-Kober
R. Psychological group treatment of obese essential hypertensives by
lay therapists in rural general practice settings. Journal of
Psychosomatic Research 1985;29(4):383–91.
Becker 2005 {published data only}
Becker D, Yanek L, Johnson W, Garrett D, Moy TF, Reynolds SS,
et al.Impact of a community-based multiple risk factor intervention
on cardio vascular risk in black families with a history of premature
coronary disease. Circulation 2005;111:1298–304.
Berg 2005 {published data only}
Berg A, Frey I, Landmann U, Deibert P, et al.Weight reduction is
feasible-preliminary results of a controlled, randomised
intervention study in overweight adults. [Gewichtsreduktion ist
machbar. Halbjahresergebnisse einer klinisch kontrolierten,
randomisierten Interventionstudie mit übergewichtigen
Erwachsenen]. Ernährungs Umschau 2003;50(10):386–93.
Blake 1987 {published data only}
Blake R, Doyle M, Straub V, Zweig S, Brent E, Ingman S, et al.A
randomized controlled evaluation of an educational program in
adults with high psychosocial risk of morbidity. Journal of FamilyPractice 1987;24:369–76. [MEDLINE: 87168241]
Boylan 2003 {published data only}
Boylan M, Renier C, Knuths J, Haller I. Preventing cardiovascular
disease in women. Minnesota Medicine 2003;86(5):52–6.
Brekke 2005b {published data only}
Brekke H, Lenner L, Taskinen M, Mansson J, et al.Lifestyle
modification improves risk factors in type 2 diabetes relatives.
Diabetes Research and Clinical Practice 2005;68:18–28.
Bruckert 1999 {published data only}
Bruckert E, Lievre M. Primary prevention of cardiovascular disease
in the elderly. Atherosclerosis 1999;144:182.
Bruno 1983 {published data only}
Bruno R, Arnold C, Jacobson L, Winick M, Wynder E.
Randomized controlled trial of a nonpharmacologic cholesterol
reduction program at the worksite. Preventive Medicine 1983;12:
523–32. [MEDLINE: 84015981]
Burke 2003 {published data only}
Burke V, Gianguilio N, Gillam H, Beilin L, et al.Physical activity
and nutrition programmes for couples: a randomise controlled
trial. Journal of Clinical Epidemiology 2003;56:421–32.
Dzator JA, Hendrie D, Burke V, Gianguilio N, Gillam HF, Beilin
LJ, et al.A randomized trial of interactive group sessions achieved
greater improvements in nutrition and physical activity at a tiny
increase at cost. Journal of Clinical Epidemiology 2004;57:610–9.
Burke 1999 {published data only}
Burke V, Giangiulio N, Gillam HF, Beilin LJ, Houghton S,
Houghton S, et al.Health promotion in couples adapting to a
shared lifestyle. Health Education Research 1999;14:269–88.
Burke 2005 {published data only}
Burke V, Beilin L, Cutt H, Mansour J, Wilson A, Mori TA, et
al.Effects of a lifestyle programme on ambulatory blood pressure
and drug dosage in treated hypertensive patients: a randomised
controlled trial. Journal of Hypertension 2005;23:1241–9.
Cambien 1981 {published data only}
Cambien F, Richard JL, Ducimetiere P, Warnet JM, Kahn J. The
Paris Cardiovascular Risk Factor Prevention Trial. Effects of two
years of intervention in a population of young men. Journal of
Epidemiology & Community Health 1981;35:91–7.
Cambien F, Richard JL, Jaqueson A, Ducimetiere P. Analysis of the
results of a trial where groups have been randomized. The Paris
cardiovascular-prevention trial. Revue d Epidemiologie et de Sante
Publique. 1981;29(3):281–8. [EMBASE: 82013888]
Carlberg 1992 {published data only}
Carlberg A, Tibblin G. Patient satisfaction in primary health care.
A comparative study of two modes of treatment for hypertension.
Family Practice 1992;9:304–10. [MEDLINE: 93093366]
Cicek 2004 {published data only}
Cisek MM, Brzostek T, Gorkiewicz, M. Influence of health
education on the occurrence of risk factors for coronary heart
disease. Wiadomosci Lekarskie 2004;57(Suppl 1):38–42.
Crouch 1986 {published data only}
Crouch M, Sallis J, Farquhar JW, Haskell W, Ellsworth N, King A,
et al.Personal and mediated health counseling for sustained dietary
reduction of hypercholesterolaemia. Preventive Medicine 1986;15:
282–91. [MEDLINE: 86313513]
Da Qing 1997 {published data only}
Pan XR, Li GW, Hu YH, Wang JX, Yang WY, An ZX, et al.The
effect of diet and exercise in preventing NIDDM in people with
impaired glucose tolerance. The Da Qing IGT and Diabetes Study.
Diabetes Care 1997;20:537–544. [MEDLINE: 97251295]
Davey-Smith 2005 {published data only}
Davey Smith G, Bracha Y, Svendsen KH, Neaton JD, Haffner SM,
Kuller LH, et al.Incidence of type 2 diabetes in the randomised
multiple risk factor intervention trial. Annals of Internal Medicine
2005;142:313–22.
Domarkene 1990 {published data only}
Domarkene S, Baubinene A, Chazova L, Kalinina A, Meimanaliev
T, Shleifer E, et al.Efficiency of a cooperative program on
multifactor prevention of coronary heart disease. Results of a 3 year
follow up. Kardiologiia 1990;30:95–8. [MEDLINE: 90369778]
DPP 1999 {published data only}
The Diabetes Prevention Program: baseline characteristics of the
randomized cohort. The Diabetes Prevention Program Research
Group. Diabetes Care 2000;23(11):1619–29.
The Diabetes Prevention Program. Design and methods for a
clinical trial in the prevention of type 2 diabetes. Diabetes Care
1999;22(4):623–34. [MEDLINE: 99205541]
20Multiple risk factor interventions for primary prevention of coronary heart disease (Review)
Copyright © 2011 The Cochrane Collaboration. Published by John Wiley & Sons, Ltd.

DPPRG 2002 {published data only}
Diabetes Prevention Program Research Group. Reduction in the
incidence of type 2 diabetes with lifestyle intervention or
metformin. New England Journal of Medicine 2002;346(6):
393–403.
Dunn 1997 {published data only}
Dunn AL, Marcus BH, Kampert JB, Garcia ME, Kohl HW 3rd,
Blair SN. Reduction in cardiovascular disease risk factors: 6-month
results from Project Active. Preventive Medicine 1997;26(6):
883–92. [MEDLINE: 98050155]
Eberle 2003 {published data only}
Eberly L, Cohen J, Prineas R, Yang l, Intervention Trial Research
group. Impact of incident diabetes and incident nonfatal
cardiovascular disease on 18 year mortality. Diabetes Care 2003;26
(3):848–54.
Edye 1989 {published data only}
Edye B, Mandryk J, Frommer M, Healey S, Ferguson D.
Evaluation of a worksite programme for the modification of
cardiovascular risk factors. Medical Journal of Australia 1989;150:
574–81. [MEDLINE: 89238014]
Elliot 2007 {published data only}
Elliot D, Goldberg L. Kuehl K, Moe E, Breger RK, Pickering MA.
The PHLAME (Promoting Healthy Lifestyles: Alternative Models
Effect) firefighter study. Outcomes of two models of behaviour
change. Journal of Occupational Environmental Medicine 2007;49:
204–13.
Esposito 2003 {published data only}
Esposito K, Pontillo A, Di Palo C, Giugliano G, Masella M,
Marfella R, et al.Effect on weight loss and life style changes on
vascular inflammatory markers in obese women. JAMA 2003;289
(14):1799–804.
Ferro 2001 {published data only}
Ferro A, Walton R. Racial differences in the effectiveness of non-
pharmacologic treatment of hypertension. Hypertension 2001;38:
24.
Fielding 1994 {published data only}
Fielding JE, Knight K, Mason T, Klesges RC, Pelletier KR.
Evaluation of the IMPACT blood pressure program. Journal of
Occupational Medicine 1994;36(7):743–6. [MEDLINE: 95017170
EMBASE 94228817]
Fielding JE, Mason T, Kinght K, Klesges R, Pelletier KR. A
randomized trial of the IMPACT worksite cholesterol reduction
program. American Journal of Preventive Medicine 1995;11(2):
120–3.
Fox 1996 {published data only}
Fox AA, Thompson JL, Butterfield GE, Gylfadottir U, Moynihan
S, Spiller G. Effects of diet and exercise on common cardiovascular
disease risk factors in moderately obese older women. American
Journal of Clinical Nutrition 1996;63(2):225–33. [MEDLINE:
96148836]
Frommer 1990 {published data only}
Frommer MS, Mandryk JA, Edye BV, Healey S, Berry G, Ferguson
DA. A randomised controlled trial of counseling in a workplace
setting for coronary heart disease risk factor modification: effects
on blood pressure. Asia-Pacific Journal of Public Health 1990;4(1):
25–33. [MEDLINE: 91026380]
Fuchs 1993 {published data only}
Fuchs Z, Viskoper JR, Drexler I, Nitzan H, Lubin F, Berlin S, et
al.Comprehensive individualised nonpharmacological treatment
programme for hypertension in physician-nurse clinics: two year
follow-up. Journal of Human Hypertension 1993;7(6):585–91.
[MEDLINE: 94157869]
Fullard 1987 {published data only}
Fullard E, Fowler G, Gray M. Promoting prevention in primary
care: controlled trial of low technology, low cost approach. BMJ1987;294:1080–2. [MEDLINE: 87214984]
Gaede 2003 {published data only}
Gaede P, Vedel P, Larsen N, Jensen GV, Parving HH, Pedersen O.
Multifactorial intervention and cardiovascular disease in patients
with type 2 diabetes. New England Journal of Medicine 2003;348
(5):383–93.
Gaede P, Vedel P, Parving H, Pederen O. Intensified multifactorial
intervention in patients with type 2 diabetes mellitus and
microalbuminuria: the Steno type 2 randomised study. Lancet1999;353:617–22.
Pedersen O, Gaede P. Intensified multifactorial intervention and
cardiovascular outcome in type 2: the Steno type 2 randomised
study. Metabolism 2003;52(8):19–23.
Gemson 1990 {published data only}
Gemson DH, Sloan RP, Messeri P, Goldberg IJ. A public health
model for cardiovascular risk reduction. Impact of cholesterol
screening with brief nonphysician counseling. Archives of InternalMedicine 1990;150:985–9. [MEDLINE: 90233900]
Gemson 1995 {published data only}
Gemson DH, Sloan RP. Efficacy of computerized health risk
appraisal as part of a periodic health examination at the worksite.
American Journal of Health Promotion 1995;9:462–6.
German 1994 {published data only}
German C, Heierle C, Zunzunegui MV, Contreras E, Blanco P,
Ruiz E, et al.The control of arterial hypertension in primary care:
the evaluation of a program of self-care [El control de la
hipertension arterial en atencion primaria: evaluacion de un
programa de autocuidados]. Atencion Primaria 1994;13(1):3–7.
[MEDLINE: 94183927]
Goldhaber-Fiebert 2003 {published data only}
Goldhaber-Fiebert J, Goldhaber-Fiebert S, Tristran M, Nathan D.
Randomised controlled community based nutrition and exercise
intervention improves glycemia and cardiovascular risk factors in
type 2 diabetic patients in rural Costa Rica. Diabetes Care 2003;26
(1):24–9.
Gomel 1993 {published data only}
Gomel M, Oldenburg B, Simpson JM, Owen N. Work-site
cardiovascular risk reduction: a randomized trial of health risk
assessment, education, counseling, and incentives. American
Journal of Public Health 1993;83:1231–8. [MEDLINE: 93370584]
Gomel MK, Oldenburg B, Simpson JM, Chilvers M, Owen N.
Composite cardiovascular risk outcomes of a work-site intervention
trial. American Journal of Public Health 1997;87(4):673–6.
Gordon 1997 {published data only}
Gordon NF, Scott CB, Levine BD. Comparison of single versus
multiple lifestyle interventions: are the antihypertensive effects of
21Multiple risk factor interventions for primary prevention of coronary heart disease (Review)
Copyright © 2011 The Cochrane Collaboration. Published by John Wiley & Sons, Ltd.

exercise training and diet-induced weight loss additive?. American
Journal of Cardiology 1997;79(6):763–7. [MEDLINE: 97223974]
Gordon 2002 {published data only}
Gordon N, English C, Contractor A, Salmon R, Leighton RF,
Franklin BA, et al.Effectiveness of three models for comprehensive
cardiovascular disease risk reduction. American Journal ofCardiology 2002;89(1):1263–8.
Gump 2003 {published data only}
Gump B, Matthews K. Special intervention reduces CVD mortality
for adherent participants in the multiple risk factor intervention
trial. Annals of Behavioural Medicine 2003;26(1):61–8.
Gysan 2004 {published data only}
Gysan DB, Latsch J, Bjarnason-Wehrens B, Albus C, Falkowski G,
Herold G, et al.The PreFord Study. A prospective cohort study to
evaluate the risk of a cardiovascular event (overall-collective) as well
as a prospective, randomized, controlled, multicentre clinical
intervention study (high-risk-collective) on primary prevention of
cardiovascular diseases in the Ford Motor Company employees in
Germany [Die PraeFord Studie]. Zeitschrift für Kardiologie 2004;93
(2):131–6.
Hanlon 1995 {published data only}
Hanlon P, McEwan J, Gilmour H, Tannahill C, Tannahill A, Kelly
M. Health checks and coronary risk: further evidence from a
randomized controlled trial. BMJ 1995;311:1609–13.
[MEDLINE: 96111859]
Haskell 1988 {published data only}
Haskell WL, Fair J, Sanders W, Alderman EL. New methodologies
for studying the prevention of atherosclerosis. Annals of ClinicalResearch 1988;20(1-2):39–45. [MEDLINE: 88308389]
Hedberg 1998 {published data only}
Hedberg GE, Wikstrom-Frisen L, Janlert U. Comparison between
two programmes for reducing the levels of risk indicators of heart
diseases among male professional drivers. Occupational &
Environmental Medicine 1998;55(8):554–61.
Hopman-Rock {published data only}
Hopman-Rock M, Westhoff M. Health education and exercise
stimulation for older people: development and evaluation of the
program “Healthy and Vital” [Gezondheidsvoorlichting en
bewegingsstimulering voor ouderen: ontwikkeling en evaluatie van
het programma “Gezond & Vitaal”]. Tijdschrift Voor GerontologieEn Geriatrie 2002;33:56–63.
Huang 2001 {published data only}
Huang E, Meigs J, Singer D. The effects of intervention to prevent
cardiovascular disease in patients with type 2 diabetes mellitus.
American Journal of Medicine 2001;111(8):633–42.
Inter99 2003 {published data only}
Jorgensen T, Borch-Johnsen K, Thomsen T, Ibsen H, Glümer C,
Pisinger C, et al.A randomised non-pharmacological intervention
study for the prevention of Ischaemic heart disease: baseline results
Inter99. European Journal of Cardiovascular Prevention
Rehabilitation 2003;10:377–86.
Toft U, Kristoffersen L, Aadahl M, von Huth Smith L, et al.Diet
and exercise intervention in a general population-mediators of
participation and adherence: the Inter99 study. European Journal of
Public Health 2006;12:1–9.
Jiang 2004 {published data only}
Jiang B, Wang W, Wu S, Hong Z. Control effect of health
education on body mass index of community population. Wei
Sheng Yan Jui 2004;33(1):98–100.
Jula 1990 {published data only}
Jula A, Ronnemaa J, Rastas A, Karvetti R-L, Muki J. Long-term
nonpharmacological treatment for mild to moderate hypertension.
Journal of Internal Medicine 1990;227:413–21. [MEDLINE:
90278339]
Kamioka 2006 {published data only}
Kamioka H, Nakamura Y, Yazaki T, Uebaba K, Mutoh Y, Okada S,
et al.Comprehensive heath eduction combining hot sap bathing
and lifestyle education in middle-aged and elderly women: one year
follow-up on randomised control trial of three and six month
interventions. Journal of Epidemiology 2006;16(1):35–44.
Karlehagen 2003 {published data only}
Karlehagen S, Ohlson C. Primary prevention of cardiovascular
disease by an occupational health service. Preventative Medicine
2003;37:219–25.
Kawakami 1999 {published data only}
Kawakami N, Haratani T, Iwata N, Imanaka Y, Murata K, Araki S.
Effects of mailed advice on stress reduction among employees in
Japan: a randomized controlled trial. Industrial Health 1999;37(2):
237–42. [MEDLINE: 99253130]
Ketola 2001 {published data only}
Ketola E, Makela M, Klockars M. Individualised multifactorial
lifestyle intervention trial for high-risk cardiovascular patients in
primary care. British Journal of General Practice 2001;51:291–4.
Kisioglu 2004 {published data only}
Kisioglu A, Aslan B, Ozturk M, Aykut M, Ilhan I. Improving
control of high blood pressure among middle-aged Turkish women
of low socio-economic status through public health training.
Croatian Medical Journal 2004;45(4):477–82.
Knappe 1982 {published data only}
Knappe J, Heinrich J, Duck KD. On the efficacy of a programme
of the prevention of cardio-vascular diseases [Zur Wirksamkeit
eines Präventionsprogramms gegen Herz–Kreislauf–Krankheiten].
Zeitschrift für die Gesamte Innere Medizin und Ihre Grenzgebiete
1982;37(19):633–41. [EMBASE: 83029552]
Ko 2004 {published data only}
Ko G. Effects of structured health education programme by a
diabetic education nurse on cardiovascular risk factors in Chinese
Type 2 diabetic patients: a 1 year prospective randomised trial.
Diabetic Medicine 2004;21:1274–9.
Kreuter 1996 {published data only}
Kreuter MW, Strecher VJ. Do tailored behavior change messages
enhance the effectiveness of health risk appraisal. Health EducationResearch 1996;11:97–105.
Lasater 1986 {published data only}
Lasater TM, Wells BL, Carleton RA, Elder JP. The role of churches
in disease prevention research studies. Public Health Reports 1986;
101(2):125–31. [MEDLINE: 86178246]
Lauritzen 1995 {published data only}
Engberg MD, Christensen B, Karlsmose B, Lous J, Lauritzen T.
General health screenings to improve cardiovascular risk profiles: a
22Multiple risk factor interventions for primary prevention of coronary heart disease (Review)
Copyright © 2011 The Cochrane Collaboration. Published by John Wiley & Sons, Ltd.

randomized controlled trial in general practice with 5 year follow-
up. Journal of Family Practice 2002;51(6):546–52.
Lauritzen T, Leboeuf-Yde C, Lunde IM, Nielsen KD. Ebeltoft
project: baseline data from a five-year randomized, controlled,
prospective health promotion study in a Danish population. British
Journal of General Practice 1995;45(399):542–7. [MEDLINE:
96104321]
Leighton 1990 {published data only}
Leighton RF, Repka FJ, Birk TJ, Lynch DJ, Bingle JF, Gohara AF,
et al.The Toledo Exercise and Diet Study. Results at 26 weeks.
Archives of Internal Medicine 1990;150(5):1016–20. [MEDLINE:
90233864]
Lindahl 1998 {published data only}
Lindahl B, Nilsson TK, Asplund K, Hallmans G. Intense
nonpharmacological intervention in subjects with multiple
cardiovascular risk factors: decreased fasting insulin levels but only
a minor effect on plasma plasminogen activator inhibitor activity.
Metabolism: Clinical & Experimental 1998;47(4):384–90.
[MEDLINE: 98209904]
Little 2004 {published data only}
Little P, Kelly J, Barnett J, Dorward M, Margetts B, Warm D.
Randomised controlled trial of dietary advice for patients with
single high blood pressure reading in primary care. BMJ 2004;328:
1054–9.
Lovibond 1986 {published data only}
Lovibond S, Birrell P, Langeluddecke P. Changing coronary heart
disease risk-factor status: the effects of three behavioural programs.
Journal of Behavioural Medicine 1986;9:414–36. [MEDLINE:
87086747]
Macdonald 1990 {published data only}
Macdonald NJ, Stark S, et al.Multiple risk factor intervention in
the prevention of coronary heart disease [abstract]. Clinical Science1990;78(Suppl 22):6P.
Martinez-Amenos 1990 {published data only}
Martínez-Amenós A, Fernández Ferré ML, Mota Vidal C, Alsina
Rocasalbas J. Evaluation of two educative models in a primary care
hypertension programme. Journal of Human Hypertension 1990;4:
362–4. [MEDLINE: 19080073; : CN–00060437]
McCance 1985 {published data only}
McCance KL, Eutropius L, Jacobs MK, Williams RR. Preventing
coronary heart disease in high-risk families. Research in Nursing &Health 1985;8(4):413–20. [MEDLINE: 86095422]
McCann 1997 {published data only}
McCann TJ, Criqui MH, Kashani IA, Sallis JF, Calfas KJ, Langer
RD, et al.A randomized trial of cardiovascular risk factor reduction:
patterns of attrition after randomization and during follow-up.
Journal of Cardiovascular Risk 1997;4(1):41–6. [MEDLINE:
7358401]
McMahon 2002 {published data only}
McMahon A, Hodgins M, Kelleher C. Feasibility of a men’s health
promotion programme in Irish primary care. Irish Journal ofMedical Science 2002;171(1):20–3.
Meimanaliev 1991 {published data only}
Meimanaliev T, Shleifer E, Aitbaev K, Aitmurzaeva G, Gilfanova V,
Podgurskaya L, et al.Prevalence of ischaemic heart disease risk
factors among the male population in Frunze aged 40-59 years and
results of a five-year prevention programme. Cor et Vasa 1991;33:
451–7. [MEDLINE: 93114001]
Miemanaliev 1993 {published data only}
Meimanaliev T, Oteva E, Aitbaev K, Maslennikov A, Nikolaeva A,
Shterental I, et al.Prevalence of main risk factors among probands
with a history of early myocardial infarction and their relatives.
Terapevticheskii Arkhiv 1993;65:28–30. [MEDLINE: 94310516]
Miller 2002 {published data only}
Miller E, Erlinger T, Young D, Jehn M, Charleston J, Rhodes D, et
al.Results of diet, exercise, and weight loss intervention trial (DEW-
IT). Hypertension 2002;40:612–18.
Murray 1986 {published data only}
Murray DM, Luepker RV, Pirie PL, Grimm RH Jr, Bloom E, Davis
MA, et al.Systematic risk factor screening and education: a
community-wide approach to prevention of coronary heart disease.
Preventive Medicine 1986;15(6):661–72. [MEDLINE: 87092202]
Nieman 2002 {published data only}
Nieman D, Brock D, Butterworth D, Utter A, Nieman CC.
Reducing diet and/or exercise training decreases the lipid and
lipoprotein risk factors of moderately obese women. Journal of the
American College of Nutrition 2002;21(4):344–50.
Nikitin 1991 {published data only}
Nikitin Y, Bondareva Z, Oteva E, Filimonova T. Serum lipid
composition in healthy subjects and patients of senile age and long
livers. Klinicheskaya Meditsina 1991;69:32–5.
Nisbeth 2000 {published data only}
Andersen L, Klausen K, Nisbeth O. One-year effect of health
counselling on life-style and risk factors for heart disease [Et ars
effekt af sundhedsvejledning pa livsstil og risikofaktorer for
hjertesygdom]. Ugeskfrift For Laeger 2002;164(13):1814–9.
Nisbeth O, Klausen K, Andersen LB. Effectiveness of counselling
over 1 year on changes in lifestyle and coronary heart disease risk
factors. Patient Education and Counseling 2000;40:121–31.
Nolte 1997 {published data only}
Nolte LJ, Nowson CA, Dyke AC. Effect of dietary fat reduction
and increased aerobic exercise on cardiovascular risk factors.
Clinical and Experimental Pharmacology and Physiology 1997;24
(11):901–3. [EMBASE: 97321842]
Olivarius 2001 {published data only}
Olivarius NF, Beck-Nielsen H, Andreasen AH, Hørder M, Pedersen
PA. Randomised trial of structured personal care of type 2 diabetes
mellitus. BMJ 2001;232:1–9.
Ostwald 1989 {published data only}
Ostwald SK. Changing employees’ dietary and exercise practices:
an experimental study in a small company. Journal of OccupationalMedicine 1989;31:90–7. [MEDLINE: 89216114]
OXCHECK 2003 {published data only}
Hillsdon M, Thorogood M, Murphy M, Jones L. Can a simple
measure of vigorous physical activity predict future mortality?
Results from the OXCHECK study. Public Health Nutrition 2003;
7(4):557–62.
Parker 2005 {published data only}
Parker D, Evangelou E, Eaton C. Intraclass correlation co-efficients
for cluster randomised trials in primary care: the cholesterol
23Multiple risk factor interventions for primary prevention of coronary heart disease (Review)
Copyright © 2011 The Cochrane Collaboration. Published by John Wiley & Sons, Ltd.
education and research trial. Contemporary Clinical Trials 2005;26:
260–7.
Patterson 1988 {published data only}
Patterson T, Sallis J, Nader P, Rupp J, McKenzie T, Roppe B, et
al.Direct observation of physical activity and dietary behaviours in a
structured environment: effects of a family-based health promotion
program. Journal of Behavioural Medicine 1988;11:447–58.
[MEDLINE: 89178617]
Persson 1996 {published data only}
Persson J, Israelsson B, Stavenow L, Holmstrom E, Berglund G.
Progression of atherosclerosis in middle-aged men: effects of
multifactorial intervention. Journal of Internal Medicine 1996;239:
425–33.
Pierce 1984 {published data only}
Pierce J, Watson D, Knightsm S, Gliddon T, Williams S, Watson R.
A controlled trial of health education in the physician’s office.
Preventive Medicine 1984;13:185–4. [MEDLINE: 84247961]
Pora 2005 {published data only}
Pora V, Farrell B, Dolovich L, Kaczorowski J. Promoting
cardiovascular health among older adults. CPJ/RCP 2005;138(7):
50–5.
PREMIER 2006 {published data only}
Elmer P, Obarzanek E, Vollmer W, Simons-Morton D, Stevens VJ,
Young DR, et al.Effects of comprehensive lifestyle modification on
diet, weight, physical fitness, and blood pressure control: 18 month
results of a randomised trial. Annals of Internal Medicine 2006;144:
485–95.
Svetkey L, Erlinger T, Vollmer W, Feldstein A, Cooper LS, Appel
LJ, et al.Effect of lifestyle modifications on blood pressure by race,
sex, hypertension status and age. Journal of Human Hypertension
2005;19:21–31.
Svetkey L, Harsha D, Vollmer W, Stevens V, Obarzanek E, Elmer
PJ, et al.PREMIER: a clinical trial of comprehensive lifestyle
modification for blood pressure control: rational, design and
baseline characteristics. Annals of Epidemiology 2003;13:462–71.
Pritchard 2002 {published data only}
Pritchard J, Nowson C, Billington T, Wark J. Benefits of a year long
workplace weight loss program on cardiovascular risk factors.
Nutrition and Diet 2002;59:87–96.
Reid 1995 {published data only}
Reid C, McNeil JJ, Williams F, Powles J. Cardiovascular risk
reduction: a randomized trial of two health promotion strategies
for lowering risk in a community with low socioeconomic status.
Journal of Cardiovascular Risk 1995;2(2):155–63. [MEDLINE:
95330659]
Robson 1989 {published data only}
Robson J, Boomla K, Fitzpatrick S, Jewell A, Taylor J, Self J, et
al.Using nurses for preventive activities with computer assisted
follow-up: a randomised controlled trial. BMJ 1989;298:433–6.
[MEDLINE: 89194461]
Rosamond 2000 {published data only}
Rosamond WD, Ammerman AS, Holliday JL, Tawney KW, Hunt
KJ, Keyserling TC, et al.Cardiovascular disease risk factor
intervention in low-income women: the North Carolina
WISEWOMAN project. Preventive Medicine 2000;31(4):370–9.
Rothman 2004 {published data only}
Rothman R, DeWalt D, Malone R, et al.Diabetes disease
management program is more effective for patients with low
literacy. JAMA 2004;11(12):752–3.
Rothman R, Malone R, Bryant B, Shintani A, et al.A randomised
trial of a primary care-based disease management program to
improve cardiovascular risk factors and glycated hemoglobin level
in patients with diabetes. American Journal of Medicine 2005;118:
279–84.
Rowland 1994 {published data only}
Rowland L, Dickinson EJ, Newman P, Ford D, Ebrahim S. Look
After Your Heart programme: impact on health status, exercise
knowledge, attitudes, and behaviour of retired women in England.
Journal of Epidemiology & Community Health 1994;48:123–8.
[MEDLINE: 94246321]
S-E London 1977 {published data only}
South East London Screening Study Group. A controlled trial of
multiphasic screening in middle-age: results of the South-East
London Screening Study. International Journal of Epidemiology1977;6:357–63. [MEDLINE: 78129309]
Sarraf-Zadegan 2003 {published data only}
Sarraf-Zadegan N, Sadri G, Malek-Afzali H, Baghaei M,
Mohammadi Fard N, Shahrokhi S, et al.Isfahan healthy heart
programme:a comprehensive integrated community based
programme for cardiovascular disease prevention and control. ActaCardiology 2003;58(4):309–20.
Schwandt 1999 {published data only}
Ohrig E, Geib HC, Haas G-M, Schwandt P. The Prevention
Education Program (PEP) Nuremberg: design and baseline data of
a family oriented intervention study. International Journal of Obesity
2001;25(Suppl 1):S89–S92.
Schwandt P, Geiss HC, Ritter MM, Ublacker C, Parhofer KG,
Otto C, et al.The prevention education program (PEP). A
prospective study of the efficacy of family-oriented life style
modification in the reduction of cardiovascular risk and disease:
design and baseline data. Journal of Clinical Epidemiology 1999;52
(8):791–800. [MEDLINE: 99392993]
Schwedes 2002 {published data only}
Schwedes U, Siebolds M, Mertes G. Meal related structured self
monitoring of blood glucose. Diabetes Care 2002;25(11):1928–32.
Smith 1991 {published data only}
Smith K, McKinlay S. The validity of health risk appraisals for
coronary heart disease: results from a randomized field trial.
American Journal of Public Health 1991;81:466–70. [MEDLINE:
91166020]
Steinbach 1982 {published data only}
Steinbach M, Constantineanu M, Harnagea P, Theodorini S,
Georgescu M, Mitu S, et al.The Bucharest Multifactorial
Prevention Trial. The changes of morbidity and of general and
specific mortality. Revue Roumaine de Medecine - Medicine Interne1982;20:197–208. [MEDLINE: 83119593]
Strandberg 2001 {published data only}
Strandberg T, Pitkala K, Berglind S, Nieminen M, Tilvis RS, et
al.Multi-factorial cardiovascular disease prevention in patients aged
75 and older: a randomised controlled trial. American Heart
Journal 2001;142:945–51.
24Multiple risk factor interventions for primary prevention of coronary heart disease (Review)
Copyright © 2011 The Cochrane Collaboration. Published by John Wiley & Sons, Ltd.

TOMHS 1991 {published data only}
No authors listed. The treatment of mild hypertension study. A
randomized, placebo-controlled trial of a nutritional-hygienic
regimen along with various drug monotherapies. The Treatment of
Mild Hypertension Research Group. Archives of Internal Medicine
1991;151(7):1413–23. [MEDLINE: 91290967]
TONE 1998 {published data only}
Whelton PK, Appel LJ, Espeland MA, Applegate WB, Ettinger WH
Jr, Kostis JB. Sodium reduction and weight loss in the treatment of
hypertension in older persons: a randomized controlled trial of
nonpharmacologic interventions in the elderly (TONE). TONE
Collaborative Research Group. JAMA 1998;279(11):839–46.
Tonstad 2005 {published data only}
Tonstad S, Sundfar T, Seljeflot I. Effect of lifestyle changes on
atherogenic lipids and endothelial cell adhesion molecules in young
adults with familial premature coronary heart disease. American
Journal of Cardiology 2005;95:1187–91.
Tsuyuki 1999 {published data only}
Tsuyuki RT, Johnson JA, Teo KK, Ackman ML, Biggs RS, Cave A,
et al.Study of Cardiovascular Risk Intervention by Pharmacists
(SCRIP): a randomized trial design of the effect of a community
pharmacist intervention program on serum cholesterol risk. Annalsof Pharmacotherapy 1999;33(9):910–19. [MEDLINE: 99420238]
Van Elderen 2001 {published data only}
Van Elderen T, Dusseldorp E. Lifestyle effects of group health
education for patients with coronary heart disease. Psychology and
Health 2001;16:327–41.
Velonakis 1999 {published data only}
Velonakis E, Sourtzi P, Komitopoulos N, Ioannides J, Varsamis E. A
health promotion programme for the prevention of cardiovascular
diseases in the elderly. International Journal of Health Promotion &
Education 1999;37(1):26–9.
Volozh 1991 {published data only}
Volozh O, Saava M, Tur I, Neilinn K, Solodkaia E, Taggerluk H.
Risk factors of coronary heart disease and atherosclerosis in Tallin
inhabitants - relation of age, sex and ethnic origin. A population
study. Kardiologiia 1991;31:20–4. [MEDLINE: 92139620]
Wang 2002 {published data only}
Wang A, Seng C. Effect of non-pharmacologic treatments on early
stage of primary hypertension. Anhiu Medical Journal 2002;23(6):
7–9.
WHP 1999 {published data only}
Emmons KM, Linnan LA, Shadel WG, Marcus B, Abrams DB.
The working healthy project: a worksite health-promotion trial
targeting physical activity, diet and smoking. Journal ofOccupational and Environmental Medicine 1999;41:545–55.
Emmons KM, Shadel WG, Linnan L, Marcus BH, Abrams DB. A
prospective analysis of change in multiple risk factors for cancer.
Cancer Research Therapy & Control 1999;8(1-2):15–23.
Wisewoman 1999 {published data only}
The Wisewoman Group. Cardiovascular disease prevention for
women attending breast and cervical cancer screening programs:
the WISEWOMAN projects. Preventive Medicine 1999;28(5):
496–502. [MEDLINE: 99263097]
Witmer 2004 {published data only}
Witmer J, Hensel M, Holck P, Ammerman A, Will JC. Heart
disease prevention for Alaska native women: a review of pilot
findings. Journal of Women’s Health 2004;13(5):569–77.
Woollard 2003 {published data only}
Woollard J, Burke V, Beilin L, Verheijden M, Bulsara MK. Effects
of general practice based intervention on diet body mass index and
blood lipids in patients at cardiovascular risk. Journal ofCardiovascular Risk 2003;10:31–40.
Working Well Trial {published data only}
Abrams DB, Boutwell WB, Grizzle J, Heimendinger J, Sorensen G,
Varnes J. Cancer control at the workplace: the Working Well Trial.
Preventive Medicine 1994;23:15–27.
Wu 1999 {published data only}
Wu X, Cao T, Zhu Y. Effects of dietary pattern modification on
blood pressure over in a work site intervention program. ChineseJournal of Cardiology 1999;27(1):22–5.
Zimmerman 1996 {published data only}
Zimmerman E, Horton La Forge B. Detection and prevention of
cardiac risk factors: health risk assessment and target follow-up in a
managed care population. Journal of Cardiovascular Nursing 1996;
11(1):27–38.
References to ongoing studies
Roderigues 2005 {published data only}
Rodriguez CJJ, Benavides M F, Villaverde GC, Pena SE, Flor SF,
Trave MP, et al.Randomised clinical trial of an intensive
intervention into life-styles of patients with hyperfibrinogenaemia
in primary prevention of cardiovascular pathology in primary
health care [Ensayo clínico aleatorizado de una intervención
intensiva sobre los estilos de vida de pacientes con
hiperfibrinogenemia en prevención primaria de las enfermedades
cardiovasculares en el ámbito de la atención primaria de salud].
Atencion Primaria 2005;25(5):260–4.
Additional references
AHA 2002
Pearson TA, Blair SN, Daniels SR, Eckel RH, Fair JM, Fortmann
SP, et al.AHA Guidelines for primary prevention of cardiovascular
disease and stroke: 2002 Update: Consensus Panel guide to
comprehensive risk reduction for adult patients without coronary
or other atherosclerotic vascular diseases. American Heart
Association Science Advisory and Coordinating Committee.
Circulation 2002;106:388–91.
Appel 2004
Appel LJ. Lifestyle modification: is it achievable and durable?.
Journal of Clinical Hypertension 2004;6(10):578–81.
Asaria 2007
Asaria P, Chisholm D, Mathers C, Ezzati M, Beaglehole R. Chronic
disease prevention: health effects and financial costs of strategies to
reduce salt intake and control tobacco use. Lancet 2007;370(9604):
2044–53.
Bejot 2007
Bejot Y, Giroud M, Rouaud O, Benatru I, Moreau T, Freycz M, et
al.Trends in stroke incidence and case-fatality rates over a 20-year
25Multiple risk factor interventions for primary prevention of coronary heart disease (Review)
Copyright © 2011 The Cochrane Collaboration. Published by John Wiley & Sons, Ltd.
period (1985-2004) in Dijon, France. Bulletin de l’Académie
Nationale de Médecine 2007;191(2):305–22.
Ben-Shlomo 1994
Ben-Shlomo Y, Davey Smith G, Shipley M, Marmot MG. What
determines mortality risk in male former cigarette smokers?.
American Journal of Public Health 1994;84:1235–42. [MEDLINE:
94337886]
Berglund 2000
Berglund G, Nilsson P, Eriksson KF, Nilsson JA, Hedblad B,
Kristenson H, et al.Long-term outcome of the Malmo preventive
project: mortality and cardiovascular morbidity. Journal of Internal
Medicine 2000;247:19–29.
Brunner 1997
Brunner E, White I, Thorogood M, Bristow A, Curle D, Marmot
MG. Can dietary interventions in the population change diet and
cardiovascular risk factors? An assessment of effectiveness utilising a
meta-analysis of randomized controlled trials. American Journal ofPublic Health 1997;87:1451–22. [MEDLINE: 97460408]
Callow 2006
Callow AD. Cardiovascular disease 2005 - the global picture.
Vascular Pharmacology 2006;45(5):302–7.
Collins 1994
Collins R, MacMahon S. Blood pressure, antihypertensive drug
treatment and the risks of stroke and coronary heart disease. British
Medical Bulletin 1994;50:272–98. [MEDLINE: 94265072]
Cook 1986
Cook D, Shaper AG, Pocock S, Kussick S. Giving up smoking and
the risk of heart attacks. Lancet 1986;ii:1376–80. [MEDLINE:
87063071]
CTT 2005
Cholesterol Treatment Trialists (CTT) Collaborators. Efficacy and
safety of cholesterol-lowering treatment: prospective meta-analysis
of data from 90,056 participants in 14 randomised trials of statins.
Lancet 2005;366:1267–78.
Davey Smith 1993
Davey Smith G, Song S, Sheldon T. Cholesterol lowering and
mortality: the importance of considering initial level of risk. BMJ
1993;306:1367–73. [MEDLINE: 93299182]
Davey Smith 1994
Davey Smith G, Egger M. Who benefits from medical
interventions?. BMJ 1994;308:72–4. [MEDLINE: 94129335]
Davey Smith 2005
Davey Smith G, Bracha Y, Svendsen KH, Neaton JD, Haffner SM,
Kuller LH for the Multiple Risk Factor Intervention Trial.
Incidence of type 2 diabetes in the randomized multiple risk factor
intervention trial. Annals of Internal Medicine 2005;142:313–22.
Daviglus 2006
Daviglus ML, Lloyd-Jones DM, Pirzada A. Preventing
cardiovascular disease in the 21st Century: therapeutic and
preventive implications of current evidence. American Journal ofCardiovascular Drugs 2006;6(2):87–101.
Dickersin 1994
Dickersin K, Scherer R, Lefebvre C. Identifying relevant studies for
systematic reviews. BMJ 1994;309:1286–91.
DiClemente 1991
DiClemente CC, Prochaska J, Fairhurst S, Velicer W, Velasques M,
Rossi J. The process of smoking cessation: an analysis of
precontemplation, contemplation and preparation stages of change.
Journal of Consulting & Clinical Psychology 1991;59:295–304.
[MEDLINE: 91251570]
Ebrahim 2001
Ebrahim S, Davey Smith GD. Exporting failure? Coronary heart
disease and stroke in developing countries. International Journal ofEpidemiology 2001;30:201–5.
Ebrahim 2008
Ebrahim S. Chronic diseases and calls to action. International
Journal of Epidemiology 2008;37(2):225–30.
Editorial 1982a
Editorial. Trials of coronary heart disease prevention. Lancet 1982;
ii:803–4. [MEDLINE: 83011769]
Editorial 1982b
Editorial. Coronary disease and multiple-risk factor intervention.
Lancet 1982;i:1395. [MEDLINE: 82218589]
Editorial 1984
Editorial. Double first in Wales. BMJ 1984;289:514–15.
[MEDLINE: 84281652]
Egger 1995
Egger M, Davey Smith G. Risks and benefits of treating mild
hypertension: a misleading meta-analysis?. Journal of Hypertension1995;13:813–15. [MEDLINE: 96039411]
Ellekjaer 2007
Ellekjaer H, Selemer R. Stroke similar incidence, better prognosis.
Tidsskr Nor Laegeforen 2007;127(6):740–3.
European Task Force 2007
Graham I, Atar D, Borch-Johnsen K, Boysen G, Burell G, Cifkova
R, et al.European guidelines on cardiovascular disease prevention in
clinical practice: full text. Fourth Joint Task Force of the European
Society of Cardiology and other societies on cardiovascular disease
prevention in clinical practice (constituted by representatives of nine
societies and by invited experts). European Journal of CardiovascularPrevention and Rehabilitation 2007;14(Suppl 2):S1–113.
Fang 2007
Fang J, Alderman MH, Keenan NL, Croft JB. Declining US Stroke
Hospitalization since 1997: National Hospital Discharge Survey,
1988-2004. Neuroepidemiology 2007;29:243–9.
Farquhar 1977
Farquhar J, Wood P, Breitrose H, Haskell W, Meyer A, MacCoby
N, et al.Community education for cardiovascular health. Lancet1977;i:1192–5. [MEDLINE: 77191418]
Farquhar 1990
Farquhar J, Fortmann S, Flora J, Taylor B, Haskell W, Williams P,
et al.Effects of communitywide education on cardiovascular disease
risk factors. The Stanford Five-City Project. JAMA 1990;264:
359–65. [MEDLINE: 90300579]
Fortmann 1993
Fortmann S, Barr Taylor C, Flora J, Jatulis D. Changes in adult
cigarette smoking prevalence after 5 years of community health
education: the Stanford Five-City Project. American Journal of
Epidemiology 1993;137:82–96. [MEDLINE: 93167232]
26Multiple risk factor interventions for primary prevention of coronary heart disease (Review)
Copyright © 2011 The Cochrane Collaboration. Published by John Wiley & Sons, Ltd.

Higgins 2008
Higgins JPT, Green S (editors). Cochrane Handbook for
Systematic Reviews of Interventions Version 5.0.2 [updated
September 2009]. The Cochrane Collaboration, 2008. Available
from www.cochrane-handbook.org.
Kickbush 1988
Kickbush I. Report on the Adelaide Conference. Healthy public
policy. 2nd International Conference on Health Promotion. 1988.
Lefebvre 1996
Lefebvre C, McDonald S. Development of a sensitive search
strategy for reports of randomised controlled trials in EMBASE.
Fourth International Cochrane Colloquium 20-24 Oct, Adelaide,
Australia. 1996.
Levi 2002
Levi F, Lucchini F, Negri E, La Vecchaia C. Trends in mortality
from cardiovascular and cerebrovascular diseases in Europe and
other areas of the world. Heart 2002;88:119–24.
Lim 2007
Lim SS, Gaziano TA, Gakidou E, Reddy KS, Farzadfar F, Lozano
R, et al.Prevention of cardiovascular disease in high-risk individuals
in low-income and middle-income countries: health effects and
costs. Lancet 2007;370(9604):2054–62.
Little 2004
Little P, Kelly J, Barnett J, Dorward M, Margetts B, Warm D.
Randomised controlled factorial trial of dietary advice for patients
with a single high blood pressure reading in primary care. BMJ2004;328:1054–9.
Luepker 1996
Luepker RV, Rastam L, Hanham PJ, Murray DM, Gray C.
Community education for cardiovascular disease prevention:
morbidity and mortality results from the Minnesota Heart Health
Programme. American Journal of Epidemiology 1996;144:351–62.
[MEDLINE: 96316780]
McCormick 1988
McCormick J, Skrabanek P. Coronary heart disease is not
preventable by population interventions. Lancet 1988;ii:839–41.
[MEDLINE: 89013414]
Meichenbaum 1993
Meichenbaum D. Changing conceptions of cognitive behavior
modification: retrospect and prospect. Journal of Consulting andClinical Psychology 2001;61(2):210–5.
MRFITRG 1990
Multiple Risk Factor Intervention Trial Research Group. Mortality
rates after 10.5 years for participants in the multiple risk factor
intervention trial. Findings related to a priori hypotheses of the
trial. JAMA 1990;263:1795–801. [MEDLINE: 90189406]
Mullen 1992
Mullen PD, Mains DA, Velez R. A meta analysis of controlled trials
of cardiac education. Patient Education Counselling 1992;19:
143–62. [MEDLINE: 93234317]
Mulrow 1995
Mulrow CD, Cornell JA, Herrera CR, Kadri A, Farnett L, Aguilar
C. Hypertension in the elderly: implications and generalizability of
randomized trials. JAMA 1995;272:1932–8. [MEDLINE:
95082133]
NSF-CHD 2000
Department of Health. National Service Framework for coronaryheart disease: modern standards and service models. London:
Department of Health, 2000.
NSF-CHD 2006
Department of Health. The coronary heart disease national service
framework: shaping the future - progress report for 2006. http://
www.doh.gov.uk/en/Publicationsandstatistics/Publications/
PublicationsPolicyAndGuidance/DH˙063168 (accessed 27
October 2010).
O’Connor 1989
O’Connor GT, Buring JE, Yusuf S, Goldhaber S, Olmstead E,
Pafenbarger R, et al.An overview of randomized trials of
rehabilitation with exercise after myocardial infarction. Circulation
1989;80:234–44. [MEDLINE: 89324326]
Oldridge 1988
Oldridge NB, Guyatt GH, Fischer ME, Rimm AA. Cardiac
rehabilitation after myocardial infarction. Combined experience of
randomized clinical trials. JAMA 1988;260:945–50. [MEDLINE:
88286972]
Pearson 1993
Pearson T, Jamison D, Trejo-Gutierrez J. Cardiovascular Disease.
In: Jamison D, Mosley WH, Measham A, Bobadilla J editor(s).
Disease control priorities in developing countries. Oxford: Oxford
University Press, 1993:577–94.
Pickering 2003
Pickering T. Lifestyle modification and blood pressure control: is
the glass half full or half empty?. JAMA 2003;289(16):2131–2.
Pickering 2004
Pickering TG. Lifestyle modification: is it achievable and durable?
The argument against. Journal of Clinical Hypertension 2004;6(10):
581–4.
Prochaska 1983
Prochaska JO, DiClemente CC. Stages and processes of self-change
in smoking: toward an integrative model of change. Journal ofConsulting and Clinical Psychology 1983;5:390–5.
Puska 1976
Puska P, Koskela K, Pakarinen H, Puumalainen P, Soininen V,
Tuomilehto J. The North Karelia Project: a programme for
community control of cardiovascular diseases. Scandinavian Journalof Social Medicine 1976;4:57–60. [MEDLINE: 76271039]
Puska 1981
Puska P, Tuomilehto J, Salonen J, Nissinen A, Koskela K,
Vartiainen E, et al.Community control of cardiovascular diseases. TheNorth Karelia Project. Copenhagen: World Health Organization,
1981:1–351.
Puska 1985
Puska P, Nissinen A, Tuomilehto J. The community based strategy
to prevent coronary heart disease conclusions from the ten years of
the North Karelia Project. Annual Review Public Health 1985;6:
147–93.
Rose 1992
Rose G. Chapter 4. Prevention for individuals and the “high risk”
strategy. The Strategy of Preventive Medicine. Oxford: Oxford
University Press, 1992:29–52.
27Multiple risk factor interventions for primary prevention of coronary heart disease (Review)
Copyright © 2011 The Cochrane Collaboration. Published by John Wiley & Sons, Ltd.
Scandinavian 1994
Scandinavian Simvastatin Survival Study Group. Randomised trial
of cholesterol lowering in 4444 patients with coronary heart
disease: the Scandanavian Simvastatin Survival Study (4S). Lancet1994;344:1383–9. [MEDLINE: 95057659]
Schoenberger 1990
Schoenberger J. Cardiovascular risk factors: multiple interventions
in man. Clinical and Experimental Hypertension. Part A, Theory and
Practice. 1990;A12:931–8. [MEDLINE: 91004858]
Svetkey 2005
Svetkey LP, Erlinger TP, Vollmer WM, Feldstein A, Cooper LS,
Appel LJ, et al.Effect of lifestyle modifications on blood pressure by
race, sex, hypertension status and age. Journal of HumanHypertension 2005;19:21–31.
Tudor-Smith 1998
Tudor-Smith C, Nutbeam D, Moore L, Catford J. Effects of the
Heartbeat Wales programme over five years on behavioural risks for
cardiovascular disease: quasi-experimental comparison of results
from Wales and a matched reference area. BMJ 1998;316:818–22.
Valkonen 1992
Valkonen T. Trends in regional and socio-economic mortality
differentials in Finland. International Journal of Health Sciences
1992;3:157–6.
Vartiainen 1994
Vartiainen E, Puska P, Pekkanen J, Tuomilehto J, Jousilahti P.
Changes in risk factors explain changes in mortality from ischaemic
heart disease in Finland. BMJ 1994;309:23–7. [MEDLINE:
94319202]
Vartiainen 2009
Vartiainen E, Laatikainen T, Peltonen M, Juolevi A, Männistö S,
Sundvall J, et al.Thirty-five-year trends in cardiovascular risk factors
in Finland. International Journal of Epidemiology 2009;39(2):
504–18. [DOI: 10.1093/ije/dyp330]
Wannamethee 1995
Wannamethee G, Shaper AG, Whincup P, Walker M. Smoking
cessation and the risk of stroke in middle-aged men. JAMA 1995;
274:155–60. [MEDLINE: 95319028]
West 2007
West R, Zatonski W, Przewozniak K, Jarvis MJ. Can we trust
national smoking prevalence figures? Discrepancies between
biochemically assessed and self-reported smoking rates in three
countries. Cancer Epidemiology, Biomarkers and Prevention 2007;
16:820–2.
References to other published versions of this review
Ebrahim 1997
Ebrahim S, Davey Smith G. Systematic review of randomised
controlled trials of multiple risk factor interventions for preventing
coronary heart disease. BMJ 1997;314:1666–74. [MEDLINE:
97336545]∗ Indicates the major publication for the study
28Multiple risk factor interventions for primary prevention of coronary heart disease (Review)
Copyright © 2011 The Cochrane Collaboration. Published by John Wiley & Sons, Ltd.
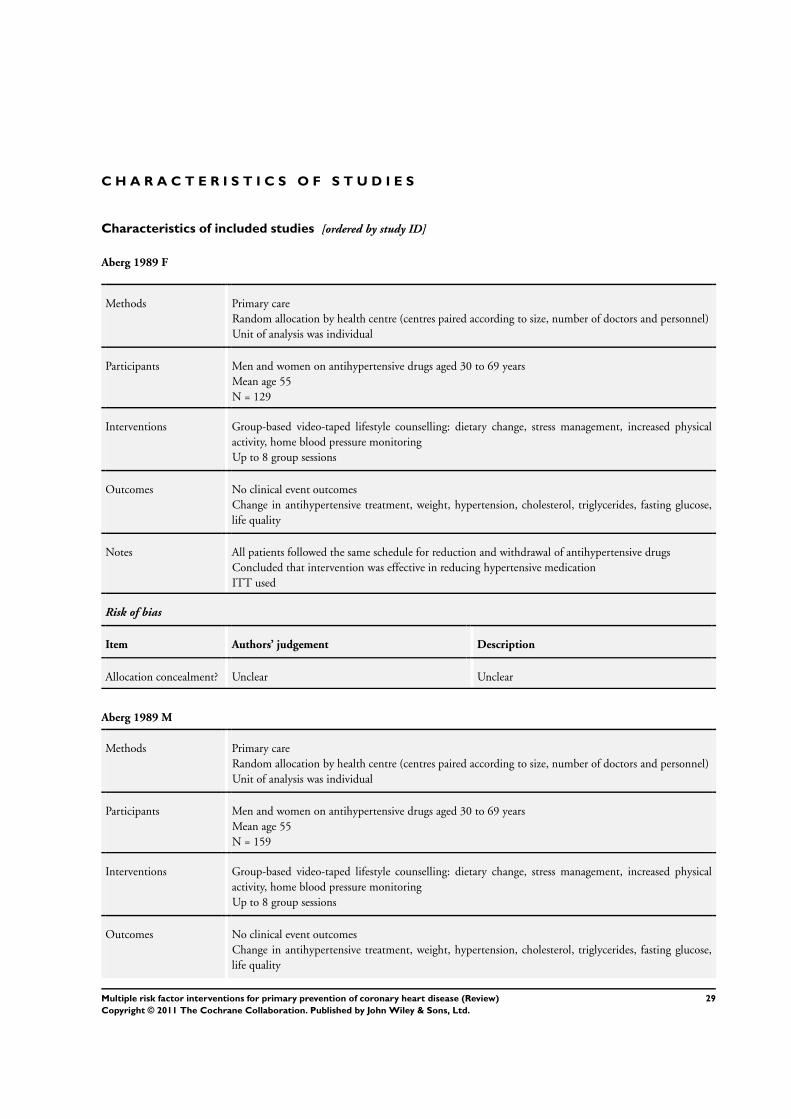
C H A R A C T E R I S T I C S O F S T U D I E S
Characteristics of included studies [ordered by study ID]
Aberg 1989 F
Methods Primary care
Random allocation by health centre (centres paired according to size, number of doctors and personnel)
Unit of analysis was individual
Participants Men and women on antihypertensive drugs aged 30 to 69 years
Mean age 55
N = 129
Interventions Group-based video-taped lifestyle counselling: dietary change, stress management, increased physical
activity, home blood pressure monitoring
Up to 8 group sessions
Outcomes No clinical event outcomes
Change in antihypertensive treatment, weight, hypertension, cholesterol, triglycerides, fasting glucose,
life quality
Notes All patients followed the same schedule for reduction and withdrawal of antihypertensive drugs
Concluded that intervention was effective in reducing hypertensive medication
ITT used
Risk of bias
Item Authors’ judgement Description
Allocation concealment? Unclear Unclear
Aberg 1989 M
Methods Primary care
Random allocation by health centre (centres paired according to size, number of doctors and personnel)
Unit of analysis was individual
Participants Men and women on antihypertensive drugs aged 30 to 69 years
Mean age 55
N = 159
Interventions Group-based video-taped lifestyle counselling: dietary change, stress management, increased physical
activity, home blood pressure monitoring
Up to 8 group sessions
Outcomes No clinical event outcomes
Change in antihypertensive treatment, weight, hypertension, cholesterol, triglycerides, fasting glucose,
life quality
29Multiple risk factor interventions for primary prevention of coronary heart disease (Review)
Copyright © 2011 The Cochrane Collaboration. Published by John Wiley & Sons, Ltd.
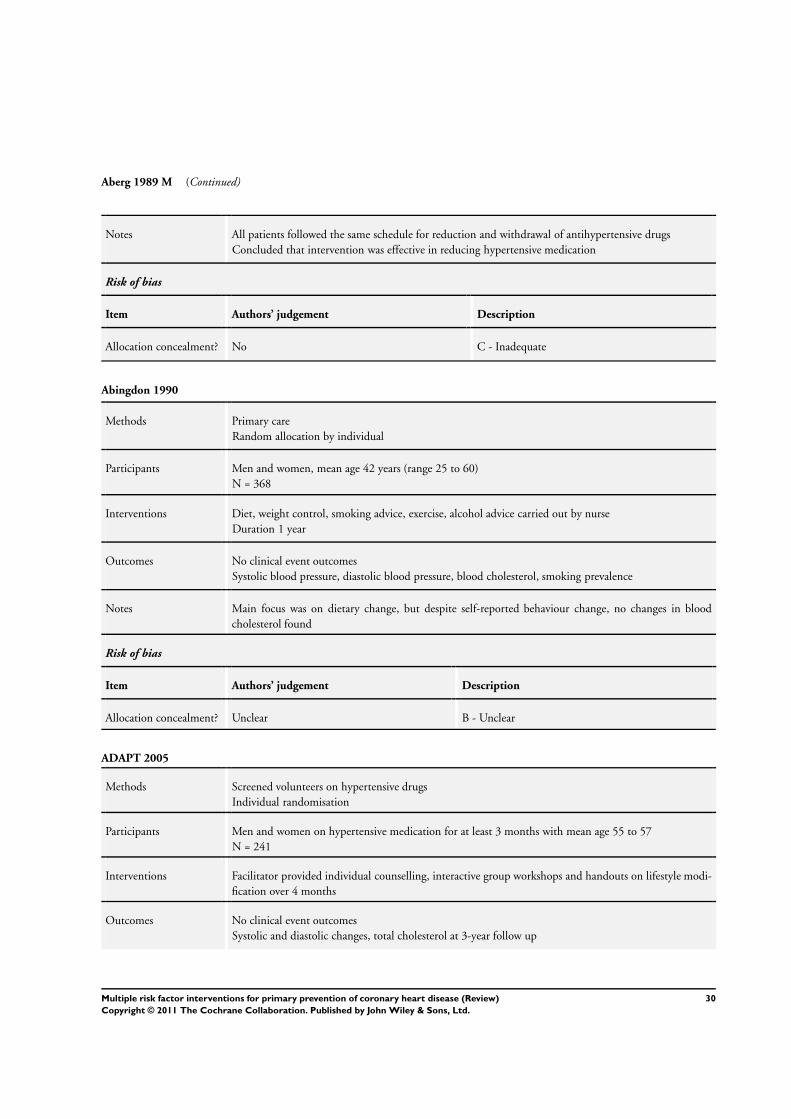
Aberg 1989 M (Continued)
Notes All patients followed the same schedule for reduction and withdrawal of antihypertensive drugs
Concluded that intervention was effective in reducing hypertensive medication
Risk of bias
Item Authors’ judgement Description
Allocation concealment? No C - Inadequate
Abingdon 1990
Methods Primary care
Random allocation by individual
Participants Men and women, mean age 42 years (range 25 to 60)
N = 368
Interventions Diet, weight control, smoking advice, exercise, alcohol advice carried out by nurse
Duration 1 year
Outcomes No clinical event outcomes
Systolic blood pressure, diastolic blood pressure, blood cholesterol, smoking prevalence
Notes Main focus was on dietary change, but despite self-reported behaviour change, no changes in blood
cholesterol found
Risk of bias
Item Authors’ judgement Description
Allocation concealment? Unclear B - Unclear
ADAPT 2005
Methods Screened volunteers on hypertensive drugs
Individual randomisation
Participants Men and women on hypertensive medication for at least 3 months with mean age 55 to 57
N = 241
Interventions Facilitator provided individual counselling, interactive group workshops and handouts on lifestyle modi-
fication over 4 months
Outcomes No clinical event outcomes
Systolic and diastolic changes, total cholesterol at 3-year follow up
30Multiple risk factor interventions for primary prevention of coronary heart disease (Review)
Copyright © 2011 The Cochrane Collaboration. Published by John Wiley & Sons, Ltd.

ADAPT 2005 (Continued)
Notes 42% loss to follow up
ITT used
No significant changes other than an increase in total cholesterol in usual care group
Risk of bias
Item Authors’ judgement Description
Allocation concealment? Yes A - Adequate
Aldana (CHIP) 2005
Methods Work site volunteers
Random allocation by individual
Participants Male and female employees mean age 46
N = 145
Interventions Lectures on diet and exercise delivered by dieticians and medical staff
Outcomes No clinical event outcomes
Systolic and diastolic BP and total cholesterol at 6-month follow up
Notes Unclear if ITT used
Study focused on increasing health knowledge
Risk of bias
Item Authors’ judgement Description
Allocation concealment? Yes A - Adequate
Applegate 1992
Methods Community screening and volunteers
Randomisation by individual
Participants Men and women aged 60 to 85 (mean age 64 to 65) with mild diastolic hypertension and modestly
overweight
N = 56
Interventions Nutritionist supervised
Individual weight loss goals, exercise and diet self-monitoring with behavioural feedback
Duration 6 months
31Multiple risk factor interventions for primary prevention of coronary heart disease (Review)
Copyright © 2011 The Cochrane Collaboration. Published by John Wiley & Sons, Ltd.
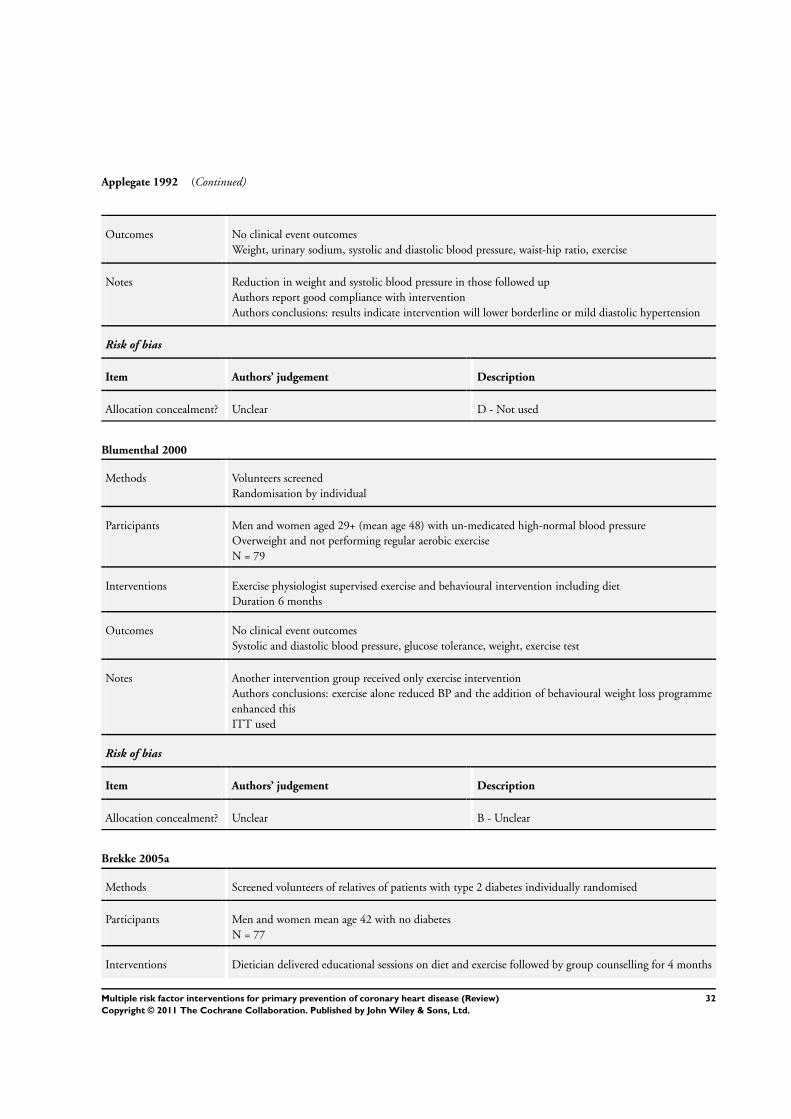
Applegate 1992 (Continued)
Outcomes No clinical event outcomes
Weight, urinary sodium, systolic and diastolic blood pressure, waist-hip ratio, exercise
Notes Reduction in weight and systolic blood pressure in those followed up
Authors report good compliance with intervention
Authors conclusions: results indicate intervention will lower borderline or mild diastolic hypertension
Risk of bias
Item Authors’ judgement Description
Allocation concealment? Unclear D - Not used
Blumenthal 2000
Methods Volunteers screened
Randomisation by individual
Participants Men and women aged 29+ (mean age 48) with un-medicated high-normal blood pressure
Overweight and not performing regular aerobic exercise
N = 79
Interventions Exercise physiologist supervised exercise and behavioural intervention including diet
Duration 6 months
Outcomes No clinical event outcomes
Systolic and diastolic blood pressure, glucose tolerance, weight, exercise test
Notes Another intervention group received only exercise intervention
Authors conclusions: exercise alone reduced BP and the addition of behavioural weight loss programme
enhanced this
ITT used
Risk of bias
Item Authors’ judgement Description
Allocation concealment? Unclear B - Unclear
Brekke 2005a
Methods Screened volunteers of relatives of patients with type 2 diabetes individually randomised
Participants Men and women mean age 42 with no diabetes
N = 77
Interventions Dietician delivered educational sessions on diet and exercise followed by group counselling for 4 months
32Multiple risk factor interventions for primary prevention of coronary heart disease (Review)
Copyright © 2011 The Cochrane Collaboration. Published by John Wiley & Sons, Ltd.
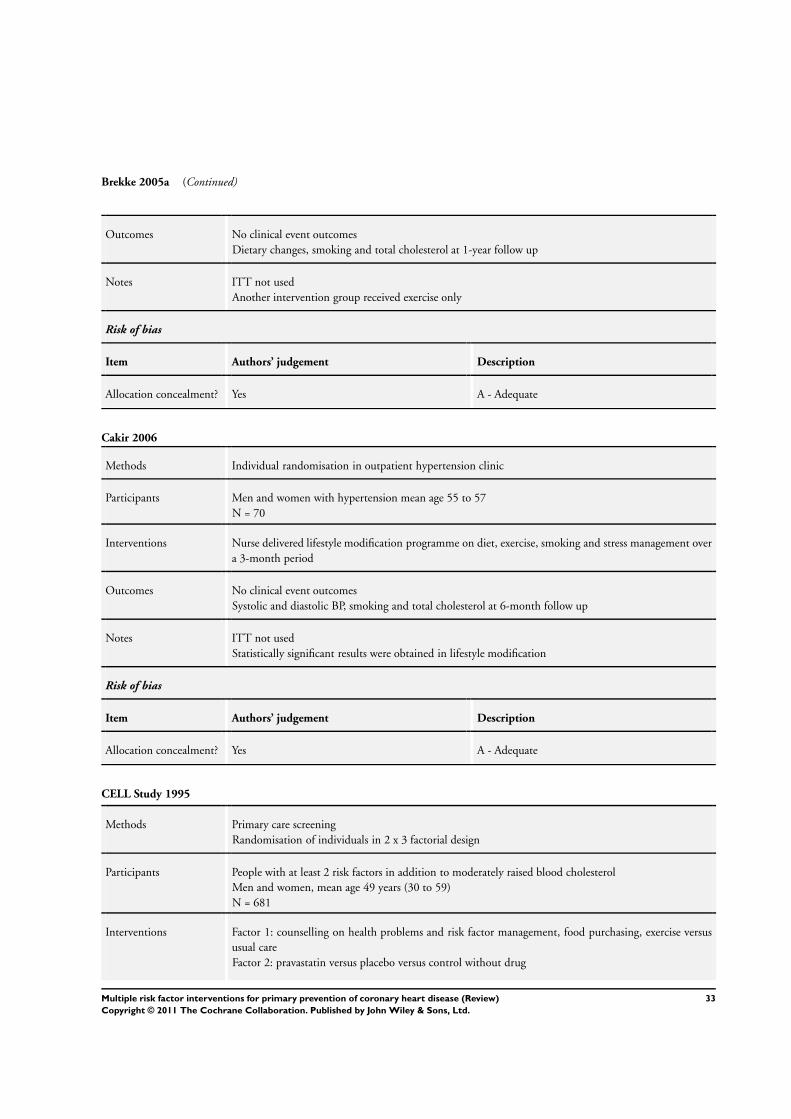
Brekke 2005a (Continued)
Outcomes No clinical event outcomes
Dietary changes, smoking and total cholesterol at 1-year follow up
Notes ITT not used
Another intervention group received exercise only
Risk of bias
Item Authors’ judgement Description
Allocation concealment? Yes A - Adequate
Cakir 2006
Methods Individual randomisation in outpatient hypertension clinic
Participants Men and women with hypertension mean age 55 to 57
N = 70
Interventions Nurse delivered lifestyle modification programme on diet, exercise, smoking and stress management over
a 3-month period
Outcomes No clinical event outcomes
Systolic and diastolic BP, smoking and total cholesterol at 6-month follow up
Notes ITT not used
Statistically significant results were obtained in lifestyle modification
Risk of bias
Item Authors’ judgement Description
Allocation concealment? Yes A - Adequate
CELL Study 1995
Methods Primary care screening
Randomisation of individuals in 2 x 3 factorial design
Participants People with at least 2 risk factors in addition to moderately raised blood cholesterol
Men and women, mean age 49 years (30 to 59)
N = 681
Interventions Factor 1: counselling on health problems and risk factor management, food purchasing, exercise versus
usual care
Factor 2: pravastatin versus placebo versus control without drug
33Multiple risk factor interventions for primary prevention of coronary heart disease (Review)
Copyright © 2011 The Cochrane Collaboration. Published by John Wiley & Sons, Ltd.
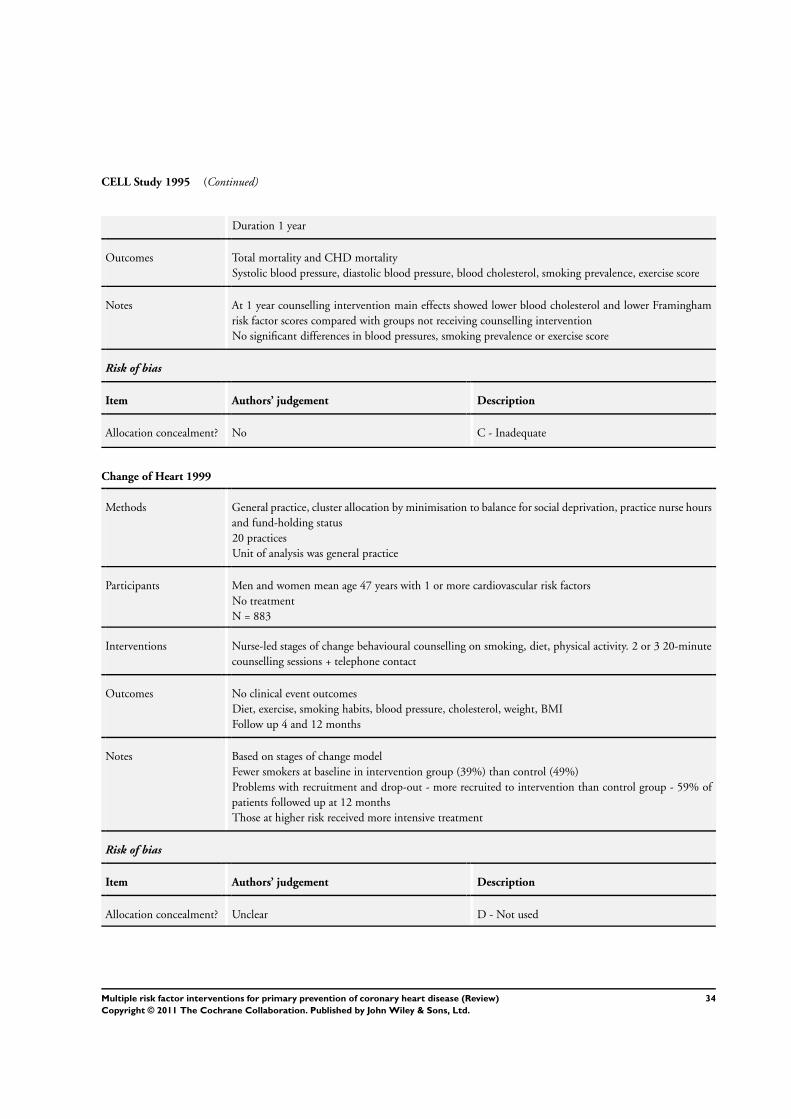
CELL Study 1995 (Continued)
Duration 1 year
Outcomes Total mortality and CHD mortality
Systolic blood pressure, diastolic blood pressure, blood cholesterol, smoking prevalence, exercise score
Notes At 1 year counselling intervention main effects showed lower blood cholesterol and lower Framingham
risk factor scores compared with groups not receiving counselling intervention
No significant differences in blood pressures, smoking prevalence or exercise score
Risk of bias
Item Authors’ judgement Description
Allocation concealment? No C - Inadequate
Change of Heart 1999
Methods General practice, cluster allocation by minimisation to balance for social deprivation, practice nurse hours
and fund-holding status
20 practices
Unit of analysis was general practice
Participants Men and women mean age 47 years with 1 or more cardiovascular risk factors
No treatment
N = 883
Interventions Nurse-led stages of change behavioural counselling on smoking, diet, physical activity. 2 or 3 20-minute
counselling sessions + telephone contact
Outcomes No clinical event outcomes
Diet, exercise, smoking habits, blood pressure, cholesterol, weight, BMI
Follow up 4 and 12 months
Notes Based on stages of change model
Fewer smokers at baseline in intervention group (39%) than control (49%)
Problems with recruitment and drop-out - more recruited to intervention than control group - 59% of
patients followed up at 12 months
Those at higher risk received more intensive treatment
Risk of bias
Item Authors’ judgement Description
Allocation concealment? Unclear D - Not used
34Multiple risk factor interventions for primary prevention of coronary heart disease (Review)
Copyright © 2011 The Cochrane Collaboration. Published by John Wiley & Sons, Ltd.
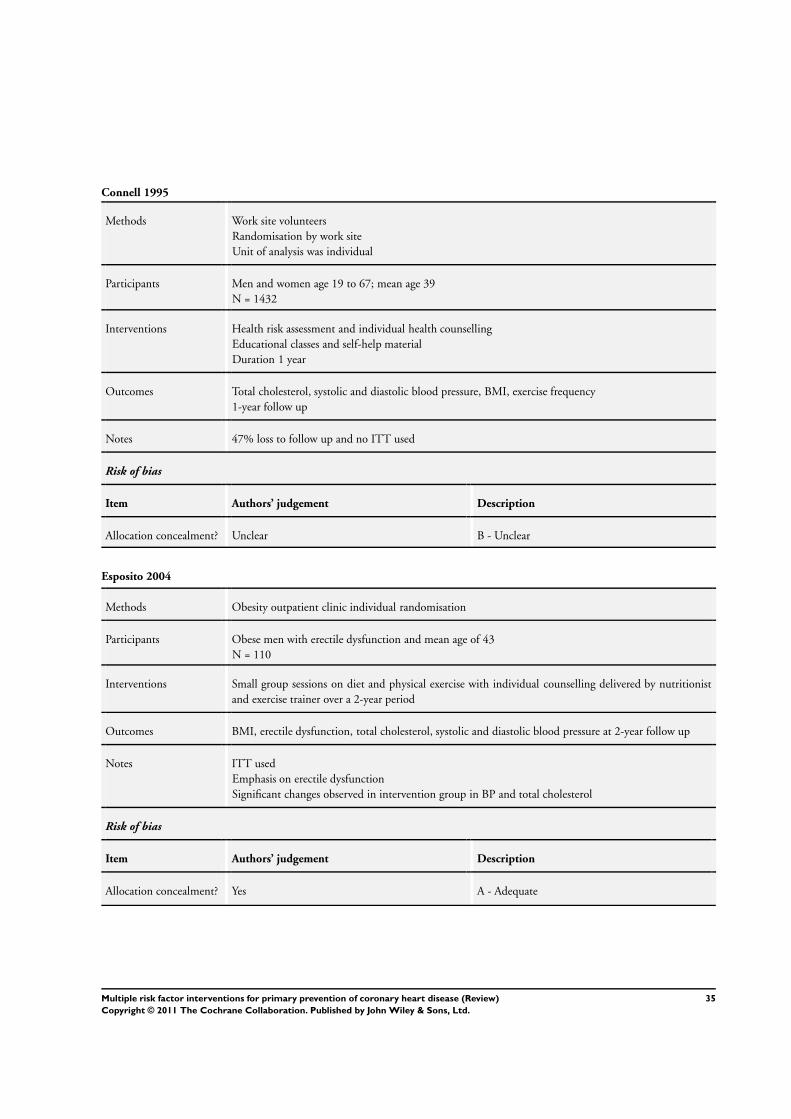
Connell 1995
Methods Work site volunteers
Randomisation by work site
Unit of analysis was individual
Participants Men and women age 19 to 67; mean age 39
N = 1432
Interventions Health risk assessment and individual health counselling
Educational classes and self-help material
Duration 1 year
Outcomes Total cholesterol, systolic and diastolic blood pressure, BMI, exercise frequency
1-year follow up
Notes 47% loss to follow up and no ITT used
Risk of bias
Item Authors’ judgement Description
Allocation concealment? Unclear B - Unclear
Esposito 2004
Methods Obesity outpatient clinic individual randomisation
Participants Obese men with erectile dysfunction and mean age of 43
N = 110
Interventions Small group sessions on diet and physical exercise with individual counselling delivered by nutritionist
and exercise trainer over a 2-year period
Outcomes BMI, erectile dysfunction, total cholesterol, systolic and diastolic blood pressure at 2-year follow up
Notes ITT used
Emphasis on erectile dysfunction
Significant changes observed in intervention group in BP and total cholesterol
Risk of bias
Item Authors’ judgement Description
Allocation concealment? Yes A - Adequate
35Multiple risk factor interventions for primary prevention of coronary heart disease (Review)
Copyright © 2011 The Cochrane Collaboration. Published by John Wiley & Sons, Ltd.
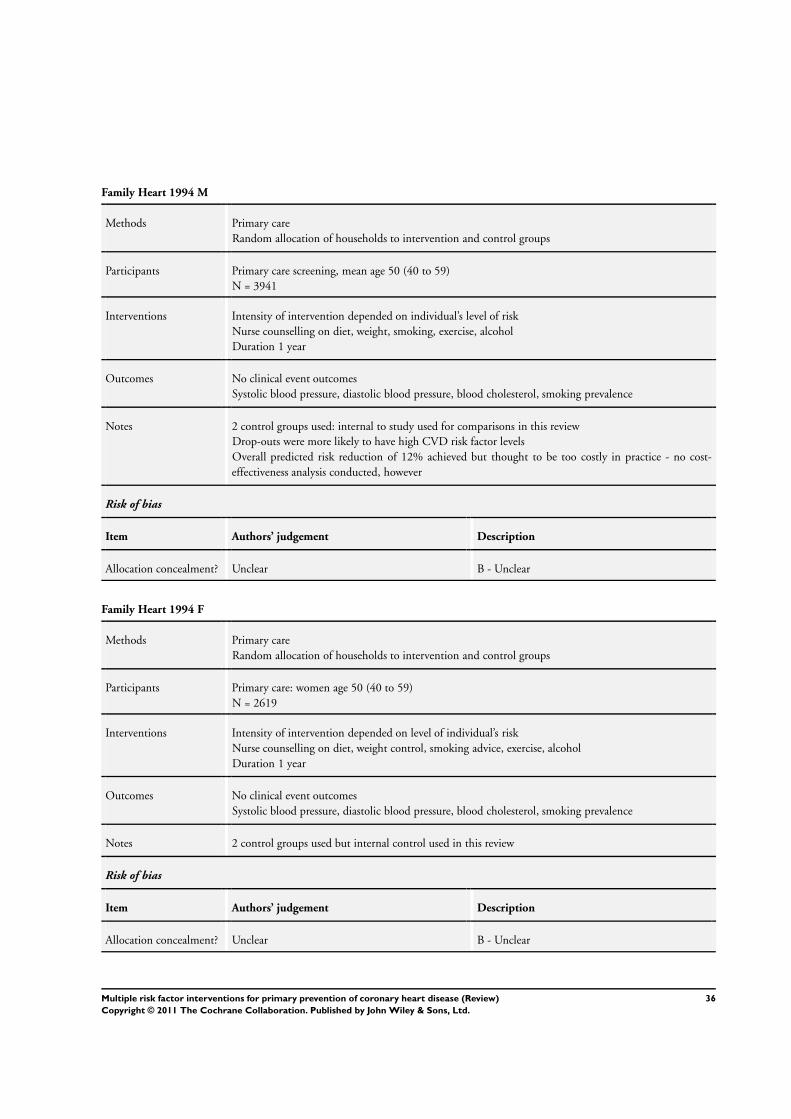
Family Heart 1994 M
Methods Primary care
Random allocation of households to intervention and control groups
Participants Primary care screening, mean age 50 (40 to 59)
N = 3941
Interventions Intensity of intervention depended on individual’s level of risk
Nurse counselling on diet, weight, smoking, exercise, alcohol
Duration 1 year
Outcomes No clinical event outcomes
Systolic blood pressure, diastolic blood pressure, blood cholesterol, smoking prevalence
Notes 2 control groups used: internal to study used for comparisons in this review
Drop-outs were more likely to have high CVD risk factor levels
Overall predicted risk reduction of 12% achieved but thought to be too costly in practice - no cost-
effectiveness analysis conducted, however
Risk of bias
Item Authors’ judgement Description
Allocation concealment? Unclear B - Unclear
Family Heart 1994 F
Methods Primary care
Random allocation of households to intervention and control groups
Participants Primary care: women age 50 (40 to 59)
N = 2619
Interventions Intensity of intervention depended on level of individual’s risk
Nurse counselling on diet, weight control, smoking advice, exercise, alcohol
Duration 1 year
Outcomes No clinical event outcomes
Systolic blood pressure, diastolic blood pressure, blood cholesterol, smoking prevalence
Notes 2 control groups used but internal control used in this review
Risk of bias
Item Authors’ judgement Description
Allocation concealment? Unclear B - Unclear
36Multiple risk factor interventions for primary prevention of coronary heart disease (Review)
Copyright © 2011 The Cochrane Collaboration. Published by John Wiley & Sons, Ltd.
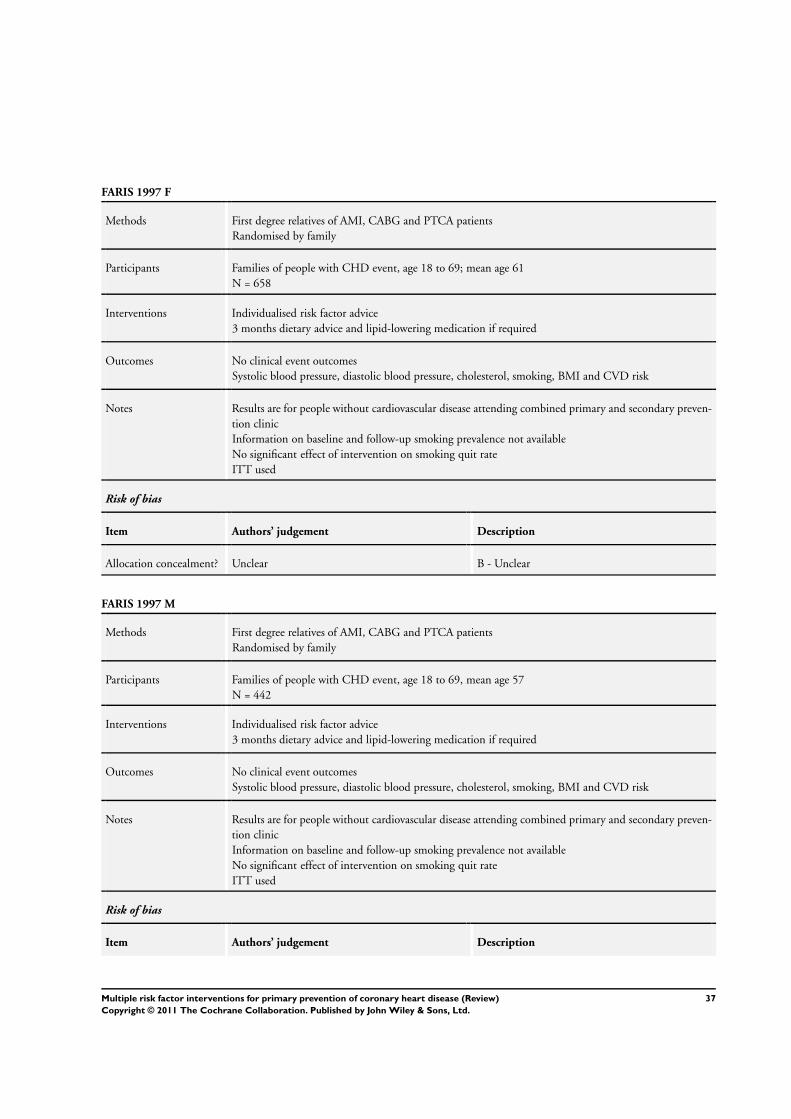
FARIS 1997 F
Methods First degree relatives of AMI, CABG and PTCA patients
Randomised by family
Participants Families of people with CHD event, age 18 to 69; mean age 61
N = 658
Interventions Individualised risk factor advice
3 months dietary advice and lipid-lowering medication if required
Outcomes No clinical event outcomes
Systolic blood pressure, diastolic blood pressure, cholesterol, smoking, BMI and CVD risk
Notes Results are for people without cardiovascular disease attending combined primary and secondary preven-
tion clinic
Information on baseline and follow-up smoking prevalence not available
No significant effect of intervention on smoking quit rate
ITT used
Risk of bias
Item Authors’ judgement Description
Allocation concealment? Unclear B - Unclear
FARIS 1997 M
Methods First degree relatives of AMI, CABG and PTCA patients
Randomised by family
Participants Families of people with CHD event, age 18 to 69, mean age 57
N = 442
Interventions Individualised risk factor advice
3 months dietary advice and lipid-lowering medication if required
Outcomes No clinical event outcomes
Systolic blood pressure, diastolic blood pressure, cholesterol, smoking, BMI and CVD risk
Notes Results are for people without cardiovascular disease attending combined primary and secondary preven-
tion clinic
Information on baseline and follow-up smoking prevalence not available
No significant effect of intervention on smoking quit rate
ITT used
Risk of bias
Item Authors’ judgement Description
37Multiple risk factor interventions for primary prevention of coronary heart disease (Review)
Copyright © 2011 The Cochrane Collaboration. Published by John Wiley & Sons, Ltd.
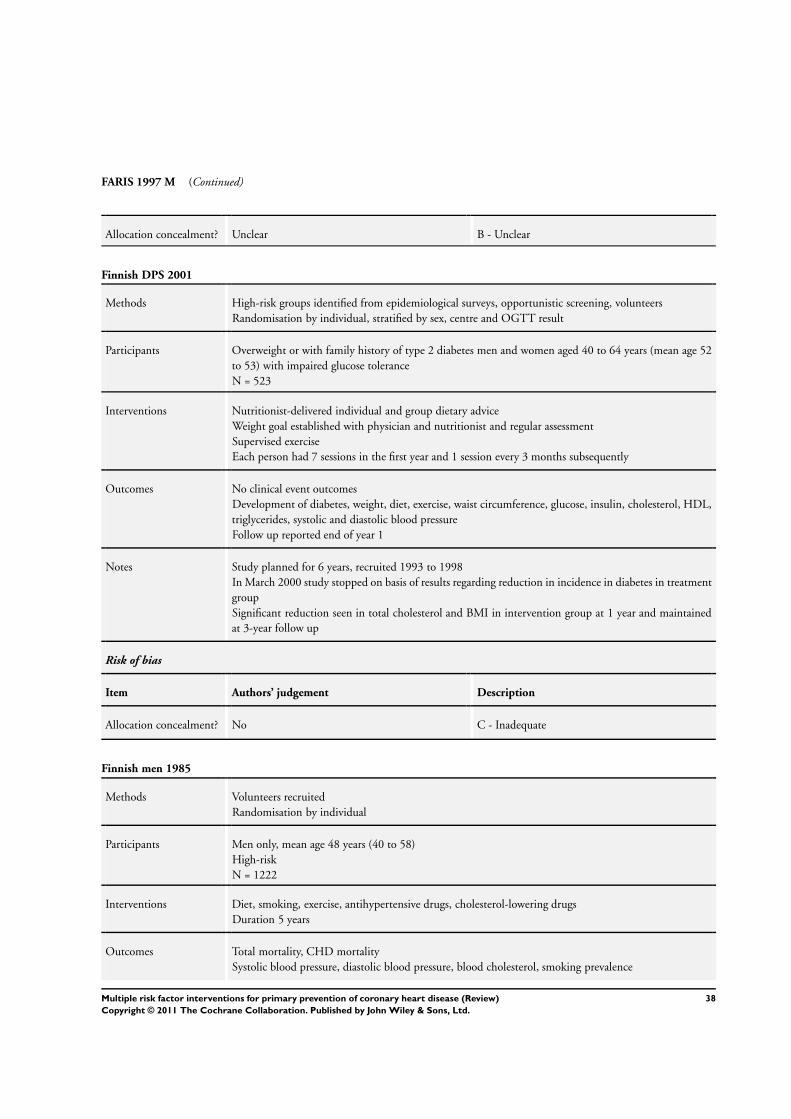
FARIS 1997 M (Continued)
Allocation concealment? Unclear B - Unclear
Finnish DPS 2001
Methods High-risk groups identified from epidemiological surveys, opportunistic screening, volunteers
Randomisation by individual, stratified by sex, centre and OGTT result
Participants Overweight or with family history of type 2 diabetes men and women aged 40 to 64 years (mean age 52
to 53) with impaired glucose tolerance
N = 523
Interventions Nutritionist-delivered individual and group dietary advice
Weight goal established with physician and nutritionist and regular assessment
Supervised exercise
Each person had 7 sessions in the first year and 1 session every 3 months subsequently
Outcomes No clinical event outcomes
Development of diabetes, weight, diet, exercise, waist circumference, glucose, insulin, cholesterol, HDL,
triglycerides, systolic and diastolic blood pressure
Follow up reported end of year 1
Notes Study planned for 6 years, recruited 1993 to 1998
In March 2000 study stopped on basis of results regarding reduction in incidence in diabetes in treatment
group
Significant reduction seen in total cholesterol and BMI in intervention group at 1 year and maintained
at 3-year follow up
Risk of bias
Item Authors’ judgement Description
Allocation concealment? No C - Inadequate
Finnish men 1985
Methods Volunteers recruited
Randomisation by individual
Participants Men only, mean age 48 years (40 to 58)
High-risk
N = 1222
Interventions Diet, smoking, exercise, antihypertensive drugs, cholesterol-lowering drugs
Duration 5 years
Outcomes Total mortality, CHD mortality
Systolic blood pressure, diastolic blood pressure, blood cholesterol, smoking prevalence
38Multiple risk factor interventions for primary prevention of coronary heart disease (Review)
Copyright © 2011 The Cochrane Collaboration. Published by John Wiley & Sons, Ltd.
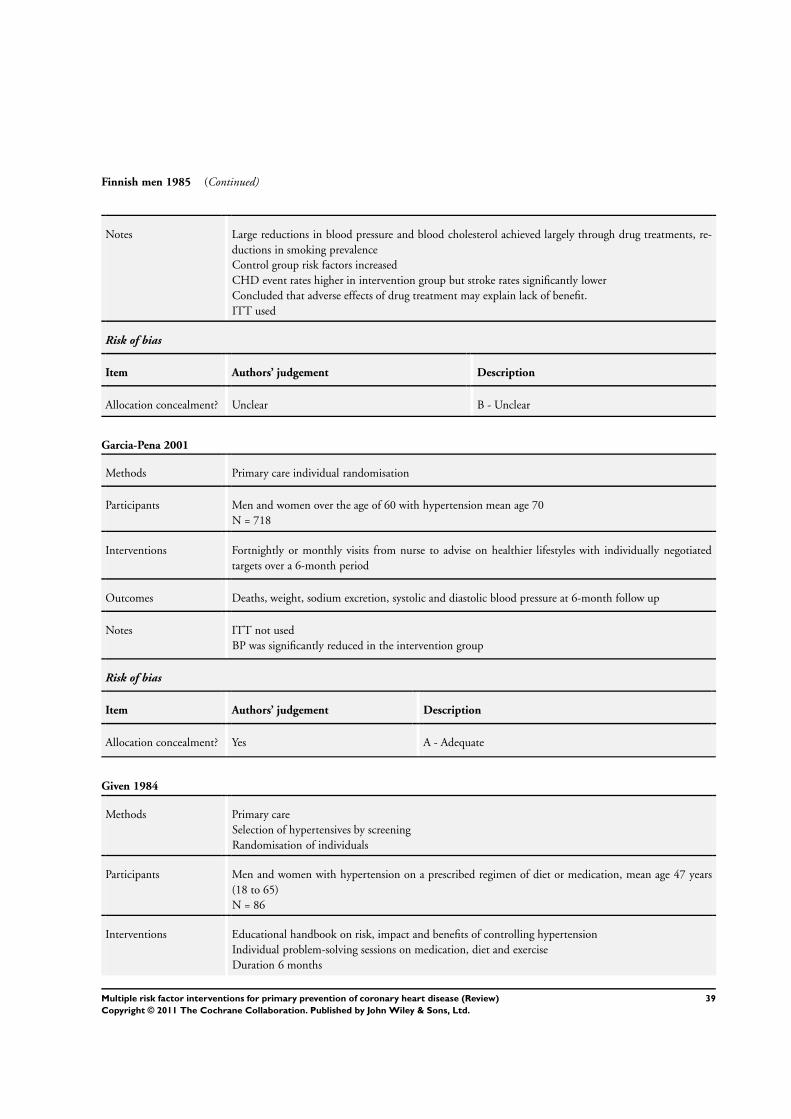
Finnish men 1985 (Continued)
Notes Large reductions in blood pressure and blood cholesterol achieved largely through drug treatments, re-
ductions in smoking prevalence
Control group risk factors increased
CHD event rates higher in intervention group but stroke rates significantly lower
Concluded that adverse effects of drug treatment may explain lack of benefit.
ITT used
Risk of bias
Item Authors’ judgement Description
Allocation concealment? Unclear B - Unclear
Garcia-Pena 2001
Methods Primary care individual randomisation
Participants Men and women over the age of 60 with hypertension mean age 70
N = 718
Interventions Fortnightly or monthly visits from nurse to advise on healthier lifestyles with individually negotiated
targets over a 6-month period
Outcomes Deaths, weight, sodium excretion, systolic and diastolic blood pressure at 6-month follow up
Notes ITT not used
BP was significantly reduced in the intervention group
Risk of bias
Item Authors’ judgement Description
Allocation concealment? Yes A - Adequate
Given 1984
Methods Primary care
Selection of hypertensives by screening
Randomisation of individuals
Participants Men and women with hypertension on a prescribed regimen of diet or medication, mean age 47 years
(18 to 65)
N = 86
Interventions Educational handbook on risk, impact and benefits of controlling hypertension
Individual problem-solving sessions on medication, diet and exercise
Duration 6 months
39Multiple risk factor interventions for primary prevention of coronary heart disease (Review)
Copyright © 2011 The Cochrane Collaboration. Published by John Wiley & Sons, Ltd.
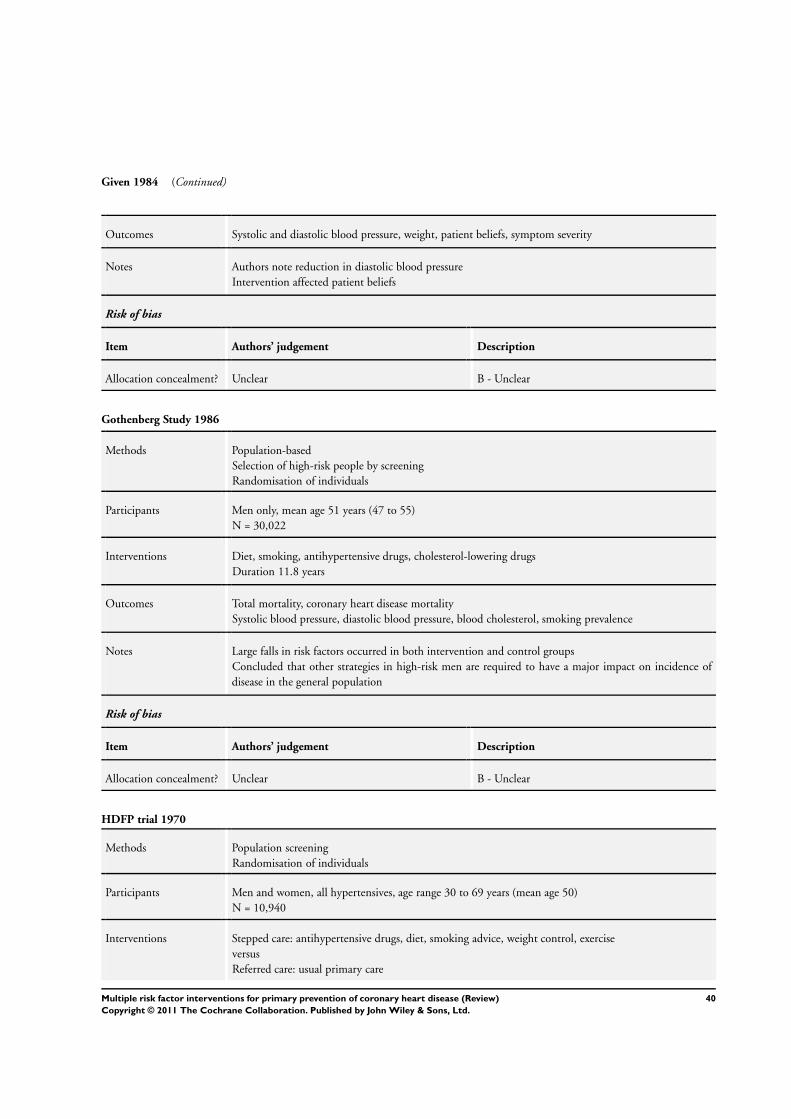
Given 1984 (Continued)
Outcomes Systolic and diastolic blood pressure, weight, patient beliefs, symptom severity
Notes Authors note reduction in diastolic blood pressure
Intervention affected patient beliefs
Risk of bias
Item Authors’ judgement Description
Allocation concealment? Unclear B - Unclear
Gothenberg Study 1986
Methods Population-based
Selection of high-risk people by screening
Randomisation of individuals
Participants Men only, mean age 51 years (47 to 55)
N = 30,022
Interventions Diet, smoking, antihypertensive drugs, cholesterol-lowering drugs
Duration 11.8 years
Outcomes Total mortality, coronary heart disease mortality
Systolic blood pressure, diastolic blood pressure, blood cholesterol, smoking prevalence
Notes Large falls in risk factors occurred in both intervention and control groups
Concluded that other strategies in high-risk men are required to have a major impact on incidence of
disease in the general population
Risk of bias
Item Authors’ judgement Description
Allocation concealment? Unclear B - Unclear
HDFP trial 1970
Methods Population screening
Randomisation of individuals
Participants Men and women, all hypertensives, age range 30 to 69 years (mean age 50)
N = 10,940
Interventions Stepped care: antihypertensive drugs, diet, smoking advice, weight control, exercise
versus
Referred care: usual primary care
40Multiple risk factor interventions for primary prevention of coronary heart disease (Review)
Copyright © 2011 The Cochrane Collaboration. Published by John Wiley & Sons, Ltd.
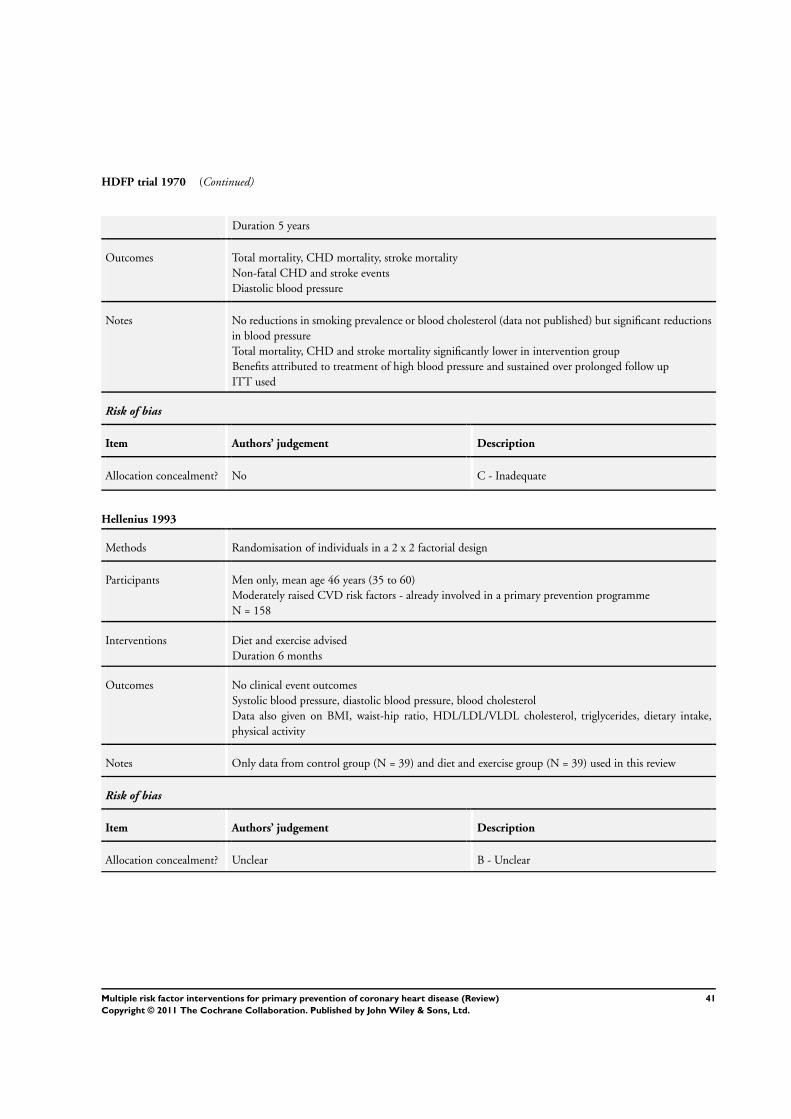
HDFP trial 1970 (Continued)
Duration 5 years
Outcomes Total mortality, CHD mortality, stroke mortality
Non-fatal CHD and stroke events
Diastolic blood pressure
Notes No reductions in smoking prevalence or blood cholesterol (data not published) but significant reductions
in blood pressure
Total mortality, CHD and stroke mortality significantly lower in intervention group
Benefits attributed to treatment of high blood pressure and sustained over prolonged follow up
ITT used
Risk of bias
Item Authors’ judgement Description
Allocation concealment? No C - Inadequate
Hellenius 1993
Methods Randomisation of individuals in a 2 x 2 factorial design
Participants Men only, mean age 46 years (35 to 60)
Moderately raised CVD risk factors - already involved in a primary prevention programme
N = 158
Interventions Diet and exercise advised
Duration 6 months
Outcomes No clinical event outcomes
Systolic blood pressure, diastolic blood pressure, blood cholesterol
Data also given on BMI, waist-hip ratio, HDL/LDL/VLDL cholesterol, triglycerides, dietary intake,
physical activity
Notes Only data from control group (N = 39) and diet and exercise group (N = 39) used in this review
Risk of bias
Item Authors’ judgement Description
Allocation concealment? Unclear B - Unclear
41Multiple risk factor interventions for primary prevention of coronary heart disease (Review)
Copyright © 2011 The Cochrane Collaboration. Published by John Wiley & Sons, Ltd.
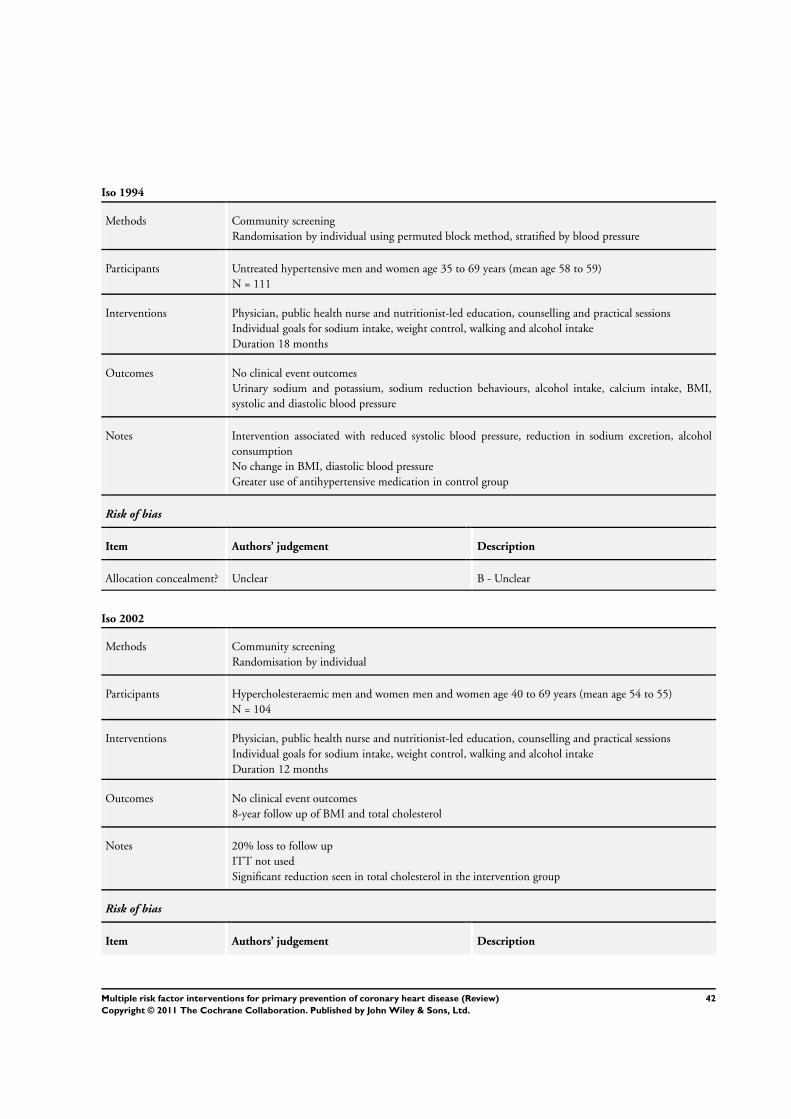
Iso 1994
Methods Community screening
Randomisation by individual using permuted block method, stratified by blood pressure
Participants Untreated hypertensive men and women age 35 to 69 years (mean age 58 to 59)
N = 111
Interventions Physician, public health nurse and nutritionist-led education, counselling and practical sessions
Individual goals for sodium intake, weight control, walking and alcohol intake
Duration 18 months
Outcomes No clinical event outcomes
Urinary sodium and potassium, sodium reduction behaviours, alcohol intake, calcium intake, BMI,
systolic and diastolic blood pressure
Notes Intervention associated with reduced systolic blood pressure, reduction in sodium excretion, alcohol
consumption
No change in BMI, diastolic blood pressure
Greater use of antihypertensive medication in control group
Risk of bias
Item Authors’ judgement Description
Allocation concealment? Unclear B - Unclear
Iso 2002
Methods Community screening
Randomisation by individual
Participants Hypercholesteraemic men and women men and women age 40 to 69 years (mean age 54 to 55)
N = 104
Interventions Physician, public health nurse and nutritionist-led education, counselling and practical sessions
Individual goals for sodium intake, weight control, walking and alcohol intake
Duration 12 months
Outcomes No clinical event outcomes
8-year follow up of BMI and total cholesterol
Notes 20% loss to follow up
ITT not used
Significant reduction seen in total cholesterol in the intervention group
Risk of bias
Item Authors’ judgement Description
42Multiple risk factor interventions for primary prevention of coronary heart disease (Review)
Copyright © 2011 The Cochrane Collaboration. Published by John Wiley & Sons, Ltd.
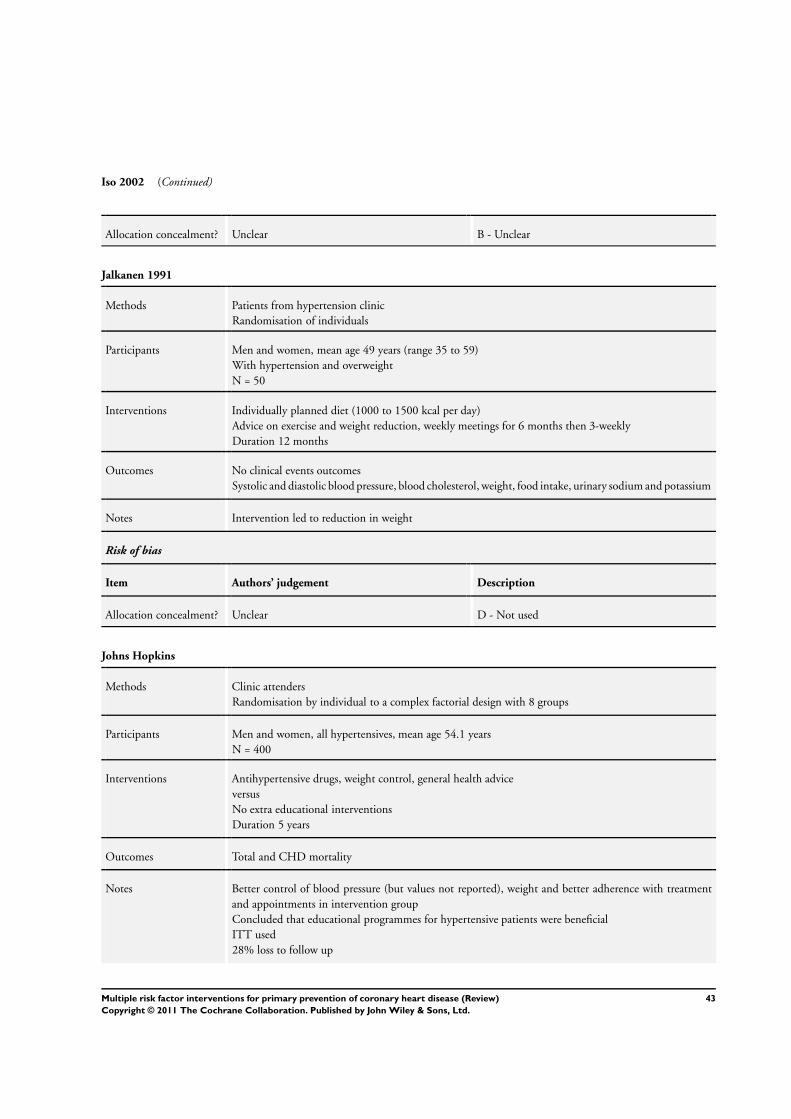
Iso 2002 (Continued)
Allocation concealment? Unclear B - Unclear
Jalkanen 1991
Methods Patients from hypertension clinic
Randomisation of individuals
Participants Men and women, mean age 49 years (range 35 to 59)
With hypertension and overweight
N = 50
Interventions Individually planned diet (1000 to 1500 kcal per day)
Advice on exercise and weight reduction, weekly meetings for 6 months then 3-weekly
Duration 12 months
Outcomes No clinical events outcomes
Systolic and diastolic blood pressure, blood cholesterol, weight, food intake, urinary sodium and potassium
Notes Intervention led to reduction in weight
Risk of bias
Item Authors’ judgement Description
Allocation concealment? Unclear D - Not used
Johns Hopkins
Methods Clinic attenders
Randomisation by individual to a complex factorial design with 8 groups
Participants Men and women, all hypertensives, mean age 54.1 years
N = 400
Interventions Antihypertensive drugs, weight control, general health advice
versus
No extra educational interventions
Duration 5 years
Outcomes Total and CHD mortality
Notes Better control of blood pressure (but values not reported), weight and better adherence with treatment
and appointments in intervention group
Concluded that educational programmes for hypertensive patients were beneficial
ITT used
28% loss to follow up
43Multiple risk factor interventions for primary prevention of coronary heart disease (Review)
Copyright © 2011 The Cochrane Collaboration. Published by John Wiley & Sons, Ltd.
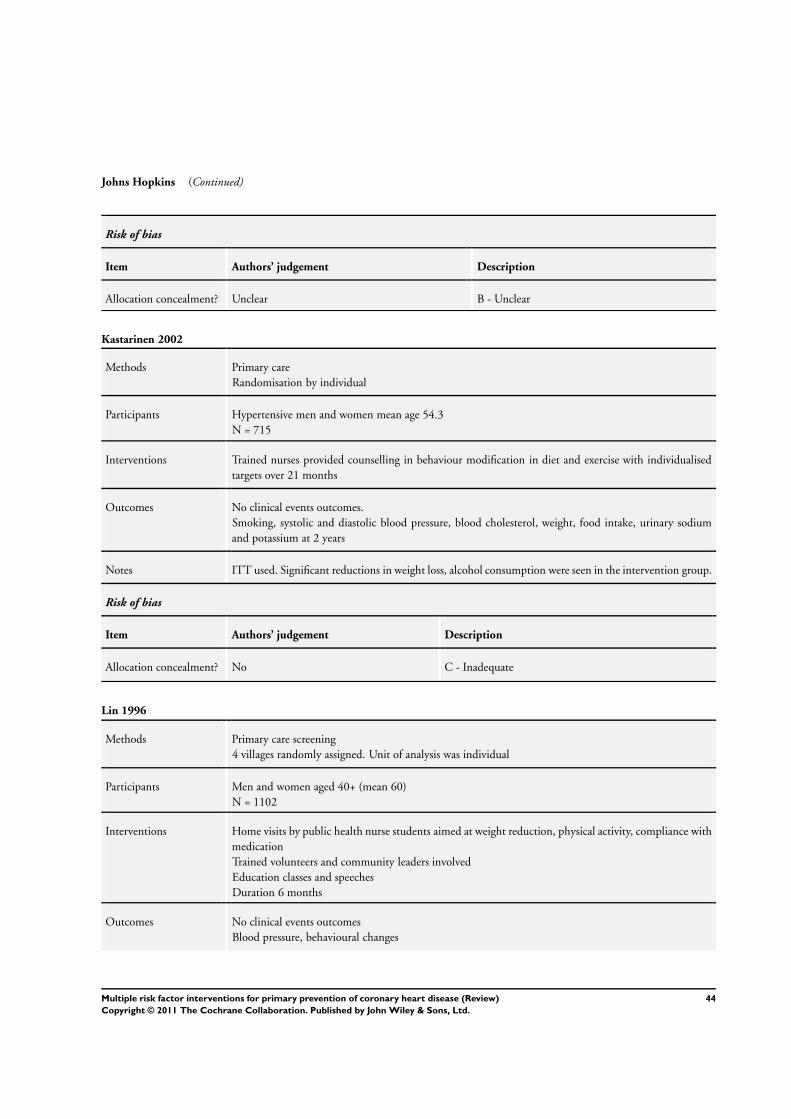
Johns Hopkins (Continued)
Risk of bias
Item Authors’ judgement Description
Allocation concealment? Unclear B - Unclear
Kastarinen 2002
Methods Primary care
Randomisation by individual
Participants Hypertensive men and women mean age 54.3
N = 715
Interventions Trained nurses provided counselling in behaviour modification in diet and exercise with individualised
targets over 21 months
Outcomes No clinical events outcomes.
Smoking, systolic and diastolic blood pressure, blood cholesterol, weight, food intake, urinary sodium
and potassium at 2 years
Notes ITT used. Significant reductions in weight loss, alcohol consumption were seen in the intervention group.
Risk of bias
Item Authors’ judgement Description
Allocation concealment? No C - Inadequate
Lin 1996
Methods Primary care screening
4 villages randomly assigned. Unit of analysis was individual
Participants Men and women aged 40+ (mean 60)
N = 1102
Interventions Home visits by public health nurse students aimed at weight reduction, physical activity, compliance with
medication
Trained volunteers and community leaders involved
Education classes and speeches
Duration 6 months
Outcomes No clinical events outcomes
Blood pressure, behavioural changes
44Multiple risk factor interventions for primary prevention of coronary heart disease (Review)
Copyright © 2011 The Cochrane Collaboration. Published by John Wiley & Sons, Ltd.
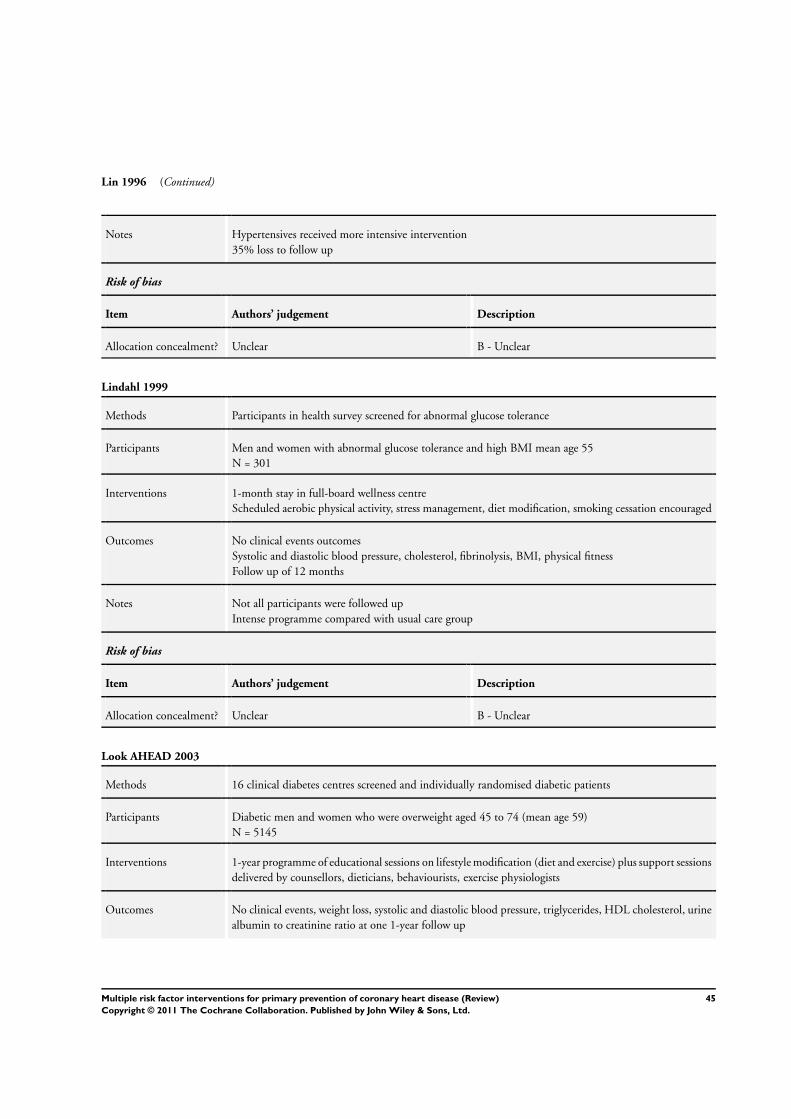
Lin 1996 (Continued)
Notes Hypertensives received more intensive intervention
35% loss to follow up
Risk of bias
Item Authors’ judgement Description
Allocation concealment? Unclear B - Unclear
Lindahl 1999
Methods Participants in health survey screened for abnormal glucose tolerance
Participants Men and women with abnormal glucose tolerance and high BMI mean age 55
N = 301
Interventions 1-month stay in full-board wellness centre
Scheduled aerobic physical activity, stress management, diet modification, smoking cessation encouraged
Outcomes No clinical events outcomes
Systolic and diastolic blood pressure, cholesterol, fibrinolysis, BMI, physical fitness
Follow up of 12 months
Notes Not all participants were followed up
Intense programme compared with usual care group
Risk of bias
Item Authors’ judgement Description
Allocation concealment? Unclear B - Unclear
Look AHEAD 2003
Methods 16 clinical diabetes centres screened and individually randomised diabetic patients
Participants Diabetic men and women who were overweight aged 45 to 74 (mean age 59)
N = 5145
Interventions 1-year programme of educational sessions on lifestyle modification (diet and exercise) plus support sessions
delivered by counsellors, dieticians, behaviourists, exercise physiologists
Outcomes No clinical events, weight loss, systolic and diastolic blood pressure, triglycerides, HDL cholesterol, urine
albumin to creatinine ratio at one 1-year follow up
45Multiple risk factor interventions for primary prevention of coronary heart disease (Review)
Copyright © 2011 The Cochrane Collaboration. Published by John Wiley & Sons, Ltd.
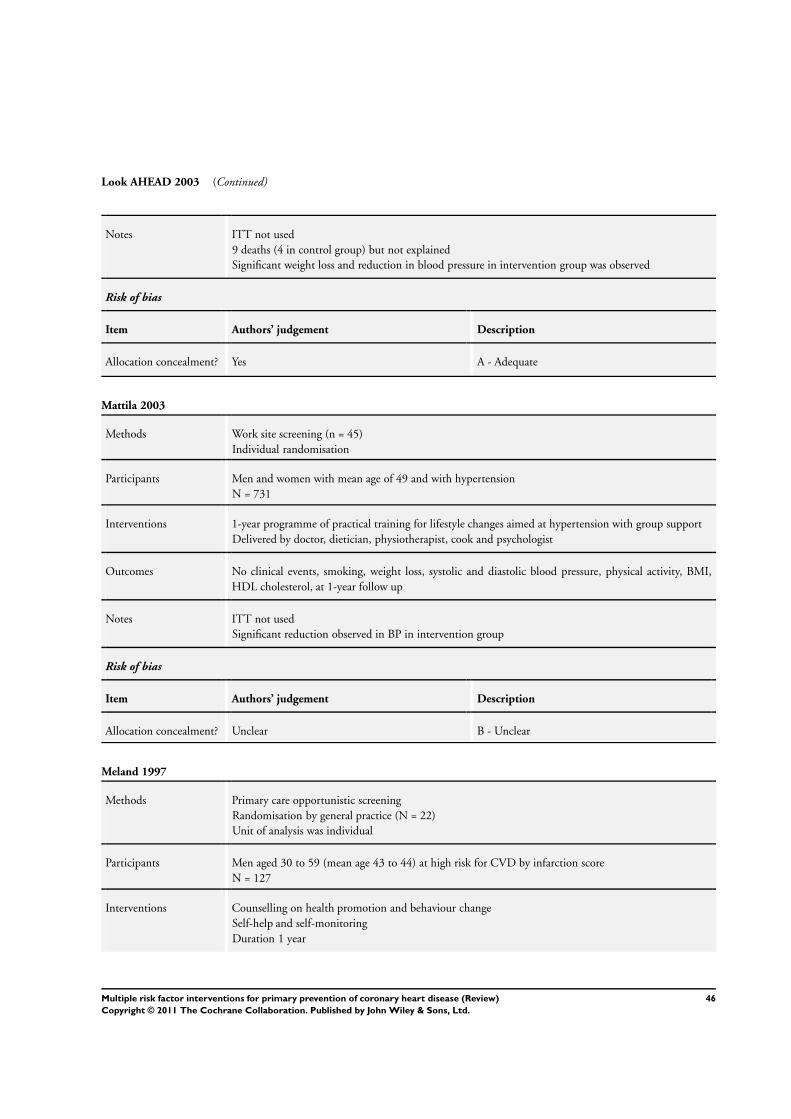
Look AHEAD 2003 (Continued)
Notes ITT not used
9 deaths (4 in control group) but not explained
Significant weight loss and reduction in blood pressure in intervention group was observed
Risk of bias
Item Authors’ judgement Description
Allocation concealment? Yes A - Adequate
Mattila 2003
Methods Work site screening (n = 45)
Individual randomisation
Participants Men and women with mean age of 49 and with hypertension
N = 731
Interventions 1-year programme of practical training for lifestyle changes aimed at hypertension with group support
Delivered by doctor, dietician, physiotherapist, cook and psychologist
Outcomes No clinical events, smoking, weight loss, systolic and diastolic blood pressure, physical activity, BMI,
HDL cholesterol, at 1-year follow up
Notes ITT not used
Significant reduction observed in BP in intervention group
Risk of bias
Item Authors’ judgement Description
Allocation concealment? Unclear B - Unclear
Meland 1997
Methods Primary care opportunistic screening
Randomisation by general practice (N = 22)
Unit of analysis was individual
Participants Men aged 30 to 59 (mean age 43 to 44) at high risk for CVD by infarction score
N = 127
Interventions Counselling on health promotion and behaviour change
Self-help and self-monitoring
Duration 1 year
46Multiple risk factor interventions for primary prevention of coronary heart disease (Review)
Copyright © 2011 The Cochrane Collaboration. Published by John Wiley & Sons, Ltd.
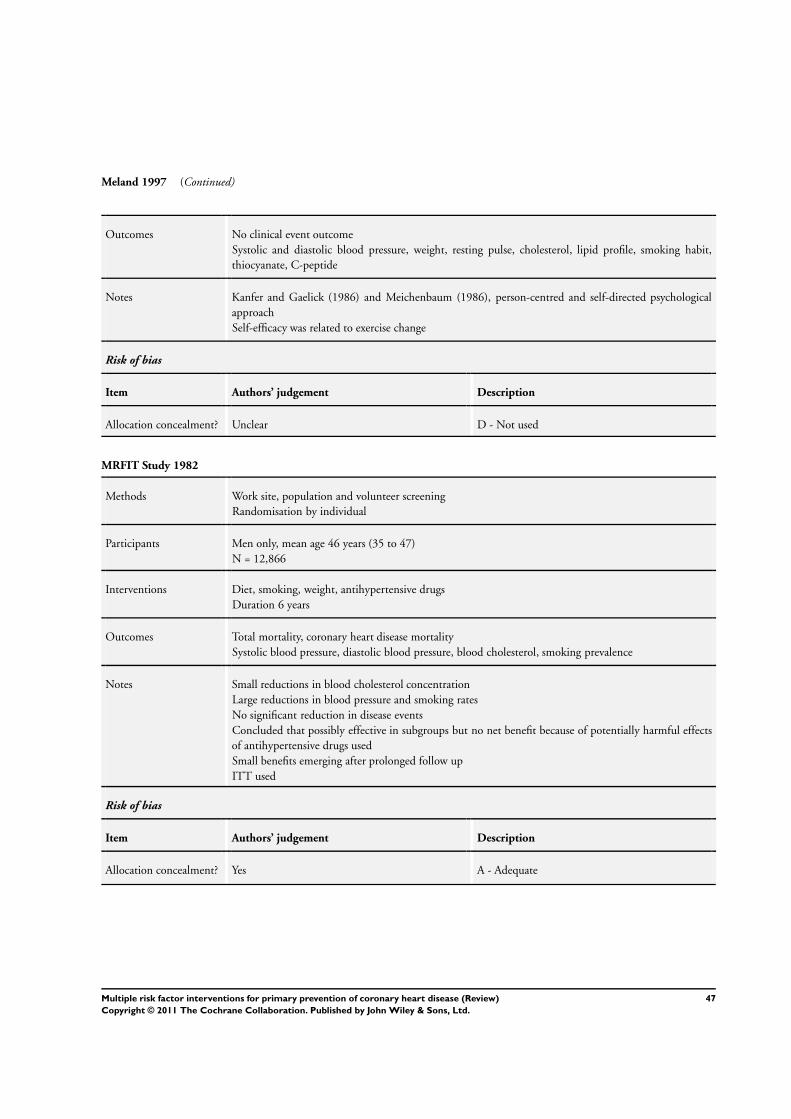
Meland 1997 (Continued)
Outcomes No clinical event outcome
Systolic and diastolic blood pressure, weight, resting pulse, cholesterol, lipid profile, smoking habit,
thiocyanate, C-peptide
Notes Kanfer and Gaelick (1986) and Meichenbaum (1986), person-centred and self-directed psychological
approach
Self-efficacy was related to exercise change
Risk of bias
Item Authors’ judgement Description
Allocation concealment? Unclear D - Not used
MRFIT Study 1982
Methods Work site, population and volunteer screening
Randomisation by individual
Participants Men only, mean age 46 years (35 to 47)
N = 12,866
Interventions Diet, smoking, weight, antihypertensive drugs
Duration 6 years
Outcomes Total mortality, coronary heart disease mortality
Systolic blood pressure, diastolic blood pressure, blood cholesterol, smoking prevalence
Notes Small reductions in blood cholesterol concentration
Large reductions in blood pressure and smoking rates
No significant reduction in disease events
Concluded that possibly effective in subgroups but no net benefit because of potentially harmful effects
of antihypertensive drugs used
Small benefits emerging after prolonged follow up
ITT used
Risk of bias
Item Authors’ judgement Description
Allocation concealment? Yes A - Adequate
47Multiple risk factor interventions for primary prevention of coronary heart disease (Review)
Copyright © 2011 The Cochrane Collaboration. Published by John Wiley & Sons, Ltd.
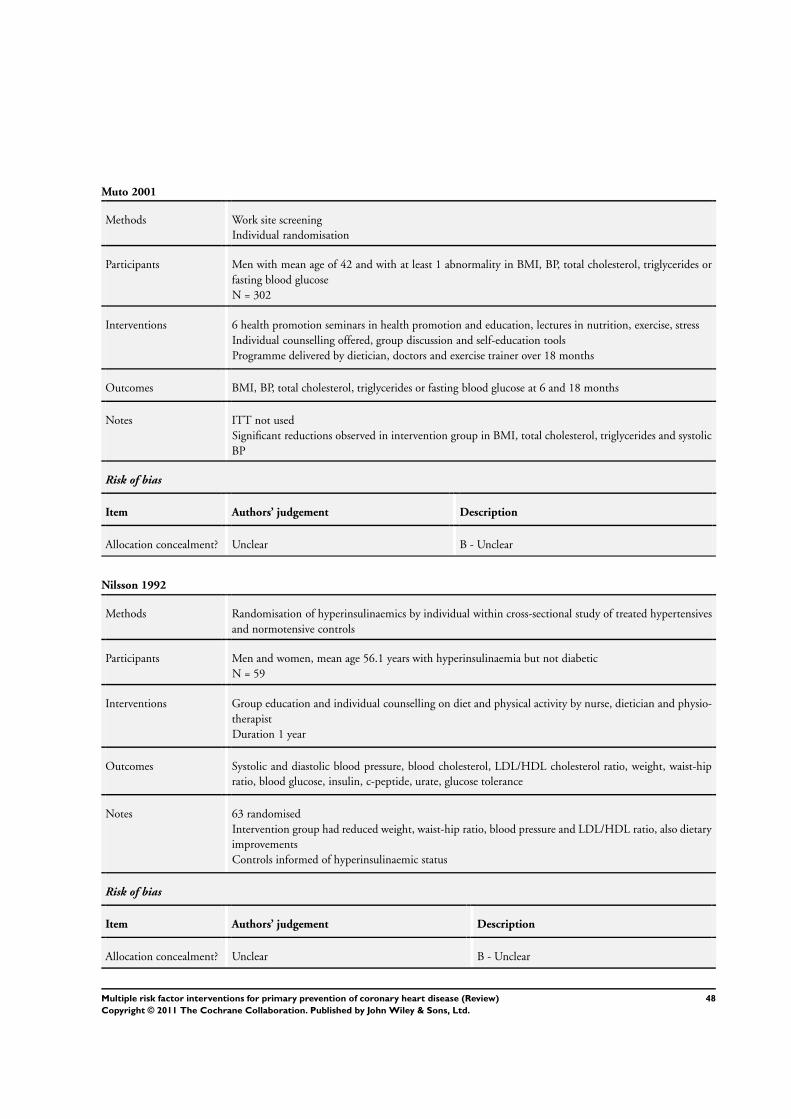
Muto 2001
Methods Work site screening
Individual randomisation
Participants Men with mean age of 42 and with at least 1 abnormality in BMI, BP, total cholesterol, triglycerides or
fasting blood glucose
N = 302
Interventions 6 health promotion seminars in health promotion and education, lectures in nutrition, exercise, stress
Individual counselling offered, group discussion and self-education tools
Programme delivered by dietician, doctors and exercise trainer over 18 months
Outcomes BMI, BP, total cholesterol, triglycerides or fasting blood glucose at 6 and 18 months
Notes ITT not used
Significant reductions observed in intervention group in BMI, total cholesterol, triglycerides and systolic
BP
Risk of bias
Item Authors’ judgement Description
Allocation concealment? Unclear B - Unclear
Nilsson 1992
Methods Randomisation of hyperinsulinaemics by individual within cross-sectional study of treated hypertensives
and normotensive controls
Participants Men and women, mean age 56.1 years with hyperinsulinaemia but not diabetic
N = 59
Interventions Group education and individual counselling on diet and physical activity by nurse, dietician and physio-
therapist
Duration 1 year
Outcomes Systolic and diastolic blood pressure, blood cholesterol, LDL/HDL cholesterol ratio, weight, waist-hip
ratio, blood glucose, insulin, c-peptide, urate, glucose tolerance
Notes 63 randomised
Intervention group had reduced weight, waist-hip ratio, blood pressure and LDL/HDL ratio, also dietary
improvements
Controls informed of hyperinsulinaemic status
Risk of bias
Item Authors’ judgement Description
Allocation concealment? Unclear B - Unclear
48Multiple risk factor interventions for primary prevention of coronary heart disease (Review)
Copyright © 2011 The Cochrane Collaboration. Published by John Wiley & Sons, Ltd.
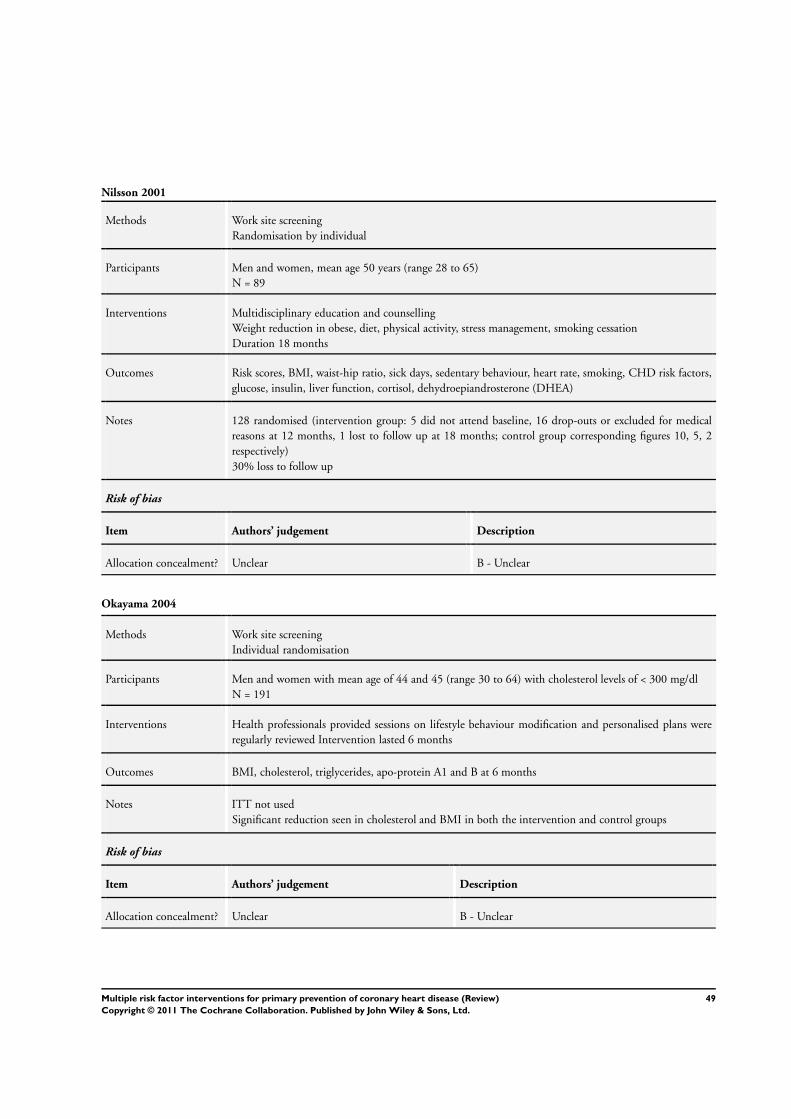
Nilsson 2001
Methods Work site screening
Randomisation by individual
Participants Men and women, mean age 50 years (range 28 to 65)
N = 89
Interventions Multidisciplinary education and counselling
Weight reduction in obese, diet, physical activity, stress management, smoking cessation
Duration 18 months
Outcomes Risk scores, BMI, waist-hip ratio, sick days, sedentary behaviour, heart rate, smoking, CHD risk factors,
glucose, insulin, liver function, cortisol, dehydroepiandrosterone (DHEA)
Notes 128 randomised (intervention group: 5 did not attend baseline, 16 drop-outs or excluded for medical
reasons at 12 months, 1 lost to follow up at 18 months; control group corresponding figures 10, 5, 2
respectively)
30% loss to follow up
Risk of bias
Item Authors’ judgement Description
Allocation concealment? Unclear B - Unclear
Okayama 2004
Methods Work site screening
Individual randomisation
Participants Men and women with mean age of 44 and 45 (range 30 to 64) with cholesterol levels of < 300 mg/dl
N = 191
Interventions Health professionals provided sessions on lifestyle behaviour modification and personalised plans were
regularly reviewed Intervention lasted 6 months
Outcomes BMI, cholesterol, triglycerides, apo-protein A1 and B at 6 months
Notes ITT not used
Significant reduction seen in cholesterol and BMI in both the intervention and control groups
Risk of bias
Item Authors’ judgement Description
Allocation concealment? Unclear B - Unclear
49Multiple risk factor interventions for primary prevention of coronary heart disease (Review)
Copyright © 2011 The Cochrane Collaboration. Published by John Wiley & Sons, Ltd.
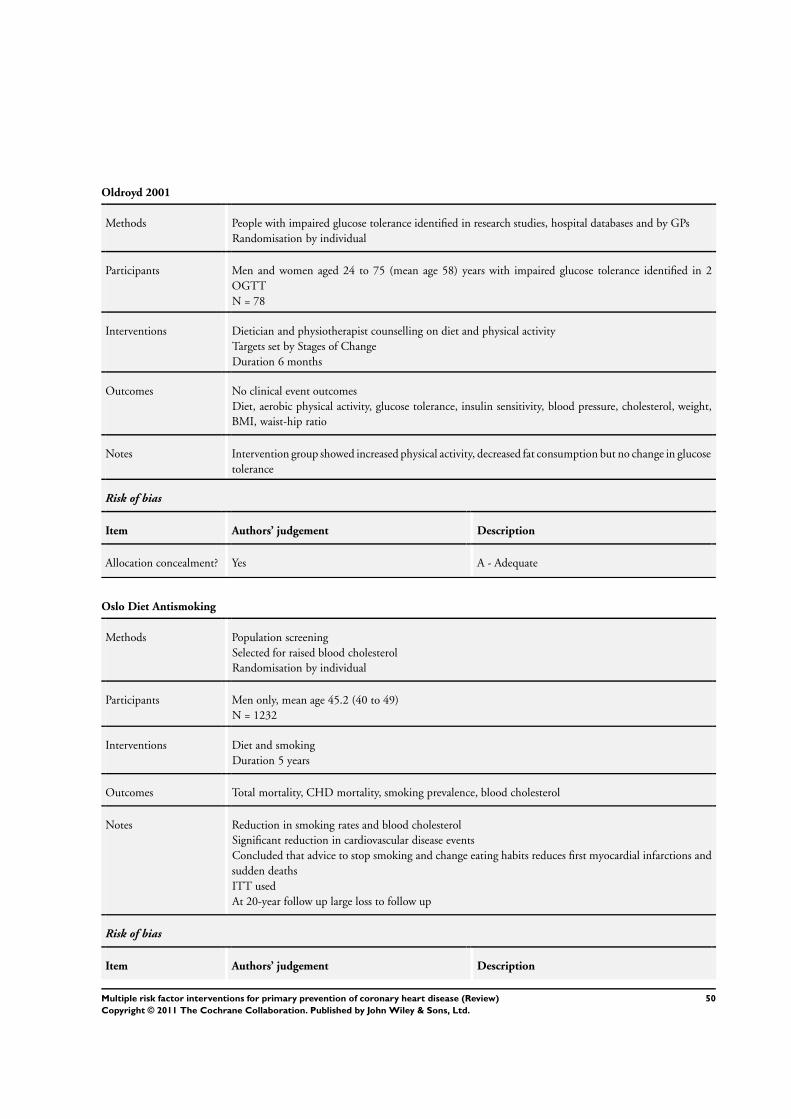
Oldroyd 2001
Methods People with impaired glucose tolerance identified in research studies, hospital databases and by GPs
Randomisation by individual
Participants Men and women aged 24 to 75 (mean age 58) years with impaired glucose tolerance identified in 2
OGTT
N = 78
Interventions Dietician and physiotherapist counselling on diet and physical activity
Targets set by Stages of Change
Duration 6 months
Outcomes No clinical event outcomes
Diet, aerobic physical activity, glucose tolerance, insulin sensitivity, blood pressure, cholesterol, weight,
BMI, waist-hip ratio
Notes Intervention group showed increased physical activity, decreased fat consumption but no change in glucose
tolerance
Risk of bias
Item Authors’ judgement Description
Allocation concealment? Yes A - Adequate
Oslo Diet Antismoking
Methods Population screening
Selected for raised blood cholesterol
Randomisation by individual
Participants Men only, mean age 45.2 (40 to 49)
N = 1232
Interventions Diet and smoking
Duration 5 years
Outcomes Total mortality, CHD mortality, smoking prevalence, blood cholesterol
Notes Reduction in smoking rates and blood cholesterol
Significant reduction in cardiovascular disease events
Concluded that advice to stop smoking and change eating habits reduces first myocardial infarctions and
sudden deaths
ITT used
At 20-year follow up large loss to follow up
Risk of bias
Item Authors’ judgement Description
50Multiple risk factor interventions for primary prevention of coronary heart disease (Review)
Copyright © 2011 The Cochrane Collaboration. Published by John Wiley & Sons, Ltd.
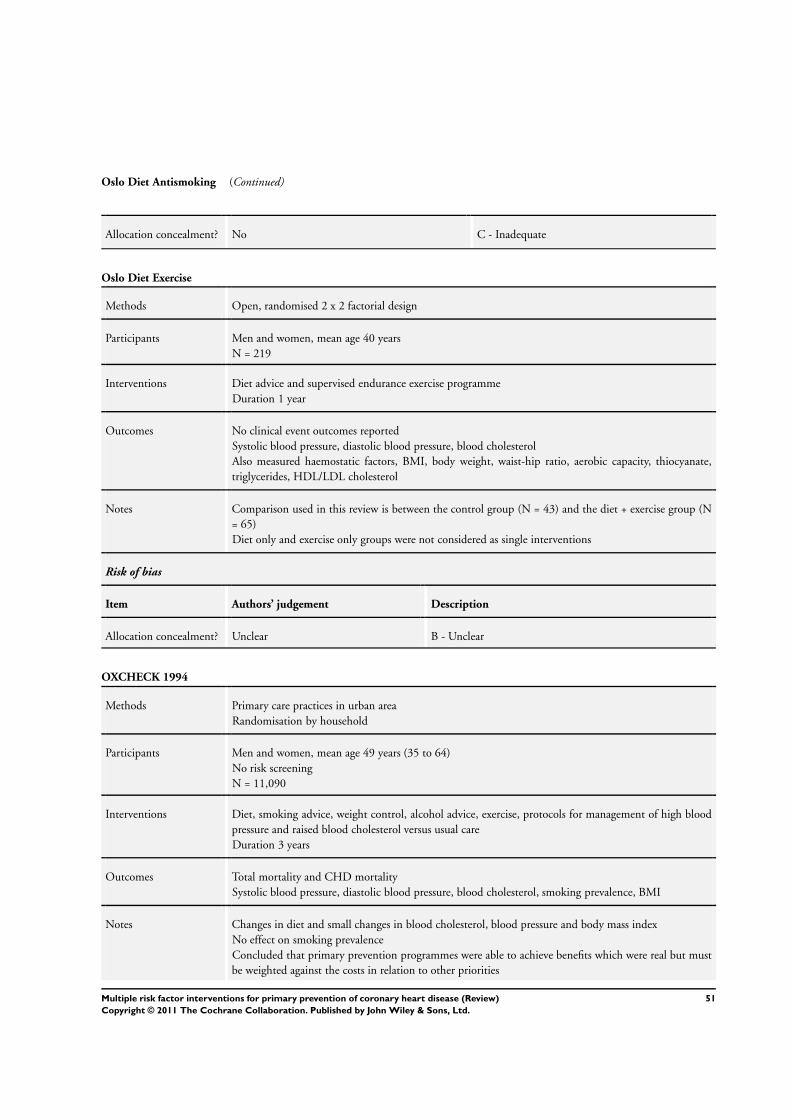
Oslo Diet Antismoking (Continued)
Allocation concealment? No C - Inadequate
Oslo Diet Exercise
Methods Open, randomised 2 x 2 factorial design
Participants Men and women, mean age 40 years
N = 219
Interventions Diet advice and supervised endurance exercise programme
Duration 1 year
Outcomes No clinical event outcomes reported
Systolic blood pressure, diastolic blood pressure, blood cholesterol
Also measured haemostatic factors, BMI, body weight, waist-hip ratio, aerobic capacity, thiocyanate,
triglycerides, HDL/LDL cholesterol
Notes Comparison used in this review is between the control group (N = 43) and the diet + exercise group (N
= 65)
Diet only and exercise only groups were not considered as single interventions
Risk of bias
Item Authors’ judgement Description
Allocation concealment? Unclear B - Unclear
OXCHECK 1994
Methods Primary care practices in urban area
Randomisation by household
Participants Men and women, mean age 49 years (35 to 64)
No risk screening
N = 11,090
Interventions Diet, smoking advice, weight control, alcohol advice, exercise, protocols for management of high blood
pressure and raised blood cholesterol versus usual care
Duration 3 years
Outcomes Total mortality and CHD mortality
Systolic blood pressure, diastolic blood pressure, blood cholesterol, smoking prevalence, BMI
Notes Changes in diet and small changes in blood cholesterol, blood pressure and body mass index
No effect on smoking prevalence
Concluded that primary prevention programmes were able to achieve benefits which were real but must
be weighted against the costs in relation to other priorities
51Multiple risk factor interventions for primary prevention of coronary heart disease (Review)
Copyright © 2011 The Cochrane Collaboration. Published by John Wiley & Sons, Ltd.
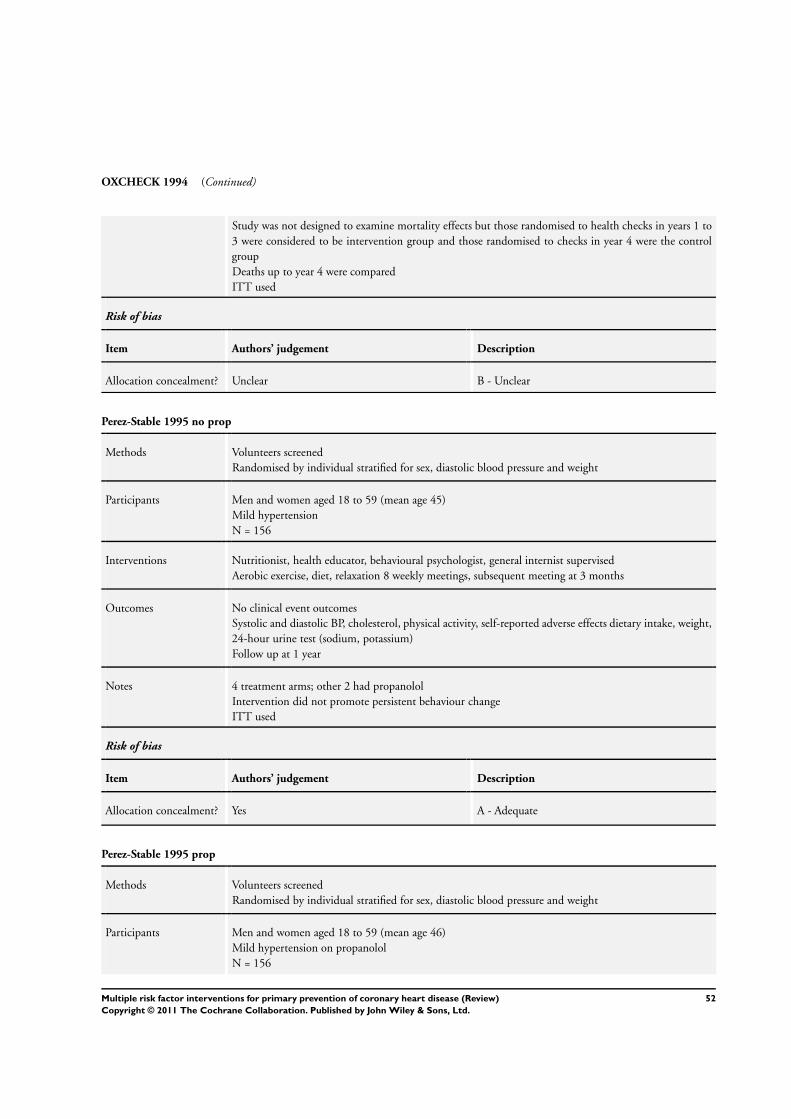
OXCHECK 1994 (Continued)
Study was not designed to examine mortality effects but those randomised to health checks in years 1 to
3 were considered to be intervention group and those randomised to checks in year 4 were the control
group
Deaths up to year 4 were compared
ITT used
Risk of bias
Item Authors’ judgement Description
Allocation concealment? Unclear B - Unclear
Perez-Stable 1995 no prop
Methods Volunteers screened
Randomised by individual stratified for sex, diastolic blood pressure and weight
Participants Men and women aged 18 to 59 (mean age 45)
Mild hypertension
N = 156
Interventions Nutritionist, health educator, behavioural psychologist, general internist supervised
Aerobic exercise, diet, relaxation 8 weekly meetings, subsequent meeting at 3 months
Outcomes No clinical event outcomes
Systolic and diastolic BP, cholesterol, physical activity, self-reported adverse effects dietary intake, weight,
24-hour urine test (sodium, potassium)
Follow up at 1 year
Notes 4 treatment arms; other 2 had propanolol
Intervention did not promote persistent behaviour change
ITT used
Risk of bias
Item Authors’ judgement Description
Allocation concealment? Yes A - Adequate
Perez-Stable 1995 prop
Methods Volunteers screened
Randomised by individual stratified for sex, diastolic blood pressure and weight
Participants Men and women aged 18 to 59 (mean age 46)
Mild hypertension on propanolol
N = 156
52Multiple risk factor interventions for primary prevention of coronary heart disease (Review)
Copyright © 2011 The Cochrane Collaboration. Published by John Wiley & Sons, Ltd.
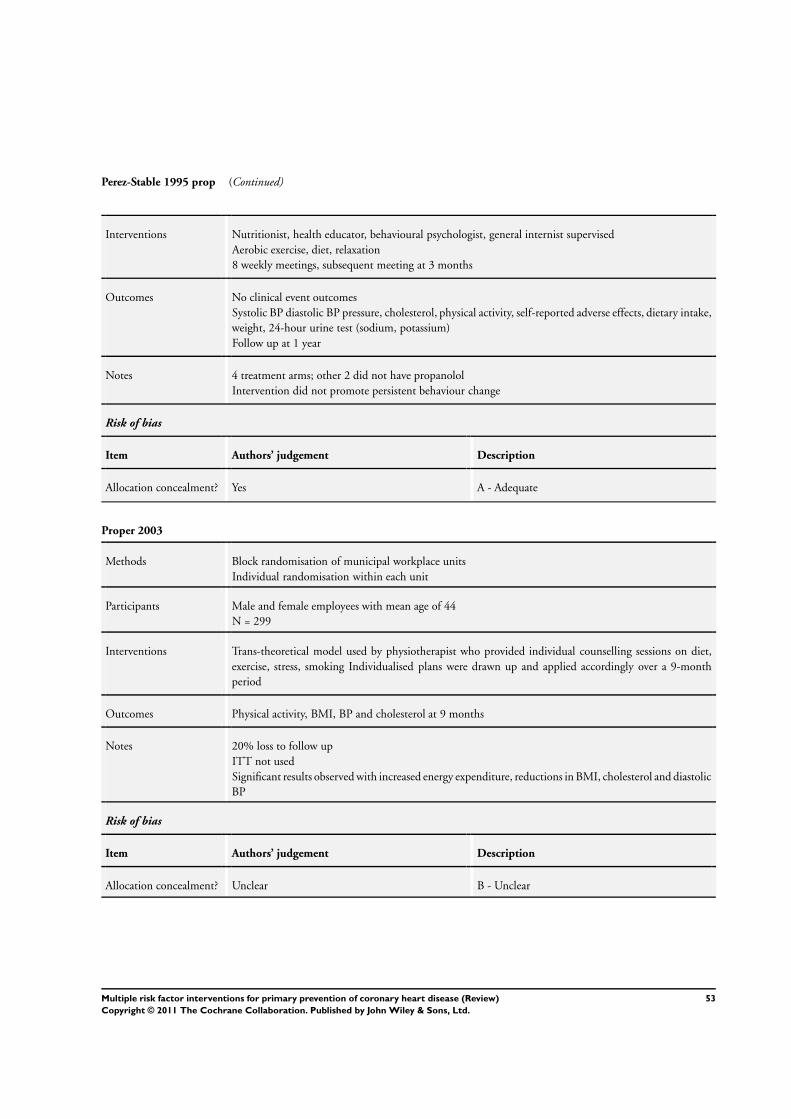
Perez-Stable 1995 prop (Continued)
Interventions Nutritionist, health educator, behavioural psychologist, general internist supervised
Aerobic exercise, diet, relaxation
8 weekly meetings, subsequent meeting at 3 months
Outcomes No clinical event outcomes
Systolic BP diastolic BP pressure, cholesterol, physical activity, self-reported adverse effects, dietary intake,
weight, 24-hour urine test (sodium, potassium)
Follow up at 1 year
Notes 4 treatment arms; other 2 did not have propanolol
Intervention did not promote persistent behaviour change
Risk of bias
Item Authors’ judgement Description
Allocation concealment? Yes A - Adequate
Proper 2003
Methods Block randomisation of municipal workplace units
Individual randomisation within each unit
Participants Male and female employees with mean age of 44
N = 299
Interventions Trans-theoretical model used by physiotherapist who provided individual counselling sessions on diet,
exercise, stress, smoking Individualised plans were drawn up and applied accordingly over a 9-month
period
Outcomes Physical activity, BMI, BP and cholesterol at 9 months
Notes 20% loss to follow up
ITT not used
Significant results observed with increased energy expenditure, reductions in BMI, cholesterol and diastolic
BP
Risk of bias
Item Authors’ judgement Description
Allocation concealment? Unclear B - Unclear
53Multiple risk factor interventions for primary prevention of coronary heart disease (Review)
Copyright © 2011 The Cochrane Collaboration. Published by John Wiley & Sons, Ltd.
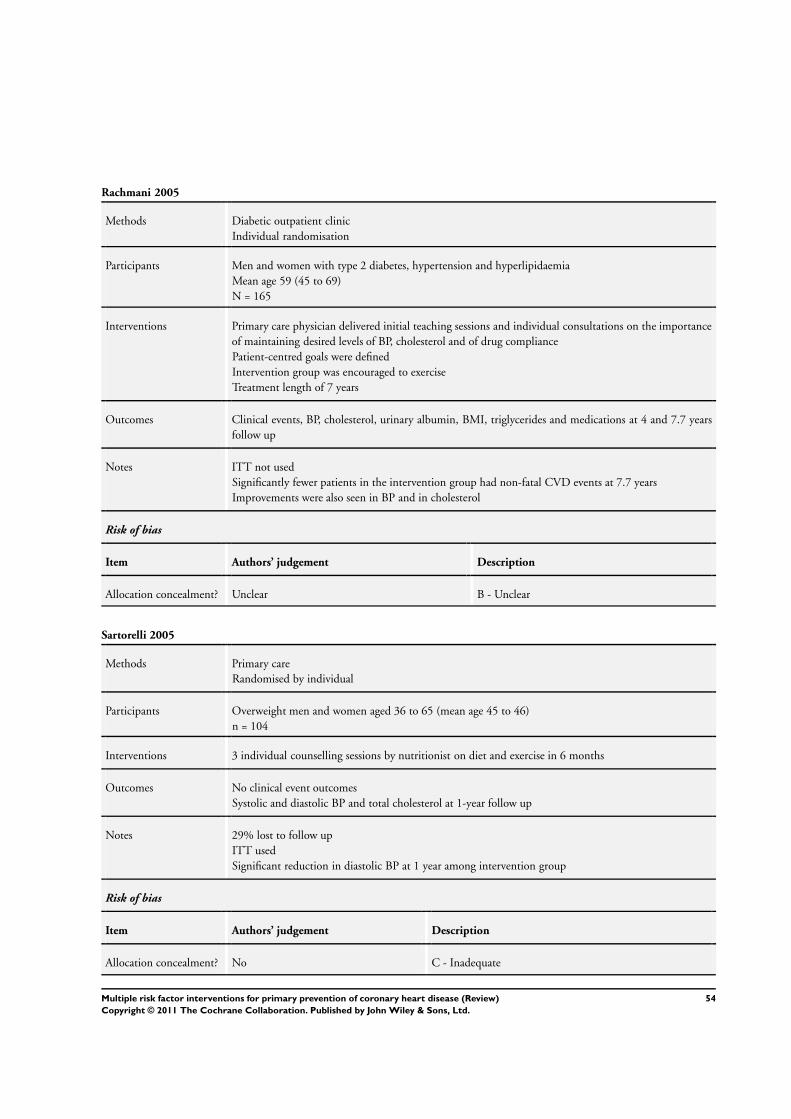
Rachmani 2005
Methods Diabetic outpatient clinic
Individual randomisation
Participants Men and women with type 2 diabetes, hypertension and hyperlipidaemia
Mean age 59 (45 to 69)
N = 165
Interventions Primary care physician delivered initial teaching sessions and individual consultations on the importance
of maintaining desired levels of BP, cholesterol and of drug compliance
Patient-centred goals were defined
Intervention group was encouraged to exercise
Treatment length of 7 years
Outcomes Clinical events, BP, cholesterol, urinary albumin, BMI, triglycerides and medications at 4 and 7.7 years
follow up
Notes ITT not used
Significantly fewer patients in the intervention group had non-fatal CVD events at 7.7 years
Improvements were also seen in BP and in cholesterol
Risk of bias
Item Authors’ judgement Description
Allocation concealment? Unclear B - Unclear
Sartorelli 2005
Methods Primary care
Randomised by individual
Participants Overweight men and women aged 36 to 65 (mean age 45 to 46)
n = 104
Interventions 3 individual counselling sessions by nutritionist on diet and exercise in 6 months
Outcomes No clinical event outcomes
Systolic and diastolic BP and total cholesterol at 1-year follow up
Notes 29% lost to follow up
ITT used
Significant reduction in diastolic BP at 1 year among intervention group
Risk of bias
Item Authors’ judgement Description
Allocation concealment? No C - Inadequate
54Multiple risk factor interventions for primary prevention of coronary heart disease (Review)
Copyright © 2011 The Cochrane Collaboration. Published by John Wiley & Sons, Ltd.
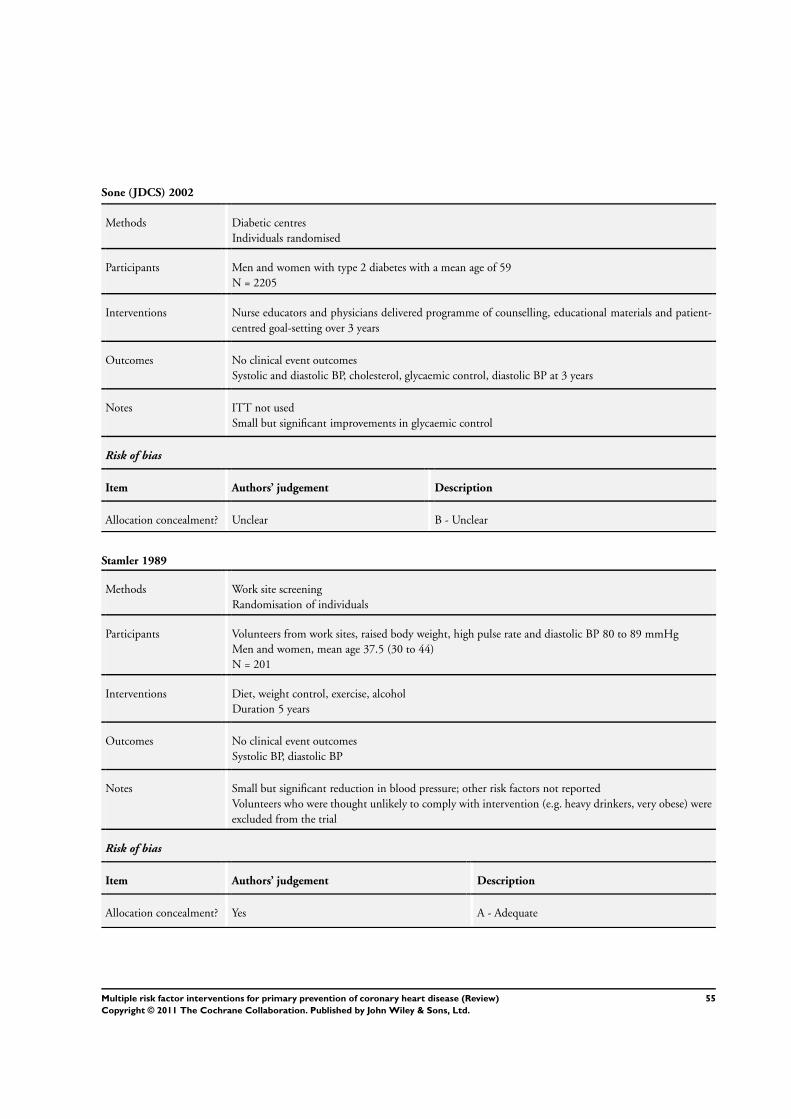
Sone (JDCS) 2002
Methods Diabetic centres
Individuals randomised
Participants Men and women with type 2 diabetes with a mean age of 59
N = 2205
Interventions Nurse educators and physicians delivered programme of counselling, educational materials and patient-
centred goal-setting over 3 years
Outcomes No clinical event outcomes
Systolic and diastolic BP, cholesterol, glycaemic control, diastolic BP at 3 years
Notes ITT not used
Small but significant improvements in glycaemic control
Risk of bias
Item Authors’ judgement Description
Allocation concealment? Unclear B - Unclear
Stamler 1989
Methods Work site screening
Randomisation of individuals
Participants Volunteers from work sites, raised body weight, high pulse rate and diastolic BP 80 to 89 mmHg
Men and women, mean age 37.5 (30 to 44)
N = 201
Interventions Diet, weight control, exercise, alcohol
Duration 5 years
Outcomes No clinical event outcomes
Systolic BP, diastolic BP
Notes Small but significant reduction in blood pressure; other risk factors not reported
Volunteers who were thought unlikely to comply with intervention (e.g. heavy drinkers, very obese) were
excluded from the trial
Risk of bias
Item Authors’ judgement Description
Allocation concealment? Yes A - Adequate
55Multiple risk factor interventions for primary prevention of coronary heart disease (Review)
Copyright © 2011 The Cochrane Collaboration. Published by John Wiley & Sons, Ltd.
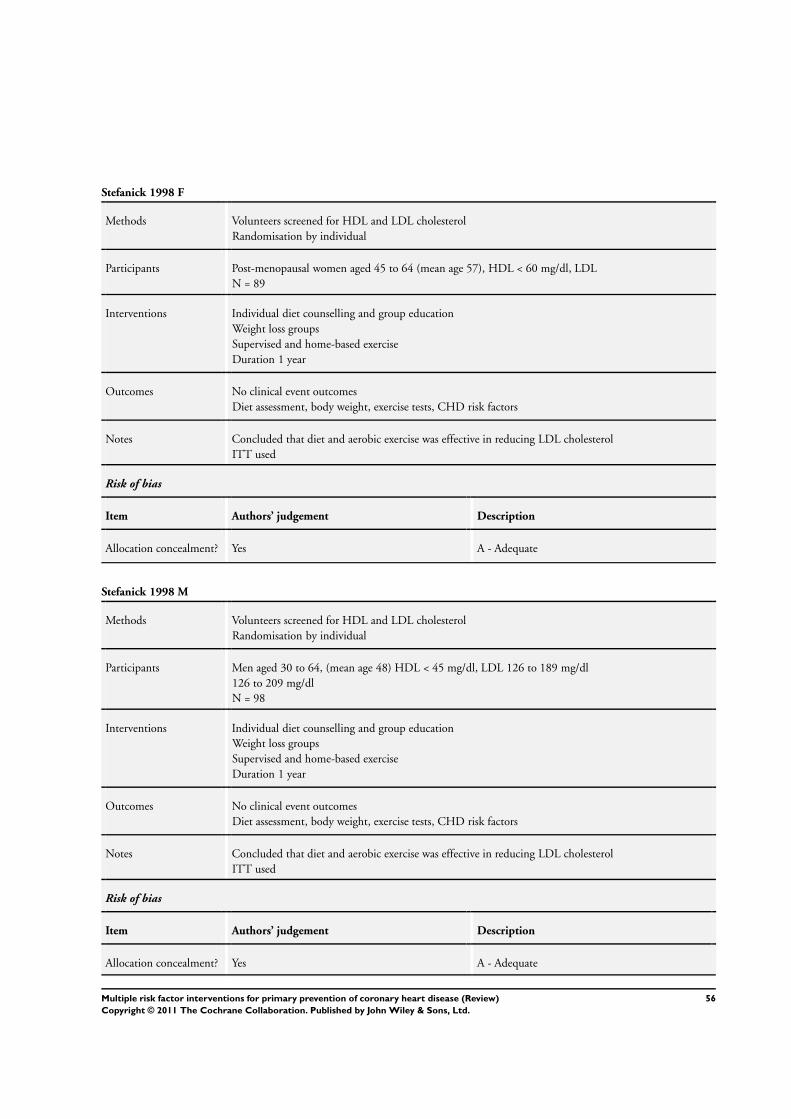
Stefanick 1998 F
Methods Volunteers screened for HDL and LDL cholesterol
Randomisation by individual
Participants Post-menopausal women aged 45 to 64 (mean age 57), HDL < 60 mg/dl, LDL
N = 89
Interventions Individual diet counselling and group education
Weight loss groups
Supervised and home-based exercise
Duration 1 year
Outcomes No clinical event outcomes
Diet assessment, body weight, exercise tests, CHD risk factors
Notes Concluded that diet and aerobic exercise was effective in reducing LDL cholesterol
ITT used
Risk of bias
Item Authors’ judgement Description
Allocation concealment? Yes A - Adequate
Stefanick 1998 M
Methods Volunteers screened for HDL and LDL cholesterol
Randomisation by individual
Participants Men aged 30 to 64, (mean age 48) HDL < 45 mg/dl, LDL 126 to 189 mg/dl
126 to 209 mg/dl
N = 98
Interventions Individual diet counselling and group education
Weight loss groups
Supervised and home-based exercise
Duration 1 year
Outcomes No clinical event outcomes
Diet assessment, body weight, exercise tests, CHD risk factors
Notes Concluded that diet and aerobic exercise was effective in reducing LDL cholesterol
ITT used
Risk of bias
Item Authors’ judgement Description
Allocation concealment? Yes A - Adequate
56Multiple risk factor interventions for primary prevention of coronary heart disease (Review)
Copyright © 2011 The Cochrane Collaboration. Published by John Wiley & Sons, Ltd.
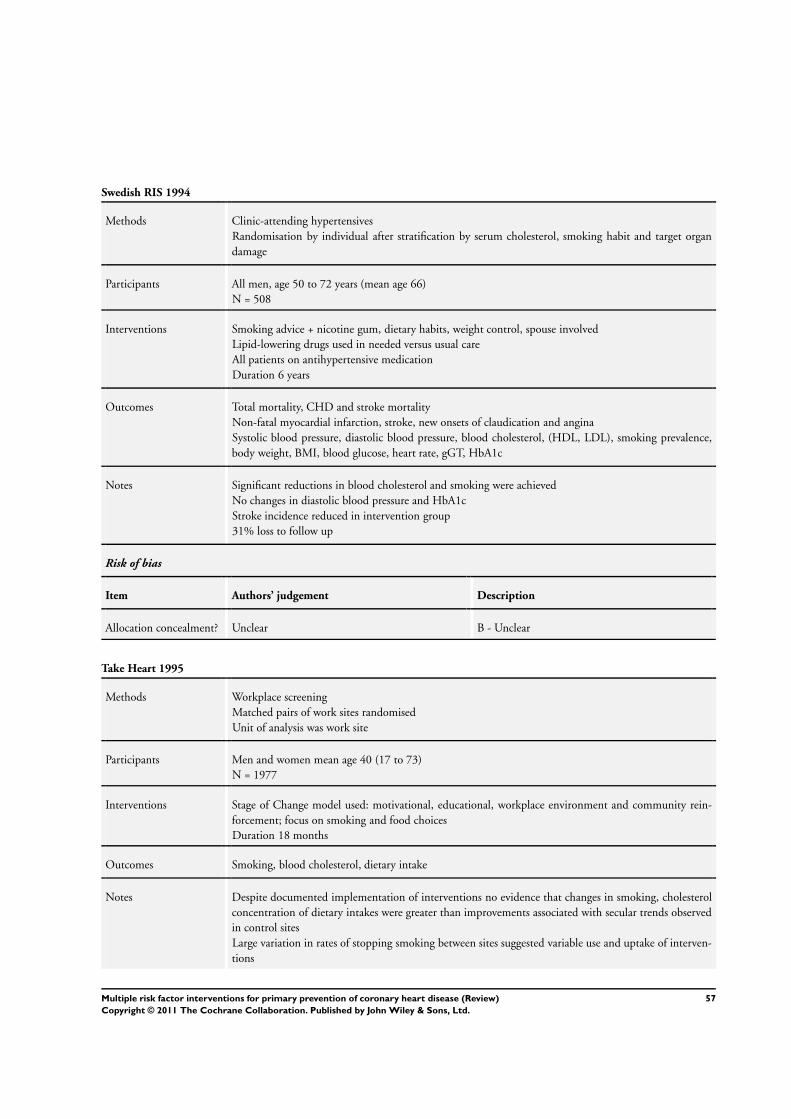
Swedish RIS 1994
Methods Clinic-attending hypertensives
Randomisation by individual after stratification by serum cholesterol, smoking habit and target organ
damage
Participants All men, age 50 to 72 years (mean age 66)
N = 508
Interventions Smoking advice + nicotine gum, dietary habits, weight control, spouse involved
Lipid-lowering drugs used in needed versus usual care
All patients on antihypertensive medication
Duration 6 years
Outcomes Total mortality, CHD and stroke mortality
Non-fatal myocardial infarction, stroke, new onsets of claudication and angina
Systolic blood pressure, diastolic blood pressure, blood cholesterol, (HDL, LDL), smoking prevalence,
body weight, BMI, blood glucose, heart rate, gGT, HbA1c
Notes Significant reductions in blood cholesterol and smoking were achieved
No changes in diastolic blood pressure and HbA1c
Stroke incidence reduced in intervention group
31% loss to follow up
Risk of bias
Item Authors’ judgement Description
Allocation concealment? Unclear B - Unclear
Take Heart 1995
Methods Workplace screening
Matched pairs of work sites randomised
Unit of analysis was work site
Participants Men and women mean age 40 (17 to 73)
N = 1977
Interventions Stage of Change model used: motivational, educational, workplace environment and community rein-
forcement; focus on smoking and food choices
Duration 18 months
Outcomes Smoking, blood cholesterol, dietary intake
Notes Despite documented implementation of interventions no evidence that changes in smoking, cholesterol
concentration of dietary intakes were greater than improvements associated with secular trends observed
in control sites
Large variation in rates of stopping smoking between sites suggested variable use and uptake of interven-
tions
57Multiple risk factor interventions for primary prevention of coronary heart disease (Review)
Copyright © 2011 The Cochrane Collaboration. Published by John Wiley & Sons, Ltd.
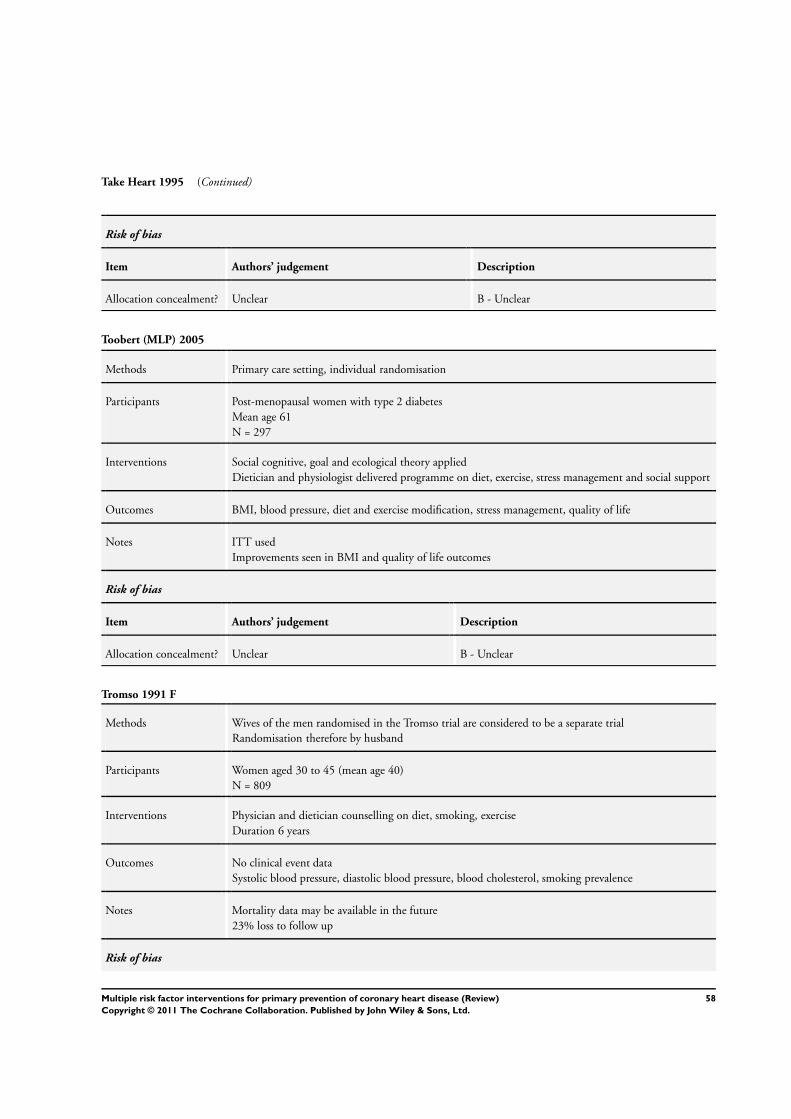
Take Heart 1995 (Continued)
Risk of bias
Item Authors’ judgement Description
Allocation concealment? Unclear B - Unclear
Toobert (MLP) 2005
Methods Primary care setting, individual randomisation
Participants Post-menopausal women with type 2 diabetes
Mean age 61
N = 297
Interventions Social cognitive, goal and ecological theory applied
Dietician and physiologist delivered programme on diet, exercise, stress management and social support
Outcomes BMI, blood pressure, diet and exercise modification, stress management, quality of life
Notes ITT used
Improvements seen in BMI and quality of life outcomes
Risk of bias
Item Authors’ judgement Description
Allocation concealment? Unclear B - Unclear
Tromso 1991 F
Methods Wives of the men randomised in the Tromso trial are considered to be a separate trial
Randomisation therefore by husband
Participants Women aged 30 to 45 (mean age 40)
N = 809
Interventions Physician and dietician counselling on diet, smoking, exercise
Duration 6 years
Outcomes No clinical event data
Systolic blood pressure, diastolic blood pressure, blood cholesterol, smoking prevalence
Notes Mortality data may be available in the future
23% loss to follow up
Risk of bias
58Multiple risk factor interventions for primary prevention of coronary heart disease (Review)
Copyright © 2011 The Cochrane Collaboration. Published by John Wiley & Sons, Ltd.
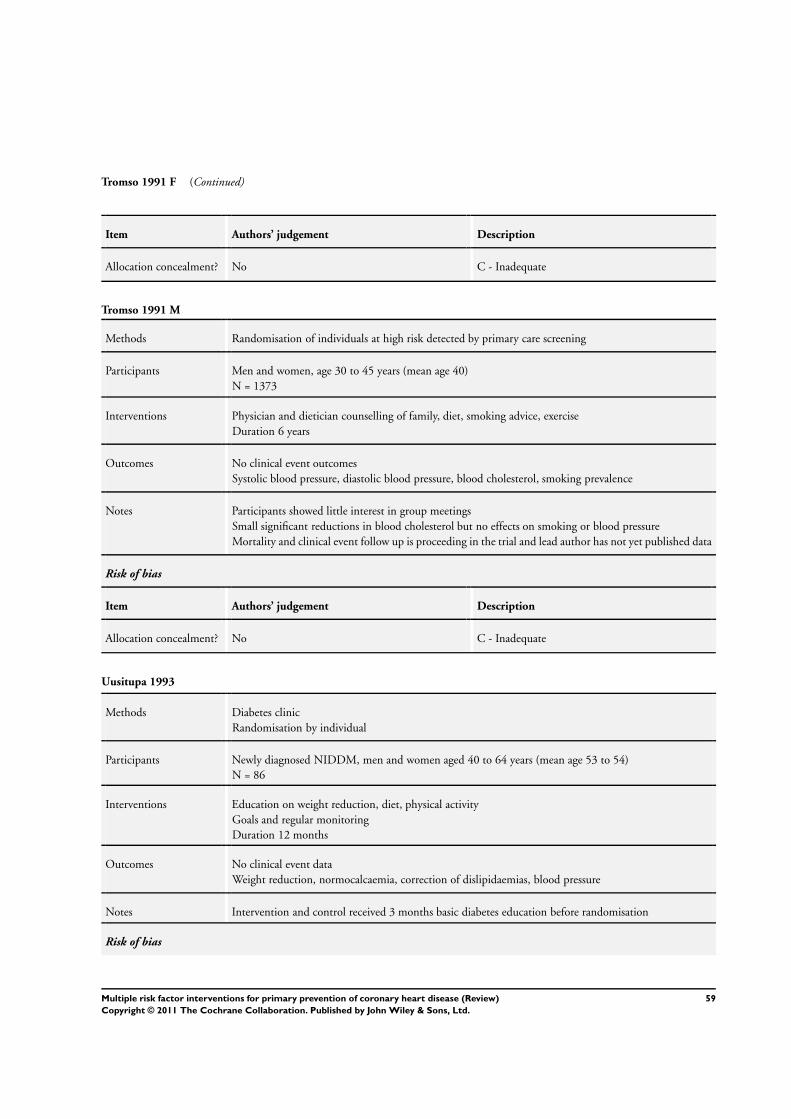
Tromso 1991 F (Continued)
Item Authors’ judgement Description
Allocation concealment? No C - Inadequate
Tromso 1991 M
Methods Randomisation of individuals at high risk detected by primary care screening
Participants Men and women, age 30 to 45 years (mean age 40)
N = 1373
Interventions Physician and dietician counselling of family, diet, smoking advice, exercise
Duration 6 years
Outcomes No clinical event outcomes
Systolic blood pressure, diastolic blood pressure, blood cholesterol, smoking prevalence
Notes Participants showed little interest in group meetings
Small significant reductions in blood cholesterol but no effects on smoking or blood pressure
Mortality and clinical event follow up is proceeding in the trial and lead author has not yet published data
Risk of bias
Item Authors’ judgement Description
Allocation concealment? No C - Inadequate
Uusitupa 1993
Methods Diabetes clinic
Randomisation by individual
Participants Newly diagnosed NIDDM, men and women aged 40 to 64 years (mean age 53 to 54)
N = 86
Interventions Education on weight reduction, diet, physical activity
Goals and regular monitoring
Duration 12 months
Outcomes No clinical event data
Weight reduction, normocalcaemia, correction of dislipidaemias, blood pressure
Notes Intervention and control received 3 months basic diabetes education before randomisation
Risk of bias
59Multiple risk factor interventions for primary prevention of coronary heart disease (Review)
Copyright © 2011 The Cochrane Collaboration. Published by John Wiley & Sons, Ltd.
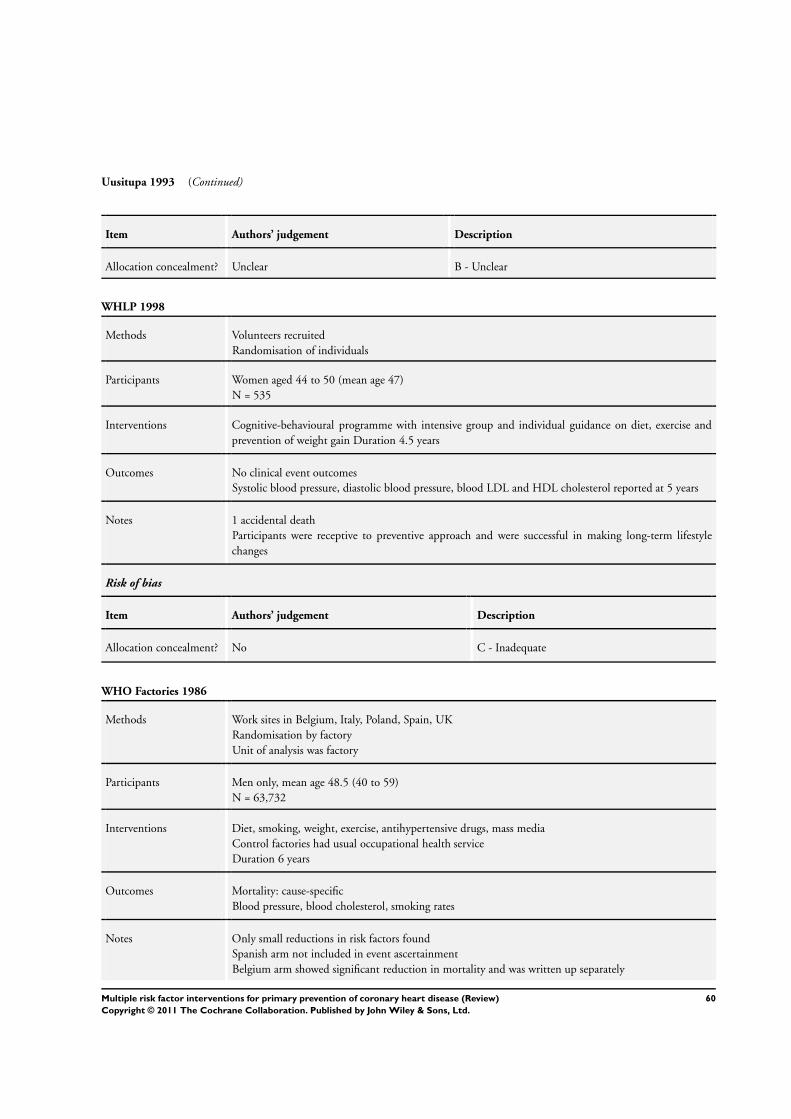
Uusitupa 1993 (Continued)
Item Authors’ judgement Description
Allocation concealment? Unclear B - Unclear
WHLP 1998
Methods Volunteers recruited
Randomisation of individuals
Participants Women aged 44 to 50 (mean age 47)
N = 535
Interventions Cognitive-behavioural programme with intensive group and individual guidance on diet, exercise and
prevention of weight gain Duration 4.5 years
Outcomes No clinical event outcomes
Systolic blood pressure, diastolic blood pressure, blood LDL and HDL cholesterol reported at 5 years
Notes 1 accidental death
Participants were receptive to preventive approach and were successful in making long-term lifestyle
changes
Risk of bias
Item Authors’ judgement Description
Allocation concealment? No C - Inadequate
WHO Factories 1986
Methods Work sites in Belgium, Italy, Poland, Spain, UK
Randomisation by factory
Unit of analysis was factory
Participants Men only, mean age 48.5 (40 to 59)
N = 63,732
Interventions Diet, smoking, weight, exercise, antihypertensive drugs, mass media
Control factories had usual occupational health service
Duration 6 years
Outcomes Mortality: cause-specific
Blood pressure, blood cholesterol, smoking rates
Notes Only small reductions in risk factors found
Spanish arm not included in event ascertainment
Belgium arm showed significant reduction in mortality and was written up separately
60Multiple risk factor interventions for primary prevention of coronary heart disease (Review)
Copyright © 2011 The Cochrane Collaboration. Published by John Wiley & Sons, Ltd.
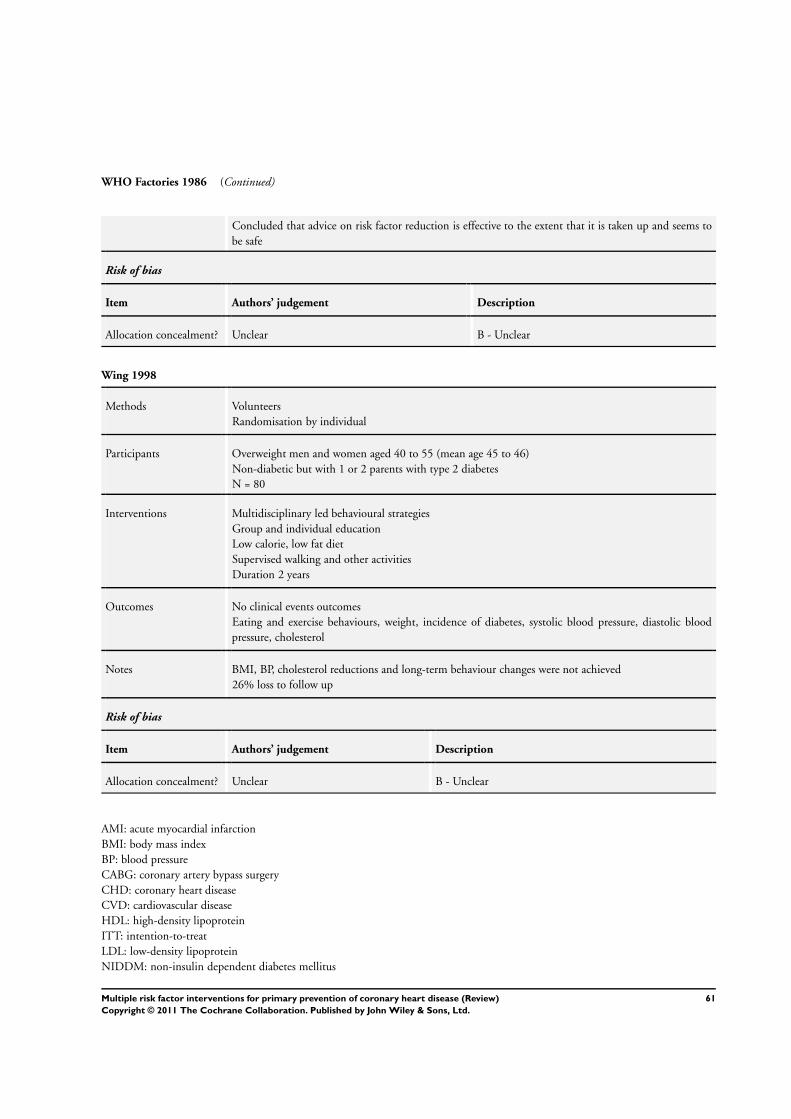
WHO Factories 1986 (Continued)
Concluded that advice on risk factor reduction is effective to the extent that it is taken up and seems to
be safe
Risk of bias
Item Authors’ judgement Description
Allocation concealment? Unclear B - Unclear
Wing 1998
Methods Volunteers
Randomisation by individual
Participants Overweight men and women aged 40 to 55 (mean age 45 to 46)
Non-diabetic but with 1 or 2 parents with type 2 diabetes
N = 80
Interventions Multidisciplinary led behavioural strategies
Group and individual education
Low calorie, low fat diet
Supervised walking and other activities
Duration 2 years
Outcomes No clinical events outcomes
Eating and exercise behaviours, weight, incidence of diabetes, systolic blood pressure, diastolic blood
pressure, cholesterol
Notes BMI, BP, cholesterol reductions and long-term behaviour changes were not achieved
26% loss to follow up
Risk of bias
Item Authors’ judgement Description
Allocation concealment? Unclear B - Unclear
AMI: acute myocardial infarction
BMI: body mass index
BP: blood pressure
CABG: coronary artery bypass surgery
CHD: coronary heart disease
CVD: cardiovascular disease
HDL: high-density lipoprotein
ITT: intention-to-treat
LDL: low-density lipoprotein
NIDDM: non-insulin dependent diabetes mellitus
61Multiple risk factor interventions for primary prevention of coronary heart disease (Review)
Copyright © 2011 The Cochrane Collaboration. Published by John Wiley & Sons, Ltd.
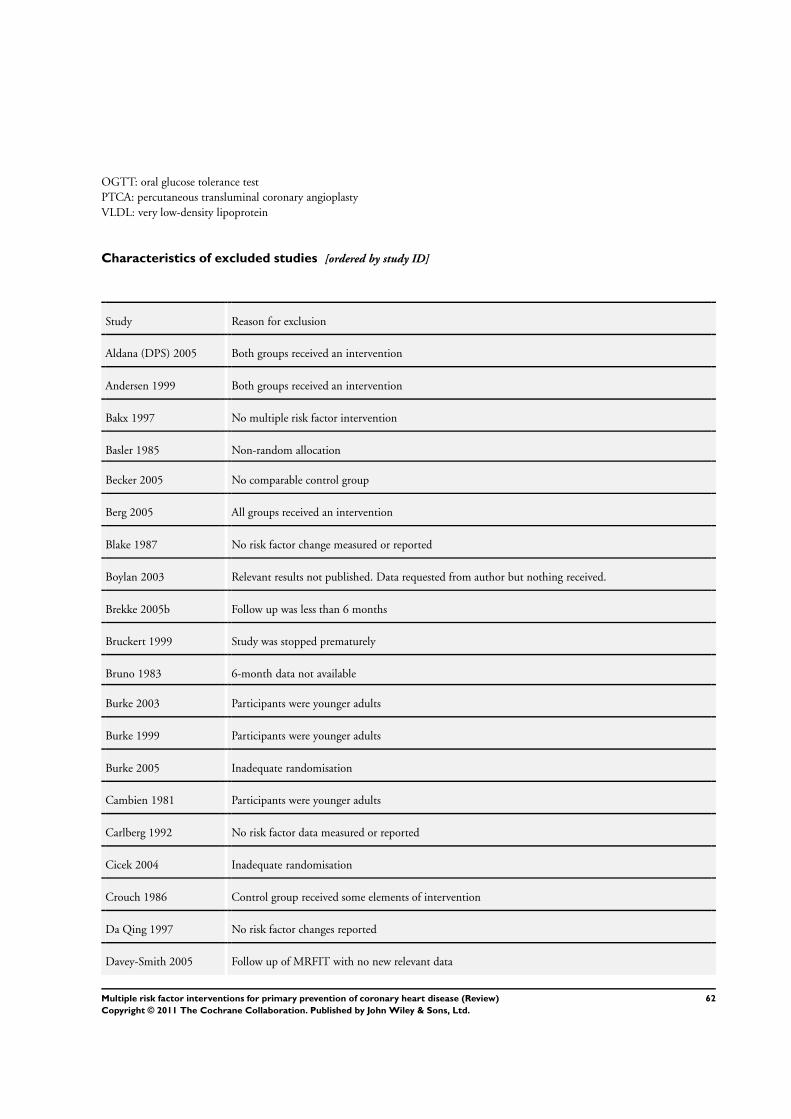
OGTT: oral glucose tolerance test
PTCA: percutaneous transluminal coronary angioplasty
VLDL: very low-density lipoprotein
Characteristics of excluded studies [ordered by study ID]
Study Reason for exclusion
Aldana (DPS) 2005 Both groups received an intervention
Andersen 1999 Both groups received an intervention
Bakx 1997 No multiple risk factor intervention
Basler 1985 Non-random allocation
Becker 2005 No comparable control group
Berg 2005 All groups received an intervention
Blake 1987 No risk factor change measured or reported
Boylan 2003 Relevant results not published. Data requested from author but nothing received.
Brekke 2005b Follow up was less than 6 months
Bruckert 1999 Study was stopped prematurely
Bruno 1983 6-month data not available
Burke 2003 Participants were younger adults
Burke 1999 Participants were younger adults
Burke 2005 Inadequate randomisation
Cambien 1981 Participants were younger adults
Carlberg 1992 No risk factor data measured or reported
Cicek 2004 Inadequate randomisation
Crouch 1986 Control group received some elements of intervention
Da Qing 1997 No risk factor changes reported
Davey-Smith 2005 Follow up of MRFIT with no new relevant data
62Multiple risk factor interventions for primary prevention of coronary heart disease (Review)
Copyright © 2011 The Cochrane Collaboration. Published by John Wiley & Sons, Ltd.
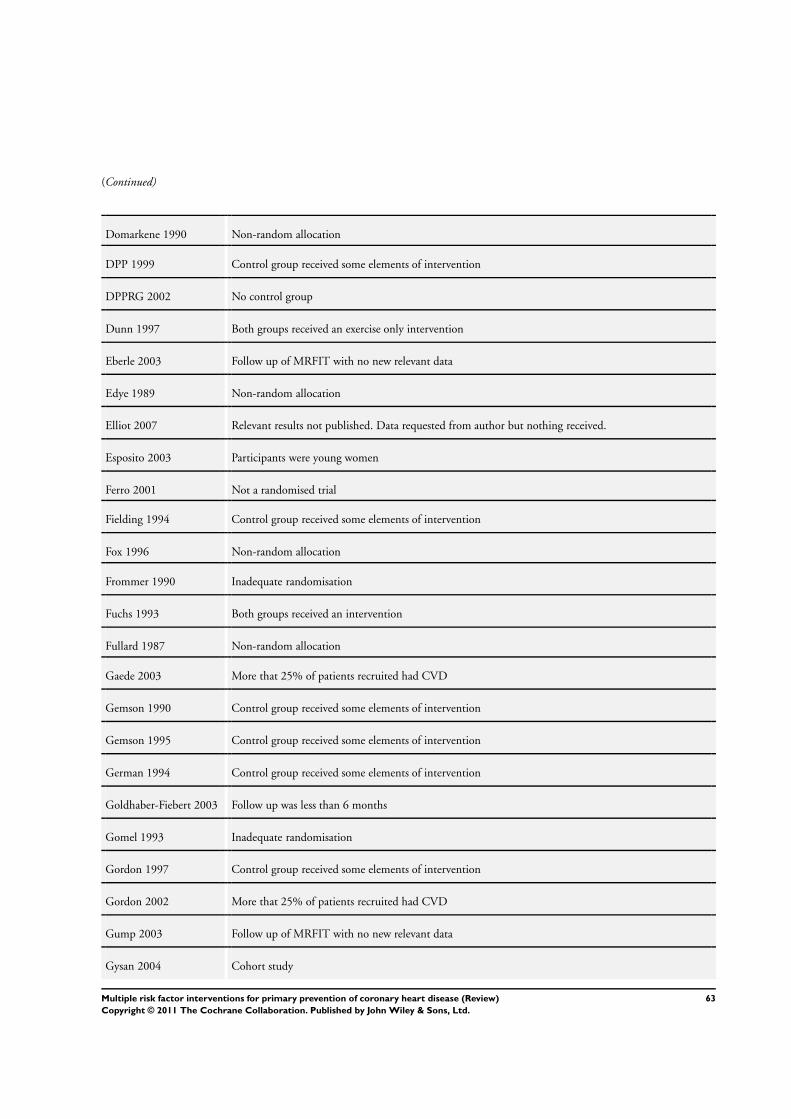
(Continued)
Domarkene 1990 Non-random allocation
DPP 1999 Control group received some elements of intervention
DPPRG 2002 No control group
Dunn 1997 Both groups received an exercise only intervention
Eberle 2003 Follow up of MRFIT with no new relevant data
Edye 1989 Non-random allocation
Elliot 2007 Relevant results not published. Data requested from author but nothing received.
Esposito 2003 Participants were young women
Ferro 2001 Not a randomised trial
Fielding 1994 Control group received some elements of intervention
Fox 1996 Non-random allocation
Frommer 1990 Inadequate randomisation
Fuchs 1993 Both groups received an intervention
Fullard 1987 Non-random allocation
Gaede 2003 More that 25% of patients recruited had CVD
Gemson 1990 Control group received some elements of intervention
Gemson 1995 Control group received some elements of intervention
German 1994 Control group received some elements of intervention
Goldhaber-Fiebert 2003 Follow up was less than 6 months
Gomel 1993 Inadequate randomisation
Gordon 1997 Control group received some elements of intervention
Gordon 2002 More that 25% of patients recruited had CVD
Gump 2003 Follow up of MRFIT with no new relevant data
Gysan 2004 Cohort study
63Multiple risk factor interventions for primary prevention of coronary heart disease (Review)
Copyright © 2011 The Cochrane Collaboration. Published by John Wiley & Sons, Ltd.

(Continued)
Hanlon 1995 6-month data not available
Haskell 1988 Secondary prevention
Hedberg 1998 Non-randomised allocation
Hopman-Rock Drop-out replaced by recruits on reserve during the study
Huang 2001 Incomplete randomisation
Inter99 2003 Ongoing trial using quasi-randomised method
Jiang 2004 Community study
Jula 1990 Inadequate randomisation
Kamioka 2006 Control group received some elements of intervention
Karlehagen 2003 No comparable control group
Kawakami 1999 Participants were younger adults
Ketola 2001 Mixed primary and secondary prevention
Kisioglu 2004 Relevant results not published. Data requested from author but nothing received.
Knappe 1982 Inadequate randomisation
Ko 2004 Unclear if recruited patients had CVD. No response from author.
Kreuter 1996 Outcome is contemplation of quitting smoking
Lasater 1986 No risk factor changes measured or reported
Lauritzen 1995 Intervention was determined by patient choice
Leighton 1990 Control group received some elements of intervention
Lindahl 1998 Uncontrolled study
Little 2004 No results given for control group
Lovibond 1986 Control group received some elements of intervention
Macdonald 1990 RCT assessing simvastatin
64Multiple risk factor interventions for primary prevention of coronary heart disease (Review)
Copyright © 2011 The Cochrane Collaboration. Published by John Wiley & Sons, Ltd.
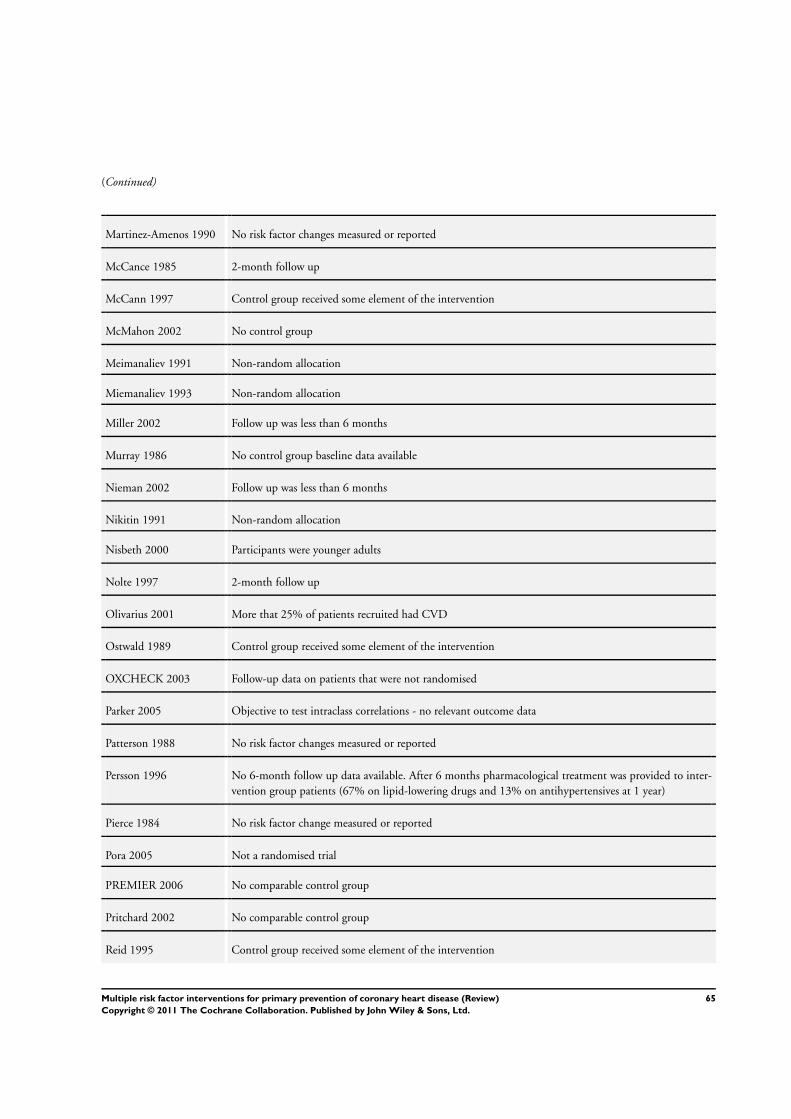
(Continued)
Martinez-Amenos 1990 No risk factor changes measured or reported
McCance 1985 2-month follow up
McCann 1997 Control group received some element of the intervention
McMahon 2002 No control group
Meimanaliev 1991 Non-random allocation
Miemanaliev 1993 Non-random allocation
Miller 2002 Follow up was less than 6 months
Murray 1986 No control group baseline data available
Nieman 2002 Follow up was less than 6 months
Nikitin 1991 Non-random allocation
Nisbeth 2000 Participants were younger adults
Nolte 1997 2-month follow up
Olivarius 2001 More that 25% of patients recruited had CVD
Ostwald 1989 Control group received some element of the intervention
OXCHECK 2003 Follow-up data on patients that were not randomised
Parker 2005 Objective to test intraclass correlations - no relevant outcome data
Patterson 1988 No risk factor changes measured or reported
Persson 1996 No 6-month follow up data available. After 6 months pharmacological treatment was provided to inter-
vention group patients (67% on lipid-lowering drugs and 13% on antihypertensives at 1 year)
Pierce 1984 No risk factor change measured or reported
Pora 2005 Not a randomised trial
PREMIER 2006 No comparable control group
Pritchard 2002 No comparable control group
Reid 1995 Control group received some element of the intervention
65Multiple risk factor interventions for primary prevention of coronary heart disease (Review)
Copyright © 2011 The Cochrane Collaboration. Published by John Wiley & Sons, Ltd.

(Continued)
Robson 1989 No risk factor changes measured or reported
Rosamond 2000 Non-random allocation
Rothman 2004 No multiple risk factor intervention
Rowland 1994 Non-random allocation
S-E London 1977 Intervention not characterised
Sarraf-Zadegan 2003 Ongoing community study
Schwandt 1999 Children and families
Schwedes 2002 More that 25% of patients recruited had CVD
Smith 1991 Non-random allocation
Steinbach 1982 Non-random allocation
Strandberg 2001 82% of patients recruited had CVD
TOMHS 1991 All participants received intervention
TONE 1998 3-month blood pressure follow up
Tonstad 2005 Patients recruited were less than 40 years of age
Tsuyuki 1999 Secondary prevention
Van Elderen 2001 Patients recruited had CVD
Velonakis 1999 Non-random allocation
Volozh 1991 Non-random allocation
Wang 2002 Follow up was less than 6 months
WHP 1999 Numbers in intervention and control group not reported
Wisewoman 1999 Control group received some element of the intervention
Witmer 2004 Follow up was less than 6 months
Woollard 2003 Patients recruited had CVD
Working Well Trial Baseline data only, no follow up
66Multiple risk factor interventions for primary prevention of coronary heart disease (Review)
Copyright © 2011 The Cochrane Collaboration. Published by John Wiley & Sons, Ltd.
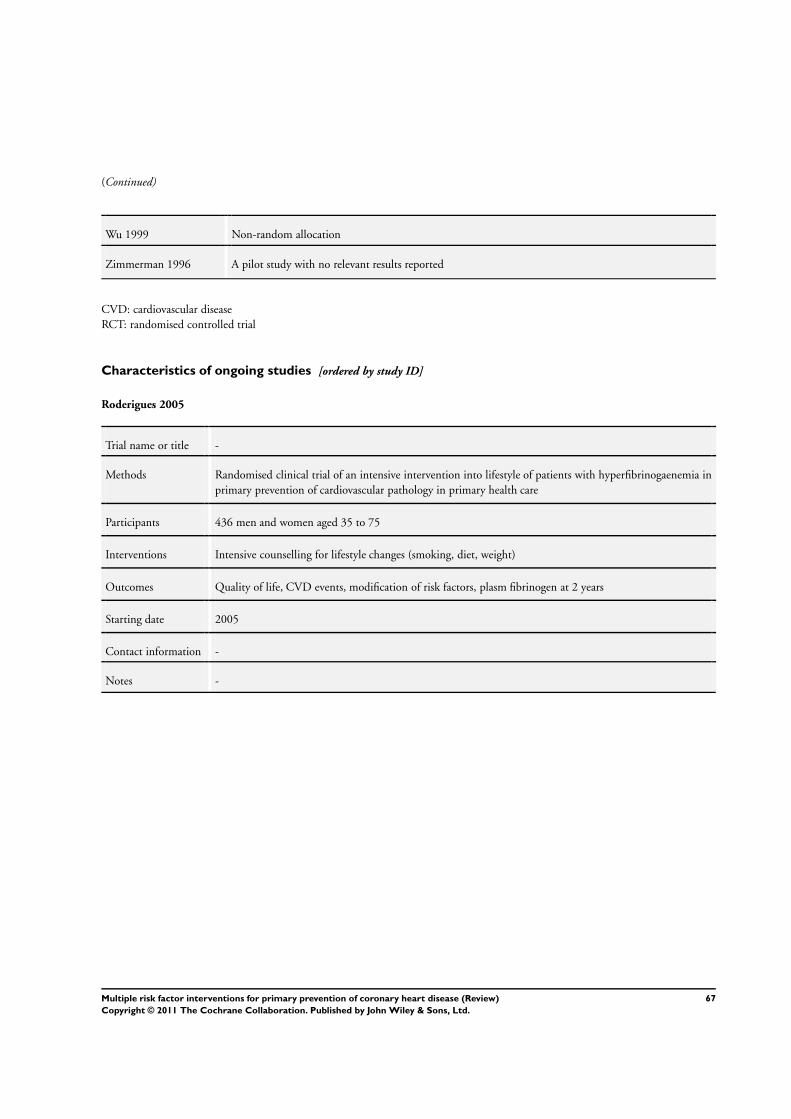
(Continued)
Wu 1999 Non-random allocation
Zimmerman 1996 A pilot study with no relevant results reported
CVD: cardiovascular disease
RCT: randomised controlled trial
Characteristics of ongoing studies [ordered by study ID]
Roderigues 2005
Trial name or title -
Methods Randomised clinical trial of an intensive intervention into lifestyle of patients with hyperfibrinogaenemia in
primary prevention of cardiovascular pathology in primary health care
Participants 436 men and women aged 35 to 75
Interventions Intensive counselling for lifestyle changes (smoking, diet, weight)
Outcomes Quality of life, CVD events, modification of risk factors, plasm fibrinogen at 2 years
Starting date 2005
Contact information -
Notes -
67Multiple risk factor interventions for primary prevention of coronary heart disease (Review)
Copyright © 2011 The Cochrane Collaboration. Published by John Wiley & Sons, Ltd.
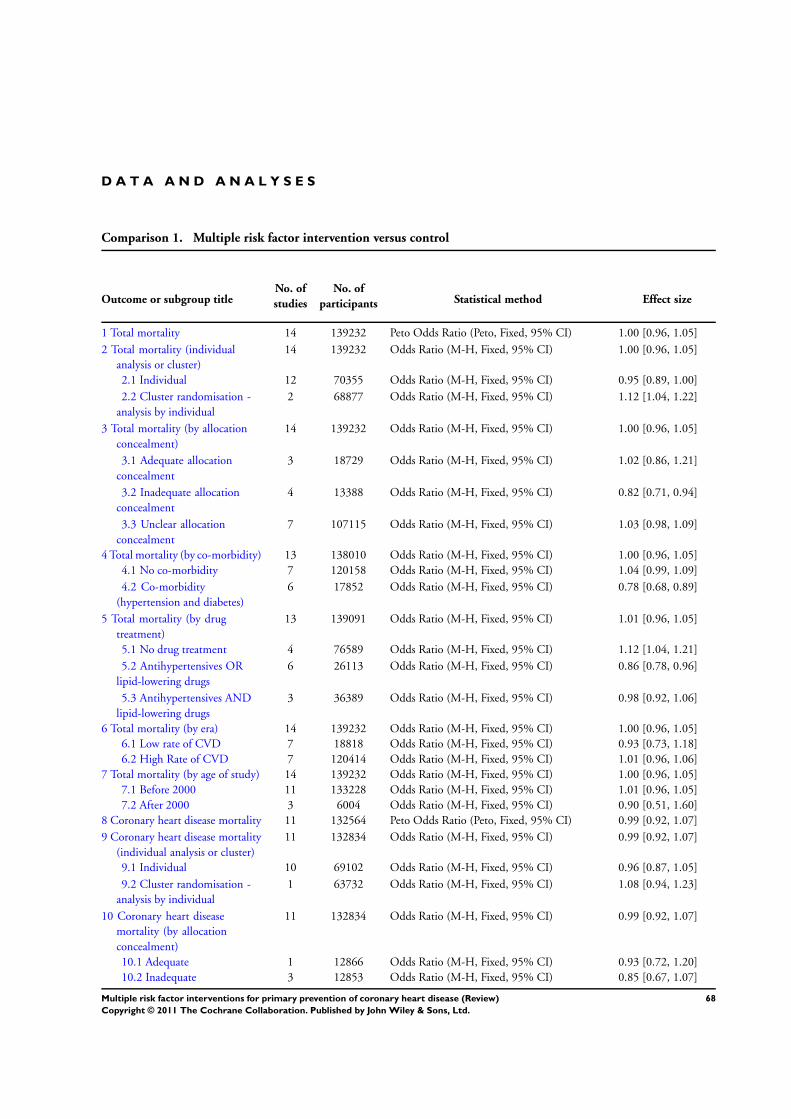
D A T A A N D A N A L Y S E S
Comparison 1. Multiple risk factor intervention versus control
Outcome or subgroup titleNo. of
studies
No. of
participants Statistical method Effect size
1 Total mortality 14 139232 Peto Odds Ratio (Peto, Fixed, 95% CI) 1.00 [0.96, 1.05]
2 Total mortality (individual
analysis or cluster)
14 139232 Odds Ratio (M-H, Fixed, 95% CI) 1.00 [0.96, 1.05]
2.1 Individual 12 70355 Odds Ratio (M-H, Fixed, 95% CI) 0.95 [0.89, 1.00]
2.2 Cluster randomisation -
analysis by individual
2 68877 Odds Ratio (M-H, Fixed, 95% CI) 1.12 [1.04, 1.22]
3 Total mortality (by allocation
concealment)
14 139232 Odds Ratio (M-H, Fixed, 95% CI) 1.00 [0.96, 1.05]
3.1 Adequate allocation
concealment
3 18729 Odds Ratio (M-H, Fixed, 95% CI) 1.02 [0.86, 1.21]
3.2 Inadequate allocation
concealment
4 13388 Odds Ratio (M-H, Fixed, 95% CI) 0.82 [0.71, 0.94]
3.3 Unclear allocation
concealment
7 107115 Odds Ratio (M-H, Fixed, 95% CI) 1.03 [0.98, 1.09]
4 Total mortality (by co-morbidity) 13 138010 Odds Ratio (M-H, Fixed, 95% CI) 1.00 [0.96, 1.05]
4.1 No co-morbidity 7 120158 Odds Ratio (M-H, Fixed, 95% CI) 1.04 [0.99, 1.09]
4.2 Co-morbidity
(hypertension and diabetes)
6 17852 Odds Ratio (M-H, Fixed, 95% CI) 0.78 [0.68, 0.89]
5 Total mortality (by drug
treatment)
13 139091 Odds Ratio (M-H, Fixed, 95% CI) 1.01 [0.96, 1.05]
5.1 No drug treatment 4 76589 Odds Ratio (M-H, Fixed, 95% CI) 1.12 [1.04, 1.21]
5.2 Antihypertensives OR
lipid-lowering drugs
6 26113 Odds Ratio (M-H, Fixed, 95% CI) 0.86 [0.78, 0.96]
5.3 Antihypertensives AND
lipid-lowering drugs
3 36389 Odds Ratio (M-H, Fixed, 95% CI) 0.98 [0.92, 1.06]
6 Total mortality (by era) 14 139232 Odds Ratio (M-H, Fixed, 95% CI) 1.00 [0.96, 1.05]
6.1 Low rate of CVD 7 18818 Odds Ratio (M-H, Fixed, 95% CI) 0.93 [0.73, 1.18]
6.2 High Rate of CVD 7 120414 Odds Ratio (M-H, Fixed, 95% CI) 1.01 [0.96, 1.06]
7 Total mortality (by age of study) 14 139232 Odds Ratio (M-H, Fixed, 95% CI) 1.00 [0.96, 1.05]
7.1 Before 2000 11 133228 Odds Ratio (M-H, Fixed, 95% CI) 1.01 [0.96, 1.05]
7.2 After 2000 3 6004 Odds Ratio (M-H, Fixed, 95% CI) 0.90 [0.51, 1.60]
8 Coronary heart disease mortality 11 132564 Peto Odds Ratio (Peto, Fixed, 95% CI) 0.99 [0.92, 1.07]
9 Coronary heart disease mortality
(individual analysis or cluster)
11 132834 Odds Ratio (M-H, Fixed, 95% CI) 0.99 [0.92, 1.07]
9.1 Individual 10 69102 Odds Ratio (M-H, Fixed, 95% CI) 0.96 [0.87, 1.05]
9.2 Cluster randomisation -
analysis by individual
1 63732 Odds Ratio (M-H, Fixed, 95% CI) 1.08 [0.94, 1.23]
10 Coronary heart disease
mortality (by allocation
concealment)
11 132834 Odds Ratio (M-H, Fixed, 95% CI) 0.99 [0.92, 1.07]
10.1 Adequate 1 12866 Odds Ratio (M-H, Fixed, 95% CI) 0.93 [0.72, 1.20]
10.2 Inadequate 3 12853 Odds Ratio (M-H, Fixed, 95% CI) 0.85 [0.67, 1.07]
68Multiple risk factor interventions for primary prevention of coronary heart disease (Review)
Copyright © 2011 The Cochrane Collaboration. Published by John Wiley & Sons, Ltd.
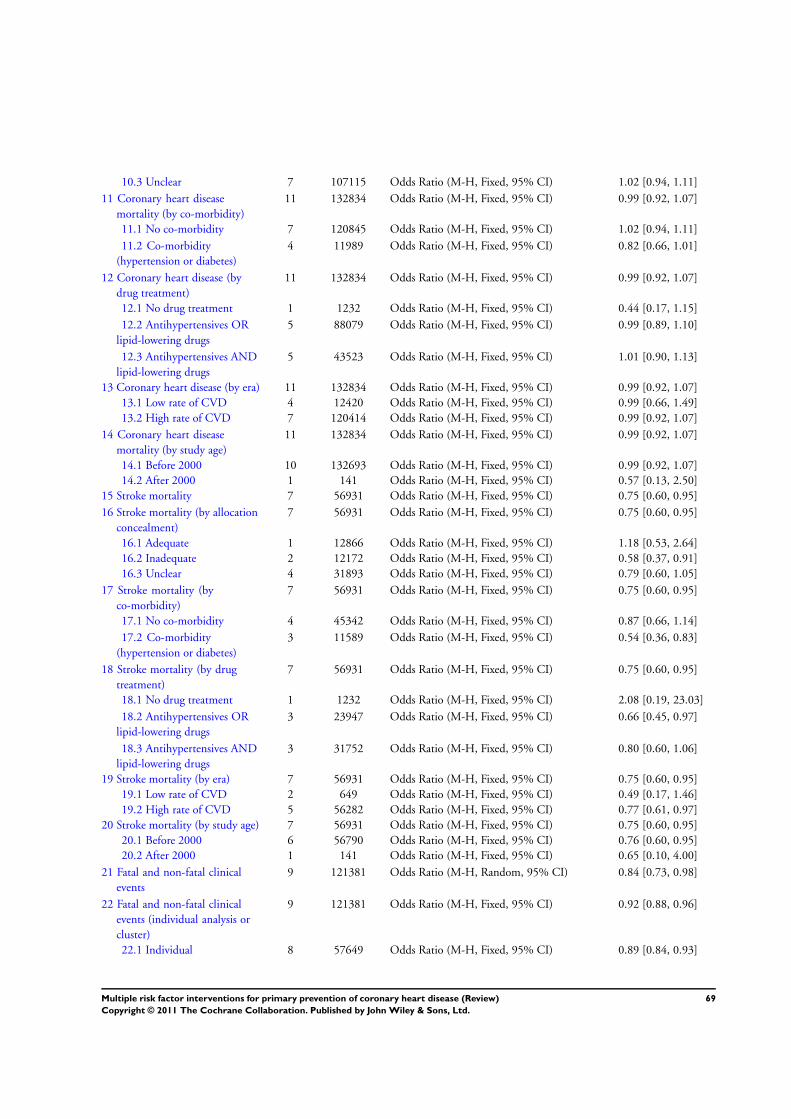
10.3 Unclear 7 107115 Odds Ratio (M-H, Fixed, 95% CI) 1.02 [0.94, 1.11]
11 Coronary heart disease
mortality (by co-morbidity)
11 132834 Odds Ratio (M-H, Fixed, 95% CI) 0.99 [0.92, 1.07]
11.1 No co-morbidity 7 120845 Odds Ratio (M-H, Fixed, 95% CI) 1.02 [0.94, 1.11]
11.2 Co-morbidity
(hypertension or diabetes)
4 11989 Odds Ratio (M-H, Fixed, 95% CI) 0.82 [0.66, 1.01]
12 Coronary heart disease (by
drug treatment)
11 132834 Odds Ratio (M-H, Fixed, 95% CI) 0.99 [0.92, 1.07]
12.1 No drug treatment 1 1232 Odds Ratio (M-H, Fixed, 95% CI) 0.44 [0.17, 1.15]
12.2 Antihypertensives OR
lipid-lowering drugs
5 88079 Odds Ratio (M-H, Fixed, 95% CI) 0.99 [0.89, 1.10]
12.3 Antihypertensives AND
lipid-lowering drugs
5 43523 Odds Ratio (M-H, Fixed, 95% CI) 1.01 [0.90, 1.13]
13 Coronary heart disease (by era) 11 132834 Odds Ratio (M-H, Fixed, 95% CI) 0.99 [0.92, 1.07]
13.1 Low rate of CVD 4 12420 Odds Ratio (M-H, Fixed, 95% CI) 0.99 [0.66, 1.49]
13.2 High rate of CVD 7 120414 Odds Ratio (M-H, Fixed, 95% CI) 0.99 [0.92, 1.07]
14 Coronary heart disease
mortality (by study age)
11 132834 Odds Ratio (M-H, Fixed, 95% CI) 0.99 [0.92, 1.07]
14.1 Before 2000 10 132693 Odds Ratio (M-H, Fixed, 95% CI) 0.99 [0.92, 1.07]
14.2 After 2000 1 141 Odds Ratio (M-H, Fixed, 95% CI) 0.57 [0.13, 2.50]
15 Stroke mortality 7 56931 Odds Ratio (M-H, Fixed, 95% CI) 0.75 [0.60, 0.95]
16 Stroke mortality (by allocation
concealment)
7 56931 Odds Ratio (M-H, Fixed, 95% CI) 0.75 [0.60, 0.95]
16.1 Adequate 1 12866 Odds Ratio (M-H, Fixed, 95% CI) 1.18 [0.53, 2.64]
16.2 Inadequate 2 12172 Odds Ratio (M-H, Fixed, 95% CI) 0.58 [0.37, 0.91]
16.3 Unclear 4 31893 Odds Ratio (M-H, Fixed, 95% CI) 0.79 [0.60, 1.05]
17 Stroke mortality (by
co-morbidity)
7 56931 Odds Ratio (M-H, Fixed, 95% CI) 0.75 [0.60, 0.95]
17.1 No co-morbidity 4 45342 Odds Ratio (M-H, Fixed, 95% CI) 0.87 [0.66, 1.14]
17.2 Co-morbidity
(hypertension or diabetes)
3 11589 Odds Ratio (M-H, Fixed, 95% CI) 0.54 [0.36, 0.83]
18 Stroke mortality (by drug
treatment)
7 56931 Odds Ratio (M-H, Fixed, 95% CI) 0.75 [0.60, 0.95]
18.1 No drug treatment 1 1232 Odds Ratio (M-H, Fixed, 95% CI) 2.08 [0.19, 23.03]
18.2 Antihypertensives OR
lipid-lowering drugs
3 23947 Odds Ratio (M-H, Fixed, 95% CI) 0.66 [0.45, 0.97]
18.3 Antihypertensives AND
lipid-lowering drugs
3 31752 Odds Ratio (M-H, Fixed, 95% CI) 0.80 [0.60, 1.06]
19 Stroke mortality (by era) 7 56931 Odds Ratio (M-H, Fixed, 95% CI) 0.75 [0.60, 0.95]
19.1 Low rate of CVD 2 649 Odds Ratio (M-H, Fixed, 95% CI) 0.49 [0.17, 1.46]
19.2 High rate of CVD 5 56282 Odds Ratio (M-H, Fixed, 95% CI) 0.77 [0.61, 0.97]
20 Stroke mortality (by study age) 7 56931 Odds Ratio (M-H, Fixed, 95% CI) 0.75 [0.60, 0.95]
20.1 Before 2000 6 56790 Odds Ratio (M-H, Fixed, 95% CI) 0.76 [0.60, 0.95]
20.2 After 2000 1 141 Odds Ratio (M-H, Fixed, 95% CI) 0.65 [0.10, 4.00]
21 Fatal and non-fatal clinical
events
9 121381 Odds Ratio (M-H, Random, 95% CI) 0.84 [0.73, 0.98]
22 Fatal and non-fatal clinical
events (individual analysis or
cluster)
9 121381 Odds Ratio (M-H, Fixed, 95% CI) 0.92 [0.88, 0.96]
22.1 Individual 8 57649 Odds Ratio (M-H, Fixed, 95% CI) 0.89 [0.84, 0.93]
69Multiple risk factor interventions for primary prevention of coronary heart disease (Review)
Copyright © 2011 The Cochrane Collaboration. Published by John Wiley & Sons, Ltd.
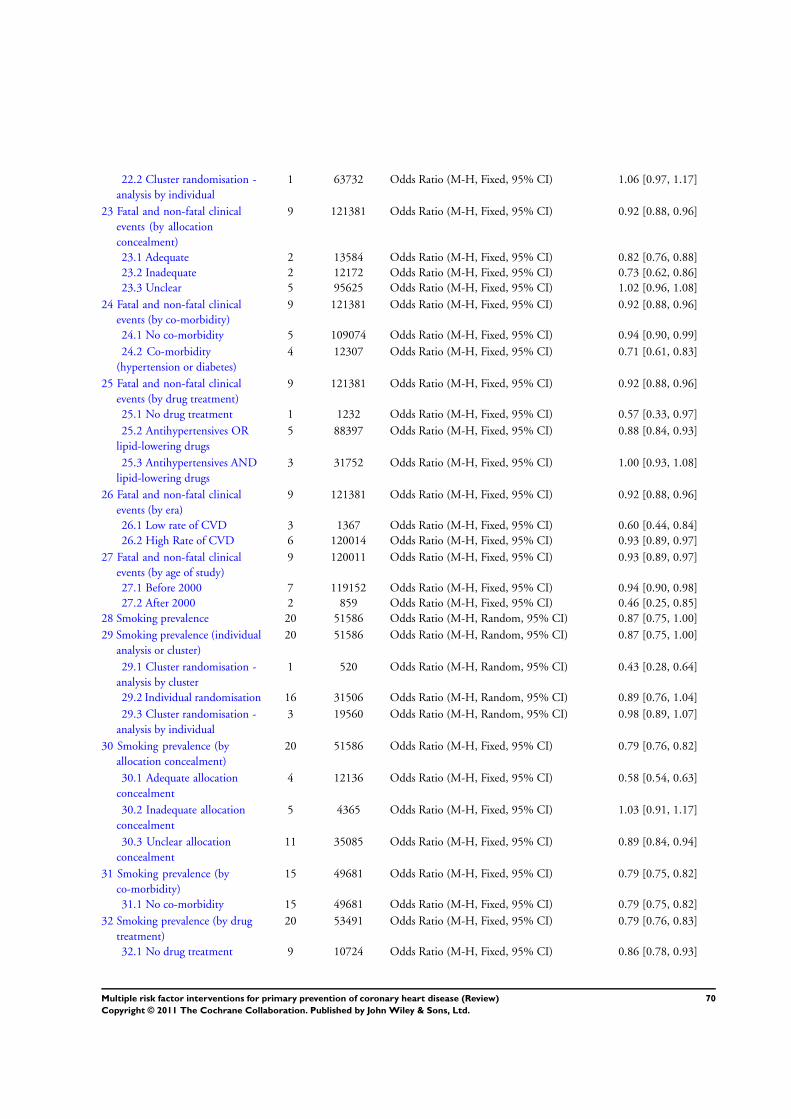
22.2 Cluster randomisation -
analysis by individual
1 63732 Odds Ratio (M-H, Fixed, 95% CI) 1.06 [0.97, 1.17]
23 Fatal and non-fatal clinical
events (by allocation
concealment)
9 121381 Odds Ratio (M-H, Fixed, 95% CI) 0.92 [0.88, 0.96]
23.1 Adequate 2 13584 Odds Ratio (M-H, Fixed, 95% CI) 0.82 [0.76, 0.88]
23.2 Inadequate 2 12172 Odds Ratio (M-H, Fixed, 95% CI) 0.73 [0.62, 0.86]
23.3 Unclear 5 95625 Odds Ratio (M-H, Fixed, 95% CI) 1.02 [0.96, 1.08]
24 Fatal and non-fatal clinical
events (by co-morbidity)
9 121381 Odds Ratio (M-H, Fixed, 95% CI) 0.92 [0.88, 0.96]
24.1 No co-morbidity 5 109074 Odds Ratio (M-H, Fixed, 95% CI) 0.94 [0.90, 0.99]
24.2 Co-morbidity
(hypertension or diabetes)
4 12307 Odds Ratio (M-H, Fixed, 95% CI) 0.71 [0.61, 0.83]
25 Fatal and non-fatal clinical
events (by drug treatment)
9 121381 Odds Ratio (M-H, Fixed, 95% CI) 0.92 [0.88, 0.96]
25.1 No drug treatment 1 1232 Odds Ratio (M-H, Fixed, 95% CI) 0.57 [0.33, 0.97]
25.2 Antihypertensives OR
lipid-lowering drugs
5 88397 Odds Ratio (M-H, Fixed, 95% CI) 0.88 [0.84, 0.93]
25.3 Antihypertensives AND
lipid-lowering drugs
3 31752 Odds Ratio (M-H, Fixed, 95% CI) 1.00 [0.93, 1.08]
26 Fatal and non-fatal clinical
events (by era)
9 121381 Odds Ratio (M-H, Fixed, 95% CI) 0.92 [0.88, 0.96]
26.1 Low rate of CVD 3 1367 Odds Ratio (M-H, Fixed, 95% CI) 0.60 [0.44, 0.84]
26.2 High Rate of CVD 6 120014 Odds Ratio (M-H, Fixed, 95% CI) 0.93 [0.89, 0.97]
27 Fatal and non-fatal clinical
events (by age of study)
9 120011 Odds Ratio (M-H, Fixed, 95% CI) 0.93 [0.89, 0.97]
27.1 Before 2000 7 119152 Odds Ratio (M-H, Fixed, 95% CI) 0.94 [0.90, 0.98]
27.2 After 2000 2 859 Odds Ratio (M-H, Fixed, 95% CI) 0.46 [0.25, 0.85]
28 Smoking prevalence 20 51586 Odds Ratio (M-H, Random, 95% CI) 0.87 [0.75, 1.00]
29 Smoking prevalence (individual
analysis or cluster)
20 51586 Odds Ratio (M-H, Random, 95% CI) 0.87 [0.75, 1.00]
29.1 Cluster randomisation -
analysis by cluster
1 520 Odds Ratio (M-H, Random, 95% CI) 0.43 [0.28, 0.64]
29.2 Individual randomisation 16 31506 Odds Ratio (M-H, Random, 95% CI) 0.89 [0.76, 1.04]
29.3 Cluster randomisation -
analysis by individual
3 19560 Odds Ratio (M-H, Random, 95% CI) 0.98 [0.89, 1.07]
30 Smoking prevalence (by
allocation concealment)
20 51586 Odds Ratio (M-H, Fixed, 95% CI) 0.79 [0.76, 0.82]
30.1 Adequate allocation
concealment
4 12136 Odds Ratio (M-H, Fixed, 95% CI) 0.58 [0.54, 0.63]
30.2 Inadequate allocation
concealment
5 4365 Odds Ratio (M-H, Fixed, 95% CI) 1.03 [0.91, 1.17]
30.3 Unclear allocation
concealment
11 35085 Odds Ratio (M-H, Fixed, 95% CI) 0.89 [0.84, 0.94]
31 Smoking prevalence (by
co-morbidity)
15 49681 Odds Ratio (M-H, Fixed, 95% CI) 0.79 [0.75, 0.82]
31.1 No co-morbidity 15 49681 Odds Ratio (M-H, Fixed, 95% CI) 0.79 [0.75, 0.82]
32 Smoking prevalence (by drug
treatment)
20 53491 Odds Ratio (M-H, Fixed, 95% CI) 0.79 [0.76, 0.83]
32.1 No drug treatment 9 10724 Odds Ratio (M-H, Fixed, 95% CI) 0.86 [0.78, 0.93]
70Multiple risk factor interventions for primary prevention of coronary heart disease (Review)
Copyright © 2011 The Cochrane Collaboration. Published by John Wiley & Sons, Ltd.
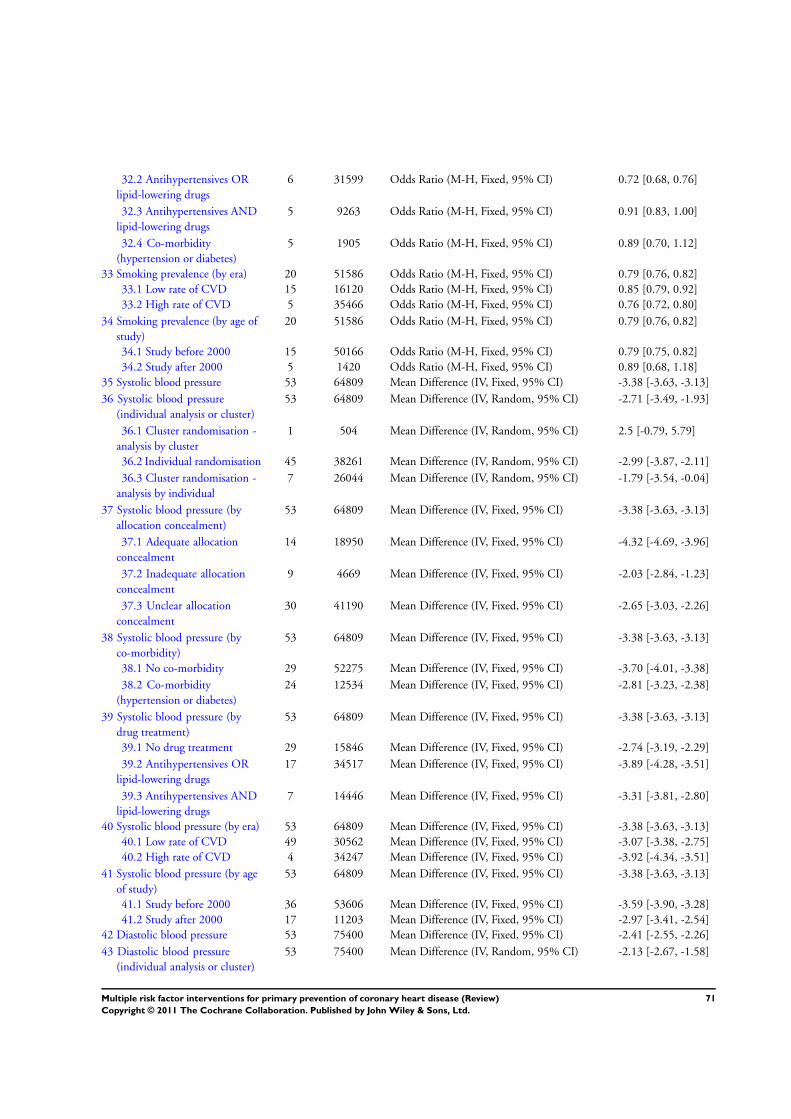
32.2 Antihypertensives OR
lipid-lowering drugs
6 31599 Odds Ratio (M-H, Fixed, 95% CI) 0.72 [0.68, 0.76]
32.3 Antihypertensives AND
lipid-lowering drugs
5 9263 Odds Ratio (M-H, Fixed, 95% CI) 0.91 [0.83, 1.00]
32.4 Co-morbidity
(hypertension or diabetes)
5 1905 Odds Ratio (M-H, Fixed, 95% CI) 0.89 [0.70, 1.12]
33 Smoking prevalence (by era) 20 51586 Odds Ratio (M-H, Fixed, 95% CI) 0.79 [0.76, 0.82]
33.1 Low rate of CVD 15 16120 Odds Ratio (M-H, Fixed, 95% CI) 0.85 [0.79, 0.92]
33.2 High rate of CVD 5 35466 Odds Ratio (M-H, Fixed, 95% CI) 0.76 [0.72, 0.80]
34 Smoking prevalence (by age of
study)
20 51586 Odds Ratio (M-H, Fixed, 95% CI) 0.79 [0.76, 0.82]
34.1 Study before 2000 15 50166 Odds Ratio (M-H, Fixed, 95% CI) 0.79 [0.75, 0.82]
34.2 Study after 2000 5 1420 Odds Ratio (M-H, Fixed, 95% CI) 0.89 [0.68, 1.18]
35 Systolic blood pressure 53 64809 Mean Difference (IV, Fixed, 95% CI) -3.38 [-3.63, -3.13]
36 Systolic blood pressure
(individual analysis or cluster)
53 64809 Mean Difference (IV, Random, 95% CI) -2.71 [-3.49, -1.93]
36.1 Cluster randomisation -
analysis by cluster
1 504 Mean Difference (IV, Random, 95% CI) 2.5 [-0.79, 5.79]
36.2 Individual randomisation 45 38261 Mean Difference (IV, Random, 95% CI) -2.99 [-3.87, -2.11]
36.3 Cluster randomisation -
analysis by individual
7 26044 Mean Difference (IV, Random, 95% CI) -1.79 [-3.54, -0.04]
37 Systolic blood pressure (by
allocation concealment)
53 64809 Mean Difference (IV, Fixed, 95% CI) -3.38 [-3.63, -3.13]
37.1 Adequate allocation
concealment
14 18950 Mean Difference (IV, Fixed, 95% CI) -4.32 [-4.69, -3.96]
37.2 Inadequate allocation
concealment
9 4669 Mean Difference (IV, Fixed, 95% CI) -2.03 [-2.84, -1.23]
37.3 Unclear allocation
concealment
30 41190 Mean Difference (IV, Fixed, 95% CI) -2.65 [-3.03, -2.26]
38 Systolic blood pressure (by
co-morbidity)
53 64809 Mean Difference (IV, Fixed, 95% CI) -3.38 [-3.63, -3.13]
38.1 No co-morbidity 29 52275 Mean Difference (IV, Fixed, 95% CI) -3.70 [-4.01, -3.38]
38.2 Co-morbidity
(hypertension or diabetes)
24 12534 Mean Difference (IV, Fixed, 95% CI) -2.81 [-3.23, -2.38]
39 Systolic blood pressure (by
drug treatment)
53 64809 Mean Difference (IV, Fixed, 95% CI) -3.38 [-3.63, -3.13]
39.1 No drug treatment 29 15846 Mean Difference (IV, Fixed, 95% CI) -2.74 [-3.19, -2.29]
39.2 Antihypertensives OR
lipid-lowering drugs
17 34517 Mean Difference (IV, Fixed, 95% CI) -3.89 [-4.28, -3.51]
39.3 Antihypertensives AND
lipid-lowering drugs
7 14446 Mean Difference (IV, Fixed, 95% CI) -3.31 [-3.81, -2.80]
40 Systolic blood pressure (by era) 53 64809 Mean Difference (IV, Fixed, 95% CI) -3.38 [-3.63, -3.13]
40.1 Low rate of CVD 49 30562 Mean Difference (IV, Fixed, 95% CI) -3.07 [-3.38, -2.75]
40.2 High rate of CVD 4 34247 Mean Difference (IV, Fixed, 95% CI) -3.92 [-4.34, -3.51]
41 Systolic blood pressure (by age
of study)
53 64809 Mean Difference (IV, Fixed, 95% CI) -3.38 [-3.63, -3.13]
41.1 Study before 2000 36 53606 Mean Difference (IV, Fixed, 95% CI) -3.59 [-3.90, -3.28]
41.2 Study after 2000 17 11203 Mean Difference (IV, Fixed, 95% CI) -2.97 [-3.41, -2.54]
42 Diastolic blood pressure 53 75400 Mean Difference (IV, Fixed, 95% CI) -2.41 [-2.55, -2.26]
43 Diastolic blood pressure
(individual analysis or cluster)
53 75400 Mean Difference (IV, Random, 95% CI) -2.13 [-2.67, -1.58]
71Multiple risk factor interventions for primary prevention of coronary heart disease (Review)
Copyright © 2011 The Cochrane Collaboration. Published by John Wiley & Sons, Ltd.
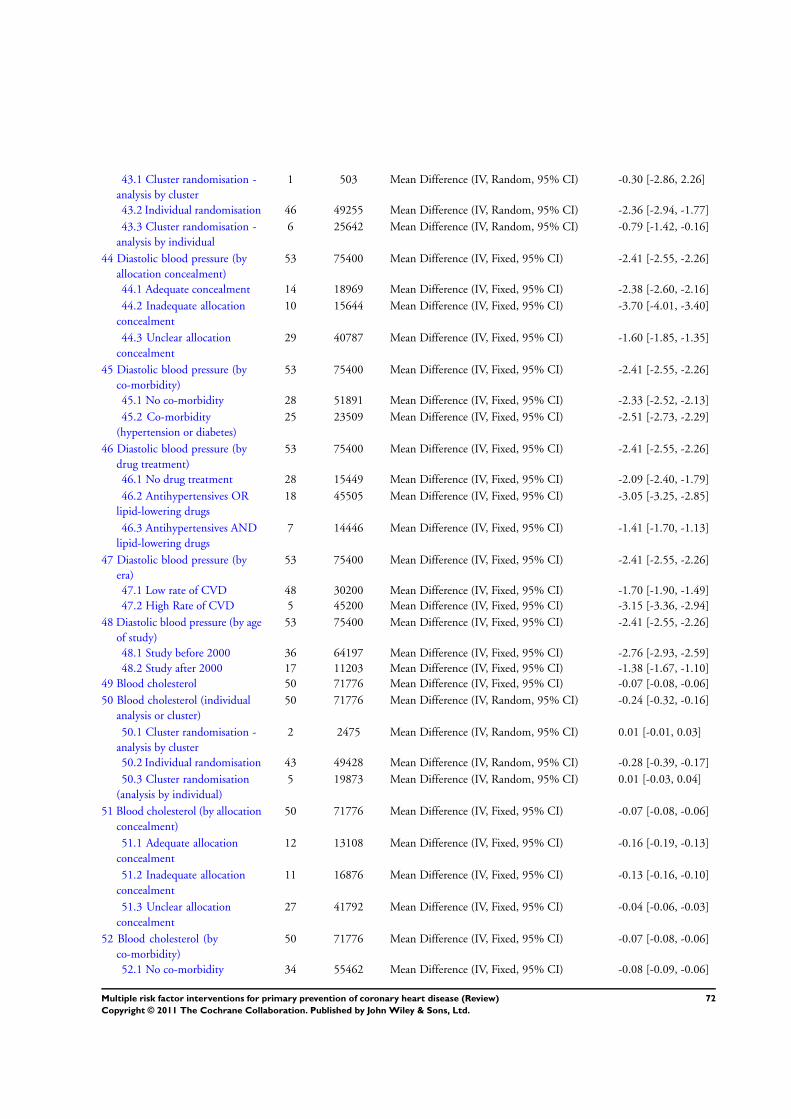
43.1 Cluster randomisation -
analysis by cluster
1 503 Mean Difference (IV, Random, 95% CI) -0.30 [-2.86, 2.26]
43.2 Individual randomisation 46 49255 Mean Difference (IV, Random, 95% CI) -2.36 [-2.94, -1.77]
43.3 Cluster randomisation -
analysis by individual
6 25642 Mean Difference (IV, Random, 95% CI) -0.79 [-1.42, -0.16]
44 Diastolic blood pressure (by
allocation concealment)
53 75400 Mean Difference (IV, Fixed, 95% CI) -2.41 [-2.55, -2.26]
44.1 Adequate concealment 14 18969 Mean Difference (IV, Fixed, 95% CI) -2.38 [-2.60, -2.16]
44.2 Inadequate allocation
concealment
10 15644 Mean Difference (IV, Fixed, 95% CI) -3.70 [-4.01, -3.40]
44.3 Unclear allocation
concealment
29 40787 Mean Difference (IV, Fixed, 95% CI) -1.60 [-1.85, -1.35]
45 Diastolic blood pressure (by
co-morbidity)
53 75400 Mean Difference (IV, Fixed, 95% CI) -2.41 [-2.55, -2.26]
45.1 No co-morbidity 28 51891 Mean Difference (IV, Fixed, 95% CI) -2.33 [-2.52, -2.13]
45.2 Co-morbidity
(hypertension or diabetes)
25 23509 Mean Difference (IV, Fixed, 95% CI) -2.51 [-2.73, -2.29]
46 Diastolic blood pressure (by
drug treatment)
53 75400 Mean Difference (IV, Fixed, 95% CI) -2.41 [-2.55, -2.26]
46.1 No drug treatment 28 15449 Mean Difference (IV, Fixed, 95% CI) -2.09 [-2.40, -1.79]
46.2 Antihypertensives OR
lipid-lowering drugs
18 45505 Mean Difference (IV, Fixed, 95% CI) -3.05 [-3.25, -2.85]
46.3 Antihypertensives AND
lipid-lowering drugs
7 14446 Mean Difference (IV, Fixed, 95% CI) -1.41 [-1.70, -1.13]
47 Diastolic blood pressure (by
era)
53 75400 Mean Difference (IV, Fixed, 95% CI) -2.41 [-2.55, -2.26]
47.1 Low rate of CVD 48 30200 Mean Difference (IV, Fixed, 95% CI) -1.70 [-1.90, -1.49]
47.2 High Rate of CVD 5 45200 Mean Difference (IV, Fixed, 95% CI) -3.15 [-3.36, -2.94]
48 Diastolic blood pressure (by age
of study)
53 75400 Mean Difference (IV, Fixed, 95% CI) -2.41 [-2.55, -2.26]
48.1 Study before 2000 36 64197 Mean Difference (IV, Fixed, 95% CI) -2.76 [-2.93, -2.59]
48.2 Study after 2000 17 11203 Mean Difference (IV, Fixed, 95% CI) -1.38 [-1.67, -1.10]
49 Blood cholesterol 50 71776 Mean Difference (IV, Fixed, 95% CI) -0.07 [-0.08, -0.06]
50 Blood cholesterol (individual
analysis or cluster)
50 71776 Mean Difference (IV, Random, 95% CI) -0.24 [-0.32, -0.16]
50.1 Cluster randomisation -
analysis by cluster
2 2475 Mean Difference (IV, Random, 95% CI) 0.01 [-0.01, 0.03]
50.2 Individual randomisation 43 49428 Mean Difference (IV, Random, 95% CI) -0.28 [-0.39, -0.17]
50.3 Cluster randomisation
(analysis by individual)
5 19873 Mean Difference (IV, Random, 95% CI) 0.01 [-0.03, 0.04]
51 Blood cholesterol (by allocation
concealment)
50 71776 Mean Difference (IV, Fixed, 95% CI) -0.07 [-0.08, -0.06]
51.1 Adequate allocation
concealment
12 13108 Mean Difference (IV, Fixed, 95% CI) -0.16 [-0.19, -0.13]
51.2 Inadequate allocation
concealment
11 16876 Mean Difference (IV, Fixed, 95% CI) -0.13 [-0.16, -0.10]
51.3 Unclear allocation
concealment
27 41792 Mean Difference (IV, Fixed, 95% CI) -0.04 [-0.06, -0.03]
52 Blood cholesterol (by
co-morbidity)
50 71776 Mean Difference (IV, Fixed, 95% CI) -0.07 [-0.08, -0.06]
52.1 No co-morbidity 34 55462 Mean Difference (IV, Fixed, 95% CI) -0.08 [-0.09, -0.06]
72Multiple risk factor interventions for primary prevention of coronary heart disease (Review)
Copyright © 2011 The Cochrane Collaboration. Published by John Wiley & Sons, Ltd.
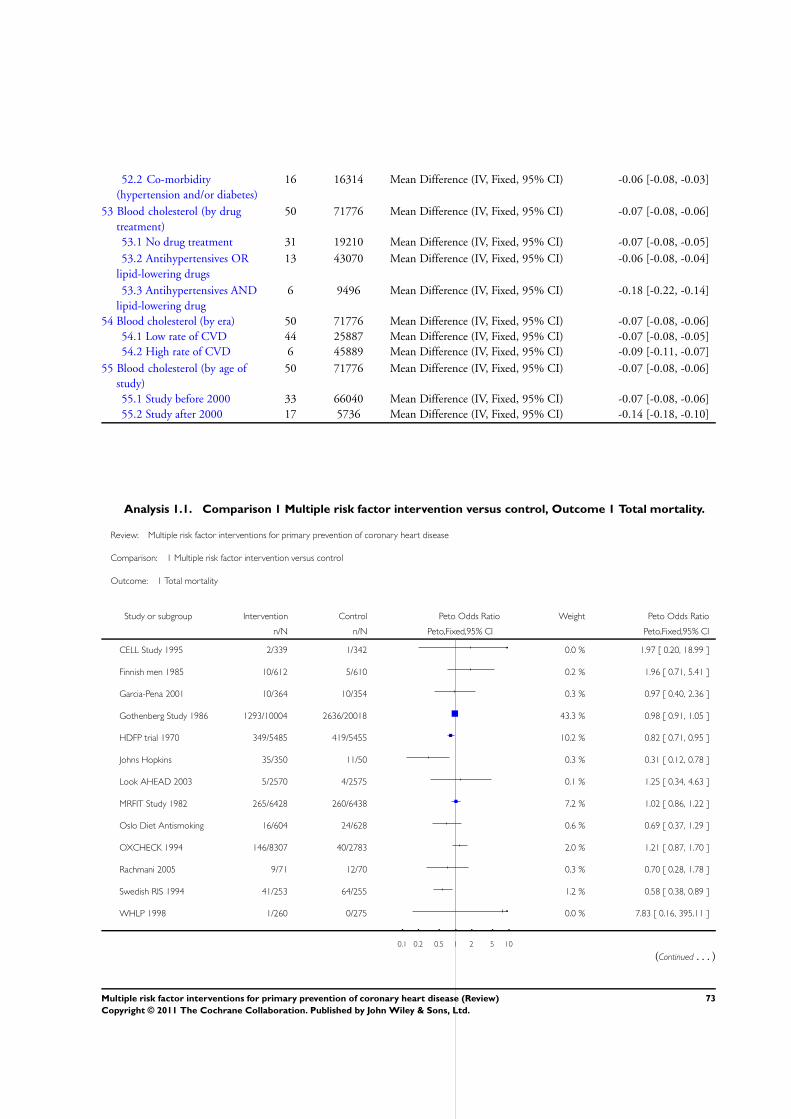
52.2 Co-morbidity
(hypertension and/or diabetes)
16 16314 Mean Difference (IV, Fixed, 95% CI) -0.06 [-0.08, -0.03]
53 Blood cholesterol (by drug
treatment)
50 71776 Mean Difference (IV, Fixed, 95% CI) -0.07 [-0.08, -0.06]
53.1 No drug treatment 31 19210 Mean Difference (IV, Fixed, 95% CI) -0.07 [-0.08, -0.05]
53.2 Antihypertensives OR
lipid-lowering drugs
13 43070 Mean Difference (IV, Fixed, 95% CI) -0.06 [-0.08, -0.04]
53.3 Antihypertensives AND
lipid-lowering drug
6 9496 Mean Difference (IV, Fixed, 95% CI) -0.18 [-0.22, -0.14]
54 Blood cholesterol (by era) 50 71776 Mean Difference (IV, Fixed, 95% CI) -0.07 [-0.08, -0.06]
54.1 Low rate of CVD 44 25887 Mean Difference (IV, Fixed, 95% CI) -0.07 [-0.08, -0.05]
54.2 High rate of CVD 6 45889 Mean Difference (IV, Fixed, 95% CI) -0.09 [-0.11, -0.07]
55 Blood cholesterol (by age of
study)
50 71776 Mean Difference (IV, Fixed, 95% CI) -0.07 [-0.08, -0.06]
55.1 Study before 2000 33 66040 Mean Difference (IV, Fixed, 95% CI) -0.07 [-0.08, -0.06]
55.2 Study after 2000 17 5736 Mean Difference (IV, Fixed, 95% CI) -0.14 [-0.18, -0.10]
Analysis 1.1. Comparison 1 Multiple risk factor intervention versus control, Outcome 1 Total mortality.
Review: Multiple risk factor interventions for primary prevention of coronary heart disease
Comparison: 1 Multiple risk factor intervention versus control
Outcome: 1 Total mortality
Study or subgroup Intervention Control Peto Odds Ratio Weight Peto Odds Ratio
n/N n/N Peto,Fixed,95% CI Peto,Fixed,95% CI
CELL Study 1995 2/339 1/342 0.0 % 1.97 [ 0.20, 18.99 ]
Finnish men 1985 10/612 5/610 0.2 % 1.96 [ 0.71, 5.41 ]
Garcia-Pena 2001 10/364 10/354 0.3 % 0.97 [ 0.40, 2.36 ]
Gothenberg Study 1986 1293/10004 2636/20018 43.3 % 0.98 [ 0.91, 1.05 ]
HDFP trial 1970 349/5485 419/5455 10.2 % 0.82 [ 0.71, 0.95 ]
Johns Hopkins 35/350 11/50 0.3 % 0.31 [ 0.12, 0.78 ]
Look AHEAD 2003 5/2570 4/2575 0.1 % 1.25 [ 0.34, 4.63 ]
MRFIT Study 1982 265/6428 260/6438 7.2 % 1.02 [ 0.86, 1.22 ]
Oslo Diet Antismoking 16/604 24/628 0.6 % 0.69 [ 0.37, 1.29 ]
OXCHECK 1994 146/8307 40/2783 2.0 % 1.21 [ 0.87, 1.70 ]
Rachmani 2005 9/71 12/70 0.3 % 0.70 [ 0.28, 1.78 ]
Swedish RIS 1994 41/253 64/255 1.2 % 0.58 [ 0.38, 0.89 ]
WHLP 1998 1/260 0/275 0.0 % 7.83 [ 0.16, 395.11 ]
0.1 0.2 0.5 1 2 5 10
(Continued . . . )
73Multiple risk factor interventions for primary prevention of coronary heart disease (Review)
Copyright © 2011 The Cochrane Collaboration. Published by John Wiley & Sons, Ltd.
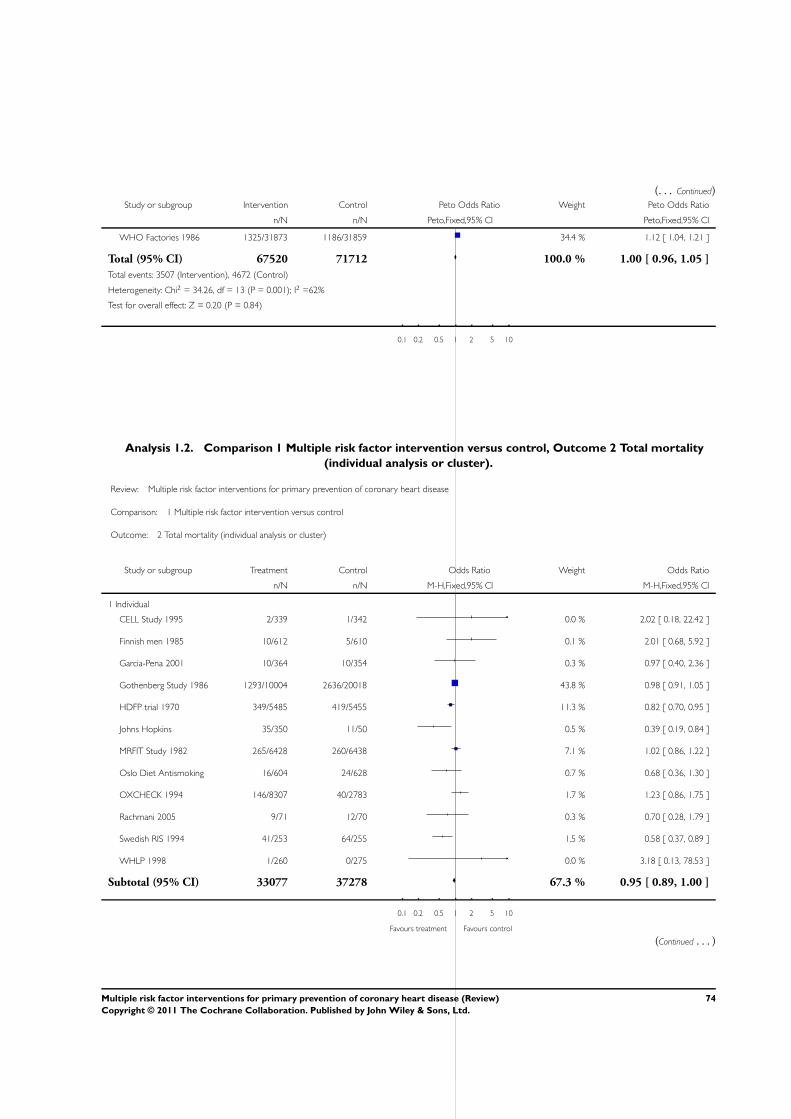
(. . . Continued)Study or subgroup Intervention Control Peto Odds Ratio Weight Peto Odds Ratio
n/N n/N Peto,Fixed,95% CI Peto,Fixed,95% CI
WHO Factories 1986 1325/31873 1186/31859 34.4 % 1.12 [ 1.04, 1.21 ]
Total (95% CI) 67520 71712 100.0 % 1.00 [ 0.96, 1.05 ]
Total events: 3507 (Intervention), 4672 (Control)
Heterogeneity: Chi2 = 34.26, df = 13 (P = 0.001); I2 =62%
Test for overall effect: Z = 0.20 (P = 0.84)
0.1 0.2 0.5 1 2 5 10
Analysis 1.2. Comparison 1 Multiple risk factor intervention versus control, Outcome 2 Total mortality
(individual analysis or cluster).
Review: Multiple risk factor interventions for primary prevention of coronary heart disease
Comparison: 1 Multiple risk factor intervention versus control
Outcome: 2 Total mortality (individual analysis or cluster)
Study or subgroup Treatment Control Odds Ratio Weight Odds Ratio
n/N n/N M-H,Fixed,95% CI M-H,Fixed,95% CI
1 Individual
CELL Study 1995 2/339 1/342 0.0 % 2.02 [ 0.18, 22.42 ]
Finnish men 1985 10/612 5/610 0.1 % 2.01 [ 0.68, 5.92 ]
Garcia-Pena 2001 10/364 10/354 0.3 % 0.97 [ 0.40, 2.36 ]
Gothenberg Study 1986 1293/10004 2636/20018 43.8 % 0.98 [ 0.91, 1.05 ]
HDFP trial 1970 349/5485 419/5455 11.3 % 0.82 [ 0.70, 0.95 ]
Johns Hopkins 35/350 11/50 0.5 % 0.39 [ 0.19, 0.84 ]
MRFIT Study 1982 265/6428 260/6438 7.1 % 1.02 [ 0.86, 1.22 ]
Oslo Diet Antismoking 16/604 24/628 0.7 % 0.68 [ 0.36, 1.30 ]
OXCHECK 1994 146/8307 40/2783 1.7 % 1.23 [ 0.86, 1.75 ]
Rachmani 2005 9/71 12/70 0.3 % 0.70 [ 0.28, 1.79 ]
Swedish RIS 1994 41/253 64/255 1.5 % 0.58 [ 0.37, 0.89 ]
WHLP 1998 1/260 0/275 0.0 % 3.18 [ 0.13, 78.53 ]
Subtotal (95% CI) 33077 37278 67.3 % 0.95 [ 0.89, 1.00 ]
0.1 0.2 0.5 1 2 5 10
Favours treatment Favours control
(Continued . . . )
74Multiple risk factor interventions for primary prevention of coronary heart disease (Review)
Copyright © 2011 The Cochrane Collaboration. Published by John Wiley & Sons, Ltd.
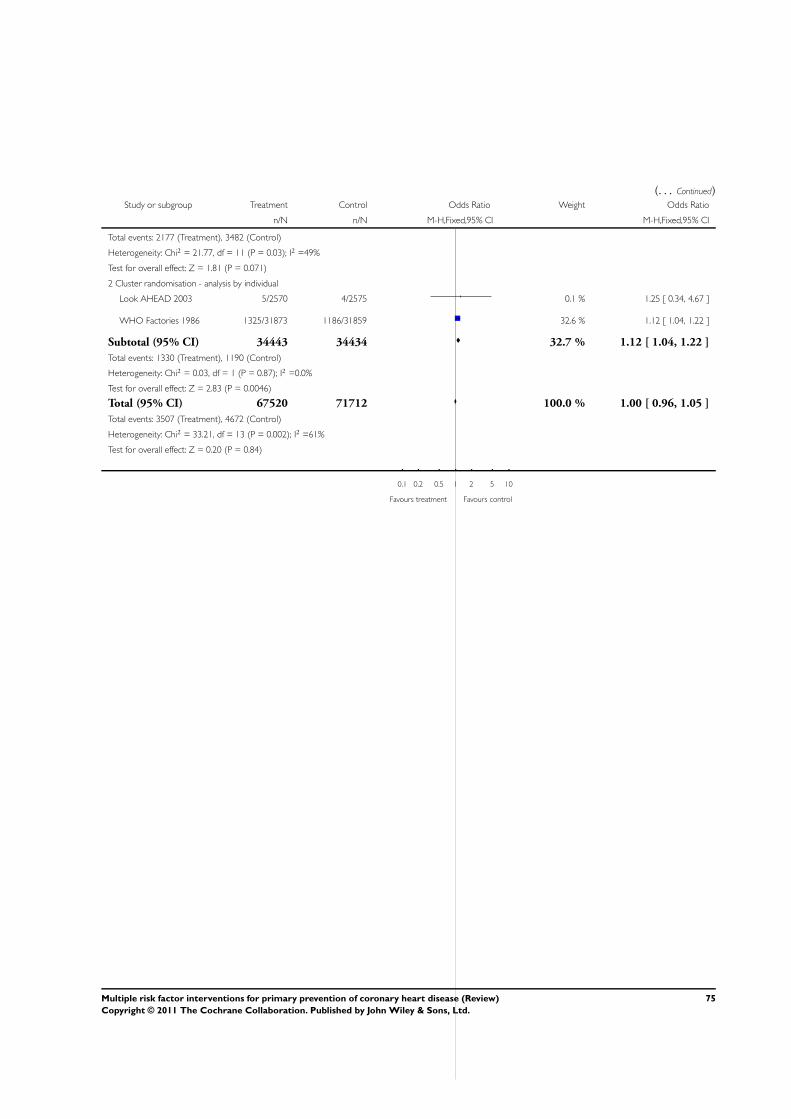
(. . . Continued)Study or subgroup Treatment Control Odds Ratio Weight Odds Ratio
n/N n/N M-H,Fixed,95% CI M-H,Fixed,95% CI
Total events: 2177 (Treatment), 3482 (Control)
Heterogeneity: Chi2 = 21.77, df = 11 (P = 0.03); I2 =49%
Test for overall effect: Z = 1.81 (P = 0.071)
2 Cluster randomisation - analysis by individual
Look AHEAD 2003 5/2570 4/2575 0.1 % 1.25 [ 0.34, 4.67 ]
WHO Factories 1986 1325/31873 1186/31859 32.6 % 1.12 [ 1.04, 1.22 ]
Subtotal (95% CI) 34443 34434 32.7 % 1.12 [ 1.04, 1.22 ]
Total events: 1330 (Treatment), 1190 (Control)
Heterogeneity: Chi2 = 0.03, df = 1 (P = 0.87); I2 =0.0%
Test for overall effect: Z = 2.83 (P = 0.0046)
Total (95% CI) 67520 71712 100.0 % 1.00 [ 0.96, 1.05 ]
Total events: 3507 (Treatment), 4672 (Control)
Heterogeneity: Chi2 = 33.21, df = 13 (P = 0.002); I2 =61%
Test for overall effect: Z = 0.20 (P = 0.84)
0.1 0.2 0.5 1 2 5 10
Favours treatment Favours control
75Multiple risk factor interventions for primary prevention of coronary heart disease (Review)
Copyright © 2011 The Cochrane Collaboration. Published by John Wiley & Sons, Ltd.
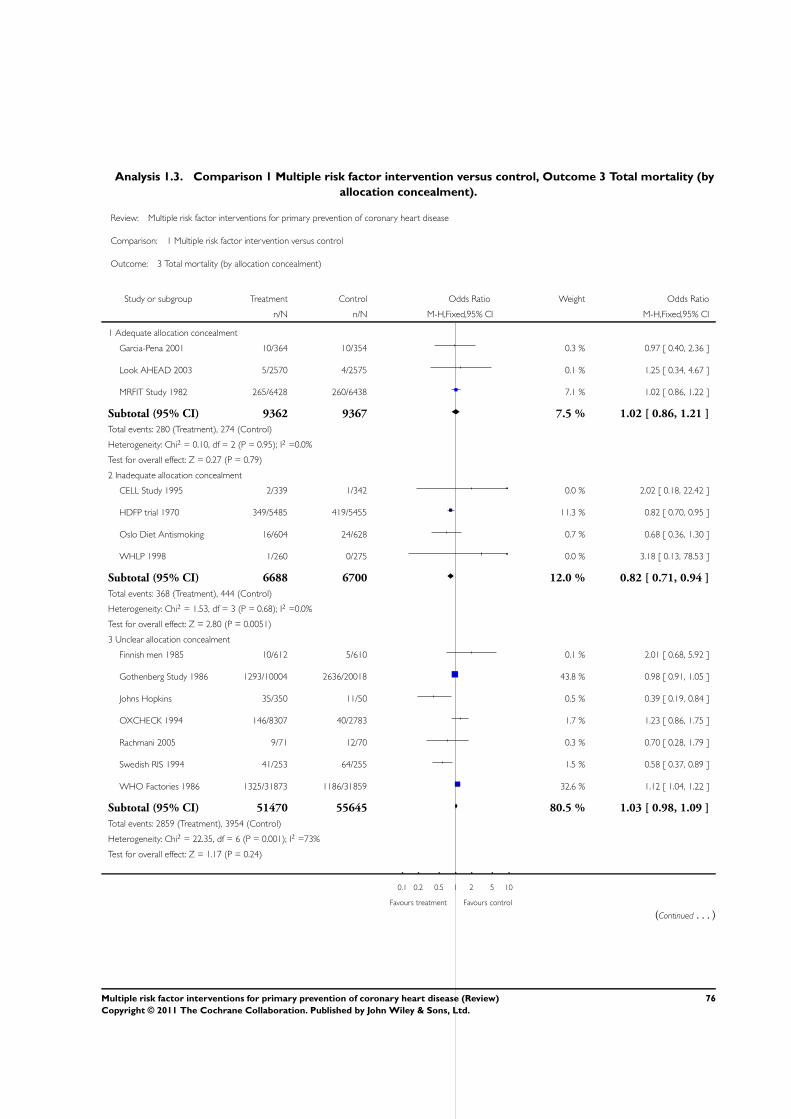
Analysis 1.3. Comparison 1 Multiple risk factor intervention versus control, Outcome 3 Total mortality (by
allocation concealment).
Review: Multiple risk factor interventions for primary prevention of coronary heart disease
Comparison: 1 Multiple risk factor intervention versus control
Outcome: 3 Total mortality (by allocation concealment)
Study or subgroup Treatment Control Odds Ratio Weight Odds Ratio
n/N n/N M-H,Fixed,95% CI M-H,Fixed,95% CI
1 Adequate allocation concealment
Garcia-Pena 2001 10/364 10/354 0.3 % 0.97 [ 0.40, 2.36 ]
Look AHEAD 2003 5/2570 4/2575 0.1 % 1.25 [ 0.34, 4.67 ]
MRFIT Study 1982 265/6428 260/6438 7.1 % 1.02 [ 0.86, 1.22 ]
Subtotal (95% CI) 9362 9367 7.5 % 1.02 [ 0.86, 1.21 ]
Total events: 280 (Treatment), 274 (Control)
Heterogeneity: Chi2 = 0.10, df = 2 (P = 0.95); I2 =0.0%
Test for overall effect: Z = 0.27 (P = 0.79)
2 Inadequate allocation concealment
CELL Study 1995 2/339 1/342 0.0 % 2.02 [ 0.18, 22.42 ]
HDFP trial 1970 349/5485 419/5455 11.3 % 0.82 [ 0.70, 0.95 ]
Oslo Diet Antismoking 16/604 24/628 0.7 % 0.68 [ 0.36, 1.30 ]
WHLP 1998 1/260 0/275 0.0 % 3.18 [ 0.13, 78.53 ]
Subtotal (95% CI) 6688 6700 12.0 % 0.82 [ 0.71, 0.94 ]
Total events: 368 (Treatment), 444 (Control)
Heterogeneity: Chi2 = 1.53, df = 3 (P = 0.68); I2 =0.0%
Test for overall effect: Z = 2.80 (P = 0.0051)
3 Unclear allocation concealment
Finnish men 1985 10/612 5/610 0.1 % 2.01 [ 0.68, 5.92 ]
Gothenberg Study 1986 1293/10004 2636/20018 43.8 % 0.98 [ 0.91, 1.05 ]
Johns Hopkins 35/350 11/50 0.5 % 0.39 [ 0.19, 0.84 ]
OXCHECK 1994 146/8307 40/2783 1.7 % 1.23 [ 0.86, 1.75 ]
Rachmani 2005 9/71 12/70 0.3 % 0.70 [ 0.28, 1.79 ]
Swedish RIS 1994 41/253 64/255 1.5 % 0.58 [ 0.37, 0.89 ]
WHO Factories 1986 1325/31873 1186/31859 32.6 % 1.12 [ 1.04, 1.22 ]
Subtotal (95% CI) 51470 55645 80.5 % 1.03 [ 0.98, 1.09 ]
Total events: 2859 (Treatment), 3954 (Control)
Heterogeneity: Chi2 = 22.35, df = 6 (P = 0.001); I2 =73%
Test for overall effect: Z = 1.17 (P = 0.24)
0.1 0.2 0.5 1 2 5 10
Favours treatment Favours control
(Continued . . . )
76Multiple risk factor interventions for primary prevention of coronary heart disease (Review)
Copyright © 2011 The Cochrane Collaboration. Published by John Wiley & Sons, Ltd.
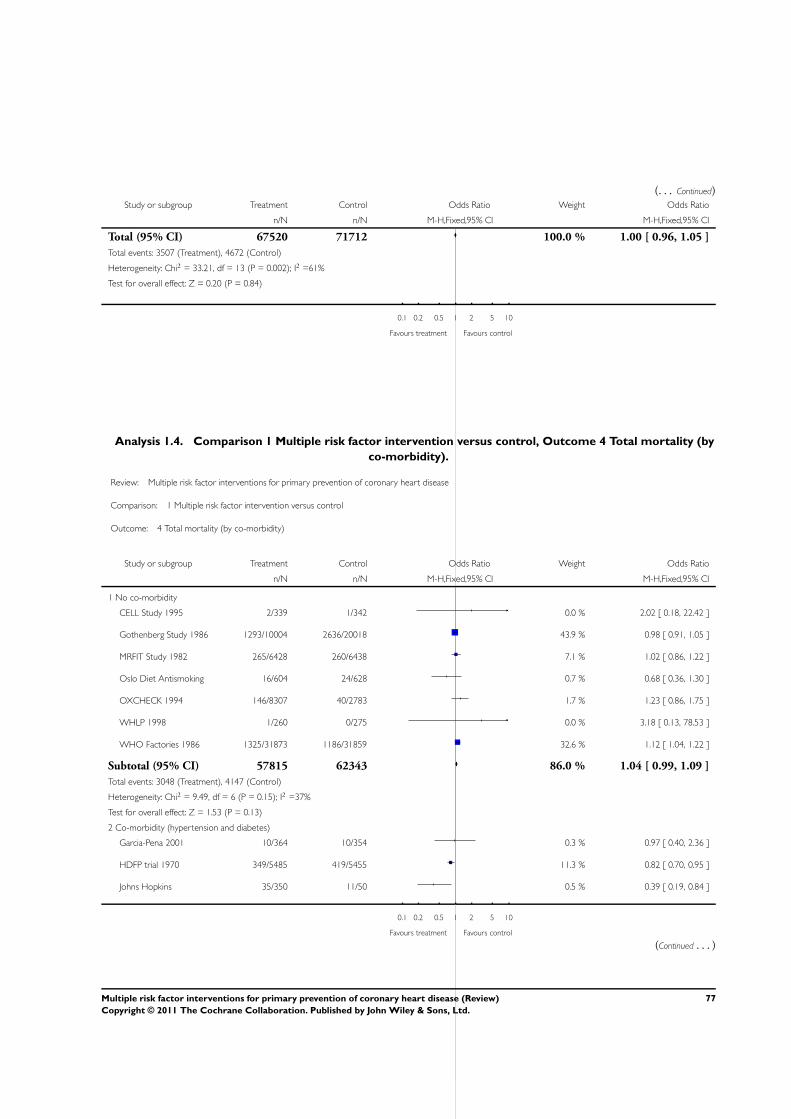
(. . . Continued)Study or subgroup Treatment Control Odds Ratio Weight Odds Ratio
n/N n/N M-H,Fixed,95% CI M-H,Fixed,95% CI
Total (95% CI) 67520 71712 100.0 % 1.00 [ 0.96, 1.05 ]
Total events: 3507 (Treatment), 4672 (Control)
Heterogeneity: Chi2 = 33.21, df = 13 (P = 0.002); I2 =61%
Test for overall effect: Z = 0.20 (P = 0.84)
0.1 0.2 0.5 1 2 5 10
Favours treatment Favours control
Analysis 1.4. Comparison 1 Multiple risk factor intervention versus control, Outcome 4 Total mortality (by
co-morbidity).
Review: Multiple risk factor interventions for primary prevention of coronary heart disease
Comparison: 1 Multiple risk factor intervention versus control
Outcome: 4 Total mortality (by co-morbidity)
Study or subgroup Treatment Control Odds Ratio Weight Odds Ratio
n/N n/N M-H,Fixed,95% CI M-H,Fixed,95% CI
1 No co-morbidity
CELL Study 1995 2/339 1/342 0.0 % 2.02 [ 0.18, 22.42 ]
Gothenberg Study 1986 1293/10004 2636/20018 43.9 % 0.98 [ 0.91, 1.05 ]
MRFIT Study 1982 265/6428 260/6438 7.1 % 1.02 [ 0.86, 1.22 ]
Oslo Diet Antismoking 16/604 24/628 0.7 % 0.68 [ 0.36, 1.30 ]
OXCHECK 1994 146/8307 40/2783 1.7 % 1.23 [ 0.86, 1.75 ]
WHLP 1998 1/260 0/275 0.0 % 3.18 [ 0.13, 78.53 ]
WHO Factories 1986 1325/31873 1186/31859 32.6 % 1.12 [ 1.04, 1.22 ]
Subtotal (95% CI) 57815 62343 86.0 % 1.04 [ 0.99, 1.09 ]
Total events: 3048 (Treatment), 4147 (Control)
Heterogeneity: Chi2 = 9.49, df = 6 (P = 0.15); I2 =37%
Test for overall effect: Z = 1.53 (P = 0.13)
2 Co-morbidity (hypertension and diabetes)
Garcia-Pena 2001 10/364 10/354 0.3 % 0.97 [ 0.40, 2.36 ]
HDFP trial 1970 349/5485 419/5455 11.3 % 0.82 [ 0.70, 0.95 ]
Johns Hopkins 35/350 11/50 0.5 % 0.39 [ 0.19, 0.84 ]
0.1 0.2 0.5 1 2 5 10
Favours treatment Favours control
(Continued . . . )
77Multiple risk factor interventions for primary prevention of coronary heart disease (Review)
Copyright © 2011 The Cochrane Collaboration. Published by John Wiley & Sons, Ltd.
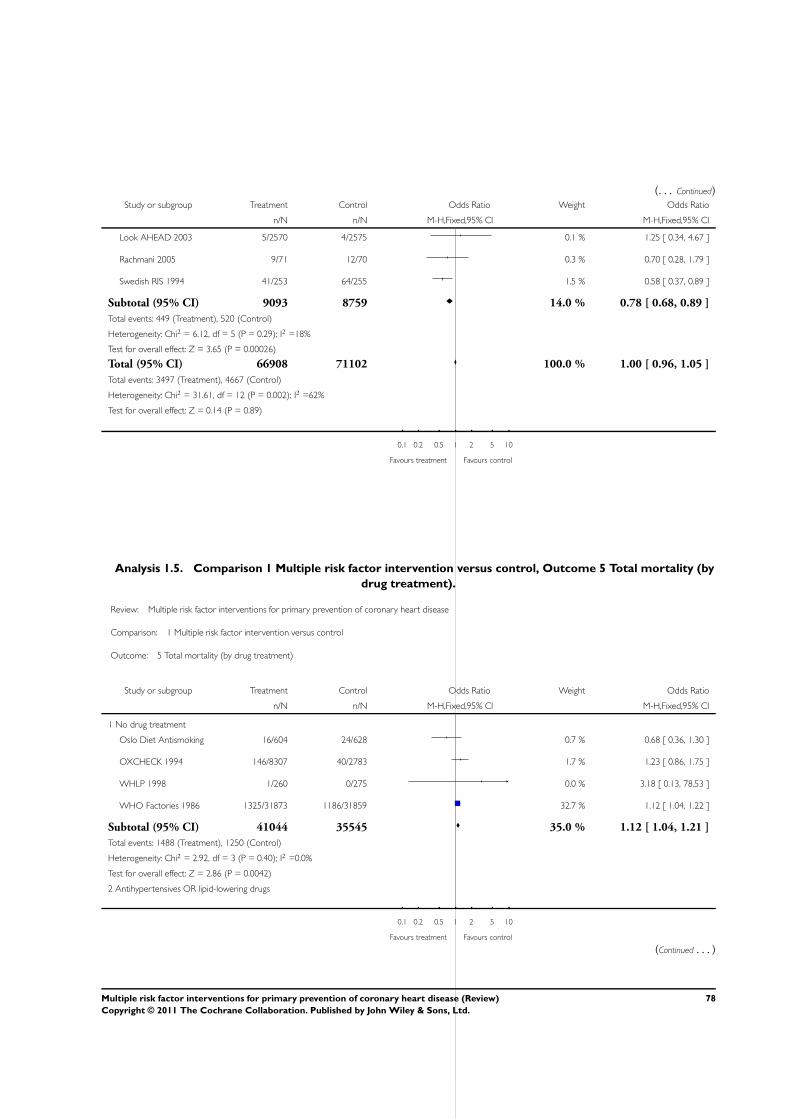
(. . . Continued)Study or subgroup Treatment Control Odds Ratio Weight Odds Ratio
n/N n/N M-H,Fixed,95% CI M-H,Fixed,95% CI
Look AHEAD 2003 5/2570 4/2575 0.1 % 1.25 [ 0.34, 4.67 ]
Rachmani 2005 9/71 12/70 0.3 % 0.70 [ 0.28, 1.79 ]
Swedish RIS 1994 41/253 64/255 1.5 % 0.58 [ 0.37, 0.89 ]
Subtotal (95% CI) 9093 8759 14.0 % 0.78 [ 0.68, 0.89 ]
Total events: 449 (Treatment), 520 (Control)
Heterogeneity: Chi2 = 6.12, df = 5 (P = 0.29); I2 =18%
Test for overall effect: Z = 3.65 (P = 0.00026)
Total (95% CI) 66908 71102 100.0 % 1.00 [ 0.96, 1.05 ]
Total events: 3497 (Treatment), 4667 (Control)
Heterogeneity: Chi2 = 31.61, df = 12 (P = 0.002); I2 =62%
Test for overall effect: Z = 0.14 (P = 0.89)
0.1 0.2 0.5 1 2 5 10
Favours treatment Favours control
Analysis 1.5. Comparison 1 Multiple risk factor intervention versus control, Outcome 5 Total mortality (by
drug treatment).
Review: Multiple risk factor interventions for primary prevention of coronary heart disease
Comparison: 1 Multiple risk factor intervention versus control
Outcome: 5 Total mortality (by drug treatment)
Study or subgroup Treatment Control Odds Ratio Weight Odds Ratio
n/N n/N M-H,Fixed,95% CI M-H,Fixed,95% CI
1 No drug treatment
Oslo Diet Antismoking 16/604 24/628 0.7 % 0.68 [ 0.36, 1.30 ]
OXCHECK 1994 146/8307 40/2783 1.7 % 1.23 [ 0.86, 1.75 ]
WHLP 1998 1/260 0/275 0.0 % 3.18 [ 0.13, 78.53 ]
WHO Factories 1986 1325/31873 1186/31859 32.7 % 1.12 [ 1.04, 1.22 ]
Subtotal (95% CI) 41044 35545 35.0 % 1.12 [ 1.04, 1.21 ]
Total events: 1488 (Treatment), 1250 (Control)
Heterogeneity: Chi2 = 2.92, df = 3 (P = 0.40); I2 =0.0%
Test for overall effect: Z = 2.86 (P = 0.0042)
2 Antihypertensives OR lipid-lowering drugs
0.1 0.2 0.5 1 2 5 10
Favours treatment Favours control
(Continued . . . )
78Multiple risk factor interventions for primary prevention of coronary heart disease (Review)
Copyright © 2011 The Cochrane Collaboration. Published by John Wiley & Sons, Ltd.
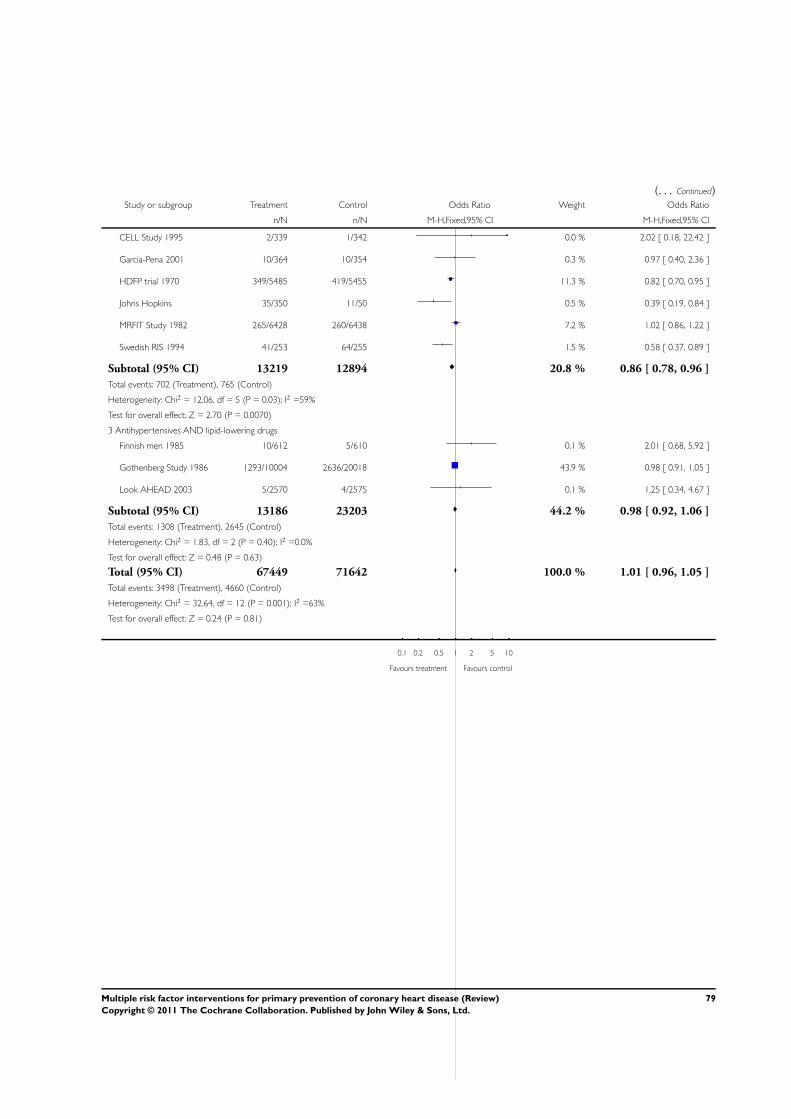
(. . . Continued)Study or subgroup Treatment Control Odds Ratio Weight Odds Ratio
n/N n/N M-H,Fixed,95% CI M-H,Fixed,95% CI
CELL Study 1995 2/339 1/342 0.0 % 2.02 [ 0.18, 22.42 ]
Garcia-Pena 2001 10/364 10/354 0.3 % 0.97 [ 0.40, 2.36 ]
HDFP trial 1970 349/5485 419/5455 11.3 % 0.82 [ 0.70, 0.95 ]
Johns Hopkins 35/350 11/50 0.5 % 0.39 [ 0.19, 0.84 ]
MRFIT Study 1982 265/6428 260/6438 7.2 % 1.02 [ 0.86, 1.22 ]
Swedish RIS 1994 41/253 64/255 1.5 % 0.58 [ 0.37, 0.89 ]
Subtotal (95% CI) 13219 12894 20.8 % 0.86 [ 0.78, 0.96 ]
Total events: 702 (Treatment), 765 (Control)
Heterogeneity: Chi2 = 12.06, df = 5 (P = 0.03); I2 =59%
Test for overall effect: Z = 2.70 (P = 0.0070)
3 Antihypertensives AND lipid-lowering drugs
Finnish men 1985 10/612 5/610 0.1 % 2.01 [ 0.68, 5.92 ]
Gothenberg Study 1986 1293/10004 2636/20018 43.9 % 0.98 [ 0.91, 1.05 ]
Look AHEAD 2003 5/2570 4/2575 0.1 % 1.25 [ 0.34, 4.67 ]
Subtotal (95% CI) 13186 23203 44.2 % 0.98 [ 0.92, 1.06 ]
Total events: 1308 (Treatment), 2645 (Control)
Heterogeneity: Chi2 = 1.83, df = 2 (P = 0.40); I2 =0.0%
Test for overall effect: Z = 0.48 (P = 0.63)
Total (95% CI) 67449 71642 100.0 % 1.01 [ 0.96, 1.05 ]
Total events: 3498 (Treatment), 4660 (Control)
Heterogeneity: Chi2 = 32.64, df = 12 (P = 0.001); I2 =63%
Test for overall effect: Z = 0.24 (P = 0.81)
0.1 0.2 0.5 1 2 5 10
Favours treatment Favours control
79Multiple risk factor interventions for primary prevention of coronary heart disease (Review)
Copyright © 2011 The Cochrane Collaboration. Published by John Wiley & Sons, Ltd.
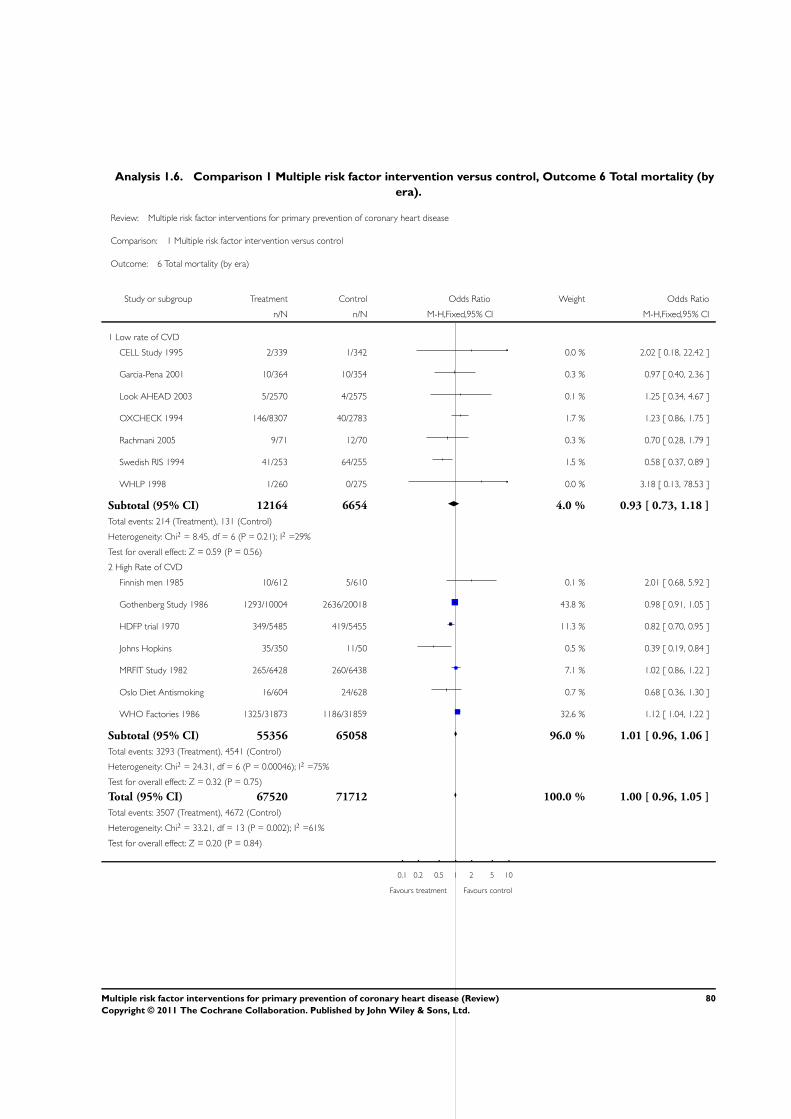
Analysis 1.6. Comparison 1 Multiple risk factor intervention versus control, Outcome 6 Total mortality (by
era).
Review: Multiple risk factor interventions for primary prevention of coronary heart disease
Comparison: 1 Multiple risk factor intervention versus control
Outcome: 6 Total mortality (by era)
Study or subgroup Treatment Control Odds Ratio Weight Odds Ratio
n/N n/N M-H,Fixed,95% CI M-H,Fixed,95% CI
1 Low rate of CVD
CELL Study 1995 2/339 1/342 0.0 % 2.02 [ 0.18, 22.42 ]
Garcia-Pena 2001 10/364 10/354 0.3 % 0.97 [ 0.40, 2.36 ]
Look AHEAD 2003 5/2570 4/2575 0.1 % 1.25 [ 0.34, 4.67 ]
OXCHECK 1994 146/8307 40/2783 1.7 % 1.23 [ 0.86, 1.75 ]
Rachmani 2005 9/71 12/70 0.3 % 0.70 [ 0.28, 1.79 ]
Swedish RIS 1994 41/253 64/255 1.5 % 0.58 [ 0.37, 0.89 ]
WHLP 1998 1/260 0/275 0.0 % 3.18 [ 0.13, 78.53 ]
Subtotal (95% CI) 12164 6654 4.0 % 0.93 [ 0.73, 1.18 ]
Total events: 214 (Treatment), 131 (Control)
Heterogeneity: Chi2 = 8.45, df = 6 (P = 0.21); I2 =29%
Test for overall effect: Z = 0.59 (P = 0.56)
2 High Rate of CVD
Finnish men 1985 10/612 5/610 0.1 % 2.01 [ 0.68, 5.92 ]
Gothenberg Study 1986 1293/10004 2636/20018 43.8 % 0.98 [ 0.91, 1.05 ]
HDFP trial 1970 349/5485 419/5455 11.3 % 0.82 [ 0.70, 0.95 ]
Johns Hopkins 35/350 11/50 0.5 % 0.39 [ 0.19, 0.84 ]
MRFIT Study 1982 265/6428 260/6438 7.1 % 1.02 [ 0.86, 1.22 ]
Oslo Diet Antismoking 16/604 24/628 0.7 % 0.68 [ 0.36, 1.30 ]
WHO Factories 1986 1325/31873 1186/31859 32.6 % 1.12 [ 1.04, 1.22 ]
Subtotal (95% CI) 55356 65058 96.0 % 1.01 [ 0.96, 1.06 ]
Total events: 3293 (Treatment), 4541 (Control)
Heterogeneity: Chi2 = 24.31, df = 6 (P = 0.00046); I2 =75%
Test for overall effect: Z = 0.32 (P = 0.75)
Total (95% CI) 67520 71712 100.0 % 1.00 [ 0.96, 1.05 ]
Total events: 3507 (Treatment), 4672 (Control)
Heterogeneity: Chi2 = 33.21, df = 13 (P = 0.002); I2 =61%
Test for overall effect: Z = 0.20 (P = 0.84)
0.1 0.2 0.5 1 2 5 10
Favours treatment Favours control
80Multiple risk factor interventions for primary prevention of coronary heart disease (Review)
Copyright © 2011 The Cochrane Collaboration. Published by John Wiley & Sons, Ltd.
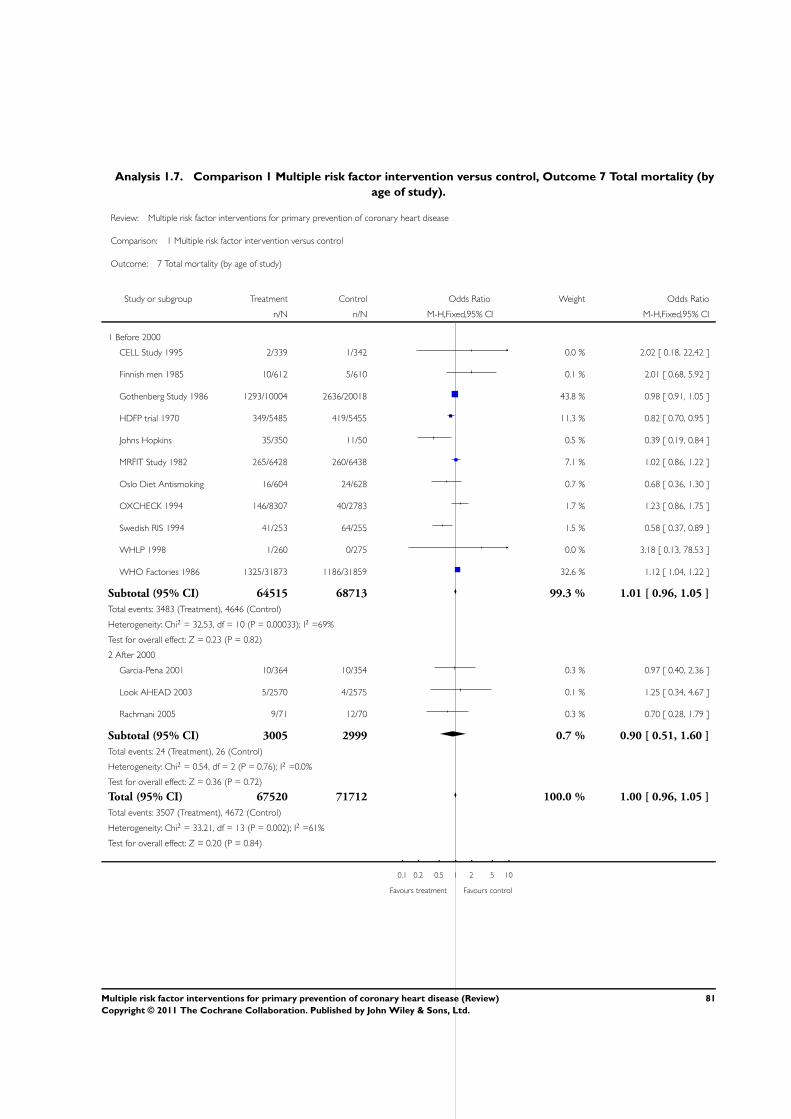
Analysis 1.7. Comparison 1 Multiple risk factor intervention versus control, Outcome 7 Total mortality (by
age of study).
Review: Multiple risk factor interventions for primary prevention of coronary heart disease
Comparison: 1 Multiple risk factor intervention versus control
Outcome: 7 Total mortality (by age of study)
Study or subgroup Treatment Control Odds Ratio Weight Odds Ratio
n/N n/N M-H,Fixed,95% CI M-H,Fixed,95% CI
1 Before 2000
CELL Study 1995 2/339 1/342 0.0 % 2.02 [ 0.18, 22.42 ]
Finnish men 1985 10/612 5/610 0.1 % 2.01 [ 0.68, 5.92 ]
Gothenberg Study 1986 1293/10004 2636/20018 43.8 % 0.98 [ 0.91, 1.05 ]
HDFP trial 1970 349/5485 419/5455 11.3 % 0.82 [ 0.70, 0.95 ]
Johns Hopkins 35/350 11/50 0.5 % 0.39 [ 0.19, 0.84 ]
MRFIT Study 1982 265/6428 260/6438 7.1 % 1.02 [ 0.86, 1.22 ]
Oslo Diet Antismoking 16/604 24/628 0.7 % 0.68 [ 0.36, 1.30 ]
OXCHECK 1994 146/8307 40/2783 1.7 % 1.23 [ 0.86, 1.75 ]
Swedish RIS 1994 41/253 64/255 1.5 % 0.58 [ 0.37, 0.89 ]
WHLP 1998 1/260 0/275 0.0 % 3.18 [ 0.13, 78.53 ]
WHO Factories 1986 1325/31873 1186/31859 32.6 % 1.12 [ 1.04, 1.22 ]
Subtotal (95% CI) 64515 68713 99.3 % 1.01 [ 0.96, 1.05 ]
Total events: 3483 (Treatment), 4646 (Control)
Heterogeneity: Chi2 = 32.53, df = 10 (P = 0.00033); I2 =69%
Test for overall effect: Z = 0.23 (P = 0.82)
2 After 2000
Garcia-Pena 2001 10/364 10/354 0.3 % 0.97 [ 0.40, 2.36 ]
Look AHEAD 2003 5/2570 4/2575 0.1 % 1.25 [ 0.34, 4.67 ]
Rachmani 2005 9/71 12/70 0.3 % 0.70 [ 0.28, 1.79 ]
Subtotal (95% CI) 3005 2999 0.7 % 0.90 [ 0.51, 1.60 ]
Total events: 24 (Treatment), 26 (Control)
Heterogeneity: Chi2 = 0.54, df = 2 (P = 0.76); I2 =0.0%
Test for overall effect: Z = 0.36 (P = 0.72)
Total (95% CI) 67520 71712 100.0 % 1.00 [ 0.96, 1.05 ]
Total events: 3507 (Treatment), 4672 (Control)
Heterogeneity: Chi2 = 33.21, df = 13 (P = 0.002); I2 =61%
Test for overall effect: Z = 0.20 (P = 0.84)
0.1 0.2 0.5 1 2 5 10
Favours treatment Favours control
81Multiple risk factor interventions for primary prevention of coronary heart disease (Review)
Copyright © 2011 The Cochrane Collaboration. Published by John Wiley & Sons, Ltd.
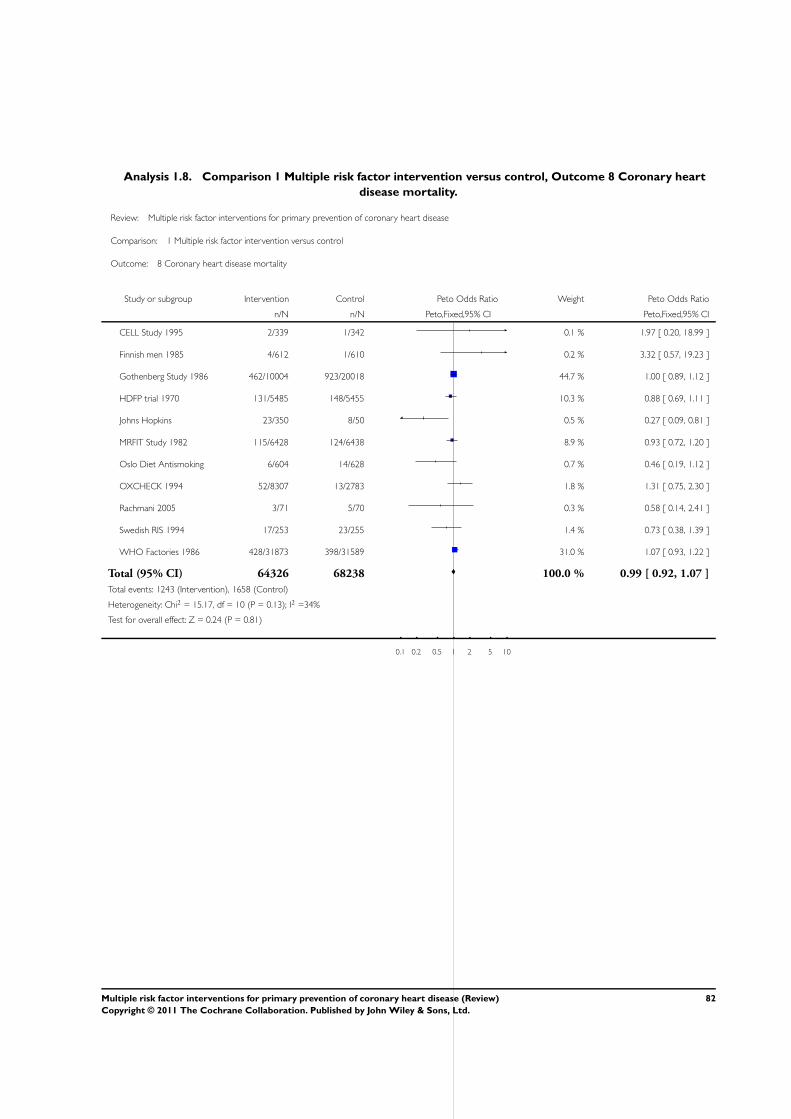
Analysis 1.8. Comparison 1 Multiple risk factor intervention versus control, Outcome 8 Coronary heart
disease mortality.
Review: Multiple risk factor interventions for primary prevention of coronary heart disease
Comparison: 1 Multiple risk factor intervention versus control
Outcome: 8 Coronary heart disease mortality
Study or subgroup Intervention Control Peto Odds Ratio Weight Peto Odds Ratio
n/N n/N Peto,Fixed,95% CI Peto,Fixed,95% CI
CELL Study 1995 2/339 1/342 0.1 % 1.97 [ 0.20, 18.99 ]
Finnish men 1985 4/612 1/610 0.2 % 3.32 [ 0.57, 19.23 ]
Gothenberg Study 1986 462/10004 923/20018 44.7 % 1.00 [ 0.89, 1.12 ]
HDFP trial 1970 131/5485 148/5455 10.3 % 0.88 [ 0.69, 1.11 ]
Johns Hopkins 23/350 8/50 0.5 % 0.27 [ 0.09, 0.81 ]
MRFIT Study 1982 115/6428 124/6438 8.9 % 0.93 [ 0.72, 1.20 ]
Oslo Diet Antismoking 6/604 14/628 0.7 % 0.46 [ 0.19, 1.12 ]
OXCHECK 1994 52/8307 13/2783 1.8 % 1.31 [ 0.75, 2.30 ]
Rachmani 2005 3/71 5/70 0.3 % 0.58 [ 0.14, 2.41 ]
Swedish RIS 1994 17/253 23/255 1.4 % 0.73 [ 0.38, 1.39 ]
WHO Factories 1986 428/31873 398/31589 31.0 % 1.07 [ 0.93, 1.22 ]
Total (95% CI) 64326 68238 100.0 % 0.99 [ 0.92, 1.07 ]
Total events: 1243 (Intervention), 1658 (Control)
Heterogeneity: Chi2 = 15.17, df = 10 (P = 0.13); I2 =34%
Test for overall effect: Z = 0.24 (P = 0.81)
0.1 0.2 0.5 1 2 5 10
82Multiple risk factor interventions for primary prevention of coronary heart disease (Review)
Copyright © 2011 The Cochrane Collaboration. Published by John Wiley & Sons, Ltd.
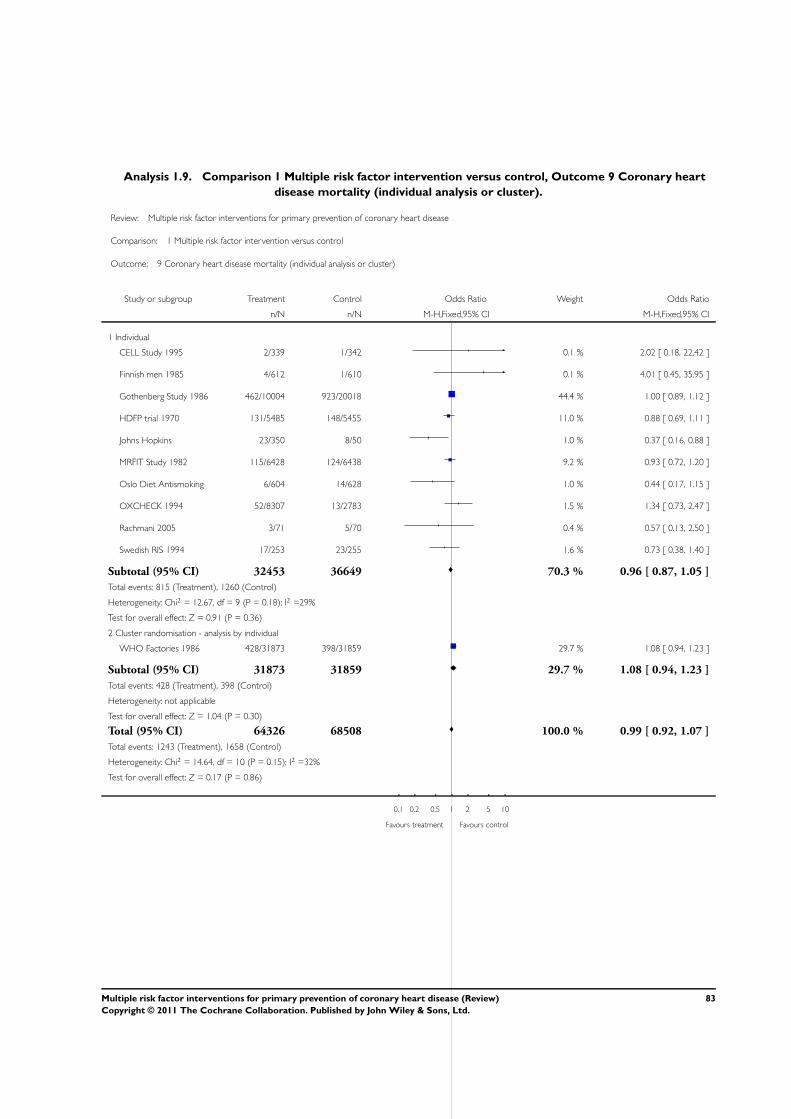
Analysis 1.9. Comparison 1 Multiple risk factor intervention versus control, Outcome 9 Coronary heart
disease mortality (individual analysis or cluster).
Review: Multiple risk factor interventions for primary prevention of coronary heart disease
Comparison: 1 Multiple risk factor intervention versus control
Outcome: 9 Coronary heart disease mortality (individual analysis or cluster)
Study or subgroup Treatment Control Odds Ratio Weight Odds Ratio
n/N n/N M-H,Fixed,95% CI M-H,Fixed,95% CI
1 Individual
CELL Study 1995 2/339 1/342 0.1 % 2.02 [ 0.18, 22.42 ]
Finnish men 1985 4/612 1/610 0.1 % 4.01 [ 0.45, 35.95 ]
Gothenberg Study 1986 462/10004 923/20018 44.4 % 1.00 [ 0.89, 1.12 ]
HDFP trial 1970 131/5485 148/5455 11.0 % 0.88 [ 0.69, 1.11 ]
Johns Hopkins 23/350 8/50 1.0 % 0.37 [ 0.16, 0.88 ]
MRFIT Study 1982 115/6428 124/6438 9.2 % 0.93 [ 0.72, 1.20 ]
Oslo Diet Antismoking 6/604 14/628 1.0 % 0.44 [ 0.17, 1.15 ]
OXCHECK 1994 52/8307 13/2783 1.5 % 1.34 [ 0.73, 2.47 ]
Rachmani 2005 3/71 5/70 0.4 % 0.57 [ 0.13, 2.50 ]
Swedish RIS 1994 17/253 23/255 1.6 % 0.73 [ 0.38, 1.40 ]
Subtotal (95% CI) 32453 36649 70.3 % 0.96 [ 0.87, 1.05 ]
Total events: 815 (Treatment), 1260 (Control)
Heterogeneity: Chi2 = 12.67, df = 9 (P = 0.18); I2 =29%
Test for overall effect: Z = 0.91 (P = 0.36)
2 Cluster randomisation - analysis by individual
WHO Factories 1986 428/31873 398/31859 29.7 % 1.08 [ 0.94, 1.23 ]
Subtotal (95% CI) 31873 31859 29.7 % 1.08 [ 0.94, 1.23 ]
Total events: 428 (Treatment), 398 (Control)
Heterogeneity: not applicable
Test for overall effect: Z = 1.04 (P = 0.30)
Total (95% CI) 64326 68508 100.0 % 0.99 [ 0.92, 1.07 ]
Total events: 1243 (Treatment), 1658 (Control)
Heterogeneity: Chi2 = 14.64, df = 10 (P = 0.15); I2 =32%
Test for overall effect: Z = 0.17 (P = 0.86)
0.1 0.2 0.5 1 2 5 10
Favours treatment Favours control
83Multiple risk factor interventions for primary prevention of coronary heart disease (Review)
Copyright © 2011 The Cochrane Collaboration. Published by John Wiley & Sons, Ltd.
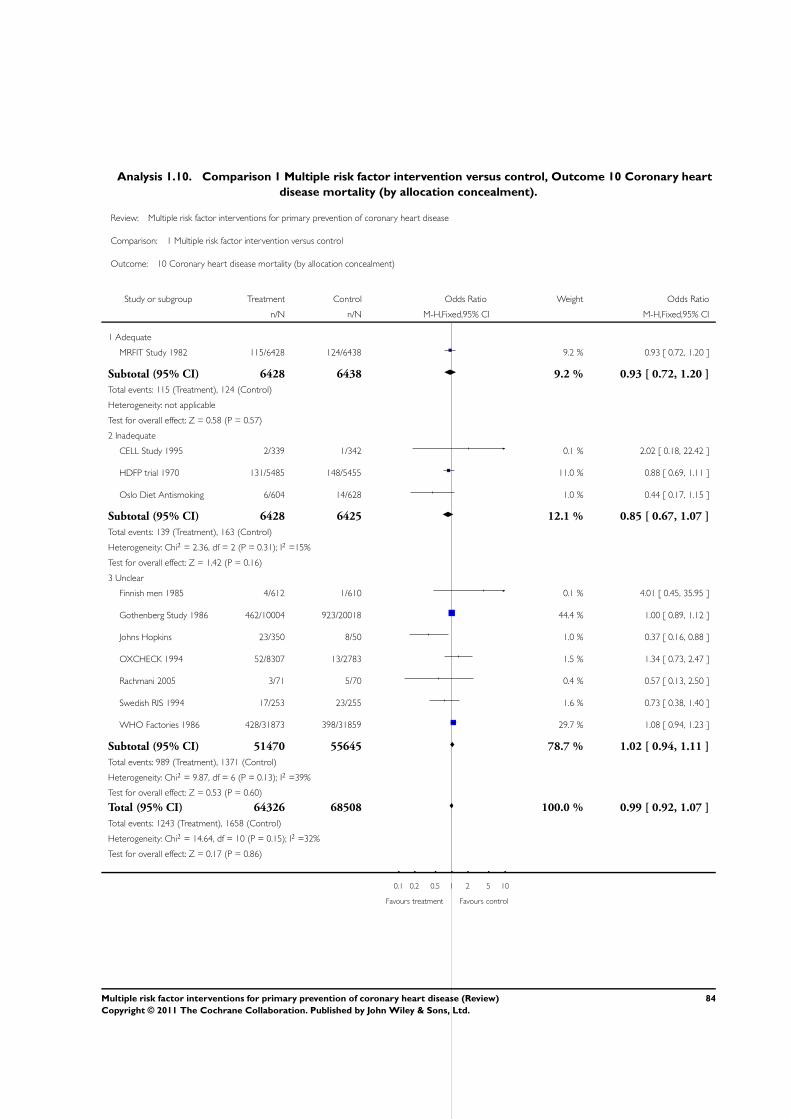
Analysis 1.10. Comparison 1 Multiple risk factor intervention versus control, Outcome 10 Coronary heart
disease mortality (by allocation concealment).
Review: Multiple risk factor interventions for primary prevention of coronary heart disease
Comparison: 1 Multiple risk factor intervention versus control
Outcome: 10 Coronary heart disease mortality (by allocation concealment)
Study or subgroup Treatment Control Odds Ratio Weight Odds Ratio
n/N n/N M-H,Fixed,95% CI M-H,Fixed,95% CI
1 Adequate
MRFIT Study 1982 115/6428 124/6438 9.2 % 0.93 [ 0.72, 1.20 ]
Subtotal (95% CI) 6428 6438 9.2 % 0.93 [ 0.72, 1.20 ]
Total events: 115 (Treatment), 124 (Control)
Heterogeneity: not applicable
Test for overall effect: Z = 0.58 (P = 0.57)
2 Inadequate
CELL Study 1995 2/339 1/342 0.1 % 2.02 [ 0.18, 22.42 ]
HDFP trial 1970 131/5485 148/5455 11.0 % 0.88 [ 0.69, 1.11 ]
Oslo Diet Antismoking 6/604 14/628 1.0 % 0.44 [ 0.17, 1.15 ]
Subtotal (95% CI) 6428 6425 12.1 % 0.85 [ 0.67, 1.07 ]
Total events: 139 (Treatment), 163 (Control)
Heterogeneity: Chi2 = 2.36, df = 2 (P = 0.31); I2 =15%
Test for overall effect: Z = 1.42 (P = 0.16)
3 Unclear
Finnish men 1985 4/612 1/610 0.1 % 4.01 [ 0.45, 35.95 ]
Gothenberg Study 1986 462/10004 923/20018 44.4 % 1.00 [ 0.89, 1.12 ]
Johns Hopkins 23/350 8/50 1.0 % 0.37 [ 0.16, 0.88 ]
OXCHECK 1994 52/8307 13/2783 1.5 % 1.34 [ 0.73, 2.47 ]
Rachmani 2005 3/71 5/70 0.4 % 0.57 [ 0.13, 2.50 ]
Swedish RIS 1994 17/253 23/255 1.6 % 0.73 [ 0.38, 1.40 ]
WHO Factories 1986 428/31873 398/31859 29.7 % 1.08 [ 0.94, 1.23 ]
Subtotal (95% CI) 51470 55645 78.7 % 1.02 [ 0.94, 1.11 ]
Total events: 989 (Treatment), 1371 (Control)
Heterogeneity: Chi2 = 9.87, df = 6 (P = 0.13); I2 =39%
Test for overall effect: Z = 0.53 (P = 0.60)
Total (95% CI) 64326 68508 100.0 % 0.99 [ 0.92, 1.07 ]
Total events: 1243 (Treatment), 1658 (Control)
Heterogeneity: Chi2 = 14.64, df = 10 (P = 0.15); I2 =32%
Test for overall effect: Z = 0.17 (P = 0.86)
0.1 0.2 0.5 1 2 5 10
Favours treatment Favours control
84Multiple risk factor interventions for primary prevention of coronary heart disease (Review)
Copyright © 2011 The Cochrane Collaboration. Published by John Wiley & Sons, Ltd.
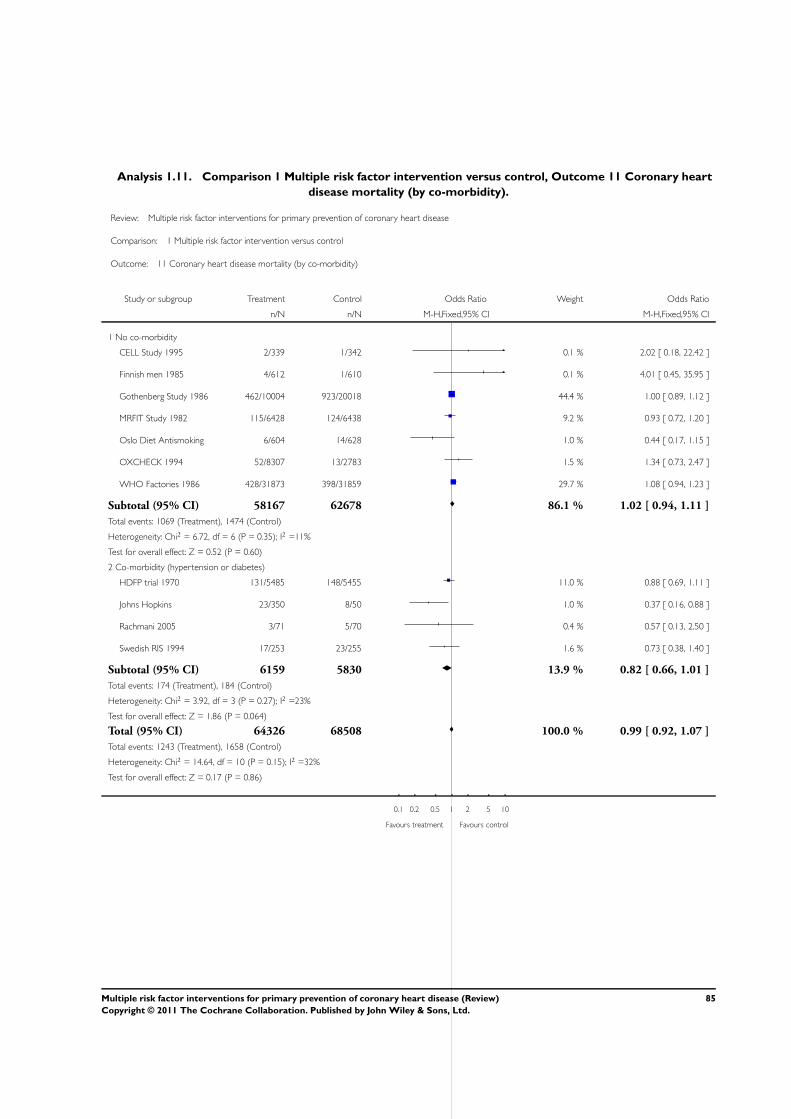
Analysis 1.11. Comparison 1 Multiple risk factor intervention versus control, Outcome 11 Coronary heart
disease mortality (by co-morbidity).
Review: Multiple risk factor interventions for primary prevention of coronary heart disease
Comparison: 1 Multiple risk factor intervention versus control
Outcome: 11 Coronary heart disease mortality (by co-morbidity)
Study or subgroup Treatment Control Odds Ratio Weight Odds Ratio
n/N n/N M-H,Fixed,95% CI M-H,Fixed,95% CI
1 No co-morbidity
CELL Study 1995 2/339 1/342 0.1 % 2.02 [ 0.18, 22.42 ]
Finnish men 1985 4/612 1/610 0.1 % 4.01 [ 0.45, 35.95 ]
Gothenberg Study 1986 462/10004 923/20018 44.4 % 1.00 [ 0.89, 1.12 ]
MRFIT Study 1982 115/6428 124/6438 9.2 % 0.93 [ 0.72, 1.20 ]
Oslo Diet Antismoking 6/604 14/628 1.0 % 0.44 [ 0.17, 1.15 ]
OXCHECK 1994 52/8307 13/2783 1.5 % 1.34 [ 0.73, 2.47 ]
WHO Factories 1986 428/31873 398/31859 29.7 % 1.08 [ 0.94, 1.23 ]
Subtotal (95% CI) 58167 62678 86.1 % 1.02 [ 0.94, 1.11 ]
Total events: 1069 (Treatment), 1474 (Control)
Heterogeneity: Chi2 = 6.72, df = 6 (P = 0.35); I2 =11%
Test for overall effect: Z = 0.52 (P = 0.60)
2 Co-morbidity (hypertension or diabetes)
HDFP trial 1970 131/5485 148/5455 11.0 % 0.88 [ 0.69, 1.11 ]
Johns Hopkins 23/350 8/50 1.0 % 0.37 [ 0.16, 0.88 ]
Rachmani 2005 3/71 5/70 0.4 % 0.57 [ 0.13, 2.50 ]
Swedish RIS 1994 17/253 23/255 1.6 % 0.73 [ 0.38, 1.40 ]
Subtotal (95% CI) 6159 5830 13.9 % 0.82 [ 0.66, 1.01 ]
Total events: 174 (Treatment), 184 (Control)
Heterogeneity: Chi2 = 3.92, df = 3 (P = 0.27); I2 =23%
Test for overall effect: Z = 1.86 (P = 0.064)
Total (95% CI) 64326 68508 100.0 % 0.99 [ 0.92, 1.07 ]
Total events: 1243 (Treatment), 1658 (Control)
Heterogeneity: Chi2 = 14.64, df = 10 (P = 0.15); I2 =32%
Test for overall effect: Z = 0.17 (P = 0.86)
0.1 0.2 0.5 1 2 5 10
Favours treatment Favours control
85Multiple risk factor interventions for primary prevention of coronary heart disease (Review)
Copyright © 2011 The Cochrane Collaboration. Published by John Wiley & Sons, Ltd.
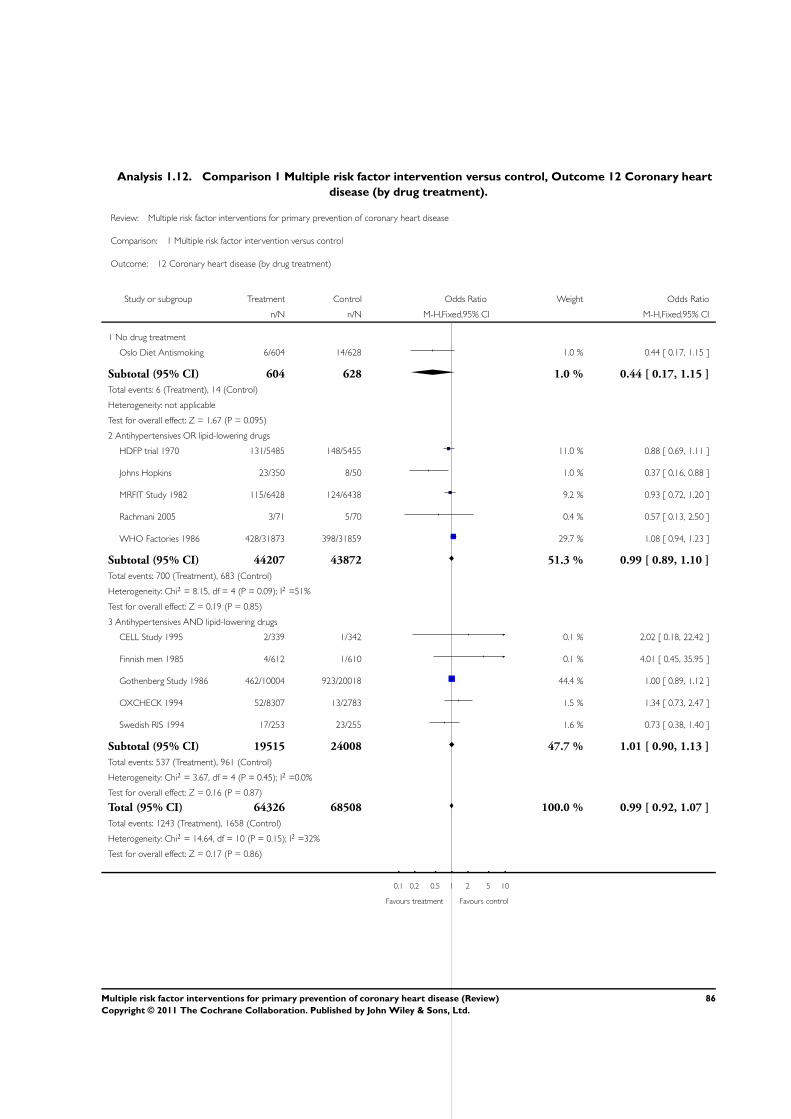
Analysis 1.12. Comparison 1 Multiple risk factor intervention versus control, Outcome 12 Coronary heart
disease (by drug treatment).
Review: Multiple risk factor interventions for primary prevention of coronary heart disease
Comparison: 1 Multiple risk factor intervention versus control
Outcome: 12 Coronary heart disease (by drug treatment)
Study or subgroup Treatment Control Odds Ratio Weight Odds Ratio
n/N n/N M-H,Fixed,95% CI M-H,Fixed,95% CI
1 No drug treatment
Oslo Diet Antismoking 6/604 14/628 1.0 % 0.44 [ 0.17, 1.15 ]
Subtotal (95% CI) 604 628 1.0 % 0.44 [ 0.17, 1.15 ]
Total events: 6 (Treatment), 14 (Control)
Heterogeneity: not applicable
Test for overall effect: Z = 1.67 (P = 0.095)
2 Antihypertensives OR lipid-lowering drugs
HDFP trial 1970 131/5485 148/5455 11.0 % 0.88 [ 0.69, 1.11 ]
Johns Hopkins 23/350 8/50 1.0 % 0.37 [ 0.16, 0.88 ]
MRFIT Study 1982 115/6428 124/6438 9.2 % 0.93 [ 0.72, 1.20 ]
Rachmani 2005 3/71 5/70 0.4 % 0.57 [ 0.13, 2.50 ]
WHO Factories 1986 428/31873 398/31859 29.7 % 1.08 [ 0.94, 1.23 ]
Subtotal (95% CI) 44207 43872 51.3 % 0.99 [ 0.89, 1.10 ]
Total events: 700 (Treatment), 683 (Control)
Heterogeneity: Chi2 = 8.15, df = 4 (P = 0.09); I2 =51%
Test for overall effect: Z = 0.19 (P = 0.85)
3 Antihypertensives AND lipid-lowering drugs
CELL Study 1995 2/339 1/342 0.1 % 2.02 [ 0.18, 22.42 ]
Finnish men 1985 4/612 1/610 0.1 % 4.01 [ 0.45, 35.95 ]
Gothenberg Study 1986 462/10004 923/20018 44.4 % 1.00 [ 0.89, 1.12 ]
OXCHECK 1994 52/8307 13/2783 1.5 % 1.34 [ 0.73, 2.47 ]
Swedish RIS 1994 17/253 23/255 1.6 % 0.73 [ 0.38, 1.40 ]
Subtotal (95% CI) 19515 24008 47.7 % 1.01 [ 0.90, 1.13 ]
Total events: 537 (Treatment), 961 (Control)
Heterogeneity: Chi2 = 3.67, df = 4 (P = 0.45); I2 =0.0%
Test for overall effect: Z = 0.16 (P = 0.87)
Total (95% CI) 64326 68508 100.0 % 0.99 [ 0.92, 1.07 ]
Total events: 1243 (Treatment), 1658 (Control)
Heterogeneity: Chi2 = 14.64, df = 10 (P = 0.15); I2 =32%
Test for overall effect: Z = 0.17 (P = 0.86)
0.1 0.2 0.5 1 2 5 10
Favours treatment Favours control
86Multiple risk factor interventions for primary prevention of coronary heart disease (Review)
Copyright © 2011 The Cochrane Collaboration. Published by John Wiley & Sons, Ltd.
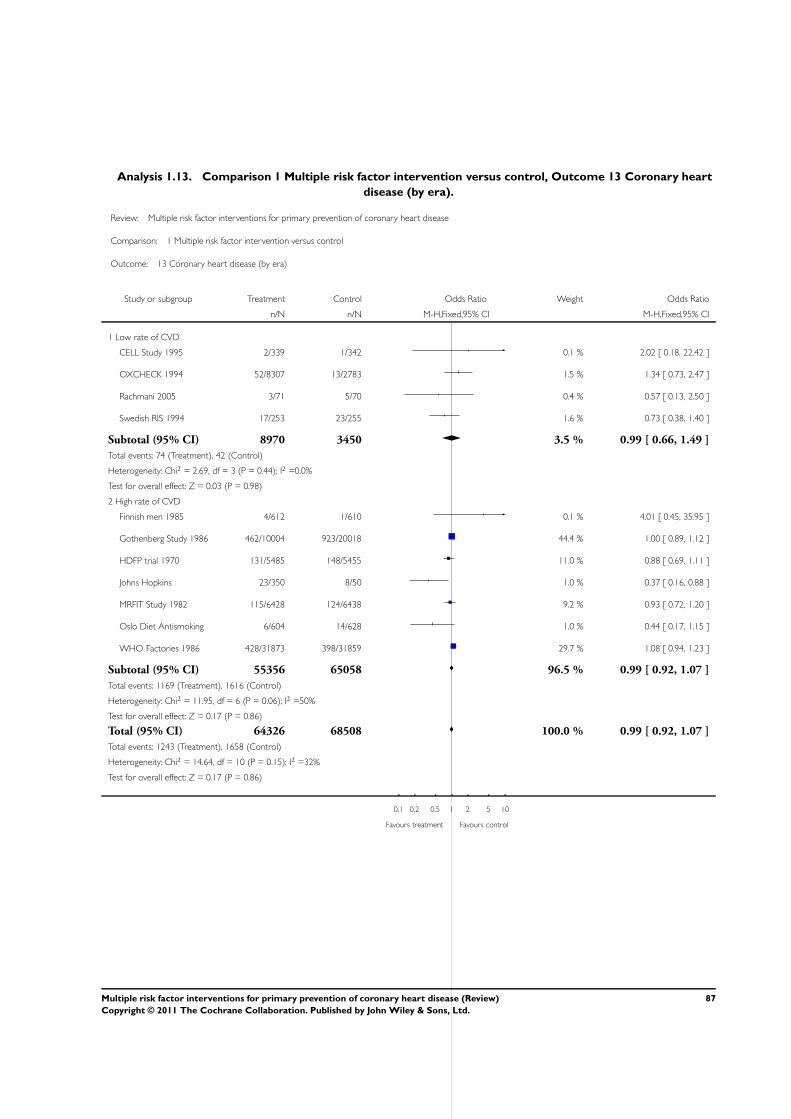
Analysis 1.13. Comparison 1 Multiple risk factor intervention versus control, Outcome 13 Coronary heart
disease (by era).
Review: Multiple risk factor interventions for primary prevention of coronary heart disease
Comparison: 1 Multiple risk factor intervention versus control
Outcome: 13 Coronary heart disease (by era)
Study or subgroup Treatment Control Odds Ratio Weight Odds Ratio
n/N n/N M-H,Fixed,95% CI M-H,Fixed,95% CI
1 Low rate of CVD
CELL Study 1995 2/339 1/342 0.1 % 2.02 [ 0.18, 22.42 ]
OXCHECK 1994 52/8307 13/2783 1.5 % 1.34 [ 0.73, 2.47 ]
Rachmani 2005 3/71 5/70 0.4 % 0.57 [ 0.13, 2.50 ]
Swedish RIS 1994 17/253 23/255 1.6 % 0.73 [ 0.38, 1.40 ]
Subtotal (95% CI) 8970 3450 3.5 % 0.99 [ 0.66, 1.49 ]
Total events: 74 (Treatment), 42 (Control)
Heterogeneity: Chi2 = 2.69, df = 3 (P = 0.44); I2 =0.0%
Test for overall effect: Z = 0.03 (P = 0.98)
2 High rate of CVD
Finnish men 1985 4/612 1/610 0.1 % 4.01 [ 0.45, 35.95 ]
Gothenberg Study 1986 462/10004 923/20018 44.4 % 1.00 [ 0.89, 1.12 ]
HDFP trial 1970 131/5485 148/5455 11.0 % 0.88 [ 0.69, 1.11 ]
Johns Hopkins 23/350 8/50 1.0 % 0.37 [ 0.16, 0.88 ]
MRFIT Study 1982 115/6428 124/6438 9.2 % 0.93 [ 0.72, 1.20 ]
Oslo Diet Antismoking 6/604 14/628 1.0 % 0.44 [ 0.17, 1.15 ]
WHO Factories 1986 428/31873 398/31859 29.7 % 1.08 [ 0.94, 1.23 ]
Subtotal (95% CI) 55356 65058 96.5 % 0.99 [ 0.92, 1.07 ]
Total events: 1169 (Treatment), 1616 (Control)
Heterogeneity: Chi2 = 11.95, df = 6 (P = 0.06); I2 =50%
Test for overall effect: Z = 0.17 (P = 0.86)
Total (95% CI) 64326 68508 100.0 % 0.99 [ 0.92, 1.07 ]
Total events: 1243 (Treatment), 1658 (Control)
Heterogeneity: Chi2 = 14.64, df = 10 (P = 0.15); I2 =32%
Test for overall effect: Z = 0.17 (P = 0.86)
0.1 0.2 0.5 1 2 5 10
Favours treatment Favours control
87Multiple risk factor interventions for primary prevention of coronary heart disease (Review)
Copyright © 2011 The Cochrane Collaboration. Published by John Wiley & Sons, Ltd.

Analysis 1.14. Comparison 1 Multiple risk factor intervention versus control, Outcome 14 Coronary heart
disease mortality (by study age).
Review: Multiple risk factor interventions for primary prevention of coronary heart disease
Comparison: 1 Multiple risk factor intervention versus control
Outcome: 14 Coronary heart disease mortality (by study age)
Study or subgroup Treatment Control Odds Ratio Weight Odds Ratio
n/N n/N M-H,Fixed,95% CI M-H,Fixed,95% CI
1 Before 2000
CELL Study 1995 2/339 1/342 0.1 % 2.02 [ 0.18, 22.42 ]
Finnish men 1985 4/612 1/610 0.1 % 4.01 [ 0.45, 35.95 ]
Gothenberg Study 1986 462/10004 923/20018 44.4 % 1.00 [ 0.89, 1.12 ]
HDFP trial 1970 131/5485 148/5455 11.0 % 0.88 [ 0.69, 1.11 ]
Johns Hopkins 23/350 8/50 1.0 % 0.37 [ 0.16, 0.88 ]
MRFIT Study 1982 115/6428 124/6438 9.2 % 0.93 [ 0.72, 1.20 ]
Oslo Diet Antismoking 6/604 14/628 1.0 % 0.44 [ 0.17, 1.15 ]
OXCHECK 1994 52/8307 13/2783 1.5 % 1.34 [ 0.73, 2.47 ]
Swedish RIS 1994 17/253 23/255 1.6 % 0.73 [ 0.38, 1.40 ]
WHO Factories 1986 428/31873 398/31859 29.7 % 1.08 [ 0.94, 1.23 ]
Subtotal (95% CI) 64255 68438 99.6 % 0.99 [ 0.92, 1.07 ]
Total events: 1240 (Treatment), 1653 (Control)
Heterogeneity: Chi2 = 14.11, df = 9 (P = 0.12); I2 =36%
Test for overall effect: Z = 0.13 (P = 0.89)
2 After 2000
Rachmani 2005 3/71 5/70 0.4 % 0.57 [ 0.13, 2.50 ]
Subtotal (95% CI) 71 70 0.4 % 0.57 [ 0.13, 2.50 ]
Total events: 3 (Treatment), 5 (Control)
Heterogeneity: not applicable
Test for overall effect: Z = 0.74 (P = 0.46)
Total (95% CI) 64326 68508 100.0 % 0.99 [ 0.92, 1.07 ]
Total events: 1243 (Treatment), 1658 (Control)
Heterogeneity: Chi2 = 14.64, df = 10 (P = 0.15); I2 =32%
Test for overall effect: Z = 0.17 (P = 0.86)
0.1 0.2 0.5 1 2 5 10
Favours treatment Favours control
88Multiple risk factor interventions for primary prevention of coronary heart disease (Review)
Copyright © 2011 The Cochrane Collaboration. Published by John Wiley & Sons, Ltd.
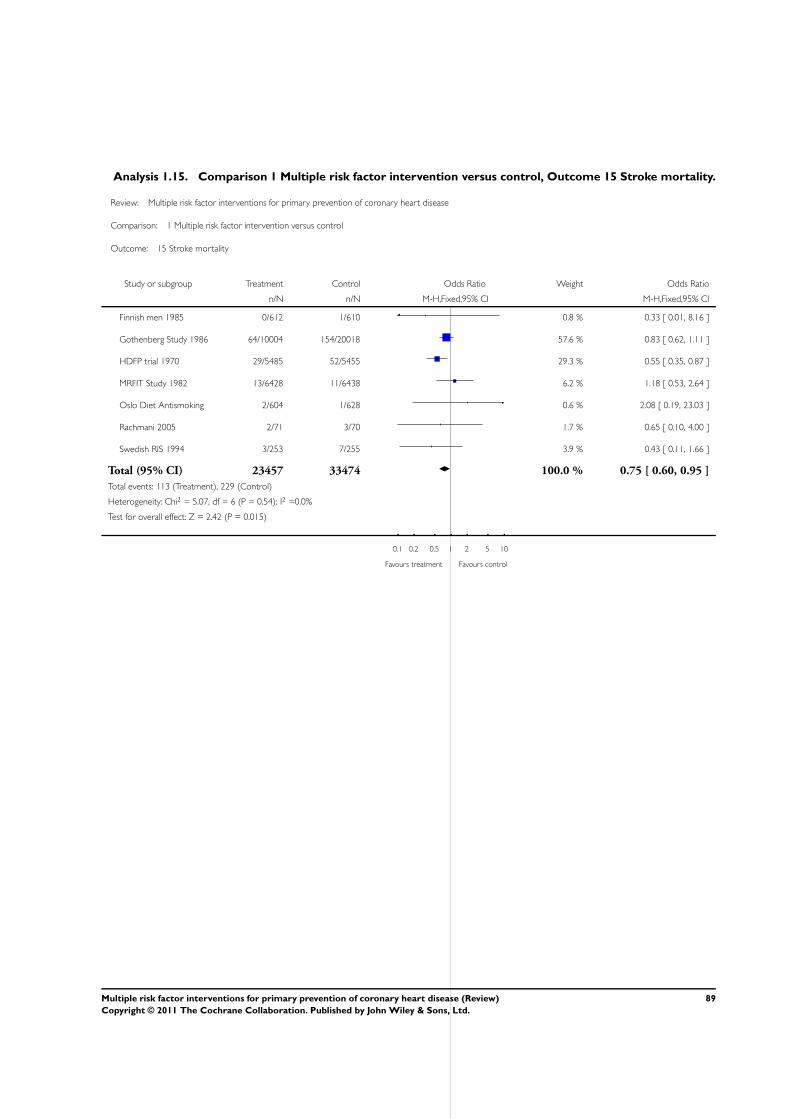
Analysis 1.15. Comparison 1 Multiple risk factor intervention versus control, Outcome 15 Stroke mortality.
Review: Multiple risk factor interventions for primary prevention of coronary heart disease
Comparison: 1 Multiple risk factor intervention versus control
Outcome: 15 Stroke mortality
Study or subgroup Treatment Control Odds Ratio Weight Odds Ratio
n/N n/N M-H,Fixed,95% CI M-H,Fixed,95% CI
Finnish men 1985 0/612 1/610 0.8 % 0.33 [ 0.01, 8.16 ]
Gothenberg Study 1986 64/10004 154/20018 57.6 % 0.83 [ 0.62, 1.11 ]
HDFP trial 1970 29/5485 52/5455 29.3 % 0.55 [ 0.35, 0.87 ]
MRFIT Study 1982 13/6428 11/6438 6.2 % 1.18 [ 0.53, 2.64 ]
Oslo Diet Antismoking 2/604 1/628 0.6 % 2.08 [ 0.19, 23.03 ]
Rachmani 2005 2/71 3/70 1.7 % 0.65 [ 0.10, 4.00 ]
Swedish RIS 1994 3/253 7/255 3.9 % 0.43 [ 0.11, 1.66 ]
Total (95% CI) 23457 33474 100.0 % 0.75 [ 0.60, 0.95 ]
Total events: 113 (Treatment), 229 (Control)
Heterogeneity: Chi2 = 5.07, df = 6 (P = 0.54); I2 =0.0%
Test for overall effect: Z = 2.42 (P = 0.015)
0.1 0.2 0.5 1 2 5 10
Favours treatment Favours control
89Multiple risk factor interventions for primary prevention of coronary heart disease (Review)
Copyright © 2011 The Cochrane Collaboration. Published by John Wiley & Sons, Ltd.
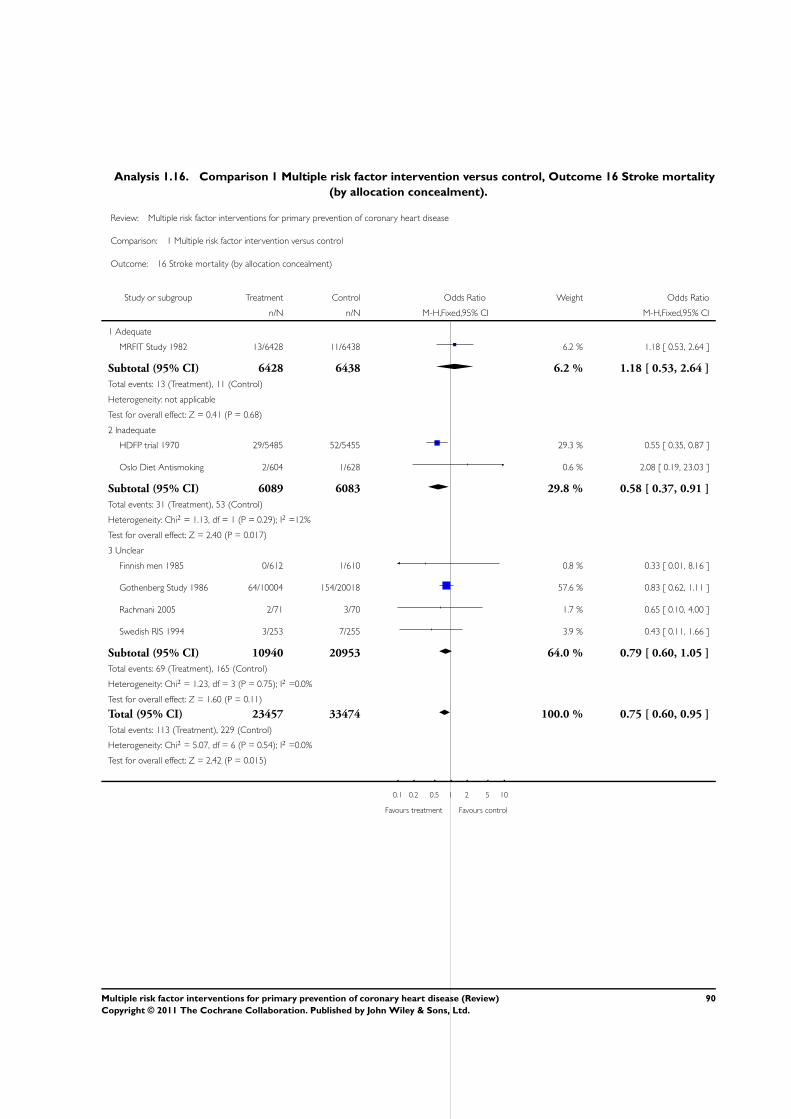
Analysis 1.16. Comparison 1 Multiple risk factor intervention versus control, Outcome 16 Stroke mortality
(by allocation concealment).
Review: Multiple risk factor interventions for primary prevention of coronary heart disease
Comparison: 1 Multiple risk factor intervention versus control
Outcome: 16 Stroke mortality (by allocation concealment)
Study or subgroup Treatment Control Odds Ratio Weight Odds Ratio
n/N n/N M-H,Fixed,95% CI M-H,Fixed,95% CI
1 Adequate
MRFIT Study 1982 13/6428 11/6438 6.2 % 1.18 [ 0.53, 2.64 ]
Subtotal (95% CI) 6428 6438 6.2 % 1.18 [ 0.53, 2.64 ]
Total events: 13 (Treatment), 11 (Control)
Heterogeneity: not applicable
Test for overall effect: Z = 0.41 (P = 0.68)
2 Inadequate
HDFP trial 1970 29/5485 52/5455 29.3 % 0.55 [ 0.35, 0.87 ]
Oslo Diet Antismoking 2/604 1/628 0.6 % 2.08 [ 0.19, 23.03 ]
Subtotal (95% CI) 6089 6083 29.8 % 0.58 [ 0.37, 0.91 ]
Total events: 31 (Treatment), 53 (Control)
Heterogeneity: Chi2 = 1.13, df = 1 (P = 0.29); I2 =12%
Test for overall effect: Z = 2.40 (P = 0.017)
3 Unclear
Finnish men 1985 0/612 1/610 0.8 % 0.33 [ 0.01, 8.16 ]
Gothenberg Study 1986 64/10004 154/20018 57.6 % 0.83 [ 0.62, 1.11 ]
Rachmani 2005 2/71 3/70 1.7 % 0.65 [ 0.10, 4.00 ]
Swedish RIS 1994 3/253 7/255 3.9 % 0.43 [ 0.11, 1.66 ]
Subtotal (95% CI) 10940 20953 64.0 % 0.79 [ 0.60, 1.05 ]
Total events: 69 (Treatment), 165 (Control)
Heterogeneity: Chi2 = 1.23, df = 3 (P = 0.75); I2 =0.0%
Test for overall effect: Z = 1.60 (P = 0.11)
Total (95% CI) 23457 33474 100.0 % 0.75 [ 0.60, 0.95 ]
Total events: 113 (Treatment), 229 (Control)
Heterogeneity: Chi2 = 5.07, df = 6 (P = 0.54); I2 =0.0%
Test for overall effect: Z = 2.42 (P = 0.015)
0.1 0.2 0.5 1 2 5 10
Favours treatment Favours control
90Multiple risk factor interventions for primary prevention of coronary heart disease (Review)
Copyright © 2011 The Cochrane Collaboration. Published by John Wiley & Sons, Ltd.
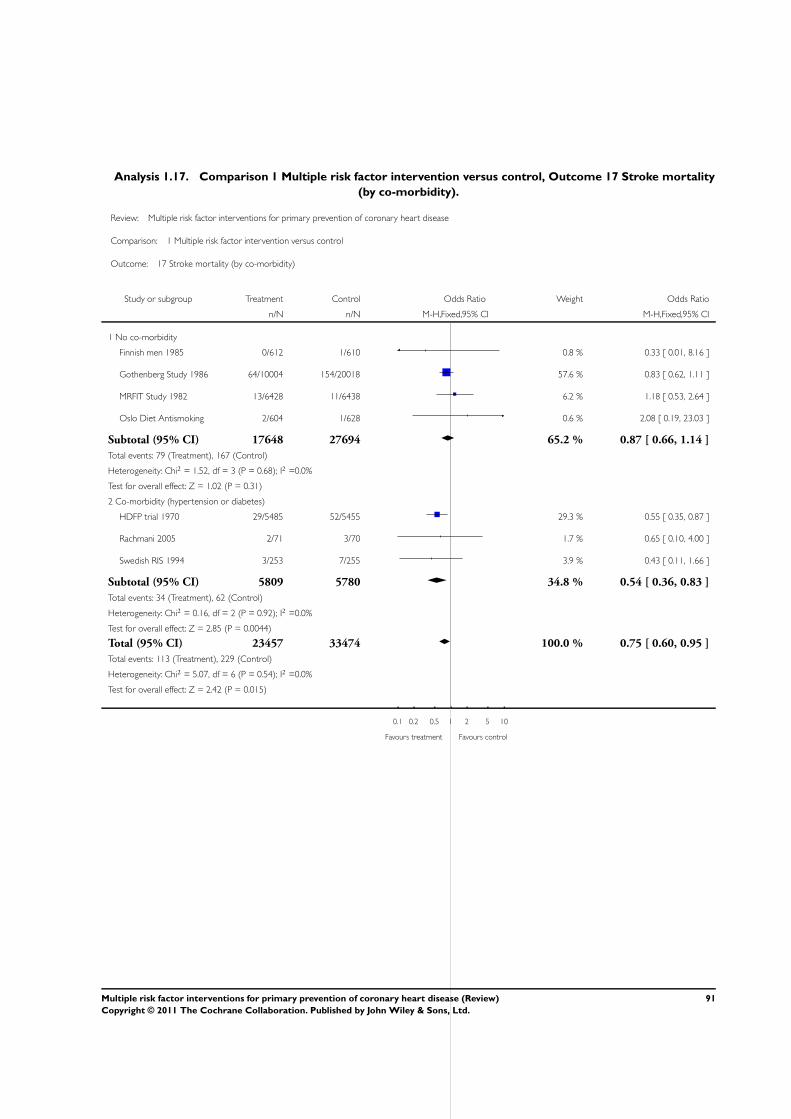
Analysis 1.17. Comparison 1 Multiple risk factor intervention versus control, Outcome 17 Stroke mortality
(by co-morbidity).
Review: Multiple risk factor interventions for primary prevention of coronary heart disease
Comparison: 1 Multiple risk factor intervention versus control
Outcome: 17 Stroke mortality (by co-morbidity)
Study or subgroup Treatment Control Odds Ratio Weight Odds Ratio
n/N n/N M-H,Fixed,95% CI M-H,Fixed,95% CI
1 No co-morbidity
Finnish men 1985 0/612 1/610 0.8 % 0.33 [ 0.01, 8.16 ]
Gothenberg Study 1986 64/10004 154/20018 57.6 % 0.83 [ 0.62, 1.11 ]
MRFIT Study 1982 13/6428 11/6438 6.2 % 1.18 [ 0.53, 2.64 ]
Oslo Diet Antismoking 2/604 1/628 0.6 % 2.08 [ 0.19, 23.03 ]
Subtotal (95% CI) 17648 27694 65.2 % 0.87 [ 0.66, 1.14 ]
Total events: 79 (Treatment), 167 (Control)
Heterogeneity: Chi2 = 1.52, df = 3 (P = 0.68); I2 =0.0%
Test for overall effect: Z = 1.02 (P = 0.31)
2 Co-morbidity (hypertension or diabetes)
HDFP trial 1970 29/5485 52/5455 29.3 % 0.55 [ 0.35, 0.87 ]
Rachmani 2005 2/71 3/70 1.7 % 0.65 [ 0.10, 4.00 ]
Swedish RIS 1994 3/253 7/255 3.9 % 0.43 [ 0.11, 1.66 ]
Subtotal (95% CI) 5809 5780 34.8 % 0.54 [ 0.36, 0.83 ]
Total events: 34 (Treatment), 62 (Control)
Heterogeneity: Chi2 = 0.16, df = 2 (P = 0.92); I2 =0.0%
Test for overall effect: Z = 2.85 (P = 0.0044)
Total (95% CI) 23457 33474 100.0 % 0.75 [ 0.60, 0.95 ]
Total events: 113 (Treatment), 229 (Control)
Heterogeneity: Chi2 = 5.07, df = 6 (P = 0.54); I2 =0.0%
Test for overall effect: Z = 2.42 (P = 0.015)
0.1 0.2 0.5 1 2 5 10
Favours treatment Favours control
91Multiple risk factor interventions for primary prevention of coronary heart disease (Review)
Copyright © 2011 The Cochrane Collaboration. Published by John Wiley & Sons, Ltd.
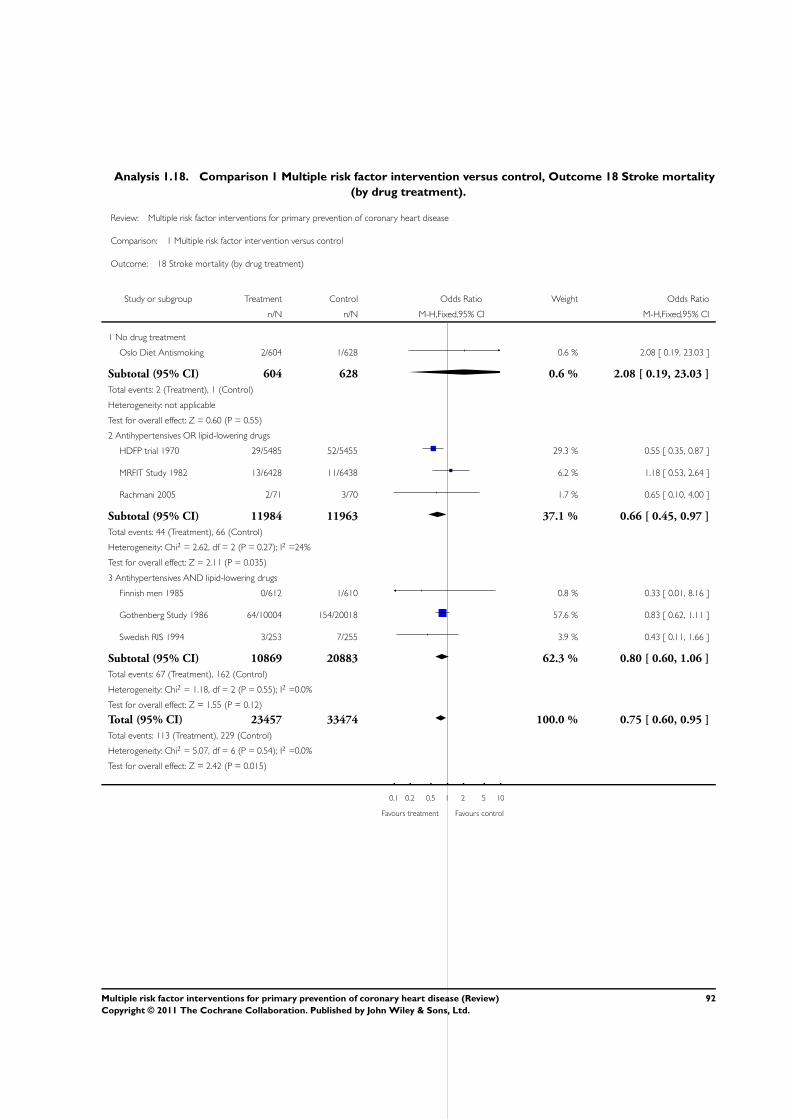
Analysis 1.18. Comparison 1 Multiple risk factor intervention versus control, Outcome 18 Stroke mortality
(by drug treatment).
Review: Multiple risk factor interventions for primary prevention of coronary heart disease
Comparison: 1 Multiple risk factor intervention versus control
Outcome: 18 Stroke mortality (by drug treatment)
Study or subgroup Treatment Control Odds Ratio Weight Odds Ratio
n/N n/N M-H,Fixed,95% CI M-H,Fixed,95% CI
1 No drug treatment
Oslo Diet Antismoking 2/604 1/628 0.6 % 2.08 [ 0.19, 23.03 ]
Subtotal (95% CI) 604 628 0.6 % 2.08 [ 0.19, 23.03 ]
Total events: 2 (Treatment), 1 (Control)
Heterogeneity: not applicable
Test for overall effect: Z = 0.60 (P = 0.55)
2 Antihypertensives OR lipid-lowering drugs
HDFP trial 1970 29/5485 52/5455 29.3 % 0.55 [ 0.35, 0.87 ]
MRFIT Study 1982 13/6428 11/6438 6.2 % 1.18 [ 0.53, 2.64 ]
Rachmani 2005 2/71 3/70 1.7 % 0.65 [ 0.10, 4.00 ]
Subtotal (95% CI) 11984 11963 37.1 % 0.66 [ 0.45, 0.97 ]
Total events: 44 (Treatment), 66 (Control)
Heterogeneity: Chi2 = 2.62, df = 2 (P = 0.27); I2 =24%
Test for overall effect: Z = 2.11 (P = 0.035)
3 Antihypertensives AND lipid-lowering drugs
Finnish men 1985 0/612 1/610 0.8 % 0.33 [ 0.01, 8.16 ]
Gothenberg Study 1986 64/10004 154/20018 57.6 % 0.83 [ 0.62, 1.11 ]
Swedish RIS 1994 3/253 7/255 3.9 % 0.43 [ 0.11, 1.66 ]
Subtotal (95% CI) 10869 20883 62.3 % 0.80 [ 0.60, 1.06 ]
Total events: 67 (Treatment), 162 (Control)
Heterogeneity: Chi2 = 1.18, df = 2 (P = 0.55); I2 =0.0%
Test for overall effect: Z = 1.55 (P = 0.12)
Total (95% CI) 23457 33474 100.0 % 0.75 [ 0.60, 0.95 ]
Total events: 113 (Treatment), 229 (Control)
Heterogeneity: Chi2 = 5.07, df = 6 (P = 0.54); I2 =0.0%
Test for overall effect: Z = 2.42 (P = 0.015)
0.1 0.2 0.5 1 2 5 10
Favours treatment Favours control
92Multiple risk factor interventions for primary prevention of coronary heart disease (Review)
Copyright © 2011 The Cochrane Collaboration. Published by John Wiley & Sons, Ltd.
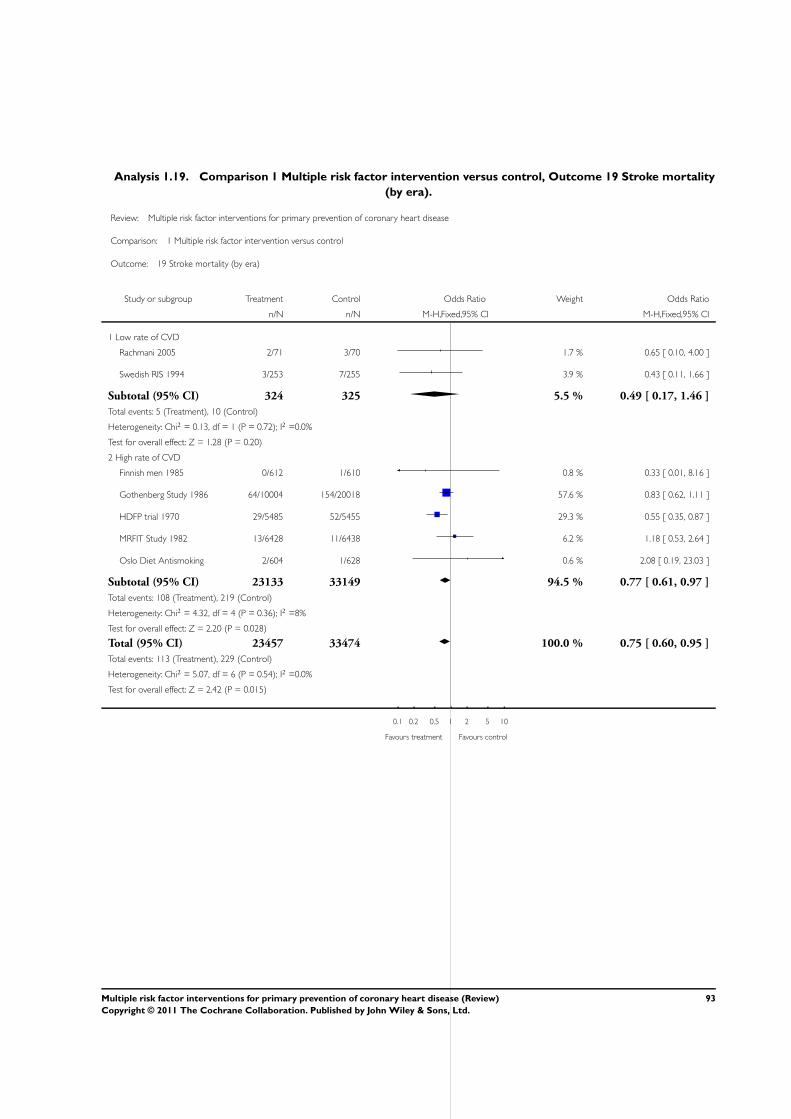
Analysis 1.19. Comparison 1 Multiple risk factor intervention versus control, Outcome 19 Stroke mortality
(by era).
Review: Multiple risk factor interventions for primary prevention of coronary heart disease
Comparison: 1 Multiple risk factor intervention versus control
Outcome: 19 Stroke mortality (by era)
Study or subgroup Treatment Control Odds Ratio Weight Odds Ratio
n/N n/N M-H,Fixed,95% CI M-H,Fixed,95% CI
1 Low rate of CVD
Rachmani 2005 2/71 3/70 1.7 % 0.65 [ 0.10, 4.00 ]
Swedish RIS 1994 3/253 7/255 3.9 % 0.43 [ 0.11, 1.66 ]
Subtotal (95% CI) 324 325 5.5 % 0.49 [ 0.17, 1.46 ]
Total events: 5 (Treatment), 10 (Control)
Heterogeneity: Chi2 = 0.13, df = 1 (P = 0.72); I2 =0.0%
Test for overall effect: Z = 1.28 (P = 0.20)
2 High rate of CVD
Finnish men 1985 0/612 1/610 0.8 % 0.33 [ 0.01, 8.16 ]
Gothenberg Study 1986 64/10004 154/20018 57.6 % 0.83 [ 0.62, 1.11 ]
HDFP trial 1970 29/5485 52/5455 29.3 % 0.55 [ 0.35, 0.87 ]
MRFIT Study 1982 13/6428 11/6438 6.2 % 1.18 [ 0.53, 2.64 ]
Oslo Diet Antismoking 2/604 1/628 0.6 % 2.08 [ 0.19, 23.03 ]
Subtotal (95% CI) 23133 33149 94.5 % 0.77 [ 0.61, 0.97 ]
Total events: 108 (Treatment), 219 (Control)
Heterogeneity: Chi2 = 4.32, df = 4 (P = 0.36); I2 =8%
Test for overall effect: Z = 2.20 (P = 0.028)
Total (95% CI) 23457 33474 100.0 % 0.75 [ 0.60, 0.95 ]
Total events: 113 (Treatment), 229 (Control)
Heterogeneity: Chi2 = 5.07, df = 6 (P = 0.54); I2 =0.0%
Test for overall effect: Z = 2.42 (P = 0.015)
0.1 0.2 0.5 1 2 5 10
Favours treatment Favours control
93Multiple risk factor interventions for primary prevention of coronary heart disease (Review)
Copyright © 2011 The Cochrane Collaboration. Published by John Wiley & Sons, Ltd.
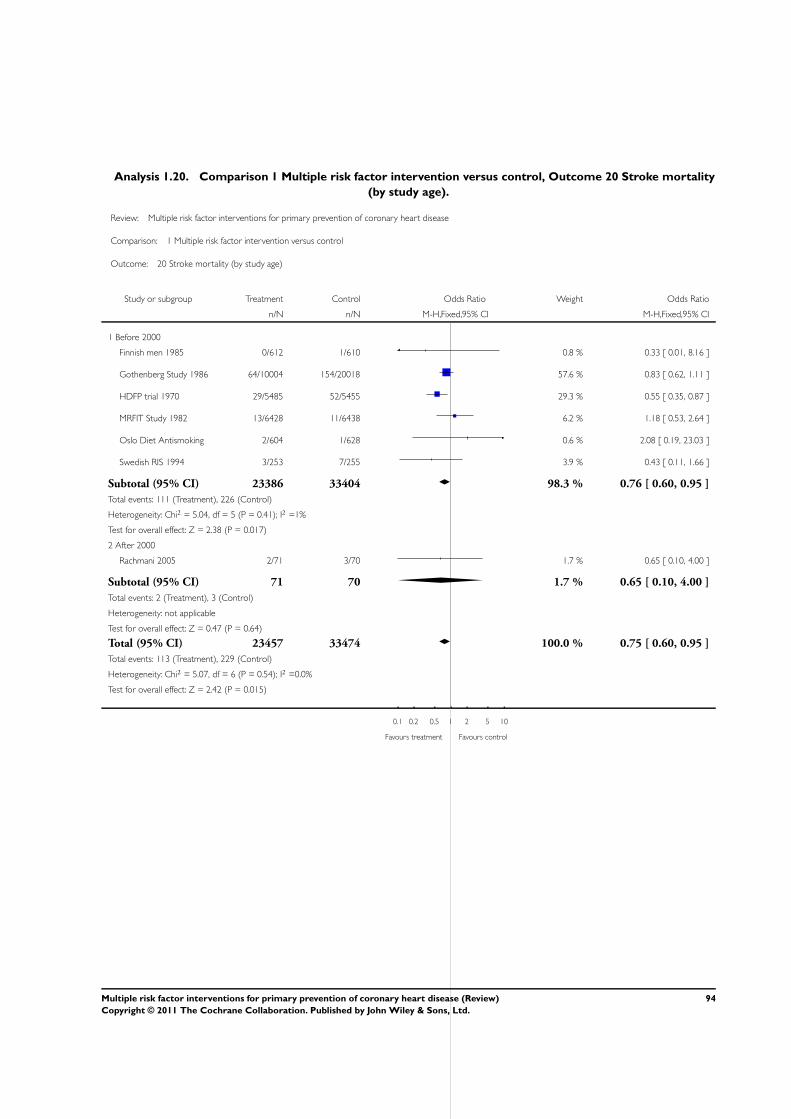
Analysis 1.20. Comparison 1 Multiple risk factor intervention versus control, Outcome 20 Stroke mortality
(by study age).
Review: Multiple risk factor interventions for primary prevention of coronary heart disease
Comparison: 1 Multiple risk factor intervention versus control
Outcome: 20 Stroke mortality (by study age)
Study or subgroup Treatment Control Odds Ratio Weight Odds Ratio
n/N n/N M-H,Fixed,95% CI M-H,Fixed,95% CI
1 Before 2000
Finnish men 1985 0/612 1/610 0.8 % 0.33 [ 0.01, 8.16 ]
Gothenberg Study 1986 64/10004 154/20018 57.6 % 0.83 [ 0.62, 1.11 ]
HDFP trial 1970 29/5485 52/5455 29.3 % 0.55 [ 0.35, 0.87 ]
MRFIT Study 1982 13/6428 11/6438 6.2 % 1.18 [ 0.53, 2.64 ]
Oslo Diet Antismoking 2/604 1/628 0.6 % 2.08 [ 0.19, 23.03 ]
Swedish RIS 1994 3/253 7/255 3.9 % 0.43 [ 0.11, 1.66 ]
Subtotal (95% CI) 23386 33404 98.3 % 0.76 [ 0.60, 0.95 ]
Total events: 111 (Treatment), 226 (Control)
Heterogeneity: Chi2 = 5.04, df = 5 (P = 0.41); I2 =1%
Test for overall effect: Z = 2.38 (P = 0.017)
2 After 2000
Rachmani 2005 2/71 3/70 1.7 % 0.65 [ 0.10, 4.00 ]
Subtotal (95% CI) 71 70 1.7 % 0.65 [ 0.10, 4.00 ]
Total events: 2 (Treatment), 3 (Control)
Heterogeneity: not applicable
Test for overall effect: Z = 0.47 (P = 0.64)
Total (95% CI) 23457 33474 100.0 % 0.75 [ 0.60, 0.95 ]
Total events: 113 (Treatment), 229 (Control)
Heterogeneity: Chi2 = 5.07, df = 6 (P = 0.54); I2 =0.0%
Test for overall effect: Z = 2.42 (P = 0.015)
0.1 0.2 0.5 1 2 5 10
Favours treatment Favours control
94Multiple risk factor interventions for primary prevention of coronary heart disease (Review)
Copyright © 2011 The Cochrane Collaboration. Published by John Wiley & Sons, Ltd.
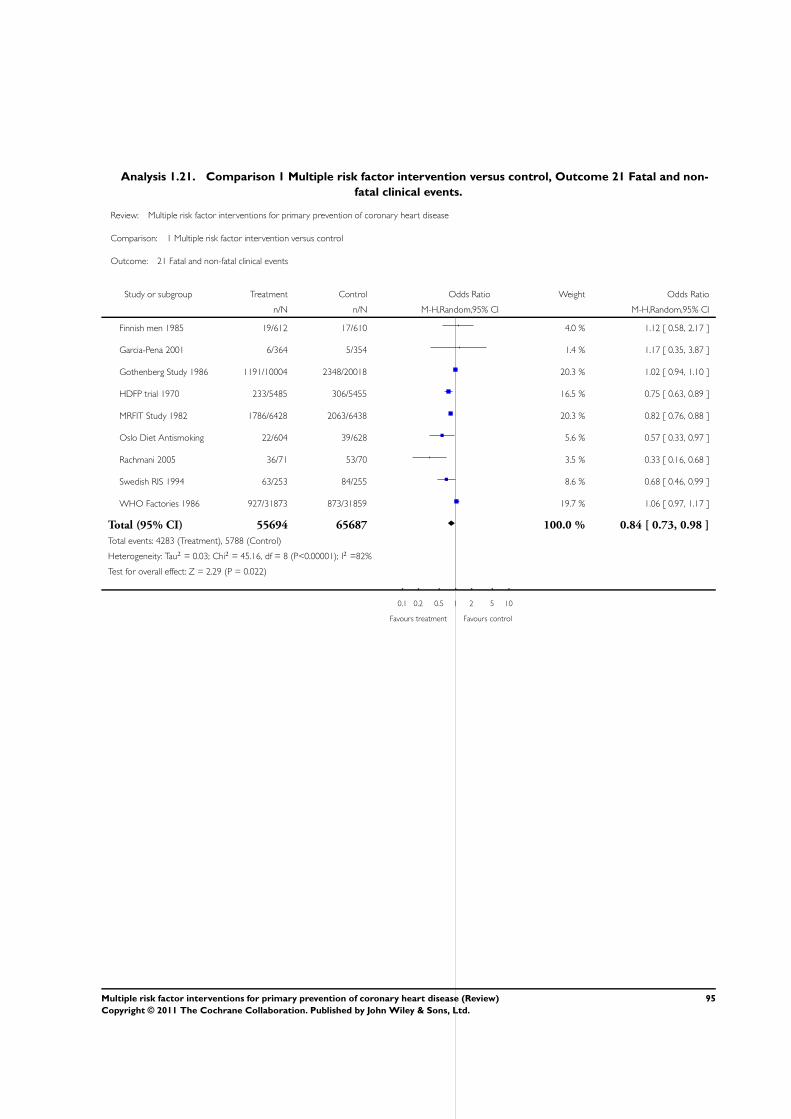
Analysis 1.21. Comparison 1 Multiple risk factor intervention versus control, Outcome 21 Fatal and non-
fatal clinical events.
Review: Multiple risk factor interventions for primary prevention of coronary heart disease
Comparison: 1 Multiple risk factor intervention versus control
Outcome: 21 Fatal and non-fatal clinical events
Study or subgroup Treatment Control Odds Ratio Weight Odds Ratio
n/N n/N M-H,Random,95% CI M-H,Random,95% CI
Finnish men 1985 19/612 17/610 4.0 % 1.12 [ 0.58, 2.17 ]
Garcia-Pena 2001 6/364 5/354 1.4 % 1.17 [ 0.35, 3.87 ]
Gothenberg Study 1986 1191/10004 2348/20018 20.3 % 1.02 [ 0.94, 1.10 ]
HDFP trial 1970 233/5485 306/5455 16.5 % 0.75 [ 0.63, 0.89 ]
MRFIT Study 1982 1786/6428 2063/6438 20.3 % 0.82 [ 0.76, 0.88 ]
Oslo Diet Antismoking 22/604 39/628 5.6 % 0.57 [ 0.33, 0.97 ]
Rachmani 2005 36/71 53/70 3.5 % 0.33 [ 0.16, 0.68 ]
Swedish RIS 1994 63/253 84/255 8.6 % 0.68 [ 0.46, 0.99 ]
WHO Factories 1986 927/31873 873/31859 19.7 % 1.06 [ 0.97, 1.17 ]
Total (95% CI) 55694 65687 100.0 % 0.84 [ 0.73, 0.98 ]
Total events: 4283 (Treatment), 5788 (Control)
Heterogeneity: Tau2 = 0.03; Chi2 = 45.16, df = 8 (P<0.00001); I2 =82%
Test for overall effect: Z = 2.29 (P = 0.022)
0.1 0.2 0.5 1 2 5 10
Favours treatment Favours control
95Multiple risk factor interventions for primary prevention of coronary heart disease (Review)
Copyright © 2011 The Cochrane Collaboration. Published by John Wiley & Sons, Ltd.
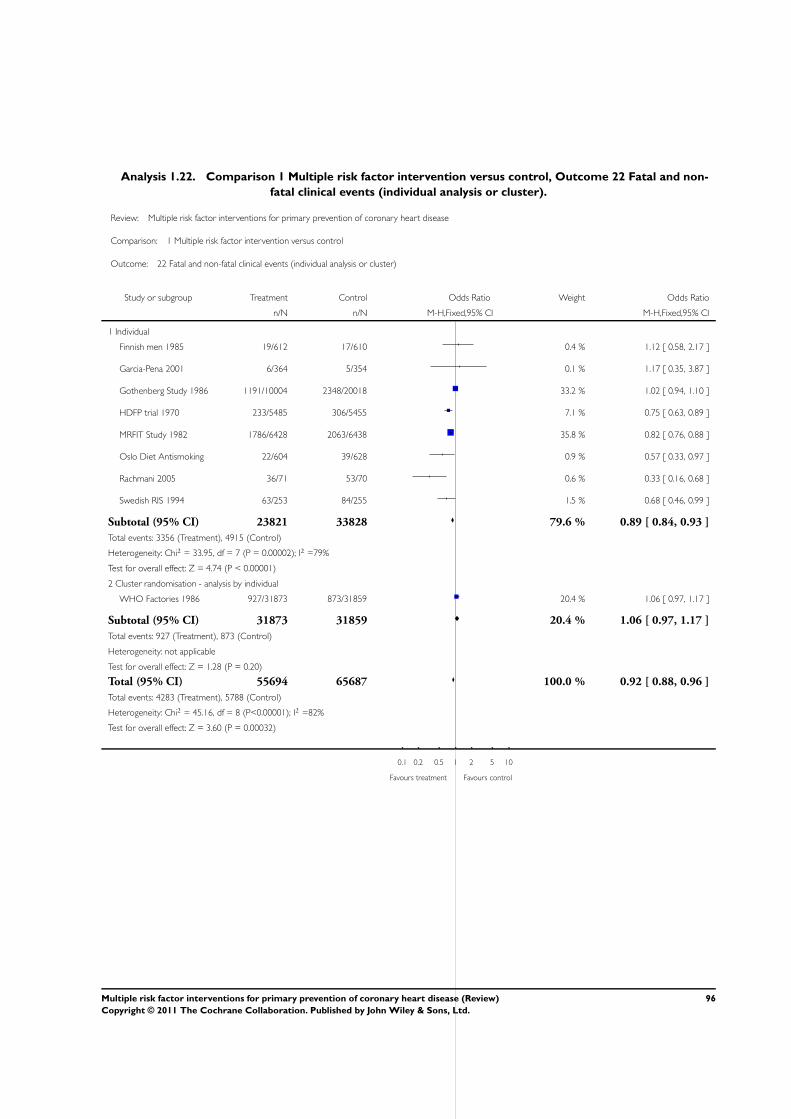
Analysis 1.22. Comparison 1 Multiple risk factor intervention versus control, Outcome 22 Fatal and non-
fatal clinical events (individual analysis or cluster).
Review: Multiple risk factor interventions for primary prevention of coronary heart disease
Comparison: 1 Multiple risk factor intervention versus control
Outcome: 22 Fatal and non-fatal clinical events (individual analysis or cluster)
Study or subgroup Treatment Control Odds Ratio Weight Odds Ratio
n/N n/N M-H,Fixed,95% CI M-H,Fixed,95% CI
1 Individual
Finnish men 1985 19/612 17/610 0.4 % 1.12 [ 0.58, 2.17 ]
Garcia-Pena 2001 6/364 5/354 0.1 % 1.17 [ 0.35, 3.87 ]
Gothenberg Study 1986 1191/10004 2348/20018 33.2 % 1.02 [ 0.94, 1.10 ]
HDFP trial 1970 233/5485 306/5455 7.1 % 0.75 [ 0.63, 0.89 ]
MRFIT Study 1982 1786/6428 2063/6438 35.8 % 0.82 [ 0.76, 0.88 ]
Oslo Diet Antismoking 22/604 39/628 0.9 % 0.57 [ 0.33, 0.97 ]
Rachmani 2005 36/71 53/70 0.6 % 0.33 [ 0.16, 0.68 ]
Swedish RIS 1994 63/253 84/255 1.5 % 0.68 [ 0.46, 0.99 ]
Subtotal (95% CI) 23821 33828 79.6 % 0.89 [ 0.84, 0.93 ]
Total events: 3356 (Treatment), 4915 (Control)
Heterogeneity: Chi2 = 33.95, df = 7 (P = 0.00002); I2 =79%
Test for overall effect: Z = 4.74 (P < 0.00001)
2 Cluster randomisation - analysis by individual
WHO Factories 1986 927/31873 873/31859 20.4 % 1.06 [ 0.97, 1.17 ]
Subtotal (95% CI) 31873 31859 20.4 % 1.06 [ 0.97, 1.17 ]
Total events: 927 (Treatment), 873 (Control)
Heterogeneity: not applicable
Test for overall effect: Z = 1.28 (P = 0.20)
Total (95% CI) 55694 65687 100.0 % 0.92 [ 0.88, 0.96 ]
Total events: 4283 (Treatment), 5788 (Control)
Heterogeneity: Chi2 = 45.16, df = 8 (P<0.00001); I2 =82%
Test for overall effect: Z = 3.60 (P = 0.00032)
0.1 0.2 0.5 1 2 5 10
Favours treatment Favours control
96Multiple risk factor interventions for primary prevention of coronary heart disease (Review)
Copyright © 2011 The Cochrane Collaboration. Published by John Wiley & Sons, Ltd.
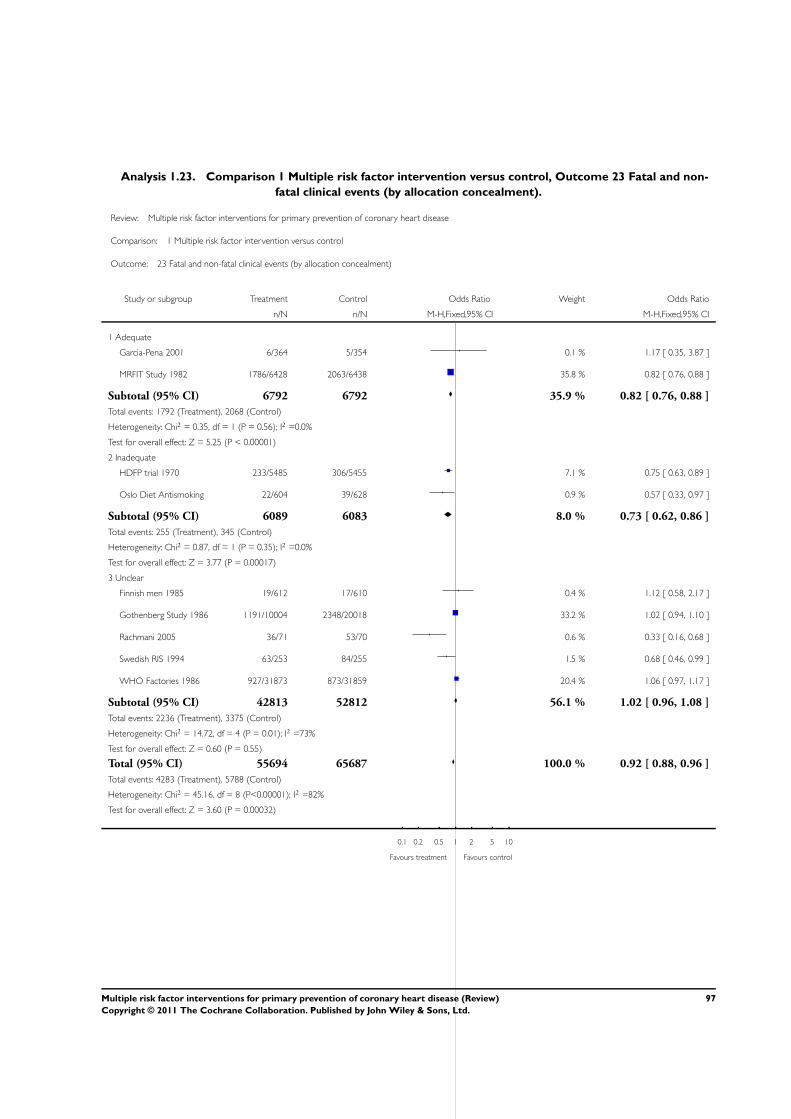
Analysis 1.23. Comparison 1 Multiple risk factor intervention versus control, Outcome 23 Fatal and non-
fatal clinical events (by allocation concealment).
Review: Multiple risk factor interventions for primary prevention of coronary heart disease
Comparison: 1 Multiple risk factor intervention versus control
Outcome: 23 Fatal and non-fatal clinical events (by allocation concealment)
Study or subgroup Treatment Control Odds Ratio Weight Odds Ratio
n/N n/N M-H,Fixed,95% CI M-H,Fixed,95% CI
1 Adequate
Garcia-Pena 2001 6/364 5/354 0.1 % 1.17 [ 0.35, 3.87 ]
MRFIT Study 1982 1786/6428 2063/6438 35.8 % 0.82 [ 0.76, 0.88 ]
Subtotal (95% CI) 6792 6792 35.9 % 0.82 [ 0.76, 0.88 ]
Total events: 1792 (Treatment), 2068 (Control)
Heterogeneity: Chi2 = 0.35, df = 1 (P = 0.56); I2 =0.0%
Test for overall effect: Z = 5.25 (P < 0.00001)
2 Inadequate
HDFP trial 1970 233/5485 306/5455 7.1 % 0.75 [ 0.63, 0.89 ]
Oslo Diet Antismoking 22/604 39/628 0.9 % 0.57 [ 0.33, 0.97 ]
Subtotal (95% CI) 6089 6083 8.0 % 0.73 [ 0.62, 0.86 ]
Total events: 255 (Treatment), 345 (Control)
Heterogeneity: Chi2 = 0.87, df = 1 (P = 0.35); I2 =0.0%
Test for overall effect: Z = 3.77 (P = 0.00017)
3 Unclear
Finnish men 1985 19/612 17/610 0.4 % 1.12 [ 0.58, 2.17 ]
Gothenberg Study 1986 1191/10004 2348/20018 33.2 % 1.02 [ 0.94, 1.10 ]
Rachmani 2005 36/71 53/70 0.6 % 0.33 [ 0.16, 0.68 ]
Swedish RIS 1994 63/253 84/255 1.5 % 0.68 [ 0.46, 0.99 ]
WHO Factories 1986 927/31873 873/31859 20.4 % 1.06 [ 0.97, 1.17 ]
Subtotal (95% CI) 42813 52812 56.1 % 1.02 [ 0.96, 1.08 ]
Total events: 2236 (Treatment), 3375 (Control)
Heterogeneity: Chi2 = 14.72, df = 4 (P = 0.01); I2 =73%
Test for overall effect: Z = 0.60 (P = 0.55)
Total (95% CI) 55694 65687 100.0 % 0.92 [ 0.88, 0.96 ]
Total events: 4283 (Treatment), 5788 (Control)
Heterogeneity: Chi2 = 45.16, df = 8 (P<0.00001); I2 =82%
Test for overall effect: Z = 3.60 (P = 0.00032)
0.1 0.2 0.5 1 2 5 10
Favours treatment Favours control
97Multiple risk factor interventions for primary prevention of coronary heart disease (Review)
Copyright © 2011 The Cochrane Collaboration. Published by John Wiley & Sons, Ltd.
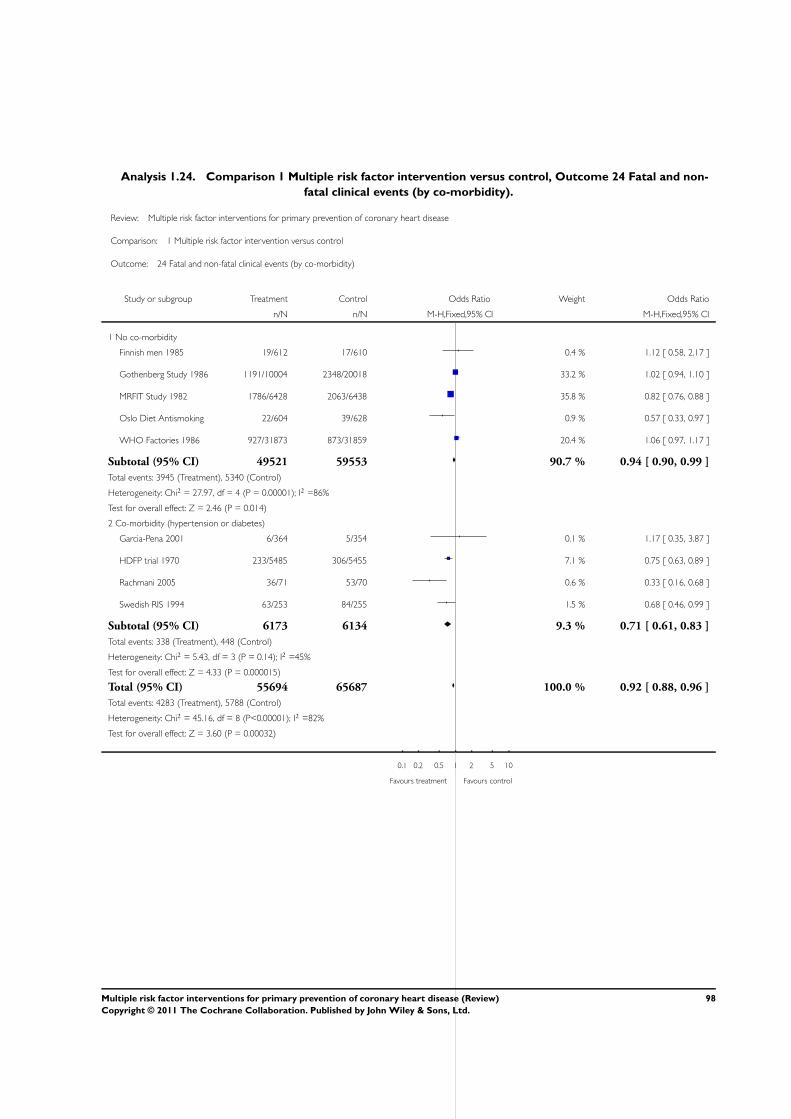
Analysis 1.24. Comparison 1 Multiple risk factor intervention versus control, Outcome 24 Fatal and non-
fatal clinical events (by co-morbidity).
Review: Multiple risk factor interventions for primary prevention of coronary heart disease
Comparison: 1 Multiple risk factor intervention versus control
Outcome: 24 Fatal and non-fatal clinical events (by co-morbidity)
Study or subgroup Treatment Control Odds Ratio Weight Odds Ratio
n/N n/N M-H,Fixed,95% CI M-H,Fixed,95% CI
1 No co-morbidity
Finnish men 1985 19/612 17/610 0.4 % 1.12 [ 0.58, 2.17 ]
Gothenberg Study 1986 1191/10004 2348/20018 33.2 % 1.02 [ 0.94, 1.10 ]
MRFIT Study 1982 1786/6428 2063/6438 35.8 % 0.82 [ 0.76, 0.88 ]
Oslo Diet Antismoking 22/604 39/628 0.9 % 0.57 [ 0.33, 0.97 ]
WHO Factories 1986 927/31873 873/31859 20.4 % 1.06 [ 0.97, 1.17 ]
Subtotal (95% CI) 49521 59553 90.7 % 0.94 [ 0.90, 0.99 ]
Total events: 3945 (Treatment), 5340 (Control)
Heterogeneity: Chi2 = 27.97, df = 4 (P = 0.00001); I2 =86%
Test for overall effect: Z = 2.46 (P = 0.014)
2 Co-morbidity (hypertension or diabetes)
Garcia-Pena 2001 6/364 5/354 0.1 % 1.17 [ 0.35, 3.87 ]
HDFP trial 1970 233/5485 306/5455 7.1 % 0.75 [ 0.63, 0.89 ]
Rachmani 2005 36/71 53/70 0.6 % 0.33 [ 0.16, 0.68 ]
Swedish RIS 1994 63/253 84/255 1.5 % 0.68 [ 0.46, 0.99 ]
Subtotal (95% CI) 6173 6134 9.3 % 0.71 [ 0.61, 0.83 ]
Total events: 338 (Treatment), 448 (Control)
Heterogeneity: Chi2 = 5.43, df = 3 (P = 0.14); I2 =45%
Test for overall effect: Z = 4.33 (P = 0.000015)
Total (95% CI) 55694 65687 100.0 % 0.92 [ 0.88, 0.96 ]
Total events: 4283 (Treatment), 5788 (Control)
Heterogeneity: Chi2 = 45.16, df = 8 (P<0.00001); I2 =82%
Test for overall effect: Z = 3.60 (P = 0.00032)
0.1 0.2 0.5 1 2 5 10
Favours treatment Favours control
98Multiple risk factor interventions for primary prevention of coronary heart disease (Review)
Copyright © 2011 The Cochrane Collaboration. Published by John Wiley & Sons, Ltd.
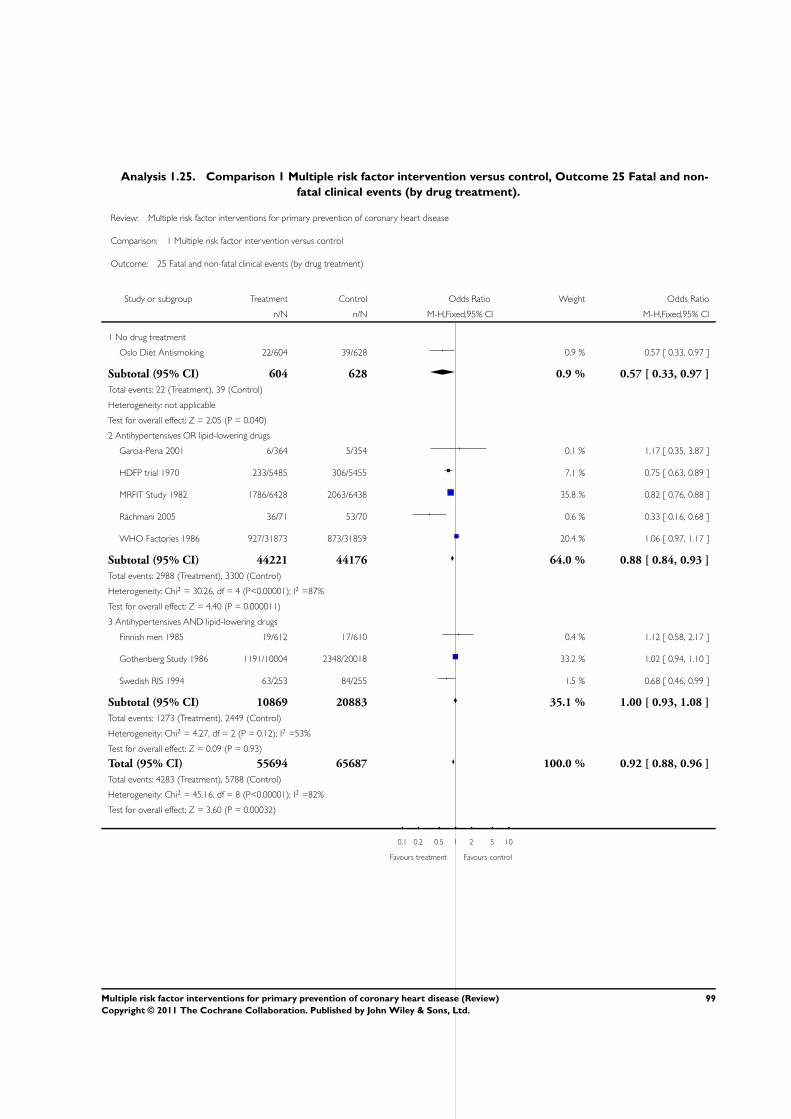
Analysis 1.25. Comparison 1 Multiple risk factor intervention versus control, Outcome 25 Fatal and non-
fatal clinical events (by drug treatment).
Review: Multiple risk factor interventions for primary prevention of coronary heart disease
Comparison: 1 Multiple risk factor intervention versus control
Outcome: 25 Fatal and non-fatal clinical events (by drug treatment)
Study or subgroup Treatment Control Odds Ratio Weight Odds Ratio
n/N n/N M-H,Fixed,95% CI M-H,Fixed,95% CI
1 No drug treatment
Oslo Diet Antismoking 22/604 39/628 0.9 % 0.57 [ 0.33, 0.97 ]
Subtotal (95% CI) 604 628 0.9 % 0.57 [ 0.33, 0.97 ]
Total events: 22 (Treatment), 39 (Control)
Heterogeneity: not applicable
Test for overall effect: Z = 2.05 (P = 0.040)
2 Antihypertensives OR lipid-lowering drugs
Garcia-Pena 2001 6/364 5/354 0.1 % 1.17 [ 0.35, 3.87 ]
HDFP trial 1970 233/5485 306/5455 7.1 % 0.75 [ 0.63, 0.89 ]
MRFIT Study 1982 1786/6428 2063/6438 35.8 % 0.82 [ 0.76, 0.88 ]
Rachmani 2005 36/71 53/70 0.6 % 0.33 [ 0.16, 0.68 ]
WHO Factories 1986 927/31873 873/31859 20.4 % 1.06 [ 0.97, 1.17 ]
Subtotal (95% CI) 44221 44176 64.0 % 0.88 [ 0.84, 0.93 ]
Total events: 2988 (Treatment), 3300 (Control)
Heterogeneity: Chi2 = 30.26, df = 4 (P<0.00001); I2 =87%
Test for overall effect: Z = 4.40 (P = 0.000011)
3 Antihypertensives AND lipid-lowering drugs
Finnish men 1985 19/612 17/610 0.4 % 1.12 [ 0.58, 2.17 ]
Gothenberg Study 1986 1191/10004 2348/20018 33.2 % 1.02 [ 0.94, 1.10 ]
Swedish RIS 1994 63/253 84/255 1.5 % 0.68 [ 0.46, 0.99 ]
Subtotal (95% CI) 10869 20883 35.1 % 1.00 [ 0.93, 1.08 ]
Total events: 1273 (Treatment), 2449 (Control)
Heterogeneity: Chi2 = 4.27, df = 2 (P = 0.12); I2 =53%
Test for overall effect: Z = 0.09 (P = 0.93)
Total (95% CI) 55694 65687 100.0 % 0.92 [ 0.88, 0.96 ]
Total events: 4283 (Treatment), 5788 (Control)
Heterogeneity: Chi2 = 45.16, df = 8 (P<0.00001); I2 =82%
Test for overall effect: Z = 3.60 (P = 0.00032)
0.1 0.2 0.5 1 2 5 10
Favours treatment Favours control
99Multiple risk factor interventions for primary prevention of coronary heart disease (Review)
Copyright © 2011 The Cochrane Collaboration. Published by John Wiley & Sons, Ltd.
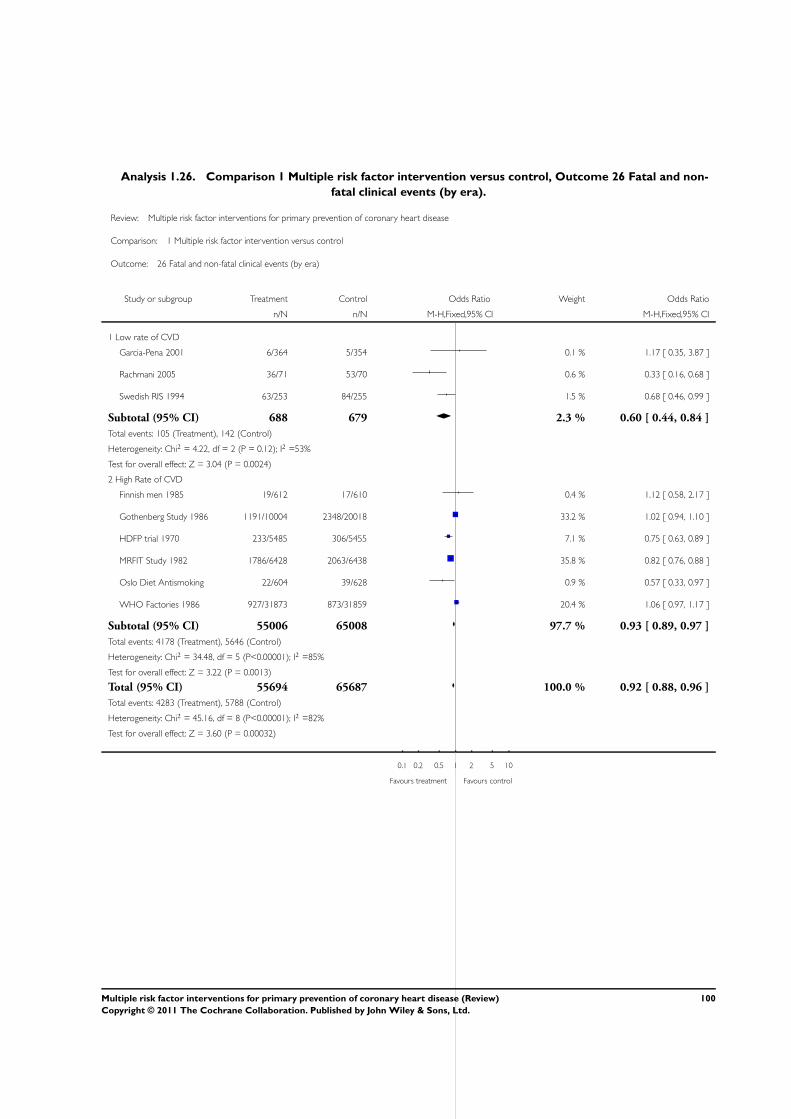
Analysis 1.26. Comparison 1 Multiple risk factor intervention versus control, Outcome 26 Fatal and non-
fatal clinical events (by era).
Review: Multiple risk factor interventions for primary prevention of coronary heart disease
Comparison: 1 Multiple risk factor intervention versus control
Outcome: 26 Fatal and non-fatal clinical events (by era)
Study or subgroup Treatment Control Odds Ratio Weight Odds Ratio
n/N n/N M-H,Fixed,95% CI M-H,Fixed,95% CI
1 Low rate of CVD
Garcia-Pena 2001 6/364 5/354 0.1 % 1.17 [ 0.35, 3.87 ]
Rachmani 2005 36/71 53/70 0.6 % 0.33 [ 0.16, 0.68 ]
Swedish RIS 1994 63/253 84/255 1.5 % 0.68 [ 0.46, 0.99 ]
Subtotal (95% CI) 688 679 2.3 % 0.60 [ 0.44, 0.84 ]
Total events: 105 (Treatment), 142 (Control)
Heterogeneity: Chi2 = 4.22, df = 2 (P = 0.12); I2 =53%
Test for overall effect: Z = 3.04 (P = 0.0024)
2 High Rate of CVD
Finnish men 1985 19/612 17/610 0.4 % 1.12 [ 0.58, 2.17 ]
Gothenberg Study 1986 1191/10004 2348/20018 33.2 % 1.02 [ 0.94, 1.10 ]
HDFP trial 1970 233/5485 306/5455 7.1 % 0.75 [ 0.63, 0.89 ]
MRFIT Study 1982 1786/6428 2063/6438 35.8 % 0.82 [ 0.76, 0.88 ]
Oslo Diet Antismoking 22/604 39/628 0.9 % 0.57 [ 0.33, 0.97 ]
WHO Factories 1986 927/31873 873/31859 20.4 % 1.06 [ 0.97, 1.17 ]
Subtotal (95% CI) 55006 65008 97.7 % 0.93 [ 0.89, 0.97 ]
Total events: 4178 (Treatment), 5646 (Control)
Heterogeneity: Chi2 = 34.48, df = 5 (P<0.00001); I2 =85%
Test for overall effect: Z = 3.22 (P = 0.0013)
Total (95% CI) 55694 65687 100.0 % 0.92 [ 0.88, 0.96 ]
Total events: 4283 (Treatment), 5788 (Control)
Heterogeneity: Chi2 = 45.16, df = 8 (P<0.00001); I2 =82%
Test for overall effect: Z = 3.60 (P = 0.00032)
0.1 0.2 0.5 1 2 5 10
Favours treatment Favours control
100Multiple risk factor interventions for primary prevention of coronary heart disease (Review)
Copyright © 2011 The Cochrane Collaboration. Published by John Wiley & Sons, Ltd.
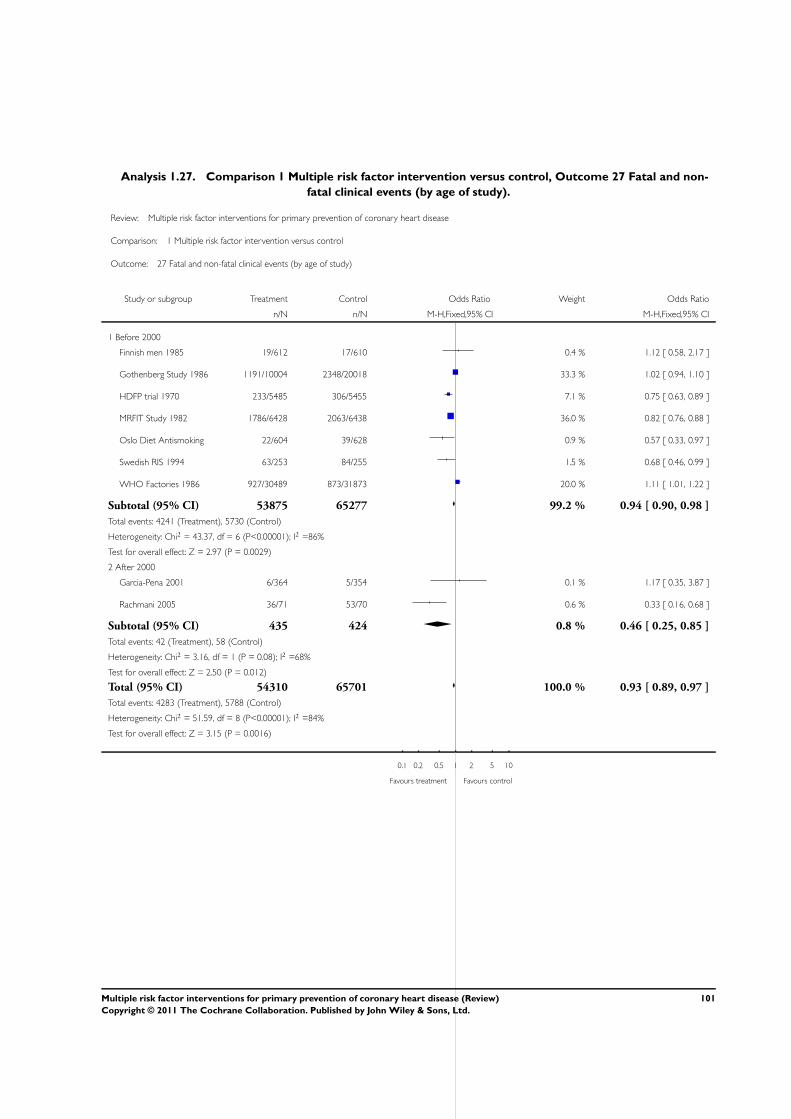
Analysis 1.27. Comparison 1 Multiple risk factor intervention versus control, Outcome 27 Fatal and non-
fatal clinical events (by age of study).
Review: Multiple risk factor interventions for primary prevention of coronary heart disease
Comparison: 1 Multiple risk factor intervention versus control
Outcome: 27 Fatal and non-fatal clinical events (by age of study)
Study or subgroup Treatment Control Odds Ratio Weight Odds Ratio
n/N n/N M-H,Fixed,95% CI M-H,Fixed,95% CI
1 Before 2000
Finnish men 1985 19/612 17/610 0.4 % 1.12 [ 0.58, 2.17 ]
Gothenberg Study 1986 1191/10004 2348/20018 33.3 % 1.02 [ 0.94, 1.10 ]
HDFP trial 1970 233/5485 306/5455 7.1 % 0.75 [ 0.63, 0.89 ]
MRFIT Study 1982 1786/6428 2063/6438 36.0 % 0.82 [ 0.76, 0.88 ]
Oslo Diet Antismoking 22/604 39/628 0.9 % 0.57 [ 0.33, 0.97 ]
Swedish RIS 1994 63/253 84/255 1.5 % 0.68 [ 0.46, 0.99 ]
WHO Factories 1986 927/30489 873/31873 20.0 % 1.11 [ 1.01, 1.22 ]
Subtotal (95% CI) 53875 65277 99.2 % 0.94 [ 0.90, 0.98 ]
Total events: 4241 (Treatment), 5730 (Control)
Heterogeneity: Chi2 = 43.37, df = 6 (P<0.00001); I2 =86%
Test for overall effect: Z = 2.97 (P = 0.0029)
2 After 2000
Garcia-Pena 2001 6/364 5/354 0.1 % 1.17 [ 0.35, 3.87 ]
Rachmani 2005 36/71 53/70 0.6 % 0.33 [ 0.16, 0.68 ]
Subtotal (95% CI) 435 424 0.8 % 0.46 [ 0.25, 0.85 ]
Total events: 42 (Treatment), 58 (Control)
Heterogeneity: Chi2 = 3.16, df = 1 (P = 0.08); I2 =68%
Test for overall effect: Z = 2.50 (P = 0.012)
Total (95% CI) 54310 65701 100.0 % 0.93 [ 0.89, 0.97 ]
Total events: 4283 (Treatment), 5788 (Control)
Heterogeneity: Chi2 = 51.59, df = 8 (P<0.00001); I2 =84%
Test for overall effect: Z = 3.15 (P = 0.0016)
0.1 0.2 0.5 1 2 5 10
Favours treatment Favours control
101Multiple risk factor interventions for primary prevention of coronary heart disease (Review)
Copyright © 2011 The Cochrane Collaboration. Published by John Wiley & Sons, Ltd.
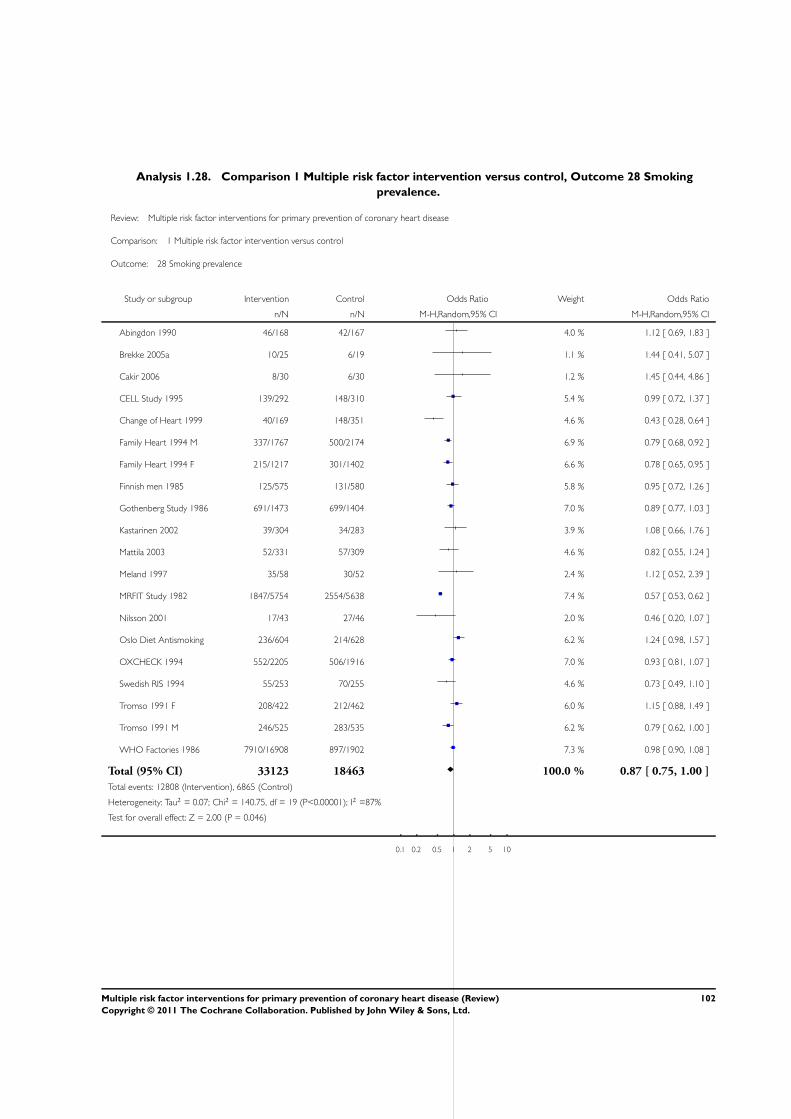
Analysis 1.28. Comparison 1 Multiple risk factor intervention versus control, Outcome 28 Smoking
prevalence.
Review: Multiple risk factor interventions for primary prevention of coronary heart disease
Comparison: 1 Multiple risk factor intervention versus control
Outcome: 28 Smoking prevalence
Study or subgroup Intervention Control Odds Ratio Weight Odds Ratio
n/N n/N M-H,Random,95% CI M-H,Random,95% CI
Abingdon 1990 46/168 42/167 4.0 % 1.12 [ 0.69, 1.83 ]
Brekke 2005a 10/25 6/19 1.1 % 1.44 [ 0.41, 5.07 ]
Cakir 2006 8/30 6/30 1.2 % 1.45 [ 0.44, 4.86 ]
CELL Study 1995 139/292 148/310 5.4 % 0.99 [ 0.72, 1.37 ]
Change of Heart 1999 40/169 148/351 4.6 % 0.43 [ 0.28, 0.64 ]
Family Heart 1994 M 337/1767 500/2174 6.9 % 0.79 [ 0.68, 0.92 ]
Family Heart 1994 F 215/1217 301/1402 6.6 % 0.78 [ 0.65, 0.95 ]
Finnish men 1985 125/575 131/580 5.8 % 0.95 [ 0.72, 1.26 ]
Gothenberg Study 1986 691/1473 699/1404 7.0 % 0.89 [ 0.77, 1.03 ]
Kastarinen 2002 39/304 34/283 3.9 % 1.08 [ 0.66, 1.76 ]
Mattila 2003 52/331 57/309 4.6 % 0.82 [ 0.55, 1.24 ]
Meland 1997 35/58 30/52 2.4 % 1.12 [ 0.52, 2.39 ]
MRFIT Study 1982 1847/5754 2554/5638 7.4 % 0.57 [ 0.53, 0.62 ]
Nilsson 2001 17/43 27/46 2.0 % 0.46 [ 0.20, 1.07 ]
Oslo Diet Antismoking 236/604 214/628 6.2 % 1.24 [ 0.98, 1.57 ]
OXCHECK 1994 552/2205 506/1916 7.0 % 0.93 [ 0.81, 1.07 ]
Swedish RIS 1994 55/253 70/255 4.6 % 0.73 [ 0.49, 1.10 ]
Tromso 1991 F 208/422 212/462 6.0 % 1.15 [ 0.88, 1.49 ]
Tromso 1991 M 246/525 283/535 6.2 % 0.79 [ 0.62, 1.00 ]
WHO Factories 1986 7910/16908 897/1902 7.3 % 0.98 [ 0.90, 1.08 ]
Total (95% CI) 33123 18463 100.0 % 0.87 [ 0.75, 1.00 ]
Total events: 12808 (Intervention), 6865 (Control)
Heterogeneity: Tau2 = 0.07; Chi2 = 140.75, df = 19 (P<0.00001); I2 =87%
Test for overall effect: Z = 2.00 (P = 0.046)
0.1 0.2 0.5 1 2 5 10
102Multiple risk factor interventions for primary prevention of coronary heart disease (Review)
Copyright © 2011 The Cochrane Collaboration. Published by John Wiley & Sons, Ltd.
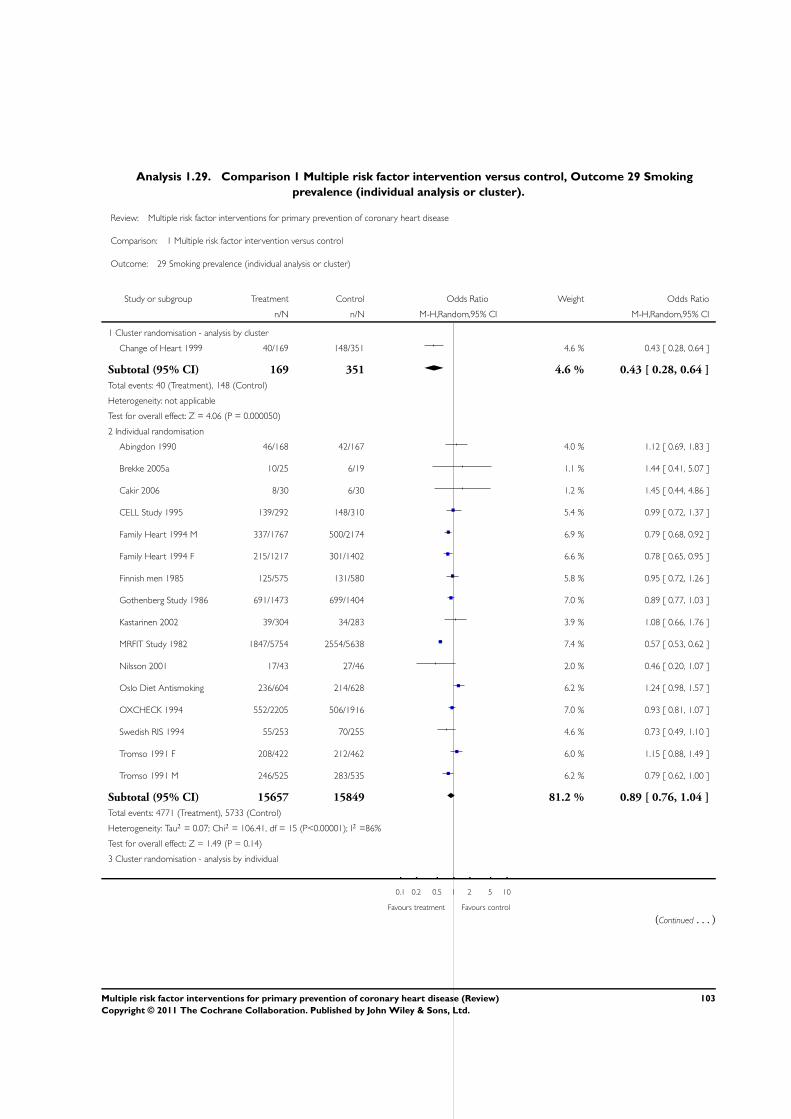
Analysis 1.29. Comparison 1 Multiple risk factor intervention versus control, Outcome 29 Smoking
prevalence (individual analysis or cluster).
Review: Multiple risk factor interventions for primary prevention of coronary heart disease
Comparison: 1 Multiple risk factor intervention versus control
Outcome: 29 Smoking prevalence (individual analysis or cluster)
Study or subgroup Treatment Control Odds Ratio Weight Odds Ratio
n/N n/N M-H,Random,95% CI M-H,Random,95% CI
1 Cluster randomisation - analysis by cluster
Change of Heart 1999 40/169 148/351 4.6 % 0.43 [ 0.28, 0.64 ]
Subtotal (95% CI) 169 351 4.6 % 0.43 [ 0.28, 0.64 ]
Total events: 40 (Treatment), 148 (Control)
Heterogeneity: not applicable
Test for overall effect: Z = 4.06 (P = 0.000050)
2 Individual randomisation
Abingdon 1990 46/168 42/167 4.0 % 1.12 [ 0.69, 1.83 ]
Brekke 2005a 10/25 6/19 1.1 % 1.44 [ 0.41, 5.07 ]
Cakir 2006 8/30 6/30 1.2 % 1.45 [ 0.44, 4.86 ]
CELL Study 1995 139/292 148/310 5.4 % 0.99 [ 0.72, 1.37 ]
Family Heart 1994 M 337/1767 500/2174 6.9 % 0.79 [ 0.68, 0.92 ]
Family Heart 1994 F 215/1217 301/1402 6.6 % 0.78 [ 0.65, 0.95 ]
Finnish men 1985 125/575 131/580 5.8 % 0.95 [ 0.72, 1.26 ]
Gothenberg Study 1986 691/1473 699/1404 7.0 % 0.89 [ 0.77, 1.03 ]
Kastarinen 2002 39/304 34/283 3.9 % 1.08 [ 0.66, 1.76 ]
MRFIT Study 1982 1847/5754 2554/5638 7.4 % 0.57 [ 0.53, 0.62 ]
Nilsson 2001 17/43 27/46 2.0 % 0.46 [ 0.20, 1.07 ]
Oslo Diet Antismoking 236/604 214/628 6.2 % 1.24 [ 0.98, 1.57 ]
OXCHECK 1994 552/2205 506/1916 7.0 % 0.93 [ 0.81, 1.07 ]
Swedish RIS 1994 55/253 70/255 4.6 % 0.73 [ 0.49, 1.10 ]
Tromso 1991 F 208/422 212/462 6.0 % 1.15 [ 0.88, 1.49 ]
Tromso 1991 M 246/525 283/535 6.2 % 0.79 [ 0.62, 1.00 ]
Subtotal (95% CI) 15657 15849 81.2 % 0.89 [ 0.76, 1.04 ]
Total events: 4771 (Treatment), 5733 (Control)
Heterogeneity: Tau2 = 0.07; Chi2 = 106.41, df = 15 (P<0.00001); I2 =86%
Test for overall effect: Z = 1.49 (P = 0.14)
3 Cluster randomisation - analysis by individual
0.1 0.2 0.5 1 2 5 10
Favours treatment Favours control
(Continued . . . )
103Multiple risk factor interventions for primary prevention of coronary heart disease (Review)
Copyright © 2011 The Cochrane Collaboration. Published by John Wiley & Sons, Ltd.
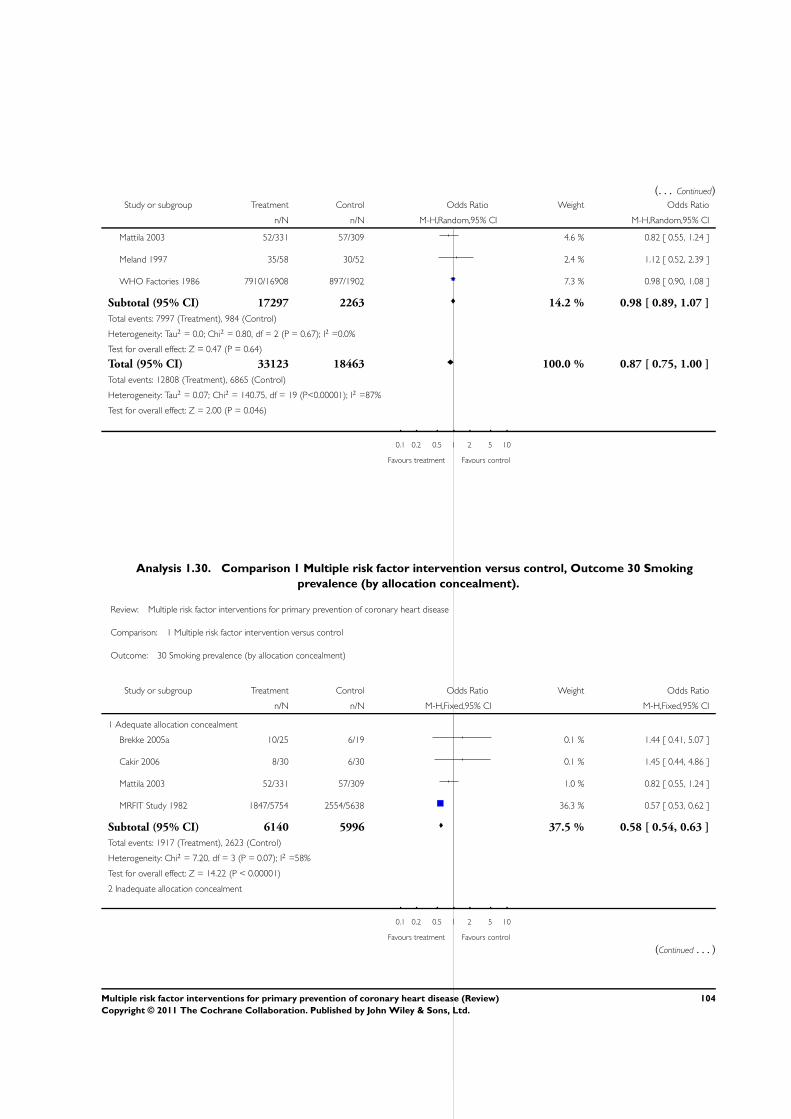
(. . . Continued)Study or subgroup Treatment Control Odds Ratio Weight Odds Ratio
n/N n/N M-H,Random,95% CI M-H,Random,95% CI
Mattila 2003 52/331 57/309 4.6 % 0.82 [ 0.55, 1.24 ]
Meland 1997 35/58 30/52 2.4 % 1.12 [ 0.52, 2.39 ]
WHO Factories 1986 7910/16908 897/1902 7.3 % 0.98 [ 0.90, 1.08 ]
Subtotal (95% CI) 17297 2263 14.2 % 0.98 [ 0.89, 1.07 ]
Total events: 7997 (Treatment), 984 (Control)
Heterogeneity: Tau2 = 0.0; Chi2 = 0.80, df = 2 (P = 0.67); I2 =0.0%
Test for overall effect: Z = 0.47 (P = 0.64)
Total (95% CI) 33123 18463 100.0 % 0.87 [ 0.75, 1.00 ]
Total events: 12808 (Treatment), 6865 (Control)
Heterogeneity: Tau2 = 0.07; Chi2 = 140.75, df = 19 (P<0.00001); I2 =87%
Test for overall effect: Z = 2.00 (P = 0.046)
0.1 0.2 0.5 1 2 5 10
Favours treatment Favours control
Analysis 1.30. Comparison 1 Multiple risk factor intervention versus control, Outcome 30 Smoking
prevalence (by allocation concealment).
Review: Multiple risk factor interventions for primary prevention of coronary heart disease
Comparison: 1 Multiple risk factor intervention versus control
Outcome: 30 Smoking prevalence (by allocation concealment)
Study or subgroup Treatment Control Odds Ratio Weight Odds Ratio
n/N n/N M-H,Fixed,95% CI M-H,Fixed,95% CI
1 Adequate allocation concealment
Brekke 2005a 10/25 6/19 0.1 % 1.44 [ 0.41, 5.07 ]
Cakir 2006 8/30 6/30 0.1 % 1.45 [ 0.44, 4.86 ]
Mattila 2003 52/331 57/309 1.0 % 0.82 [ 0.55, 1.24 ]
MRFIT Study 1982 1847/5754 2554/5638 36.3 % 0.57 [ 0.53, 0.62 ]
Subtotal (95% CI) 6140 5996 37.5 % 0.58 [ 0.54, 0.63 ]
Total events: 1917 (Treatment), 2623 (Control)
Heterogeneity: Chi2 = 7.20, df = 3 (P = 0.07); I2 =58%
Test for overall effect: Z = 14.22 (P < 0.00001)
2 Inadequate allocation concealment
0.1 0.2 0.5 1 2 5 10
Favours treatment Favours control
(Continued . . . )
104Multiple risk factor interventions for primary prevention of coronary heart disease (Review)
Copyright © 2011 The Cochrane Collaboration. Published by John Wiley & Sons, Ltd.
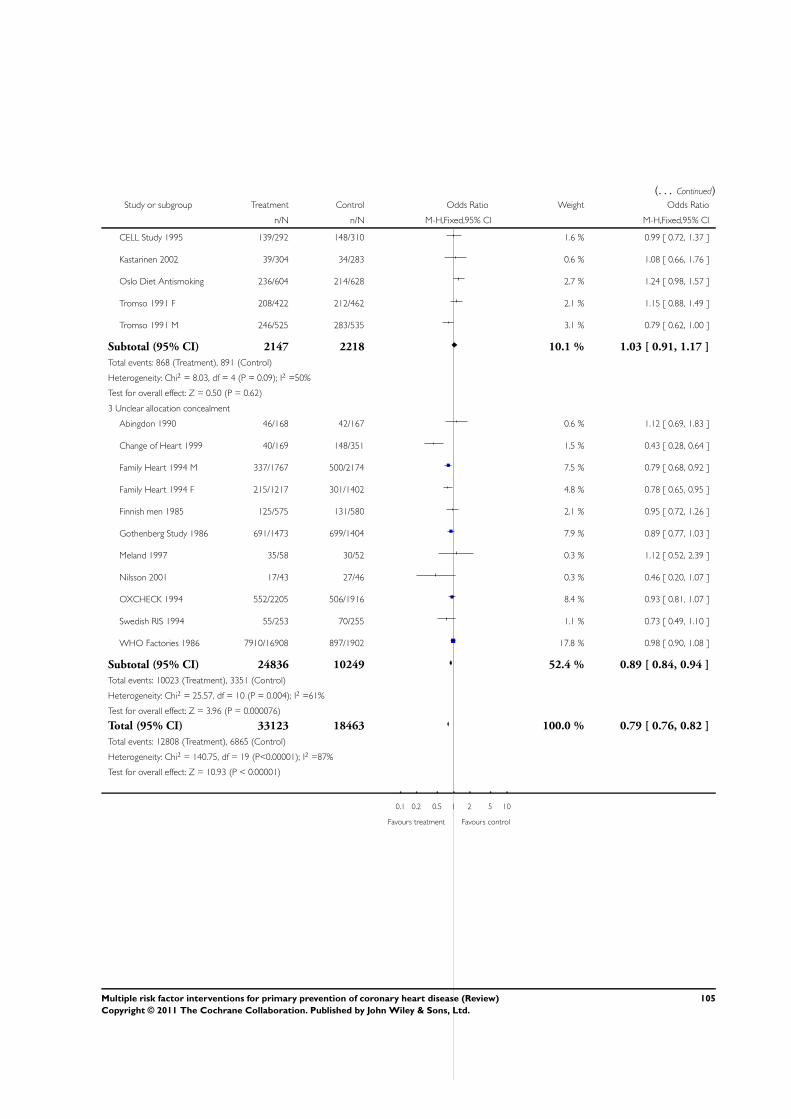
(. . . Continued)Study or subgroup Treatment Control Odds Ratio Weight Odds Ratio
n/N n/N M-H,Fixed,95% CI M-H,Fixed,95% CI
CELL Study 1995 139/292 148/310 1.6 % 0.99 [ 0.72, 1.37 ]
Kastarinen 2002 39/304 34/283 0.6 % 1.08 [ 0.66, 1.76 ]
Oslo Diet Antismoking 236/604 214/628 2.7 % 1.24 [ 0.98, 1.57 ]
Tromso 1991 F 208/422 212/462 2.1 % 1.15 [ 0.88, 1.49 ]
Tromso 1991 M 246/525 283/535 3.1 % 0.79 [ 0.62, 1.00 ]
Subtotal (95% CI) 2147 2218 10.1 % 1.03 [ 0.91, 1.17 ]
Total events: 868 (Treatment), 891 (Control)
Heterogeneity: Chi2 = 8.03, df = 4 (P = 0.09); I2 =50%
Test for overall effect: Z = 0.50 (P = 0.62)
3 Unclear allocation concealment
Abingdon 1990 46/168 42/167 0.6 % 1.12 [ 0.69, 1.83 ]
Change of Heart 1999 40/169 148/351 1.5 % 0.43 [ 0.28, 0.64 ]
Family Heart 1994 M 337/1767 500/2174 7.5 % 0.79 [ 0.68, 0.92 ]
Family Heart 1994 F 215/1217 301/1402 4.8 % 0.78 [ 0.65, 0.95 ]
Finnish men 1985 125/575 131/580 2.1 % 0.95 [ 0.72, 1.26 ]
Gothenberg Study 1986 691/1473 699/1404 7.9 % 0.89 [ 0.77, 1.03 ]
Meland 1997 35/58 30/52 0.3 % 1.12 [ 0.52, 2.39 ]
Nilsson 2001 17/43 27/46 0.3 % 0.46 [ 0.20, 1.07 ]
OXCHECK 1994 552/2205 506/1916 8.4 % 0.93 [ 0.81, 1.07 ]
Swedish RIS 1994 55/253 70/255 1.1 % 0.73 [ 0.49, 1.10 ]
WHO Factories 1986 7910/16908 897/1902 17.8 % 0.98 [ 0.90, 1.08 ]
Subtotal (95% CI) 24836 10249 52.4 % 0.89 [ 0.84, 0.94 ]
Total events: 10023 (Treatment), 3351 (Control)
Heterogeneity: Chi2 = 25.57, df = 10 (P = 0.004); I2 =61%
Test for overall effect: Z = 3.96 (P = 0.000076)
Total (95% CI) 33123 18463 100.0 % 0.79 [ 0.76, 0.82 ]
Total events: 12808 (Treatment), 6865 (Control)
Heterogeneity: Chi2 = 140.75, df = 19 (P<0.00001); I2 =87%
Test for overall effect: Z = 10.93 (P < 0.00001)
0.1 0.2 0.5 1 2 5 10
Favours treatment Favours control
105Multiple risk factor interventions for primary prevention of coronary heart disease (Review)
Copyright © 2011 The Cochrane Collaboration. Published by John Wiley & Sons, Ltd.
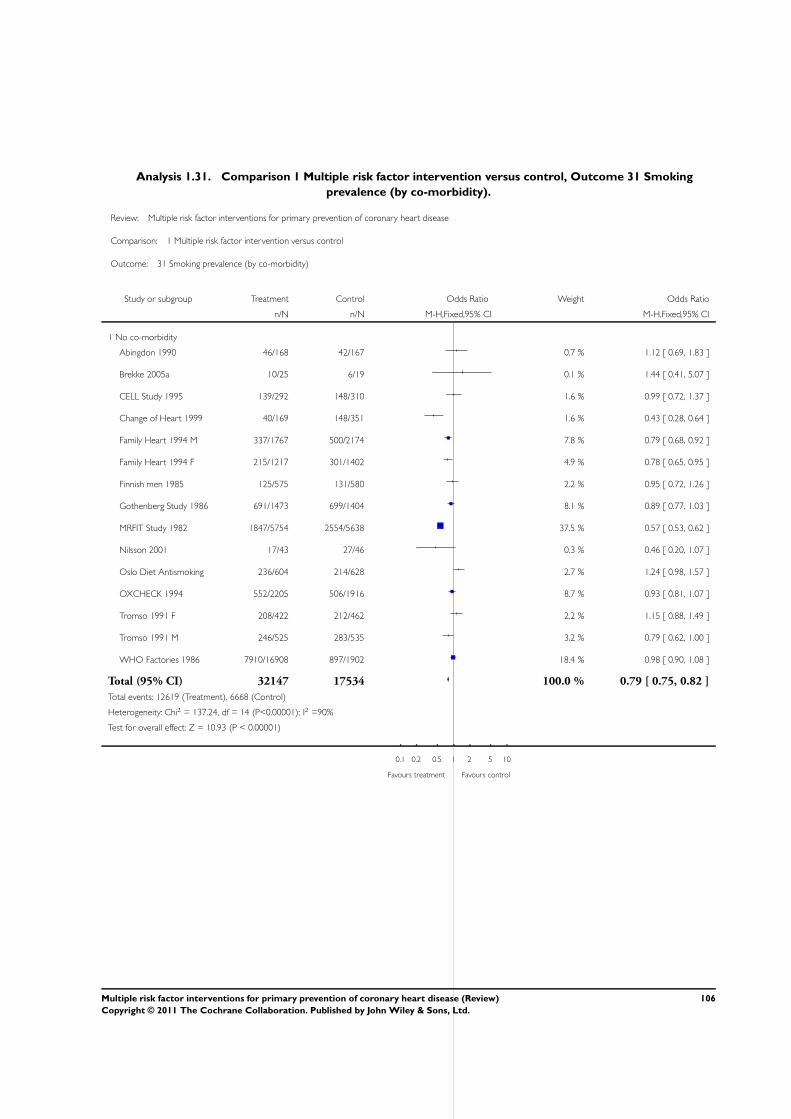
Analysis 1.31. Comparison 1 Multiple risk factor intervention versus control, Outcome 31 Smoking
prevalence (by co-morbidity).
Review: Multiple risk factor interventions for primary prevention of coronary heart disease
Comparison: 1 Multiple risk factor intervention versus control
Outcome: 31 Smoking prevalence (by co-morbidity)
Study or subgroup Treatment Control Odds Ratio Weight Odds Ratio
n/N n/N M-H,Fixed,95% CI M-H,Fixed,95% CI
1 No co-morbidity
Abingdon 1990 46/168 42/167 0.7 % 1.12 [ 0.69, 1.83 ]
Brekke 2005a 10/25 6/19 0.1 % 1.44 [ 0.41, 5.07 ]
CELL Study 1995 139/292 148/310 1.6 % 0.99 [ 0.72, 1.37 ]
Change of Heart 1999 40/169 148/351 1.6 % 0.43 [ 0.28, 0.64 ]
Family Heart 1994 M 337/1767 500/2174 7.8 % 0.79 [ 0.68, 0.92 ]
Family Heart 1994 F 215/1217 301/1402 4.9 % 0.78 [ 0.65, 0.95 ]
Finnish men 1985 125/575 131/580 2.2 % 0.95 [ 0.72, 1.26 ]
Gothenberg Study 1986 691/1473 699/1404 8.1 % 0.89 [ 0.77, 1.03 ]
MRFIT Study 1982 1847/5754 2554/5638 37.5 % 0.57 [ 0.53, 0.62 ]
Nilsson 2001 17/43 27/46 0.3 % 0.46 [ 0.20, 1.07 ]
Oslo Diet Antismoking 236/604 214/628 2.7 % 1.24 [ 0.98, 1.57 ]
OXCHECK 1994 552/2205 506/1916 8.7 % 0.93 [ 0.81, 1.07 ]
Tromso 1991 F 208/422 212/462 2.2 % 1.15 [ 0.88, 1.49 ]
Tromso 1991 M 246/525 283/535 3.2 % 0.79 [ 0.62, 1.00 ]
WHO Factories 1986 7910/16908 897/1902 18.4 % 0.98 [ 0.90, 1.08 ]
Total (95% CI) 32147 17534 100.0 % 0.79 [ 0.75, 0.82 ]
Total events: 12619 (Treatment), 6668 (Control)
Heterogeneity: Chi2 = 137.24, df = 14 (P<0.00001); I2 =90%
Test for overall effect: Z = 10.93 (P < 0.00001)
0.1 0.2 0.5 1 2 5 10
Favours treatment Favours control
106Multiple risk factor interventions for primary prevention of coronary heart disease (Review)
Copyright © 2011 The Cochrane Collaboration. Published by John Wiley & Sons, Ltd.
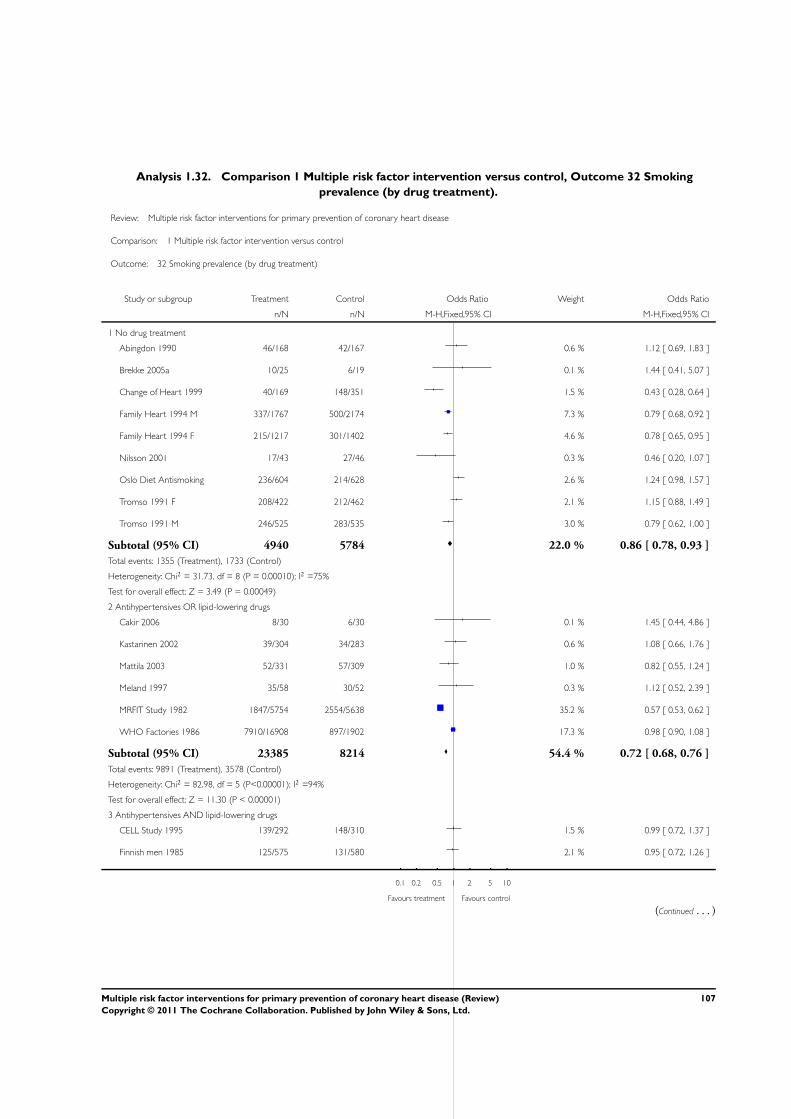
Analysis 1.32. Comparison 1 Multiple risk factor intervention versus control, Outcome 32 Smoking
prevalence (by drug treatment).
Review: Multiple risk factor interventions for primary prevention of coronary heart disease
Comparison: 1 Multiple risk factor intervention versus control
Outcome: 32 Smoking prevalence (by drug treatment)
Study or subgroup Treatment Control Odds Ratio Weight Odds Ratio
n/N n/N M-H,Fixed,95% CI M-H,Fixed,95% CI
1 No drug treatment
Abingdon 1990 46/168 42/167 0.6 % 1.12 [ 0.69, 1.83 ]
Brekke 2005a 10/25 6/19 0.1 % 1.44 [ 0.41, 5.07 ]
Change of Heart 1999 40/169 148/351 1.5 % 0.43 [ 0.28, 0.64 ]
Family Heart 1994 M 337/1767 500/2174 7.3 % 0.79 [ 0.68, 0.92 ]
Family Heart 1994 F 215/1217 301/1402 4.6 % 0.78 [ 0.65, 0.95 ]
Nilsson 2001 17/43 27/46 0.3 % 0.46 [ 0.20, 1.07 ]
Oslo Diet Antismoking 236/604 214/628 2.6 % 1.24 [ 0.98, 1.57 ]
Tromso 1991 F 208/422 212/462 2.1 % 1.15 [ 0.88, 1.49 ]
Tromso 1991 M 246/525 283/535 3.0 % 0.79 [ 0.62, 1.00 ]
Subtotal (95% CI) 4940 5784 22.0 % 0.86 [ 0.78, 0.93 ]
Total events: 1355 (Treatment), 1733 (Control)
Heterogeneity: Chi2 = 31.73, df = 8 (P = 0.00010); I2 =75%
Test for overall effect: Z = 3.49 (P = 0.00049)
2 Antihypertensives OR lipid-lowering drugs
Cakir 2006 8/30 6/30 0.1 % 1.45 [ 0.44, 4.86 ]
Kastarinen 2002 39/304 34/283 0.6 % 1.08 [ 0.66, 1.76 ]
Mattila 2003 52/331 57/309 1.0 % 0.82 [ 0.55, 1.24 ]
Meland 1997 35/58 30/52 0.3 % 1.12 [ 0.52, 2.39 ]
MRFIT Study 1982 1847/5754 2554/5638 35.2 % 0.57 [ 0.53, 0.62 ]
WHO Factories 1986 7910/16908 897/1902 17.3 % 0.98 [ 0.90, 1.08 ]
Subtotal (95% CI) 23385 8214 54.4 % 0.72 [ 0.68, 0.76 ]
Total events: 9891 (Treatment), 3578 (Control)
Heterogeneity: Chi2 = 82.98, df = 5 (P<0.00001); I2 =94%
Test for overall effect: Z = 11.30 (P < 0.00001)
3 Antihypertensives AND lipid-lowering drugs
CELL Study 1995 139/292 148/310 1.5 % 0.99 [ 0.72, 1.37 ]
Finnish men 1985 125/575 131/580 2.1 % 0.95 [ 0.72, 1.26 ]
0.1 0.2 0.5 1 2 5 10
Favours treatment Favours control
(Continued . . . )
107Multiple risk factor interventions for primary prevention of coronary heart disease (Review)
Copyright © 2011 The Cochrane Collaboration. Published by John Wiley & Sons, Ltd.
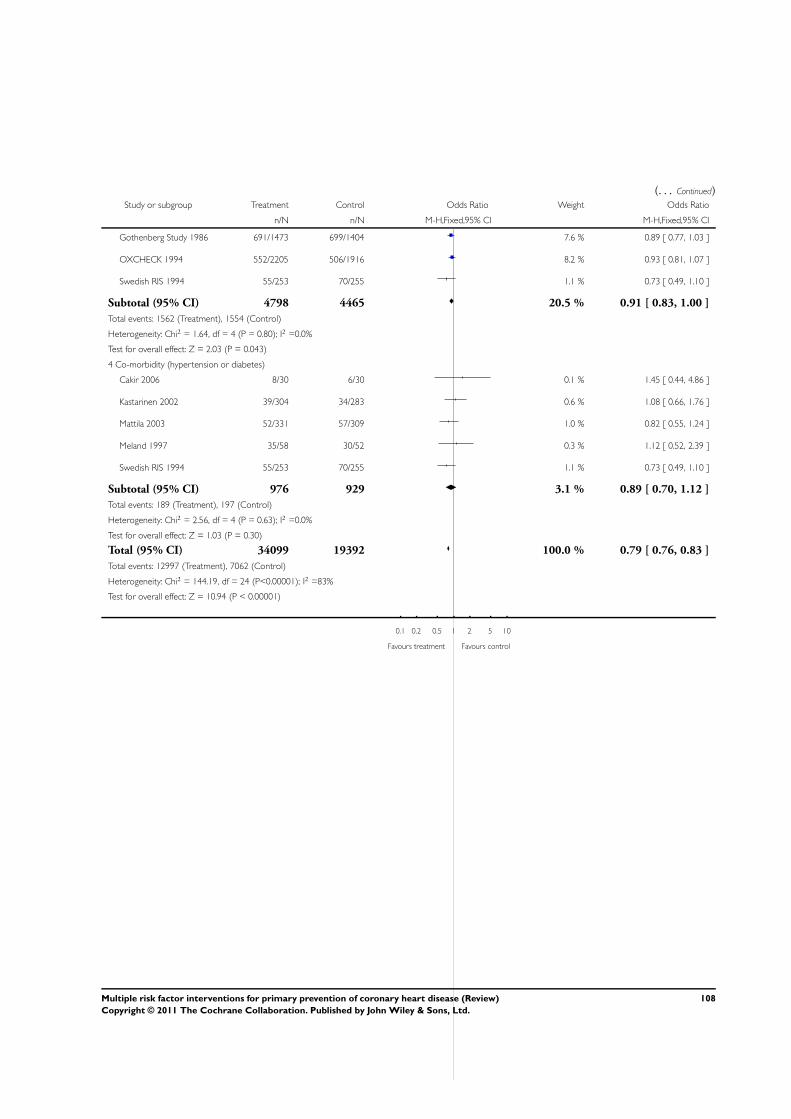
(. . . Continued)Study or subgroup Treatment Control Odds Ratio Weight Odds Ratio
n/N n/N M-H,Fixed,95% CI M-H,Fixed,95% CI
Gothenberg Study 1986 691/1473 699/1404 7.6 % 0.89 [ 0.77, 1.03 ]
OXCHECK 1994 552/2205 506/1916 8.2 % 0.93 [ 0.81, 1.07 ]
Swedish RIS 1994 55/253 70/255 1.1 % 0.73 [ 0.49, 1.10 ]
Subtotal (95% CI) 4798 4465 20.5 % 0.91 [ 0.83, 1.00 ]
Total events: 1562 (Treatment), 1554 (Control)
Heterogeneity: Chi2 = 1.64, df = 4 (P = 0.80); I2 =0.0%
Test for overall effect: Z = 2.03 (P = 0.043)
4 Co-morbidity (hypertension or diabetes)
Cakir 2006 8/30 6/30 0.1 % 1.45 [ 0.44, 4.86 ]
Kastarinen 2002 39/304 34/283 0.6 % 1.08 [ 0.66, 1.76 ]
Mattila 2003 52/331 57/309 1.0 % 0.82 [ 0.55, 1.24 ]
Meland 1997 35/58 30/52 0.3 % 1.12 [ 0.52, 2.39 ]
Swedish RIS 1994 55/253 70/255 1.1 % 0.73 [ 0.49, 1.10 ]
Subtotal (95% CI) 976 929 3.1 % 0.89 [ 0.70, 1.12 ]
Total events: 189 (Treatment), 197 (Control)
Heterogeneity: Chi2 = 2.56, df = 4 (P = 0.63); I2 =0.0%
Test for overall effect: Z = 1.03 (P = 0.30)
Total (95% CI) 34099 19392 100.0 % 0.79 [ 0.76, 0.83 ]
Total events: 12997 (Treatment), 7062 (Control)
Heterogeneity: Chi2 = 144.19, df = 24 (P<0.00001); I2 =83%
Test for overall effect: Z = 10.94 (P < 0.00001)
0.1 0.2 0.5 1 2 5 10
Favours treatment Favours control
108Multiple risk factor interventions for primary prevention of coronary heart disease (Review)
Copyright © 2011 The Cochrane Collaboration. Published by John Wiley & Sons, Ltd.
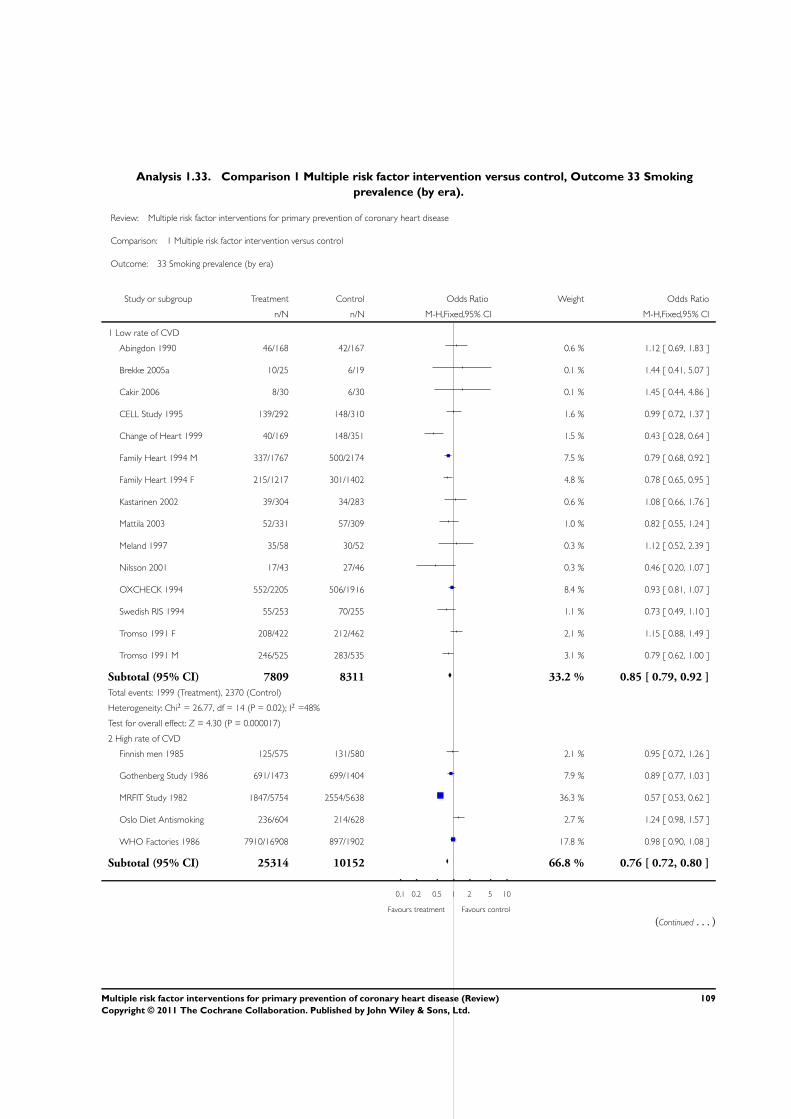
Analysis 1.33. Comparison 1 Multiple risk factor intervention versus control, Outcome 33 Smoking
prevalence (by era).
Review: Multiple risk factor interventions for primary prevention of coronary heart disease
Comparison: 1 Multiple risk factor intervention versus control
Outcome: 33 Smoking prevalence (by era)
Study or subgroup Treatment Control Odds Ratio Weight Odds Ratio
n/N n/N M-H,Fixed,95% CI M-H,Fixed,95% CI
1 Low rate of CVD
Abingdon 1990 46/168 42/167 0.6 % 1.12 [ 0.69, 1.83 ]
Brekke 2005a 10/25 6/19 0.1 % 1.44 [ 0.41, 5.07 ]
Cakir 2006 8/30 6/30 0.1 % 1.45 [ 0.44, 4.86 ]
CELL Study 1995 139/292 148/310 1.6 % 0.99 [ 0.72, 1.37 ]
Change of Heart 1999 40/169 148/351 1.5 % 0.43 [ 0.28, 0.64 ]
Family Heart 1994 M 337/1767 500/2174 7.5 % 0.79 [ 0.68, 0.92 ]
Family Heart 1994 F 215/1217 301/1402 4.8 % 0.78 [ 0.65, 0.95 ]
Kastarinen 2002 39/304 34/283 0.6 % 1.08 [ 0.66, 1.76 ]
Mattila 2003 52/331 57/309 1.0 % 0.82 [ 0.55, 1.24 ]
Meland 1997 35/58 30/52 0.3 % 1.12 [ 0.52, 2.39 ]
Nilsson 2001 17/43 27/46 0.3 % 0.46 [ 0.20, 1.07 ]
OXCHECK 1994 552/2205 506/1916 8.4 % 0.93 [ 0.81, 1.07 ]
Swedish RIS 1994 55/253 70/255 1.1 % 0.73 [ 0.49, 1.10 ]
Tromso 1991 F 208/422 212/462 2.1 % 1.15 [ 0.88, 1.49 ]
Tromso 1991 M 246/525 283/535 3.1 % 0.79 [ 0.62, 1.00 ]
Subtotal (95% CI) 7809 8311 33.2 % 0.85 [ 0.79, 0.92 ]
Total events: 1999 (Treatment), 2370 (Control)
Heterogeneity: Chi2 = 26.77, df = 14 (P = 0.02); I2 =48%
Test for overall effect: Z = 4.30 (P = 0.000017)
2 High rate of CVD
Finnish men 1985 125/575 131/580 2.1 % 0.95 [ 0.72, 1.26 ]
Gothenberg Study 1986 691/1473 699/1404 7.9 % 0.89 [ 0.77, 1.03 ]
MRFIT Study 1982 1847/5754 2554/5638 36.3 % 0.57 [ 0.53, 0.62 ]
Oslo Diet Antismoking 236/604 214/628 2.7 % 1.24 [ 0.98, 1.57 ]
WHO Factories 1986 7910/16908 897/1902 17.8 % 0.98 [ 0.90, 1.08 ]
Subtotal (95% CI) 25314 10152 66.8 % 0.76 [ 0.72, 0.80 ]
0.1 0.2 0.5 1 2 5 10
Favours treatment Favours control
(Continued . . . )
109Multiple risk factor interventions for primary prevention of coronary heart disease (Review)
Copyright © 2011 The Cochrane Collaboration. Published by John Wiley & Sons, Ltd.
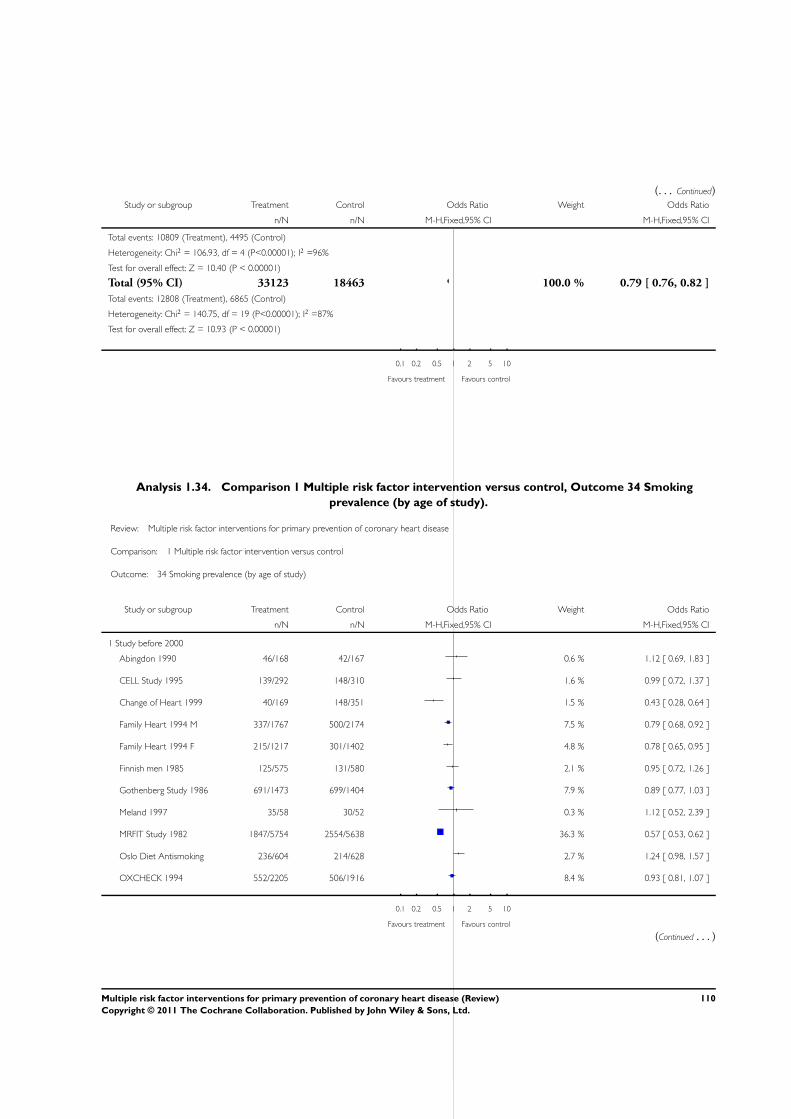
(. . . Continued)Study or subgroup Treatment Control Odds Ratio Weight Odds Ratio
n/N n/N M-H,Fixed,95% CI M-H,Fixed,95% CI
Total events: 10809 (Treatment), 4495 (Control)
Heterogeneity: Chi2 = 106.93, df = 4 (P<0.00001); I2 =96%
Test for overall effect: Z = 10.40 (P < 0.00001)
Total (95% CI) 33123 18463 100.0 % 0.79 [ 0.76, 0.82 ]
Total events: 12808 (Treatment), 6865 (Control)
Heterogeneity: Chi2 = 140.75, df = 19 (P<0.00001); I2 =87%
Test for overall effect: Z = 10.93 (P < 0.00001)
0.1 0.2 0.5 1 2 5 10
Favours treatment Favours control
Analysis 1.34. Comparison 1 Multiple risk factor intervention versus control, Outcome 34 Smoking
prevalence (by age of study).
Review: Multiple risk factor interventions for primary prevention of coronary heart disease
Comparison: 1 Multiple risk factor intervention versus control
Outcome: 34 Smoking prevalence (by age of study)
Study or subgroup Treatment Control Odds Ratio Weight Odds Ratio
n/N n/N M-H,Fixed,95% CI M-H,Fixed,95% CI
1 Study before 2000
Abingdon 1990 46/168 42/167 0.6 % 1.12 [ 0.69, 1.83 ]
CELL Study 1995 139/292 148/310 1.6 % 0.99 [ 0.72, 1.37 ]
Change of Heart 1999 40/169 148/351 1.5 % 0.43 [ 0.28, 0.64 ]
Family Heart 1994 M 337/1767 500/2174 7.5 % 0.79 [ 0.68, 0.92 ]
Family Heart 1994 F 215/1217 301/1402 4.8 % 0.78 [ 0.65, 0.95 ]
Finnish men 1985 125/575 131/580 2.1 % 0.95 [ 0.72, 1.26 ]
Gothenberg Study 1986 691/1473 699/1404 7.9 % 0.89 [ 0.77, 1.03 ]
Meland 1997 35/58 30/52 0.3 % 1.12 [ 0.52, 2.39 ]
MRFIT Study 1982 1847/5754 2554/5638 36.3 % 0.57 [ 0.53, 0.62 ]
Oslo Diet Antismoking 236/604 214/628 2.7 % 1.24 [ 0.98, 1.57 ]
OXCHECK 1994 552/2205 506/1916 8.4 % 0.93 [ 0.81, 1.07 ]
0.1 0.2 0.5 1 2 5 10
Favours treatment Favours control
(Continued . . . )
110Multiple risk factor interventions for primary prevention of coronary heart disease (Review)
Copyright © 2011 The Cochrane Collaboration. Published by John Wiley & Sons, Ltd.
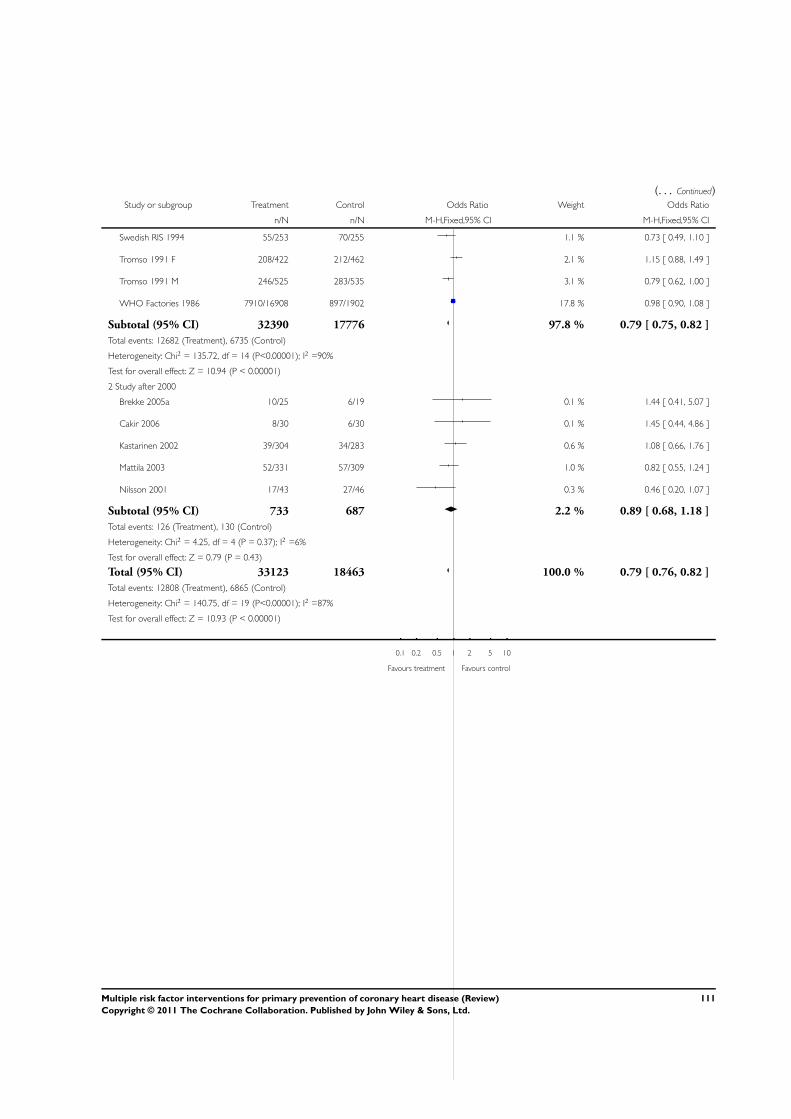
(. . . Continued)Study or subgroup Treatment Control Odds Ratio Weight Odds Ratio
n/N n/N M-H,Fixed,95% CI M-H,Fixed,95% CI
Swedish RIS 1994 55/253 70/255 1.1 % 0.73 [ 0.49, 1.10 ]
Tromso 1991 F 208/422 212/462 2.1 % 1.15 [ 0.88, 1.49 ]
Tromso 1991 M 246/525 283/535 3.1 % 0.79 [ 0.62, 1.00 ]
WHO Factories 1986 7910/16908 897/1902 17.8 % 0.98 [ 0.90, 1.08 ]
Subtotal (95% CI) 32390 17776 97.8 % 0.79 [ 0.75, 0.82 ]
Total events: 12682 (Treatment), 6735 (Control)
Heterogeneity: Chi2 = 135.72, df = 14 (P<0.00001); I2 =90%
Test for overall effect: Z = 10.94 (P < 0.00001)
2 Study after 2000
Brekke 2005a 10/25 6/19 0.1 % 1.44 [ 0.41, 5.07 ]
Cakir 2006 8/30 6/30 0.1 % 1.45 [ 0.44, 4.86 ]
Kastarinen 2002 39/304 34/283 0.6 % 1.08 [ 0.66, 1.76 ]
Mattila 2003 52/331 57/309 1.0 % 0.82 [ 0.55, 1.24 ]
Nilsson 2001 17/43 27/46 0.3 % 0.46 [ 0.20, 1.07 ]
Subtotal (95% CI) 733 687 2.2 % 0.89 [ 0.68, 1.18 ]
Total events: 126 (Treatment), 130 (Control)
Heterogeneity: Chi2 = 4.25, df = 4 (P = 0.37); I2 =6%
Test for overall effect: Z = 0.79 (P = 0.43)
Total (95% CI) 33123 18463 100.0 % 0.79 [ 0.76, 0.82 ]
Total events: 12808 (Treatment), 6865 (Control)
Heterogeneity: Chi2 = 140.75, df = 19 (P<0.00001); I2 =87%
Test for overall effect: Z = 10.93 (P < 0.00001)
0.1 0.2 0.5 1 2 5 10
Favours treatment Favours control
111Multiple risk factor interventions for primary prevention of coronary heart disease (Review)
Copyright © 2011 The Cochrane Collaboration. Published by John Wiley & Sons, Ltd.
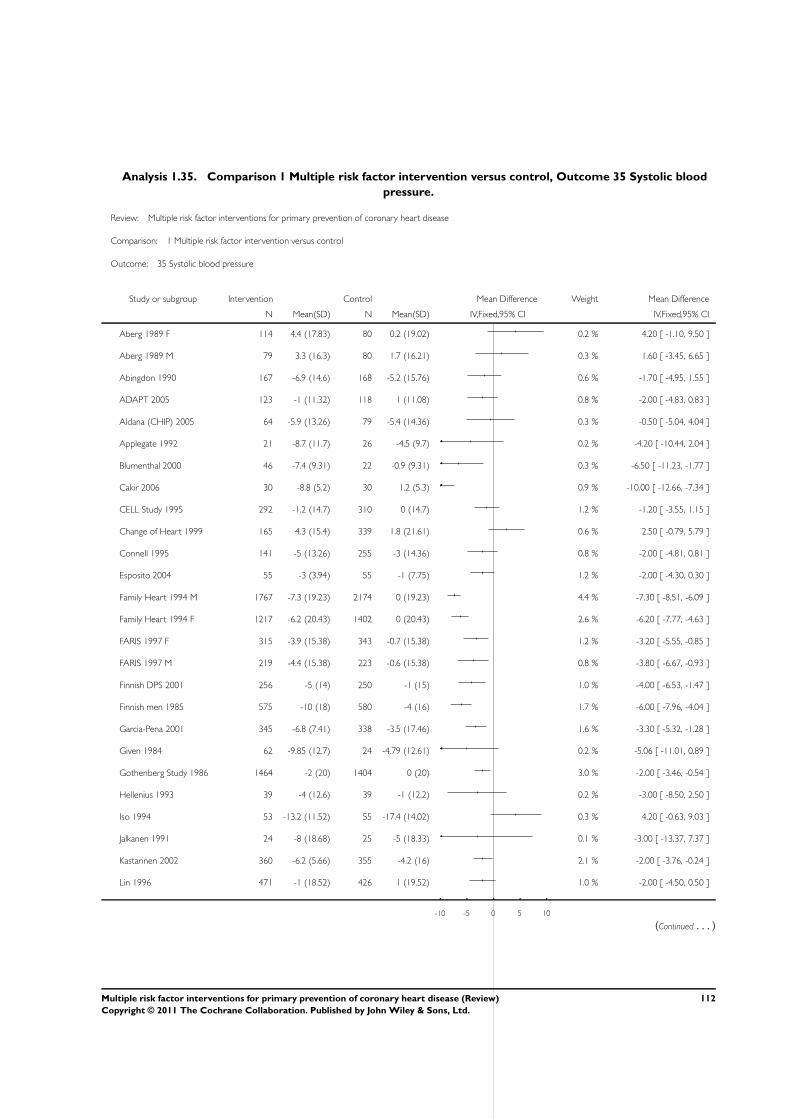
Analysis 1.35. Comparison 1 Multiple risk factor intervention versus control, Outcome 35 Systolic blood
pressure.
Review: Multiple risk factor interventions for primary prevention of coronary heart disease
Comparison: 1 Multiple risk factor intervention versus control
Outcome: 35 Systolic blood pressure
Study or subgroup Intervention Control Mean Difference Weight Mean Difference
N Mean(SD) N Mean(SD) IV,Fixed,95% CI IV,Fixed,95% CI
Aberg 1989 F 114 4.4 (17.83) 80 0.2 (19.02) 0.2 % 4.20 [ -1.10, 9.50 ]
Aberg 1989 M 79 3.3 (16.3) 80 1.7 (16.21) 0.3 % 1.60 [ -3.45, 6.65 ]
Abingdon 1990 167 -6.9 (14.6) 168 -5.2 (15.76) 0.6 % -1.70 [ -4.95, 1.55 ]
ADAPT 2005 123 -1 (11.32) 118 1 (11.08) 0.8 % -2.00 [ -4.83, 0.83 ]
Aldana (CHIP) 2005 64 -5.9 (13.26) 79 -5.4 (14.36) 0.3 % -0.50 [ -5.04, 4.04 ]
Applegate 1992 21 -8.7 (11.7) 26 -4.5 (9.7) 0.2 % -4.20 [ -10.44, 2.04 ]
Blumenthal 2000 46 -7.4 (9.31) 22 -0.9 (9.31) 0.3 % -6.50 [ -11.23, -1.77 ]
Cakir 2006 30 -8.8 (5.2) 30 1.2 (5.3) 0.9 % -10.00 [ -12.66, -7.34 ]
CELL Study 1995 292 -1.2 (14.7) 310 0 (14.7) 1.2 % -1.20 [ -3.55, 1.15 ]
Change of Heart 1999 165 4.3 (15.4) 339 1.8 (21.61) 0.6 % 2.50 [ -0.79, 5.79 ]
Connell 1995 141 -5 (13.26) 255 -3 (14.36) 0.8 % -2.00 [ -4.81, 0.81 ]
Esposito 2004 55 -3 (3.94) 55 -1 (7.75) 1.2 % -2.00 [ -4.30, 0.30 ]
Family Heart 1994 M 1767 -7.3 (19.23) 2174 0 (19.23) 4.4 % -7.30 [ -8.51, -6.09 ]
Family Heart 1994 F 1217 -6.2 (20.43) 1402 0 (20.43) 2.6 % -6.20 [ -7.77, -4.63 ]
FARIS 1997 F 315 -3.9 (15.38) 343 -0.7 (15.38) 1.2 % -3.20 [ -5.55, -0.85 ]
FARIS 1997 M 219 -4.4 (15.38) 223 -0.6 (15.38) 0.8 % -3.80 [ -6.67, -0.93 ]
Finnish DPS 2001 256 -5 (14) 250 -1 (15) 1.0 % -4.00 [ -6.53, -1.47 ]
Finnish men 1985 575 -10 (18) 580 -4 (16) 1.7 % -6.00 [ -7.96, -4.04 ]
Garcia-Pena 2001 345 -6.8 (7.41) 338 -3.5 (17.46) 1.6 % -3.30 [ -5.32, -1.28 ]
Given 1984 62 -9.85 (12.7) 24 -4.79 (12.61) 0.2 % -5.06 [ -11.01, 0.89 ]
Gothenberg Study 1986 1464 -2 (20) 1404 0 (20) 3.0 % -2.00 [ -3.46, -0.54 ]
Hellenius 1993 39 -4 (12.6) 39 -1 (12.2) 0.2 % -3.00 [ -8.50, 2.50 ]
Iso 1994 53 -13.2 (11.52) 55 -17.4 (14.02) 0.3 % 4.20 [ -0.63, 9.03 ]
Jalkanen 1991 24 -8 (18.68) 25 -5 (18.33) 0.1 % -3.00 [ -13.37, 7.37 ]
Kastarinen 2002 360 -6.2 (5.66) 355 -4.2 (16) 2.1 % -2.00 [ -3.76, -0.24 ]
Lin 1996 471 -1 (18.52) 426 1 (19.52) 1.0 % -2.00 [ -4.50, 0.50 ]
-10 -5 0 5 10
(Continued . . . )
112Multiple risk factor interventions for primary prevention of coronary heart disease (Review)
Copyright © 2011 The Cochrane Collaboration. Published by John Wiley & Sons, Ltd.
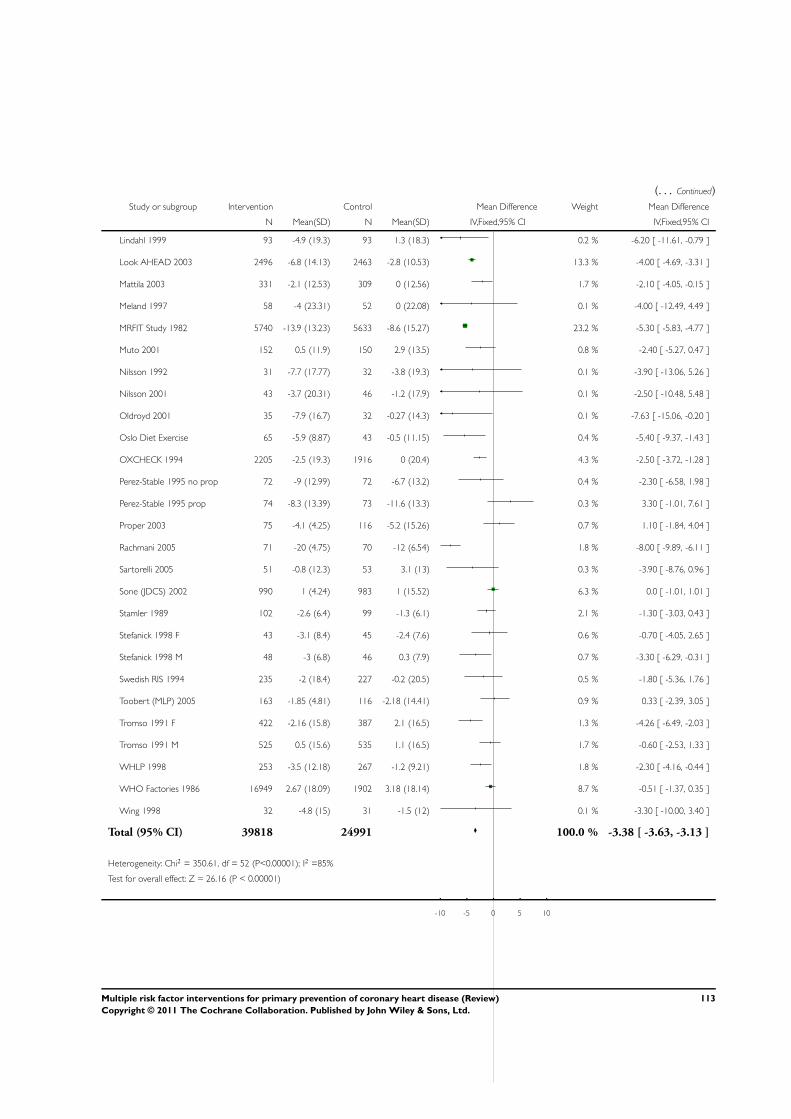
(. . . Continued)
Study or subgroup Intervention Control Mean Difference Weight Mean Difference
N Mean(SD) N Mean(SD) IV,Fixed,95% CI IV,Fixed,95% CI
Lindahl 1999 93 -4.9 (19.3) 93 1.3 (18.3) 0.2 % -6.20 [ -11.61, -0.79 ]
Look AHEAD 2003 2496 -6.8 (14.13) 2463 -2.8 (10.53) 13.3 % -4.00 [ -4.69, -3.31 ]
Mattila 2003 331 -2.1 (12.53) 309 0 (12.56) 1.7 % -2.10 [ -4.05, -0.15 ]
Meland 1997 58 -4 (23.31) 52 0 (22.08) 0.1 % -4.00 [ -12.49, 4.49 ]
MRFIT Study 1982 5740 -13.9 (13.23) 5633 -8.6 (15.27) 23.2 % -5.30 [ -5.83, -4.77 ]
Muto 2001 152 0.5 (11.9) 150 2.9 (13.5) 0.8 % -2.40 [ -5.27, 0.47 ]
Nilsson 1992 31 -7.7 (17.77) 32 -3.8 (19.3) 0.1 % -3.90 [ -13.06, 5.26 ]
Nilsson 2001 43 -3.7 (20.31) 46 -1.2 (17.9) 0.1 % -2.50 [ -10.48, 5.48 ]
Oldroyd 2001 35 -7.9 (16.7) 32 -0.27 (14.3) 0.1 % -7.63 [ -15.06, -0.20 ]
Oslo Diet Exercise 65 -5.9 (8.87) 43 -0.5 (11.15) 0.4 % -5.40 [ -9.37, -1.43 ]
OXCHECK 1994 2205 -2.5 (19.3) 1916 0 (20.4) 4.3 % -2.50 [ -3.72, -1.28 ]
Perez-Stable 1995 no prop 72 -9 (12.99) 72 -6.7 (13.2) 0.4 % -2.30 [ -6.58, 1.98 ]
Perez-Stable 1995 prop 74 -8.3 (13.39) 73 -11.6 (13.3) 0.3 % 3.30 [ -1.01, 7.61 ]
Proper 2003 75 -4.1 (4.25) 116 -5.2 (15.26) 0.7 % 1.10 [ -1.84, 4.04 ]
Rachmani 2005 71 -20 (4.75) 70 -12 (6.54) 1.8 % -8.00 [ -9.89, -6.11 ]
Sartorelli 2005 51 -0.8 (12.3) 53 3.1 (13) 0.3 % -3.90 [ -8.76, 0.96 ]
Sone (JDCS) 2002 990 1 (4.24) 983 1 (15.52) 6.3 % 0.0 [ -1.01, 1.01 ]
Stamler 1989 102 -2.6 (6.4) 99 -1.3 (6.1) 2.1 % -1.30 [ -3.03, 0.43 ]
Stefanick 1998 F 43 -3.1 (8.4) 45 -2.4 (7.6) 0.6 % -0.70 [ -4.05, 2.65 ]
Stefanick 1998 M 48 -3 (6.8) 46 0.3 (7.9) 0.7 % -3.30 [ -6.29, -0.31 ]
Swedish RIS 1994 235 -2 (18.4) 227 -0.2 (20.5) 0.5 % -1.80 [ -5.36, 1.76 ]
Toobert (MLP) 2005 163 -1.85 (4.81) 116 -2.18 (14.41) 0.9 % 0.33 [ -2.39, 3.05 ]
Tromso 1991 F 422 -2.16 (15.8) 387 2.1 (16.5) 1.3 % -4.26 [ -6.49, -2.03 ]
Tromso 1991 M 525 0.5 (15.6) 535 1.1 (16.5) 1.7 % -0.60 [ -2.53, 1.33 ]
WHLP 1998 253 -3.5 (12.18) 267 -1.2 (9.21) 1.8 % -2.30 [ -4.16, -0.44 ]
WHO Factories 1986 16949 2.67 (18.09) 1902 3.18 (18.14) 8.7 % -0.51 [ -1.37, 0.35 ]
Wing 1998 32 -4.8 (15) 31 -1.5 (12) 0.1 % -3.30 [ -10.00, 3.40 ]
Total (95% CI) 39818 24991 100.0 % -3.38 [ -3.63, -3.13 ]
Heterogeneity: Chi2 = 350.61, df = 52 (P<0.00001); I2 =85%
Test for overall effect: Z = 26.16 (P < 0.00001)
-10 -5 0 5 10
113Multiple risk factor interventions for primary prevention of coronary heart disease (Review)
Copyright © 2011 The Cochrane Collaboration. Published by John Wiley & Sons, Ltd.
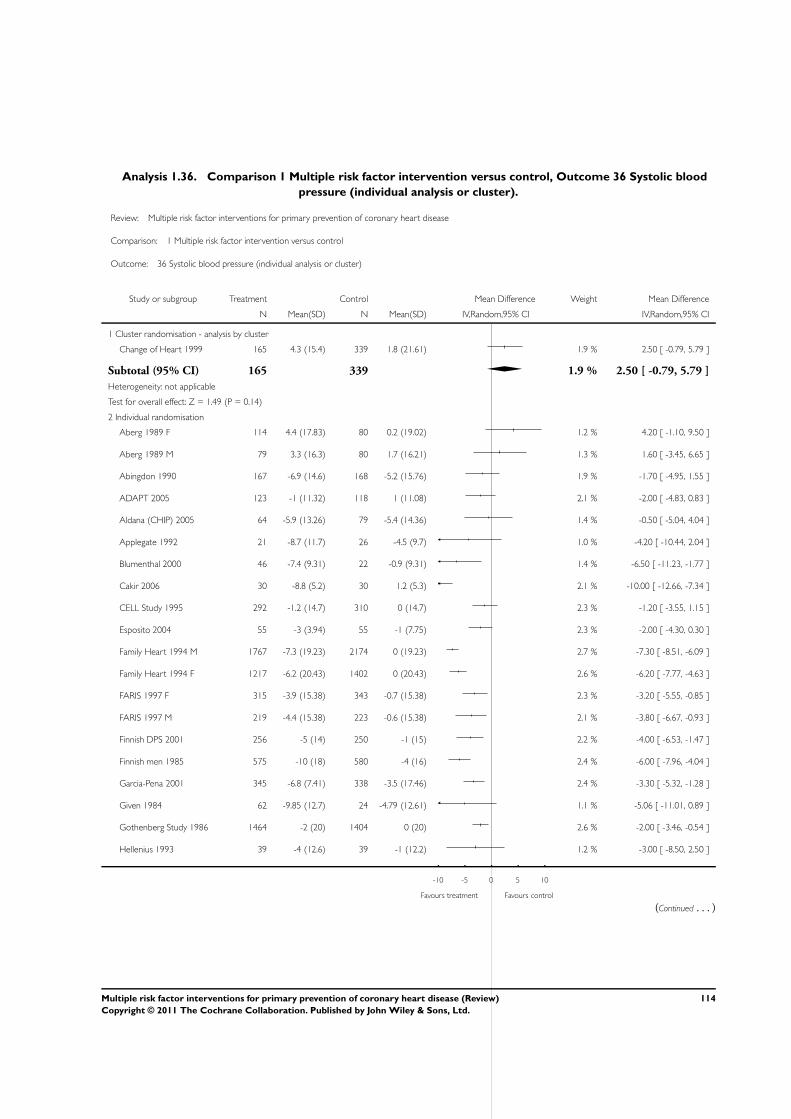
Analysis 1.36. Comparison 1 Multiple risk factor intervention versus control, Outcome 36 Systolic blood
pressure (individual analysis or cluster).
Review: Multiple risk factor interventions for primary prevention of coronary heart disease
Comparison: 1 Multiple risk factor intervention versus control
Outcome: 36 Systolic blood pressure (individual analysis or cluster)
Study or subgroup Treatment Control Mean Difference Weight Mean Difference
N Mean(SD) N Mean(SD) IV,Random,95% CI IV,Random,95% CI
1 Cluster randomisation - analysis by cluster
Change of Heart 1999 165 4.3 (15.4) 339 1.8 (21.61) 1.9 % 2.50 [ -0.79, 5.79 ]
Subtotal (95% CI) 165 339 1.9 % 2.50 [ -0.79, 5.79 ]
Heterogeneity: not applicable
Test for overall effect: Z = 1.49 (P = 0.14)
2 Individual randomisation
Aberg 1989 F 114 4.4 (17.83) 80 0.2 (19.02) 1.2 % 4.20 [ -1.10, 9.50 ]
Aberg 1989 M 79 3.3 (16.3) 80 1.7 (16.21) 1.3 % 1.60 [ -3.45, 6.65 ]
Abingdon 1990 167 -6.9 (14.6) 168 -5.2 (15.76) 1.9 % -1.70 [ -4.95, 1.55 ]
ADAPT 2005 123 -1 (11.32) 118 1 (11.08) 2.1 % -2.00 [ -4.83, 0.83 ]
Aldana (CHIP) 2005 64 -5.9 (13.26) 79 -5.4 (14.36) 1.4 % -0.50 [ -5.04, 4.04 ]
Applegate 1992 21 -8.7 (11.7) 26 -4.5 (9.7) 1.0 % -4.20 [ -10.44, 2.04 ]
Blumenthal 2000 46 -7.4 (9.31) 22 -0.9 (9.31) 1.4 % -6.50 [ -11.23, -1.77 ]
Cakir 2006 30 -8.8 (5.2) 30 1.2 (5.3) 2.1 % -10.00 [ -12.66, -7.34 ]
CELL Study 1995 292 -1.2 (14.7) 310 0 (14.7) 2.3 % -1.20 [ -3.55, 1.15 ]
Esposito 2004 55 -3 (3.94) 55 -1 (7.75) 2.3 % -2.00 [ -4.30, 0.30 ]
Family Heart 1994 M 1767 -7.3 (19.23) 2174 0 (19.23) 2.7 % -7.30 [ -8.51, -6.09 ]
Family Heart 1994 F 1217 -6.2 (20.43) 1402 0 (20.43) 2.6 % -6.20 [ -7.77, -4.63 ]
FARIS 1997 F 315 -3.9 (15.38) 343 -0.7 (15.38) 2.3 % -3.20 [ -5.55, -0.85 ]
FARIS 1997 M 219 -4.4 (15.38) 223 -0.6 (15.38) 2.1 % -3.80 [ -6.67, -0.93 ]
Finnish DPS 2001 256 -5 (14) 250 -1 (15) 2.2 % -4.00 [ -6.53, -1.47 ]
Finnish men 1985 575 -10 (18) 580 -4 (16) 2.4 % -6.00 [ -7.96, -4.04 ]
Garcia-Pena 2001 345 -6.8 (7.41) 338 -3.5 (17.46) 2.4 % -3.30 [ -5.32, -1.28 ]
Given 1984 62 -9.85 (12.7) 24 -4.79 (12.61) 1.1 % -5.06 [ -11.01, 0.89 ]
Gothenberg Study 1986 1464 -2 (20) 1404 0 (20) 2.6 % -2.00 [ -3.46, -0.54 ]
Hellenius 1993 39 -4 (12.6) 39 -1 (12.2) 1.2 % -3.00 [ -8.50, 2.50 ]
-10 -5 0 5 10
Favours treatment Favours control
(Continued . . . )
114Multiple risk factor interventions for primary prevention of coronary heart disease (Review)
Copyright © 2011 The Cochrane Collaboration. Published by John Wiley & Sons, Ltd.
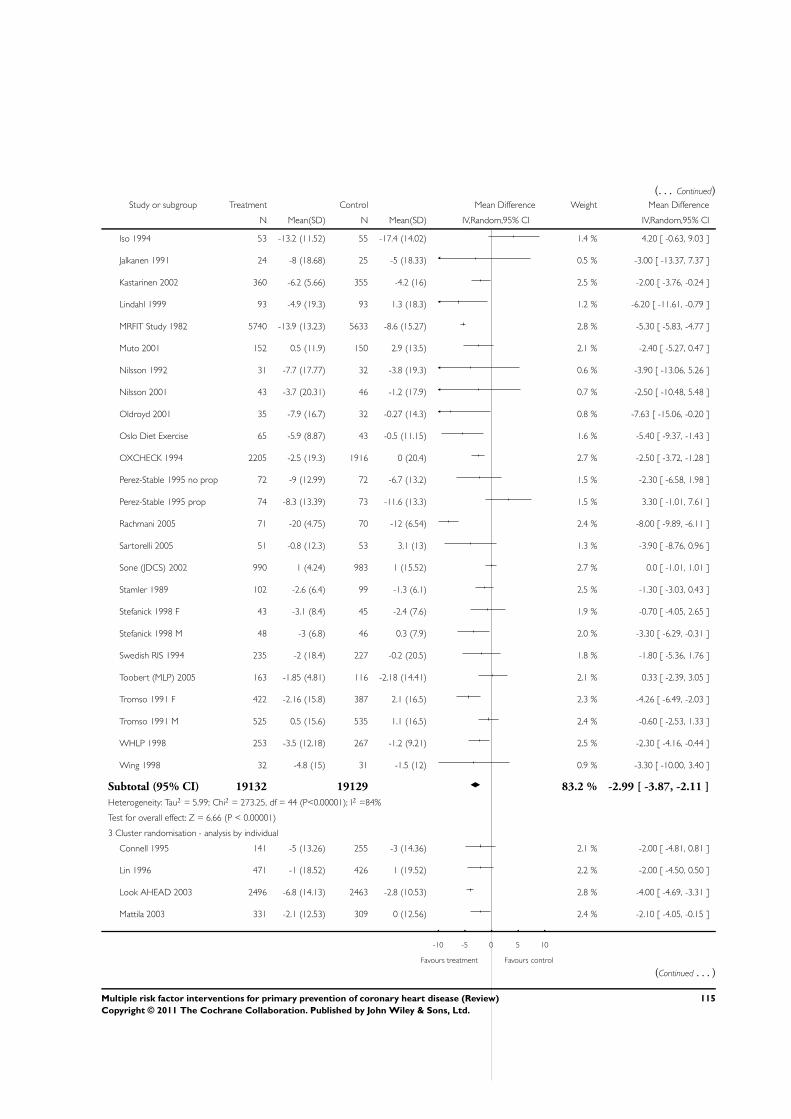
(. . . Continued)Study or subgroup Treatment Control Mean Difference Weight Mean Difference
N Mean(SD) N Mean(SD) IV,Random,95% CI IV,Random,95% CI
Iso 1994 53 -13.2 (11.52) 55 -17.4 (14.02) 1.4 % 4.20 [ -0.63, 9.03 ]
Jalkanen 1991 24 -8 (18.68) 25 -5 (18.33) 0.5 % -3.00 [ -13.37, 7.37 ]
Kastarinen 2002 360 -6.2 (5.66) 355 -4.2 (16) 2.5 % -2.00 [ -3.76, -0.24 ]
Lindahl 1999 93 -4.9 (19.3) 93 1.3 (18.3) 1.2 % -6.20 [ -11.61, -0.79 ]
MRFIT Study 1982 5740 -13.9 (13.23) 5633 -8.6 (15.27) 2.8 % -5.30 [ -5.83, -4.77 ]
Muto 2001 152 0.5 (11.9) 150 2.9 (13.5) 2.1 % -2.40 [ -5.27, 0.47 ]
Nilsson 1992 31 -7.7 (17.77) 32 -3.8 (19.3) 0.6 % -3.90 [ -13.06, 5.26 ]
Nilsson 2001 43 -3.7 (20.31) 46 -1.2 (17.9) 0.7 % -2.50 [ -10.48, 5.48 ]
Oldroyd 2001 35 -7.9 (16.7) 32 -0.27 (14.3) 0.8 % -7.63 [ -15.06, -0.20 ]
Oslo Diet Exercise 65 -5.9 (8.87) 43 -0.5 (11.15) 1.6 % -5.40 [ -9.37, -1.43 ]
OXCHECK 1994 2205 -2.5 (19.3) 1916 0 (20.4) 2.7 % -2.50 [ -3.72, -1.28 ]
Perez-Stable 1995 no prop 72 -9 (12.99) 72 -6.7 (13.2) 1.5 % -2.30 [ -6.58, 1.98 ]
Perez-Stable 1995 prop 74 -8.3 (13.39) 73 -11.6 (13.3) 1.5 % 3.30 [ -1.01, 7.61 ]
Rachmani 2005 71 -20 (4.75) 70 -12 (6.54) 2.4 % -8.00 [ -9.89, -6.11 ]
Sartorelli 2005 51 -0.8 (12.3) 53 3.1 (13) 1.3 % -3.90 [ -8.76, 0.96 ]
Sone (JDCS) 2002 990 1 (4.24) 983 1 (15.52) 2.7 % 0.0 [ -1.01, 1.01 ]
Stamler 1989 102 -2.6 (6.4) 99 -1.3 (6.1) 2.5 % -1.30 [ -3.03, 0.43 ]
Stefanick 1998 F 43 -3.1 (8.4) 45 -2.4 (7.6) 1.9 % -0.70 [ -4.05, 2.65 ]
Stefanick 1998 M 48 -3 (6.8) 46 0.3 (7.9) 2.0 % -3.30 [ -6.29, -0.31 ]
Swedish RIS 1994 235 -2 (18.4) 227 -0.2 (20.5) 1.8 % -1.80 [ -5.36, 1.76 ]
Toobert (MLP) 2005 163 -1.85 (4.81) 116 -2.18 (14.41) 2.1 % 0.33 [ -2.39, 3.05 ]
Tromso 1991 F 422 -2.16 (15.8) 387 2.1 (16.5) 2.3 % -4.26 [ -6.49, -2.03 ]
Tromso 1991 M 525 0.5 (15.6) 535 1.1 (16.5) 2.4 % -0.60 [ -2.53, 1.33 ]
WHLP 1998 253 -3.5 (12.18) 267 -1.2 (9.21) 2.5 % -2.30 [ -4.16, -0.44 ]
Wing 1998 32 -4.8 (15) 31 -1.5 (12) 0.9 % -3.30 [ -10.00, 3.40 ]
Subtotal (95% CI) 19132 19129 83.2 % -2.99 [ -3.87, -2.11 ]
Heterogeneity: Tau2 = 5.99; Chi2 = 273.25, df = 44 (P<0.00001); I2 =84%
Test for overall effect: Z = 6.66 (P < 0.00001)
3 Cluster randomisation - analysis by individual
Connell 1995 141 -5 (13.26) 255 -3 (14.36) 2.1 % -2.00 [ -4.81, 0.81 ]
Lin 1996 471 -1 (18.52) 426 1 (19.52) 2.2 % -2.00 [ -4.50, 0.50 ]
Look AHEAD 2003 2496 -6.8 (14.13) 2463 -2.8 (10.53) 2.8 % -4.00 [ -4.69, -3.31 ]
Mattila 2003 331 -2.1 (12.53) 309 0 (12.56) 2.4 % -2.10 [ -4.05, -0.15 ]
-10 -5 0 5 10
Favours treatment Favours control
(Continued . . . )
115Multiple risk factor interventions for primary prevention of coronary heart disease (Review)
Copyright © 2011 The Cochrane Collaboration. Published by John Wiley & Sons, Ltd.
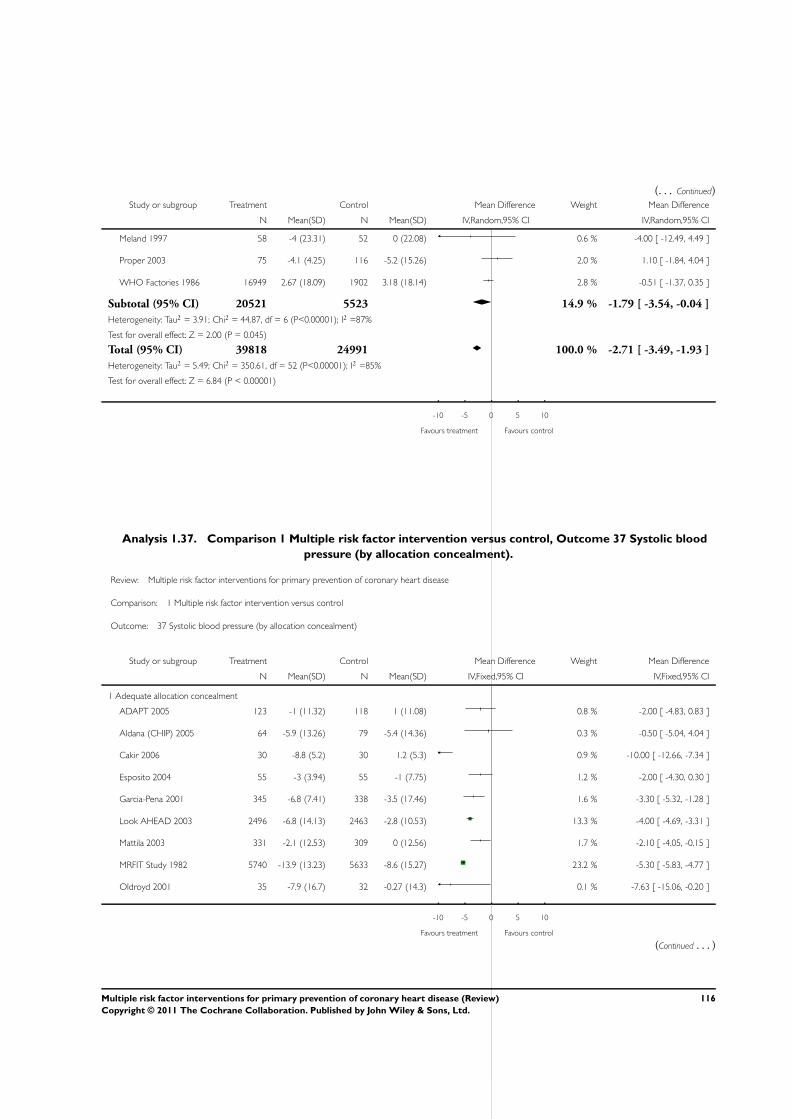
(. . . Continued)Study or subgroup Treatment Control Mean Difference Weight Mean Difference
N Mean(SD) N Mean(SD) IV,Random,95% CI IV,Random,95% CI
Meland 1997 58 -4 (23.31) 52 0 (22.08) 0.6 % -4.00 [ -12.49, 4.49 ]
Proper 2003 75 -4.1 (4.25) 116 -5.2 (15.26) 2.0 % 1.10 [ -1.84, 4.04 ]
WHO Factories 1986 16949 2.67 (18.09) 1902 3.18 (18.14) 2.8 % -0.51 [ -1.37, 0.35 ]
Subtotal (95% CI) 20521 5523 14.9 % -1.79 [ -3.54, -0.04 ]
Heterogeneity: Tau2 = 3.91; Chi2 = 44.87, df = 6 (P<0.00001); I2 =87%
Test for overall effect: Z = 2.00 (P = 0.045)
Total (95% CI) 39818 24991 100.0 % -2.71 [ -3.49, -1.93 ]
Heterogeneity: Tau2 = 5.49; Chi2 = 350.61, df = 52 (P<0.00001); I2 =85%
Test for overall effect: Z = 6.84 (P < 0.00001)
-10 -5 0 5 10
Favours treatment Favours control
Analysis 1.37. Comparison 1 Multiple risk factor intervention versus control, Outcome 37 Systolic blood
pressure (by allocation concealment).
Review: Multiple risk factor interventions for primary prevention of coronary heart disease
Comparison: 1 Multiple risk factor intervention versus control
Outcome: 37 Systolic blood pressure (by allocation concealment)
Study or subgroup Treatment Control Mean Difference Weight Mean Difference
N Mean(SD) N Mean(SD) IV,Fixed,95% CI IV,Fixed,95% CI
1 Adequate allocation concealment
ADAPT 2005 123 -1 (11.32) 118 1 (11.08) 0.8 % -2.00 [ -4.83, 0.83 ]
Aldana (CHIP) 2005 64 -5.9 (13.26) 79 -5.4 (14.36) 0.3 % -0.50 [ -5.04, 4.04 ]
Cakir 2006 30 -8.8 (5.2) 30 1.2 (5.3) 0.9 % -10.00 [ -12.66, -7.34 ]
Esposito 2004 55 -3 (3.94) 55 -1 (7.75) 1.2 % -2.00 [ -4.30, 0.30 ]
Garcia-Pena 2001 345 -6.8 (7.41) 338 -3.5 (17.46) 1.6 % -3.30 [ -5.32, -1.28 ]
Look AHEAD 2003 2496 -6.8 (14.13) 2463 -2.8 (10.53) 13.3 % -4.00 [ -4.69, -3.31 ]
Mattila 2003 331 -2.1 (12.53) 309 0 (12.56) 1.7 % -2.10 [ -4.05, -0.15 ]
MRFIT Study 1982 5740 -13.9 (13.23) 5633 -8.6 (15.27) 23.2 % -5.30 [ -5.83, -4.77 ]
Oldroyd 2001 35 -7.9 (16.7) 32 -0.27 (14.3) 0.1 % -7.63 [ -15.06, -0.20 ]
-10 -5 0 5 10
Favours treatment Favours control
(Continued . . . )
116Multiple risk factor interventions for primary prevention of coronary heart disease (Review)
Copyright © 2011 The Cochrane Collaboration. Published by John Wiley & Sons, Ltd.
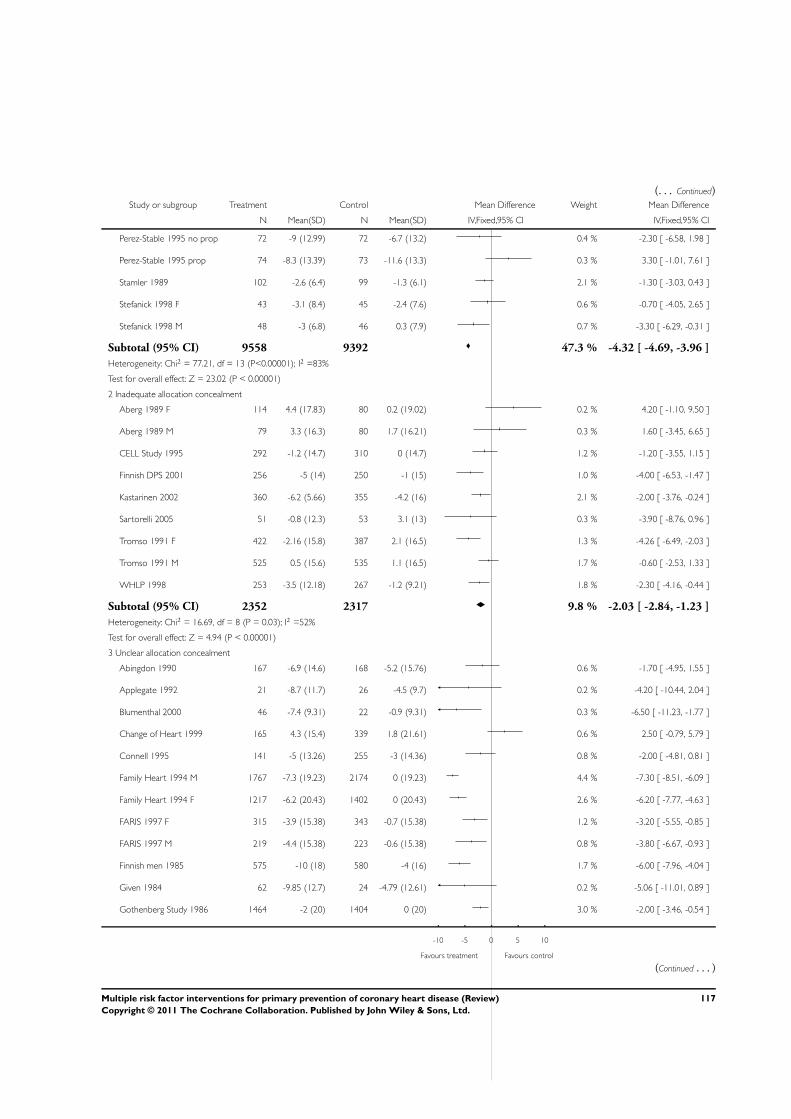
(. . . Continued)Study or subgroup Treatment Control Mean Difference Weight Mean Difference
N Mean(SD) N Mean(SD) IV,Fixed,95% CI IV,Fixed,95% CI
Perez-Stable 1995 no prop 72 -9 (12.99) 72 -6.7 (13.2) 0.4 % -2.30 [ -6.58, 1.98 ]
Perez-Stable 1995 prop 74 -8.3 (13.39) 73 -11.6 (13.3) 0.3 % 3.30 [ -1.01, 7.61 ]
Stamler 1989 102 -2.6 (6.4) 99 -1.3 (6.1) 2.1 % -1.30 [ -3.03, 0.43 ]
Stefanick 1998 F 43 -3.1 (8.4) 45 -2.4 (7.6) 0.6 % -0.70 [ -4.05, 2.65 ]
Stefanick 1998 M 48 -3 (6.8) 46 0.3 (7.9) 0.7 % -3.30 [ -6.29, -0.31 ]
Subtotal (95% CI) 9558 9392 47.3 % -4.32 [ -4.69, -3.96 ]
Heterogeneity: Chi2 = 77.21, df = 13 (P<0.00001); I2 =83%
Test for overall effect: Z = 23.02 (P < 0.00001)
2 Inadequate allocation concealment
Aberg 1989 F 114 4.4 (17.83) 80 0.2 (19.02) 0.2 % 4.20 [ -1.10, 9.50 ]
Aberg 1989 M 79 3.3 (16.3) 80 1.7 (16.21) 0.3 % 1.60 [ -3.45, 6.65 ]
CELL Study 1995 292 -1.2 (14.7) 310 0 (14.7) 1.2 % -1.20 [ -3.55, 1.15 ]
Finnish DPS 2001 256 -5 (14) 250 -1 (15) 1.0 % -4.00 [ -6.53, -1.47 ]
Kastarinen 2002 360 -6.2 (5.66) 355 -4.2 (16) 2.1 % -2.00 [ -3.76, -0.24 ]
Sartorelli 2005 51 -0.8 (12.3) 53 3.1 (13) 0.3 % -3.90 [ -8.76, 0.96 ]
Tromso 1991 F 422 -2.16 (15.8) 387 2.1 (16.5) 1.3 % -4.26 [ -6.49, -2.03 ]
Tromso 1991 M 525 0.5 (15.6) 535 1.1 (16.5) 1.7 % -0.60 [ -2.53, 1.33 ]
WHLP 1998 253 -3.5 (12.18) 267 -1.2 (9.21) 1.8 % -2.30 [ -4.16, -0.44 ]
Subtotal (95% CI) 2352 2317 9.8 % -2.03 [ -2.84, -1.23 ]
Heterogeneity: Chi2 = 16.69, df = 8 (P = 0.03); I2 =52%
Test for overall effect: Z = 4.94 (P < 0.00001)
3 Unclear allocation concealment
Abingdon 1990 167 -6.9 (14.6) 168 -5.2 (15.76) 0.6 % -1.70 [ -4.95, 1.55 ]
Applegate 1992 21 -8.7 (11.7) 26 -4.5 (9.7) 0.2 % -4.20 [ -10.44, 2.04 ]
Blumenthal 2000 46 -7.4 (9.31) 22 -0.9 (9.31) 0.3 % -6.50 [ -11.23, -1.77 ]
Change of Heart 1999 165 4.3 (15.4) 339 1.8 (21.61) 0.6 % 2.50 [ -0.79, 5.79 ]
Connell 1995 141 -5 (13.26) 255 -3 (14.36) 0.8 % -2.00 [ -4.81, 0.81 ]
Family Heart 1994 M 1767 -7.3 (19.23) 2174 0 (19.23) 4.4 % -7.30 [ -8.51, -6.09 ]
Family Heart 1994 F 1217 -6.2 (20.43) 1402 0 (20.43) 2.6 % -6.20 [ -7.77, -4.63 ]
FARIS 1997 F 315 -3.9 (15.38) 343 -0.7 (15.38) 1.2 % -3.20 [ -5.55, -0.85 ]
FARIS 1997 M 219 -4.4 (15.38) 223 -0.6 (15.38) 0.8 % -3.80 [ -6.67, -0.93 ]
Finnish men 1985 575 -10 (18) 580 -4 (16) 1.7 % -6.00 [ -7.96, -4.04 ]
Given 1984 62 -9.85 (12.7) 24 -4.79 (12.61) 0.2 % -5.06 [ -11.01, 0.89 ]
Gothenberg Study 1986 1464 -2 (20) 1404 0 (20) 3.0 % -2.00 [ -3.46, -0.54 ]
-10 -5 0 5 10
Favours treatment Favours control
(Continued . . . )
117Multiple risk factor interventions for primary prevention of coronary heart disease (Review)
Copyright © 2011 The Cochrane Collaboration. Published by John Wiley & Sons, Ltd.
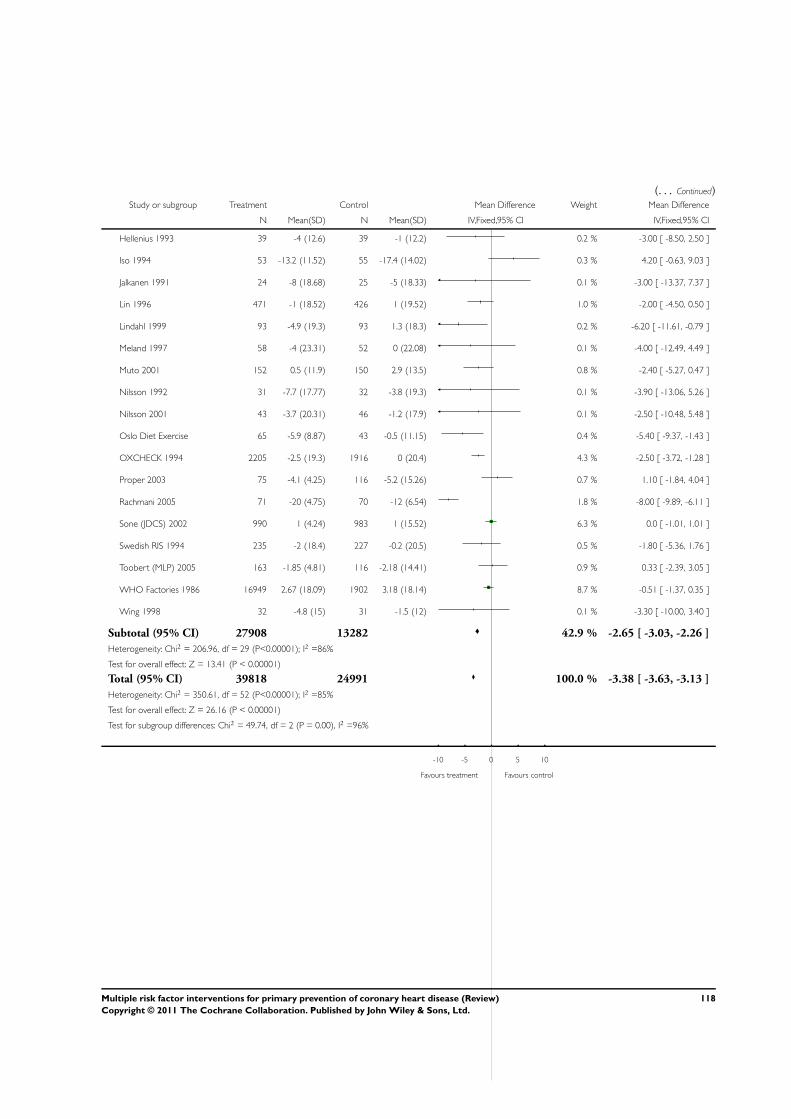
(. . . Continued)Study or subgroup Treatment Control Mean Difference Weight Mean Difference
N Mean(SD) N Mean(SD) IV,Fixed,95% CI IV,Fixed,95% CI
Hellenius 1993 39 -4 (12.6) 39 -1 (12.2) 0.2 % -3.00 [ -8.50, 2.50 ]
Iso 1994 53 -13.2 (11.52) 55 -17.4 (14.02) 0.3 % 4.20 [ -0.63, 9.03 ]
Jalkanen 1991 24 -8 (18.68) 25 -5 (18.33) 0.1 % -3.00 [ -13.37, 7.37 ]
Lin 1996 471 -1 (18.52) 426 1 (19.52) 1.0 % -2.00 [ -4.50, 0.50 ]
Lindahl 1999 93 -4.9 (19.3) 93 1.3 (18.3) 0.2 % -6.20 [ -11.61, -0.79 ]
Meland 1997 58 -4 (23.31) 52 0 (22.08) 0.1 % -4.00 [ -12.49, 4.49 ]
Muto 2001 152 0.5 (11.9) 150 2.9 (13.5) 0.8 % -2.40 [ -5.27, 0.47 ]
Nilsson 1992 31 -7.7 (17.77) 32 -3.8 (19.3) 0.1 % -3.90 [ -13.06, 5.26 ]
Nilsson 2001 43 -3.7 (20.31) 46 -1.2 (17.9) 0.1 % -2.50 [ -10.48, 5.48 ]
Oslo Diet Exercise 65 -5.9 (8.87) 43 -0.5 (11.15) 0.4 % -5.40 [ -9.37, -1.43 ]
OXCHECK 1994 2205 -2.5 (19.3) 1916 0 (20.4) 4.3 % -2.50 [ -3.72, -1.28 ]
Proper 2003 75 -4.1 (4.25) 116 -5.2 (15.26) 0.7 % 1.10 [ -1.84, 4.04 ]
Rachmani 2005 71 -20 (4.75) 70 -12 (6.54) 1.8 % -8.00 [ -9.89, -6.11 ]
Sone (JDCS) 2002 990 1 (4.24) 983 1 (15.52) 6.3 % 0.0 [ -1.01, 1.01 ]
Swedish RIS 1994 235 -2 (18.4) 227 -0.2 (20.5) 0.5 % -1.80 [ -5.36, 1.76 ]
Toobert (MLP) 2005 163 -1.85 (4.81) 116 -2.18 (14.41) 0.9 % 0.33 [ -2.39, 3.05 ]
WHO Factories 1986 16949 2.67 (18.09) 1902 3.18 (18.14) 8.7 % -0.51 [ -1.37, 0.35 ]
Wing 1998 32 -4.8 (15) 31 -1.5 (12) 0.1 % -3.30 [ -10.00, 3.40 ]
Subtotal (95% CI) 27908 13282 42.9 % -2.65 [ -3.03, -2.26 ]
Heterogeneity: Chi2 = 206.96, df = 29 (P<0.00001); I2 =86%
Test for overall effect: Z = 13.41 (P < 0.00001)
Total (95% CI) 39818 24991 100.0 % -3.38 [ -3.63, -3.13 ]
Heterogeneity: Chi2 = 350.61, df = 52 (P<0.00001); I2 =85%
Test for overall effect: Z = 26.16 (P < 0.00001)
Test for subgroup differences: Chi2 = 49.74, df = 2 (P = 0.00), I2 =96%
-10 -5 0 5 10
Favours treatment Favours control
118Multiple risk factor interventions for primary prevention of coronary heart disease (Review)
Copyright © 2011 The Cochrane Collaboration. Published by John Wiley & Sons, Ltd.
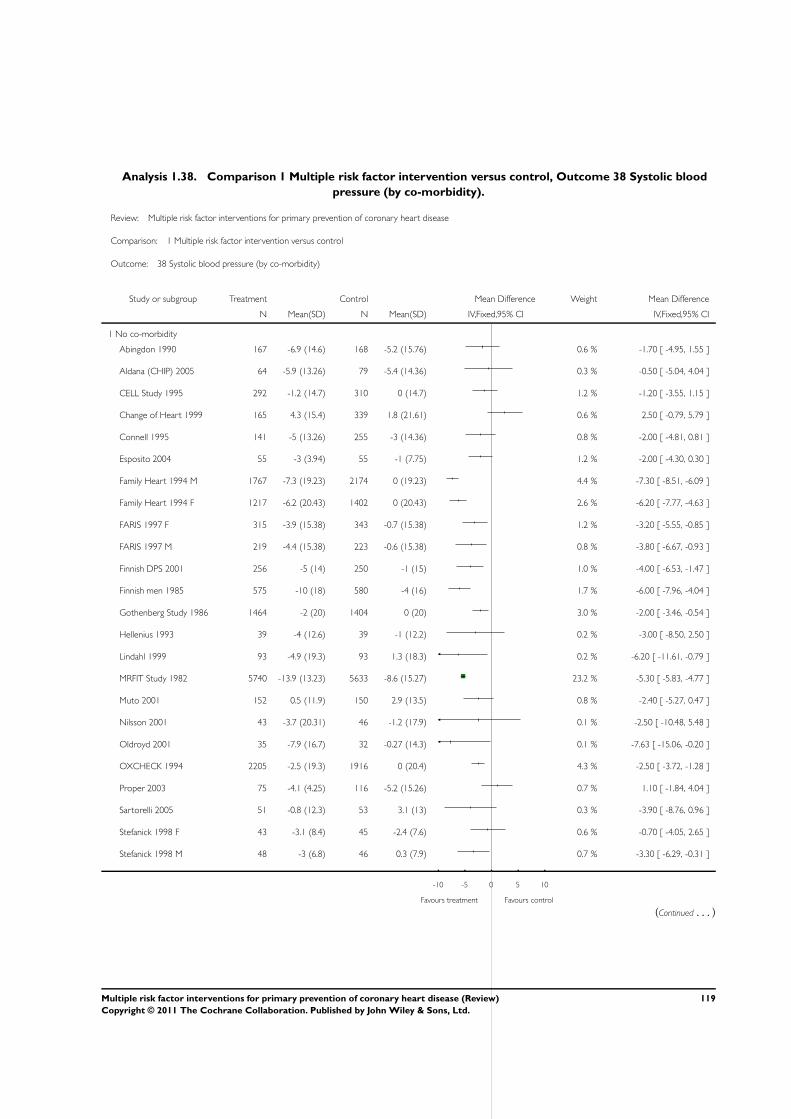
Analysis 1.38. Comparison 1 Multiple risk factor intervention versus control, Outcome 38 Systolic blood
pressure (by co-morbidity).
Review: Multiple risk factor interventions for primary prevention of coronary heart disease
Comparison: 1 Multiple risk factor intervention versus control
Outcome: 38 Systolic blood pressure (by co-morbidity)
Study or subgroup Treatment Control Mean Difference Weight Mean Difference
N Mean(SD) N Mean(SD) IV,Fixed,95% CI IV,Fixed,95% CI
1 No co-morbidity
Abingdon 1990 167 -6.9 (14.6) 168 -5.2 (15.76) 0.6 % -1.70 [ -4.95, 1.55 ]
Aldana (CHIP) 2005 64 -5.9 (13.26) 79 -5.4 (14.36) 0.3 % -0.50 [ -5.04, 4.04 ]
CELL Study 1995 292 -1.2 (14.7) 310 0 (14.7) 1.2 % -1.20 [ -3.55, 1.15 ]
Change of Heart 1999 165 4.3 (15.4) 339 1.8 (21.61) 0.6 % 2.50 [ -0.79, 5.79 ]
Connell 1995 141 -5 (13.26) 255 -3 (14.36) 0.8 % -2.00 [ -4.81, 0.81 ]
Esposito 2004 55 -3 (3.94) 55 -1 (7.75) 1.2 % -2.00 [ -4.30, 0.30 ]
Family Heart 1994 M 1767 -7.3 (19.23) 2174 0 (19.23) 4.4 % -7.30 [ -8.51, -6.09 ]
Family Heart 1994 F 1217 -6.2 (20.43) 1402 0 (20.43) 2.6 % -6.20 [ -7.77, -4.63 ]
FARIS 1997 F 315 -3.9 (15.38) 343 -0.7 (15.38) 1.2 % -3.20 [ -5.55, -0.85 ]
FARIS 1997 M 219 -4.4 (15.38) 223 -0.6 (15.38) 0.8 % -3.80 [ -6.67, -0.93 ]
Finnish DPS 2001 256 -5 (14) 250 -1 (15) 1.0 % -4.00 [ -6.53, -1.47 ]
Finnish men 1985 575 -10 (18) 580 -4 (16) 1.7 % -6.00 [ -7.96, -4.04 ]
Gothenberg Study 1986 1464 -2 (20) 1404 0 (20) 3.0 % -2.00 [ -3.46, -0.54 ]
Hellenius 1993 39 -4 (12.6) 39 -1 (12.2) 0.2 % -3.00 [ -8.50, 2.50 ]
Lindahl 1999 93 -4.9 (19.3) 93 1.3 (18.3) 0.2 % -6.20 [ -11.61, -0.79 ]
MRFIT Study 1982 5740 -13.9 (13.23) 5633 -8.6 (15.27) 23.2 % -5.30 [ -5.83, -4.77 ]
Muto 2001 152 0.5 (11.9) 150 2.9 (13.5) 0.8 % -2.40 [ -5.27, 0.47 ]
Nilsson 2001 43 -3.7 (20.31) 46 -1.2 (17.9) 0.1 % -2.50 [ -10.48, 5.48 ]
Oldroyd 2001 35 -7.9 (16.7) 32 -0.27 (14.3) 0.1 % -7.63 [ -15.06, -0.20 ]
OXCHECK 1994 2205 -2.5 (19.3) 1916 0 (20.4) 4.3 % -2.50 [ -3.72, -1.28 ]
Proper 2003 75 -4.1 (4.25) 116 -5.2 (15.26) 0.7 % 1.10 [ -1.84, 4.04 ]
Sartorelli 2005 51 -0.8 (12.3) 53 3.1 (13) 0.3 % -3.90 [ -8.76, 0.96 ]
Stefanick 1998 F 43 -3.1 (8.4) 45 -2.4 (7.6) 0.6 % -0.70 [ -4.05, 2.65 ]
Stefanick 1998 M 48 -3 (6.8) 46 0.3 (7.9) 0.7 % -3.30 [ -6.29, -0.31 ]
-10 -5 0 5 10
Favours treatment Favours control
(Continued . . . )
119Multiple risk factor interventions for primary prevention of coronary heart disease (Review)
Copyright © 2011 The Cochrane Collaboration. Published by John Wiley & Sons, Ltd.
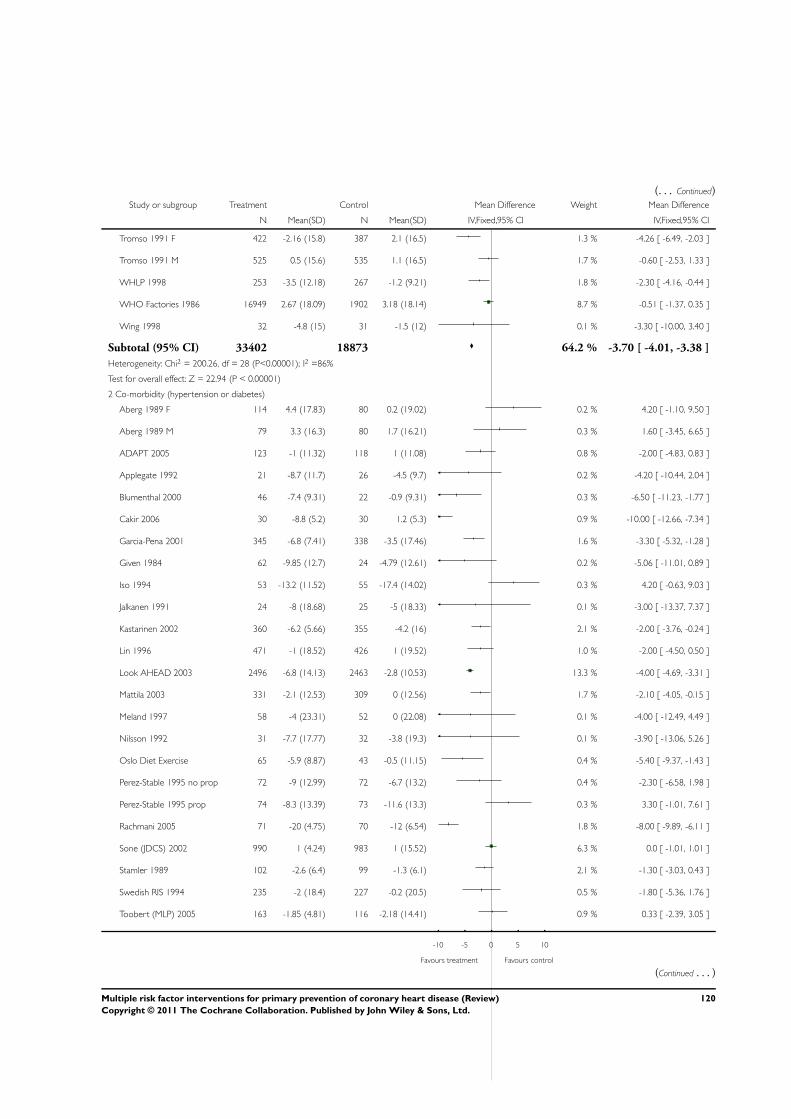
(. . . Continued)Study or subgroup Treatment Control Mean Difference Weight Mean Difference
N Mean(SD) N Mean(SD) IV,Fixed,95% CI IV,Fixed,95% CI
Tromso 1991 F 422 -2.16 (15.8) 387 2.1 (16.5) 1.3 % -4.26 [ -6.49, -2.03 ]
Tromso 1991 M 525 0.5 (15.6) 535 1.1 (16.5) 1.7 % -0.60 [ -2.53, 1.33 ]
WHLP 1998 253 -3.5 (12.18) 267 -1.2 (9.21) 1.8 % -2.30 [ -4.16, -0.44 ]
WHO Factories 1986 16949 2.67 (18.09) 1902 3.18 (18.14) 8.7 % -0.51 [ -1.37, 0.35 ]
Wing 1998 32 -4.8 (15) 31 -1.5 (12) 0.1 % -3.30 [ -10.00, 3.40 ]
Subtotal (95% CI) 33402 18873 64.2 % -3.70 [ -4.01, -3.38 ]
Heterogeneity: Chi2 = 200.26, df = 28 (P<0.00001); I2 =86%
Test for overall effect: Z = 22.94 (P < 0.00001)
2 Co-morbidity (hypertension or diabetes)
Aberg 1989 F 114 4.4 (17.83) 80 0.2 (19.02) 0.2 % 4.20 [ -1.10, 9.50 ]
Aberg 1989 M 79 3.3 (16.3) 80 1.7 (16.21) 0.3 % 1.60 [ -3.45, 6.65 ]
ADAPT 2005 123 -1 (11.32) 118 1 (11.08) 0.8 % -2.00 [ -4.83, 0.83 ]
Applegate 1992 21 -8.7 (11.7) 26 -4.5 (9.7) 0.2 % -4.20 [ -10.44, 2.04 ]
Blumenthal 2000 46 -7.4 (9.31) 22 -0.9 (9.31) 0.3 % -6.50 [ -11.23, -1.77 ]
Cakir 2006 30 -8.8 (5.2) 30 1.2 (5.3) 0.9 % -10.00 [ -12.66, -7.34 ]
Garcia-Pena 2001 345 -6.8 (7.41) 338 -3.5 (17.46) 1.6 % -3.30 [ -5.32, -1.28 ]
Given 1984 62 -9.85 (12.7) 24 -4.79 (12.61) 0.2 % -5.06 [ -11.01, 0.89 ]
Iso 1994 53 -13.2 (11.52) 55 -17.4 (14.02) 0.3 % 4.20 [ -0.63, 9.03 ]
Jalkanen 1991 24 -8 (18.68) 25 -5 (18.33) 0.1 % -3.00 [ -13.37, 7.37 ]
Kastarinen 2002 360 -6.2 (5.66) 355 -4.2 (16) 2.1 % -2.00 [ -3.76, -0.24 ]
Lin 1996 471 -1 (18.52) 426 1 (19.52) 1.0 % -2.00 [ -4.50, 0.50 ]
Look AHEAD 2003 2496 -6.8 (14.13) 2463 -2.8 (10.53) 13.3 % -4.00 [ -4.69, -3.31 ]
Mattila 2003 331 -2.1 (12.53) 309 0 (12.56) 1.7 % -2.10 [ -4.05, -0.15 ]
Meland 1997 58 -4 (23.31) 52 0 (22.08) 0.1 % -4.00 [ -12.49, 4.49 ]
Nilsson 1992 31 -7.7 (17.77) 32 -3.8 (19.3) 0.1 % -3.90 [ -13.06, 5.26 ]
Oslo Diet Exercise 65 -5.9 (8.87) 43 -0.5 (11.15) 0.4 % -5.40 [ -9.37, -1.43 ]
Perez-Stable 1995 no prop 72 -9 (12.99) 72 -6.7 (13.2) 0.4 % -2.30 [ -6.58, 1.98 ]
Perez-Stable 1995 prop 74 -8.3 (13.39) 73 -11.6 (13.3) 0.3 % 3.30 [ -1.01, 7.61 ]
Rachmani 2005 71 -20 (4.75) 70 -12 (6.54) 1.8 % -8.00 [ -9.89, -6.11 ]
Sone (JDCS) 2002 990 1 (4.24) 983 1 (15.52) 6.3 % 0.0 [ -1.01, 1.01 ]
Stamler 1989 102 -2.6 (6.4) 99 -1.3 (6.1) 2.1 % -1.30 [ -3.03, 0.43 ]
Swedish RIS 1994 235 -2 (18.4) 227 -0.2 (20.5) 0.5 % -1.80 [ -5.36, 1.76 ]
Toobert (MLP) 2005 163 -1.85 (4.81) 116 -2.18 (14.41) 0.9 % 0.33 [ -2.39, 3.05 ]
-10 -5 0 5 10
Favours treatment Favours control
(Continued . . . )
120Multiple risk factor interventions for primary prevention of coronary heart disease (Review)
Copyright © 2011 The Cochrane Collaboration. Published by John Wiley & Sons, Ltd.
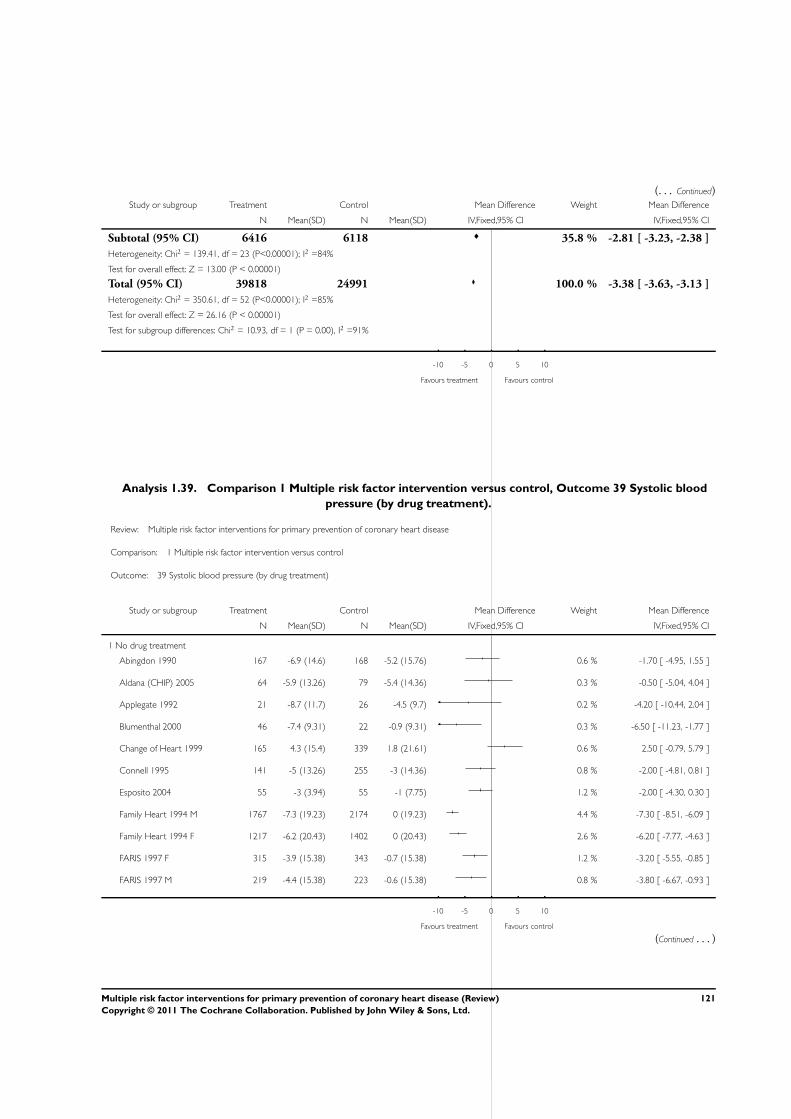
(. . . Continued)Study or subgroup Treatment Control Mean Difference Weight Mean Difference
N Mean(SD) N Mean(SD) IV,Fixed,95% CI IV,Fixed,95% CI
Subtotal (95% CI) 6416 6118 35.8 % -2.81 [ -3.23, -2.38 ]
Heterogeneity: Chi2 = 139.41, df = 23 (P<0.00001); I2 =84%
Test for overall effect: Z = 13.00 (P < 0.00001)
Total (95% CI) 39818 24991 100.0 % -3.38 [ -3.63, -3.13 ]
Heterogeneity: Chi2 = 350.61, df = 52 (P<0.00001); I2 =85%
Test for overall effect: Z = 26.16 (P < 0.00001)
Test for subgroup differences: Chi2 = 10.93, df = 1 (P = 0.00), I2 =91%
-10 -5 0 5 10
Favours treatment Favours control
Analysis 1.39. Comparison 1 Multiple risk factor intervention versus control, Outcome 39 Systolic blood
pressure (by drug treatment).
Review: Multiple risk factor interventions for primary prevention of coronary heart disease
Comparison: 1 Multiple risk factor intervention versus control
Outcome: 39 Systolic blood pressure (by drug treatment)
Study or subgroup Treatment Control Mean Difference Weight Mean Difference
N Mean(SD) N Mean(SD) IV,Fixed,95% CI IV,Fixed,95% CI
1 No drug treatment
Abingdon 1990 167 -6.9 (14.6) 168 -5.2 (15.76) 0.6 % -1.70 [ -4.95, 1.55 ]
Aldana (CHIP) 2005 64 -5.9 (13.26) 79 -5.4 (14.36) 0.3 % -0.50 [ -5.04, 4.04 ]
Applegate 1992 21 -8.7 (11.7) 26 -4.5 (9.7) 0.2 % -4.20 [ -10.44, 2.04 ]
Blumenthal 2000 46 -7.4 (9.31) 22 -0.9 (9.31) 0.3 % -6.50 [ -11.23, -1.77 ]
Change of Heart 1999 165 4.3 (15.4) 339 1.8 (21.61) 0.6 % 2.50 [ -0.79, 5.79 ]
Connell 1995 141 -5 (13.26) 255 -3 (14.36) 0.8 % -2.00 [ -4.81, 0.81 ]
Esposito 2004 55 -3 (3.94) 55 -1 (7.75) 1.2 % -2.00 [ -4.30, 0.30 ]
Family Heart 1994 M 1767 -7.3 (19.23) 2174 0 (19.23) 4.4 % -7.30 [ -8.51, -6.09 ]
Family Heart 1994 F 1217 -6.2 (20.43) 1402 0 (20.43) 2.6 % -6.20 [ -7.77, -4.63 ]
FARIS 1997 F 315 -3.9 (15.38) 343 -0.7 (15.38) 1.2 % -3.20 [ -5.55, -0.85 ]
FARIS 1997 M 219 -4.4 (15.38) 223 -0.6 (15.38) 0.8 % -3.80 [ -6.67, -0.93 ]
-10 -5 0 5 10
Favours treatment Favours control
(Continued . . . )
121Multiple risk factor interventions for primary prevention of coronary heart disease (Review)
Copyright © 2011 The Cochrane Collaboration. Published by John Wiley & Sons, Ltd.
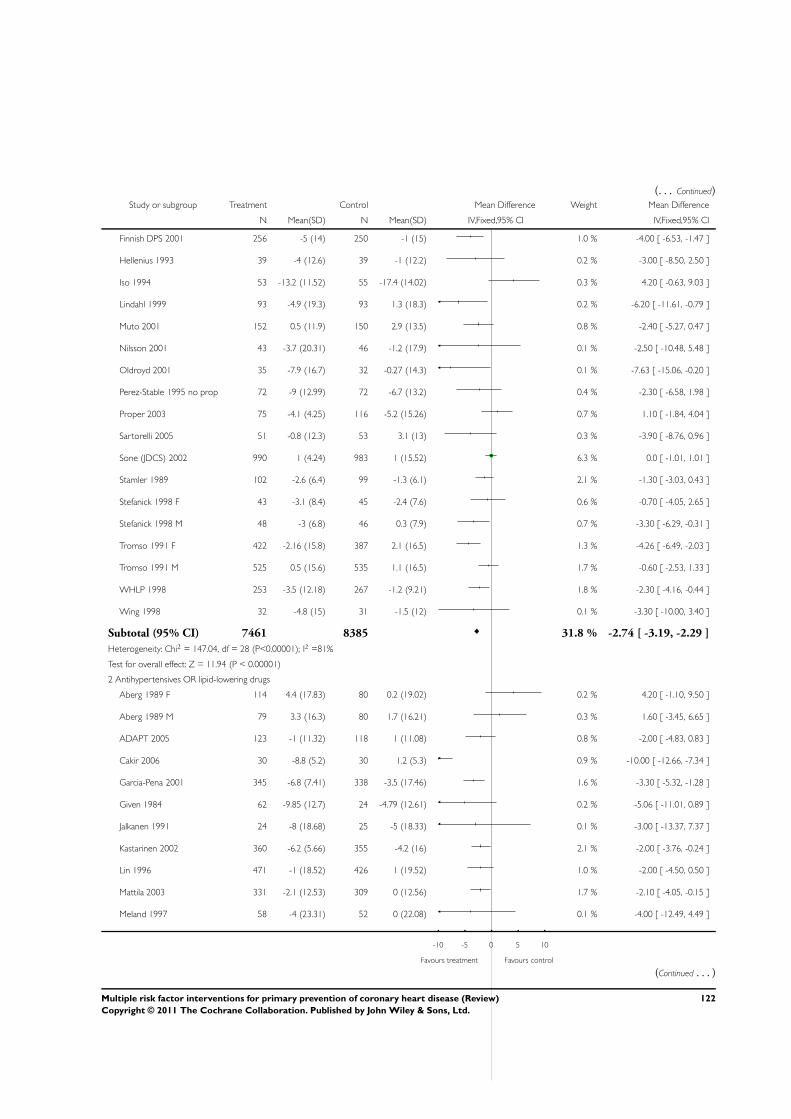
(. . . Continued)Study or subgroup Treatment Control Mean Difference Weight Mean Difference
N Mean(SD) N Mean(SD) IV,Fixed,95% CI IV,Fixed,95% CI
Finnish DPS 2001 256 -5 (14) 250 -1 (15) 1.0 % -4.00 [ -6.53, -1.47 ]
Hellenius 1993 39 -4 (12.6) 39 -1 (12.2) 0.2 % -3.00 [ -8.50, 2.50 ]
Iso 1994 53 -13.2 (11.52) 55 -17.4 (14.02) 0.3 % 4.20 [ -0.63, 9.03 ]
Lindahl 1999 93 -4.9 (19.3) 93 1.3 (18.3) 0.2 % -6.20 [ -11.61, -0.79 ]
Muto 2001 152 0.5 (11.9) 150 2.9 (13.5) 0.8 % -2.40 [ -5.27, 0.47 ]
Nilsson 2001 43 -3.7 (20.31) 46 -1.2 (17.9) 0.1 % -2.50 [ -10.48, 5.48 ]
Oldroyd 2001 35 -7.9 (16.7) 32 -0.27 (14.3) 0.1 % -7.63 [ -15.06, -0.20 ]
Perez-Stable 1995 no prop 72 -9 (12.99) 72 -6.7 (13.2) 0.4 % -2.30 [ -6.58, 1.98 ]
Proper 2003 75 -4.1 (4.25) 116 -5.2 (15.26) 0.7 % 1.10 [ -1.84, 4.04 ]
Sartorelli 2005 51 -0.8 (12.3) 53 3.1 (13) 0.3 % -3.90 [ -8.76, 0.96 ]
Sone (JDCS) 2002 990 1 (4.24) 983 1 (15.52) 6.3 % 0.0 [ -1.01, 1.01 ]
Stamler 1989 102 -2.6 (6.4) 99 -1.3 (6.1) 2.1 % -1.30 [ -3.03, 0.43 ]
Stefanick 1998 F 43 -3.1 (8.4) 45 -2.4 (7.6) 0.6 % -0.70 [ -4.05, 2.65 ]
Stefanick 1998 M 48 -3 (6.8) 46 0.3 (7.9) 0.7 % -3.30 [ -6.29, -0.31 ]
Tromso 1991 F 422 -2.16 (15.8) 387 2.1 (16.5) 1.3 % -4.26 [ -6.49, -2.03 ]
Tromso 1991 M 525 0.5 (15.6) 535 1.1 (16.5) 1.7 % -0.60 [ -2.53, 1.33 ]
WHLP 1998 253 -3.5 (12.18) 267 -1.2 (9.21) 1.8 % -2.30 [ -4.16, -0.44 ]
Wing 1998 32 -4.8 (15) 31 -1.5 (12) 0.1 % -3.30 [ -10.00, 3.40 ]
Subtotal (95% CI) 7461 8385 31.8 % -2.74 [ -3.19, -2.29 ]
Heterogeneity: Chi2 = 147.04, df = 28 (P<0.00001); I2 =81%
Test for overall effect: Z = 11.94 (P < 0.00001)
2 Antihypertensives OR lipid-lowering drugs
Aberg 1989 F 114 4.4 (17.83) 80 0.2 (19.02) 0.2 % 4.20 [ -1.10, 9.50 ]
Aberg 1989 M 79 3.3 (16.3) 80 1.7 (16.21) 0.3 % 1.60 [ -3.45, 6.65 ]
ADAPT 2005 123 -1 (11.32) 118 1 (11.08) 0.8 % -2.00 [ -4.83, 0.83 ]
Cakir 2006 30 -8.8 (5.2) 30 1.2 (5.3) 0.9 % -10.00 [ -12.66, -7.34 ]
Garcia-Pena 2001 345 -6.8 (7.41) 338 -3.5 (17.46) 1.6 % -3.30 [ -5.32, -1.28 ]
Given 1984 62 -9.85 (12.7) 24 -4.79 (12.61) 0.2 % -5.06 [ -11.01, 0.89 ]
Jalkanen 1991 24 -8 (18.68) 25 -5 (18.33) 0.1 % -3.00 [ -13.37, 7.37 ]
Kastarinen 2002 360 -6.2 (5.66) 355 -4.2 (16) 2.1 % -2.00 [ -3.76, -0.24 ]
Lin 1996 471 -1 (18.52) 426 1 (19.52) 1.0 % -2.00 [ -4.50, 0.50 ]
Mattila 2003 331 -2.1 (12.53) 309 0 (12.56) 1.7 % -2.10 [ -4.05, -0.15 ]
Meland 1997 58 -4 (23.31) 52 0 (22.08) 0.1 % -4.00 [ -12.49, 4.49 ]
-10 -5 0 5 10
Favours treatment Favours control
(Continued . . . )
122Multiple risk factor interventions for primary prevention of coronary heart disease (Review)
Copyright © 2011 The Cochrane Collaboration. Published by John Wiley & Sons, Ltd.
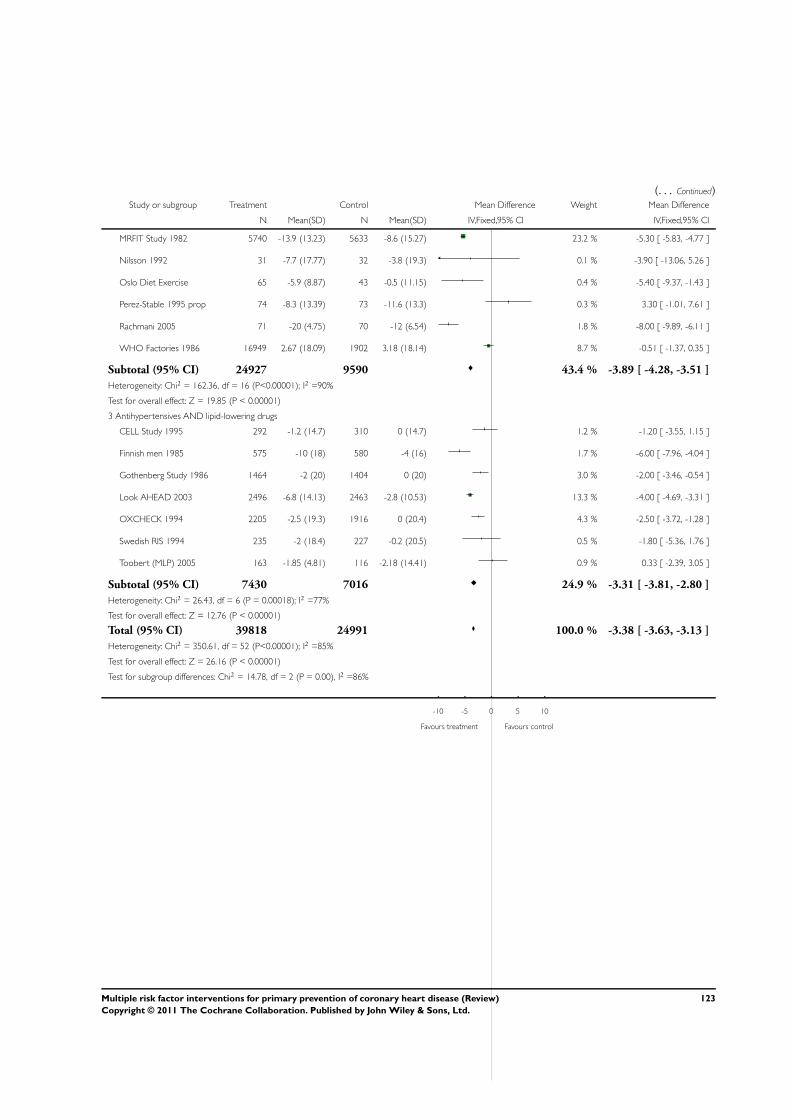
(. . . Continued)Study or subgroup Treatment Control Mean Difference Weight Mean Difference
N Mean(SD) N Mean(SD) IV,Fixed,95% CI IV,Fixed,95% CI
MRFIT Study 1982 5740 -13.9 (13.23) 5633 -8.6 (15.27) 23.2 % -5.30 [ -5.83, -4.77 ]
Nilsson 1992 31 -7.7 (17.77) 32 -3.8 (19.3) 0.1 % -3.90 [ -13.06, 5.26 ]
Oslo Diet Exercise 65 -5.9 (8.87) 43 -0.5 (11.15) 0.4 % -5.40 [ -9.37, -1.43 ]
Perez-Stable 1995 prop 74 -8.3 (13.39) 73 -11.6 (13.3) 0.3 % 3.30 [ -1.01, 7.61 ]
Rachmani 2005 71 -20 (4.75) 70 -12 (6.54) 1.8 % -8.00 [ -9.89, -6.11 ]
WHO Factories 1986 16949 2.67 (18.09) 1902 3.18 (18.14) 8.7 % -0.51 [ -1.37, 0.35 ]
Subtotal (95% CI) 24927 9590 43.4 % -3.89 [ -4.28, -3.51 ]
Heterogeneity: Chi2 = 162.36, df = 16 (P<0.00001); I2 =90%
Test for overall effect: Z = 19.85 (P < 0.00001)
3 Antihypertensives AND lipid-lowering drugs
CELL Study 1995 292 -1.2 (14.7) 310 0 (14.7) 1.2 % -1.20 [ -3.55, 1.15 ]
Finnish men 1985 575 -10 (18) 580 -4 (16) 1.7 % -6.00 [ -7.96, -4.04 ]
Gothenberg Study 1986 1464 -2 (20) 1404 0 (20) 3.0 % -2.00 [ -3.46, -0.54 ]
Look AHEAD 2003 2496 -6.8 (14.13) 2463 -2.8 (10.53) 13.3 % -4.00 [ -4.69, -3.31 ]
OXCHECK 1994 2205 -2.5 (19.3) 1916 0 (20.4) 4.3 % -2.50 [ -3.72, -1.28 ]
Swedish RIS 1994 235 -2 (18.4) 227 -0.2 (20.5) 0.5 % -1.80 [ -5.36, 1.76 ]
Toobert (MLP) 2005 163 -1.85 (4.81) 116 -2.18 (14.41) 0.9 % 0.33 [ -2.39, 3.05 ]
Subtotal (95% CI) 7430 7016 24.9 % -3.31 [ -3.81, -2.80 ]
Heterogeneity: Chi2 = 26.43, df = 6 (P = 0.00018); I2 =77%
Test for overall effect: Z = 12.76 (P < 0.00001)
Total (95% CI) 39818 24991 100.0 % -3.38 [ -3.63, -3.13 ]
Heterogeneity: Chi2 = 350.61, df = 52 (P<0.00001); I2 =85%
Test for overall effect: Z = 26.16 (P < 0.00001)
Test for subgroup differences: Chi2 = 14.78, df = 2 (P = 0.00), I2 =86%
-10 -5 0 5 10
Favours treatment Favours control
123Multiple risk factor interventions for primary prevention of coronary heart disease (Review)
Copyright © 2011 The Cochrane Collaboration. Published by John Wiley & Sons, Ltd.
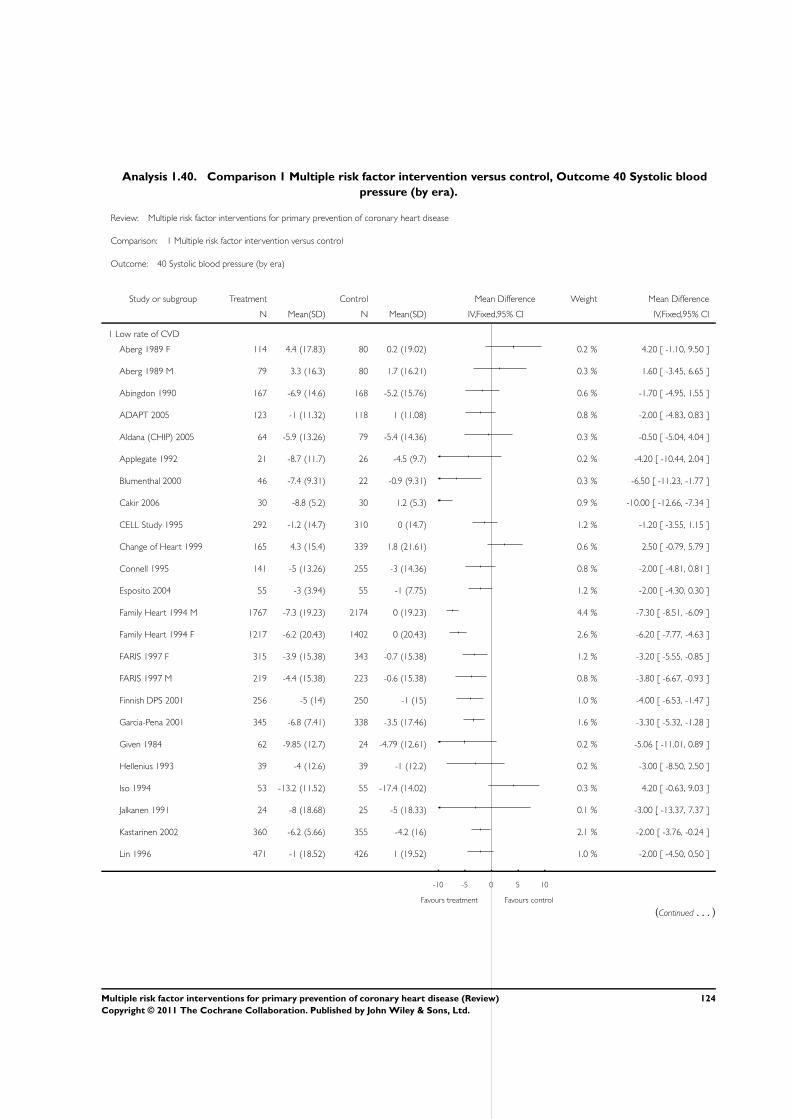
Analysis 1.40. Comparison 1 Multiple risk factor intervention versus control, Outcome 40 Systolic blood
pressure (by era).
Review: Multiple risk factor interventions for primary prevention of coronary heart disease
Comparison: 1 Multiple risk factor intervention versus control
Outcome: 40 Systolic blood pressure (by era)
Study or subgroup Treatment Control Mean Difference Weight Mean Difference
N Mean(SD) N Mean(SD) IV,Fixed,95% CI IV,Fixed,95% CI
1 Low rate of CVD
Aberg 1989 F 114 4.4 (17.83) 80 0.2 (19.02) 0.2 % 4.20 [ -1.10, 9.50 ]
Aberg 1989 M 79 3.3 (16.3) 80 1.7 (16.21) 0.3 % 1.60 [ -3.45, 6.65 ]
Abingdon 1990 167 -6.9 (14.6) 168 -5.2 (15.76) 0.6 % -1.70 [ -4.95, 1.55 ]
ADAPT 2005 123 -1 (11.32) 118 1 (11.08) 0.8 % -2.00 [ -4.83, 0.83 ]
Aldana (CHIP) 2005 64 -5.9 (13.26) 79 -5.4 (14.36) 0.3 % -0.50 [ -5.04, 4.04 ]
Applegate 1992 21 -8.7 (11.7) 26 -4.5 (9.7) 0.2 % -4.20 [ -10.44, 2.04 ]
Blumenthal 2000 46 -7.4 (9.31) 22 -0.9 (9.31) 0.3 % -6.50 [ -11.23, -1.77 ]
Cakir 2006 30 -8.8 (5.2) 30 1.2 (5.3) 0.9 % -10.00 [ -12.66, -7.34 ]
CELL Study 1995 292 -1.2 (14.7) 310 0 (14.7) 1.2 % -1.20 [ -3.55, 1.15 ]
Change of Heart 1999 165 4.3 (15.4) 339 1.8 (21.61) 0.6 % 2.50 [ -0.79, 5.79 ]
Connell 1995 141 -5 (13.26) 255 -3 (14.36) 0.8 % -2.00 [ -4.81, 0.81 ]
Esposito 2004 55 -3 (3.94) 55 -1 (7.75) 1.2 % -2.00 [ -4.30, 0.30 ]
Family Heart 1994 M 1767 -7.3 (19.23) 2174 0 (19.23) 4.4 % -7.30 [ -8.51, -6.09 ]
Family Heart 1994 F 1217 -6.2 (20.43) 1402 0 (20.43) 2.6 % -6.20 [ -7.77, -4.63 ]
FARIS 1997 F 315 -3.9 (15.38) 343 -0.7 (15.38) 1.2 % -3.20 [ -5.55, -0.85 ]
FARIS 1997 M 219 -4.4 (15.38) 223 -0.6 (15.38) 0.8 % -3.80 [ -6.67, -0.93 ]
Finnish DPS 2001 256 -5 (14) 250 -1 (15) 1.0 % -4.00 [ -6.53, -1.47 ]
Garcia-Pena 2001 345 -6.8 (7.41) 338 -3.5 (17.46) 1.6 % -3.30 [ -5.32, -1.28 ]
Given 1984 62 -9.85 (12.7) 24 -4.79 (12.61) 0.2 % -5.06 [ -11.01, 0.89 ]
Hellenius 1993 39 -4 (12.6) 39 -1 (12.2) 0.2 % -3.00 [ -8.50, 2.50 ]
Iso 1994 53 -13.2 (11.52) 55 -17.4 (14.02) 0.3 % 4.20 [ -0.63, 9.03 ]
Jalkanen 1991 24 -8 (18.68) 25 -5 (18.33) 0.1 % -3.00 [ -13.37, 7.37 ]
Kastarinen 2002 360 -6.2 (5.66) 355 -4.2 (16) 2.1 % -2.00 [ -3.76, -0.24 ]
Lin 1996 471 -1 (18.52) 426 1 (19.52) 1.0 % -2.00 [ -4.50, 0.50 ]
-10 -5 0 5 10
Favours treatment Favours control
(Continued . . . )
124Multiple risk factor interventions for primary prevention of coronary heart disease (Review)
Copyright © 2011 The Cochrane Collaboration. Published by John Wiley & Sons, Ltd.

(. . . Continued)Study or subgroup Treatment Control Mean Difference Weight Mean Difference
N Mean(SD) N Mean(SD) IV,Fixed,95% CI IV,Fixed,95% CI
Lindahl 1999 93 -4.9 (19.3) 93 1.3 (18.3) 0.2 % -6.20 [ -11.61, -0.79 ]
Look AHEAD 2003 2496 -6.8 (14.13) 2463 -2.8 (10.53) 13.3 % -4.00 [ -4.69, -3.31 ]
Mattila 2003 331 -2.1 (12.53) 309 0 (12.56) 1.7 % -2.10 [ -4.05, -0.15 ]
Meland 1997 58 -4 (23.31) 52 0 (22.08) 0.1 % -4.00 [ -12.49, 4.49 ]
Muto 2001 152 0.5 (11.9) 150 2.9 (13.5) 0.8 % -2.40 [ -5.27, 0.47 ]
Nilsson 1992 31 -7.7 (17.77) 32 -3.8 (19.3) 0.1 % -3.90 [ -13.06, 5.26 ]
Nilsson 2001 43 -3.7 (20.31) 46 -1.2 (17.9) 0.1 % -2.50 [ -10.48, 5.48 ]
Oldroyd 2001 35 -7.9 (16.7) 32 -0.27 (14.3) 0.1 % -7.63 [ -15.06, -0.20 ]
Oslo Diet Exercise 65 -5.9 (8.87) 43 -0.5 (11.15) 0.4 % -5.40 [ -9.37, -1.43 ]
OXCHECK 1994 2205 -2.5 (19.3) 1916 0 (20.4) 4.3 % -2.50 [ -3.72, -1.28 ]
Perez-Stable 1995 no prop 72 -9 (12.99) 72 -6.7 (13.2) 0.4 % -2.30 [ -6.58, 1.98 ]
Perez-Stable 1995 prop 74 -8.3 (13.39) 73 -11.6 (13.3) 0.3 % 3.30 [ -1.01, 7.61 ]
Proper 2003 75 -4.1 (4.25) 116 -5.2 (15.26) 0.7 % 1.10 [ -1.84, 4.04 ]
Rachmani 2005 71 -20 (4.75) 70 -12 (6.54) 1.8 % -8.00 [ -9.89, -6.11 ]
Sartorelli 2005 51 -0.8 (12.3) 53 3.1 (13) 0.3 % -3.90 [ -8.76, 0.96 ]
Sone (JDCS) 2002 990 1 (4.24) 983 1 (15.52) 6.3 % 0.0 [ -1.01, 1.01 ]
Stamler 1989 102 -2.6 (6.4) 99 -1.3 (6.1) 2.1 % -1.30 [ -3.03, 0.43 ]
Stefanick 1998 F 43 -3.1 (8.4) 45 -2.4 (7.6) 0.6 % -0.70 [ -4.05, 2.65 ]
Stefanick 1998 M 48 -3 (6.8) 46 0.3 (7.9) 0.7 % -3.30 [ -6.29, -0.31 ]
Swedish RIS 1994 235 -2 (18.4) 227 -0.2 (20.5) 0.5 % -1.80 [ -5.36, 1.76 ]
Toobert (MLP) 2005 163 -1.85 (4.81) 116 -2.18 (14.41) 0.9 % 0.33 [ -2.39, 3.05 ]
Tromso 1991 F 422 -2.16 (15.8) 387 2.1 (16.5) 1.3 % -4.26 [ -6.49, -2.03 ]
Tromso 1991 M 525 0.5 (15.6) 535 1.1 (16.5) 1.7 % -0.60 [ -2.53, 1.33 ]
WHLP 1998 253 -3.5 (12.18) 267 -1.2 (9.21) 1.8 % -2.30 [ -4.16, -0.44 ]
Wing 1998 32 -4.8 (15) 31 -1.5 (12) 0.1 % -3.30 [ -10.00, 3.40 ]
Subtotal (95% CI) 15090 15472 63.5 % -3.07 [ -3.38, -2.75 ]
Heterogeneity: Chi2 = 242.51, df = 48 (P<0.00001); I2 =80%
Test for overall effect: Z = 18.91 (P < 0.00001)
2 High rate of CVD
Finnish men 1985 575 -10 (18) 580 -4 (16) 1.7 % -6.00 [ -7.96, -4.04 ]
Gothenberg Study 1986 1464 -2 (20) 1404 0 (20) 3.0 % -2.00 [ -3.46, -0.54 ]
MRFIT Study 1982 5740 -13.9 (13.23) 5633 -8.6 (15.27) 23.2 % -5.30 [ -5.83, -4.77 ]
WHO Factories 1986 16949 2.67 (18.09) 1902 3.18 (18.14) 8.7 % -0.51 [ -1.37, 0.35 ]
-10 -5 0 5 10
Favours treatment Favours control
(Continued . . . )
125Multiple risk factor interventions for primary prevention of coronary heart disease (Review)
Copyright © 2011 The Cochrane Collaboration. Published by John Wiley & Sons, Ltd.
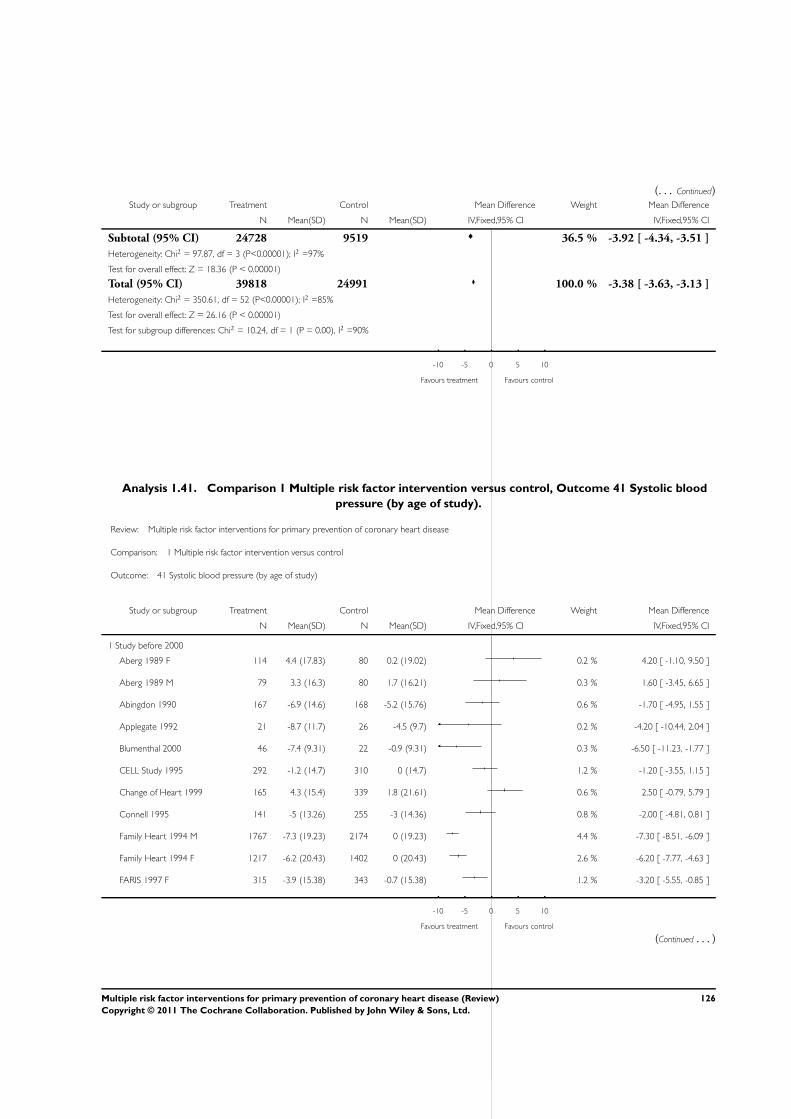
(. . . Continued)Study or subgroup Treatment Control Mean Difference Weight Mean Difference
N Mean(SD) N Mean(SD) IV,Fixed,95% CI IV,Fixed,95% CI
Subtotal (95% CI) 24728 9519 36.5 % -3.92 [ -4.34, -3.51 ]
Heterogeneity: Chi2 = 97.87, df = 3 (P<0.00001); I2 =97%
Test for overall effect: Z = 18.36 (P < 0.00001)
Total (95% CI) 39818 24991 100.0 % -3.38 [ -3.63, -3.13 ]
Heterogeneity: Chi2 = 350.61, df = 52 (P<0.00001); I2 =85%
Test for overall effect: Z = 26.16 (P < 0.00001)
Test for subgroup differences: Chi2 = 10.24, df = 1 (P = 0.00), I2 =90%
-10 -5 0 5 10
Favours treatment Favours control
Analysis 1.41. Comparison 1 Multiple risk factor intervention versus control, Outcome 41 Systolic blood
pressure (by age of study).
Review: Multiple risk factor interventions for primary prevention of coronary heart disease
Comparison: 1 Multiple risk factor intervention versus control
Outcome: 41 Systolic blood pressure (by age of study)
Study or subgroup Treatment Control Mean Difference Weight Mean Difference
N Mean(SD) N Mean(SD) IV,Fixed,95% CI IV,Fixed,95% CI
1 Study before 2000
Aberg 1989 F 114 4.4 (17.83) 80 0.2 (19.02) 0.2 % 4.20 [ -1.10, 9.50 ]
Aberg 1989 M 79 3.3 (16.3) 80 1.7 (16.21) 0.3 % 1.60 [ -3.45, 6.65 ]
Abingdon 1990 167 -6.9 (14.6) 168 -5.2 (15.76) 0.6 % -1.70 [ -4.95, 1.55 ]
Applegate 1992 21 -8.7 (11.7) 26 -4.5 (9.7) 0.2 % -4.20 [ -10.44, 2.04 ]
Blumenthal 2000 46 -7.4 (9.31) 22 -0.9 (9.31) 0.3 % -6.50 [ -11.23, -1.77 ]
CELL Study 1995 292 -1.2 (14.7) 310 0 (14.7) 1.2 % -1.20 [ -3.55, 1.15 ]
Change of Heart 1999 165 4.3 (15.4) 339 1.8 (21.61) 0.6 % 2.50 [ -0.79, 5.79 ]
Connell 1995 141 -5 (13.26) 255 -3 (14.36) 0.8 % -2.00 [ -4.81, 0.81 ]
Family Heart 1994 M 1767 -7.3 (19.23) 2174 0 (19.23) 4.4 % -7.30 [ -8.51, -6.09 ]
Family Heart 1994 F 1217 -6.2 (20.43) 1402 0 (20.43) 2.6 % -6.20 [ -7.77, -4.63 ]
FARIS 1997 F 315 -3.9 (15.38) 343 -0.7 (15.38) 1.2 % -3.20 [ -5.55, -0.85 ]
-10 -5 0 5 10
Favours treatment Favours control
(Continued . . . )
126Multiple risk factor interventions for primary prevention of coronary heart disease (Review)
Copyright © 2011 The Cochrane Collaboration. Published by John Wiley & Sons, Ltd.
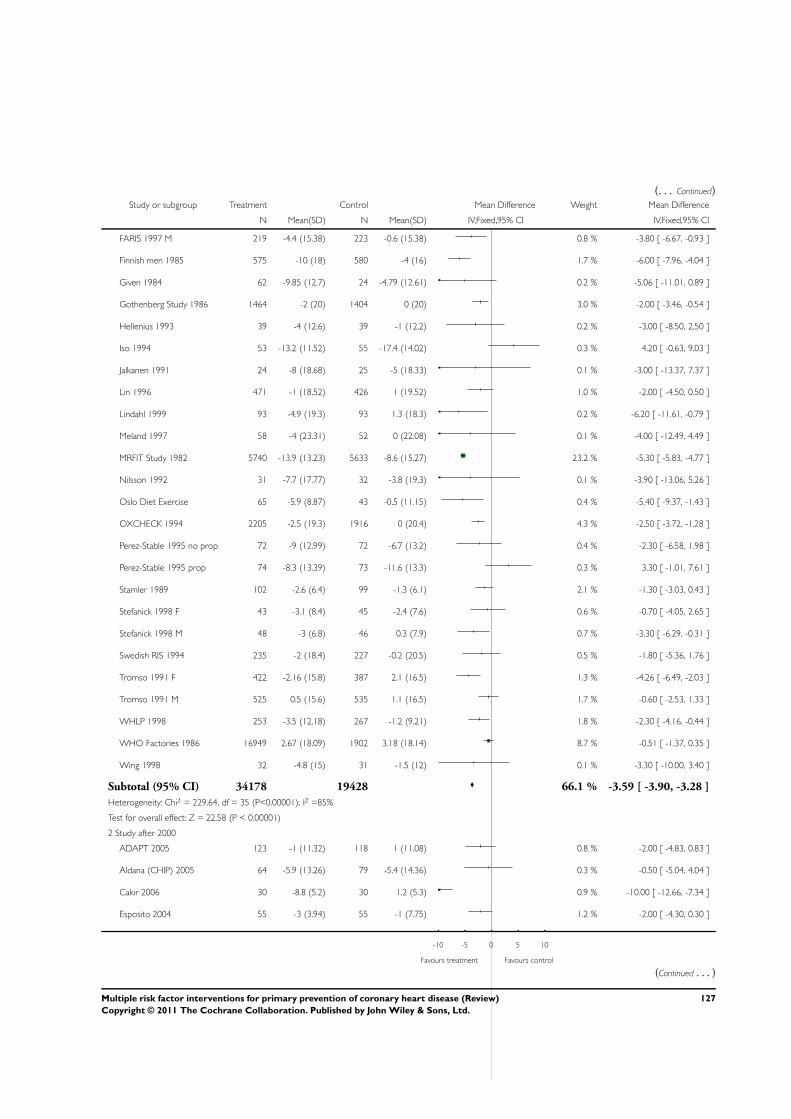
(. . . Continued)Study or subgroup Treatment Control Mean Difference Weight Mean Difference
N Mean(SD) N Mean(SD) IV,Fixed,95% CI IV,Fixed,95% CI
FARIS 1997 M 219 -4.4 (15.38) 223 -0.6 (15.38) 0.8 % -3.80 [ -6.67, -0.93 ]
Finnish men 1985 575 -10 (18) 580 -4 (16) 1.7 % -6.00 [ -7.96, -4.04 ]
Given 1984 62 -9.85 (12.7) 24 -4.79 (12.61) 0.2 % -5.06 [ -11.01, 0.89 ]
Gothenberg Study 1986 1464 -2 (20) 1404 0 (20) 3.0 % -2.00 [ -3.46, -0.54 ]
Hellenius 1993 39 -4 (12.6) 39 -1 (12.2) 0.2 % -3.00 [ -8.50, 2.50 ]
Iso 1994 53 -13.2 (11.52) 55 -17.4 (14.02) 0.3 % 4.20 [ -0.63, 9.03 ]
Jalkanen 1991 24 -8 (18.68) 25 -5 (18.33) 0.1 % -3.00 [ -13.37, 7.37 ]
Lin 1996 471 -1 (18.52) 426 1 (19.52) 1.0 % -2.00 [ -4.50, 0.50 ]
Lindahl 1999 93 -4.9 (19.3) 93 1.3 (18.3) 0.2 % -6.20 [ -11.61, -0.79 ]
Meland 1997 58 -4 (23.31) 52 0 (22.08) 0.1 % -4.00 [ -12.49, 4.49 ]
MRFIT Study 1982 5740 -13.9 (13.23) 5633 -8.6 (15.27) 23.2 % -5.30 [ -5.83, -4.77 ]
Nilsson 1992 31 -7.7 (17.77) 32 -3.8 (19.3) 0.1 % -3.90 [ -13.06, 5.26 ]
Oslo Diet Exercise 65 -5.9 (8.87) 43 -0.5 (11.15) 0.4 % -5.40 [ -9.37, -1.43 ]
OXCHECK 1994 2205 -2.5 (19.3) 1916 0 (20.4) 4.3 % -2.50 [ -3.72, -1.28 ]
Perez-Stable 1995 no prop 72 -9 (12.99) 72 -6.7 (13.2) 0.4 % -2.30 [ -6.58, 1.98 ]
Perez-Stable 1995 prop 74 -8.3 (13.39) 73 -11.6 (13.3) 0.3 % 3.30 [ -1.01, 7.61 ]
Stamler 1989 102 -2.6 (6.4) 99 -1.3 (6.1) 2.1 % -1.30 [ -3.03, 0.43 ]
Stefanick 1998 F 43 -3.1 (8.4) 45 -2.4 (7.6) 0.6 % -0.70 [ -4.05, 2.65 ]
Stefanick 1998 M 48 -3 (6.8) 46 0.3 (7.9) 0.7 % -3.30 [ -6.29, -0.31 ]
Swedish RIS 1994 235 -2 (18.4) 227 -0.2 (20.5) 0.5 % -1.80 [ -5.36, 1.76 ]
Tromso 1991 F 422 -2.16 (15.8) 387 2.1 (16.5) 1.3 % -4.26 [ -6.49, -2.03 ]
Tromso 1991 M 525 0.5 (15.6) 535 1.1 (16.5) 1.7 % -0.60 [ -2.53, 1.33 ]
WHLP 1998 253 -3.5 (12.18) 267 -1.2 (9.21) 1.8 % -2.30 [ -4.16, -0.44 ]
WHO Factories 1986 16949 2.67 (18.09) 1902 3.18 (18.14) 8.7 % -0.51 [ -1.37, 0.35 ]
Wing 1998 32 -4.8 (15) 31 -1.5 (12) 0.1 % -3.30 [ -10.00, 3.40 ]
Subtotal (95% CI) 34178 19428 66.1 % -3.59 [ -3.90, -3.28 ]
Heterogeneity: Chi2 = 229.64, df = 35 (P<0.00001); I2 =85%
Test for overall effect: Z = 22.58 (P < 0.00001)
2 Study after 2000
ADAPT 2005 123 -1 (11.32) 118 1 (11.08) 0.8 % -2.00 [ -4.83, 0.83 ]
Aldana (CHIP) 2005 64 -5.9 (13.26) 79 -5.4 (14.36) 0.3 % -0.50 [ -5.04, 4.04 ]
Cakir 2006 30 -8.8 (5.2) 30 1.2 (5.3) 0.9 % -10.00 [ -12.66, -7.34 ]
Esposito 2004 55 -3 (3.94) 55 -1 (7.75) 1.2 % -2.00 [ -4.30, 0.30 ]
-10 -5 0 5 10
Favours treatment Favours control
(Continued . . . )
127Multiple risk factor interventions for primary prevention of coronary heart disease (Review)
Copyright © 2011 The Cochrane Collaboration. Published by John Wiley & Sons, Ltd.
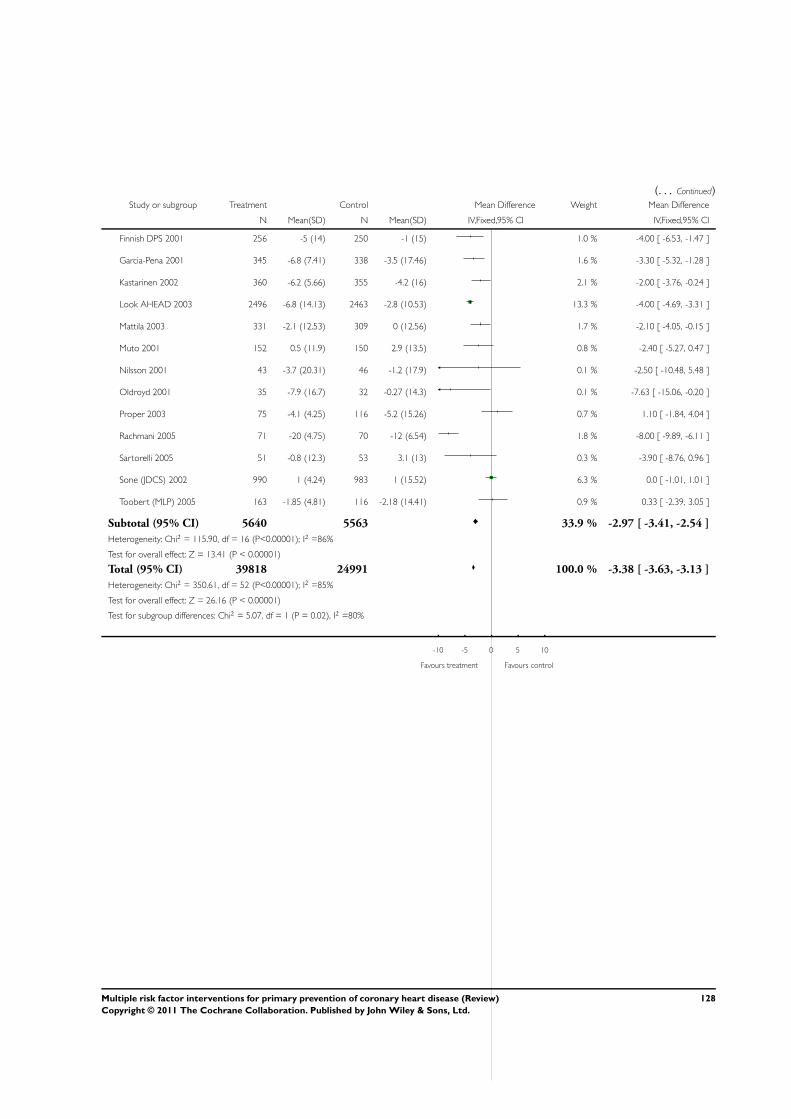
(. . . Continued)Study or subgroup Treatment Control Mean Difference Weight Mean Difference
N Mean(SD) N Mean(SD) IV,Fixed,95% CI IV,Fixed,95% CI
Finnish DPS 2001 256 -5 (14) 250 -1 (15) 1.0 % -4.00 [ -6.53, -1.47 ]
Garcia-Pena 2001 345 -6.8 (7.41) 338 -3.5 (17.46) 1.6 % -3.30 [ -5.32, -1.28 ]
Kastarinen 2002 360 -6.2 (5.66) 355 -4.2 (16) 2.1 % -2.00 [ -3.76, -0.24 ]
Look AHEAD 2003 2496 -6.8 (14.13) 2463 -2.8 (10.53) 13.3 % -4.00 [ -4.69, -3.31 ]
Mattila 2003 331 -2.1 (12.53) 309 0 (12.56) 1.7 % -2.10 [ -4.05, -0.15 ]
Muto 2001 152 0.5 (11.9) 150 2.9 (13.5) 0.8 % -2.40 [ -5.27, 0.47 ]
Nilsson 2001 43 -3.7 (20.31) 46 -1.2 (17.9) 0.1 % -2.50 [ -10.48, 5.48 ]
Oldroyd 2001 35 -7.9 (16.7) 32 -0.27 (14.3) 0.1 % -7.63 [ -15.06, -0.20 ]
Proper 2003 75 -4.1 (4.25) 116 -5.2 (15.26) 0.7 % 1.10 [ -1.84, 4.04 ]
Rachmani 2005 71 -20 (4.75) 70 -12 (6.54) 1.8 % -8.00 [ -9.89, -6.11 ]
Sartorelli 2005 51 -0.8 (12.3) 53 3.1 (13) 0.3 % -3.90 [ -8.76, 0.96 ]
Sone (JDCS) 2002 990 1 (4.24) 983 1 (15.52) 6.3 % 0.0 [ -1.01, 1.01 ]
Toobert (MLP) 2005 163 -1.85 (4.81) 116 -2.18 (14.41) 0.9 % 0.33 [ -2.39, 3.05 ]
Subtotal (95% CI) 5640 5563 33.9 % -2.97 [ -3.41, -2.54 ]
Heterogeneity: Chi2 = 115.90, df = 16 (P<0.00001); I2 =86%
Test for overall effect: Z = 13.41 (P < 0.00001)
Total (95% CI) 39818 24991 100.0 % -3.38 [ -3.63, -3.13 ]
Heterogeneity: Chi2 = 350.61, df = 52 (P<0.00001); I2 =85%
Test for overall effect: Z = 26.16 (P < 0.00001)
Test for subgroup differences: Chi2 = 5.07, df = 1 (P = 0.02), I2 =80%
-10 -5 0 5 10
Favours treatment Favours control
128Multiple risk factor interventions for primary prevention of coronary heart disease (Review)
Copyright © 2011 The Cochrane Collaboration. Published by John Wiley & Sons, Ltd.
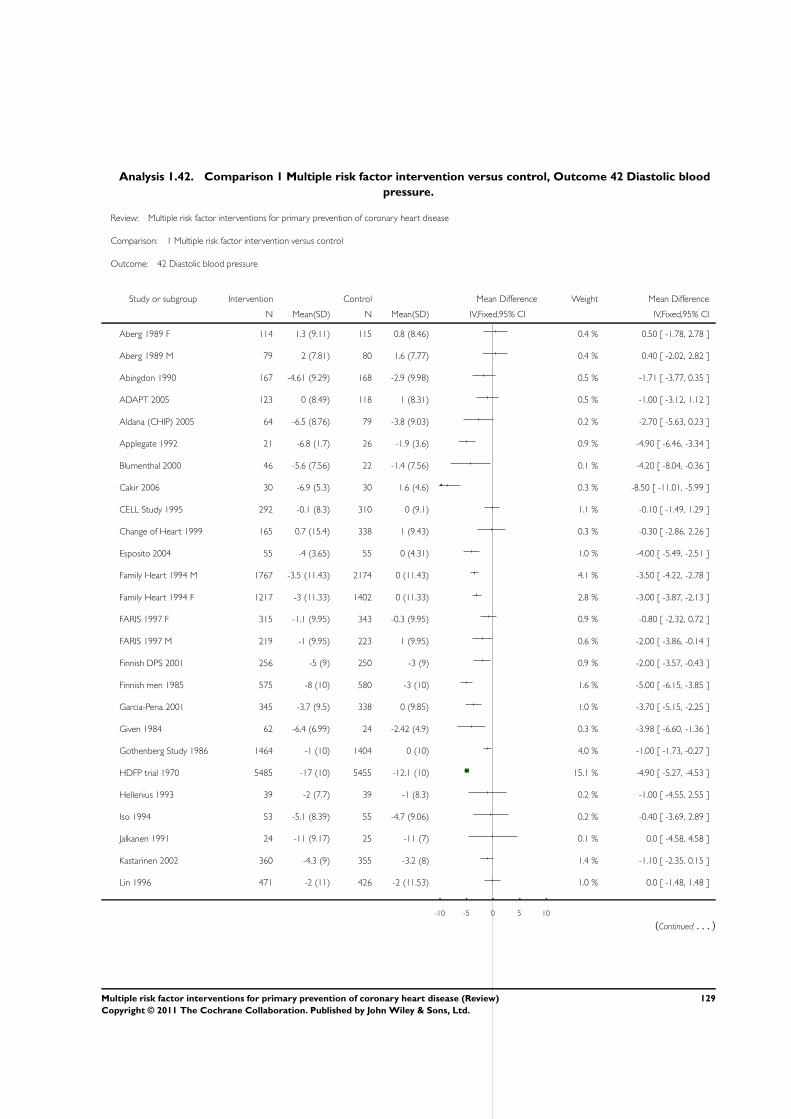
Analysis 1.42. Comparison 1 Multiple risk factor intervention versus control, Outcome 42 Diastolic blood
pressure.
Review: Multiple risk factor interventions for primary prevention of coronary heart disease
Comparison: 1 Multiple risk factor intervention versus control
Outcome: 42 Diastolic blood pressure
Study or subgroup Intervention Control Mean Difference Weight Mean Difference
N Mean(SD) N Mean(SD) IV,Fixed,95% CI IV,Fixed,95% CI
Aberg 1989 F 114 1.3 (9.11) 115 0.8 (8.46) 0.4 % 0.50 [ -1.78, 2.78 ]
Aberg 1989 M 79 2 (7.81) 80 1.6 (7.77) 0.4 % 0.40 [ -2.02, 2.82 ]
Abingdon 1990 167 -4.61 (9.29) 168 -2.9 (9.98) 0.5 % -1.71 [ -3.77, 0.35 ]
ADAPT 2005 123 0 (8.49) 118 1 (8.31) 0.5 % -1.00 [ -3.12, 1.12 ]
Aldana (CHIP) 2005 64 -6.5 (8.76) 79 -3.8 (9.03) 0.2 % -2.70 [ -5.63, 0.23 ]
Applegate 1992 21 -6.8 (1.7) 26 -1.9 (3.6) 0.9 % -4.90 [ -6.46, -3.34 ]
Blumenthal 2000 46 -5.6 (7.56) 22 -1.4 (7.56) 0.1 % -4.20 [ -8.04, -0.36 ]
Cakir 2006 30 -6.9 (5.3) 30 1.6 (4.6) 0.3 % -8.50 [ -11.01, -5.99 ]
CELL Study 1995 292 -0.1 (8.3) 310 0 (9.1) 1.1 % -0.10 [ -1.49, 1.29 ]
Change of Heart 1999 165 0.7 (15.4) 338 1 (9.43) 0.3 % -0.30 [ -2.86, 2.26 ]
Esposito 2004 55 -4 (3.65) 55 0 (4.31) 1.0 % -4.00 [ -5.49, -2.51 ]
Family Heart 1994 M 1767 -3.5 (11.43) 2174 0 (11.43) 4.1 % -3.50 [ -4.22, -2.78 ]
Family Heart 1994 F 1217 -3 (11.33) 1402 0 (11.33) 2.8 % -3.00 [ -3.87, -2.13 ]
FARIS 1997 F 315 -1.1 (9.95) 343 -0.3 (9.95) 0.9 % -0.80 [ -2.32, 0.72 ]
FARIS 1997 M 219 -1 (9.95) 223 1 (9.95) 0.6 % -2.00 [ -3.86, -0.14 ]
Finnish DPS 2001 256 -5 (9) 250 -3 (9) 0.9 % -2.00 [ -3.57, -0.43 ]
Finnish men 1985 575 -8 (10) 580 -3 (10) 1.6 % -5.00 [ -6.15, -3.85 ]
Garcia-Pena 2001 345 -3.7 (9.5) 338 0 (9.85) 1.0 % -3.70 [ -5.15, -2.25 ]
Given 1984 62 -6.4 (6.99) 24 -2.42 (4.9) 0.3 % -3.98 [ -6.60, -1.36 ]
Gothenberg Study 1986 1464 -1 (10) 1404 0 (10) 4.0 % -1.00 [ -1.73, -0.27 ]
HDFP trial 1970 5485 -17 (10) 5455 -12.1 (10) 15.1 % -4.90 [ -5.27, -4.53 ]
Hellenius 1993 39 -2 (7.7) 39 -1 (8.3) 0.2 % -1.00 [ -4.55, 2.55 ]
Iso 1994 53 -5.1 (8.39) 55 -4.7 (9.06) 0.2 % -0.40 [ -3.69, 2.89 ]
Jalkanen 1991 24 -11 (9.17) 25 -11 (7) 0.1 % 0.0 [ -4.58, 4.58 ]
Kastarinen 2002 360 -4.3 (9) 355 -3.2 (8) 1.4 % -1.10 [ -2.35, 0.15 ]
Lin 1996 471 -2 (11) 426 -2 (11.53) 1.0 % 0.0 [ -1.48, 1.48 ]
-10 -5 0 5 10
(Continued . . . )
129Multiple risk factor interventions for primary prevention of coronary heart disease (Review)
Copyright © 2011 The Cochrane Collaboration. Published by John Wiley & Sons, Ltd.
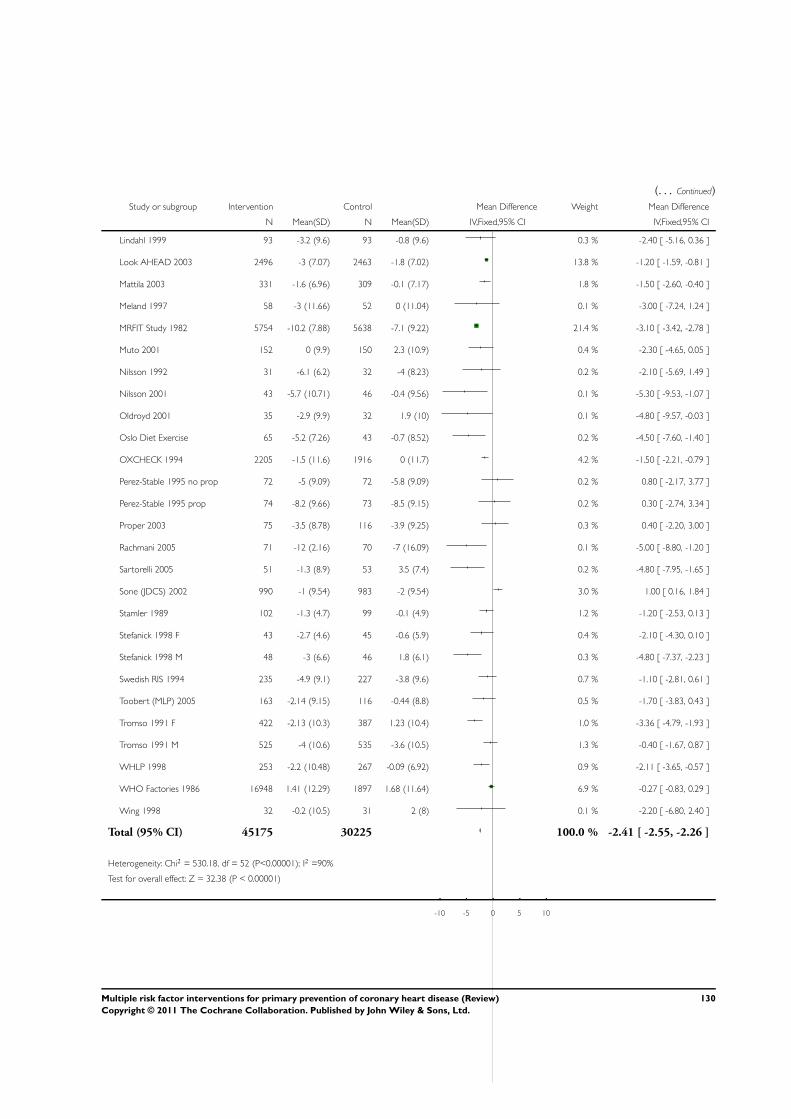
(. . . Continued)
Study or subgroup Intervention Control Mean Difference Weight Mean Difference
N Mean(SD) N Mean(SD) IV,Fixed,95% CI IV,Fixed,95% CI
Lindahl 1999 93 -3.2 (9.6) 93 -0.8 (9.6) 0.3 % -2.40 [ -5.16, 0.36 ]
Look AHEAD 2003 2496 -3 (7.07) 2463 -1.8 (7.02) 13.8 % -1.20 [ -1.59, -0.81 ]
Mattila 2003 331 -1.6 (6.96) 309 -0.1 (7.17) 1.8 % -1.50 [ -2.60, -0.40 ]
Meland 1997 58 -3 (11.66) 52 0 (11.04) 0.1 % -3.00 [ -7.24, 1.24 ]
MRFIT Study 1982 5754 -10.2 (7.88) 5638 -7.1 (9.22) 21.4 % -3.10 [ -3.42, -2.78 ]
Muto 2001 152 0 (9.9) 150 2.3 (10.9) 0.4 % -2.30 [ -4.65, 0.05 ]
Nilsson 1992 31 -6.1 (6.2) 32 -4 (8.23) 0.2 % -2.10 [ -5.69, 1.49 ]
Nilsson 2001 43 -5.7 (10.71) 46 -0.4 (9.56) 0.1 % -5.30 [ -9.53, -1.07 ]
Oldroyd 2001 35 -2.9 (9.9) 32 1.9 (10) 0.1 % -4.80 [ -9.57, -0.03 ]
Oslo Diet Exercise 65 -5.2 (7.26) 43 -0.7 (8.52) 0.2 % -4.50 [ -7.60, -1.40 ]
OXCHECK 1994 2205 -1.5 (11.6) 1916 0 (11.7) 4.2 % -1.50 [ -2.21, -0.79 ]
Perez-Stable 1995 no prop 72 -5 (9.09) 72 -5.8 (9.09) 0.2 % 0.80 [ -2.17, 3.77 ]
Perez-Stable 1995 prop 74 -8.2 (9.66) 73 -8.5 (9.15) 0.2 % 0.30 [ -2.74, 3.34 ]
Proper 2003 75 -3.5 (8.78) 116 -3.9 (9.25) 0.3 % 0.40 [ -2.20, 3.00 ]
Rachmani 2005 71 -12 (2.16) 70 -7 (16.09) 0.1 % -5.00 [ -8.80, -1.20 ]
Sartorelli 2005 51 -1.3 (8.9) 53 3.5 (7.4) 0.2 % -4.80 [ -7.95, -1.65 ]
Sone (JDCS) 2002 990 -1 (9.54) 983 -2 (9.54) 3.0 % 1.00 [ 0.16, 1.84 ]
Stamler 1989 102 -1.3 (4.7) 99 -0.1 (4.9) 1.2 % -1.20 [ -2.53, 0.13 ]
Stefanick 1998 F 43 -2.7 (4.6) 45 -0.6 (5.9) 0.4 % -2.10 [ -4.30, 0.10 ]
Stefanick 1998 M 48 -3 (6.6) 46 1.8 (6.1) 0.3 % -4.80 [ -7.37, -2.23 ]
Swedish RIS 1994 235 -4.9 (9.1) 227 -3.8 (9.6) 0.7 % -1.10 [ -2.81, 0.61 ]
Toobert (MLP) 2005 163 -2.14 (9.15) 116 -0.44 (8.8) 0.5 % -1.70 [ -3.83, 0.43 ]
Tromso 1991 F 422 -2.13 (10.3) 387 1.23 (10.4) 1.0 % -3.36 [ -4.79, -1.93 ]
Tromso 1991 M 525 -4 (10.6) 535 -3.6 (10.5) 1.3 % -0.40 [ -1.67, 0.87 ]
WHLP 1998 253 -2.2 (10.48) 267 -0.09 (6.92) 0.9 % -2.11 [ -3.65, -0.57 ]
WHO Factories 1986 16948 1.41 (12.29) 1897 1.68 (11.64) 6.9 % -0.27 [ -0.83, 0.29 ]
Wing 1998 32 -0.2 (10.5) 31 2 (8) 0.1 % -2.20 [ -6.80, 2.40 ]
Total (95% CI) 45175 30225 100.0 % -2.41 [ -2.55, -2.26 ]
Heterogeneity: Chi2 = 530.18, df = 52 (P<0.00001); I2 =90%
Test for overall effect: Z = 32.38 (P < 0.00001)
-10 -5 0 5 10
130Multiple risk factor interventions for primary prevention of coronary heart disease (Review)
Copyright © 2011 The Cochrane Collaboration. Published by John Wiley & Sons, Ltd.
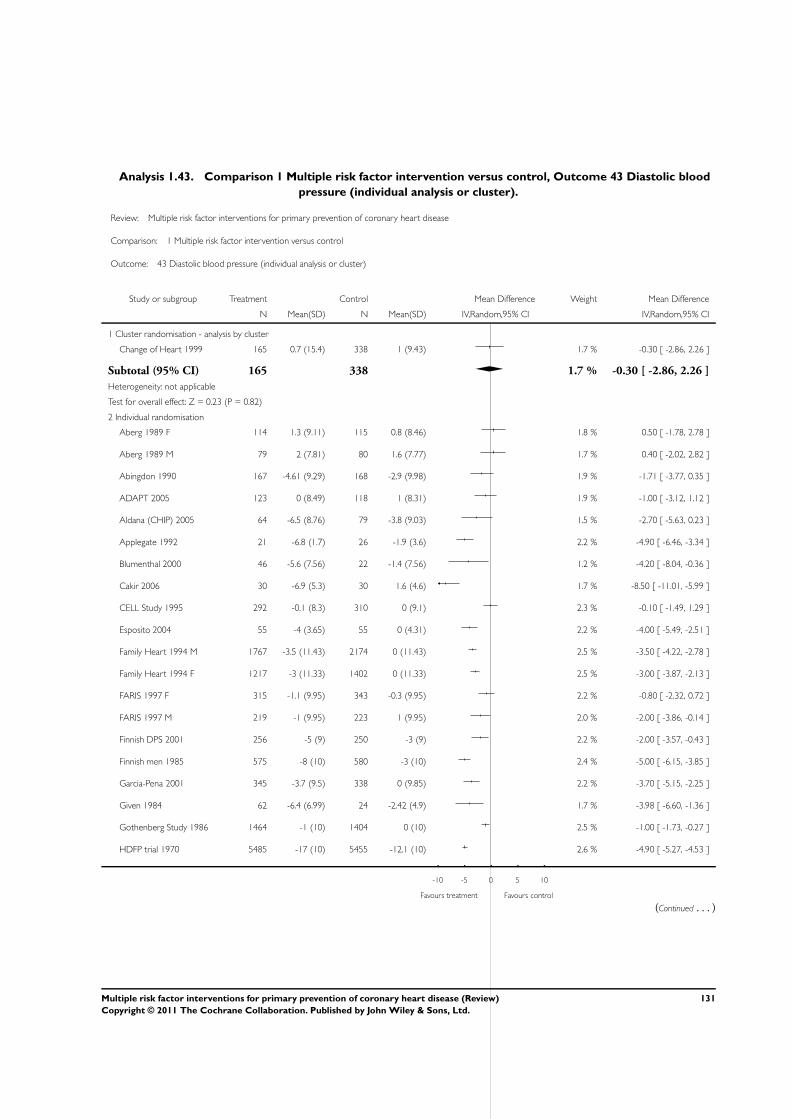
Analysis 1.43. Comparison 1 Multiple risk factor intervention versus control, Outcome 43 Diastolic blood
pressure (individual analysis or cluster).
Review: Multiple risk factor interventions for primary prevention of coronary heart disease
Comparison: 1 Multiple risk factor intervention versus control
Outcome: 43 Diastolic blood pressure (individual analysis or cluster)
Study or subgroup Treatment Control Mean Difference Weight Mean Difference
N Mean(SD) N Mean(SD) IV,Random,95% CI IV,Random,95% CI
1 Cluster randomisation - analysis by cluster
Change of Heart 1999 165 0.7 (15.4) 338 1 (9.43) 1.7 % -0.30 [ -2.86, 2.26 ]
Subtotal (95% CI) 165 338 1.7 % -0.30 [ -2.86, 2.26 ]
Heterogeneity: not applicable
Test for overall effect: Z = 0.23 (P = 0.82)
2 Individual randomisation
Aberg 1989 F 114 1.3 (9.11) 115 0.8 (8.46) 1.8 % 0.50 [ -1.78, 2.78 ]
Aberg 1989 M 79 2 (7.81) 80 1.6 (7.77) 1.7 % 0.40 [ -2.02, 2.82 ]
Abingdon 1990 167 -4.61 (9.29) 168 -2.9 (9.98) 1.9 % -1.71 [ -3.77, 0.35 ]
ADAPT 2005 123 0 (8.49) 118 1 (8.31) 1.9 % -1.00 [ -3.12, 1.12 ]
Aldana (CHIP) 2005 64 -6.5 (8.76) 79 -3.8 (9.03) 1.5 % -2.70 [ -5.63, 0.23 ]
Applegate 1992 21 -6.8 (1.7) 26 -1.9 (3.6) 2.2 % -4.90 [ -6.46, -3.34 ]
Blumenthal 2000 46 -5.6 (7.56) 22 -1.4 (7.56) 1.2 % -4.20 [ -8.04, -0.36 ]
Cakir 2006 30 -6.9 (5.3) 30 1.6 (4.6) 1.7 % -8.50 [ -11.01, -5.99 ]
CELL Study 1995 292 -0.1 (8.3) 310 0 (9.1) 2.3 % -0.10 [ -1.49, 1.29 ]
Esposito 2004 55 -4 (3.65) 55 0 (4.31) 2.2 % -4.00 [ -5.49, -2.51 ]
Family Heart 1994 M 1767 -3.5 (11.43) 2174 0 (11.43) 2.5 % -3.50 [ -4.22, -2.78 ]
Family Heart 1994 F 1217 -3 (11.33) 1402 0 (11.33) 2.5 % -3.00 [ -3.87, -2.13 ]
FARIS 1997 F 315 -1.1 (9.95) 343 -0.3 (9.95) 2.2 % -0.80 [ -2.32, 0.72 ]
FARIS 1997 M 219 -1 (9.95) 223 1 (9.95) 2.0 % -2.00 [ -3.86, -0.14 ]
Finnish DPS 2001 256 -5 (9) 250 -3 (9) 2.2 % -2.00 [ -3.57, -0.43 ]
Finnish men 1985 575 -8 (10) 580 -3 (10) 2.4 % -5.00 [ -6.15, -3.85 ]
Garcia-Pena 2001 345 -3.7 (9.5) 338 0 (9.85) 2.2 % -3.70 [ -5.15, -2.25 ]
Given 1984 62 -6.4 (6.99) 24 -2.42 (4.9) 1.7 % -3.98 [ -6.60, -1.36 ]
Gothenberg Study 1986 1464 -1 (10) 1404 0 (10) 2.5 % -1.00 [ -1.73, -0.27 ]
HDFP trial 1970 5485 -17 (10) 5455 -12.1 (10) 2.6 % -4.90 [ -5.27, -4.53 ]
-10 -5 0 5 10
Favours treatment Favours control
(Continued . . . )
131Multiple risk factor interventions for primary prevention of coronary heart disease (Review)
Copyright © 2011 The Cochrane Collaboration. Published by John Wiley & Sons, Ltd.
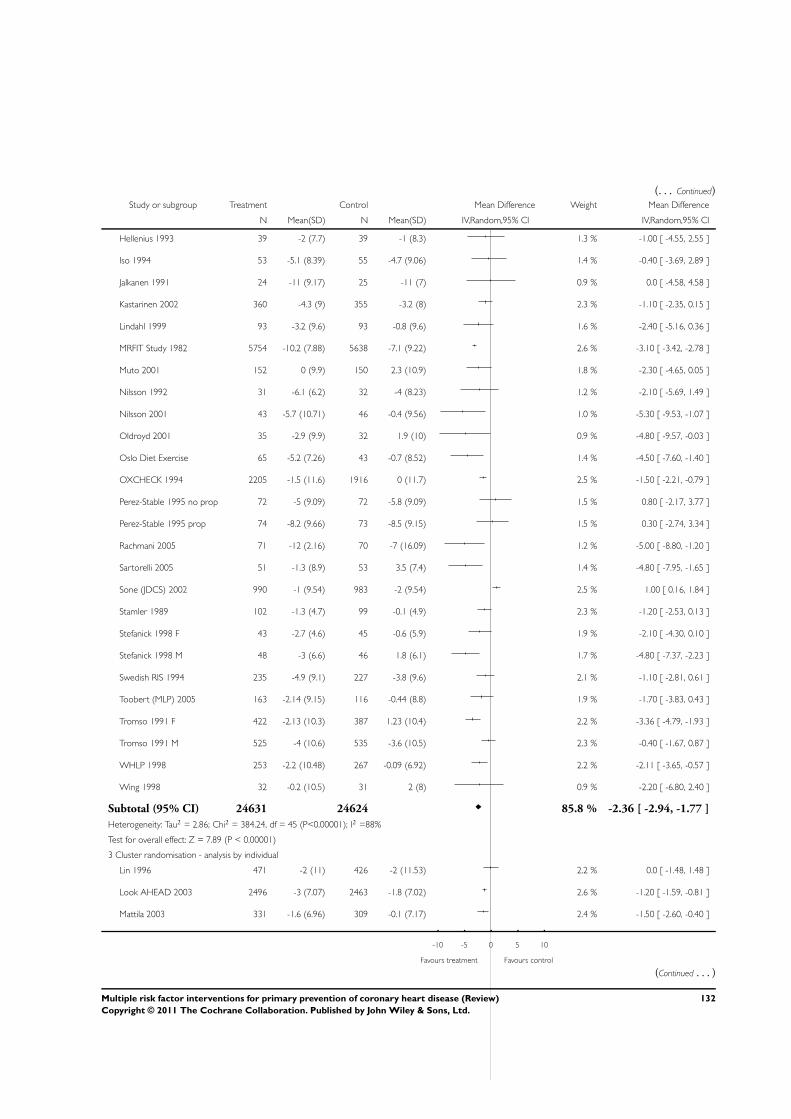
(. . . Continued)Study or subgroup Treatment Control Mean Difference Weight Mean Difference
N Mean(SD) N Mean(SD) IV,Random,95% CI IV,Random,95% CI
Hellenius 1993 39 -2 (7.7) 39 -1 (8.3) 1.3 % -1.00 [ -4.55, 2.55 ]
Iso 1994 53 -5.1 (8.39) 55 -4.7 (9.06) 1.4 % -0.40 [ -3.69, 2.89 ]
Jalkanen 1991 24 -11 (9.17) 25 -11 (7) 0.9 % 0.0 [ -4.58, 4.58 ]
Kastarinen 2002 360 -4.3 (9) 355 -3.2 (8) 2.3 % -1.10 [ -2.35, 0.15 ]
Lindahl 1999 93 -3.2 (9.6) 93 -0.8 (9.6) 1.6 % -2.40 [ -5.16, 0.36 ]
MRFIT Study 1982 5754 -10.2 (7.88) 5638 -7.1 (9.22) 2.6 % -3.10 [ -3.42, -2.78 ]
Muto 2001 152 0 (9.9) 150 2.3 (10.9) 1.8 % -2.30 [ -4.65, 0.05 ]
Nilsson 1992 31 -6.1 (6.2) 32 -4 (8.23) 1.2 % -2.10 [ -5.69, 1.49 ]
Nilsson 2001 43 -5.7 (10.71) 46 -0.4 (9.56) 1.0 % -5.30 [ -9.53, -1.07 ]
Oldroyd 2001 35 -2.9 (9.9) 32 1.9 (10) 0.9 % -4.80 [ -9.57, -0.03 ]
Oslo Diet Exercise 65 -5.2 (7.26) 43 -0.7 (8.52) 1.4 % -4.50 [ -7.60, -1.40 ]
OXCHECK 1994 2205 -1.5 (11.6) 1916 0 (11.7) 2.5 % -1.50 [ -2.21, -0.79 ]
Perez-Stable 1995 no prop 72 -5 (9.09) 72 -5.8 (9.09) 1.5 % 0.80 [ -2.17, 3.77 ]
Perez-Stable 1995 prop 74 -8.2 (9.66) 73 -8.5 (9.15) 1.5 % 0.30 [ -2.74, 3.34 ]
Rachmani 2005 71 -12 (2.16) 70 -7 (16.09) 1.2 % -5.00 [ -8.80, -1.20 ]
Sartorelli 2005 51 -1.3 (8.9) 53 3.5 (7.4) 1.4 % -4.80 [ -7.95, -1.65 ]
Sone (JDCS) 2002 990 -1 (9.54) 983 -2 (9.54) 2.5 % 1.00 [ 0.16, 1.84 ]
Stamler 1989 102 -1.3 (4.7) 99 -0.1 (4.9) 2.3 % -1.20 [ -2.53, 0.13 ]
Stefanick 1998 F 43 -2.7 (4.6) 45 -0.6 (5.9) 1.9 % -2.10 [ -4.30, 0.10 ]
Stefanick 1998 M 48 -3 (6.6) 46 1.8 (6.1) 1.7 % -4.80 [ -7.37, -2.23 ]
Swedish RIS 1994 235 -4.9 (9.1) 227 -3.8 (9.6) 2.1 % -1.10 [ -2.81, 0.61 ]
Toobert (MLP) 2005 163 -2.14 (9.15) 116 -0.44 (8.8) 1.9 % -1.70 [ -3.83, 0.43 ]
Tromso 1991 F 422 -2.13 (10.3) 387 1.23 (10.4) 2.2 % -3.36 [ -4.79, -1.93 ]
Tromso 1991 M 525 -4 (10.6) 535 -3.6 (10.5) 2.3 % -0.40 [ -1.67, 0.87 ]
WHLP 1998 253 -2.2 (10.48) 267 -0.09 (6.92) 2.2 % -2.11 [ -3.65, -0.57 ]
Wing 1998 32 -0.2 (10.5) 31 2 (8) 0.9 % -2.20 [ -6.80, 2.40 ]
Subtotal (95% CI) 24631 24624 85.8 % -2.36 [ -2.94, -1.77 ]
Heterogeneity: Tau2 = 2.86; Chi2 = 384.24, df = 45 (P<0.00001); I2 =88%
Test for overall effect: Z = 7.89 (P < 0.00001)
3 Cluster randomisation - analysis by individual
Lin 1996 471 -2 (11) 426 -2 (11.53) 2.2 % 0.0 [ -1.48, 1.48 ]
Look AHEAD 2003 2496 -3 (7.07) 2463 -1.8 (7.02) 2.6 % -1.20 [ -1.59, -0.81 ]
Mattila 2003 331 -1.6 (6.96) 309 -0.1 (7.17) 2.4 % -1.50 [ -2.60, -0.40 ]
-10 -5 0 5 10
Favours treatment Favours control
(Continued . . . )
132Multiple risk factor interventions for primary prevention of coronary heart disease (Review)
Copyright © 2011 The Cochrane Collaboration. Published by John Wiley & Sons, Ltd.
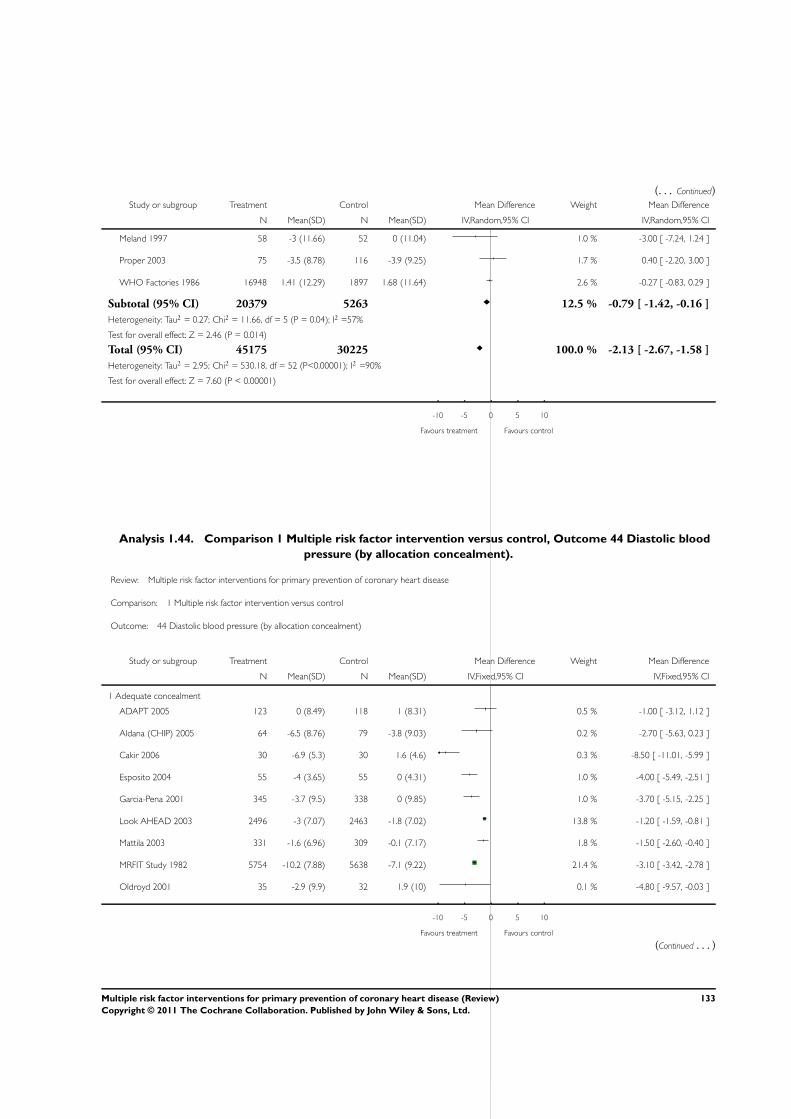
(. . . Continued)Study or subgroup Treatment Control Mean Difference Weight Mean Difference
N Mean(SD) N Mean(SD) IV,Random,95% CI IV,Random,95% CI
Meland 1997 58 -3 (11.66) 52 0 (11.04) 1.0 % -3.00 [ -7.24, 1.24 ]
Proper 2003 75 -3.5 (8.78) 116 -3.9 (9.25) 1.7 % 0.40 [ -2.20, 3.00 ]
WHO Factories 1986 16948 1.41 (12.29) 1897 1.68 (11.64) 2.6 % -0.27 [ -0.83, 0.29 ]
Subtotal (95% CI) 20379 5263 12.5 % -0.79 [ -1.42, -0.16 ]
Heterogeneity: Tau2 = 0.27; Chi2 = 11.66, df = 5 (P = 0.04); I2 =57%
Test for overall effect: Z = 2.46 (P = 0.014)
Total (95% CI) 45175 30225 100.0 % -2.13 [ -2.67, -1.58 ]
Heterogeneity: Tau2 = 2.95; Chi2 = 530.18, df = 52 (P<0.00001); I2 =90%
Test for overall effect: Z = 7.60 (P < 0.00001)
-10 -5 0 5 10
Favours treatment Favours control
Analysis 1.44. Comparison 1 Multiple risk factor intervention versus control, Outcome 44 Diastolic blood
pressure (by allocation concealment).
Review: Multiple risk factor interventions for primary prevention of coronary heart disease
Comparison: 1 Multiple risk factor intervention versus control
Outcome: 44 Diastolic blood pressure (by allocation concealment)
Study or subgroup Treatment Control Mean Difference Weight Mean Difference
N Mean(SD) N Mean(SD) IV,Fixed,95% CI IV,Fixed,95% CI
1 Adequate concealment
ADAPT 2005 123 0 (8.49) 118 1 (8.31) 0.5 % -1.00 [ -3.12, 1.12 ]
Aldana (CHIP) 2005 64 -6.5 (8.76) 79 -3.8 (9.03) 0.2 % -2.70 [ -5.63, 0.23 ]
Cakir 2006 30 -6.9 (5.3) 30 1.6 (4.6) 0.3 % -8.50 [ -11.01, -5.99 ]
Esposito 2004 55 -4 (3.65) 55 0 (4.31) 1.0 % -4.00 [ -5.49, -2.51 ]
Garcia-Pena 2001 345 -3.7 (9.5) 338 0 (9.85) 1.0 % -3.70 [ -5.15, -2.25 ]
Look AHEAD 2003 2496 -3 (7.07) 2463 -1.8 (7.02) 13.8 % -1.20 [ -1.59, -0.81 ]
Mattila 2003 331 -1.6 (6.96) 309 -0.1 (7.17) 1.8 % -1.50 [ -2.60, -0.40 ]
MRFIT Study 1982 5754 -10.2 (7.88) 5638 -7.1 (9.22) 21.4 % -3.10 [ -3.42, -2.78 ]
Oldroyd 2001 35 -2.9 (9.9) 32 1.9 (10) 0.1 % -4.80 [ -9.57, -0.03 ]
-10 -5 0 5 10
Favours treatment Favours control
(Continued . . . )
133Multiple risk factor interventions for primary prevention of coronary heart disease (Review)
Copyright © 2011 The Cochrane Collaboration. Published by John Wiley & Sons, Ltd.
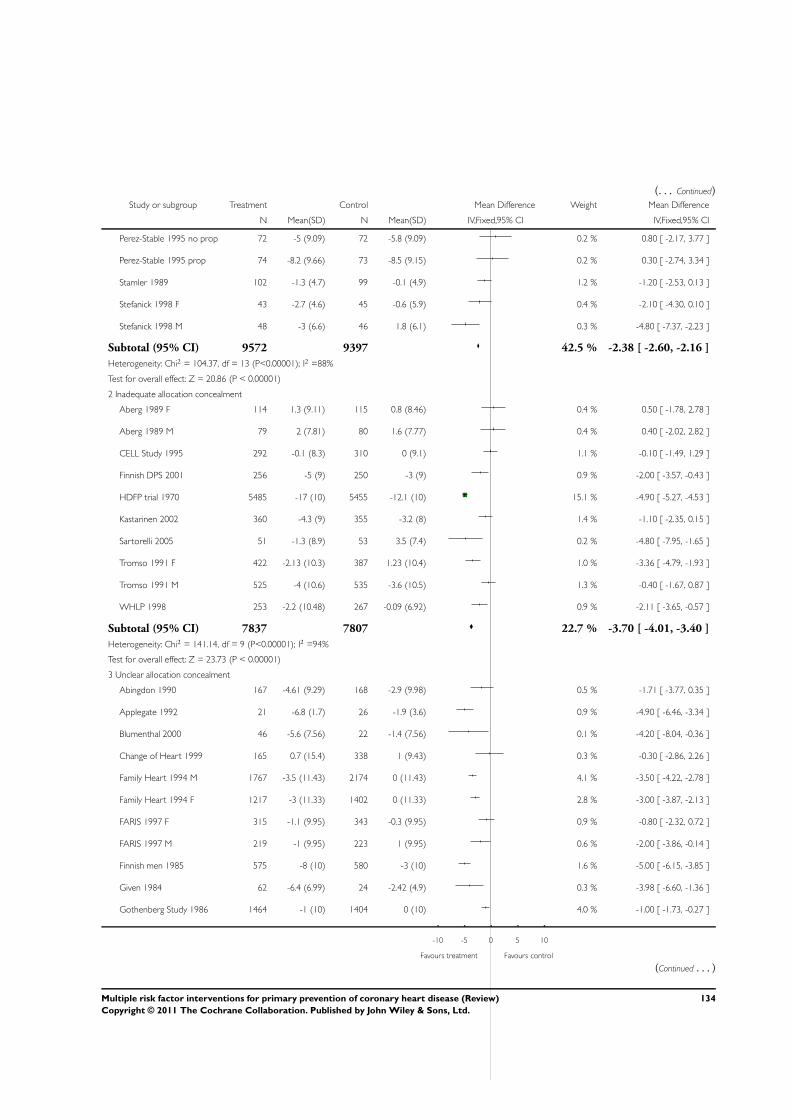
(. . . Continued)Study or subgroup Treatment Control Mean Difference Weight Mean Difference
N Mean(SD) N Mean(SD) IV,Fixed,95% CI IV,Fixed,95% CI
Perez-Stable 1995 no prop 72 -5 (9.09) 72 -5.8 (9.09) 0.2 % 0.80 [ -2.17, 3.77 ]
Perez-Stable 1995 prop 74 -8.2 (9.66) 73 -8.5 (9.15) 0.2 % 0.30 [ -2.74, 3.34 ]
Stamler 1989 102 -1.3 (4.7) 99 -0.1 (4.9) 1.2 % -1.20 [ -2.53, 0.13 ]
Stefanick 1998 F 43 -2.7 (4.6) 45 -0.6 (5.9) 0.4 % -2.10 [ -4.30, 0.10 ]
Stefanick 1998 M 48 -3 (6.6) 46 1.8 (6.1) 0.3 % -4.80 [ -7.37, -2.23 ]
Subtotal (95% CI) 9572 9397 42.5 % -2.38 [ -2.60, -2.16 ]
Heterogeneity: Chi2 = 104.37, df = 13 (P<0.00001); I2 =88%
Test for overall effect: Z = 20.86 (P < 0.00001)
2 Inadequate allocation concealment
Aberg 1989 F 114 1.3 (9.11) 115 0.8 (8.46) 0.4 % 0.50 [ -1.78, 2.78 ]
Aberg 1989 M 79 2 (7.81) 80 1.6 (7.77) 0.4 % 0.40 [ -2.02, 2.82 ]
CELL Study 1995 292 -0.1 (8.3) 310 0 (9.1) 1.1 % -0.10 [ -1.49, 1.29 ]
Finnish DPS 2001 256 -5 (9) 250 -3 (9) 0.9 % -2.00 [ -3.57, -0.43 ]
HDFP trial 1970 5485 -17 (10) 5455 -12.1 (10) 15.1 % -4.90 [ -5.27, -4.53 ]
Kastarinen 2002 360 -4.3 (9) 355 -3.2 (8) 1.4 % -1.10 [ -2.35, 0.15 ]
Sartorelli 2005 51 -1.3 (8.9) 53 3.5 (7.4) 0.2 % -4.80 [ -7.95, -1.65 ]
Tromso 1991 F 422 -2.13 (10.3) 387 1.23 (10.4) 1.0 % -3.36 [ -4.79, -1.93 ]
Tromso 1991 M 525 -4 (10.6) 535 -3.6 (10.5) 1.3 % -0.40 [ -1.67, 0.87 ]
WHLP 1998 253 -2.2 (10.48) 267 -0.09 (6.92) 0.9 % -2.11 [ -3.65, -0.57 ]
Subtotal (95% CI) 7837 7807 22.7 % -3.70 [ -4.01, -3.40 ]
Heterogeneity: Chi2 = 141.14, df = 9 (P<0.00001); I2 =94%
Test for overall effect: Z = 23.73 (P < 0.00001)
3 Unclear allocation concealment
Abingdon 1990 167 -4.61 (9.29) 168 -2.9 (9.98) 0.5 % -1.71 [ -3.77, 0.35 ]
Applegate 1992 21 -6.8 (1.7) 26 -1.9 (3.6) 0.9 % -4.90 [ -6.46, -3.34 ]
Blumenthal 2000 46 -5.6 (7.56) 22 -1.4 (7.56) 0.1 % -4.20 [ -8.04, -0.36 ]
Change of Heart 1999 165 0.7 (15.4) 338 1 (9.43) 0.3 % -0.30 [ -2.86, 2.26 ]
Family Heart 1994 M 1767 -3.5 (11.43) 2174 0 (11.43) 4.1 % -3.50 [ -4.22, -2.78 ]
Family Heart 1994 F 1217 -3 (11.33) 1402 0 (11.33) 2.8 % -3.00 [ -3.87, -2.13 ]
FARIS 1997 F 315 -1.1 (9.95) 343 -0.3 (9.95) 0.9 % -0.80 [ -2.32, 0.72 ]
FARIS 1997 M 219 -1 (9.95) 223 1 (9.95) 0.6 % -2.00 [ -3.86, -0.14 ]
Finnish men 1985 575 -8 (10) 580 -3 (10) 1.6 % -5.00 [ -6.15, -3.85 ]
Given 1984 62 -6.4 (6.99) 24 -2.42 (4.9) 0.3 % -3.98 [ -6.60, -1.36 ]
Gothenberg Study 1986 1464 -1 (10) 1404 0 (10) 4.0 % -1.00 [ -1.73, -0.27 ]
-10 -5 0 5 10
Favours treatment Favours control
(Continued . . . )
134Multiple risk factor interventions for primary prevention of coronary heart disease (Review)
Copyright © 2011 The Cochrane Collaboration. Published by John Wiley & Sons, Ltd.
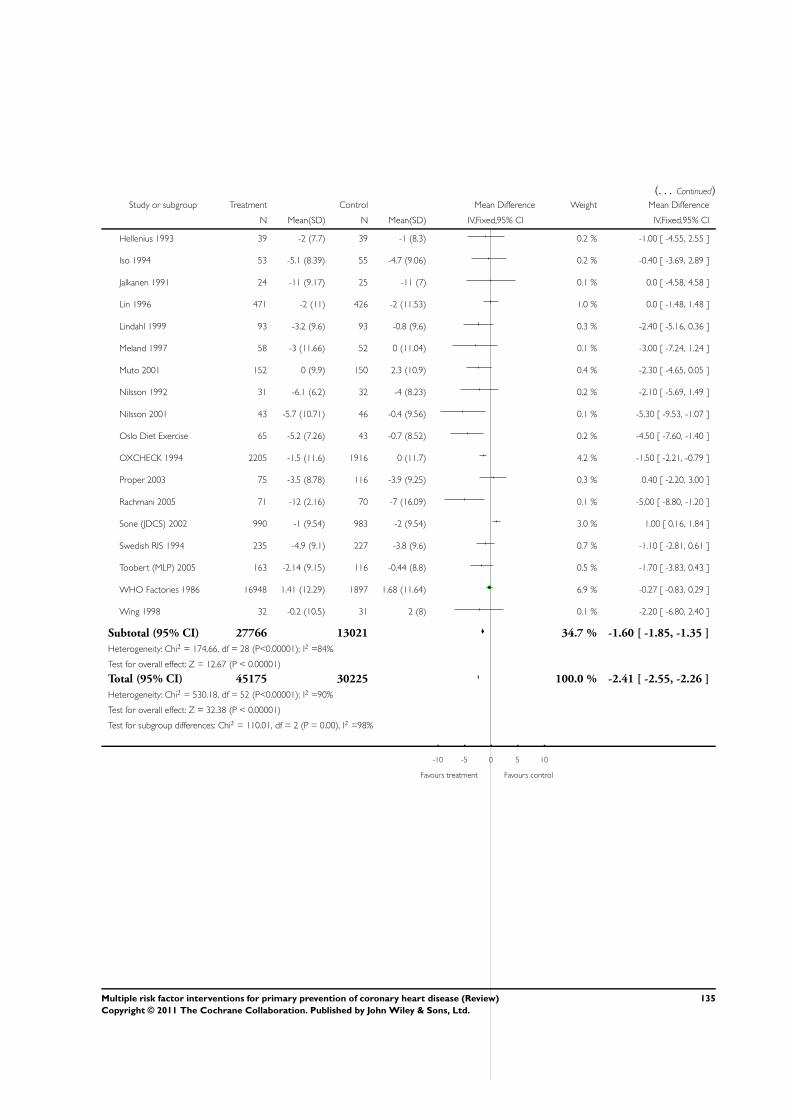
(. . . Continued)Study or subgroup Treatment Control Mean Difference Weight Mean Difference
N Mean(SD) N Mean(SD) IV,Fixed,95% CI IV,Fixed,95% CI
Hellenius 1993 39 -2 (7.7) 39 -1 (8.3) 0.2 % -1.00 [ -4.55, 2.55 ]
Iso 1994 53 -5.1 (8.39) 55 -4.7 (9.06) 0.2 % -0.40 [ -3.69, 2.89 ]
Jalkanen 1991 24 -11 (9.17) 25 -11 (7) 0.1 % 0.0 [ -4.58, 4.58 ]
Lin 1996 471 -2 (11) 426 -2 (11.53) 1.0 % 0.0 [ -1.48, 1.48 ]
Lindahl 1999 93 -3.2 (9.6) 93 -0.8 (9.6) 0.3 % -2.40 [ -5.16, 0.36 ]
Meland 1997 58 -3 (11.66) 52 0 (11.04) 0.1 % -3.00 [ -7.24, 1.24 ]
Muto 2001 152 0 (9.9) 150 2.3 (10.9) 0.4 % -2.30 [ -4.65, 0.05 ]
Nilsson 1992 31 -6.1 (6.2) 32 -4 (8.23) 0.2 % -2.10 [ -5.69, 1.49 ]
Nilsson 2001 43 -5.7 (10.71) 46 -0.4 (9.56) 0.1 % -5.30 [ -9.53, -1.07 ]
Oslo Diet Exercise 65 -5.2 (7.26) 43 -0.7 (8.52) 0.2 % -4.50 [ -7.60, -1.40 ]
OXCHECK 1994 2205 -1.5 (11.6) 1916 0 (11.7) 4.2 % -1.50 [ -2.21, -0.79 ]
Proper 2003 75 -3.5 (8.78) 116 -3.9 (9.25) 0.3 % 0.40 [ -2.20, 3.00 ]
Rachmani 2005 71 -12 (2.16) 70 -7 (16.09) 0.1 % -5.00 [ -8.80, -1.20 ]
Sone (JDCS) 2002 990 -1 (9.54) 983 -2 (9.54) 3.0 % 1.00 [ 0.16, 1.84 ]
Swedish RIS 1994 235 -4.9 (9.1) 227 -3.8 (9.6) 0.7 % -1.10 [ -2.81, 0.61 ]
Toobert (MLP) 2005 163 -2.14 (9.15) 116 -0.44 (8.8) 0.5 % -1.70 [ -3.83, 0.43 ]
WHO Factories 1986 16948 1.41 (12.29) 1897 1.68 (11.64) 6.9 % -0.27 [ -0.83, 0.29 ]
Wing 1998 32 -0.2 (10.5) 31 2 (8) 0.1 % -2.20 [ -6.80, 2.40 ]
Subtotal (95% CI) 27766 13021 34.7 % -1.60 [ -1.85, -1.35 ]
Heterogeneity: Chi2 = 174.66, df = 28 (P<0.00001); I2 =84%
Test for overall effect: Z = 12.67 (P < 0.00001)
Total (95% CI) 45175 30225 100.0 % -2.41 [ -2.55, -2.26 ]
Heterogeneity: Chi2 = 530.18, df = 52 (P<0.00001); I2 =90%
Test for overall effect: Z = 32.38 (P < 0.00001)
Test for subgroup differences: Chi2 = 110.01, df = 2 (P = 0.00), I2 =98%
-10 -5 0 5 10
Favours treatment Favours control
135Multiple risk factor interventions for primary prevention of coronary heart disease (Review)
Copyright © 2011 The Cochrane Collaboration. Published by John Wiley & Sons, Ltd.
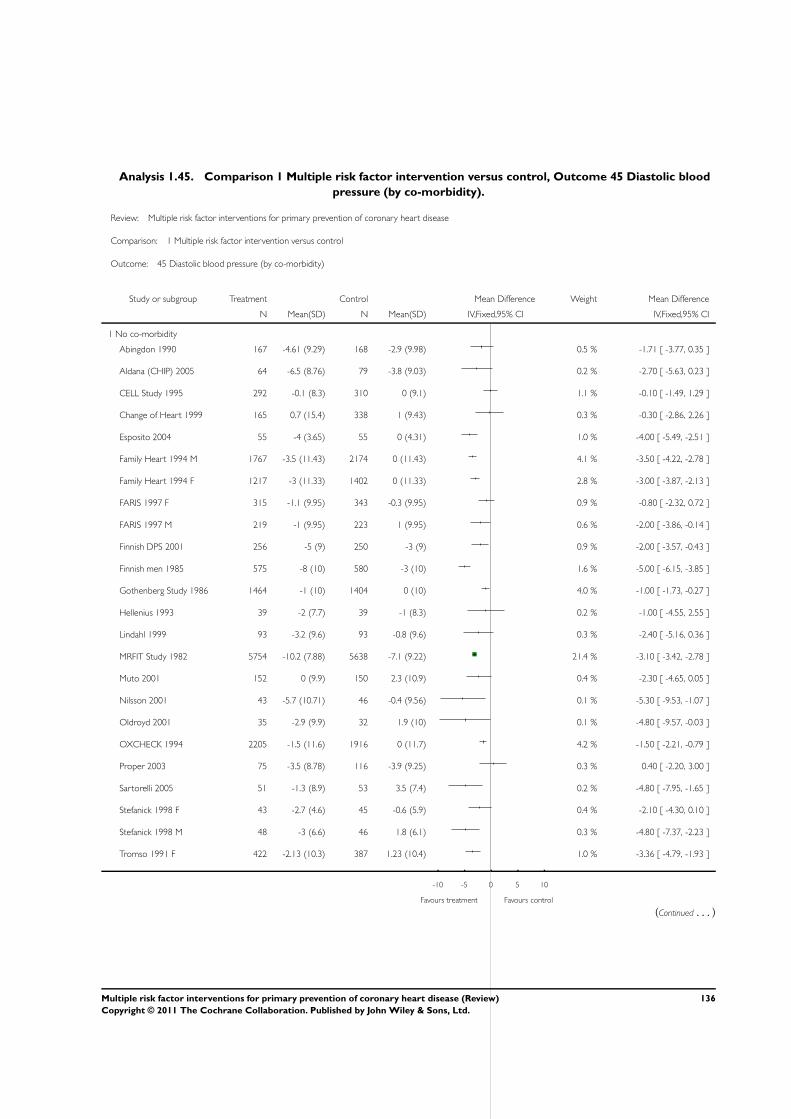
Analysis 1.45. Comparison 1 Multiple risk factor intervention versus control, Outcome 45 Diastolic blood
pressure (by co-morbidity).
Review: Multiple risk factor interventions for primary prevention of coronary heart disease
Comparison: 1 Multiple risk factor intervention versus control
Outcome: 45 Diastolic blood pressure (by co-morbidity)
Study or subgroup Treatment Control Mean Difference Weight Mean Difference
N Mean(SD) N Mean(SD) IV,Fixed,95% CI IV,Fixed,95% CI
1 No co-morbidity
Abingdon 1990 167 -4.61 (9.29) 168 -2.9 (9.98) 0.5 % -1.71 [ -3.77, 0.35 ]
Aldana (CHIP) 2005 64 -6.5 (8.76) 79 -3.8 (9.03) 0.2 % -2.70 [ -5.63, 0.23 ]
CELL Study 1995 292 -0.1 (8.3) 310 0 (9.1) 1.1 % -0.10 [ -1.49, 1.29 ]
Change of Heart 1999 165 0.7 (15.4) 338 1 (9.43) 0.3 % -0.30 [ -2.86, 2.26 ]
Esposito 2004 55 -4 (3.65) 55 0 (4.31) 1.0 % -4.00 [ -5.49, -2.51 ]
Family Heart 1994 M 1767 -3.5 (11.43) 2174 0 (11.43) 4.1 % -3.50 [ -4.22, -2.78 ]
Family Heart 1994 F 1217 -3 (11.33) 1402 0 (11.33) 2.8 % -3.00 [ -3.87, -2.13 ]
FARIS 1997 F 315 -1.1 (9.95) 343 -0.3 (9.95) 0.9 % -0.80 [ -2.32, 0.72 ]
FARIS 1997 M 219 -1 (9.95) 223 1 (9.95) 0.6 % -2.00 [ -3.86, -0.14 ]
Finnish DPS 2001 256 -5 (9) 250 -3 (9) 0.9 % -2.00 [ -3.57, -0.43 ]
Finnish men 1985 575 -8 (10) 580 -3 (10) 1.6 % -5.00 [ -6.15, -3.85 ]
Gothenberg Study 1986 1464 -1 (10) 1404 0 (10) 4.0 % -1.00 [ -1.73, -0.27 ]
Hellenius 1993 39 -2 (7.7) 39 -1 (8.3) 0.2 % -1.00 [ -4.55, 2.55 ]
Lindahl 1999 93 -3.2 (9.6) 93 -0.8 (9.6) 0.3 % -2.40 [ -5.16, 0.36 ]
MRFIT Study 1982 5754 -10.2 (7.88) 5638 -7.1 (9.22) 21.4 % -3.10 [ -3.42, -2.78 ]
Muto 2001 152 0 (9.9) 150 2.3 (10.9) 0.4 % -2.30 [ -4.65, 0.05 ]
Nilsson 2001 43 -5.7 (10.71) 46 -0.4 (9.56) 0.1 % -5.30 [ -9.53, -1.07 ]
Oldroyd 2001 35 -2.9 (9.9) 32 1.9 (10) 0.1 % -4.80 [ -9.57, -0.03 ]
OXCHECK 1994 2205 -1.5 (11.6) 1916 0 (11.7) 4.2 % -1.50 [ -2.21, -0.79 ]
Proper 2003 75 -3.5 (8.78) 116 -3.9 (9.25) 0.3 % 0.40 [ -2.20, 3.00 ]
Sartorelli 2005 51 -1.3 (8.9) 53 3.5 (7.4) 0.2 % -4.80 [ -7.95, -1.65 ]
Stefanick 1998 F 43 -2.7 (4.6) 45 -0.6 (5.9) 0.4 % -2.10 [ -4.30, 0.10 ]
Stefanick 1998 M 48 -3 (6.6) 46 1.8 (6.1) 0.3 % -4.80 [ -7.37, -2.23 ]
Tromso 1991 F 422 -2.13 (10.3) 387 1.23 (10.4) 1.0 % -3.36 [ -4.79, -1.93 ]
-10 -5 0 5 10
Favours treatment Favours control
(Continued . . . )
136Multiple risk factor interventions for primary prevention of coronary heart disease (Review)
Copyright © 2011 The Cochrane Collaboration. Published by John Wiley & Sons, Ltd.
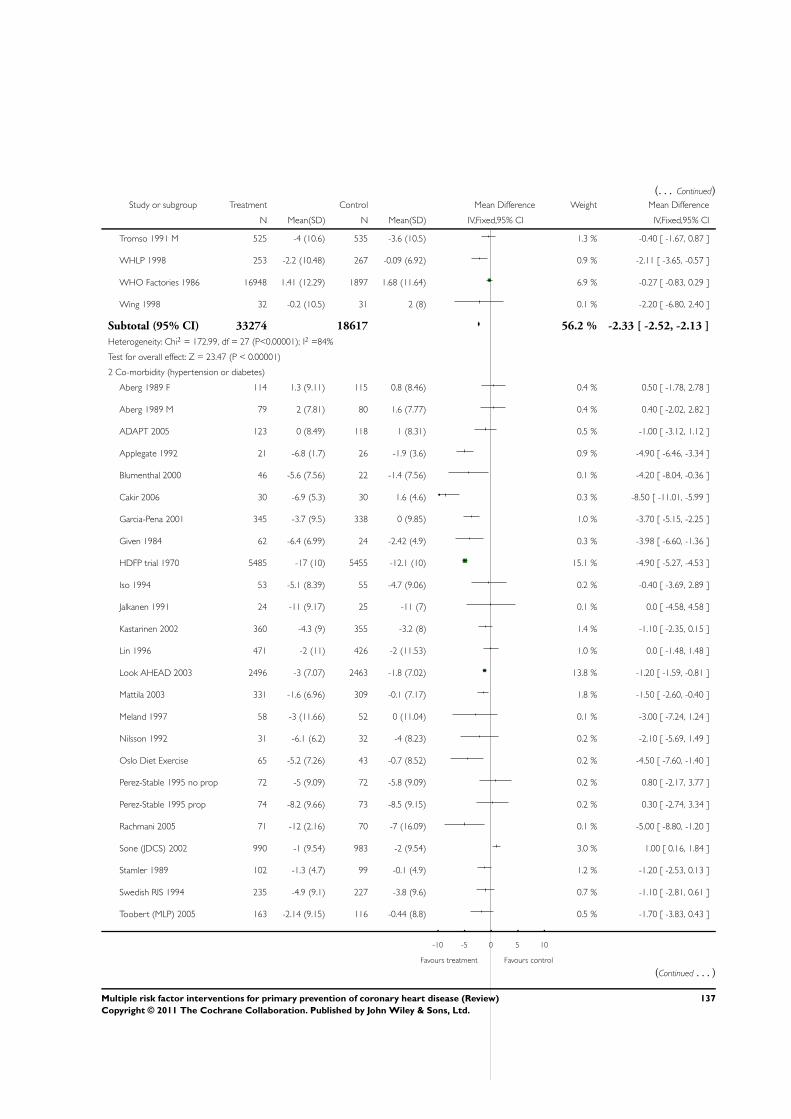
(. . . Continued)Study or subgroup Treatment Control Mean Difference Weight Mean Difference
N Mean(SD) N Mean(SD) IV,Fixed,95% CI IV,Fixed,95% CI
Tromso 1991 M 525 -4 (10.6) 535 -3.6 (10.5) 1.3 % -0.40 [ -1.67, 0.87 ]
WHLP 1998 253 -2.2 (10.48) 267 -0.09 (6.92) 0.9 % -2.11 [ -3.65, -0.57 ]
WHO Factories 1986 16948 1.41 (12.29) 1897 1.68 (11.64) 6.9 % -0.27 [ -0.83, 0.29 ]
Wing 1998 32 -0.2 (10.5) 31 2 (8) 0.1 % -2.20 [ -6.80, 2.40 ]
Subtotal (95% CI) 33274 18617 56.2 % -2.33 [ -2.52, -2.13 ]
Heterogeneity: Chi2 = 172.99, df = 27 (P<0.00001); I2 =84%
Test for overall effect: Z = 23.47 (P < 0.00001)
2 Co-morbidity (hypertension or diabetes)
Aberg 1989 F 114 1.3 (9.11) 115 0.8 (8.46) 0.4 % 0.50 [ -1.78, 2.78 ]
Aberg 1989 M 79 2 (7.81) 80 1.6 (7.77) 0.4 % 0.40 [ -2.02, 2.82 ]
ADAPT 2005 123 0 (8.49) 118 1 (8.31) 0.5 % -1.00 [ -3.12, 1.12 ]
Applegate 1992 21 -6.8 (1.7) 26 -1.9 (3.6) 0.9 % -4.90 [ -6.46, -3.34 ]
Blumenthal 2000 46 -5.6 (7.56) 22 -1.4 (7.56) 0.1 % -4.20 [ -8.04, -0.36 ]
Cakir 2006 30 -6.9 (5.3) 30 1.6 (4.6) 0.3 % -8.50 [ -11.01, -5.99 ]
Garcia-Pena 2001 345 -3.7 (9.5) 338 0 (9.85) 1.0 % -3.70 [ -5.15, -2.25 ]
Given 1984 62 -6.4 (6.99) 24 -2.42 (4.9) 0.3 % -3.98 [ -6.60, -1.36 ]
HDFP trial 1970 5485 -17 (10) 5455 -12.1 (10) 15.1 % -4.90 [ -5.27, -4.53 ]
Iso 1994 53 -5.1 (8.39) 55 -4.7 (9.06) 0.2 % -0.40 [ -3.69, 2.89 ]
Jalkanen 1991 24 -11 (9.17) 25 -11 (7) 0.1 % 0.0 [ -4.58, 4.58 ]
Kastarinen 2002 360 -4.3 (9) 355 -3.2 (8) 1.4 % -1.10 [ -2.35, 0.15 ]
Lin 1996 471 -2 (11) 426 -2 (11.53) 1.0 % 0.0 [ -1.48, 1.48 ]
Look AHEAD 2003 2496 -3 (7.07) 2463 -1.8 (7.02) 13.8 % -1.20 [ -1.59, -0.81 ]
Mattila 2003 331 -1.6 (6.96) 309 -0.1 (7.17) 1.8 % -1.50 [ -2.60, -0.40 ]
Meland 1997 58 -3 (11.66) 52 0 (11.04) 0.1 % -3.00 [ -7.24, 1.24 ]
Nilsson 1992 31 -6.1 (6.2) 32 -4 (8.23) 0.2 % -2.10 [ -5.69, 1.49 ]
Oslo Diet Exercise 65 -5.2 (7.26) 43 -0.7 (8.52) 0.2 % -4.50 [ -7.60, -1.40 ]
Perez-Stable 1995 no prop 72 -5 (9.09) 72 -5.8 (9.09) 0.2 % 0.80 [ -2.17, 3.77 ]
Perez-Stable 1995 prop 74 -8.2 (9.66) 73 -8.5 (9.15) 0.2 % 0.30 [ -2.74, 3.34 ]
Rachmani 2005 71 -12 (2.16) 70 -7 (16.09) 0.1 % -5.00 [ -8.80, -1.20 ]
Sone (JDCS) 2002 990 -1 (9.54) 983 -2 (9.54) 3.0 % 1.00 [ 0.16, 1.84 ]
Stamler 1989 102 -1.3 (4.7) 99 -0.1 (4.9) 1.2 % -1.20 [ -2.53, 0.13 ]
Swedish RIS 1994 235 -4.9 (9.1) 227 -3.8 (9.6) 0.7 % -1.10 [ -2.81, 0.61 ]
Toobert (MLP) 2005 163 -2.14 (9.15) 116 -0.44 (8.8) 0.5 % -1.70 [ -3.83, 0.43 ]
-10 -5 0 5 10
Favours treatment Favours control
(Continued . . . )
137Multiple risk factor interventions for primary prevention of coronary heart disease (Review)
Copyright © 2011 The Cochrane Collaboration. Published by John Wiley & Sons, Ltd.
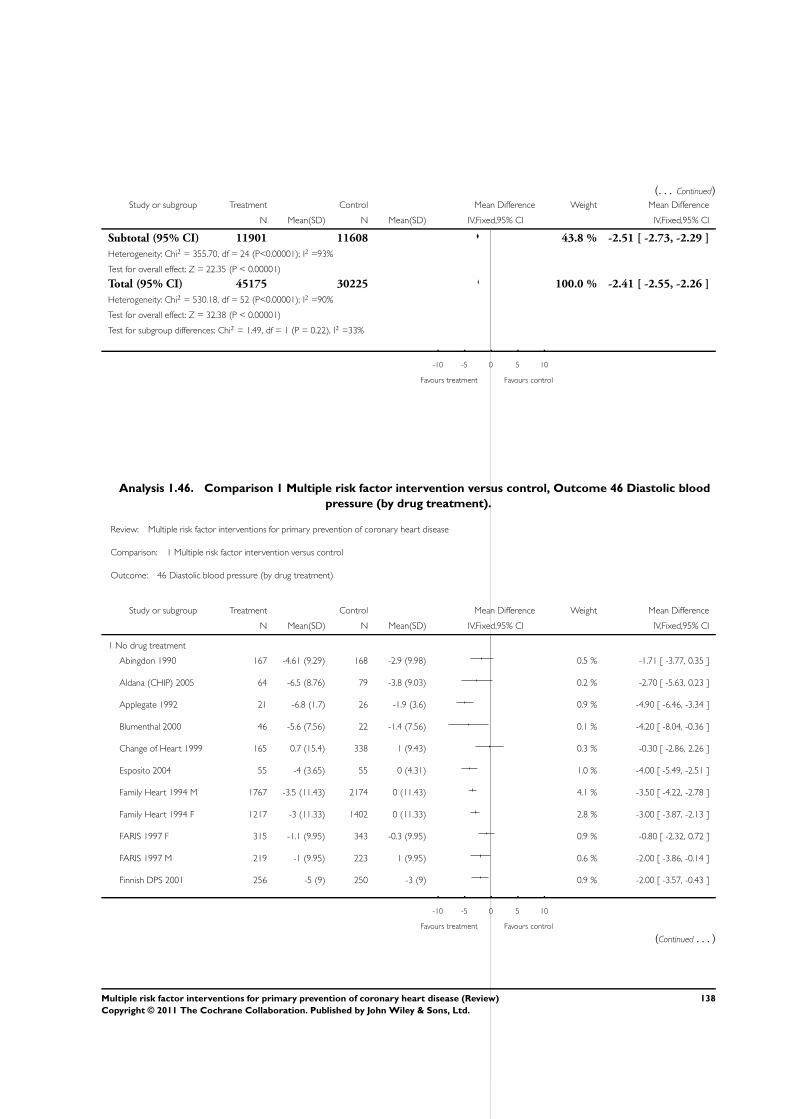
(. . . Continued)Study or subgroup Treatment Control Mean Difference Weight Mean Difference
N Mean(SD) N Mean(SD) IV,Fixed,95% CI IV,Fixed,95% CI
Subtotal (95% CI) 11901 11608 43.8 % -2.51 [ -2.73, -2.29 ]
Heterogeneity: Chi2 = 355.70, df = 24 (P<0.00001); I2 =93%
Test for overall effect: Z = 22.35 (P < 0.00001)
Total (95% CI) 45175 30225 100.0 % -2.41 [ -2.55, -2.26 ]
Heterogeneity: Chi2 = 530.18, df = 52 (P<0.00001); I2 =90%
Test for overall effect: Z = 32.38 (P < 0.00001)
Test for subgroup differences: Chi2 = 1.49, df = 1 (P = 0.22), I2 =33%
-10 -5 0 5 10
Favours treatment Favours control
Analysis 1.46. Comparison 1 Multiple risk factor intervention versus control, Outcome 46 Diastolic blood
pressure (by drug treatment).
Review: Multiple risk factor interventions for primary prevention of coronary heart disease
Comparison: 1 Multiple risk factor intervention versus control
Outcome: 46 Diastolic blood pressure (by drug treatment)
Study or subgroup Treatment Control Mean Difference Weight Mean Difference
N Mean(SD) N Mean(SD) IV,Fixed,95% CI IV,Fixed,95% CI
1 No drug treatment
Abingdon 1990 167 -4.61 (9.29) 168 -2.9 (9.98) 0.5 % -1.71 [ -3.77, 0.35 ]
Aldana (CHIP) 2005 64 -6.5 (8.76) 79 -3.8 (9.03) 0.2 % -2.70 [ -5.63, 0.23 ]
Applegate 1992 21 -6.8 (1.7) 26 -1.9 (3.6) 0.9 % -4.90 [ -6.46, -3.34 ]
Blumenthal 2000 46 -5.6 (7.56) 22 -1.4 (7.56) 0.1 % -4.20 [ -8.04, -0.36 ]
Change of Heart 1999 165 0.7 (15.4) 338 1 (9.43) 0.3 % -0.30 [ -2.86, 2.26 ]
Esposito 2004 55 -4 (3.65) 55 0 (4.31) 1.0 % -4.00 [ -5.49, -2.51 ]
Family Heart 1994 M 1767 -3.5 (11.43) 2174 0 (11.43) 4.1 % -3.50 [ -4.22, -2.78 ]
Family Heart 1994 F 1217 -3 (11.33) 1402 0 (11.33) 2.8 % -3.00 [ -3.87, -2.13 ]
FARIS 1997 F 315 -1.1 (9.95) 343 -0.3 (9.95) 0.9 % -0.80 [ -2.32, 0.72 ]
FARIS 1997 M 219 -1 (9.95) 223 1 (9.95) 0.6 % -2.00 [ -3.86, -0.14 ]
Finnish DPS 2001 256 -5 (9) 250 -3 (9) 0.9 % -2.00 [ -3.57, -0.43 ]
-10 -5 0 5 10
Favours treatment Favours control
(Continued . . . )
138Multiple risk factor interventions for primary prevention of coronary heart disease (Review)
Copyright © 2011 The Cochrane Collaboration. Published by John Wiley & Sons, Ltd.
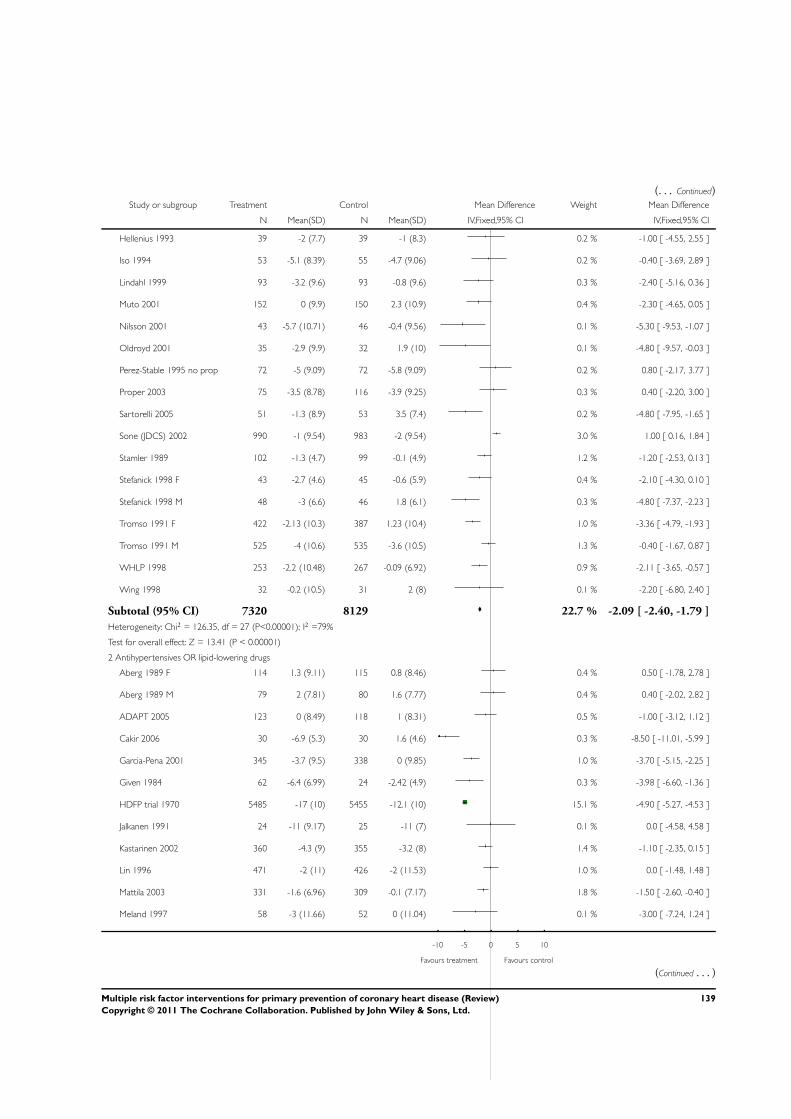
(. . . Continued)Study or subgroup Treatment Control Mean Difference Weight Mean Difference
N Mean(SD) N Mean(SD) IV,Fixed,95% CI IV,Fixed,95% CI
Hellenius 1993 39 -2 (7.7) 39 -1 (8.3) 0.2 % -1.00 [ -4.55, 2.55 ]
Iso 1994 53 -5.1 (8.39) 55 -4.7 (9.06) 0.2 % -0.40 [ -3.69, 2.89 ]
Lindahl 1999 93 -3.2 (9.6) 93 -0.8 (9.6) 0.3 % -2.40 [ -5.16, 0.36 ]
Muto 2001 152 0 (9.9) 150 2.3 (10.9) 0.4 % -2.30 [ -4.65, 0.05 ]
Nilsson 2001 43 -5.7 (10.71) 46 -0.4 (9.56) 0.1 % -5.30 [ -9.53, -1.07 ]
Oldroyd 2001 35 -2.9 (9.9) 32 1.9 (10) 0.1 % -4.80 [ -9.57, -0.03 ]
Perez-Stable 1995 no prop 72 -5 (9.09) 72 -5.8 (9.09) 0.2 % 0.80 [ -2.17, 3.77 ]
Proper 2003 75 -3.5 (8.78) 116 -3.9 (9.25) 0.3 % 0.40 [ -2.20, 3.00 ]
Sartorelli 2005 51 -1.3 (8.9) 53 3.5 (7.4) 0.2 % -4.80 [ -7.95, -1.65 ]
Sone (JDCS) 2002 990 -1 (9.54) 983 -2 (9.54) 3.0 % 1.00 [ 0.16, 1.84 ]
Stamler 1989 102 -1.3 (4.7) 99 -0.1 (4.9) 1.2 % -1.20 [ -2.53, 0.13 ]
Stefanick 1998 F 43 -2.7 (4.6) 45 -0.6 (5.9) 0.4 % -2.10 [ -4.30, 0.10 ]
Stefanick 1998 M 48 -3 (6.6) 46 1.8 (6.1) 0.3 % -4.80 [ -7.37, -2.23 ]
Tromso 1991 F 422 -2.13 (10.3) 387 1.23 (10.4) 1.0 % -3.36 [ -4.79, -1.93 ]
Tromso 1991 M 525 -4 (10.6) 535 -3.6 (10.5) 1.3 % -0.40 [ -1.67, 0.87 ]
WHLP 1998 253 -2.2 (10.48) 267 -0.09 (6.92) 0.9 % -2.11 [ -3.65, -0.57 ]
Wing 1998 32 -0.2 (10.5) 31 2 (8) 0.1 % -2.20 [ -6.80, 2.40 ]
Subtotal (95% CI) 7320 8129 22.7 % -2.09 [ -2.40, -1.79 ]
Heterogeneity: Chi2 = 126.35, df = 27 (P<0.00001); I2 =79%
Test for overall effect: Z = 13.41 (P < 0.00001)
2 Antihypertensives OR lipid-lowering drugs
Aberg 1989 F 114 1.3 (9.11) 115 0.8 (8.46) 0.4 % 0.50 [ -1.78, 2.78 ]
Aberg 1989 M 79 2 (7.81) 80 1.6 (7.77) 0.4 % 0.40 [ -2.02, 2.82 ]
ADAPT 2005 123 0 (8.49) 118 1 (8.31) 0.5 % -1.00 [ -3.12, 1.12 ]
Cakir 2006 30 -6.9 (5.3) 30 1.6 (4.6) 0.3 % -8.50 [ -11.01, -5.99 ]
Garcia-Pena 2001 345 -3.7 (9.5) 338 0 (9.85) 1.0 % -3.70 [ -5.15, -2.25 ]
Given 1984 62 -6.4 (6.99) 24 -2.42 (4.9) 0.3 % -3.98 [ -6.60, -1.36 ]
HDFP trial 1970 5485 -17 (10) 5455 -12.1 (10) 15.1 % -4.90 [ -5.27, -4.53 ]
Jalkanen 1991 24 -11 (9.17) 25 -11 (7) 0.1 % 0.0 [ -4.58, 4.58 ]
Kastarinen 2002 360 -4.3 (9) 355 -3.2 (8) 1.4 % -1.10 [ -2.35, 0.15 ]
Lin 1996 471 -2 (11) 426 -2 (11.53) 1.0 % 0.0 [ -1.48, 1.48 ]
Mattila 2003 331 -1.6 (6.96) 309 -0.1 (7.17) 1.8 % -1.50 [ -2.60, -0.40 ]
Meland 1997 58 -3 (11.66) 52 0 (11.04) 0.1 % -3.00 [ -7.24, 1.24 ]
-10 -5 0 5 10
Favours treatment Favours control
(Continued . . . )
139Multiple risk factor interventions for primary prevention of coronary heart disease (Review)
Copyright © 2011 The Cochrane Collaboration. Published by John Wiley & Sons, Ltd.
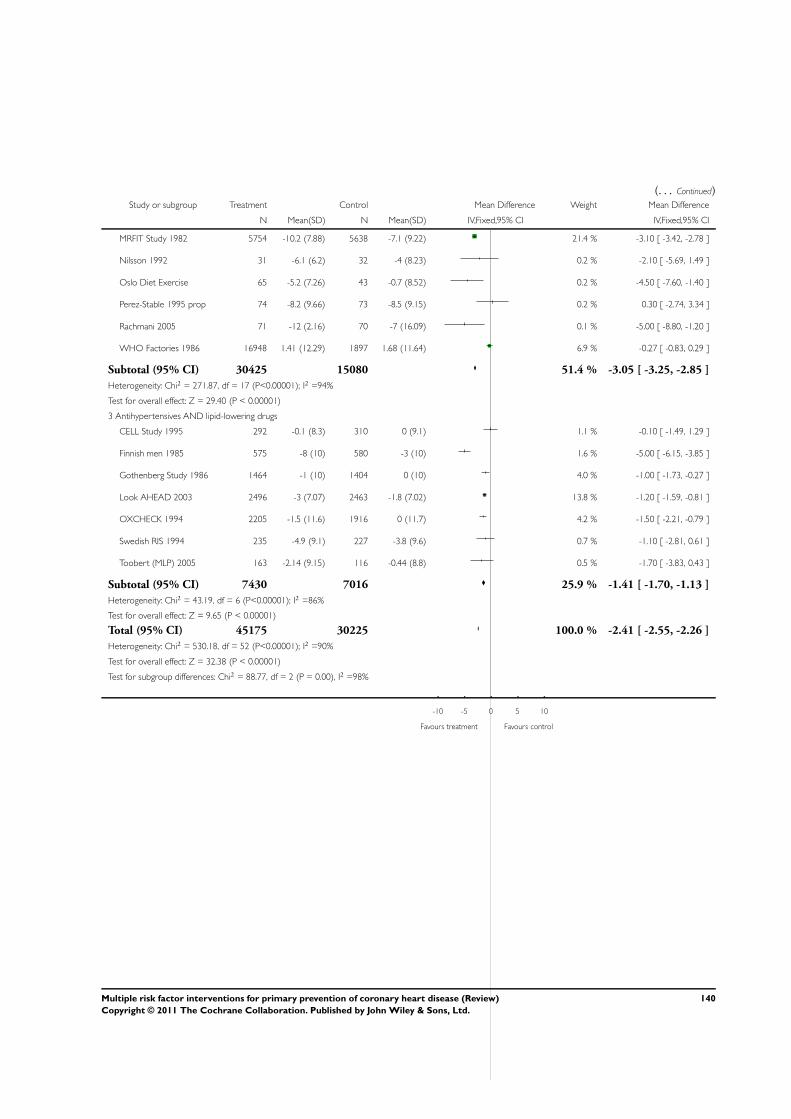
(. . . Continued)Study or subgroup Treatment Control Mean Difference Weight Mean Difference
N Mean(SD) N Mean(SD) IV,Fixed,95% CI IV,Fixed,95% CI
MRFIT Study 1982 5754 -10.2 (7.88) 5638 -7.1 (9.22) 21.4 % -3.10 [ -3.42, -2.78 ]
Nilsson 1992 31 -6.1 (6.2) 32 -4 (8.23) 0.2 % -2.10 [ -5.69, 1.49 ]
Oslo Diet Exercise 65 -5.2 (7.26) 43 -0.7 (8.52) 0.2 % -4.50 [ -7.60, -1.40 ]
Perez-Stable 1995 prop 74 -8.2 (9.66) 73 -8.5 (9.15) 0.2 % 0.30 [ -2.74, 3.34 ]
Rachmani 2005 71 -12 (2.16) 70 -7 (16.09) 0.1 % -5.00 [ -8.80, -1.20 ]
WHO Factories 1986 16948 1.41 (12.29) 1897 1.68 (11.64) 6.9 % -0.27 [ -0.83, 0.29 ]
Subtotal (95% CI) 30425 15080 51.4 % -3.05 [ -3.25, -2.85 ]
Heterogeneity: Chi2 = 271.87, df = 17 (P<0.00001); I2 =94%
Test for overall effect: Z = 29.40 (P < 0.00001)
3 Antihypertensives AND lipid-lowering drugs
CELL Study 1995 292 -0.1 (8.3) 310 0 (9.1) 1.1 % -0.10 [ -1.49, 1.29 ]
Finnish men 1985 575 -8 (10) 580 -3 (10) 1.6 % -5.00 [ -6.15, -3.85 ]
Gothenberg Study 1986 1464 -1 (10) 1404 0 (10) 4.0 % -1.00 [ -1.73, -0.27 ]
Look AHEAD 2003 2496 -3 (7.07) 2463 -1.8 (7.02) 13.8 % -1.20 [ -1.59, -0.81 ]
OXCHECK 1994 2205 -1.5 (11.6) 1916 0 (11.7) 4.2 % -1.50 [ -2.21, -0.79 ]
Swedish RIS 1994 235 -4.9 (9.1) 227 -3.8 (9.6) 0.7 % -1.10 [ -2.81, 0.61 ]
Toobert (MLP) 2005 163 -2.14 (9.15) 116 -0.44 (8.8) 0.5 % -1.70 [ -3.83, 0.43 ]
Subtotal (95% CI) 7430 7016 25.9 % -1.41 [ -1.70, -1.13 ]
Heterogeneity: Chi2 = 43.19, df = 6 (P<0.00001); I2 =86%
Test for overall effect: Z = 9.65 (P < 0.00001)
Total (95% CI) 45175 30225 100.0 % -2.41 [ -2.55, -2.26 ]
Heterogeneity: Chi2 = 530.18, df = 52 (P<0.00001); I2 =90%
Test for overall effect: Z = 32.38 (P < 0.00001)
Test for subgroup differences: Chi2 = 88.77, df = 2 (P = 0.00), I2 =98%
-10 -5 0 5 10
Favours treatment Favours control
140Multiple risk factor interventions for primary prevention of coronary heart disease (Review)
Copyright © 2011 The Cochrane Collaboration. Published by John Wiley & Sons, Ltd.
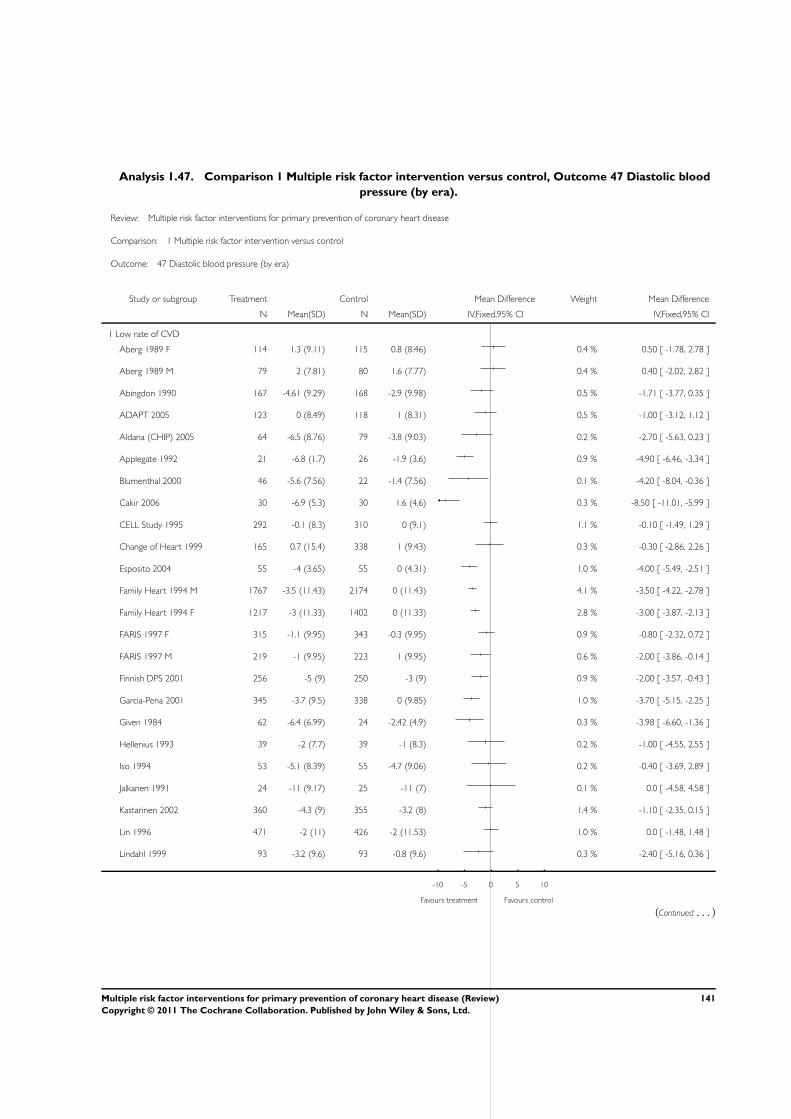
Analysis 1.47. Comparison 1 Multiple risk factor intervention versus control, Outcome 47 Diastolic blood
pressure (by era).
Review: Multiple risk factor interventions for primary prevention of coronary heart disease
Comparison: 1 Multiple risk factor intervention versus control
Outcome: 47 Diastolic blood pressure (by era)
Study or subgroup Treatment Control Mean Difference Weight Mean Difference
N Mean(SD) N Mean(SD) IV,Fixed,95% CI IV,Fixed,95% CI
1 Low rate of CVD
Aberg 1989 F 114 1.3 (9.11) 115 0.8 (8.46) 0.4 % 0.50 [ -1.78, 2.78 ]
Aberg 1989 M 79 2 (7.81) 80 1.6 (7.77) 0.4 % 0.40 [ -2.02, 2.82 ]
Abingdon 1990 167 -4.61 (9.29) 168 -2.9 (9.98) 0.5 % -1.71 [ -3.77, 0.35 ]
ADAPT 2005 123 0 (8.49) 118 1 (8.31) 0.5 % -1.00 [ -3.12, 1.12 ]
Aldana (CHIP) 2005 64 -6.5 (8.76) 79 -3.8 (9.03) 0.2 % -2.70 [ -5.63, 0.23 ]
Applegate 1992 21 -6.8 (1.7) 26 -1.9 (3.6) 0.9 % -4.90 [ -6.46, -3.34 ]
Blumenthal 2000 46 -5.6 (7.56) 22 -1.4 (7.56) 0.1 % -4.20 [ -8.04, -0.36 ]
Cakir 2006 30 -6.9 (5.3) 30 1.6 (4.6) 0.3 % -8.50 [ -11.01, -5.99 ]
CELL Study 1995 292 -0.1 (8.3) 310 0 (9.1) 1.1 % -0.10 [ -1.49, 1.29 ]
Change of Heart 1999 165 0.7 (15.4) 338 1 (9.43) 0.3 % -0.30 [ -2.86, 2.26 ]
Esposito 2004 55 -4 (3.65) 55 0 (4.31) 1.0 % -4.00 [ -5.49, -2.51 ]
Family Heart 1994 M 1767 -3.5 (11.43) 2174 0 (11.43) 4.1 % -3.50 [ -4.22, -2.78 ]
Family Heart 1994 F 1217 -3 (11.33) 1402 0 (11.33) 2.8 % -3.00 [ -3.87, -2.13 ]
FARIS 1997 F 315 -1.1 (9.95) 343 -0.3 (9.95) 0.9 % -0.80 [ -2.32, 0.72 ]
FARIS 1997 M 219 -1 (9.95) 223 1 (9.95) 0.6 % -2.00 [ -3.86, -0.14 ]
Finnish DPS 2001 256 -5 (9) 250 -3 (9) 0.9 % -2.00 [ -3.57, -0.43 ]
Garcia-Pena 2001 345 -3.7 (9.5) 338 0 (9.85) 1.0 % -3.70 [ -5.15, -2.25 ]
Given 1984 62 -6.4 (6.99) 24 -2.42 (4.9) 0.3 % -3.98 [ -6.60, -1.36 ]
Hellenius 1993 39 -2 (7.7) 39 -1 (8.3) 0.2 % -1.00 [ -4.55, 2.55 ]
Iso 1994 53 -5.1 (8.39) 55 -4.7 (9.06) 0.2 % -0.40 [ -3.69, 2.89 ]
Jalkanen 1991 24 -11 (9.17) 25 -11 (7) 0.1 % 0.0 [ -4.58, 4.58 ]
Kastarinen 2002 360 -4.3 (9) 355 -3.2 (8) 1.4 % -1.10 [ -2.35, 0.15 ]
Lin 1996 471 -2 (11) 426 -2 (11.53) 1.0 % 0.0 [ -1.48, 1.48 ]
Lindahl 1999 93 -3.2 (9.6) 93 -0.8 (9.6) 0.3 % -2.40 [ -5.16, 0.36 ]
-10 -5 0 5 10
Favours treatment Favours control
(Continued . . . )
141Multiple risk factor interventions for primary prevention of coronary heart disease (Review)
Copyright © 2011 The Cochrane Collaboration. Published by John Wiley & Sons, Ltd.
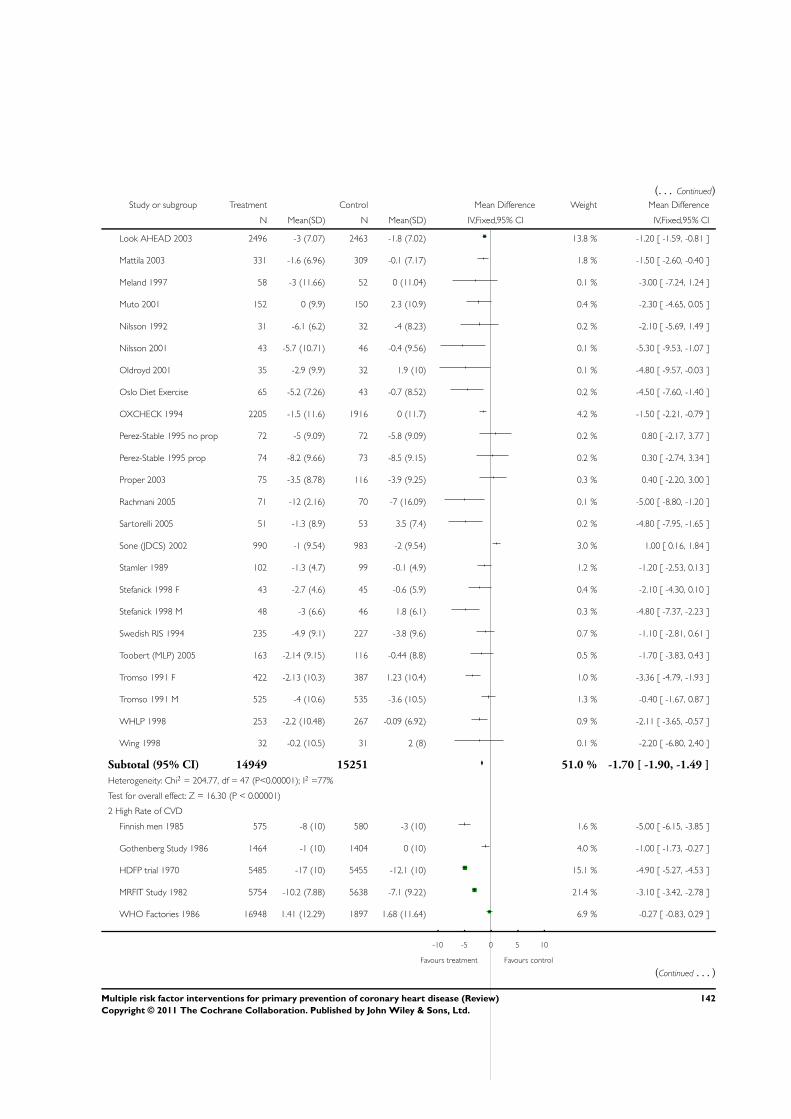
(. . . Continued)Study or subgroup Treatment Control Mean Difference Weight Mean Difference
N Mean(SD) N Mean(SD) IV,Fixed,95% CI IV,Fixed,95% CI
Look AHEAD 2003 2496 -3 (7.07) 2463 -1.8 (7.02) 13.8 % -1.20 [ -1.59, -0.81 ]
Mattila 2003 331 -1.6 (6.96) 309 -0.1 (7.17) 1.8 % -1.50 [ -2.60, -0.40 ]
Meland 1997 58 -3 (11.66) 52 0 (11.04) 0.1 % -3.00 [ -7.24, 1.24 ]
Muto 2001 152 0 (9.9) 150 2.3 (10.9) 0.4 % -2.30 [ -4.65, 0.05 ]
Nilsson 1992 31 -6.1 (6.2) 32 -4 (8.23) 0.2 % -2.10 [ -5.69, 1.49 ]
Nilsson 2001 43 -5.7 (10.71) 46 -0.4 (9.56) 0.1 % -5.30 [ -9.53, -1.07 ]
Oldroyd 2001 35 -2.9 (9.9) 32 1.9 (10) 0.1 % -4.80 [ -9.57, -0.03 ]
Oslo Diet Exercise 65 -5.2 (7.26) 43 -0.7 (8.52) 0.2 % -4.50 [ -7.60, -1.40 ]
OXCHECK 1994 2205 -1.5 (11.6) 1916 0 (11.7) 4.2 % -1.50 [ -2.21, -0.79 ]
Perez-Stable 1995 no prop 72 -5 (9.09) 72 -5.8 (9.09) 0.2 % 0.80 [ -2.17, 3.77 ]
Perez-Stable 1995 prop 74 -8.2 (9.66) 73 -8.5 (9.15) 0.2 % 0.30 [ -2.74, 3.34 ]
Proper 2003 75 -3.5 (8.78) 116 -3.9 (9.25) 0.3 % 0.40 [ -2.20, 3.00 ]
Rachmani 2005 71 -12 (2.16) 70 -7 (16.09) 0.1 % -5.00 [ -8.80, -1.20 ]
Sartorelli 2005 51 -1.3 (8.9) 53 3.5 (7.4) 0.2 % -4.80 [ -7.95, -1.65 ]
Sone (JDCS) 2002 990 -1 (9.54) 983 -2 (9.54) 3.0 % 1.00 [ 0.16, 1.84 ]
Stamler 1989 102 -1.3 (4.7) 99 -0.1 (4.9) 1.2 % -1.20 [ -2.53, 0.13 ]
Stefanick 1998 F 43 -2.7 (4.6) 45 -0.6 (5.9) 0.4 % -2.10 [ -4.30, 0.10 ]
Stefanick 1998 M 48 -3 (6.6) 46 1.8 (6.1) 0.3 % -4.80 [ -7.37, -2.23 ]
Swedish RIS 1994 235 -4.9 (9.1) 227 -3.8 (9.6) 0.7 % -1.10 [ -2.81, 0.61 ]
Toobert (MLP) 2005 163 -2.14 (9.15) 116 -0.44 (8.8) 0.5 % -1.70 [ -3.83, 0.43 ]
Tromso 1991 F 422 -2.13 (10.3) 387 1.23 (10.4) 1.0 % -3.36 [ -4.79, -1.93 ]
Tromso 1991 M 525 -4 (10.6) 535 -3.6 (10.5) 1.3 % -0.40 [ -1.67, 0.87 ]
WHLP 1998 253 -2.2 (10.48) 267 -0.09 (6.92) 0.9 % -2.11 [ -3.65, -0.57 ]
Wing 1998 32 -0.2 (10.5) 31 2 (8) 0.1 % -2.20 [ -6.80, 2.40 ]
Subtotal (95% CI) 14949 15251 51.0 % -1.70 [ -1.90, -1.49 ]
Heterogeneity: Chi2 = 204.77, df = 47 (P<0.00001); I2 =77%
Test for overall effect: Z = 16.30 (P < 0.00001)
2 High Rate of CVD
Finnish men 1985 575 -8 (10) 580 -3 (10) 1.6 % -5.00 [ -6.15, -3.85 ]
Gothenberg Study 1986 1464 -1 (10) 1404 0 (10) 4.0 % -1.00 [ -1.73, -0.27 ]
HDFP trial 1970 5485 -17 (10) 5455 -12.1 (10) 15.1 % -4.90 [ -5.27, -4.53 ]
MRFIT Study 1982 5754 -10.2 (7.88) 5638 -7.1 (9.22) 21.4 % -3.10 [ -3.42, -2.78 ]
WHO Factories 1986 16948 1.41 (12.29) 1897 1.68 (11.64) 6.9 % -0.27 [ -0.83, 0.29 ]
-10 -5 0 5 10
Favours treatment Favours control
(Continued . . . )
142Multiple risk factor interventions for primary prevention of coronary heart disease (Review)
Copyright © 2011 The Cochrane Collaboration. Published by John Wiley & Sons, Ltd.

(. . . Continued)Study or subgroup Treatment Control Mean Difference Weight Mean Difference
N Mean(SD) N Mean(SD) IV,Fixed,95% CI IV,Fixed,95% CI
Subtotal (95% CI) 30226 14974 49.0 % -3.15 [ -3.36, -2.94 ]
Heterogeneity: Chi2 = 230.11, df = 4 (P<0.00001); I2 =98%
Test for overall effect: Z = 29.64 (P < 0.00001)
Total (95% CI) 45175 30225 100.0 % -2.41 [ -2.55, -2.26 ]
Heterogeneity: Chi2 = 530.18, df = 52 (P<0.00001); I2 =90%
Test for overall effect: Z = 32.38 (P < 0.00001)
Test for subgroup differences: Chi2 = 95.29, df = 1 (P = 0.0), I2 =99%
-10 -5 0 5 10
Favours treatment Favours control
Analysis 1.48. Comparison 1 Multiple risk factor intervention versus control, Outcome 48 Diastolic blood
pressure (by age of study).
Review: Multiple risk factor interventions for primary prevention of coronary heart disease
Comparison: 1 Multiple risk factor intervention versus control
Outcome: 48 Diastolic blood pressure (by age of study)
Study or subgroup Treatment Control Mean Difference Weight Mean Difference
N Mean(SD) N Mean(SD) IV,Fixed,95% CI IV,Fixed,95% CI
1 Study before 2000
Aberg 1989 F 114 1.3 (9.11) 115 0.8 (8.46) 0.4 % 0.50 [ -1.78, 2.78 ]
Aberg 1989 M 79 2 (7.81) 80 1.6 (7.77) 0.4 % 0.40 [ -2.02, 2.82 ]
Abingdon 1990 167 -4.61 (9.29) 168 -2.9 (9.98) 0.5 % -1.71 [ -3.77, 0.35 ]
Applegate 1992 21 -6.8 (1.7) 26 -1.9 (3.6) 0.9 % -4.90 [ -6.46, -3.34 ]
Blumenthal 2000 46 -5.6 (7.56) 22 -1.4 (7.56) 0.1 % -4.20 [ -8.04, -0.36 ]
CELL Study 1995 292 -0.1 (8.3) 310 0 (9.1) 1.1 % -0.10 [ -1.49, 1.29 ]
Change of Heart 1999 165 0.7 (15.4) 338 1 (9.43) 0.3 % -0.30 [ -2.86, 2.26 ]
Family Heart 1994 M 1767 -3.5 (11.43) 2174 0 (11.43) 4.1 % -3.50 [ -4.22, -2.78 ]
Family Heart 1994 F 1217 -3 (11.33) 1402 0 (11.33) 2.8 % -3.00 [ -3.87, -2.13 ]
FARIS 1997 F 315 -1.1 (9.95) 343 -0.3 (9.95) 0.9 % -0.80 [ -2.32, 0.72 ]
FARIS 1997 M 219 -1 (9.95) 223 1 (9.95) 0.6 % -2.00 [ -3.86, -0.14 ]
-10 -5 0 5 10
Favours treatment Favours control
(Continued . . . )
143Multiple risk factor interventions for primary prevention of coronary heart disease (Review)
Copyright © 2011 The Cochrane Collaboration. Published by John Wiley & Sons, Ltd.
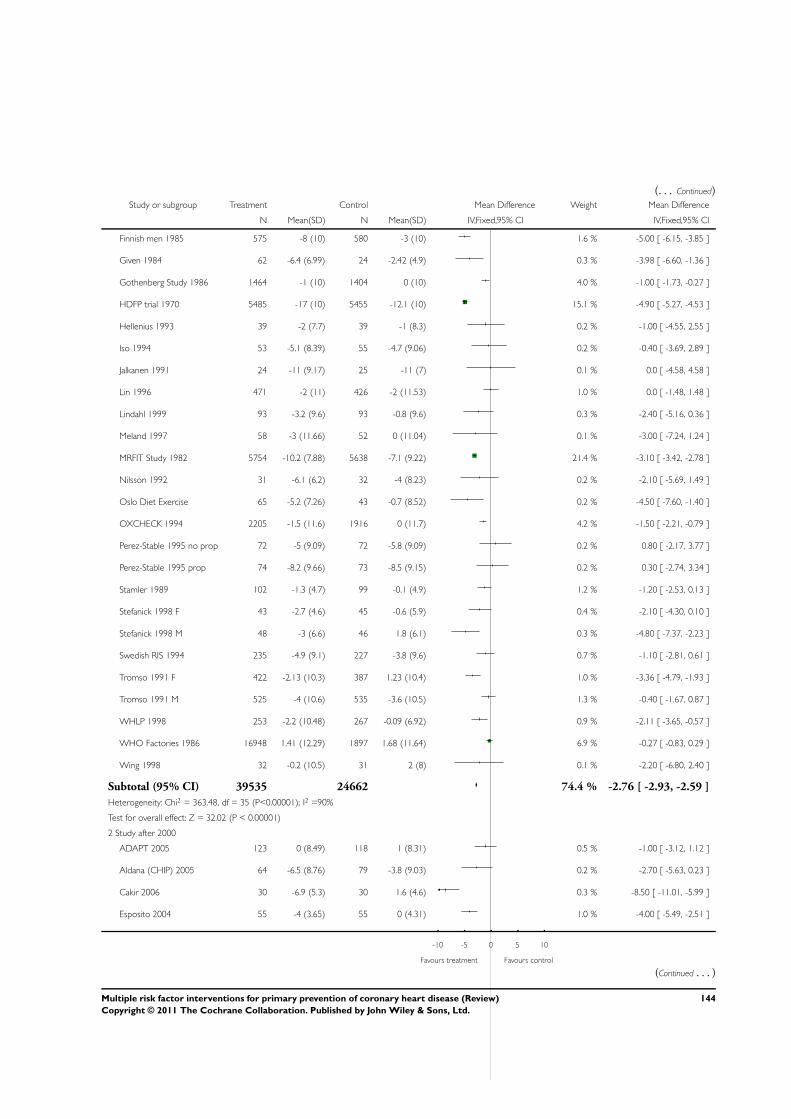
(. . . Continued)Study or subgroup Treatment Control Mean Difference Weight Mean Difference
N Mean(SD) N Mean(SD) IV,Fixed,95% CI IV,Fixed,95% CI
Finnish men 1985 575 -8 (10) 580 -3 (10) 1.6 % -5.00 [ -6.15, -3.85 ]
Given 1984 62 -6.4 (6.99) 24 -2.42 (4.9) 0.3 % -3.98 [ -6.60, -1.36 ]
Gothenberg Study 1986 1464 -1 (10) 1404 0 (10) 4.0 % -1.00 [ -1.73, -0.27 ]
HDFP trial 1970 5485 -17 (10) 5455 -12.1 (10) 15.1 % -4.90 [ -5.27, -4.53 ]
Hellenius 1993 39 -2 (7.7) 39 -1 (8.3) 0.2 % -1.00 [ -4.55, 2.55 ]
Iso 1994 53 -5.1 (8.39) 55 -4.7 (9.06) 0.2 % -0.40 [ -3.69, 2.89 ]
Jalkanen 1991 24 -11 (9.17) 25 -11 (7) 0.1 % 0.0 [ -4.58, 4.58 ]
Lin 1996 471 -2 (11) 426 -2 (11.53) 1.0 % 0.0 [ -1.48, 1.48 ]
Lindahl 1999 93 -3.2 (9.6) 93 -0.8 (9.6) 0.3 % -2.40 [ -5.16, 0.36 ]
Meland 1997 58 -3 (11.66) 52 0 (11.04) 0.1 % -3.00 [ -7.24, 1.24 ]
MRFIT Study 1982 5754 -10.2 (7.88) 5638 -7.1 (9.22) 21.4 % -3.10 [ -3.42, -2.78 ]
Nilsson 1992 31 -6.1 (6.2) 32 -4 (8.23) 0.2 % -2.10 [ -5.69, 1.49 ]
Oslo Diet Exercise 65 -5.2 (7.26) 43 -0.7 (8.52) 0.2 % -4.50 [ -7.60, -1.40 ]
OXCHECK 1994 2205 -1.5 (11.6) 1916 0 (11.7) 4.2 % -1.50 [ -2.21, -0.79 ]
Perez-Stable 1995 no prop 72 -5 (9.09) 72 -5.8 (9.09) 0.2 % 0.80 [ -2.17, 3.77 ]
Perez-Stable 1995 prop 74 -8.2 (9.66) 73 -8.5 (9.15) 0.2 % 0.30 [ -2.74, 3.34 ]
Stamler 1989 102 -1.3 (4.7) 99 -0.1 (4.9) 1.2 % -1.20 [ -2.53, 0.13 ]
Stefanick 1998 F 43 -2.7 (4.6) 45 -0.6 (5.9) 0.4 % -2.10 [ -4.30, 0.10 ]
Stefanick 1998 M 48 -3 (6.6) 46 1.8 (6.1) 0.3 % -4.80 [ -7.37, -2.23 ]
Swedish RIS 1994 235 -4.9 (9.1) 227 -3.8 (9.6) 0.7 % -1.10 [ -2.81, 0.61 ]
Tromso 1991 F 422 -2.13 (10.3) 387 1.23 (10.4) 1.0 % -3.36 [ -4.79, -1.93 ]
Tromso 1991 M 525 -4 (10.6) 535 -3.6 (10.5) 1.3 % -0.40 [ -1.67, 0.87 ]
WHLP 1998 253 -2.2 (10.48) 267 -0.09 (6.92) 0.9 % -2.11 [ -3.65, -0.57 ]
WHO Factories 1986 16948 1.41 (12.29) 1897 1.68 (11.64) 6.9 % -0.27 [ -0.83, 0.29 ]
Wing 1998 32 -0.2 (10.5) 31 2 (8) 0.1 % -2.20 [ -6.80, 2.40 ]
Subtotal (95% CI) 39535 24662 74.4 % -2.76 [ -2.93, -2.59 ]
Heterogeneity: Chi2 = 363.48, df = 35 (P<0.00001); I2 =90%
Test for overall effect: Z = 32.02 (P < 0.00001)
2 Study after 2000
ADAPT 2005 123 0 (8.49) 118 1 (8.31) 0.5 % -1.00 [ -3.12, 1.12 ]
Aldana (CHIP) 2005 64 -6.5 (8.76) 79 -3.8 (9.03) 0.2 % -2.70 [ -5.63, 0.23 ]
Cakir 2006 30 -6.9 (5.3) 30 1.6 (4.6) 0.3 % -8.50 [ -11.01, -5.99 ]
Esposito 2004 55 -4 (3.65) 55 0 (4.31) 1.0 % -4.00 [ -5.49, -2.51 ]
-10 -5 0 5 10
Favours treatment Favours control
(Continued . . . )
144Multiple risk factor interventions for primary prevention of coronary heart disease (Review)
Copyright © 2011 The Cochrane Collaboration. Published by John Wiley & Sons, Ltd.
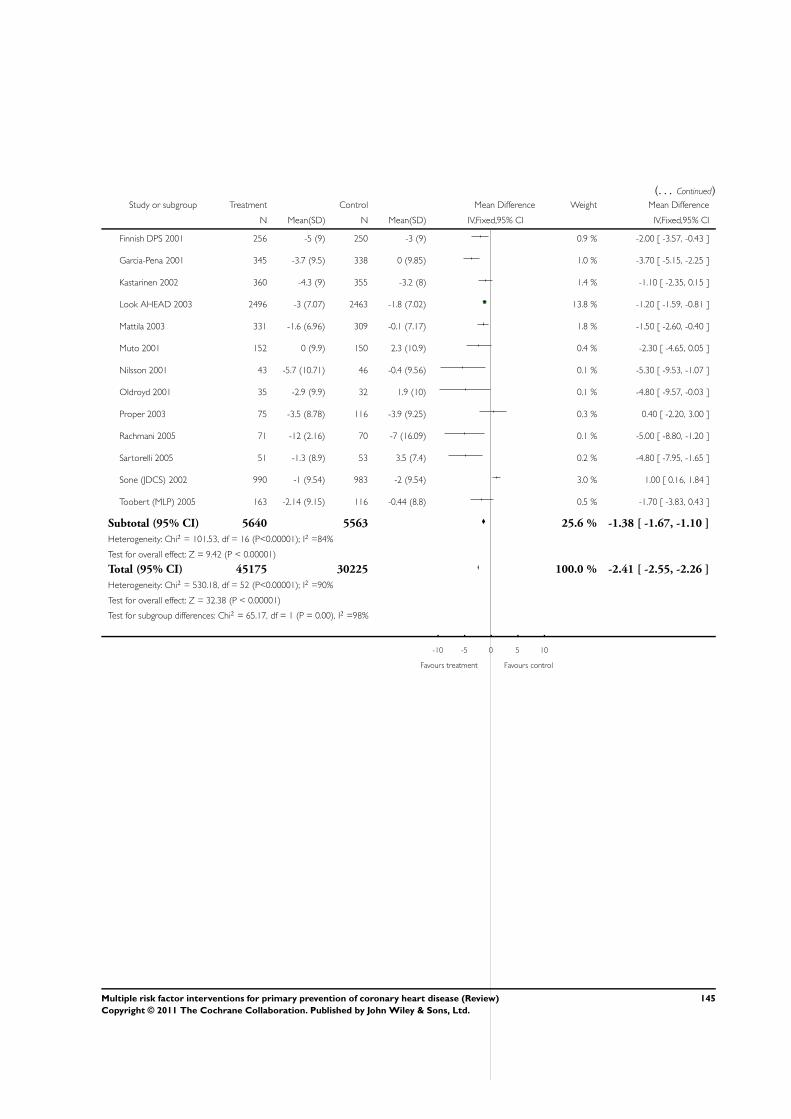
(. . . Continued)Study or subgroup Treatment Control Mean Difference Weight Mean Difference
N Mean(SD) N Mean(SD) IV,Fixed,95% CI IV,Fixed,95% CI
Finnish DPS 2001 256 -5 (9) 250 -3 (9) 0.9 % -2.00 [ -3.57, -0.43 ]
Garcia-Pena 2001 345 -3.7 (9.5) 338 0 (9.85) 1.0 % -3.70 [ -5.15, -2.25 ]
Kastarinen 2002 360 -4.3 (9) 355 -3.2 (8) 1.4 % -1.10 [ -2.35, 0.15 ]
Look AHEAD 2003 2496 -3 (7.07) 2463 -1.8 (7.02) 13.8 % -1.20 [ -1.59, -0.81 ]
Mattila 2003 331 -1.6 (6.96) 309 -0.1 (7.17) 1.8 % -1.50 [ -2.60, -0.40 ]
Muto 2001 152 0 (9.9) 150 2.3 (10.9) 0.4 % -2.30 [ -4.65, 0.05 ]
Nilsson 2001 43 -5.7 (10.71) 46 -0.4 (9.56) 0.1 % -5.30 [ -9.53, -1.07 ]
Oldroyd 2001 35 -2.9 (9.9) 32 1.9 (10) 0.1 % -4.80 [ -9.57, -0.03 ]
Proper 2003 75 -3.5 (8.78) 116 -3.9 (9.25) 0.3 % 0.40 [ -2.20, 3.00 ]
Rachmani 2005 71 -12 (2.16) 70 -7 (16.09) 0.1 % -5.00 [ -8.80, -1.20 ]
Sartorelli 2005 51 -1.3 (8.9) 53 3.5 (7.4) 0.2 % -4.80 [ -7.95, -1.65 ]
Sone (JDCS) 2002 990 -1 (9.54) 983 -2 (9.54) 3.0 % 1.00 [ 0.16, 1.84 ]
Toobert (MLP) 2005 163 -2.14 (9.15) 116 -0.44 (8.8) 0.5 % -1.70 [ -3.83, 0.43 ]
Subtotal (95% CI) 5640 5563 25.6 % -1.38 [ -1.67, -1.10 ]
Heterogeneity: Chi2 = 101.53, df = 16 (P<0.00001); I2 =84%
Test for overall effect: Z = 9.42 (P < 0.00001)
Total (95% CI) 45175 30225 100.0 % -2.41 [ -2.55, -2.26 ]
Heterogeneity: Chi2 = 530.18, df = 52 (P<0.00001); I2 =90%
Test for overall effect: Z = 32.38 (P < 0.00001)
Test for subgroup differences: Chi2 = 65.17, df = 1 (P = 0.00), I2 =98%
-10 -5 0 5 10
Favours treatment Favours control
145Multiple risk factor interventions for primary prevention of coronary heart disease (Review)
Copyright © 2011 The Cochrane Collaboration. Published by John Wiley & Sons, Ltd.
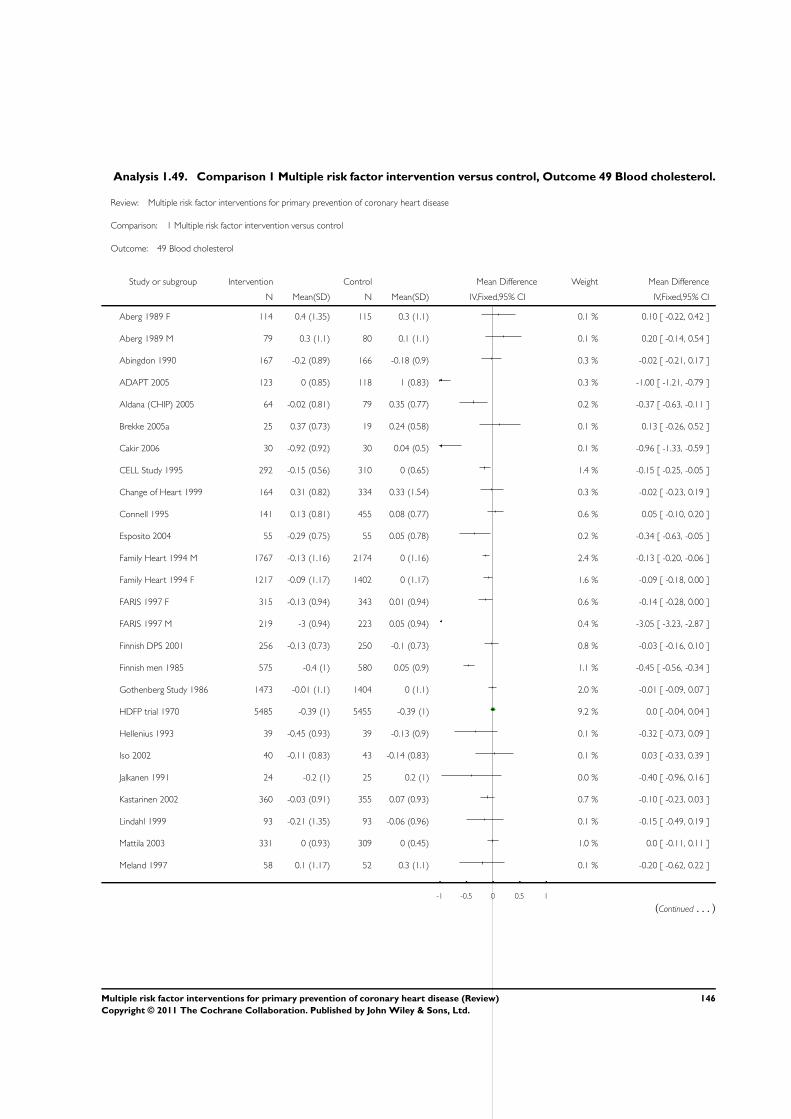
Analysis 1.49. Comparison 1 Multiple risk factor intervention versus control, Outcome 49 Blood cholesterol.
Review: Multiple risk factor interventions for primary prevention of coronary heart disease
Comparison: 1 Multiple risk factor intervention versus control
Outcome: 49 Blood cholesterol
Study or subgroup Intervention Control Mean Difference Weight Mean Difference
N Mean(SD) N Mean(SD) IV,Fixed,95% CI IV,Fixed,95% CI
Aberg 1989 F 114 0.4 (1.35) 115 0.3 (1.1) 0.1 % 0.10 [ -0.22, 0.42 ]
Aberg 1989 M 79 0.3 (1.1) 80 0.1 (1.1) 0.1 % 0.20 [ -0.14, 0.54 ]
Abingdon 1990 167 -0.2 (0.89) 166 -0.18 (0.9) 0.3 % -0.02 [ -0.21, 0.17 ]
ADAPT 2005 123 0 (0.85) 118 1 (0.83) 0.3 % -1.00 [ -1.21, -0.79 ]
Aldana (CHIP) 2005 64 -0.02 (0.81) 79 0.35 (0.77) 0.2 % -0.37 [ -0.63, -0.11 ]
Brekke 2005a 25 0.37 (0.73) 19 0.24 (0.58) 0.1 % 0.13 [ -0.26, 0.52 ]
Cakir 2006 30 -0.92 (0.92) 30 0.04 (0.5) 0.1 % -0.96 [ -1.33, -0.59 ]
CELL Study 1995 292 -0.15 (0.56) 310 0 (0.65) 1.4 % -0.15 [ -0.25, -0.05 ]
Change of Heart 1999 164 0.31 (0.82) 334 0.33 (1.54) 0.3 % -0.02 [ -0.23, 0.19 ]
Connell 1995 141 0.13 (0.81) 455 0.08 (0.77) 0.6 % 0.05 [ -0.10, 0.20 ]
Esposito 2004 55 -0.29 (0.75) 55 0.05 (0.78) 0.2 % -0.34 [ -0.63, -0.05 ]
Family Heart 1994 M 1767 -0.13 (1.16) 2174 0 (1.16) 2.4 % -0.13 [ -0.20, -0.06 ]
Family Heart 1994 F 1217 -0.09 (1.17) 1402 0 (1.17) 1.6 % -0.09 [ -0.18, 0.00 ]
FARIS 1997 F 315 -0.13 (0.94) 343 0.01 (0.94) 0.6 % -0.14 [ -0.28, 0.00 ]
FARIS 1997 M 219 -3 (0.94) 223 0.05 (0.94) 0.4 % -3.05 [ -3.23, -2.87 ]
Finnish DPS 2001 256 -0.13 (0.73) 250 -0.1 (0.73) 0.8 % -0.03 [ -0.16, 0.10 ]
Finnish men 1985 575 -0.4 (1) 580 0.05 (0.9) 1.1 % -0.45 [ -0.56, -0.34 ]
Gothenberg Study 1986 1473 -0.01 (1.1) 1404 0 (1.1) 2.0 % -0.01 [ -0.09, 0.07 ]
HDFP trial 1970 5485 -0.39 (1) 5455 -0.39 (1) 9.2 % 0.0 [ -0.04, 0.04 ]
Hellenius 1993 39 -0.45 (0.93) 39 -0.13 (0.9) 0.1 % -0.32 [ -0.73, 0.09 ]
Iso 2002 40 -0.11 (0.83) 43 -0.14 (0.83) 0.1 % 0.03 [ -0.33, 0.39 ]
Jalkanen 1991 24 -0.2 (1) 25 0.2 (1) 0.0 % -0.40 [ -0.96, 0.16 ]
Kastarinen 2002 360 -0.03 (0.91) 355 0.07 (0.93) 0.7 % -0.10 [ -0.23, 0.03 ]
Lindahl 1999 93 -0.21 (1.35) 93 -0.06 (0.96) 0.1 % -0.15 [ -0.49, 0.19 ]
Mattila 2003 331 0 (0.93) 309 0 (0.45) 1.0 % 0.0 [ -0.11, 0.11 ]
Meland 1997 58 0.1 (1.17) 52 0.3 (1.1) 0.1 % -0.20 [ -0.62, 0.22 ]
-1 -0.5 0 0.5 1
(Continued . . . )
146Multiple risk factor interventions for primary prevention of coronary heart disease (Review)
Copyright © 2011 The Cochrane Collaboration. Published by John Wiley & Sons, Ltd.
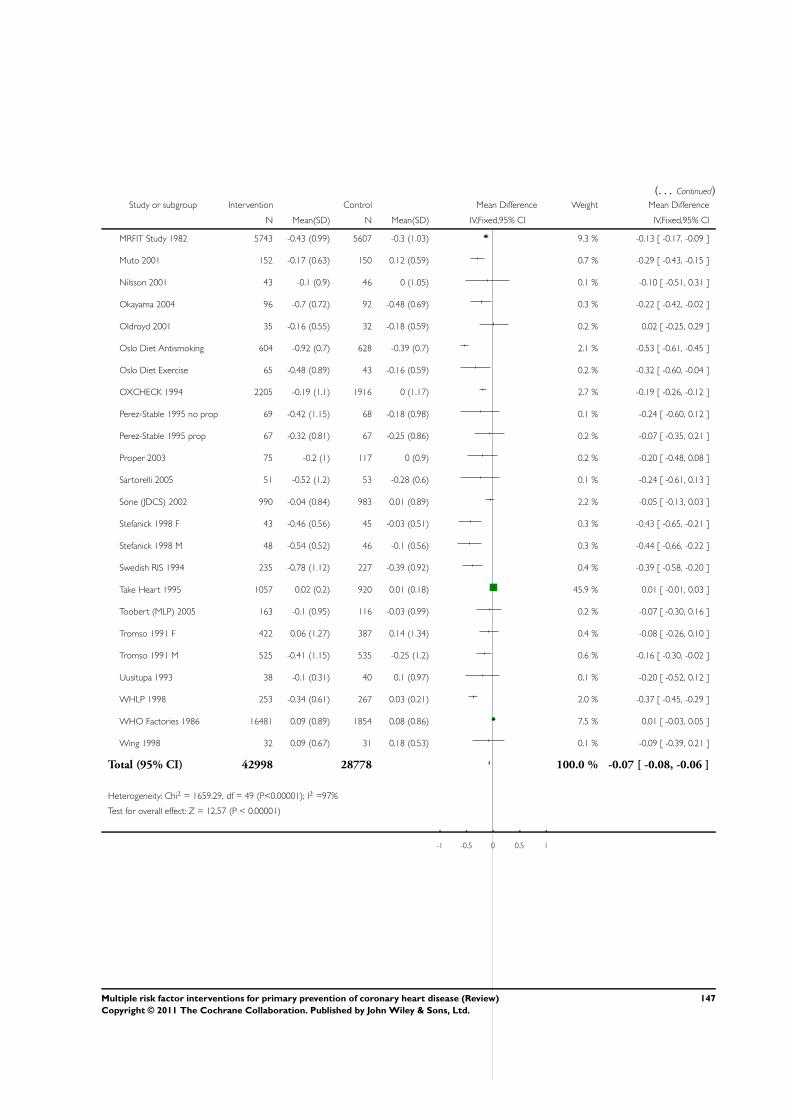
(. . . Continued)Study or subgroup Intervention Control Mean Difference Weight Mean Difference
N Mean(SD) N Mean(SD) IV,Fixed,95% CI IV,Fixed,95% CI
MRFIT Study 1982 5743 -0.43 (0.99) 5607 -0.3 (1.03) 9.3 % -0.13 [ -0.17, -0.09 ]
Muto 2001 152 -0.17 (0.63) 150 0.12 (0.59) 0.7 % -0.29 [ -0.43, -0.15 ]
Nilsson 2001 43 -0.1 (0.9) 46 0 (1.05) 0.1 % -0.10 [ -0.51, 0.31 ]
Okayama 2004 96 -0.7 (0.72) 92 -0.48 (0.69) 0.3 % -0.22 [ -0.42, -0.02 ]
Oldroyd 2001 35 -0.16 (0.55) 32 -0.18 (0.59) 0.2 % 0.02 [ -0.25, 0.29 ]
Oslo Diet Antismoking 604 -0.92 (0.7) 628 -0.39 (0.7) 2.1 % -0.53 [ -0.61, -0.45 ]
Oslo Diet Exercise 65 -0.48 (0.89) 43 -0.16 (0.59) 0.2 % -0.32 [ -0.60, -0.04 ]
OXCHECK 1994 2205 -0.19 (1.1) 1916 0 (1.17) 2.7 % -0.19 [ -0.26, -0.12 ]
Perez-Stable 1995 no prop 69 -0.42 (1.15) 68 -0.18 (0.98) 0.1 % -0.24 [ -0.60, 0.12 ]
Perez-Stable 1995 prop 67 -0.32 (0.81) 67 -0.25 (0.86) 0.2 % -0.07 [ -0.35, 0.21 ]
Proper 2003 75 -0.2 (1) 117 0 (0.9) 0.2 % -0.20 [ -0.48, 0.08 ]
Sartorelli 2005 51 -0.52 (1.2) 53 -0.28 (0.6) 0.1 % -0.24 [ -0.61, 0.13 ]
Sone (JDCS) 2002 990 -0.04 (0.84) 983 0.01 (0.89) 2.2 % -0.05 [ -0.13, 0.03 ]
Stefanick 1998 F 43 -0.46 (0.56) 45 -0.03 (0.51) 0.3 % -0.43 [ -0.65, -0.21 ]
Stefanick 1998 M 48 -0.54 (0.52) 46 -0.1 (0.56) 0.3 % -0.44 [ -0.66, -0.22 ]
Swedish RIS 1994 235 -0.78 (1.12) 227 -0.39 (0.92) 0.4 % -0.39 [ -0.58, -0.20 ]
Take Heart 1995 1057 0.02 (0.2) 920 0.01 (0.18) 45.9 % 0.01 [ -0.01, 0.03 ]
Toobert (MLP) 2005 163 -0.1 (0.95) 116 -0.03 (0.99) 0.2 % -0.07 [ -0.30, 0.16 ]
Tromso 1991 F 422 0.06 (1.27) 387 0.14 (1.34) 0.4 % -0.08 [ -0.26, 0.10 ]
Tromso 1991 M 525 -0.41 (1.15) 535 -0.25 (1.2) 0.6 % -0.16 [ -0.30, -0.02 ]
Uusitupa 1993 38 -0.1 (0.31) 40 0.1 (0.97) 0.1 % -0.20 [ -0.52, 0.12 ]
WHLP 1998 253 -0.34 (0.61) 267 0.03 (0.21) 2.0 % -0.37 [ -0.45, -0.29 ]
WHO Factories 1986 16481 0.09 (0.89) 1854 0.08 (0.86) 7.5 % 0.01 [ -0.03, 0.05 ]
Wing 1998 32 0.09 (0.67) 31 0.18 (0.53) 0.1 % -0.09 [ -0.39, 0.21 ]
Total (95% CI) 42998 28778 100.0 % -0.07 [ -0.08, -0.06 ]
Heterogeneity: Chi2 = 1659.29, df = 49 (P<0.00001); I2 =97%
Test for overall effect: Z = 12.57 (P < 0.00001)
-1 -0.5 0 0.5 1
147Multiple risk factor interventions for primary prevention of coronary heart disease (Review)
Copyright © 2011 The Cochrane Collaboration. Published by John Wiley & Sons, Ltd.
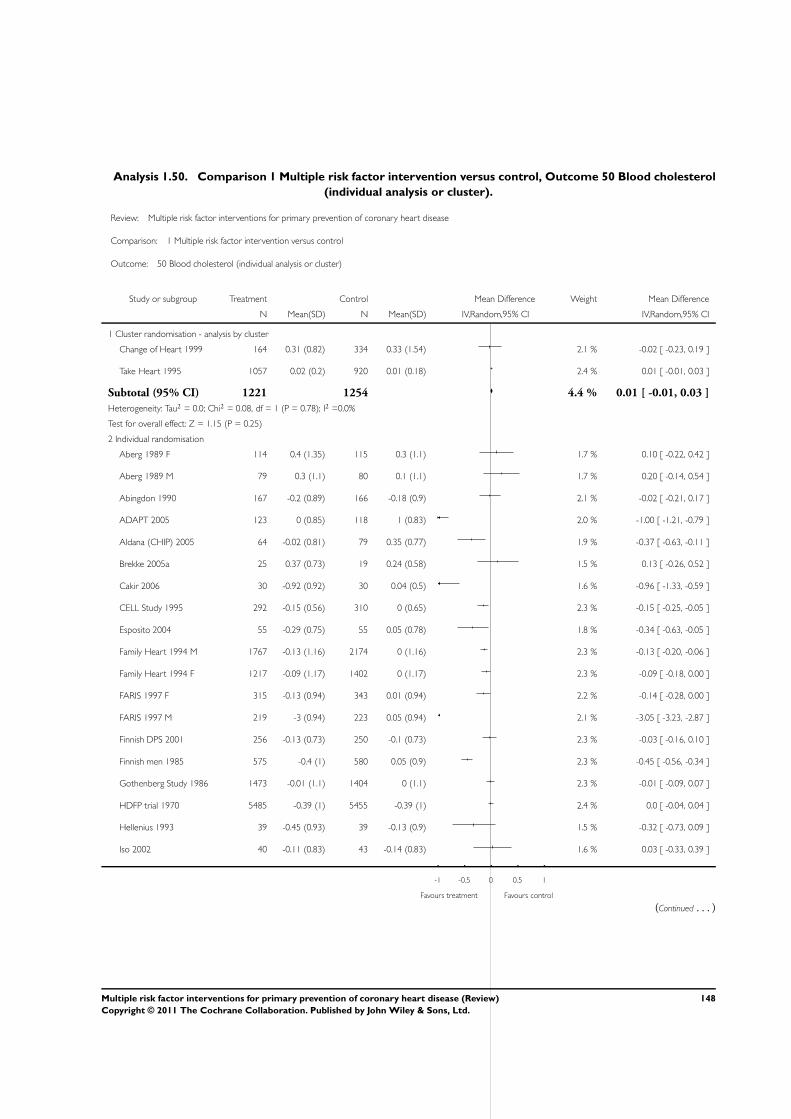
Analysis 1.50. Comparison 1 Multiple risk factor intervention versus control, Outcome 50 Blood cholesterol
(individual analysis or cluster).
Review: Multiple risk factor interventions for primary prevention of coronary heart disease
Comparison: 1 Multiple risk factor intervention versus control
Outcome: 50 Blood cholesterol (individual analysis or cluster)
Study or subgroup Treatment Control Mean Difference Weight Mean Difference
N Mean(SD) N Mean(SD) IV,Random,95% CI IV,Random,95% CI
1 Cluster randomisation - analysis by cluster
Change of Heart 1999 164 0.31 (0.82) 334 0.33 (1.54) 2.1 % -0.02 [ -0.23, 0.19 ]
Take Heart 1995 1057 0.02 (0.2) 920 0.01 (0.18) 2.4 % 0.01 [ -0.01, 0.03 ]
Subtotal (95% CI) 1221 1254 4.4 % 0.01 [ -0.01, 0.03 ]
Heterogeneity: Tau2 = 0.0; Chi2 = 0.08, df = 1 (P = 0.78); I2 =0.0%
Test for overall effect: Z = 1.15 (P = 0.25)
2 Individual randomisation
Aberg 1989 F 114 0.4 (1.35) 115 0.3 (1.1) 1.7 % 0.10 [ -0.22, 0.42 ]
Aberg 1989 M 79 0.3 (1.1) 80 0.1 (1.1) 1.7 % 0.20 [ -0.14, 0.54 ]
Abingdon 1990 167 -0.2 (0.89) 166 -0.18 (0.9) 2.1 % -0.02 [ -0.21, 0.17 ]
ADAPT 2005 123 0 (0.85) 118 1 (0.83) 2.0 % -1.00 [ -1.21, -0.79 ]
Aldana (CHIP) 2005 64 -0.02 (0.81) 79 0.35 (0.77) 1.9 % -0.37 [ -0.63, -0.11 ]
Brekke 2005a 25 0.37 (0.73) 19 0.24 (0.58) 1.5 % 0.13 [ -0.26, 0.52 ]
Cakir 2006 30 -0.92 (0.92) 30 0.04 (0.5) 1.6 % -0.96 [ -1.33, -0.59 ]
CELL Study 1995 292 -0.15 (0.56) 310 0 (0.65) 2.3 % -0.15 [ -0.25, -0.05 ]
Esposito 2004 55 -0.29 (0.75) 55 0.05 (0.78) 1.8 % -0.34 [ -0.63, -0.05 ]
Family Heart 1994 M 1767 -0.13 (1.16) 2174 0 (1.16) 2.3 % -0.13 [ -0.20, -0.06 ]
Family Heart 1994 F 1217 -0.09 (1.17) 1402 0 (1.17) 2.3 % -0.09 [ -0.18, 0.00 ]
FARIS 1997 F 315 -0.13 (0.94) 343 0.01 (0.94) 2.2 % -0.14 [ -0.28, 0.00 ]
FARIS 1997 M 219 -3 (0.94) 223 0.05 (0.94) 2.1 % -3.05 [ -3.23, -2.87 ]
Finnish DPS 2001 256 -0.13 (0.73) 250 -0.1 (0.73) 2.3 % -0.03 [ -0.16, 0.10 ]
Finnish men 1985 575 -0.4 (1) 580 0.05 (0.9) 2.3 % -0.45 [ -0.56, -0.34 ]
Gothenberg Study 1986 1473 -0.01 (1.1) 1404 0 (1.1) 2.3 % -0.01 [ -0.09, 0.07 ]
HDFP trial 1970 5485 -0.39 (1) 5455 -0.39 (1) 2.4 % 0.0 [ -0.04, 0.04 ]
Hellenius 1993 39 -0.45 (0.93) 39 -0.13 (0.9) 1.5 % -0.32 [ -0.73, 0.09 ]
Iso 2002 40 -0.11 (0.83) 43 -0.14 (0.83) 1.6 % 0.03 [ -0.33, 0.39 ]
-1 -0.5 0 0.5 1
Favours treatment Favours control
(Continued . . . )
148Multiple risk factor interventions for primary prevention of coronary heart disease (Review)
Copyright © 2011 The Cochrane Collaboration. Published by John Wiley & Sons, Ltd.
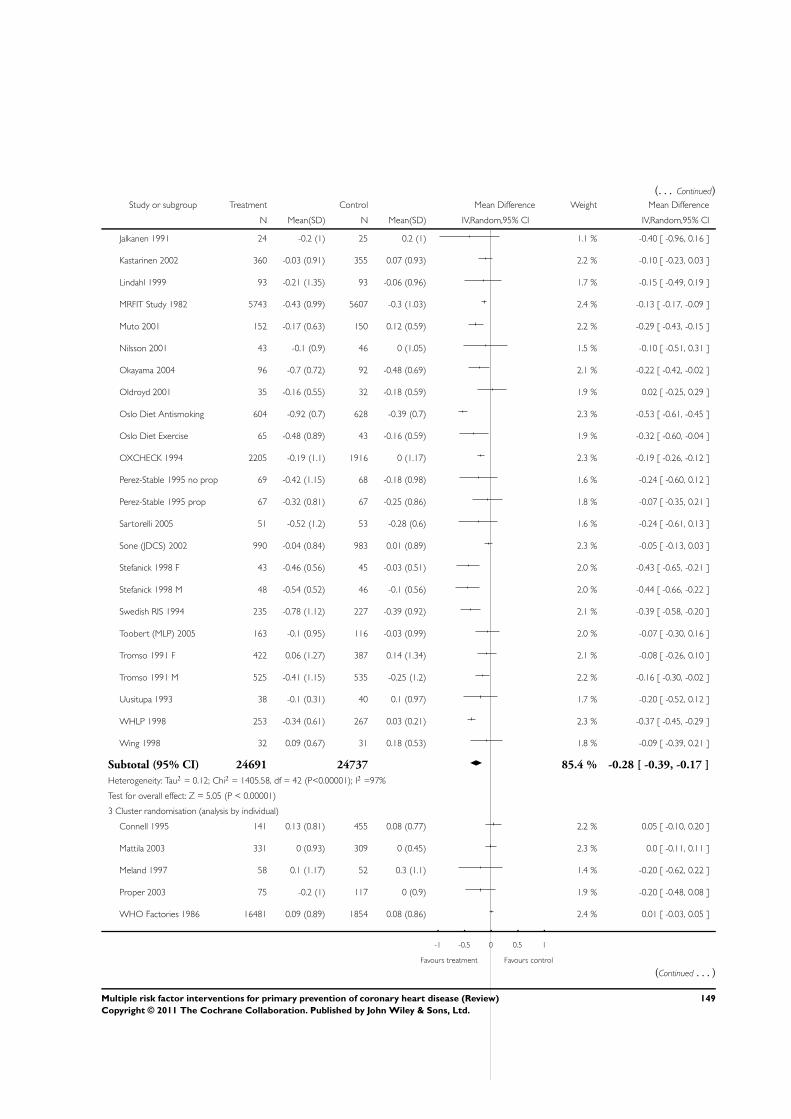
(. . . Continued)Study or subgroup Treatment Control Mean Difference Weight Mean Difference
N Mean(SD) N Mean(SD) IV,Random,95% CI IV,Random,95% CI
Jalkanen 1991 24 -0.2 (1) 25 0.2 (1) 1.1 % -0.40 [ -0.96, 0.16 ]
Kastarinen 2002 360 -0.03 (0.91) 355 0.07 (0.93) 2.2 % -0.10 [ -0.23, 0.03 ]
Lindahl 1999 93 -0.21 (1.35) 93 -0.06 (0.96) 1.7 % -0.15 [ -0.49, 0.19 ]
MRFIT Study 1982 5743 -0.43 (0.99) 5607 -0.3 (1.03) 2.4 % -0.13 [ -0.17, -0.09 ]
Muto 2001 152 -0.17 (0.63) 150 0.12 (0.59) 2.2 % -0.29 [ -0.43, -0.15 ]
Nilsson 2001 43 -0.1 (0.9) 46 0 (1.05) 1.5 % -0.10 [ -0.51, 0.31 ]
Okayama 2004 96 -0.7 (0.72) 92 -0.48 (0.69) 2.1 % -0.22 [ -0.42, -0.02 ]
Oldroyd 2001 35 -0.16 (0.55) 32 -0.18 (0.59) 1.9 % 0.02 [ -0.25, 0.29 ]
Oslo Diet Antismoking 604 -0.92 (0.7) 628 -0.39 (0.7) 2.3 % -0.53 [ -0.61, -0.45 ]
Oslo Diet Exercise 65 -0.48 (0.89) 43 -0.16 (0.59) 1.9 % -0.32 [ -0.60, -0.04 ]
OXCHECK 1994 2205 -0.19 (1.1) 1916 0 (1.17) 2.3 % -0.19 [ -0.26, -0.12 ]
Perez-Stable 1995 no prop 69 -0.42 (1.15) 68 -0.18 (0.98) 1.6 % -0.24 [ -0.60, 0.12 ]
Perez-Stable 1995 prop 67 -0.32 (0.81) 67 -0.25 (0.86) 1.8 % -0.07 [ -0.35, 0.21 ]
Sartorelli 2005 51 -0.52 (1.2) 53 -0.28 (0.6) 1.6 % -0.24 [ -0.61, 0.13 ]
Sone (JDCS) 2002 990 -0.04 (0.84) 983 0.01 (0.89) 2.3 % -0.05 [ -0.13, 0.03 ]
Stefanick 1998 F 43 -0.46 (0.56) 45 -0.03 (0.51) 2.0 % -0.43 [ -0.65, -0.21 ]
Stefanick 1998 M 48 -0.54 (0.52) 46 -0.1 (0.56) 2.0 % -0.44 [ -0.66, -0.22 ]
Swedish RIS 1994 235 -0.78 (1.12) 227 -0.39 (0.92) 2.1 % -0.39 [ -0.58, -0.20 ]
Toobert (MLP) 2005 163 -0.1 (0.95) 116 -0.03 (0.99) 2.0 % -0.07 [ -0.30, 0.16 ]
Tromso 1991 F 422 0.06 (1.27) 387 0.14 (1.34) 2.1 % -0.08 [ -0.26, 0.10 ]
Tromso 1991 M 525 -0.41 (1.15) 535 -0.25 (1.2) 2.2 % -0.16 [ -0.30, -0.02 ]
Uusitupa 1993 38 -0.1 (0.31) 40 0.1 (0.97) 1.7 % -0.20 [ -0.52, 0.12 ]
WHLP 1998 253 -0.34 (0.61) 267 0.03 (0.21) 2.3 % -0.37 [ -0.45, -0.29 ]
Wing 1998 32 0.09 (0.67) 31 0.18 (0.53) 1.8 % -0.09 [ -0.39, 0.21 ]
Subtotal (95% CI) 24691 24737 85.4 % -0.28 [ -0.39, -0.17 ]
Heterogeneity: Tau2 = 0.12; Chi2 = 1405.58, df = 42 (P<0.00001); I2 =97%
Test for overall effect: Z = 5.05 (P < 0.00001)
3 Cluster randomisation (analysis by individual)
Connell 1995 141 0.13 (0.81) 455 0.08 (0.77) 2.2 % 0.05 [ -0.10, 0.20 ]
Mattila 2003 331 0 (0.93) 309 0 (0.45) 2.3 % 0.0 [ -0.11, 0.11 ]
Meland 1997 58 0.1 (1.17) 52 0.3 (1.1) 1.4 % -0.20 [ -0.62, 0.22 ]
Proper 2003 75 -0.2 (1) 117 0 (0.9) 1.9 % -0.20 [ -0.48, 0.08 ]
WHO Factories 1986 16481 0.09 (0.89) 1854 0.08 (0.86) 2.4 % 0.01 [ -0.03, 0.05 ]
-1 -0.5 0 0.5 1
Favours treatment Favours control
(Continued . . . )
149Multiple risk factor interventions for primary prevention of coronary heart disease (Review)
Copyright © 2011 The Cochrane Collaboration. Published by John Wiley & Sons, Ltd.
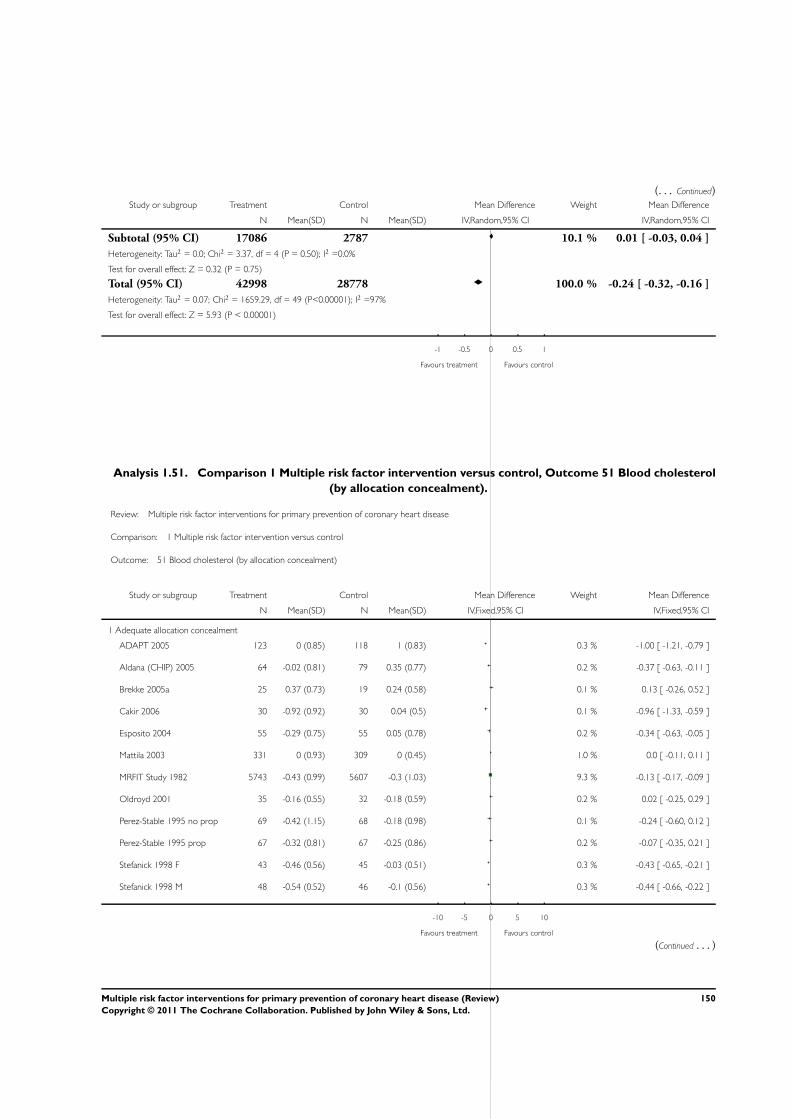
(. . . Continued)Study or subgroup Treatment Control Mean Difference Weight Mean Difference
N Mean(SD) N Mean(SD) IV,Random,95% CI IV,Random,95% CI
Subtotal (95% CI) 17086 2787 10.1 % 0.01 [ -0.03, 0.04 ]
Heterogeneity: Tau2 = 0.0; Chi2 = 3.37, df = 4 (P = 0.50); I2 =0.0%
Test for overall effect: Z = 0.32 (P = 0.75)
Total (95% CI) 42998 28778 100.0 % -0.24 [ -0.32, -0.16 ]
Heterogeneity: Tau2 = 0.07; Chi2 = 1659.29, df = 49 (P<0.00001); I2 =97%
Test for overall effect: Z = 5.93 (P < 0.00001)
-1 -0.5 0 0.5 1
Favours treatment Favours control
Analysis 1.51. Comparison 1 Multiple risk factor intervention versus control, Outcome 51 Blood cholesterol
(by allocation concealment).
Review: Multiple risk factor interventions for primary prevention of coronary heart disease
Comparison: 1 Multiple risk factor intervention versus control
Outcome: 51 Blood cholesterol (by allocation concealment)
Study or subgroup Treatment Control Mean Difference Weight Mean Difference
N Mean(SD) N Mean(SD) IV,Fixed,95% CI IV,Fixed,95% CI
1 Adequate allocation concealment
ADAPT 2005 123 0 (0.85) 118 1 (0.83) 0.3 % -1.00 [ -1.21, -0.79 ]
Aldana (CHIP) 2005 64 -0.02 (0.81) 79 0.35 (0.77) 0.2 % -0.37 [ -0.63, -0.11 ]
Brekke 2005a 25 0.37 (0.73) 19 0.24 (0.58) 0.1 % 0.13 [ -0.26, 0.52 ]
Cakir 2006 30 -0.92 (0.92) 30 0.04 (0.5) 0.1 % -0.96 [ -1.33, -0.59 ]
Esposito 2004 55 -0.29 (0.75) 55 0.05 (0.78) 0.2 % -0.34 [ -0.63, -0.05 ]
Mattila 2003 331 0 (0.93) 309 0 (0.45) 1.0 % 0.0 [ -0.11, 0.11 ]
MRFIT Study 1982 5743 -0.43 (0.99) 5607 -0.3 (1.03) 9.3 % -0.13 [ -0.17, -0.09 ]
Oldroyd 2001 35 -0.16 (0.55) 32 -0.18 (0.59) 0.2 % 0.02 [ -0.25, 0.29 ]
Perez-Stable 1995 no prop 69 -0.42 (1.15) 68 -0.18 (0.98) 0.1 % -0.24 [ -0.60, 0.12 ]
Perez-Stable 1995 prop 67 -0.32 (0.81) 67 -0.25 (0.86) 0.2 % -0.07 [ -0.35, 0.21 ]
Stefanick 1998 F 43 -0.46 (0.56) 45 -0.03 (0.51) 0.3 % -0.43 [ -0.65, -0.21 ]
Stefanick 1998 M 48 -0.54 (0.52) 46 -0.1 (0.56) 0.3 % -0.44 [ -0.66, -0.22 ]
-10 -5 0 5 10
Favours treatment Favours control
(Continued . . . )
150Multiple risk factor interventions for primary prevention of coronary heart disease (Review)
Copyright © 2011 The Cochrane Collaboration. Published by John Wiley & Sons, Ltd.
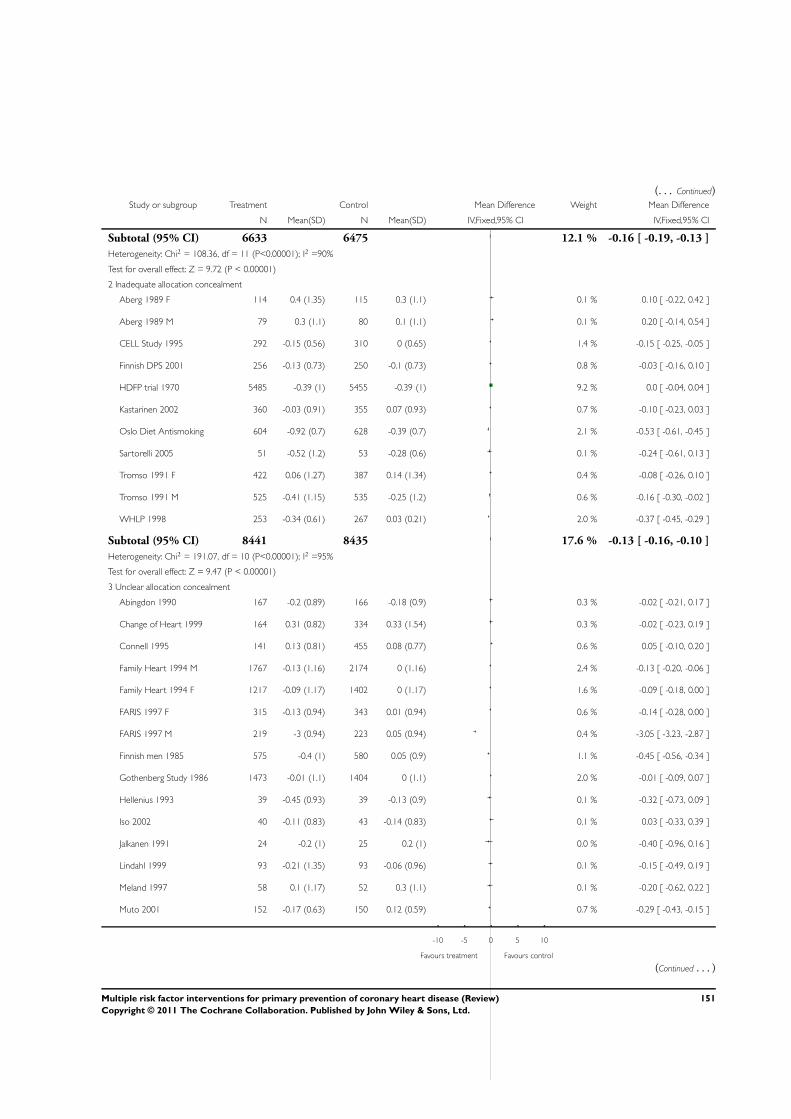
(. . . Continued)Study or subgroup Treatment Control Mean Difference Weight Mean Difference
N Mean(SD) N Mean(SD) IV,Fixed,95% CI IV,Fixed,95% CI
Subtotal (95% CI) 6633 6475 12.1 % -0.16 [ -0.19, -0.13 ]
Heterogeneity: Chi2 = 108.36, df = 11 (P<0.00001); I2 =90%
Test for overall effect: Z = 9.72 (P < 0.00001)
2 Inadequate allocation concealment
Aberg 1989 F 114 0.4 (1.35) 115 0.3 (1.1) 0.1 % 0.10 [ -0.22, 0.42 ]
Aberg 1989 M 79 0.3 (1.1) 80 0.1 (1.1) 0.1 % 0.20 [ -0.14, 0.54 ]
CELL Study 1995 292 -0.15 (0.56) 310 0 (0.65) 1.4 % -0.15 [ -0.25, -0.05 ]
Finnish DPS 2001 256 -0.13 (0.73) 250 -0.1 (0.73) 0.8 % -0.03 [ -0.16, 0.10 ]
HDFP trial 1970 5485 -0.39 (1) 5455 -0.39 (1) 9.2 % 0.0 [ -0.04, 0.04 ]
Kastarinen 2002 360 -0.03 (0.91) 355 0.07 (0.93) 0.7 % -0.10 [ -0.23, 0.03 ]
Oslo Diet Antismoking 604 -0.92 (0.7) 628 -0.39 (0.7) 2.1 % -0.53 [ -0.61, -0.45 ]
Sartorelli 2005 51 -0.52 (1.2) 53 -0.28 (0.6) 0.1 % -0.24 [ -0.61, 0.13 ]
Tromso 1991 F 422 0.06 (1.27) 387 0.14 (1.34) 0.4 % -0.08 [ -0.26, 0.10 ]
Tromso 1991 M 525 -0.41 (1.15) 535 -0.25 (1.2) 0.6 % -0.16 [ -0.30, -0.02 ]
WHLP 1998 253 -0.34 (0.61) 267 0.03 (0.21) 2.0 % -0.37 [ -0.45, -0.29 ]
Subtotal (95% CI) 8441 8435 17.6 % -0.13 [ -0.16, -0.10 ]
Heterogeneity: Chi2 = 191.07, df = 10 (P<0.00001); I2 =95%
Test for overall effect: Z = 9.47 (P < 0.00001)
3 Unclear allocation concealment
Abingdon 1990 167 -0.2 (0.89) 166 -0.18 (0.9) 0.3 % -0.02 [ -0.21, 0.17 ]
Change of Heart 1999 164 0.31 (0.82) 334 0.33 (1.54) 0.3 % -0.02 [ -0.23, 0.19 ]
Connell 1995 141 0.13 (0.81) 455 0.08 (0.77) 0.6 % 0.05 [ -0.10, 0.20 ]
Family Heart 1994 M 1767 -0.13 (1.16) 2174 0 (1.16) 2.4 % -0.13 [ -0.20, -0.06 ]
Family Heart 1994 F 1217 -0.09 (1.17) 1402 0 (1.17) 1.6 % -0.09 [ -0.18, 0.00 ]
FARIS 1997 F 315 -0.13 (0.94) 343 0.01 (0.94) 0.6 % -0.14 [ -0.28, 0.00 ]
FARIS 1997 M 219 -3 (0.94) 223 0.05 (0.94) 0.4 % -3.05 [ -3.23, -2.87 ]
Finnish men 1985 575 -0.4 (1) 580 0.05 (0.9) 1.1 % -0.45 [ -0.56, -0.34 ]
Gothenberg Study 1986 1473 -0.01 (1.1) 1404 0 (1.1) 2.0 % -0.01 [ -0.09, 0.07 ]
Hellenius 1993 39 -0.45 (0.93) 39 -0.13 (0.9) 0.1 % -0.32 [ -0.73, 0.09 ]
Iso 2002 40 -0.11 (0.83) 43 -0.14 (0.83) 0.1 % 0.03 [ -0.33, 0.39 ]
Jalkanen 1991 24 -0.2 (1) 25 0.2 (1) 0.0 % -0.40 [ -0.96, 0.16 ]
Lindahl 1999 93 -0.21 (1.35) 93 -0.06 (0.96) 0.1 % -0.15 [ -0.49, 0.19 ]
Meland 1997 58 0.1 (1.17) 52 0.3 (1.1) 0.1 % -0.20 [ -0.62, 0.22 ]
Muto 2001 152 -0.17 (0.63) 150 0.12 (0.59) 0.7 % -0.29 [ -0.43, -0.15 ]
-10 -5 0 5 10
Favours treatment Favours control
(Continued . . . )
151Multiple risk factor interventions for primary prevention of coronary heart disease (Review)
Copyright © 2011 The Cochrane Collaboration. Published by John Wiley & Sons, Ltd.
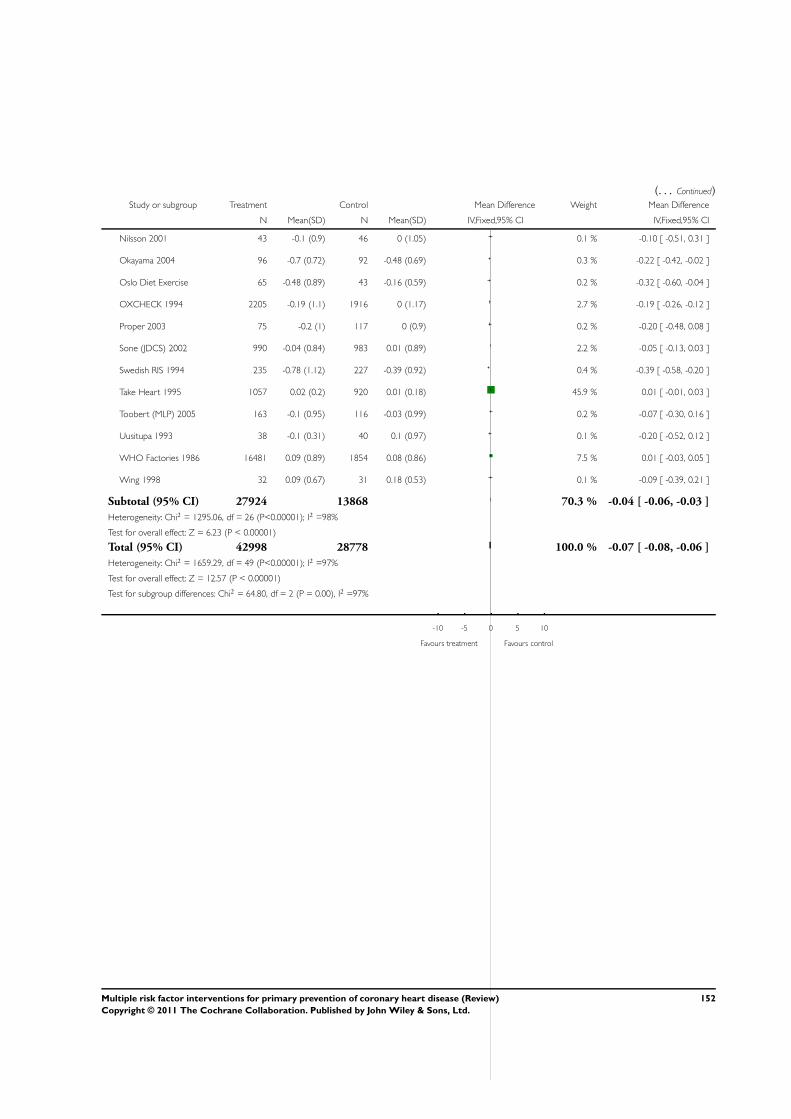
(. . . Continued)Study or subgroup Treatment Control Mean Difference Weight Mean Difference
N Mean(SD) N Mean(SD) IV,Fixed,95% CI IV,Fixed,95% CI
Nilsson 2001 43 -0.1 (0.9) 46 0 (1.05) 0.1 % -0.10 [ -0.51, 0.31 ]
Okayama 2004 96 -0.7 (0.72) 92 -0.48 (0.69) 0.3 % -0.22 [ -0.42, -0.02 ]
Oslo Diet Exercise 65 -0.48 (0.89) 43 -0.16 (0.59) 0.2 % -0.32 [ -0.60, -0.04 ]
OXCHECK 1994 2205 -0.19 (1.1) 1916 0 (1.17) 2.7 % -0.19 [ -0.26, -0.12 ]
Proper 2003 75 -0.2 (1) 117 0 (0.9) 0.2 % -0.20 [ -0.48, 0.08 ]
Sone (JDCS) 2002 990 -0.04 (0.84) 983 0.01 (0.89) 2.2 % -0.05 [ -0.13, 0.03 ]
Swedish RIS 1994 235 -0.78 (1.12) 227 -0.39 (0.92) 0.4 % -0.39 [ -0.58, -0.20 ]
Take Heart 1995 1057 0.02 (0.2) 920 0.01 (0.18) 45.9 % 0.01 [ -0.01, 0.03 ]
Toobert (MLP) 2005 163 -0.1 (0.95) 116 -0.03 (0.99) 0.2 % -0.07 [ -0.30, 0.16 ]
Uusitupa 1993 38 -0.1 (0.31) 40 0.1 (0.97) 0.1 % -0.20 [ -0.52, 0.12 ]
WHO Factories 1986 16481 0.09 (0.89) 1854 0.08 (0.86) 7.5 % 0.01 [ -0.03, 0.05 ]
Wing 1998 32 0.09 (0.67) 31 0.18 (0.53) 0.1 % -0.09 [ -0.39, 0.21 ]
Subtotal (95% CI) 27924 13868 70.3 % -0.04 [ -0.06, -0.03 ]
Heterogeneity: Chi2 = 1295.06, df = 26 (P<0.00001); I2 =98%
Test for overall effect: Z = 6.23 (P < 0.00001)
Total (95% CI) 42998 28778 100.0 % -0.07 [ -0.08, -0.06 ]
Heterogeneity: Chi2 = 1659.29, df = 49 (P<0.00001); I2 =97%
Test for overall effect: Z = 12.57 (P < 0.00001)
Test for subgroup differences: Chi2 = 64.80, df = 2 (P = 0.00), I2 =97%
-10 -5 0 5 10
Favours treatment Favours control
152Multiple risk factor interventions for primary prevention of coronary heart disease (Review)
Copyright © 2011 The Cochrane Collaboration. Published by John Wiley & Sons, Ltd.
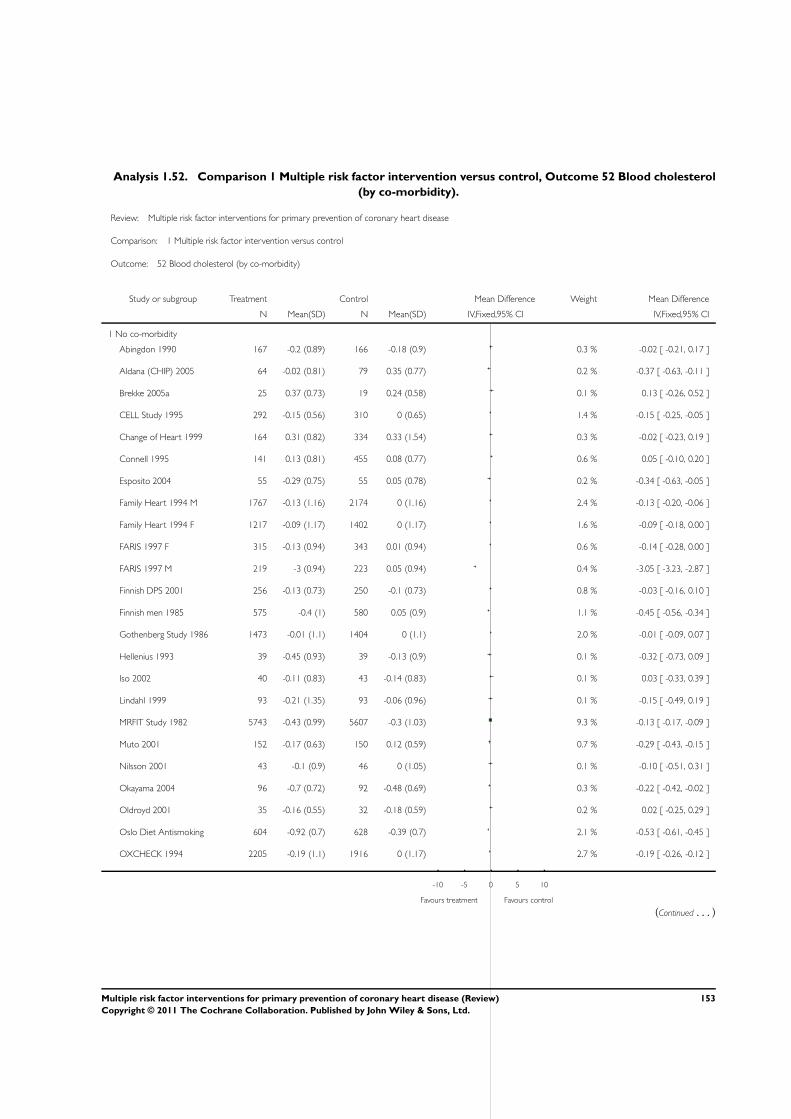
Analysis 1.52. Comparison 1 Multiple risk factor intervention versus control, Outcome 52 Blood cholesterol
(by co-morbidity).
Review: Multiple risk factor interventions for primary prevention of coronary heart disease
Comparison: 1 Multiple risk factor intervention versus control
Outcome: 52 Blood cholesterol (by co-morbidity)
Study or subgroup Treatment Control Mean Difference Weight Mean Difference
N Mean(SD) N Mean(SD) IV,Fixed,95% CI IV,Fixed,95% CI
1 No co-morbidity
Abingdon 1990 167 -0.2 (0.89) 166 -0.18 (0.9) 0.3 % -0.02 [ -0.21, 0.17 ]
Aldana (CHIP) 2005 64 -0.02 (0.81) 79 0.35 (0.77) 0.2 % -0.37 [ -0.63, -0.11 ]
Brekke 2005a 25 0.37 (0.73) 19 0.24 (0.58) 0.1 % 0.13 [ -0.26, 0.52 ]
CELL Study 1995 292 -0.15 (0.56) 310 0 (0.65) 1.4 % -0.15 [ -0.25, -0.05 ]
Change of Heart 1999 164 0.31 (0.82) 334 0.33 (1.54) 0.3 % -0.02 [ -0.23, 0.19 ]
Connell 1995 141 0.13 (0.81) 455 0.08 (0.77) 0.6 % 0.05 [ -0.10, 0.20 ]
Esposito 2004 55 -0.29 (0.75) 55 0.05 (0.78) 0.2 % -0.34 [ -0.63, -0.05 ]
Family Heart 1994 M 1767 -0.13 (1.16) 2174 0 (1.16) 2.4 % -0.13 [ -0.20, -0.06 ]
Family Heart 1994 F 1217 -0.09 (1.17) 1402 0 (1.17) 1.6 % -0.09 [ -0.18, 0.00 ]
FARIS 1997 F 315 -0.13 (0.94) 343 0.01 (0.94) 0.6 % -0.14 [ -0.28, 0.00 ]
FARIS 1997 M 219 -3 (0.94) 223 0.05 (0.94) 0.4 % -3.05 [ -3.23, -2.87 ]
Finnish DPS 2001 256 -0.13 (0.73) 250 -0.1 (0.73) 0.8 % -0.03 [ -0.16, 0.10 ]
Finnish men 1985 575 -0.4 (1) 580 0.05 (0.9) 1.1 % -0.45 [ -0.56, -0.34 ]
Gothenberg Study 1986 1473 -0.01 (1.1) 1404 0 (1.1) 2.0 % -0.01 [ -0.09, 0.07 ]
Hellenius 1993 39 -0.45 (0.93) 39 -0.13 (0.9) 0.1 % -0.32 [ -0.73, 0.09 ]
Iso 2002 40 -0.11 (0.83) 43 -0.14 (0.83) 0.1 % 0.03 [ -0.33, 0.39 ]
Lindahl 1999 93 -0.21 (1.35) 93 -0.06 (0.96) 0.1 % -0.15 [ -0.49, 0.19 ]
MRFIT Study 1982 5743 -0.43 (0.99) 5607 -0.3 (1.03) 9.3 % -0.13 [ -0.17, -0.09 ]
Muto 2001 152 -0.17 (0.63) 150 0.12 (0.59) 0.7 % -0.29 [ -0.43, -0.15 ]
Nilsson 2001 43 -0.1 (0.9) 46 0 (1.05) 0.1 % -0.10 [ -0.51, 0.31 ]
Okayama 2004 96 -0.7 (0.72) 92 -0.48 (0.69) 0.3 % -0.22 [ -0.42, -0.02 ]
Oldroyd 2001 35 -0.16 (0.55) 32 -0.18 (0.59) 0.2 % 0.02 [ -0.25, 0.29 ]
Oslo Diet Antismoking 604 -0.92 (0.7) 628 -0.39 (0.7) 2.1 % -0.53 [ -0.61, -0.45 ]
OXCHECK 1994 2205 -0.19 (1.1) 1916 0 (1.17) 2.7 % -0.19 [ -0.26, -0.12 ]
-10 -5 0 5 10
Favours treatment Favours control
(Continued . . . )
153Multiple risk factor interventions for primary prevention of coronary heart disease (Review)
Copyright © 2011 The Cochrane Collaboration. Published by John Wiley & Sons, Ltd.
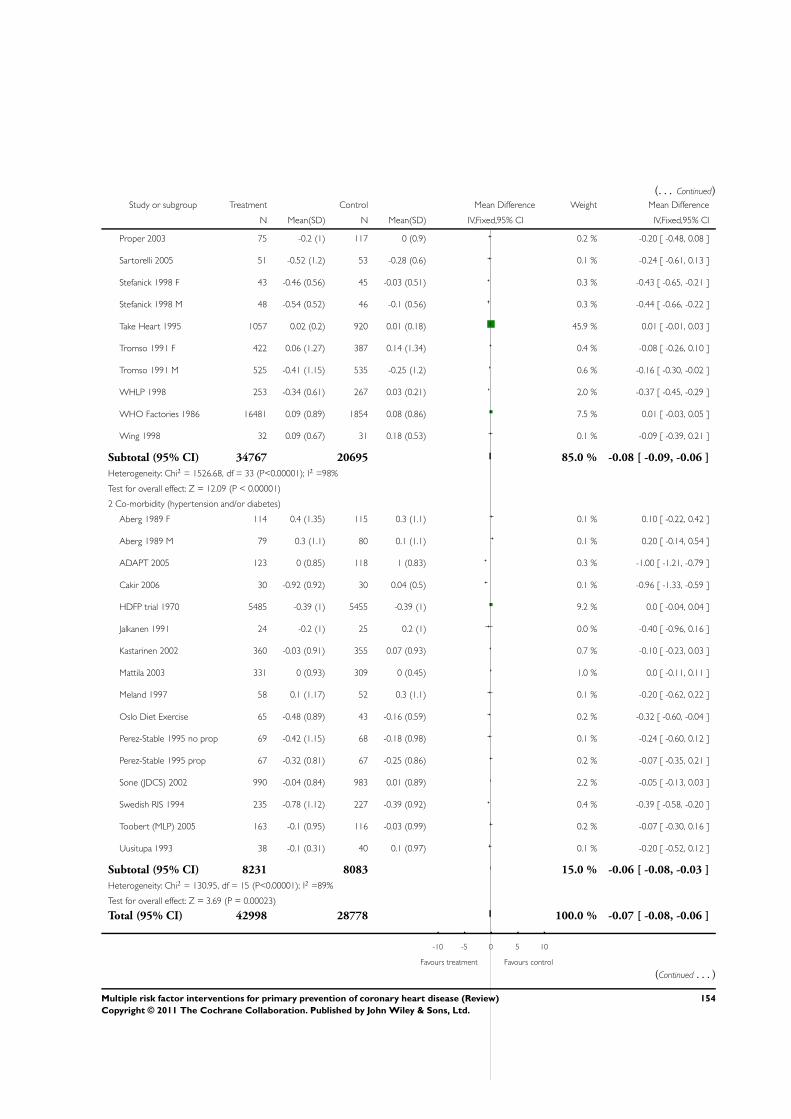
(. . . Continued)Study or subgroup Treatment Control Mean Difference Weight Mean Difference
N Mean(SD) N Mean(SD) IV,Fixed,95% CI IV,Fixed,95% CI
Proper 2003 75 -0.2 (1) 117 0 (0.9) 0.2 % -0.20 [ -0.48, 0.08 ]
Sartorelli 2005 51 -0.52 (1.2) 53 -0.28 (0.6) 0.1 % -0.24 [ -0.61, 0.13 ]
Stefanick 1998 F 43 -0.46 (0.56) 45 -0.03 (0.51) 0.3 % -0.43 [ -0.65, -0.21 ]
Stefanick 1998 M 48 -0.54 (0.52) 46 -0.1 (0.56) 0.3 % -0.44 [ -0.66, -0.22 ]
Take Heart 1995 1057 0.02 (0.2) 920 0.01 (0.18) 45.9 % 0.01 [ -0.01, 0.03 ]
Tromso 1991 F 422 0.06 (1.27) 387 0.14 (1.34) 0.4 % -0.08 [ -0.26, 0.10 ]
Tromso 1991 M 525 -0.41 (1.15) 535 -0.25 (1.2) 0.6 % -0.16 [ -0.30, -0.02 ]
WHLP 1998 253 -0.34 (0.61) 267 0.03 (0.21) 2.0 % -0.37 [ -0.45, -0.29 ]
WHO Factories 1986 16481 0.09 (0.89) 1854 0.08 (0.86) 7.5 % 0.01 [ -0.03, 0.05 ]
Wing 1998 32 0.09 (0.67) 31 0.18 (0.53) 0.1 % -0.09 [ -0.39, 0.21 ]
Subtotal (95% CI) 34767 20695 85.0 % -0.08 [ -0.09, -0.06 ]
Heterogeneity: Chi2 = 1526.68, df = 33 (P<0.00001); I2 =98%
Test for overall effect: Z = 12.09 (P < 0.00001)
2 Co-morbidity (hypertension and/or diabetes)
Aberg 1989 F 114 0.4 (1.35) 115 0.3 (1.1) 0.1 % 0.10 [ -0.22, 0.42 ]
Aberg 1989 M 79 0.3 (1.1) 80 0.1 (1.1) 0.1 % 0.20 [ -0.14, 0.54 ]
ADAPT 2005 123 0 (0.85) 118 1 (0.83) 0.3 % -1.00 [ -1.21, -0.79 ]
Cakir 2006 30 -0.92 (0.92) 30 0.04 (0.5) 0.1 % -0.96 [ -1.33, -0.59 ]
HDFP trial 1970 5485 -0.39 (1) 5455 -0.39 (1) 9.2 % 0.0 [ -0.04, 0.04 ]
Jalkanen 1991 24 -0.2 (1) 25 0.2 (1) 0.0 % -0.40 [ -0.96, 0.16 ]
Kastarinen 2002 360 -0.03 (0.91) 355 0.07 (0.93) 0.7 % -0.10 [ -0.23, 0.03 ]
Mattila 2003 331 0 (0.93) 309 0 (0.45) 1.0 % 0.0 [ -0.11, 0.11 ]
Meland 1997 58 0.1 (1.17) 52 0.3 (1.1) 0.1 % -0.20 [ -0.62, 0.22 ]
Oslo Diet Exercise 65 -0.48 (0.89) 43 -0.16 (0.59) 0.2 % -0.32 [ -0.60, -0.04 ]
Perez-Stable 1995 no prop 69 -0.42 (1.15) 68 -0.18 (0.98) 0.1 % -0.24 [ -0.60, 0.12 ]
Perez-Stable 1995 prop 67 -0.32 (0.81) 67 -0.25 (0.86) 0.2 % -0.07 [ -0.35, 0.21 ]
Sone (JDCS) 2002 990 -0.04 (0.84) 983 0.01 (0.89) 2.2 % -0.05 [ -0.13, 0.03 ]
Swedish RIS 1994 235 -0.78 (1.12) 227 -0.39 (0.92) 0.4 % -0.39 [ -0.58, -0.20 ]
Toobert (MLP) 2005 163 -0.1 (0.95) 116 -0.03 (0.99) 0.2 % -0.07 [ -0.30, 0.16 ]
Uusitupa 1993 38 -0.1 (0.31) 40 0.1 (0.97) 0.1 % -0.20 [ -0.52, 0.12 ]
Subtotal (95% CI) 8231 8083 15.0 % -0.06 [ -0.08, -0.03 ]
Heterogeneity: Chi2 = 130.95, df = 15 (P<0.00001); I2 =89%
Test for overall effect: Z = 3.69 (P = 0.00023)
Total (95% CI) 42998 28778 100.0 % -0.07 [ -0.08, -0.06 ]
-10 -5 0 5 10
Favours treatment Favours control
(Continued . . . )
154Multiple risk factor interventions for primary prevention of coronary heart disease (Review)
Copyright © 2011 The Cochrane Collaboration. Published by John Wiley & Sons, Ltd.
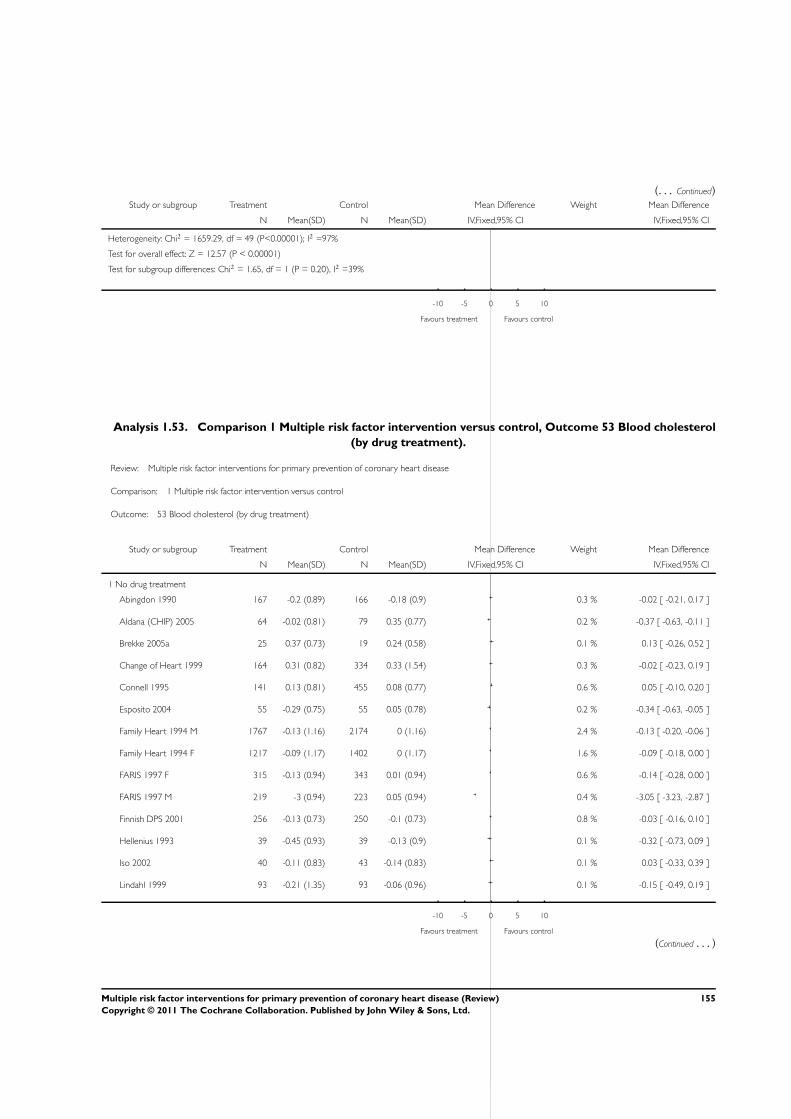
(. . . Continued)Study or subgroup Treatment Control Mean Difference Weight Mean Difference
N Mean(SD) N Mean(SD) IV,Fixed,95% CI IV,Fixed,95% CI
Heterogeneity: Chi2 = 1659.29, df = 49 (P<0.00001); I2 =97%
Test for overall effect: Z = 12.57 (P < 0.00001)
Test for subgroup differences: Chi2 = 1.65, df = 1 (P = 0.20), I2 =39%
-10 -5 0 5 10
Favours treatment Favours control
Analysis 1.53. Comparison 1 Multiple risk factor intervention versus control, Outcome 53 Blood cholesterol
(by drug treatment).
Review: Multiple risk factor interventions for primary prevention of coronary heart disease
Comparison: 1 Multiple risk factor intervention versus control
Outcome: 53 Blood cholesterol (by drug treatment)
Study or subgroup Treatment Control Mean Difference Weight Mean Difference
N Mean(SD) N Mean(SD) IV,Fixed,95% CI IV,Fixed,95% CI
1 No drug treatment
Abingdon 1990 167 -0.2 (0.89) 166 -0.18 (0.9) 0.3 % -0.02 [ -0.21, 0.17 ]
Aldana (CHIP) 2005 64 -0.02 (0.81) 79 0.35 (0.77) 0.2 % -0.37 [ -0.63, -0.11 ]
Brekke 2005a 25 0.37 (0.73) 19 0.24 (0.58) 0.1 % 0.13 [ -0.26, 0.52 ]
Change of Heart 1999 164 0.31 (0.82) 334 0.33 (1.54) 0.3 % -0.02 [ -0.23, 0.19 ]
Connell 1995 141 0.13 (0.81) 455 0.08 (0.77) 0.6 % 0.05 [ -0.10, 0.20 ]
Esposito 2004 55 -0.29 (0.75) 55 0.05 (0.78) 0.2 % -0.34 [ -0.63, -0.05 ]
Family Heart 1994 M 1767 -0.13 (1.16) 2174 0 (1.16) 2.4 % -0.13 [ -0.20, -0.06 ]
Family Heart 1994 F 1217 -0.09 (1.17) 1402 0 (1.17) 1.6 % -0.09 [ -0.18, 0.00 ]
FARIS 1997 F 315 -0.13 (0.94) 343 0.01 (0.94) 0.6 % -0.14 [ -0.28, 0.00 ]
FARIS 1997 M 219 -3 (0.94) 223 0.05 (0.94) 0.4 % -3.05 [ -3.23, -2.87 ]
Finnish DPS 2001 256 -0.13 (0.73) 250 -0.1 (0.73) 0.8 % -0.03 [ -0.16, 0.10 ]
Hellenius 1993 39 -0.45 (0.93) 39 -0.13 (0.9) 0.1 % -0.32 [ -0.73, 0.09 ]
Iso 2002 40 -0.11 (0.83) 43 -0.14 (0.83) 0.1 % 0.03 [ -0.33, 0.39 ]
Lindahl 1999 93 -0.21 (1.35) 93 -0.06 (0.96) 0.1 % -0.15 [ -0.49, 0.19 ]
-10 -5 0 5 10
Favours treatment Favours control
(Continued . . . )
155Multiple risk factor interventions for primary prevention of coronary heart disease (Review)
Copyright © 2011 The Cochrane Collaboration. Published by John Wiley & Sons, Ltd.
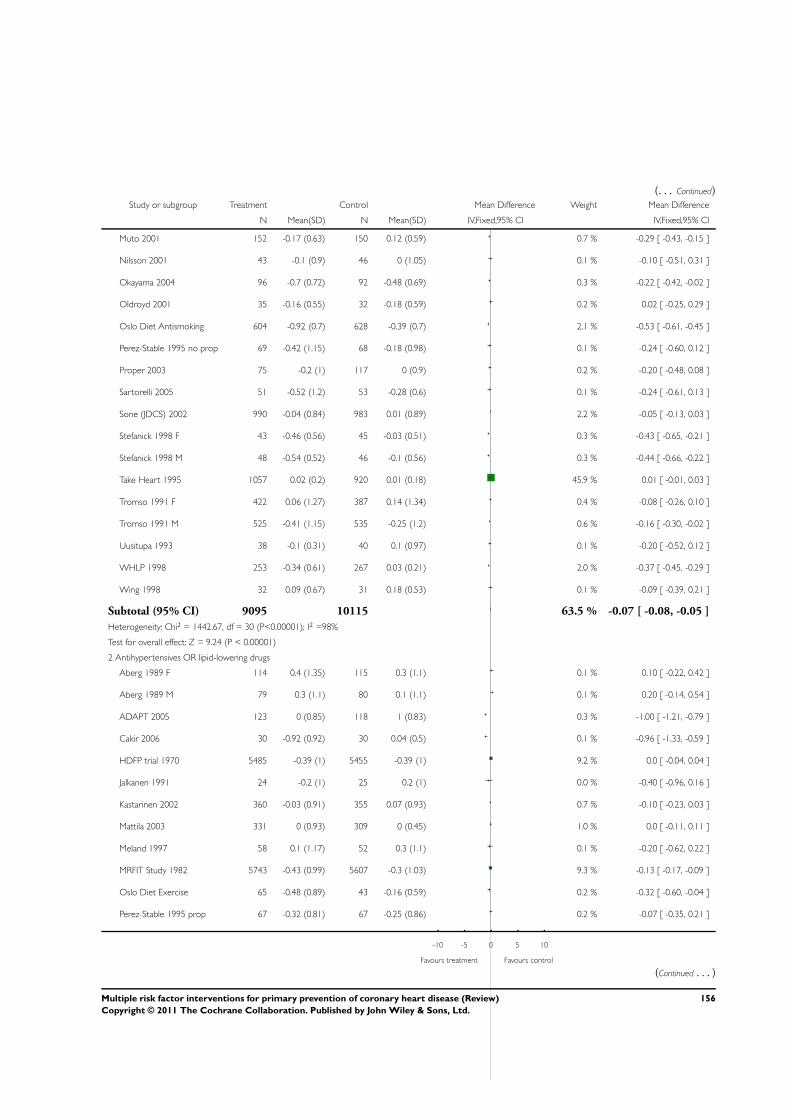
(. . . Continued)Study or subgroup Treatment Control Mean Difference Weight Mean Difference
N Mean(SD) N Mean(SD) IV,Fixed,95% CI IV,Fixed,95% CI
Muto 2001 152 -0.17 (0.63) 150 0.12 (0.59) 0.7 % -0.29 [ -0.43, -0.15 ]
Nilsson 2001 43 -0.1 (0.9) 46 0 (1.05) 0.1 % -0.10 [ -0.51, 0.31 ]
Okayama 2004 96 -0.7 (0.72) 92 -0.48 (0.69) 0.3 % -0.22 [ -0.42, -0.02 ]
Oldroyd 2001 35 -0.16 (0.55) 32 -0.18 (0.59) 0.2 % 0.02 [ -0.25, 0.29 ]
Oslo Diet Antismoking 604 -0.92 (0.7) 628 -0.39 (0.7) 2.1 % -0.53 [ -0.61, -0.45 ]
Perez-Stable 1995 no prop 69 -0.42 (1.15) 68 -0.18 (0.98) 0.1 % -0.24 [ -0.60, 0.12 ]
Proper 2003 75 -0.2 (1) 117 0 (0.9) 0.2 % -0.20 [ -0.48, 0.08 ]
Sartorelli 2005 51 -0.52 (1.2) 53 -0.28 (0.6) 0.1 % -0.24 [ -0.61, 0.13 ]
Sone (JDCS) 2002 990 -0.04 (0.84) 983 0.01 (0.89) 2.2 % -0.05 [ -0.13, 0.03 ]
Stefanick 1998 F 43 -0.46 (0.56) 45 -0.03 (0.51) 0.3 % -0.43 [ -0.65, -0.21 ]
Stefanick 1998 M 48 -0.54 (0.52) 46 -0.1 (0.56) 0.3 % -0.44 [ -0.66, -0.22 ]
Take Heart 1995 1057 0.02 (0.2) 920 0.01 (0.18) 45.9 % 0.01 [ -0.01, 0.03 ]
Tromso 1991 F 422 0.06 (1.27) 387 0.14 (1.34) 0.4 % -0.08 [ -0.26, 0.10 ]
Tromso 1991 M 525 -0.41 (1.15) 535 -0.25 (1.2) 0.6 % -0.16 [ -0.30, -0.02 ]
Uusitupa 1993 38 -0.1 (0.31) 40 0.1 (0.97) 0.1 % -0.20 [ -0.52, 0.12 ]
WHLP 1998 253 -0.34 (0.61) 267 0.03 (0.21) 2.0 % -0.37 [ -0.45, -0.29 ]
Wing 1998 32 0.09 (0.67) 31 0.18 (0.53) 0.1 % -0.09 [ -0.39, 0.21 ]
Subtotal (95% CI) 9095 10115 63.5 % -0.07 [ -0.08, -0.05 ]
Heterogeneity: Chi2 = 1442.67, df = 30 (P<0.00001); I2 =98%
Test for overall effect: Z = 9.24 (P < 0.00001)
2 Antihypertensives OR lipid-lowering drugs
Aberg 1989 F 114 0.4 (1.35) 115 0.3 (1.1) 0.1 % 0.10 [ -0.22, 0.42 ]
Aberg 1989 M 79 0.3 (1.1) 80 0.1 (1.1) 0.1 % 0.20 [ -0.14, 0.54 ]
ADAPT 2005 123 0 (0.85) 118 1 (0.83) 0.3 % -1.00 [ -1.21, -0.79 ]
Cakir 2006 30 -0.92 (0.92) 30 0.04 (0.5) 0.1 % -0.96 [ -1.33, -0.59 ]
HDFP trial 1970 5485 -0.39 (1) 5455 -0.39 (1) 9.2 % 0.0 [ -0.04, 0.04 ]
Jalkanen 1991 24 -0.2 (1) 25 0.2 (1) 0.0 % -0.40 [ -0.96, 0.16 ]
Kastarinen 2002 360 -0.03 (0.91) 355 0.07 (0.93) 0.7 % -0.10 [ -0.23, 0.03 ]
Mattila 2003 331 0 (0.93) 309 0 (0.45) 1.0 % 0.0 [ -0.11, 0.11 ]
Meland 1997 58 0.1 (1.17) 52 0.3 (1.1) 0.1 % -0.20 [ -0.62, 0.22 ]
MRFIT Study 1982 5743 -0.43 (0.99) 5607 -0.3 (1.03) 9.3 % -0.13 [ -0.17, -0.09 ]
Oslo Diet Exercise 65 -0.48 (0.89) 43 -0.16 (0.59) 0.2 % -0.32 [ -0.60, -0.04 ]
Perez-Stable 1995 prop 67 -0.32 (0.81) 67 -0.25 (0.86) 0.2 % -0.07 [ -0.35, 0.21 ]
-10 -5 0 5 10
Favours treatment Favours control
(Continued . . . )
156Multiple risk factor interventions for primary prevention of coronary heart disease (Review)
Copyright © 2011 The Cochrane Collaboration. Published by John Wiley & Sons, Ltd.
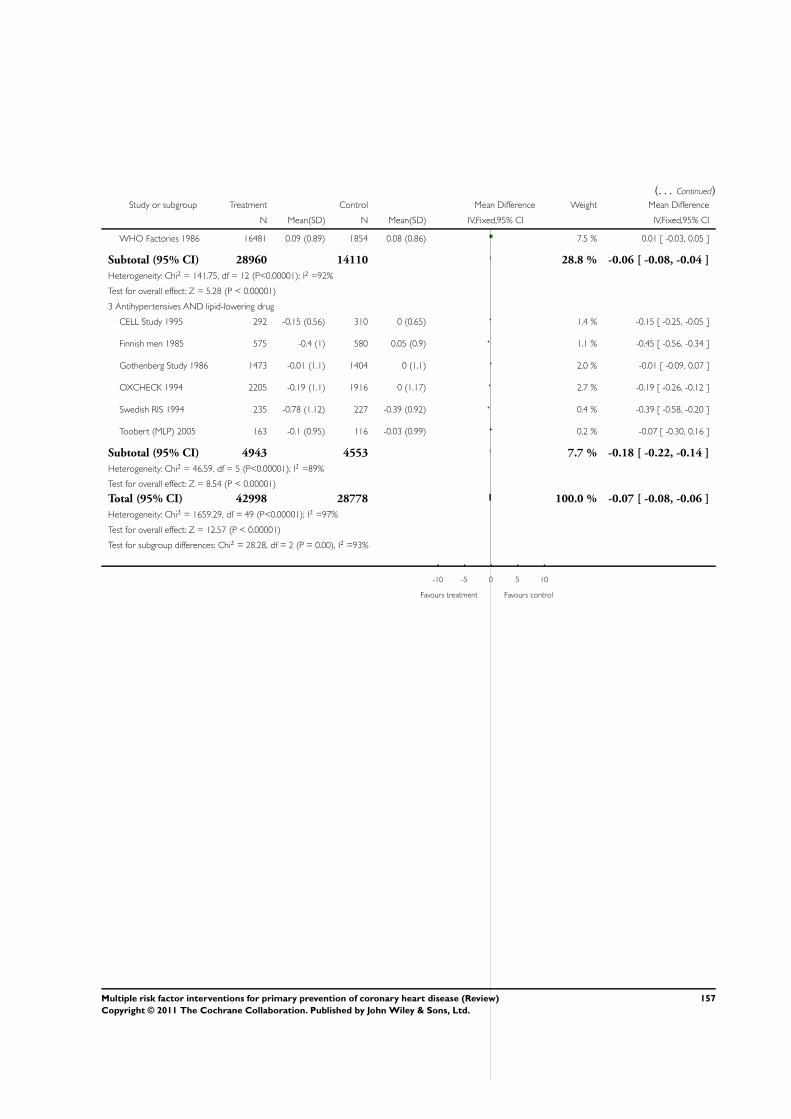
(. . . Continued)Study or subgroup Treatment Control Mean Difference Weight Mean Difference
N Mean(SD) N Mean(SD) IV,Fixed,95% CI IV,Fixed,95% CI
WHO Factories 1986 16481 0.09 (0.89) 1854 0.08 (0.86) 7.5 % 0.01 [ -0.03, 0.05 ]
Subtotal (95% CI) 28960 14110 28.8 % -0.06 [ -0.08, -0.04 ]
Heterogeneity: Chi2 = 141.75, df = 12 (P<0.00001); I2 =92%
Test for overall effect: Z = 5.28 (P < 0.00001)
3 Antihypertensives AND lipid-lowering drug
CELL Study 1995 292 -0.15 (0.56) 310 0 (0.65) 1.4 % -0.15 [ -0.25, -0.05 ]
Finnish men 1985 575 -0.4 (1) 580 0.05 (0.9) 1.1 % -0.45 [ -0.56, -0.34 ]
Gothenberg Study 1986 1473 -0.01 (1.1) 1404 0 (1.1) 2.0 % -0.01 [ -0.09, 0.07 ]
OXCHECK 1994 2205 -0.19 (1.1) 1916 0 (1.17) 2.7 % -0.19 [ -0.26, -0.12 ]
Swedish RIS 1994 235 -0.78 (1.12) 227 -0.39 (0.92) 0.4 % -0.39 [ -0.58, -0.20 ]
Toobert (MLP) 2005 163 -0.1 (0.95) 116 -0.03 (0.99) 0.2 % -0.07 [ -0.30, 0.16 ]
Subtotal (95% CI) 4943 4553 7.7 % -0.18 [ -0.22, -0.14 ]
Heterogeneity: Chi2 = 46.59, df = 5 (P<0.00001); I2 =89%
Test for overall effect: Z = 8.54 (P < 0.00001)
Total (95% CI) 42998 28778 100.0 % -0.07 [ -0.08, -0.06 ]
Heterogeneity: Chi2 = 1659.29, df = 49 (P<0.00001); I2 =97%
Test for overall effect: Z = 12.57 (P < 0.00001)
Test for subgroup differences: Chi2 = 28.28, df = 2 (P = 0.00), I2 =93%
-10 -5 0 5 10
Favours treatment Favours control
157Multiple risk factor interventions for primary prevention of coronary heart disease (Review)
Copyright © 2011 The Cochrane Collaboration. Published by John Wiley & Sons, Ltd.
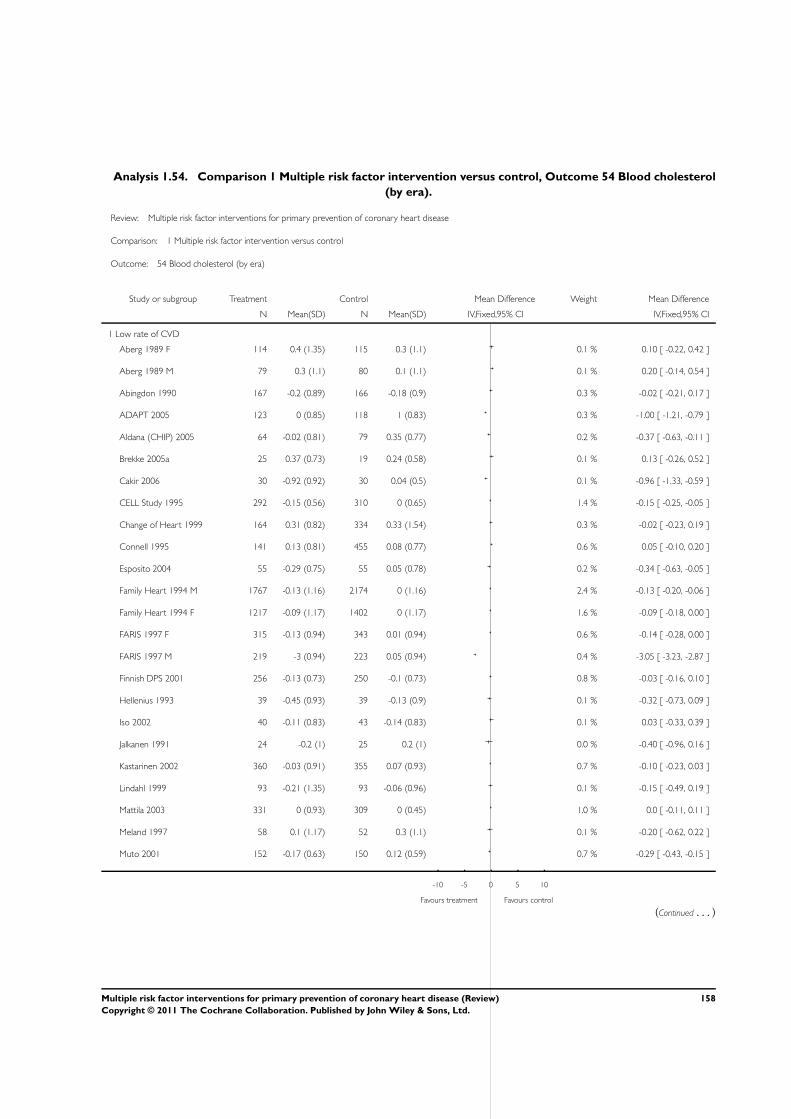
Analysis 1.54. Comparison 1 Multiple risk factor intervention versus control, Outcome 54 Blood cholesterol
(by era).
Review: Multiple risk factor interventions for primary prevention of coronary heart disease
Comparison: 1 Multiple risk factor intervention versus control
Outcome: 54 Blood cholesterol (by era)
Study or subgroup Treatment Control Mean Difference Weight Mean Difference
N Mean(SD) N Mean(SD) IV,Fixed,95% CI IV,Fixed,95% CI
1 Low rate of CVD
Aberg 1989 F 114 0.4 (1.35) 115 0.3 (1.1) 0.1 % 0.10 [ -0.22, 0.42 ]
Aberg 1989 M 79 0.3 (1.1) 80 0.1 (1.1) 0.1 % 0.20 [ -0.14, 0.54 ]
Abingdon 1990 167 -0.2 (0.89) 166 -0.18 (0.9) 0.3 % -0.02 [ -0.21, 0.17 ]
ADAPT 2005 123 0 (0.85) 118 1 (0.83) 0.3 % -1.00 [ -1.21, -0.79 ]
Aldana (CHIP) 2005 64 -0.02 (0.81) 79 0.35 (0.77) 0.2 % -0.37 [ -0.63, -0.11 ]
Brekke 2005a 25 0.37 (0.73) 19 0.24 (0.58) 0.1 % 0.13 [ -0.26, 0.52 ]
Cakir 2006 30 -0.92 (0.92) 30 0.04 (0.5) 0.1 % -0.96 [ -1.33, -0.59 ]
CELL Study 1995 292 -0.15 (0.56) 310 0 (0.65) 1.4 % -0.15 [ -0.25, -0.05 ]
Change of Heart 1999 164 0.31 (0.82) 334 0.33 (1.54) 0.3 % -0.02 [ -0.23, 0.19 ]
Connell 1995 141 0.13 (0.81) 455 0.08 (0.77) 0.6 % 0.05 [ -0.10, 0.20 ]
Esposito 2004 55 -0.29 (0.75) 55 0.05 (0.78) 0.2 % -0.34 [ -0.63, -0.05 ]
Family Heart 1994 M 1767 -0.13 (1.16) 2174 0 (1.16) 2.4 % -0.13 [ -0.20, -0.06 ]
Family Heart 1994 F 1217 -0.09 (1.17) 1402 0 (1.17) 1.6 % -0.09 [ -0.18, 0.00 ]
FARIS 1997 F 315 -0.13 (0.94) 343 0.01 (0.94) 0.6 % -0.14 [ -0.28, 0.00 ]
FARIS 1997 M 219 -3 (0.94) 223 0.05 (0.94) 0.4 % -3.05 [ -3.23, -2.87 ]
Finnish DPS 2001 256 -0.13 (0.73) 250 -0.1 (0.73) 0.8 % -0.03 [ -0.16, 0.10 ]
Hellenius 1993 39 -0.45 (0.93) 39 -0.13 (0.9) 0.1 % -0.32 [ -0.73, 0.09 ]
Iso 2002 40 -0.11 (0.83) 43 -0.14 (0.83) 0.1 % 0.03 [ -0.33, 0.39 ]
Jalkanen 1991 24 -0.2 (1) 25 0.2 (1) 0.0 % -0.40 [ -0.96, 0.16 ]
Kastarinen 2002 360 -0.03 (0.91) 355 0.07 (0.93) 0.7 % -0.10 [ -0.23, 0.03 ]
Lindahl 1999 93 -0.21 (1.35) 93 -0.06 (0.96) 0.1 % -0.15 [ -0.49, 0.19 ]
Mattila 2003 331 0 (0.93) 309 0 (0.45) 1.0 % 0.0 [ -0.11, 0.11 ]
Meland 1997 58 0.1 (1.17) 52 0.3 (1.1) 0.1 % -0.20 [ -0.62, 0.22 ]
Muto 2001 152 -0.17 (0.63) 150 0.12 (0.59) 0.7 % -0.29 [ -0.43, -0.15 ]
-10 -5 0 5 10
Favours treatment Favours control
(Continued . . . )
158Multiple risk factor interventions for primary prevention of coronary heart disease (Review)
Copyright © 2011 The Cochrane Collaboration. Published by John Wiley & Sons, Ltd.
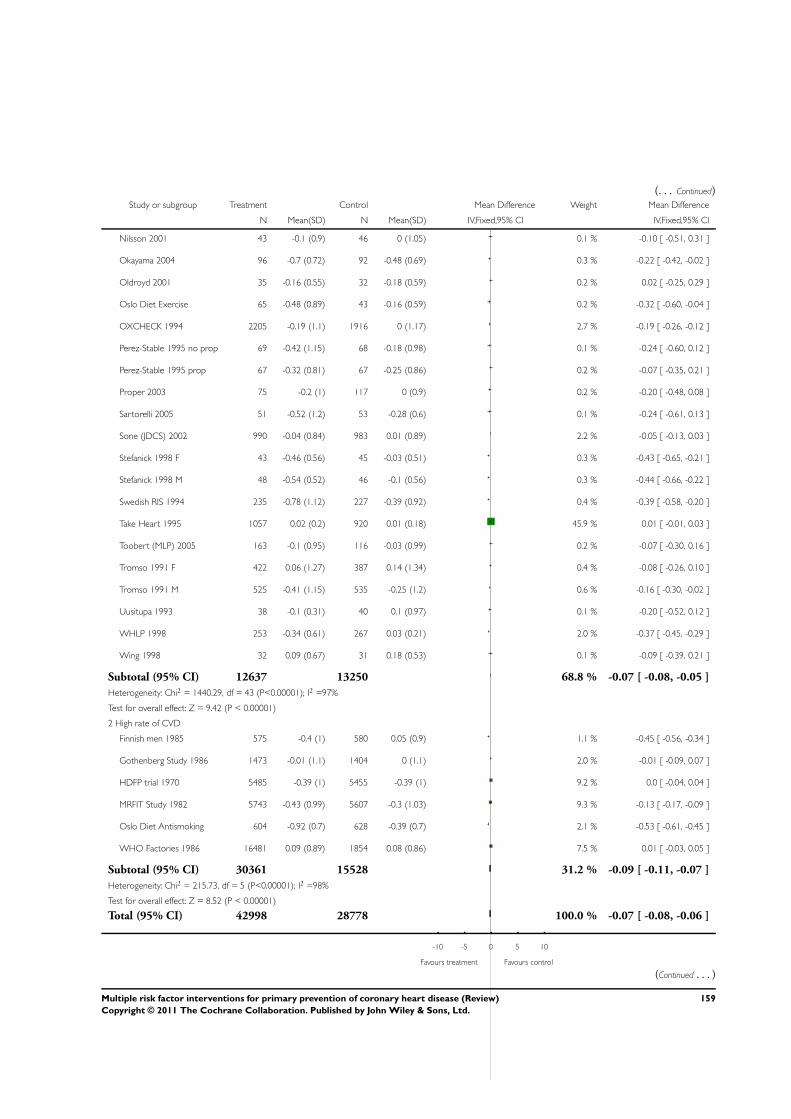
(. . . Continued)Study or subgroup Treatment Control Mean Difference Weight Mean Difference
N Mean(SD) N Mean(SD) IV,Fixed,95% CI IV,Fixed,95% CI
Nilsson 2001 43 -0.1 (0.9) 46 0 (1.05) 0.1 % -0.10 [ -0.51, 0.31 ]
Okayama 2004 96 -0.7 (0.72) 92 -0.48 (0.69) 0.3 % -0.22 [ -0.42, -0.02 ]
Oldroyd 2001 35 -0.16 (0.55) 32 -0.18 (0.59) 0.2 % 0.02 [ -0.25, 0.29 ]
Oslo Diet Exercise 65 -0.48 (0.89) 43 -0.16 (0.59) 0.2 % -0.32 [ -0.60, -0.04 ]
OXCHECK 1994 2205 -0.19 (1.1) 1916 0 (1.17) 2.7 % -0.19 [ -0.26, -0.12 ]
Perez-Stable 1995 no prop 69 -0.42 (1.15) 68 -0.18 (0.98) 0.1 % -0.24 [ -0.60, 0.12 ]
Perez-Stable 1995 prop 67 -0.32 (0.81) 67 -0.25 (0.86) 0.2 % -0.07 [ -0.35, 0.21 ]
Proper 2003 75 -0.2 (1) 117 0 (0.9) 0.2 % -0.20 [ -0.48, 0.08 ]
Sartorelli 2005 51 -0.52 (1.2) 53 -0.28 (0.6) 0.1 % -0.24 [ -0.61, 0.13 ]
Sone (JDCS) 2002 990 -0.04 (0.84) 983 0.01 (0.89) 2.2 % -0.05 [ -0.13, 0.03 ]
Stefanick 1998 F 43 -0.46 (0.56) 45 -0.03 (0.51) 0.3 % -0.43 [ -0.65, -0.21 ]
Stefanick 1998 M 48 -0.54 (0.52) 46 -0.1 (0.56) 0.3 % -0.44 [ -0.66, -0.22 ]
Swedish RIS 1994 235 -0.78 (1.12) 227 -0.39 (0.92) 0.4 % -0.39 [ -0.58, -0.20 ]
Take Heart 1995 1057 0.02 (0.2) 920 0.01 (0.18) 45.9 % 0.01 [ -0.01, 0.03 ]
Toobert (MLP) 2005 163 -0.1 (0.95) 116 -0.03 (0.99) 0.2 % -0.07 [ -0.30, 0.16 ]
Tromso 1991 F 422 0.06 (1.27) 387 0.14 (1.34) 0.4 % -0.08 [ -0.26, 0.10 ]
Tromso 1991 M 525 -0.41 (1.15) 535 -0.25 (1.2) 0.6 % -0.16 [ -0.30, -0.02 ]
Uusitupa 1993 38 -0.1 (0.31) 40 0.1 (0.97) 0.1 % -0.20 [ -0.52, 0.12 ]
WHLP 1998 253 -0.34 (0.61) 267 0.03 (0.21) 2.0 % -0.37 [ -0.45, -0.29 ]
Wing 1998 32 0.09 (0.67) 31 0.18 (0.53) 0.1 % -0.09 [ -0.39, 0.21 ]
Subtotal (95% CI) 12637 13250 68.8 % -0.07 [ -0.08, -0.05 ]
Heterogeneity: Chi2 = 1440.29, df = 43 (P<0.00001); I2 =97%
Test for overall effect: Z = 9.42 (P < 0.00001)
2 High rate of CVD
Finnish men 1985 575 -0.4 (1) 580 0.05 (0.9) 1.1 % -0.45 [ -0.56, -0.34 ]
Gothenberg Study 1986 1473 -0.01 (1.1) 1404 0 (1.1) 2.0 % -0.01 [ -0.09, 0.07 ]
HDFP trial 1970 5485 -0.39 (1) 5455 -0.39 (1) 9.2 % 0.0 [ -0.04, 0.04 ]
MRFIT Study 1982 5743 -0.43 (0.99) 5607 -0.3 (1.03) 9.3 % -0.13 [ -0.17, -0.09 ]
Oslo Diet Antismoking 604 -0.92 (0.7) 628 -0.39 (0.7) 2.1 % -0.53 [ -0.61, -0.45 ]
WHO Factories 1986 16481 0.09 (0.89) 1854 0.08 (0.86) 7.5 % 0.01 [ -0.03, 0.05 ]
Subtotal (95% CI) 30361 15528 31.2 % -0.09 [ -0.11, -0.07 ]
Heterogeneity: Chi2 = 215.73, df = 5 (P<0.00001); I2 =98%
Test for overall effect: Z = 8.52 (P < 0.00001)
Total (95% CI) 42998 28778 100.0 % -0.07 [ -0.08, -0.06 ]
-10 -5 0 5 10
Favours treatment Favours control
(Continued . . . )
159Multiple risk factor interventions for primary prevention of coronary heart disease (Review)
Copyright © 2011 The Cochrane Collaboration. Published by John Wiley & Sons, Ltd.
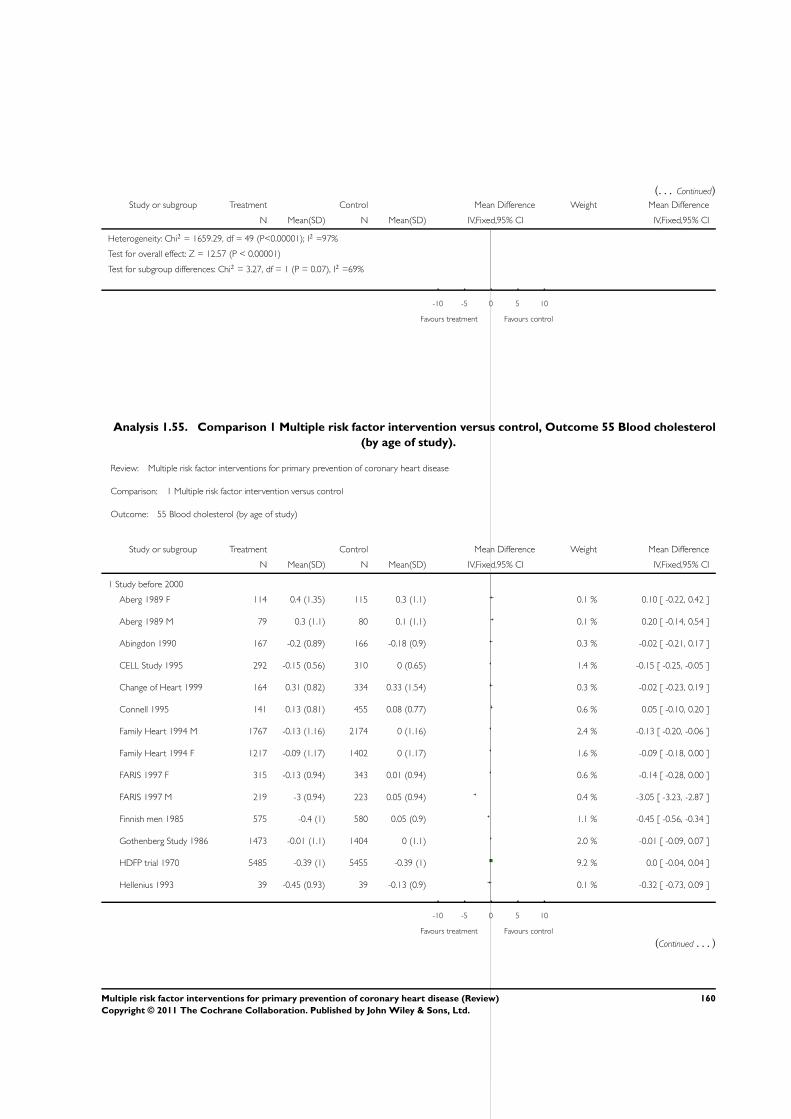
(. . . Continued)Study or subgroup Treatment Control Mean Difference Weight Mean Difference
N Mean(SD) N Mean(SD) IV,Fixed,95% CI IV,Fixed,95% CI
Heterogeneity: Chi2 = 1659.29, df = 49 (P<0.00001); I2 =97%
Test for overall effect: Z = 12.57 (P < 0.00001)
Test for subgroup differences: Chi2 = 3.27, df = 1 (P = 0.07), I2 =69%
-10 -5 0 5 10
Favours treatment Favours control
Analysis 1.55. Comparison 1 Multiple risk factor intervention versus control, Outcome 55 Blood cholesterol
(by age of study).
Review: Multiple risk factor interventions for primary prevention of coronary heart disease
Comparison: 1 Multiple risk factor intervention versus control
Outcome: 55 Blood cholesterol (by age of study)
Study or subgroup Treatment Control Mean Difference Weight Mean Difference
N Mean(SD) N Mean(SD) IV,Fixed,95% CI IV,Fixed,95% CI
1 Study before 2000
Aberg 1989 F 114 0.4 (1.35) 115 0.3 (1.1) 0.1 % 0.10 [ -0.22, 0.42 ]
Aberg 1989 M 79 0.3 (1.1) 80 0.1 (1.1) 0.1 % 0.20 [ -0.14, 0.54 ]
Abingdon 1990 167 -0.2 (0.89) 166 -0.18 (0.9) 0.3 % -0.02 [ -0.21, 0.17 ]
CELL Study 1995 292 -0.15 (0.56) 310 0 (0.65) 1.4 % -0.15 [ -0.25, -0.05 ]
Change of Heart 1999 164 0.31 (0.82) 334 0.33 (1.54) 0.3 % -0.02 [ -0.23, 0.19 ]
Connell 1995 141 0.13 (0.81) 455 0.08 (0.77) 0.6 % 0.05 [ -0.10, 0.20 ]
Family Heart 1994 M 1767 -0.13 (1.16) 2174 0 (1.16) 2.4 % -0.13 [ -0.20, -0.06 ]
Family Heart 1994 F 1217 -0.09 (1.17) 1402 0 (1.17) 1.6 % -0.09 [ -0.18, 0.00 ]
FARIS 1997 F 315 -0.13 (0.94) 343 0.01 (0.94) 0.6 % -0.14 [ -0.28, 0.00 ]
FARIS 1997 M 219 -3 (0.94) 223 0.05 (0.94) 0.4 % -3.05 [ -3.23, -2.87 ]
Finnish men 1985 575 -0.4 (1) 580 0.05 (0.9) 1.1 % -0.45 [ -0.56, -0.34 ]
Gothenberg Study 1986 1473 -0.01 (1.1) 1404 0 (1.1) 2.0 % -0.01 [ -0.09, 0.07 ]
HDFP trial 1970 5485 -0.39 (1) 5455 -0.39 (1) 9.2 % 0.0 [ -0.04, 0.04 ]
Hellenius 1993 39 -0.45 (0.93) 39 -0.13 (0.9) 0.1 % -0.32 [ -0.73, 0.09 ]
-10 -5 0 5 10
Favours treatment Favours control
(Continued . . . )
160Multiple risk factor interventions for primary prevention of coronary heart disease (Review)
Copyright © 2011 The Cochrane Collaboration. Published by John Wiley & Sons, Ltd.
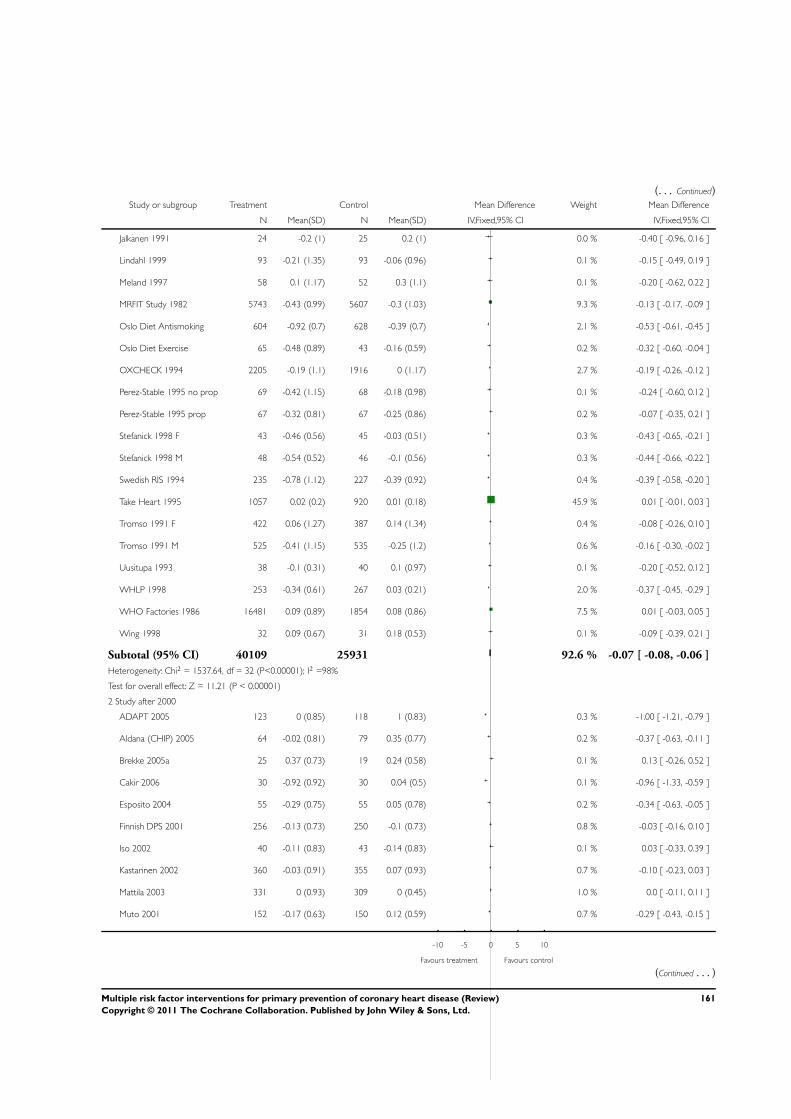
(. . . Continued)Study or subgroup Treatment Control Mean Difference Weight Mean Difference
N Mean(SD) N Mean(SD) IV,Fixed,95% CI IV,Fixed,95% CI
Jalkanen 1991 24 -0.2 (1) 25 0.2 (1) 0.0 % -0.40 [ -0.96, 0.16 ]
Lindahl 1999 93 -0.21 (1.35) 93 -0.06 (0.96) 0.1 % -0.15 [ -0.49, 0.19 ]
Meland 1997 58 0.1 (1.17) 52 0.3 (1.1) 0.1 % -0.20 [ -0.62, 0.22 ]
MRFIT Study 1982 5743 -0.43 (0.99) 5607 -0.3 (1.03) 9.3 % -0.13 [ -0.17, -0.09 ]
Oslo Diet Antismoking 604 -0.92 (0.7) 628 -0.39 (0.7) 2.1 % -0.53 [ -0.61, -0.45 ]
Oslo Diet Exercise 65 -0.48 (0.89) 43 -0.16 (0.59) 0.2 % -0.32 [ -0.60, -0.04 ]
OXCHECK 1994 2205 -0.19 (1.1) 1916 0 (1.17) 2.7 % -0.19 [ -0.26, -0.12 ]
Perez-Stable 1995 no prop 69 -0.42 (1.15) 68 -0.18 (0.98) 0.1 % -0.24 [ -0.60, 0.12 ]
Perez-Stable 1995 prop 67 -0.32 (0.81) 67 -0.25 (0.86) 0.2 % -0.07 [ -0.35, 0.21 ]
Stefanick 1998 F 43 -0.46 (0.56) 45 -0.03 (0.51) 0.3 % -0.43 [ -0.65, -0.21 ]
Stefanick 1998 M 48 -0.54 (0.52) 46 -0.1 (0.56) 0.3 % -0.44 [ -0.66, -0.22 ]
Swedish RIS 1994 235 -0.78 (1.12) 227 -0.39 (0.92) 0.4 % -0.39 [ -0.58, -0.20 ]
Take Heart 1995 1057 0.02 (0.2) 920 0.01 (0.18) 45.9 % 0.01 [ -0.01, 0.03 ]
Tromso 1991 F 422 0.06 (1.27) 387 0.14 (1.34) 0.4 % -0.08 [ -0.26, 0.10 ]
Tromso 1991 M 525 -0.41 (1.15) 535 -0.25 (1.2) 0.6 % -0.16 [ -0.30, -0.02 ]
Uusitupa 1993 38 -0.1 (0.31) 40 0.1 (0.97) 0.1 % -0.20 [ -0.52, 0.12 ]
WHLP 1998 253 -0.34 (0.61) 267 0.03 (0.21) 2.0 % -0.37 [ -0.45, -0.29 ]
WHO Factories 1986 16481 0.09 (0.89) 1854 0.08 (0.86) 7.5 % 0.01 [ -0.03, 0.05 ]
Wing 1998 32 0.09 (0.67) 31 0.18 (0.53) 0.1 % -0.09 [ -0.39, 0.21 ]
Subtotal (95% CI) 40109 25931 92.6 % -0.07 [ -0.08, -0.06 ]
Heterogeneity: Chi2 = 1537.64, df = 32 (P<0.00001); I2 =98%
Test for overall effect: Z = 11.21 (P < 0.00001)
2 Study after 2000
ADAPT 2005 123 0 (0.85) 118 1 (0.83) 0.3 % -1.00 [ -1.21, -0.79 ]
Aldana (CHIP) 2005 64 -0.02 (0.81) 79 0.35 (0.77) 0.2 % -0.37 [ -0.63, -0.11 ]
Brekke 2005a 25 0.37 (0.73) 19 0.24 (0.58) 0.1 % 0.13 [ -0.26, 0.52 ]
Cakir 2006 30 -0.92 (0.92) 30 0.04 (0.5) 0.1 % -0.96 [ -1.33, -0.59 ]
Esposito 2004 55 -0.29 (0.75) 55 0.05 (0.78) 0.2 % -0.34 [ -0.63, -0.05 ]
Finnish DPS 2001 256 -0.13 (0.73) 250 -0.1 (0.73) 0.8 % -0.03 [ -0.16, 0.10 ]
Iso 2002 40 -0.11 (0.83) 43 -0.14 (0.83) 0.1 % 0.03 [ -0.33, 0.39 ]
Kastarinen 2002 360 -0.03 (0.91) 355 0.07 (0.93) 0.7 % -0.10 [ -0.23, 0.03 ]
Mattila 2003 331 0 (0.93) 309 0 (0.45) 1.0 % 0.0 [ -0.11, 0.11 ]
Muto 2001 152 -0.17 (0.63) 150 0.12 (0.59) 0.7 % -0.29 [ -0.43, -0.15 ]
-10 -5 0 5 10
Favours treatment Favours control
(Continued . . . )
161Multiple risk factor interventions for primary prevention of coronary heart disease (Review)
Copyright © 2011 The Cochrane Collaboration. Published by John Wiley & Sons, Ltd.
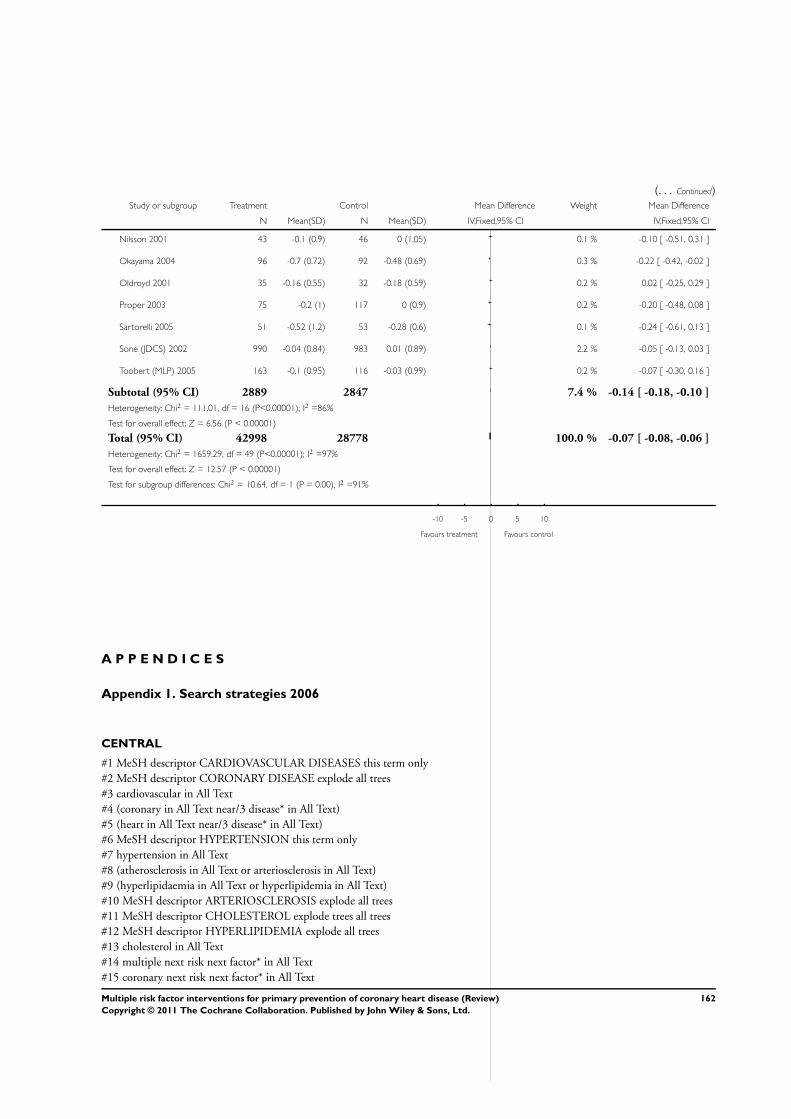
(. . . Continued)Study or subgroup Treatment Control Mean Difference Weight Mean Difference
N Mean(SD) N Mean(SD) IV,Fixed,95% CI IV,Fixed,95% CI
Nilsson 2001 43 -0.1 (0.9) 46 0 (1.05) 0.1 % -0.10 [ -0.51, 0.31 ]
Okayama 2004 96 -0.7 (0.72) 92 -0.48 (0.69) 0.3 % -0.22 [ -0.42, -0.02 ]
Oldroyd 2001 35 -0.16 (0.55) 32 -0.18 (0.59) 0.2 % 0.02 [ -0.25, 0.29 ]
Proper 2003 75 -0.2 (1) 117 0 (0.9) 0.2 % -0.20 [ -0.48, 0.08 ]
Sartorelli 2005 51 -0.52 (1.2) 53 -0.28 (0.6) 0.1 % -0.24 [ -0.61, 0.13 ]
Sone (JDCS) 2002 990 -0.04 (0.84) 983 0.01 (0.89) 2.2 % -0.05 [ -0.13, 0.03 ]
Toobert (MLP) 2005 163 -0.1 (0.95) 116 -0.03 (0.99) 0.2 % -0.07 [ -0.30, 0.16 ]
Subtotal (95% CI) 2889 2847 7.4 % -0.14 [ -0.18, -0.10 ]
Heterogeneity: Chi2 = 111.01, df = 16 (P<0.00001); I2 =86%
Test for overall effect: Z = 6.56 (P < 0.00001)
Total (95% CI) 42998 28778 100.0 % -0.07 [ -0.08, -0.06 ]
Heterogeneity: Chi2 = 1659.29, df = 49 (P<0.00001); I2 =97%
Test for overall effect: Z = 12.57 (P < 0.00001)
Test for subgroup differences: Chi2 = 10.64, df = 1 (P = 0.00), I2 =91%
-10 -5 0 5 10
Favours treatment Favours control
A P P E N D I C E S
Appendix 1. Search strategies 2006
CENTRAL
#1 MeSH descriptor CARDIOVASCULAR DISEASES this term only
#2 MeSH descriptor CORONARY DISEASE explode all trees
#3 cardiovascular in All Text
#4 (coronary in All Text near/3 disease* in All Text)
#5 (heart in All Text near/3 disease* in All Text)
#6 MeSH descriptor HYPERTENSION this term only
#7 hypertension in All Text
#8 (atherosclerosis in All Text or arteriosclerosis in All Text)
#9 (hyperlipidaemia in All Text or hyperlipidemia in All Text)
#10 MeSH descriptor ARTERIOSCLEROSIS explode all trees
#11 MeSH descriptor CHOLESTEROL explode trees all trees
#12 MeSH descriptor HYPERLIPIDEMIA explode all trees
#13 cholesterol in All Text
#14 multiple next risk next factor* in All Text
#15 coronary next risk next factor* in All Text
162Multiple risk factor interventions for primary prevention of coronary heart disease (Review)
Copyright © 2011 The Cochrane Collaboration. Published by John Wiley & Sons, Ltd.
#16 (#1 or #2 or #3 or #4 or #5 or #6 or #7 or #8 or #9 or #10)
#17 (#11 or #12 or #13 or #14 or #15)
#18 (#16 or #17)
#19 MeSH descriptor HEALTH EDUCATION explode all trees
#20 MeSH descriptor HEALTH PROMOTION explode all trees
#21 MeSH descriptor HEALTH BEHAVIOR explode all trees
#22 MeSH descriptor PRIMARY PREVENTION this term only
#23 MeSH descriptor COUNSELING this term only
#24 counsel* in All Text
#25 (health in All Text near/3 educat* in All Text)
#26 (patient in All Text near/3 educat* in All Text)
#27 (education* in All Text near/3 program* in All Text)
#28 (health in All Text near/3 promotion* in All Text)
#29 (health in All Text near/3 behaviour* in All Text)
#30 (health in All Text near/3 behavior* in All Text)
#31 primary next prevention in All Text
#32 (multiple next risk in All Text near/3 intervention* in All Text)
#33 (multifactor* in All Text near/3 intervention* in All Text)
#34 (multifactor* in All Text near/3 prevention in All Text)
#35 (risk next factor* in All Text near/3 reduc* in All Text)
#36 (risk next factor* in All Text near/3 manag* in All Text)
#37 (risk next factor* in All Text near/3 intervent* in All Text)
#38 (lifestyle in All Text near/3 intervention* in All Text)
#39 (lifestyle in All Text near/3 advice in All Text)
#40 (life-style in All Text near/3 intervention* in All Text)
#41 (life-style in All Text near/3 advice in All Text)
#42 (life-style in All Text near/3 alter* in All Text)
#43 (lifestyle in All Text near/3 alter* in All Text)
#44 (lifestyle in All Text near/3 educat* in All Text)
#45 (life-style in All Text near/3 educat* in All Text)
#46 (life-style in All Text near/3 chang* in All Text)
#47 (lifestyle in All Text near/3 chang* in All Text)
#48 (behavior* in All Text near/3 chang* in All Text)
#49 (behaviour* in All Text near/3 chang* in All Text)
#50 (health next care in All Text near/3 advice in All Text)
#51 (healthcare in All Text near/3 advice in All Text)
#52 nonpharmacologic* in All Text
#53 non-pharmacologic* in All Text
#54 (#19 or #20 or #21 or #22 or #23 or #24 or #25 or #26 or #27 or #28 or #29)
#55 (#30 or #31 or #32 or #33 or #34 or #35 or #36 or #37 or #38 or #39)
#56 (#40 or #41 or #42 or #43 or #44 or #45 or #46 or #47 or #48 or #49 or #50 or #51 or #52 or #53)
#57 (#54 or #55 or #56)
#58 (#18 and #57)
MEDLINE on Ovid
1 cardiovascular diseases/
2 exp coronary disease/
3 hypertension/
4 exp Arteriosclerosis/
5 exp Hyperlipidemia/
6 (cardiovascular adj3 disease$).tw.
7 (cardiovascular adj3 (fit or fitness)).tw.
163Multiple risk factor interventions for primary prevention of coronary heart disease (Review)
Copyright © 2011 The Cochrane Collaboration. Published by John Wiley & Sons, Ltd.

8 (Coronary adj3 disease$).tw.
9 heart disease$.tw.
10 hypertension.tw.
11 hyperlipid?emia.tw
12 cholesterol.tw.
13 atherosclerosis.tw.
14 arteriosclerosis.tw.
15 coronary risk factor$.tw.
16 multiple risk factor$.tw.
17 cardiovascular risk factor$.tw.
18 or/1-17
19 health promotion/
20 exp health education/
21 exp health behavior/
22 exp counseling/
23 primary prevention/
24 (multifactor$ adj5 (intervent$ or prevent$)).tw.
25 ((lifestyle or life-style) adj3 (intervention$ or educat$ or advice$ or alter$ or change$)).tw.
26 ((lifestyle or life-style or behavio?r$) adj3 (intervention$ or educat$ or advice$ or alter$ or change$)).tw.
27 ((healthcare or health care) adj3 advice).tw.
28 primary prevention.tw.
29 (risk factor$ adj3 (reduc$ or manage$ or managing or intervent$ or program$)).tw.
30 (educat$ adj3 (program$ or patient$)).tw.
31 ((health or healthcare or health care) adj3 (educat$ or advice or promot$)).tw.
32 (nonpharmacologic$ or non-pharmacologic$).tw.
33 ((lifestyle or life style or life-style or behavio?r$ or risk factor$) adj3 modif$).tw.
34 or/19-33
35 18 and 34
36 randomized controlled trial.pt.
37 controlled clinical trial.pt.
38 Randomized controlled trials/
39 random allocation.sh.
40 double blind method.sh.
41 single-blind method.sh.
42 or/36-41
43 clinical trial.pt.
44 exp Clinical trials/
45 (clin$ adj25 trial$).ti,ab.
46 ((singl$ or doubl$ or trebl$ or tripl$) adj (blind$ or mask$)).ti,ab.
47 placebos.sh.
48 placebo$.ti,ab.
49 random$.ti,ab.
50 research design.sh.
51 or/43-50
52 exp animal/ not humans/
53 42 or 51
54 53 not 52
55 54 and 35
EMBASE on Ovid
1 cardiovascular disease/
2 exp ischemic heart disease/
164Multiple risk factor interventions for primary prevention of coronary heart disease (Review)
Copyright © 2011 The Cochrane Collaboration. Published by John Wiley & Sons, Ltd.

3 (coronary adj3 disease$).tw.
4 heart disease$.tw.
5 Hypertension/
6 hypertension.tw.
7 (cardiovascular adj3 (disease$ or fit of fitness)).tw.
8 exp arteriosclerosis/
9 exp hyperlipidemia/
10 hyperlipid?emia.tw.
11 cholesterol.tw.
12 arteriosclero$.tw.
13 atherosclero$.tw.
14 coronary risk factor$.tw.
15 multiple risk factor$.tw.
16 cardiovascular risk factor$.tw.
17 or/1-16
18 exp health education/
19 exp health behavior/
20 primary prevention/
21 exp counseling/
22 (multifactor$ adj5 (intervent$ or prevent$)).tw.
23 ((life-style or life style or lifestyle or healthcare or health care) adj3 (intervention$ or educat$ or advice or alter$ or change$)).tw.
24 primary prevention.tw.
25 (risk factor$ adj3 (reduc$ or manage$ or managing or intervent$ or program$)).tw.
26 (educat$ adj3 (program$ or patient$)).tw.
27 (non pharmacologic$ or nonpharmacologic$).tw.
28 (risk factor$ adj3 modif$).tw.
29 ((lifestyle or life-style or life style) adj3 modif$).tw.
30 exp behavior therapy/
31 (behavi?r$ adj3 (intervention$ or program$ or modif$ or change$ or alter$)).tw.
32 (promot$ adj3 (health or healthcare or health care)).tw.
33 or/18-32
34 17 and 33
35 random$.ti,ab.
36 factorial$.ti,ab.
37 (crossover$ or cross over$ or cross-over$).ti,ab.
38 placebo$.ti,ab.
39 (double$ adj blind$).ti,ab.
40 (singl$ adj blind$).ti,ab.
41 assign$.ti,ab.
42 allocat$.ti,ab.
43 volunteer$.ti,ab.
44 Crossover Procedure/
45 Double Blind Procedure/
46 Randomized Controlled Trial/
47 Single Blind Procedure/
48 or/35-47
49 exp animal/
50 nonhuman/
51 exp animal experiment/
52 or/49-51
53 exp human/
54 52 not 53
55 48 not 54
165Multiple risk factor interventions for primary prevention of coronary heart disease (Review)
Copyright © 2011 The Cochrane Collaboration. Published by John Wiley & Sons, Ltd.

56 55 and 34
Appendix 2. Search strategies 2001
MEDLINE on Ovid
<Mid 1998 to August Week 2 2001>
1 cardiovascular diseases/
2 exp coronary disease/
3 hypertension/
4 exp Arteriosclerosis/
5 exp Hyperlipidemia/
6 (cardiovascular adj3 disease$).tw.
7 (cardiovascular adj3 (fit or fitness)).tw.
8 (Coronary adj3 disease$).tw.
9 heart disease$.tw.
10 hypertension.tw.
11 hyperlipid?emia.tw.
12 cholesterol.tw.
13 atherosclerosis.tw.
14 arteriosclerosis.tw.
15 coronary risk factor$.tw.
16 multiple risk factor$.tw.
17 cardiovascular risk factor$.tw.
18 or/1-17
19 health promotion/
20 exp health education/
21 exp health behavior/
22 exp counseling/
23 primary prevention/
24 (multifactor$ adj5 (intervent$ or prevent$)).tw.
25 ((lifestyle or life-style) adj3 (intervention$ or educat$ or advice$ or alter$ or change$)).tw.
26 ((lifestyle or life-style or behavio?r$) adj3 (intervention$ or educat$ or advice$ or alter$ or change$)).tw.
27 ((healthcare or health care) adj3 advice).tw.
28 primary prevention.tw.
29 (risk factor$ adj3 (reduc$ or manage$ or managing or intervent$ or program$)).tw.
30 (educat$ adj3 (program$ or patient$)).tw.
31 ((health or healthcare or health care) adj3 (educat$ or advice or promot$)).tw.
32 (nonpharmacologic$ or non-pharmacologic$).tw.
33 ((lifestyle or life style or life-style or behavio?r$ or risk factor$) adj3 modif$).tw.
34 or/19-33
35 18 and 34
36 randomized controlled trial.pt.
37 controlled clinical trial.pt.
38 Randomized controlled trials/
39 random allocation.sh.
40 double blind method.sh.
41 single-blind method.sh.
42 or/36-41
43 (animal not human).sh.
44 42 not 43
166Multiple risk factor interventions for primary prevention of coronary heart disease (Review)
Copyright © 2011 The Cochrane Collaboration. Published by John Wiley & Sons, Ltd.

45 clinical trial.pt.
46 exp Clinical trials/
47 (clin$ adj25 trial$).ti,ab.
48 ((singl$ or doubl$ or trebl$ or tripl$) adj (blind$ or mask$)).ti,ab.
49 placebos.sh.
50 placebo$.ti,ab.
51 random$.ti,ab.
52 research design.sh.
53 or/45-52
54 53 not 43
55 54 not 44
56 44 or 54
57 35 and 56
58 limit 57 to yr=2000-2001
EMBASE on Ovid
<1996 to August Week 2 2001>
1 cardiovascular diseases/
2 exp coronary disease/
3 hypertension/
4 exp Arteriosclerosis/
5 exp Hyperlipidemia/
6 (cardiovascular adj3 disease$).tw.
7 (cardiovascular adj3 (fit or fitness)).tw.
8 (Coronary adj3 disease$).tw.
9 heart disease$.tw.
10 hypertension.tw.
11 hyperlipid?emia.tw.
12 cholesterol.tw.
13 atherosclerosis.tw.
14 arteriosclerosis.tw.
15 coronary risk factor$.tw.
16 multiple risk factor$.tw.
17 cardovascular risk factor$.tw.
18 or/1-17
19 health promotion/
20 exp health education/
21 exp health behavior/
22 exp counseling/
23 primary prevention/
24 (multifactor$ adj5 (intervent$ or prevent$)).tw.
25 ((lifestyle or life-style) adj3 (intervention$ or educat$ or advice$ or alter$ or change$)).tw.
26 ((lifestyle or life-style or behavio?r$) adj3 (intervention$ or educat$ or advice$ or alter$ or change$)).tw.
27 ((healthcare or health care) adj3 advice).tw.
28 primary prevention.tw.
29 (risk factor$ adj3 (reduc$ or manage$ or managing or intervent$ or program$)).tw.
30 (educat$ adj3 (program$ or patient$)).tw.
31 ((health or healthcare or health care) adj3 (educat$ or advice or promot$)).tw.
32 (nonpharmacologic$ or non-pharmacologic$).tw.
33 ((lifestyle or life style or life-style or behavio?r$ or risk factor$) adj3 modif$).tw.
34 or/19-33
35 18 and 34
167Multiple risk factor interventions for primary prevention of coronary heart disease (Review)
Copyright © 2011 The Cochrane Collaboration. Published by John Wiley & Sons, Ltd.

36 cardiovascular disease/
37 exp ischemic heart disease/
38 (coronary adj3 disease$).tw.
39 heart disease$.tw.
40 Hypertension/
41 hypertension.tw.
42 (cardiovascular adj3 (disease$ or fit of fitness)).tw.
43 exp arteriosclerosis/
44 exp hyperlipidemia/
45 hyperlipid?emia.tw.
46 cholesterol.tw.
47 arteriosclero$.tw.
48 atherosclero$.tw.
49 coronary risk factor$.tw.
50 multiple risk factor$.tw.
51 cardiovascular risk factor$.tw.
52 or/36-51
53 exp health education/
54 exp health behavior/
55 primary prevention/
56 exp counseling/
57 (multifactor$ adj5 (intervent$ or prevent$)).tw.
58 ((life-style or life style or lifestyle or healthcare or health care) adj3 (intervention$ or educat$ or advice or alter$ or change$)).tw.
59 primary prevention.tw.
60 (risk factor$ adj3 (reduc$ or manage$ or managing or intervent$ or program$)).tw.
61 (educat$ adj3 (program$ or patient$)).tw.
62 (non pharmacologic$ or nonpharmacologic$).tw.
63 (risk factor$ adj3 modif$).tw.
64 ((lifestyle or life-style or life style) adj3 modif$).tw.
65 exp behavior therapy/
66 (behavi?r$ adj3 (intervention$ or program$ or modif$ or change$ or alter$)).tw.
67 (promot$ adj3 (health or healthcare or health care)).tw.
68 or/53-67
69 52 and 68
70 random$.tw.
71 randomized controlled trial/
72 trial$.tw.
73 compar$.tw.
74 follow-up.tw.
75 blind$.tw.
76 double blind procedure/
77 placebo$.tw.
78 placebo/
79 doubl$.tw.
80 nonhuman/ not human/
81 exp child/ not exp adult/
82 or/70-79
83 82 and 69
84 83 not (80 or 81)
168Multiple risk factor interventions for primary prevention of coronary heart disease (Review)
Copyright © 2011 The Cochrane Collaboration. Published by John Wiley & Sons, Ltd.

Appendix 3. Search strategy 1995
MEDLINE
randomized controlled trial.pt.
randomized controlled trials/
random-allocation.sh.
double-blind-method.sh.
single-blind-method.sh.
1 or 2 or 3 or 4 or 5
clinical trials.pt.
clinical trials.sh.
clin$ near trial$.ti.
clin$ near trial$.ab.
placebo.sh.
placebo.tw.
random.tw.
7 or 8 or 9 or 10 or 11 or 12 or 13
limit 14 to human
coronary disease.sh.
cerebrovascular disorders.sh.
W H A T ’ S N E W
Last assessed as up-to-date: 21 December 2006.
Date Event Description
11 November 2010 New search has been performed The search has been re-run to June 2006. We identified
and included 16 trials from the updated search.
11 November 2010 New citation required and conclusions have changed A total of 55 trials are included in this update. We
applied the new criteria of including studies with at
least six months follow up. New authors are introduced
to this update.
H I S T O R Y
Review first published: Issue 2, 1999
169Multiple risk factor interventions for primary prevention of coronary heart disease (Review)
Copyright © 2011 The Cochrane Collaboration. Published by John Wiley & Sons, Ltd.
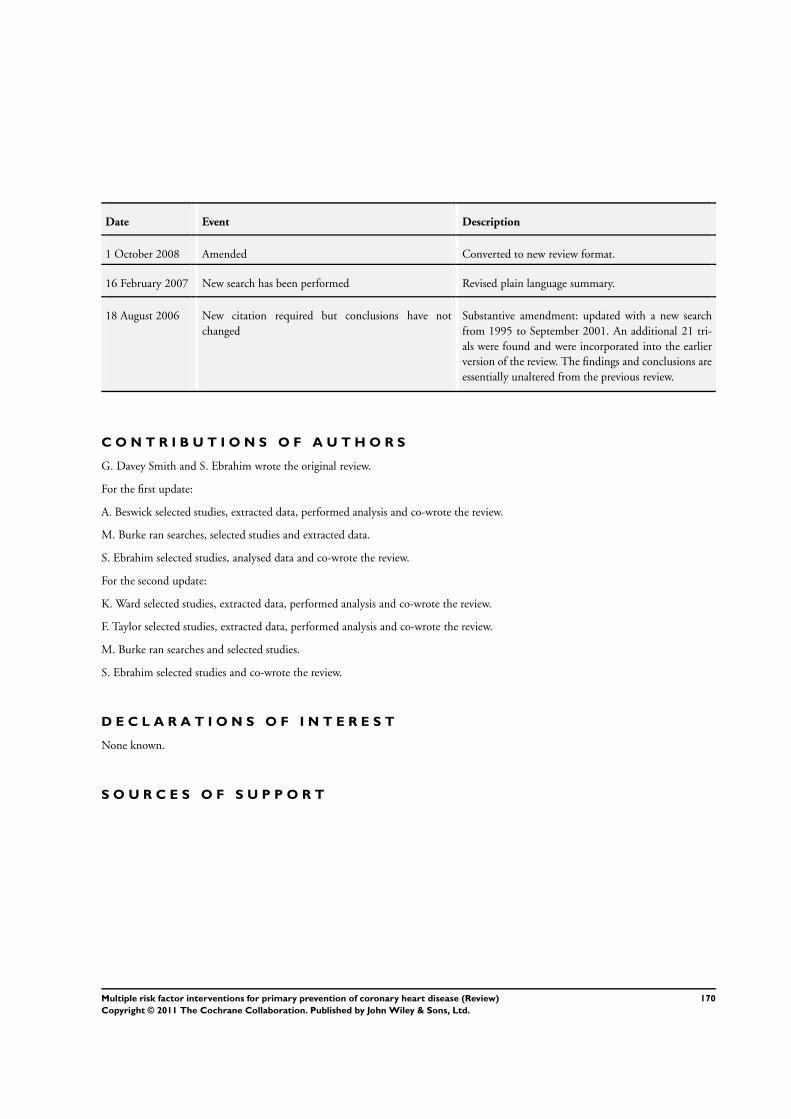
Date Event Description
1 October 2008 Amended Converted to new review format.
16 February 2007 New search has been performed Revised plain language summary.
18 August 2006 New citation required but conclusions have not
changed
Substantive amendment: updated with a new search
from 1995 to September 2001. An additional 21 tri-
als were found and were incorporated into the earlier
version of the review. The findings and conclusions are
essentially unaltered from the previous review.
C O N T R I B U T I O N S O F A U T H O R S
G. Davey Smith and S. Ebrahim wrote the original review.
For the first update:
A. Beswick selected studies, extracted data, performed analysis and co-wrote the review.
M. Burke ran searches, selected studies and extracted data.
S. Ebrahim selected studies, analysed data and co-wrote the review.
For the second update:
K. Ward selected studies, extracted data, performed analysis and co-wrote the review.
F. Taylor selected studies, extracted data, performed analysis and co-wrote the review.
M. Burke ran searches and selected studies.
S. Ebrahim selected studies and co-wrote the review.
D E C L A R A T I O N S O F I N T E R E S T
None known.
S O U R C E S O F S U P P O R T
170Multiple risk factor interventions for primary prevention of coronary heart disease (Review)
Copyright © 2011 The Cochrane Collaboration. Published by John Wiley & Sons, Ltd.
Internal sources
• MRC Health Services Research Collaboration, UK.
• Systematic Reviews Training Unit, University of London, UK.
• Department of Social Medicine, University of Bristol, UK.
• Department of Epidemiology & Population Health, London School of Hygeine & Tropical Medicine, UK.
External sources
• NHS Centre for Reviews & Dissemination, University of York, UK.
• Health Education Authority, London, UK.
I N D E X T E R M S
Medical Subject Headings (MeSH)
Coronary Disease [mortality; ∗prevention & control]; Patient Education as Topic; Randomized Controlled Trials as Topic; Risk Factors
MeSH check words
Humans
171Multiple risk factor interventions for primary prevention of coronary heart disease (Review)
Copyright © 2011 The Cochrane Collaboration. Published by John Wiley & Sons, Ltd.