Embed Size (px)
Citation preview

1 3
DOI 10.1007/s10337-014-2699-4Chromatographia
OrIgInal
Multiple Response Optimization of a HPLC Method for the Determination of Enantiomeric Purity of S‑Ofloxacin
Valliappan Kannappan · Sai Sandeep Mannemala
received: 28 February 2014 / revised: 21 april 2014 / accepted: 18 May 2014 © Springer-Verlag Berlin Heidelberg 2014
Keywords Column liquid chromatography · Ofloxacin enantiomers · Chiral HPlC separation · Central composite design · Polysaccharide chiral stationary phase · Chromatographic optimization function
Introduction
Chiral drugs constitute one-third of the worldwide marketed drugs. It is now well documented that the enantiomers of chiral drugs exhibit different pharmacological and toxico-logical properties [1]. Therefore, the determination of enan-tiomeric purity of chiral drugs is important from the point of view of safety and efficacy of drug therapy [2]. Ofloxacin (Fig. 1) designated as [(±)-9-fluoro-2,3-dihydro-3-methyl-10-(4-methyl-1-piperazinyl)-7-oxo-7H-pyridol(1,2,3-de)-1,4-benzoxazine-6-carboxylic acid] is a second-generation broad spectrum antibiotic. Ofloxacin possesses one stereo-genic center in the oxazidine ring and exists in two enan-tiomeric forms. levofloxacin (S-OFl) is the S-enantiomer of Ofloxacin, the eutomer, which shows 8-fold to 128-fold higher activity than its r-enantiomer (r-OFl) with differ-ent in vitro bacterial strains [3]. levofloxacin products may contain traces of the r-OFl, the distomer, residual from levofloxacin synthesis. Hence, it is necessary to identify and determine both the Ofloxacin enantiomers for chiral quality control. The monograph of n is official in Indian Pharmaco-poeia [4], British Pharmacopoeia [5] and USP nF 32 [6]. It is available in various dosage forms, viz. tablets, eye drops, infusion, suspension and capsules in Indian market.
The determination of n enantiomers in pharmaceutical dos-age form and biological matrices was performed by capillary electrokinetic chromatography [7], capillary electrophoresis [8], ligand exchange methods [9–11]. also a semiprepara-tive method by employing immobilized β-cyclodextrin chiral
Abstract The aim of the study was to develop a new HPlC method for direct chiral separation of Ofloxacin enantiomers using polar non-aqueous mobile phase by application of response surface methodology. rotatable central composite design (CCD) with eight factorial points, six axial points and six replications in central point was used to evaluate the influence of three independent vari-ables (concentration of methanol, diethylamine and flow rate) on the output responses (capacity factor of first peak, tailing factors of both the enantiomers, resolution between the Ofloxacin enantiomers, retention time of the last peak and chromatographic optimization function). Further, CCD data were combined with multiple response optimiza-tion in order to obtain a set of optimal experimental con-ditions (% methanol/hexane/acetonitrile-43.33/10/46.62 (v/v), % acetic acid/diethylamine-0.4/0.2 and flow rate as 1.4 ml min−1) leading to the most desirable compromise between resolution and analysis time. The method demon-strated good correlation between observed and predicted responses. The developed method was validated according to ICH guidelines and applied for quantitative analysis of two commercially available tablets Zenoflox (Ofloxacin) and glevo (levofloxacin). good agreement was found between the assay results and the label claim of the mar-keted formulations by showing good %recovery and %CV. The study resulted in a better chromatographic system for the determination of Ofloxacin enantiomers.
V. Kannappan (*) · S. S. Mannemala Department of Pharmacy, Faculty of Engineering and Technology, annamalai University, annamalai nagar, Chidambaram 608002, Tamil nadu, Indiae-mail: [email protected]

V. Kannappan, S. S. Mannemala
1 3
stationary phase (CSP) is reported [12]. However, an inten-sive literature survey revealed that there are three direct chi-ral analysis HPlC methods reported for determination of n enantiomers. lehr et al. [13] and rabba et al. [14] developed methods based on bovine serum albumin (BSa) CSP which suffers from limitation of usage of delicate column. Sun et al. [15] proposed a method based on Chiralcel OD-H column, which has major weakness like excess analysis time (20 min), low sensitivity (lOD = 10 µg/l) and a poor resolution (Rs = 1.3) between the enantiomers. Further, none of these methods utilized a systematic optimization approach (viz. chemometric methods) for the separation and quantitation of the n enantiomers, but employed a time-consuming trial and error approach which will result only in an apparent optimum and information regarding the sensitivity of the factors on the analytes separation and interaction between the factors is not available. all the above indicated direct chiral HPlC meth-ods suffer from one or the other limitation and may not be suitable for routine quality control purpose. Hence, this study attempts to develop an improved HPlC method for the deter-mination of Ofloxacin enantiomers using chemometric proce-dure and also demonstrate the utility of the developed method by analyzing two commercially available tablets Zenoflox (Ofloxacin) and glevo (:levofloxacin).
Experimental
apparatus
The chromatographic system from Shimadzu (Shimadzu Cor-poration, Kyoto, Japan) was used for the analysis which con-sisted of two lC 20 aD solvent delivery modules, a SPD-M 20a PDa detector and a rheodyne injector (model 7125, USa) valve fitted with a 20-µl loop. The system was con-trolled through a system controller (SCl-10a) and a personal computer using a Shimadzu chromatographic software (lC Solution, release 1.11SP1) installed on it. The mobile phase was degassed using Branson sonicator (Branson Ultrasonics, USa). a lux Cellulose-4 column (250 × 4.6 mm, ID) packed with cellulose tris (4-chloro-3-methylphenylcarbamate)
coated on silica particles (5 µm) from Phenomenex (Phe-nomenex, USa) was used. absorbance spectra were recorded using an UV–Visible spectrophotometer (Model UV-1601PC; Japan) using quartz cell of 1.00 cm of path length.
Software
Experimental design, data analysis and desirability func-tion calculations were performed by using JMP®, 9.0 trial version (SaS Institute Inc., Cary, nC) [16]. Perturbation plot was generated using Design expert®, 8.0 version (Stat-Ease, Mn, USa). The rest of the calculations for the anal-ysis were performed by the use of Microsoft Excel 2010 software (Microsoft, USa).
Chemicals and reagents
Working standards of Ofloxacin (±)-Ofloxacin (98.9 %) was donated by East India Pharmaceuticals (Kolkata, India), levofloxacin (99.7 %) was a gift sample from M/S Phar-maceuticals (Puducherry, India) and probenecid, internal standard (IS) (99.8 %), was purchased from Sigma-aldrich (Bangalore, India); acetonitrile (MeCn), methanol (MeOH) of HPlC grade and acetic acid (acOH) and diethyl amine (DEa) of analytical reagent grade were procured from M/S SD Fine Chemicals (Mumbai, India). The HPlC grade water was prepared by using Milli-Q academic, Millipore (Banga-lore, India). The tablets Zenoflox (Ofloxacin, 200 mg) from Mankind Pharma ltd (Mumbai, India) and glevo (levoflox-acin 500 mg) from glenmark Pharmaceuticals ltd (Chennai, India) was procured from local pharmacy.
Preparation of Solutions and Chromatographic Conditions
Stock and Working Standard Solutions
Stock standard solutions of (±)-Ofloxacin, S-OFl and probenecid (IS) 1,000 (µg ml−1) were prepared in mobile phase. The prepared stock solutions were stored at 4 °C pro-tected from light. Working standard solutions were freshly prepared by diluting the stock standard solutions with mobile
Fig. 1 Structure of n enantiom-ers

Multiple Response Optimization of a HPLC Method
1 3
phase during the day of analysis. Calibration curves report-ing peak area ratios of S-OFl and r-OFl to that of the IS versus drug concentrations were established in the range of 2–10 µg ml−1 for all the analytes in the presence of probenecid (10 µg ml−1) as IS. The standard solution pre-pared for the optimization procedure comprised Ofloxacin (10 µg ml−1), S-OFl (10 µg ml−1) and IS (10 µg ml−1).
Preparation of Sample Solution
Twenty tablets were weighed and finely powdered. an amount of tablet powder equivalent to 20 mg of (±)-Ofloxa-cin was accurately weighed and transferred in a 25-ml vol-umetric flask; a suitable quantity of IS (25 mg) was added followed by 12 ml of mobile phase. This mixture was sub-jected to sonication for 10 min for complete extraction of drugs and the solution was made up to the mark with mobile phase and further dilutions were made to obtain a concen-tration of (±)-Ofloxacin and IS as 8.0 and 10.0 µg ml−1, respectively. The solution was centrifuged at 4,000 rpm for 10 min; the clear supernatant was collected and filtered through a 0.2-µm membrane filter (gelman Science, India), and 20 µl of this solution was injected for HPlC analysis.
Chromatographic Conditions
The chromatographic separation was carried out using a mobile phase consisting of a mixture of MeOH, hexane, MeCn and small amounts of acOH and DEa. The analytes were detected at 285 nm based on isobestic point. Prior to use, the mobile phase was degassed for 15 min in an ultrasonic bath and vacuum filtered through 0.45-µm membrane filter (gelman Science, India). The injection volume was 20 µl. The mobile phase was prepared by first mixing the appropri-ate proportions of MeOH in hexane and then with aCn; sub-sequently small amounts of acOH and DEa were added to this mixture as per design. The HPlC system was used in an air-conditioned laboratory atmosphere (25 ± 2 °C).
Method Validation
The optimized method was validated according to ICH Q2(r1) guidelines [17]. The validation parameters like linearity, limit of detection and quantification, specificity, accuracy, precision and robustness were addressed.
Results and Discussion
Optimization of Chromatographic Conditions
rotatable central composite design (rCCD) was employed in this study for the optimization of chromatographic
separation and to understand the interaction of selected fac-tors on separation attributes. The selection of key factors for optimization was based on preliminary experiments and prior knowledge from literature [18–21]. For instance, the concentration of hexane was fixed at 10 % v/v and the con-centration of acOH was fixed at 0.4 % v/v in the mobile phase as it aided in maintaining a better peak shape for both enantiomers. So, the factors selected for optimization process were % MeOH concentration (A), % DEa concen-tration (B) and flow rate (C). The factor space of this design was expanded with in the following range: MeOH concen-tration was varied from 40 to 60 % v/v, DEa concentration from 0.2 to 0.3 % and flow rate from 1.0 to 1.4 ml min−1 by keeping concentration of hexane (10 % v/v), acOH (0.4 % v/v) constant and % MeCn constituting the rest of the volume of mobile phase. In order to judge the quality of the method under different conditions, the following responses of interest were defined (1) capacity factor of the first eluted peak (k1), (2) tailing factor of the 2nd peak, S-OFl (tF2), (3) tailing factor of the 3rd peak, r-OFl (tF3), (4) resolution between the Ofloxacin enantiomers (Rs23), (5) retention time of the last peak, r-OFl (tR3) and (6) chromatographic optimization function (COF).
COF is calculated according to Eq. (1) [22]. Where Ai and B are weighted parameters (equal to unity in this study), Rsi is the resolution of the ith pair, Rsid is the desired resolution for the specific pair (equals to 4), tM rep-resents the desired maximum analysis time (here assumed 10 min), and tl is the actual time of the last eluted peak. In the present study, COF was used as it enabled to decrease data from each chromatogram to a single number which can be used in the optimization procedure. The elution order of analytes was confirmed by injecting the pure standards individually. Probenecid (IS) was used as an internal stand-ard as it presented acceptable resolution and retention time with both of the enantiomers.
Table 1 summarizes the conducted experiments, viz. (n = 14 + 6) six replicates at center point and the responses. all experiments were conducted in randomized order to minimize the effects of uncontrolled variables that may introduce a bias on the measurements. Two replicates were performed for each experiment in order to know the experimental error variance and to test the predictive valid-ity of the model.
a cross-effect between the three factors (MeOH, DEa and flow rate) and the selected responses were then ana-lyzed using a “standard least squares” model. Calculated coefficients of the response model and obtained P values are given in Table 2. The insignificant terms (P > 0.05)
(1)COF =
K∑
i=1
Ai ln
(
Rsi
Rsid
)
+ B(tM − tL)

V. Kannappan, S. S. Mannemala
1 3
were eliminated from the model through a backward elimination process to obtain a simple and realistic model. The adjusted R2 were well within the acceptable lim-its of R2 ≥ 0.80 [23], which revealed that the experimen-tal data show a good fit with the second-order polynomial equations. For all the reduced models, P value of >0.05 is obtained, implying that these models are significant. The adequate precision values were found to be in the range of 14.08–33.67, which indicates an adequate signal, and there-fore, the model is significant for the separation process. The %CV for all the models was found to be <10 %, except for COF (12.05 %). Therefore, the diagnostic plots (a) normal probability plot of the residuals and (b) plot of residual ver-sus predicted values [24] were analyzed for response COF.
Since the assumptions of normality and constant variance of the residuals were found to be satisfied, the fitted model for the response COF was accepted.
response models (Table 2) suggest that among the fitted models, k1 has the interaction term (aC) with largest abso-lute coefficient (+0.042). The positive interaction between A and C is statistically significant (P < 0.0001) for the k1 model. Perturbation plot was examined for response k1 to understand the effect of an independent factor on a specific response, with all other factors held constant at a reference point [25]. It is evident from Fig. 2 that the response k1 was highly influenced by the level of factor B followed by fac-tor a. as expected, capacity factor k1 is least sensitive to factor C.
Table 1 Central composite rotatable design arrangement and responses
Central composite rotatable design arrangements are in random
Design points Coded factor levels responses
%MeOH %DEa Flow rate k1 Rs23 tF2 tF3 tR3 COF
1 0 0 0 0.40 4.7 2.1 1.8 6.4 7.89
2 0 0 0 0.40 4.7 2.1 1.9 6.4 7.89
3 0 0 0 0.41 4.8 2.0 1.7 6.5 7.71
4 0 0 0 0.43 4.7 1.9 1.8 6.5 7.69
5 0 0 0 0.41 4.7 1.9 1.7 6.5 7.69
6 0 0 0 0.40 4.7 1.9 1.8 6.5 7.70
7 0 0 −1.682 0.42 5.2 2.3 1.9 9.2 2.45
8 0 0 +1.682 0.45 4.2 1.6 1.5 5 10.38
9 0 −1.682 0 0.61 4.3 1.9 1.8 6.3 7.47
10 −1.682 0 0 0.57 7.5 1.8 1.5 6.9 7.53
11 +1.682 0 0 0.52 3.6 2.1 1.9 6.8 6.83
12 0 +1.682 0 0.51 4.9 2.1 1.7 6.6 7.68
13 +1 +1 −1 0.45 4.1 2.6 2.1 7.9 4.92
14 +1 −1 −1 0.60 4.1 2.4 2.1 7.6 4.99
15 −1 −1 −1 0.52 5.9 1.9 1.68 8.2 4.39
16 −1 +1 −1 0.43 5.6 2.0 1.6 8.7 3.41
17 +1 +1 +1 0.39 3.9 2.0 1.8 5.7 9.20
18 +1 −1 +1 0.55 3.8 2.0 1.8 5.6 9.14
19 −1 +1 +1 0.48 5.8 1.8 1.5 6 8.97
20 −1 −1 +1 0.69 5.7 1.6 1.5 6.9 6.87
Table 2 reduced response models and statistical parameters obtained from anOVa (after backward elimination)
a Only significant coefficients with P < 0.05 are included. Factors are in coded levels
responses reduced response modelsa adjusted R2 Model P value %CV adequate precision
k1 k1 = +0.42 − 0.015 a − 0.057 B + 0.012 C − 0.042 aC+ 0.046 a2 + 0.051 B2
0.8664 0.000 6.50 14.088
Rs23 Rs23 = +4.65 − 1.00 a − 0.16 C + 0.28 a2 0.9406 0.000 4.61 33.672
tF2 tF2 = + 2.00 + 0.16 a + 0.061 B − 0.20 C 0.8186 0.001 5.12 18.270
tF3 tF3 = +1.75 + 0.16 a − 0.11 C 0.8476 0.000 4.00 20.209
tR3 tR3 = +6.81 − 1.12 C 0.8144 0.000 6.60 26.440
COF COF = +7.04 + 2.18 C 0.8249 0.000 12.05 27.381

Multiple Response Optimization of a HPLC Method
1 3
global Optimization of Multiple responses
The targeted criteria for the optimization was to minimize the resolution between the Ofloxacin enantiomeric pair, reduce the tailing factors of enantiomers, minimize the analysis time, increase the COF value as well as the reten-tion factor k1. global optimization of multiple responses was achieved by employing desirability function computed using JMP prediction profiler (Fig. 3). Desirability function transfers the response variable to a 0–1 scale. a response of 0 represents a completely undesirable response and 1 represents the most desirable response. Figure 3 depicts that a smaller % of MeOH has positive impact on all the factors except for the resolution Rs23 in which it leads to excess resolution between the enantiomer pair, small % of DEa showed a good impact on k1 value. However, its effect on other factors was not significant as it showed less curvature and the higher flow rate values showed sig-nificant effect on k1, COF and tR3. The operating condi-tions were chosen to achieve the maximum overall desir-ability; all the responses were optimized simultaneously. The optimum conditions were chosen by total desirability as near as 1. The highest desirability value of 0.823 was achieved at MeOH/hexane/MeCn-43.33/10/46.62 (v/v) %, %acOH/DEa-0.4/0.2 and flow rate as 1.4 ml min−1. The predicted response values corresponding to the high-est desirability value (0.823) were k1 = 0.61, Rs23 = 5.193, tF2 = 1.68, tF3 = 1.57, tR3 = 6.14 min and COF = 8.25. The prediction efficiency of the model was confirmed by
performing the experiment under the optimal condition, and the corresponding chromatogram is shown in Fig. 4. The average errors for k1, Rs23, tF2, tF3, tR3 and COF were 1.63, 0.05, −1.60, −3.95, −2.61 and 0.73 %, respectively, within a difference of <4 %, indicating a good correlation between the experimental and the predicted responses.
Validation of the Test Procedure
Linearity
The linearity of the proposed method was estimated by car-rying out regression analysis at five concentration levels in the range of 2–10 µg ml−1 for Ofloxacin (approximately 20–200 % of the nominal range of the analyte). The cali-bration curve was obtained using the linear least squares regression procedure. The representative linear equation was y = 0.2375x − 0.0413 and y = 0.2356x − 0.0462 for S-OFl and r-OFl, respectively. Correlation coefficients were found to be more than 0.998 for both enantiomers. The homoscedasticity for the calibration curves was veri-fied by using Bartlett’s test and in that no statistical differ-ence (P > 0.05) was found between the variances [26].
Limits of Detection and Quantitation
Calibration curves were plotted at five levels ranging from 0.05 to 1.0 % of the nominal analyte concentration [27]. The residual standard deviation of the response (σ) and slope (s) of the calibration curve was used to calculate the lOD as 3.3 σ/s and lOQ as 10 σ/s. Using the above equations, the lOD and lOQ were estimated as 4.95 and 14.99 ng ml−1 for S-OFl, and 4.26 and 12.92 ng ml−1 for r-enantiomer, respectively.
Specificity
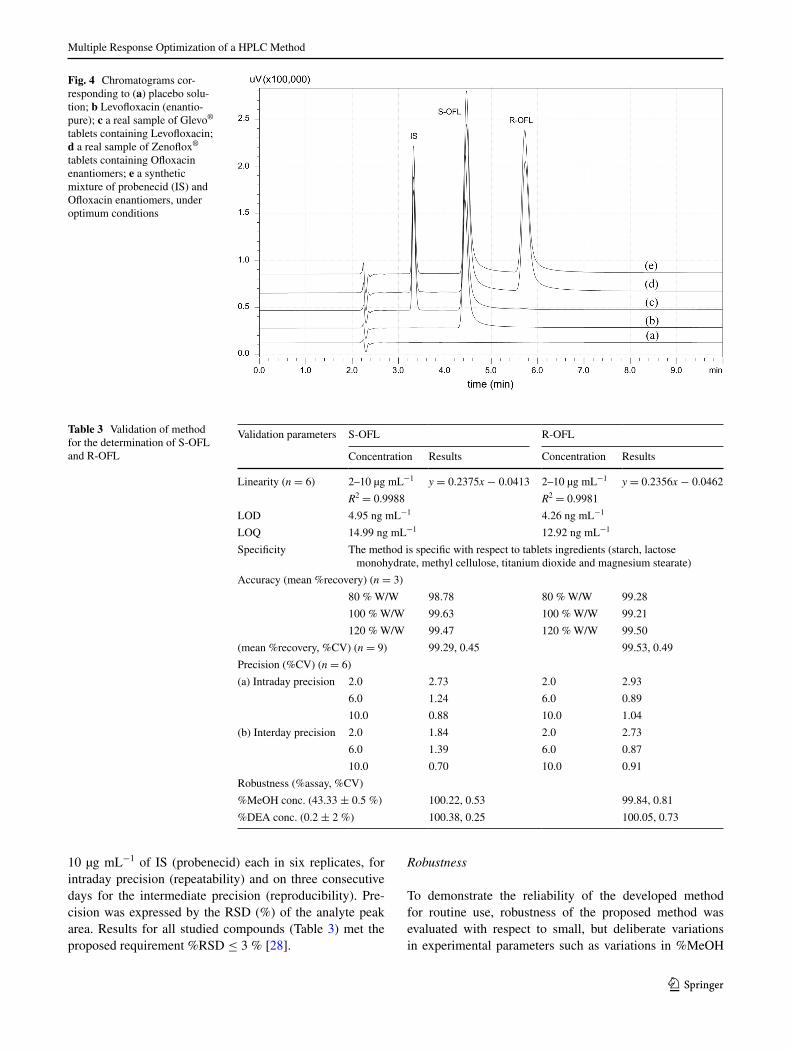
Specificity of the method was evaluated by comparing the chromatograms of placebo sample containing a mixture of the commonly used excipients (starch, lactose monohy-drate, methyl cellulose, titanium dioxide and magnesium stearate) with that of the standard drugs. There were no excipient peaks co-eluted with the analyte as well as with IS, which shows that the developed method is selective and specific to the excipients used in this study (Fig. 4).
Accuracy
accuracy of the method was demonstrated by analyzing quality control (QC) standards prepared at three levels of 80, 100 and 120 % of the expected assay value in the mar-keted formulation. QC samples were prepared as three rep-licates at each concentration level by spiking the standard
Fig. 2 Perturbation plot showing the effect of each of the independ-ent factors on response k1, where A is %MeOH, B is %DEa and C is mobile phase flow rate

V. Kannappan, S. S. Mannemala
1 3
drugs with the placebo excipients, which were left over-night to allow matrix–analyte interactions to occur, and then analyzed as described in “Preparation of Sample Solution” section. The % recovery of the enantiomers at each level (n = 3) and mean % recovery (n = 9) were determined, and data are presented in Table 3 where accuracy (%) was expressed as [(calculated amount/predicted amount) × 100]. The recoveries of both enantiomers at each level were found to lie within the acceptable criteria of the bias ±2 % [28]. The mean % recovery (n = 9) for each enantiomer was also tested for significance by using Student’s t test, the null
hypothesis being that the recovery is unity or 100 %. Since the calculated t-value (tCalc) for S-OFl (2.73) and r-OFl (1.64) is less than the theoretical t-value (tCrit = 4.30), at 5 % significance level, the null hypothesis was accepted. These results indicate that the method is accurate, and there was no interference from placebo in this study.
Precision
The precision was established by injecting three concen-tration levels (2, 6 and 10 µg ml−1) for Ofloxacin with
Fig. 3 Prediction profiler obtained for the responses Rs23, tF2, tF3, tR3, COF and k1
Multiple Response Optimization of a HPLC Method
1 3
10 µg ml−1 of IS (probenecid) each in six replicates, for intraday precision (repeatability) and on three consecutive days for the intermediate precision (reproducibility). Pre-cision was expressed by the rSD (%) of the analyte peak area. results for all studied compounds (Table 3) met the proposed requirement %rSD ≤ 3 % [28].
Robustness
To demonstrate the reliability of the developed method for routine use, robustness of the proposed method was evaluated with respect to small, but deliberate variations in experimental parameters such as variations in %MeOH
Fig. 4 Chromatograms cor-responding to (a) placebo solu-tion; b levofloxacin (enantio-pure); c a real sample of glevo® tablets containing levofloxacin; d a real sample of Zenoflox® tablets containing Ofloxacin enantiomers; e a synthetic mixture of probenecid (IS) and Ofloxacin enantiomers, under optimum conditions
Table 3 Validation of method for the determination of S-OFl and r-OFl
Validation parameters S-OFl r-OFl
Concentration results Concentration results
linearity (n = 6) 2–10 µg ml−1 y = 0.2375x − 0.0413 2–10 µg ml−1 y = 0.2356x − 0.0462
R2 = 0.9988 R2 = 0.9981
lOD 4.95 ng ml−1 4.26 ng ml−1
lOQ 14.99 ng ml−1 12.92 ng ml−1
Specificity The method is specific with respect to tablets ingredients (starch, lactose monohydrate, methyl cellulose, titanium dioxide and magnesium stearate)
accuracy (mean %recovery) (n = 3)
80 % W/W 98.78 80 % W/W 99.28
100 % W/W 99.63 100 % W/W 99.21
120 % W/W 99.47 120 % W/W 99.50
(mean %recovery, %CV) (n = 9) 99.29, 0.45 99.53, 0.49
Precision (%CV) (n = 6)
(a) Intraday precision 2.0 2.73 2.0 2.93
6.0 1.24 6.0 0.89
10.0 0.88 10.0 1.04
(b) Interday precision 2.0 1.84 2.0 2.73
6.0 1.39 6.0 0.87
10.0 0.70 10.0 0.91
robustness (%assay, %CV)
%MeOH conc. (43.33 ± 0.5 %) 100.22, 0.53 99.84, 0.81
%DEa conc. (0.2 ± 2 %) 100.38, 0.25 100.05, 0.73

V. Kannappan, S. S. Mannemala
1 3
concentration (43.38 % ± 0.5) and % DEa (0.2 ± 0.02) did not alter the retention times, tailing factor (tF2) and res-olution values more than 2 % in the proposed method. So, it could be concluded that the developed method is robust.
Application of the Method
The proposed rP-HPlC method was applied to the quan-titative analysis of the Ofloxacin and levofloxacin tab-lets. Ofloxacin enantiomers in real samples (Zenoflox tablets) containing racemic Ofloxacin were analyzed by the proposed method. representative chromatograms are presented in Fig. 4. The results achieved when analyzing Zenoflox tablets were 100.07 (0.11) mg of levofloxacin and 99.95 (0.06) mg of r-OFl, respectively, with the val-ues within parentheses being the %CV of the six replicates. assay of levofloxacin was performed on glevo-500 tab-lets in which the presence of r-enantiomer is considered to be an impurity. The result obtained for the assay of levo-floxacin was 499.6 (0.1) mg with the values within paren-theses being the %CV of the six replicates. The content of the r-OFl was not more than 0.5 %. good agreement was found between the assay results and the label claim of the marketed formulations. The quantities found for Ofloxacin as well as for levofloxacin in tablets were in conformity with the values claimed by the manufacturer.
Conclusions
In this paper, an efficient chiral HPlC method was devel-oped, optimized and validated for the simultaneous esti-mation of the Ofloxacin enantiomers in pharmaceutical formulations and in bulk drugs using response surface methodology. This method reduces overall analysis time and provides essential information regarding the sensitiv-ity of various chromatographic factors and their interaction effects on separation attributes. Higher sensitivity, shorter analysis time, use of polar non-aqueous organic solvents and adequate resolution of the developed method dem-onstrates that it can be extrapolated for semi-preparative purpose and for lC–MS analysis of Ofloxacin enantiom-ers. The proposed method was found to be linear, sensitive, selective, precise and accurate. Therefore, it could be suc-cessfully adopted for routine analysis of Ofloxacin enanti-omers and in chiral impurity profiling of levofloxacin in bulk drugs and pharmaceutical formulations.
Acknowledgments Sai Sandeep M is grateful to University grants Commission (UgC), new Delhi, India, for providing UgC BSr fel-lowship and to UgC SaP- DrS Phase-I sponsored Department of Pharmacy, annamalai University, Tamil nadu, India, for providing the facilities to carry this research work.
References
1. Burke D, Henderson DJ (2002) Chirality: a blueprint for the future. Br J anaesth 88(4):563–576. doi:10.1093/bja/88.4.563
2. Francotte Er (2001) Enantioselective chromatography as a power-ful alternative for the preparation of drug enantiomers. J Chroma-togr a 906(1–2):379–397. doi:10.1016/S0021-9673(00)00951-1
3. Drew rH, gallis Ha (1988) Ofloxacin: its pharmacol-ogy, pharmacokinetics, and potential for clinical applica-tion. Pharmacother J Hum Pharmacol Drug Ther 8(1):35–46. doi:10.1002/j.1875-9114.1988.tb0406x
4. Indian Pharmacopoeia (2010) vol v. 1. Indian Pharmacopoeia Commission, ghaziabad, India
5. British Pharmacopoeia (2011) vol v. 1. Her Majesty’s stationery Office, london, UK
6. United States Pharmacopoeia (2009) vol v. 1. United States Phar-macopeial Convention, rockville, Maryland, USa
7. de Boer T, Mol r, de Zeeuw ra, de Jong gJ, Ensing K (2001) Enantioseparation of ofloxacin in urine by capillary electrokinetic chromatography using charged cyclodextrins as chiral selectors and assessment of enantioconversion. Electrophoresis 22(7):1413–1418. doi:10.1002/1522-2683(200105)22:7<1413::aID-ElPS1413>3.0. CO;2-U
8. awadallah B, Schmidt PC, Wahl Ma (2003) Quantitation of the enantiomers of ofloxacin by capillary electrophoresis in the parts per billion concentration range for in vitro drug absorp-tion studies. J Chromatogr a 988(1):135–143. doi:10.1016/S0021-9673(02)02015-0
9. Bi W, Tian M, row KH (2011) Chiral separation and determi-nation of ofloxacin enantiomers by ionic liquid-assisted ligand-exchange chromatography. analyst 136(2):379–387. doi:10.1039/C0an00657B
10. Yan H, Qiao F (2013) rapid screening of ofloxacin enantiomers in human urine by molecularly imprinted solid-phase extraction coupled with ligand exchange chromatography. J liq Chromatogr relat Technol 37(9):1237–1248. doi:10.1080/10826076.2013.789795
11. Zeng S, Zhong J, Pan l, li Y (1999) High-performance liquid chromatography separation and quantitation of ofloxacin enan-tiomers in rat microsomes. J Chromatogr B Biomed Sci appl 728(1):151–155. doi:10.1016/S0378-4347(99)00085-7
12. Fang Z, guo Z, Qin Q, Fan J, Yin Y, Zhang W (2013) Semi-pre-parative enantiomeric separation of ofloxacin by HPlC. J Chro-matogr Sci 51(2):133–137. doi:10.1093/chromsci/bms117
13. lehr K-H, Damm P (1988) Quantification of the enantiomers of ofloxacin in biological fluids by high-performance liquid chro-matography. J Chromatogr B Biomed Sci appl 425:153–161. doi:10.1016/0378-4347(88)80015-X
14. rabbaa l, Dautrey S, Colas-linhart n, Carbon C, Farinotti r (1997) absorption of ofloxacin isomers in the rat small intestine. antimicrob agents Chemother 41(10):2274–2277
15. Sun X, Wu D, Shao B, Zhang J (2009) High-performance liquid-chromatographic separation of ofloxacin using a chiral stationary phase. anal Sci 25(7):931–933. doi:10.2116/analsci.25.931
16. Institute. SaS (2010) JMP statistical software version 9.0. SaS Institute Inc, Cary, north Carolina, USa
17. Secretariat ICH (2005) Validation of analytical procedures: text and methodology, Q2 (r1), current step 4 version, parent guide-lines on methodology dated november 6 1996, incorporated in november 2005, vol 60. Fed.register, geneva, Switzerland
18. Dossou KSS, Chiap P, Chankvetadze B, Servais a-C, Fillet M, Crommen J (2010) Optimization of the lC enantioseparation of chiral pharmaceuticals using cellulose tris(4-chloro-3-methylphe-nylcarbamate) as chiral selector and polar non-aqueous mobile phases. J Sep Sci 33(12):1699–1707. doi:10.1002/jssc.201000049

Multiple Response Optimization of a HPLC Method
1 3
19. Chankvetadze B (2012) recent developments on polysaccha-ride-based chiral stationary phases for liquid-phase separation of enantiomers. J Chromatogr a 1269:26–51. doi:10.1016/j.chroma.2012.10.033
20. Dossou KSS, Chiap P, Servais aC, Fillet M, Crommen J (2011) Development and validation of a lC method for the enantiomeric purity determination of S-ropivacaine in a pharmaceutical for-mulation using a recently commercialized cellulose-based chiral stationary phase and polar non-aqueous mobile phase. J Pharm Biomed anal 54(4):687–693. doi:10.1016/j.jpba.2010.10.020
21. Valliappan K, Vaithiyanathan S, Palanivel V (2013) Direct chiral HPlC method for the simultaneous determination of warfarin enantiomers and its impurities in raw material and pharmaceuti-cal formulation: application of chemometric protocol. Chroma-tographia 76(5–6):287–292. doi:10.1007/s10337-012-2373-7
22. glajch Jl, Kirkland JJ, Squire KM, Minor JM (1980) Opti-mization of solvent strength and selectivity for reversed-phase liquid chromatography using an interactive mixture-design sta-tistical technique. J Chromatogr a 199:57–79. doi:10.1016/S0021-9673(01)91361-5
23. Sivakumar T, Manavalan r, Muralidharan C, Valliappan K (2007) Multi-criteria decision making approach and experimen-tal design as chemometric tools to optimize HPlC separation
of domperidone and pantoprazole. J Pharm Biomed anal 43(5):1842–1848. doi:10.1016/j.jpba.2006.12.007
24. Choisnard l, Bigan M, Blondeau D, Dhulster P, leman B, guil-lochon D (2003) application of the method of the experimental design to the study of a processing of unshrinkableness of wool fibers. J appl Polym Sci 89(2):535–547. doi:10.1002/app.12173
25. Sivakumar T, Manavalan r, Muralidharan C, Valliappan K (2007) an improved HPlC method with the aid of a chemometric proto-col: simultaneous analysis of amlodipine and atorvastatin in phar-maceutical formulations. J Sep Sci 30(18):3143–3153. doi:10.1002/jssc.200700148
26. Danzer K, Currie l (1998) guidelines for calibration in ana-lytical chemistry-Part I. Fundamentals and single component calibration (IUPaC recommendations 1998). Pure appl Chem 70(4):993–1014
27. Crowther JB (2001) Validation of pharmaceutical test meth-ods. In: Satinder a, Stephen S (eds) Separation science and technology, vol 3. academic Press, pp 415–443. doi:10.1016/S0149-6395(01)80014-3
28. Ermer J, Burgess C, Kleinschmidt g, McB. Miller JH (2005) Per-formance parameters, calculations and tests. In: Method valida-tion in pharmaceutical analysis. Wiley-VCH Verlag gmbH & Co. Kgaa, pp 21–194. doi:10.1002/3527604685.ch2


![$ISPN#PPL ] - HPLC · Indispensable in PAH trace analysis ... Thin Layer Chromatography Fast separations of a broad range of substances ... mised for example when carrying out enantiomeric](https://img.pdfslide.us/doc/110x75/5f676df75a1f082e080bdc4a/ispnppl-hplc-indispensable-in-pah-trace-analysis-thin-layer-chromatography.jpg)