Embed Size (px)
Citation preview

Multiple Environmental Controls on Cockroach Assemblage Structure in a TropicalRain Forest
Vitor D. Tarli1,2, Pedro A. C. L. Pequeno1,3, Elizabeth Franklin1,4,5, Jos�e W. de Morais1,4, Jorge L. P. Souza1,2, Adriano H. C.
Oliveira1,2, and Diego R. Guilherme1
1 Centro de Estudos Integrados da Biodiversidade Amazonica (CENBAM), CP 2223, CEP 69080–971, Manaus, AM, Brazil
2 Programa de P�os-Graduac�~ao em Entomologia, INPA, CP 2223, CEP 69080–971, Manaus, AM, Brazil
3 Programa de P�os-Graduac�~ao em Ecologia, INPA, CP 2223, CEP 69080–971, Manaus, AM, Brazil
4 Instituto Nacional de Pesquisas da Amazonia (INPA), Coordenac�~ao de Biodiversidade, CP 2223, CEP 69080–971, Manaus, AM, Brazil
ABSTRACT
Arthropod abundance and diversity are remarkable in tropical forests, but are also spatially patchy. This has been attributed either toresources, predators, abiotic conditions or disturbances, but whether such factors may simultaneously shape arthropod assemblage struc-ture is little known. We used cockroaches to test for multiple environmental controls on assemblage structure in 25 km2 of Amazonianforest. We performed nocturnal, direct searches for cockroaches in 30 plots (250 m 9 2 m) during two seasons, and gathered data onbiotic and abiotic factors from previous studies. Cockroach abundance increased with dry litter mass, a measure of resource amount,while species richness increased with litter phosphorus content, a measure of resource availability. Cockroach abundance and speciesrichness decreased with ant relative abundance. Cockroach species composition changed along the gradient of: (1) soil clay content,which correlates with a broad differentiation between flood-prone and non-flooded forest; (2) soil relative moisture, consistent withknown interspecific variation in desiccation tolerance; and (3) according to the abundance of ants, a potential predator. Turnover in spe-cies composition was correlated with abiotic conditions—sorting species according to physiological requirements and to disturbance-related life history traits—and to ants’ selective pressure. Cockroach abundance, diversity, and composition seem to be controlled by dis-tinct sets of environmental factors, but predators which were represented by ants, emerged as a common factor underlying cockroachdistribution. Such patterns of community structure may have been previously overlooked by undue focus on single or a few factors, andmay be common to tropical forest arthropods.
Abstract in Portuguese is available in the online version of this article.
Key words: bottom-up limitation; competition; distribution; environmental filter; top-down limitation.
ARTHROPODS ARE DOMINANT ORGANISMS IN TERRESTRIAL ECOSYS-
TEMS. This is particularly evident in tropical forests, where theycan encompass more than half of the total animal biomass (Fit-tkau & Klinge 1973) and reach over 18,000 species/ha (Bassetet al. 2012). However, this remarkable component of biodiver-sity is not homogeneously distributed in space. Attempts toexplain variation among arthropod communities in tropical for-ests have focused on several factors individually. Some studieshave found arthropod (or a subset of arthropods) abundanceand diversity to be limited by resources such as habitat spaceand nutrient availability (Kaspari 1996, McGlynn et al. 2007,2009, Kaspari & Yanoviak 2009, Sayer et al. 2010), both possi-bly promoted by floristic diversity (Basset et al. 2012), whileothers have provided evidence for limitation by predators (Dial& Roughgarden 1995, Kalka et al. 2008). In parallel, abiotic fac-tors such as substrate moisture (Levings & Windsor 1984) andnatural disturbances (e.g., floods; Mertl et al. 2009) have also
been found to play a role in the arthropod assemblage struc-ture. Thus, multiple factors may simultaneously shape arthropoddistribution in tropical forests, but their relative contributionsare not well resolved. For instance, while there is evidence thatfood availability and predation pressure can jointly shape abun-dance (Richards & Coley 2007, Bennett 2010) and that differ-ent mechanisms can underlie different components ofassemblages (e.g., Sayer et al. 2010), the prevalence or generalityof such patterns is not clear.
Cockroaches (Blattaria, except termites) comprise a diverseclade of detritivore-herbivore insects that account for a meaning-ful share of the arthropod biomass in some natural environments(Collins 1980, Basset 2001, Ellwood & Foster 2004) andcan have large impacts on nutrient cycling and energy fluxes (e.g.,Irmler & Furch 1979). In some ecosystems, termites—a lineageof eusocial cockroaches which are major detritivores in thetropics—may even be replaced by other blattarians as the mainagents of organic matter turnover (Bell et al. 2007), and somecockroaches are also important pollinators (Nagamitsu & Inoue1997, Momose et al. 1998). However, cockroaches have been
Received 20 December 2013; revision accepted 7 May 2014.5Corresponding author; e-mail: [email protected]
ª 2014 The Association for Tropical Biology and Conservation 1
BIOTROPICA 0(0): 1–10 2014 10.1111/btp.12138
largely studied from the perspective of pests of human dwellingsor as model organisms in physiology and behavior (Bell et al.2007). Consequently, quantitative data on their ecology under nat-ural conditions is limited (Grandcolas & Pellens 2012). Cock-roach abundance and diversity is highest in the tropics (Bell et al.2007), but little is known about the factors structuring tropicalcockroach assemblages (e.g., Schal & Bell 1986, Boyer & Rivault2006).
Cockroaches occur from the horizontal compartments ofthe soil to the vertical strata and canopy of standing trees (Sin-clair et al. 2001, Bell et al. 2007). Tropical rain forest landscapesin turn feature significant variation in topographic, soil, and vege-tation properties (Castilho et al. 2006), which may create habitatheterogeneity affecting cockroach abundance, species richness,and composition. For instance, in a hand sorting survey of littermacrofauna undertaken in 72 9 250 m long plots in an Amazo-nian rain forest, it was found that cockroaches were found in 68percent of the plots, and that their density ranged from 0 to 0.6adult individuals m�2 (Morais J. W. & Franklin E., unpubl. data),suggesting considerable patchiness in their distribution.
As cryptic animals with a detritivore-herbivore diet, cock-roaches can use plant substrates—either live or dead tissues—asboth refuge and food. Accordingly, there is evidence that bothcockroach species richness and abundance are related to litterdepth (Abenserg-Traun et al. 1996). Moreover, recent studies sug-gest that tropical rain forest arthropods can be limited by specificelements, particularly phosphorus, which plays a key role in anab-olism and whose availability is generally low and patchy in tropi-cal landscapes (McGlynn et al. 2007, Kaspari & Yanoviak 2008,2009). At the same time, predation may also contribute to distri-bution patterns, as cockroaches are prey of numerous animals,especially ants (Schal et al. 1984, Grandcolas & Pellens 2012),and there is evidence that the latter may limit cockroach densities(Otis et al. 1986).
Beyond resources and predators, many tropical forest land-scapes feature a dense drainage system where clayish plateausand sandy bottomlands alternate, with the latter being prone towaterlogging during the rainiest months (e.g., Hodnett et al. 1997).Species whose life histories are not adapted to the seasonal dis-turbance may be excluded from seasonally inundated forests(Adis & Junk 2002). Furthermore, cuticular permeability variesalmost fourfold among cockroach species (Appel et al. 1983), sothat the natural moisture gradients of tropical forests (e.g., Kas-pari & Weiser 2000) are likely to influence their distribution (Bo-yer & Rivault 2006). These potential effects are not mutuallyexclusive, rather, their different combinations represent alternativehypotheses that may account for variation in cockroach assem-blage structure across tropical landscapes.
In this study, we investigate multiple environmental controlson the cockroach assemblage structure across an old growth,tropical rain forest landscape (25 km2) in Amazonia. Specifically,we expected cockroach species richness and abundance toincrease with putative resources (i.e., tree biomass, tree speciesrichness, dry litter mass, and litter phosphorus content) and soilmoisture, and to decrease with predation pressure (i.e., relative
abundance of ants, a generalist predator) and on clay-poor, flood-prone soils. We further hypothesized that cockroach species com-position would change along both biotic (resources and preda-tors) and abiotic gradients (soil relative moisture and claycontent), assuming that species differ both in their performancesin biotic interactions (e.g., competition and predation) and in theirphysiological and life cycle requirements. To our knowledge, thisis the first assessment of factors underlying cockroach distribu-tion across a tropical rain forest landscape in the Amazon.
METHODS
STUDY SITE.—The Reserva Ducke has topographic and edaphicvariation typical of many areas in the Amazon Basin and has atotal area of 10,000 hectares situated northwest of Manaus, at km26 on the AM-010 highway (2°570S, 59°560W). Disturbance isminimal in the reserve because anthropic-disturbed areas aresmall and located at the edges of the forest, around the head-quarters and access roads. It is a moderately rugged terrain (ele-vation 30–180 m asl). Soils are acidic and very low in nutrientssuch as P, Ca, and K. They are classified as Xanthic Hapludox(‘Latossolo Amarelo’ in the Brazilian system) on plateaus, TypicEpiaquods (‘Espodossolo C�arbico’ in the Brazilian system) on slopes,and Typic Endoaquods (‘Espodossolo Ferroc�arbico’ in the Braziliansystem) associated with small streams in valleys (Chauvel et al.1987, Bravard & Righi 1989).
The vegetation is ombrophilous dense forest with a closedcanopy, and the undergrowth is characterized by abundant stem-less palms, such as Astrocaryum spp. and Attalea spp. (Chauvelet al. 1987, Guillaumet 1987). There are approximately 1200 spe-cies of trees (Costa et al. 2009) with a canopy height of 30–37 m,some reaching 40–45 m. The mean annual temperature and rain-fall in 2010–2011 were 25°C and 2763 mm, respectively, with ashort, drier season between July and September (Coordination ofEnvironmental Dynamics, INPA).
SAMPLING DESIGN.—The study site contains a grid of six regularlyspaced north–south and six east–west trails. Each trail is 5 kmlong, forming a 5 km 9 5 km grid. The east–west trails havefive 250 m plots that follow terrain contours to minimize thevariation in soil features and their correlates within plots, thusmaximizing between-plot variation (RAPELD method, Magnus-son et al. 2005). The grid allows access to 30 uniformly distrib-uted sample plots, located 1 km apart along the trails (Table S1).The width of the plot is not fixed, but varies according to thebiological group being sampled (Costa & Magnusson 2010). Forcockroach sampling, each plot consists of a transect 250 mlong 9 2 m wide.
COCKROACH SAMPLING.—To increase the likelihood of samplingspecies occurring on a given plot, we sampled cockroaches duringtwo periods of 6 d in 30 plots at Reserva Ducke. The first periodwas between November and December 2010 (beginning of therainy season), and the second in May 2011 (end of the rainy sea-son). The best method to sample cockroaches is through direct
2 Tarli et al.

sampling during the first hours of the night (Grandcolas & Pel-lens 2012). Accordingly, two experienced collectors carried out anactive survey with 1 h of effort in each plot beginning at 1830 h.The same collectors sampled each plot in both periods, keeping adistance of 30 m between each other along the central axis of theplot, and inspecting 1 m to both sides. Disturbance in theenvironment was minimized to increase sampling efficiency. Totaleffort in both periods was 60 h. We manually collected adultcockroaches present on the litter, fallen trunks, branches, andshrubby vegetation, and placed them in a plastic container(mouth diameter 7.5 cm, 10 cm in depth) with the addition of akilling agent and preservative (50 mL of ethanol 75%). Wesampled cockroaches present on the leaves by placing the plasticcontainer below the leaf and, with the help of the lid placed onthe top of the leaf, the animal was pushed to the interior of thecontainer. On other surfaces, we used forceps to catch theanimals.
We identified adult cockroaches to species or sorted to mor-phospecies under the supervision of specialists from the NationalMuseum of Rio de Janeiro (MNRJ), in Rio de Janeiro City, Brazil.We also consulted the reference collection of the museum, anddeposited biological material in the Entomological Collection ofINPA, Manaus, Brazil, and MNRJ. The raw data are available atthe website of the Brazilian Program for Biodiversity Research(PPBio; Table S1).
ENVIRONMENTAL DATA.—Environmental data included soil claycontent, soil relative moisture, litter dry mass, litter phosphoruscontent, tree biomass and tree species richness (dbh >10 cmtrees), and ants. We obtained data for the independent variablesmeasured at the same 30 plots where we sampled the cock-roaches, as well as full descriptions of sampling methods fromprevious surveys made available by the website of the PPBio. Weconducted soil textural analyses and nutrient analyses accordingto the recommendations of EMBRAPA (1997).
To determine soil clay content (Table S1) and relative mois-ture, we sampled and combined six soil subsamples to a depth of5 cm and at least 50 m distant from each other for each plotand analyzed them at the Soil Laboratory of the AgronomyDepartment at INPA. Soil relative moisture consisted of the dif-ference between the wet weight and dry weight of the soil sam-ple, divided by the dry weight and multiplied by 100 (T.Pimentel, unpubl. data).
We obtained litter dry mass (Table S1) from each plot by col-lecting all the fine litter (leaves, fruits, and woody items with diam-eter <2 cm) in five quadrats (0.4 m 9 0.6 m) distant at least50 m from each other. Litter was dried at 65°C for 5 d and thenweighed to determine dry mass (mean value: 121.5 g; range: 59.2–231.5 g). Further, we grinded leaves and subjected them to nitric-perchloric digestion, each sample being subsequently diluted in50 mL distilled water. We determined litter phosphorus content(g/Kg) by colorimetry under a spectrophotometer, in the presenceof ammonium molybdate and ascorbic acid (mean value:0.23651 g/kg; range: 0.19008–0.30245 g/kg). Diameter at breastheight (dbh) >10 cm trees species composition was obtained from
Castilho et al. (2006) (personal contact for metadata). The mean ofeach plot was used in analyses for all soil and litter variables.
We obtained tree biomass, including palm trees (mean value:330.16 Mg/ha; range: 254.7–400 Mg/ha) from Castilho et al.(2006). We sampled trees with dbh ≥30 cm in 1 hectare(250 m 9 40 m), and trees at dbh of 10–30 cm and 1–10 cm in0.5 ha (250 m 9 20 m) and 0.1 ha (250 m 9 4 m), respectively.We counted and measured trees, and estimated total biomassusing published allometric equations (see Castilho et al. 2006).Plant species richness (mean value: 155.63 per plot; range: 118–192 per plot) is available on the PPBio website (Table S1).
We sampled ants between June and August 2012 in the same30 plots at Reserva Ducke (Oliveira 2013). Although we sampledant and cockroach data in different years, ant colonies are rela-tively long-lived and their assemblages generally stable at timescales of a few years (Andersen 2008). Thus, we considered thatboth datasets could still be reasonably compared. In each plot,we placed one pitfall trap (95 mm diameter; 8 cm depth; 500 mLvolume) every 25 m along the central axis of the plot, for a totalof 10 traps. We buried pitfall traps so as to place their top atground level, then partially filled them with a killing and preserva-tive solution (100 mL of 70% ethanol and a drop of odorlessdetergent), covered them to exclude rain and leaves, and left themon the ground for 48 h. For each plot, we counted the numberof traps (0–10) in which each ant species occurred, a reasonablemeasure of ant species relative abundance (King 2010). Speciescounts were summed by plot to estimate overall ant relativeabundance per plot. A full reference collection of this materialwas deposited in INPA’s Entomological Collection.
DATA ANALYSIS.—We used Chao’s abundance-based estimator ofspecies richness (Colwell et al. 2012) to infer the total number ofcockroach species (including unobserved ones) for each plot.Sampling plots were ordinated as a function of cockroach speciescomposition using Principal Coordinate Analysis (PCoA) appliedto Sørensen’s pairwise dissimilarities among plots (Legendre &Legendre 2012). The first and the second PCoA axes preserved23 and 18.5 percent of the variance of the original dissimilarities,with <5 percent of this variance preserved from the third axisonwards, and were used to represent the main gradients in cock-roach species turnover across the landscape.
Each possible combination of predictors was treated as analternative hypothesis on the factors underlying (1) cockroachabundance (total count of individuals per plot); (2) estimated spe-cies richness; and (3) species composition (scores of first and sec-ond PCoA axes). The seven environmental variables potentiallyinfluencing the three cockroach-dependent variables were com-bined into alternative regression models, with a maximum of threepredictors (one for each 10 observations) to preserve a reasonablenumber of degrees of freedom per model (Gotelli & Ellison2004). We first included tree biomass with the other five environ-mental variables, and then we substituted it for tree richness withthe same variables, to see if plant diversity would underlie thediversity of cockroaches. For each dependent variable, themost supported set of predictors was inferred using Akaike’s
Environmental Controls on Tropical Cockroaches 3

information criterion corrected for sample size (AICc), with themodel with the lowest AICc being favored (Burnham & Anderson2002). We also computed the Akaike weight w (i.e., the probabilityof a model being the most supported one under a given modelset) as a measure of the relative support for each model. The ana-lyses were undertaken with R software (R Development CoreTeam. 2013).
RESULTS
A total of 1004 individuals were sorted to 41 species and/ormorphospecies in three families (Table S2). Of these, 11 specieswere nominally identified and 30 remained as morphospecies.The number of species observed per plot varied between 5 and15, while estimated species richness varied from 5 to 70. Thenumber of individuals sampled per plot varied between 13 and65. Ectobiidae showed the highest number of species (31) repre-senting 78 percent of the number of species collected, followedby Blaberidae and Corydiidae with nine and only one species,respectively. The most abundant family was Ecotobiidae with 853individuals, followed by Blaberidade and Corydiidae, with 150and six individuals, respectively. Xestoblatta vera and Neoblattellapoecilops were the most abundant, representing 29 and 19.6
percent of all sampled individuals, respectively. Nine and five spe-cies had only one and two individuals collected, respectively. TheChao abundance-based estimator indicated a total of almost 50species, suggesting that the sampling captured most of the speciescollectable with this technique.
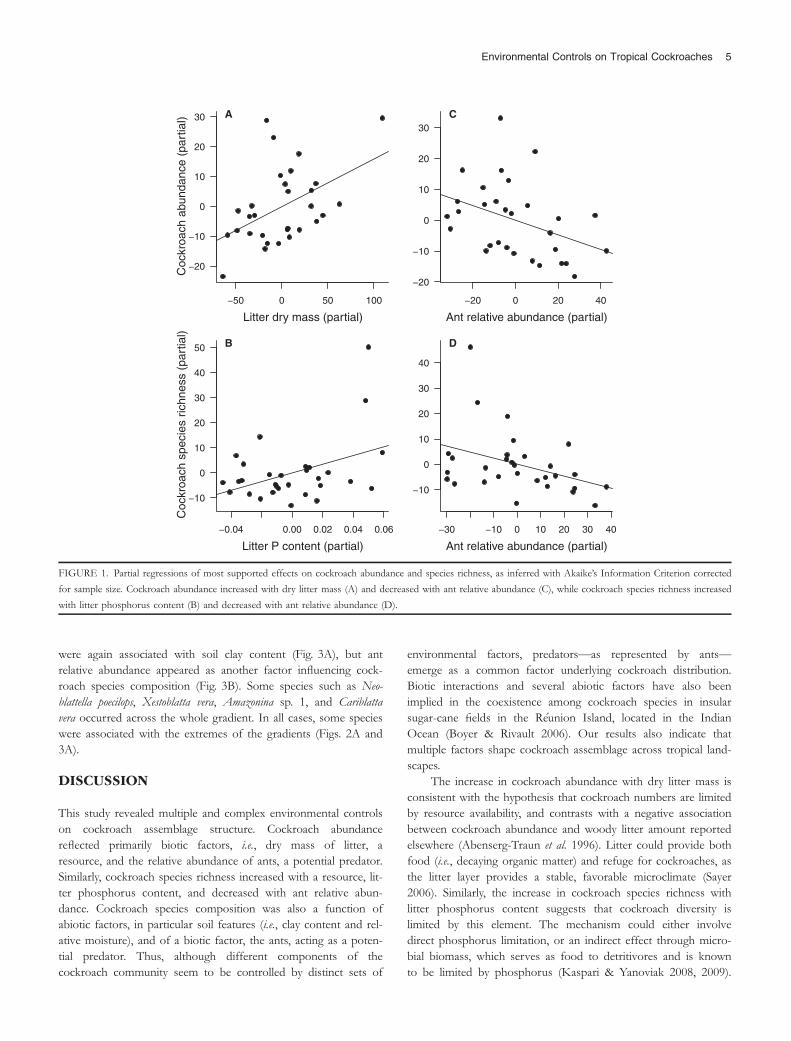
The variation in cockroach abundance across the rain for-est landscape was best explained by a model including dry littermass and ant relative abundance (Table 1; Table S3). Partialregressions indicated that cockroaches achieved higher abun-dance with increasing dry litter mass, but lower abundance withincreasing ant relative abundance (Figs. 1A and C). Likewise,the most supported model accounting for variation in cock-roach species richness included litter phosphorus content andant relative abundance (Table 1). Cockroach species richnessincreased with the amount of phosphorus in the litter, butdecreased with increasing ant relative abundance (Figs. 1B andD).
Cockroach species composition, as summarized by the firstPCoA axis, showed a pattern of turnover across plots (Table 1;Fig. 2A). Changes in species composition were mainly associatedwith soil clay content and relative moisture (Figs. 2B and C). Thesecond PCoA axis also showed a pattern of turnover across plots(Table 2; Table S4; Fig. 3A). Changes in species composition
TABLE 1. Evaluation of competing models on the response of cockroach abundance, species richness and species composition to environmental features (soil clay content, soil moisture, litter
dry mass, litter phosphorus content, tree biomass and ant relative abundance) in an Amazonian rain forest. Models are ranked in increasing order by their respective values of
the Akaike Information Criterion corrected for sample size (AICc). Parameter estimates are given for the five best models for each response variable; for the remaining models,
see Table S1 in Supporting Information
Response variable Intercept
Soil clay
content (%)
Ant relative
abundance
Litter
phosphorus
content (g/kg)
Dry litter
mass (g)
Soil
moisture (%)
Tree
biomass
(Mg/ha) R2 AICc DAICc w
Cockroach
abundance
28.465 �0.239 0.16 0.337 238.664 0 0.209
0.954 0.173 0.276 0.318 239.524 0.86 0.136
17.237 �0.169 0.165 0.155 0.358 240.59 1.926 0.08
12.907 0.169 0.218 240.946 2.281 0.067
41.519 �0.223 �54.2 0.15 0.349 240.986 2.322 0.065
Cockroach
richness
�9.685 �0.238 175 0.23 240.178 0 0.174
�21.912 �0.235 194.2 0.062 0.26 241.865 1.688 0.075
�15.989 141 0.105 241.998 1.821 0.07
�0.38 �0.06 �0.256 151.9 0.256 242.024 1.846 0.069
2.386 �0.291 160.3 �0.13 0.245 242.469 2.292 0.055
Cockroach
composition
(First PCoA
axis)
0.067 0.007 �0.009 0.676 �22.871 0 0.43
0.235 0.007 �0.002 �0.01 0.69 �21.28 1.591 0.194
0 0.007 0.001 �0.009 0.682 �20.568 2.303 0.136
0.23 0.007 �0.63 �0.009 0.681 �20.421 2.45 0.126
�0.042 0.007 �0.009 0 0.677 �20.134 2.737 0.109
Cockroach
composition
(Second PCoA
axis)
�0.372 0.002 0.005 0.223 �2.787 0 0.157
0.13 0.003 �0.007 0.2 �1.924 0.863 0.102
�0.223 0.004 0.104 �1.19 1.597 0.071
�0.167 0.003 0.003 �0.004 0.254 �1.106 1.681 0.068
�0.266 0.002 0.004 �0 0.243 �0.645 2.142 0.054
R2 = explained variance; DAICc = difference between each model’s AICc and the minimum AICc found; w = Akaike weight.
4 Tarli et al.
were again associated with soil clay content (Fig. 3A), but antrelative abundance appeared as another factor influencing cock-roach species composition (Fig. 3B). Some species such as Neo-blattella poecilops, Xestoblatta vera, Amazonina sp. 1, and Cariblattavera occurred across the whole gradient. In all cases, some specieswere associated with the extremes of the gradients (Figs. 2A and3A).
DISCUSSION
This study revealed multiple and complex environmental controlson cockroach assemblage structure. Cockroach abundancereflected primarily biotic factors, i.e., dry mass of litter, aresource, and the relative abundance of ants, a potential predator.Similarly, cockroach species richness increased with a resource, lit-ter phosphorus content, and decreased with ant relative abun-dance. Cockroach species composition was also a function ofabiotic factors, in particular soil features (i.e., clay content and rel-ative moisture), and of a biotic factor, the ants, acting as a poten-tial predator. Thus, although different components of thecockroach community seem to be controlled by distinct sets of
environmental factors, predators—as represented by ants—emerge as a common factor underlying cockroach distribution.Biotic interactions and several abiotic factors have also beenimplied in the coexistence among cockroach species in insularsugar-cane fields in the R�eunion Island, located in the IndianOcean (Boyer & Rivault 2006). Our results also indicate thatmultiple factors shape cockroach assemblage across tropical land-scapes.
The increase in cockroach abundance with dry litter mass isconsistent with the hypothesis that cockroach numbers are limitedby resource availability, and contrasts with a negative associationbetween cockroach abundance and woody litter amount reportedelsewhere (Abenserg-Traun et al. 1996). Litter could provide bothfood (i.e., decaying organic matter) and refuge for cockroaches, asthe litter layer provides a stable, favorable microclimate (Sayer2006). Similarly, the increase in cockroach species richness withlitter phosphorus content suggests that cockroach diversity islimited by this element. The mechanism could either involvedirect phosphorus limitation, or an indirect effect through micro-bial biomass, which serves as food to detritivores and is knownto be limited by phosphorus (Kaspari & Yanoviak 2008, 2009).
−50 0 50 100
−20
−10
0
10
20
30
Litter dry mass (partial)
A
−20 0 20 40
−20
−10
0
10
20
30
Ant relative abundance (partial)
C
Coc
kroa
ch a
bund
ance
(pa
rtia
l)
−0.04 0.00 0.02 0.04 0.06
−10
0
10
20
30
40
50
Litter P content (partial)
B
−30 −10 0 10 20 30 40
−10
0
10
20
30
40
D
Ant relative abundance (partial)
Coc
kroa
ch s
peci
es r
ichn
ess
(par
tial)
FIGURE 1. Partial regressions of most supported effects on cockroach abundance and species richness, as inferred with Akaike’s Information Criterion corrected
for sample size. Cockroach abundance increased with dry litter mass (A) and decreased with ant relative abundance (C), while cockroach species richness increased
with litter phosphorus content (B) and decreased with ant relative abundance (D).
Environmental Controls on Tropical Cockroaches 5

Regardless, in plots with low phosphorus content, competition islikely to be more intense, and species more efficient in exploitingthis resource may have an advantage over (and potentiallyexclude) others. Jacquemin et al. (2012) showed that experimentalfertilization with phosphorus enhanced litter decomposition andreduced litter amount, decreasing the abundance of ants. Theyalso detected the opposite or no effect on the rest of the inverte-brates, including cockroaches. Thus, the increasing of the mesofa-una density (i.e., springtails and mites) represented a higher preyavailability for predators. One may suppose that if phosphorusincreases decomposition rate and a lower amount of litter reducesthe abundance of ants, then the positive effect of phosphorus onthe cockroach species richness could be indirect and reflecting theexclusion of predators (ants). However, we included ants togetherwith phosphorus in the models and the effects of both weredetected, meaning that both effects are independent. Probably theeffect of phosphorus has nothing to do with ants, but with nutri-ent availability. Thus, phosphorus availability may promote thecoexistence of cockroach species in the studied rain forest. Highphosphorus environments have been found to promote the abun-dance of litter detritivores in tropical forests elsewhere (McGlynn
et al. 2007, 2009, Kaspari & Yanoviak 2009), but we found nosuch pattern with respect to cockroach abundance.
The decline of both cockroach abundance and species rich-ness with ant relative abundance could be either due to directpredation by ants or active avoidance of ant-rich sites by cock-roaches, perhaps by means of chemical recognition. Cockroachesinhabiting the ground litter exhibit reaction to ants, especiallyarmy ants, which attack all species, except those showing thanato-sis (Grandcolas & Deleporte 1994, Grandcolas & Pellens 2012).Thus, some species may be more prone to predation than others.Overall, our results suggest that cockroach abundance and spe-cies richness are simultaneously under ‘bottom-up’ (i.e., resources)and ‘top-down’ control (i.e., predators) across the studied land-scape. This contradicts previous suggestions that the detritivorefauna would be mainly limited by resource availability (e.g., Chen& Wise 1999, Ponsard et al. 2000, Dyer & Letourneau 2003,McGlynn et al. 2007, Kaspari & Yanoviak 2009). Rather, ourresults are more consistent with a scenario in which resources setcarrying capacity, while predators harvest populations to a levelbelow that (McIntosh et al. 2005, Boyer & Rivault 2006, Richards& Coley 2007).
Neoblattella sp.2Euphyllodromia sp.Nyctibora sp.Anaplecta sp.2Euphyllodromia tupiAmazonina sp.2Epilampra sp.4Epilampra sp.6Lanxoblatta emarginataEpilampra sodalisDendroblatta sp.1Gen. n. sp. n.Melestora symetricaDasyblatta sp.2Ischnoptera sp.2Dendroblatta moratoiAudreia sp.Amazonina sp.1Xestoblatta veraChorisoneura sp.Galiblatta williamsiNeoblattella poecilopsCariblatta sp.2Euphyllodromia variegataIschnoptera sp.1Epilampra sp.2Epilampra sp.1Cariblatta veraXestoblatta gracilisEpilampra sp.3Riatia sp.Chromatonotus sp.1Epilampra sp.5Cariblatta sp.1Dasyblatta sp.1Neoblattella sp.3Dendroblatta sp.2Neoblattella sp.1 Anaplecta sp.1Euphyllodromia amazonensisAnaplecta sp.3
Spe
cies
occ
urre
nce
First PCoA axis
A
−60 −40 −20 0 20
−0.4
−0.2
0.0
0.2
B
Soil clay content (partial)
−20 −10 0 10 20 30
−0.3
−0.2
−0.1
0.0
0.1
0.2
0.3
C
Relative soil moisture (partial)
Firs
t PC
oA a
xis
(par
tial)
FIGURE 2. Partial regressions of most supported effects on cockroach species composition, as inferred with Akaike’s Information Criterion corrected for sample
size. Plots were ordinated according to species composition as summarized by the first Principal Coordinate (first PCoA axis) based on Sørensen’s dissimilarities,
with scores increasing from left to right (A). Cockroach species composition changed with soil clay content (B) and soil relative moisture (C).
6 Tarli et al.

We found that cockroach species turnover was driven bytwo soil features, namely relative soil moisture and soil claycontent. The influence of soil moisture on species compositionis consistent with the fourfold variation in cuticular permeabil-ity among cockroach species (Appel et al. 1983), although thisvariable was not measured in our study. Nonetheless, this widevariation should filter cockroach species according to desicca-tion tolerance. On the other hand, we also detected the rela-tion between cockroach species composition with claypercentage and ants. The relation with clay percentage suggestsa broad differentiation between assemblages subject to a moredynamic or disturbed environment (the valleys, which are moreprone to seasonal inundation and where the mineral fractionof soil is almost pure sand) and assemblages inhabiting a morestable environment (plateaus, with more clay-rich soil).Although soil texture could directly influence cockroach specieswith fossorial habits (Bell et al. 2007), none of the species wecollected are known to be fossorial. Thus, we hypothesize thatthe species turnover observed along the soil clay gradientresulted from species being filtered according to their life histo-ries, with species inhabiting clay-poor, seasonally waterloggedplots more likely to display traits relevant to enduring seasonaldisturbance (e.g., seasonal phenology, vertical migration ability,
or submersion tolerance). Interestingly, soil clay percentage hasalso been shown to affect the distribution of most other taxainvestigated in the Amazon Basin, including palms (Costa et al.2009), ants (Oliveira et al. 2009), and edaphic oribatid mites(Moraes et al. 2011). The results also showed that the ants cancollectively exert pressure on cockroaches along the studiedlandscape. Predator presence has varying effects on the prey,and can influence prey population dynamics, reflecting bothdirect effects of predation and indirect effects of predatoravoidance and other changes in prey behavior (Richards & Co-ley 2007, Creel & Christianson 2008). We suggest that localcockroach populations are primarily limited by litter amountand potential predators, with successfully established species,then being assembled according to their competitive abilitiesregarding phosphorus availability and their predation suscepti-bilities. Interestingly, this pattern mirrors that reported by Sayeret al. (2010), who found that overall arthropod abundanceincreased with forest floor mass, while arthropod diversityincreased with soil phosphorus.
Our hypothesis that tree biomass and/or tree richness wouldinfluence the cockroach distribution (e.g., by providing food orhabitat) was not supported. This contrasts with the finding thatcockroach occurrence was more likely as the percent cover of the
TABLE 2. Evaluation of competing models on the response of cockroach abundance, species richness, and species composition to environmental features (soil clay content, soil moisture, litter
dry mass, litter phosphorus content, tree richness, and ant relative abundance) in an Amazonian rain forest. Models are ranked in increasing order by their respective values
of the Akaike Information Criterion corrected for sample size (AICc). Parameter estimates are given for the five best models for each response variable; for the remaining
models, see Table S1 in Supporting Information.
Response variable Intercept
Soil clay
content (%)
Soil
moisture (%)
Dry litter
mass (g)
Litter
phosphorus
content (g/kg)
Tree
richness
Ant relative
abundance R2 AICc DAICc w
Cockroach
abundance
28.465 0.16 �0.239 0.337 238.664 0 0.206
0.954 0.276 0.173 0.318 239.524 0.86 0.134
17.237 0.155 0.165 �0.169 0.358 240.59 1.926 0.078
12.907 0.169 0.218 240.946 2.281 0.066
41.519 0.15 �54.209 �0.223 0.349 240.986 2.322 0.064
Cockroach
richness
�9.685 175.039 �0.238 0.23 240.178 0 0.173
�21.912 0.062 194.164 �0.235 0.26 241.865 1.688 0.074
�15.989 140.964 0.105 241.998 1.821 0.07
�0.38 �0.063 151.877 �0.256 0.256 242.024 1.846 0.069
2.386 �0.13 160.348 �0.291 0.245 242.469 2.292 0.055
Cockroach
composition
(First PCoA axis)
0.067 0.007 �0.009 0.676 �22.871 0 0.419
0.235 0.007 �0.01 �0.002 0.69 �21.28 1.591 0.189
0 0.007 �0.009 0.001 0.682 �20.568 2.303 0.132
�0.124 0.006 �0.008 0.001 0.682 �20.528 2.342 0.13
0.23 0.007 �0.009 �0.626 0.681 �20.421 2.45 0.123
Cockroach
composition
(Second PCoA axis)
�0.372 0.002 0.005 0.223 �2.787 0 0.146
0.13 0.003 �0.007 0.2 �1.924 0.863 0.095
�0.223 0.004 0.104 �1.19 1.597 0.066
�0.167 0.003 �0.004 0.003 0.254 �1.106 1.681 0.063
�0.266 0.002 �0 0.004 0.243 �0.645 2.142 0.05
R2, explained variance; DAICc, difference between each model’s AICc and the minimum AICc found; w, Akaike weight.
Environmental Controls on Tropical Cockroaches 7

most common tree species increased in alpine vegetation (Sinclairet al. 2001). However, cockroaches may inhabit a certain substrateduring the day and forage at night in another (Grandcolas &Pellens 2012), possibly in response to predation risk (Schal et al.1984). This might explain why any effect of tree biomass orrichness, if it exists, could not be detected.
This study revealed a complex picture of how cockroachassemblages are structured across a tropical rain forest landscapein the Amazon. Earlier studies shed light on factors shapingcockroach assemblages at smaller spatial extents in primary tropi-cal rain forest (e.g., Schal & Bell 1986). Here, we provided evi-dence that biotic interactions—in particular, competition forresources and predation—set how many individuals and speciescan coexist locally. Abiotic filters appear to sort species accordingto desiccation tolerance and, possibly, to life history traits thatpromote persistence under seasonal disturbance. We also foundevidence that collectively ants can have selective pressure oncockroaches. These ideas could be tested experimentally by mea-suring relevant traits in representative species whose distributionpatterns are known. More generally, we suggest that future
studies take into account multiple, alternative mechanisms thatmay affect tropical arthropod assemblages to gain explanatoryand predictive power.
ACKNOWLEDGMENTS
We thank Dr. Sonia Maria Lopes Fraga and Edivar Heeren deOliveira, both from the National Museum of Rio de Janeiro,for their assistance in cockroach identification, and Dr. WilliamE. Magnusson for his fruitful contribution. We are also grate-ful to MSc. Tania Pena Pimentel (INPA) for providing dataon soil relative moisture. This study was supported by theBrazilian Program for Biodiversity Research (PPBio), the Cen-ter for Integrated Studies of Amazonian Biodiversity (CEN-BAM), and the Long Term Ecological Project—AnthropicImpacts on the Amazon Forest (PELD, IAFA). J. L. P. S wassupported by a CNPq post-doctoral scholarship, and A. H. C.O, P. A. C. L. P. and D. R. G. were supported by CAPESand CNPq scholarships. Data are maintained by PPBio andCENBAM.
Dendroblatta sp.1Anaplecta sp.2Epilampra sodalisEpilampra sp.4Neoblattella sp.2Euphyllodromia sp.Nyctibora sp.Amazonina sp.2Chorisoneura sp.Ischnoptera sp.2Dendroblatta moratoiEpilampra sp.2Epilampra sp.3Chromatonotus sp.1Anaplecta sp.3Epilampra sp.6Dasyblatta sp.1Cariblatta sp.2Xestoblatta gracilisEuphyllodromia variegataCariblatta sp.1Cariblatta veraEuphyllodromia amazonensisDasyblatta sp.2Riatia sp.Neoblattella poecilopsXestoblatta veraAnaplecta sp.1Epilampra sp.1Ischnoptera sp.1Amazonina sp.1Neoblattella sp.1 Gen. n. sp. n.Neoblattella sp.3Dendroblatta sp.2Euphyllodromia tupiAudreia sp.Melestora symetricaGaliblatta williamsiEpilampra sp.5Lanxoblatta emarginata
Spe
cies
occ
urre
nce
Second PCoA axis
A
−40 −20 0 20 40
−0.4
−0.2
0.0
0.2
0.4B
Soil clay content (partial)
−40 −20 0 20 40
−0.2
0.0
0.2
0.4
0.6C
Ant relative abundance (partial)
Sec
ond
PC
oA a
xis
(par
tial)
FIGURE 3. Partial regressions of most supported effects on cockroach species composition, as inferred with Akaike’s Information Criterion corrected for
sample size. Plots were ordinated according to species composition as summarized by the second Principal Coordinate (second PCoA axis) based on
Sørensen’s dissimilarities, with scores increasing from left to right (A). Cockroach species composition changed with soil clay content (B) and ant relative
abundance (C).
8 Tarli et al.

SUPPORTING INFORMATION
Additional Supporting Information may be found in the onlineversion of this article:
TABLE S1. Data deposited in the digital repository of the BrazilianBiodiversity Research Program.TABLE S2. Diversity, abundance, and frequency of cockroaches recorded
in 30 plots in the tropical forest in Reserva Ducke.TABLE S3. Evaluation of competing models on the response of cock-
roach abundance, species richness, and species composition to environmentalfeatures in an Amazonian rain forest.TABLE S4. Evaluation of competing models on the response of cock-
roach abundance, species richness, and species composition to environmentalfeatures in an Amazonian rain forest.
LITERATURE CITED
ABENSERG-TRAUN, M., G. W. ARNOLD, D. E. STEVEN, G. T. SMITH, L. ATKINS,J. J. VIVEEN, AND M. GUTTER. 1996. Biodiversity indicators in semi-arid, agricultural Western Australia. Pac. Conserv. Biol. 2: 375–389.
ADIS, J., AND W. J. JUNK. 2002. Terrestrial invertebrates inhabiting lowlandriver floodplains of Central Amazonia and Central Europe: A review.Freshw. Biol. 47: 711–731.
ANDERSEN, A. N. 2008. Not enough niches: Non-equilibrial processes promot-ing species coexistence in diverse ant communities. Austral Ecol. 33:211–220.
APPEL, A. G., D. A. REIERSON, AND M. K. RUST. 1983. Comparative waterrelations and temperature sensitivity of cockroaches. Comp. Biochem.Physiol. A Physiol. 74: 357–361.
BASSET, Y. 2001. Invertebrates in the canopy of tropical rain forests: Howmuch do we really know? Plant Ecol. 153: 87–107.
BASSET, Y., L. CIZEK, P. CU�ENOUD, R. K. DIDHAM, F. GUILHAUMON, O. MISSA,V. NOVOTNY, F. ØDEGAARD, T. ROSLIN, J. SCHMIDL, A. K. TISHECHKIN,N. N. WINCHESTER, D. W. ROUBIK, H.-P. ABERLENC, J. BAIL, H. BARRI-
OS, J. R. BRIDLE, G. CASTA~NO-MENESES, B. CORBARA, G. CURLETTI, W.D. da ROCHA, D. De BAKKER, J. H. C. DELABIE, A. DEJEAN, L. L. FA-GAN, A. FLOREN, R. L. KITCHING, M. MEDIANERO, S. E. MILLER, E. G.de OLIVEIRA, J. ORIVEL, M. POLLET, M. RAPP, S. P. RIBEIRO, Y. ROISIN,J. B. SCHMIDT, L. SØRENSEN, AND M. LEPONCE. 2012. Arthropod diver-sity in a tropical forest. Science 338: 1481–1484.
BELL, W. J., L. M. ROTH, AND C. A. NALEPA. 2007. Cockroaches: Ecology,behavior, and natural history. The Johns Hopkins University Press,Baltimore, MD.
BENNETT, A. 2010. The role of soil community biodiversity in insect biodiver-sity. Insect Conserv. Divers. 3: 157–171.
BOYER, S., AND C. RIVAULT. 2006. Habitat selection and coexistence of cock-roach species (Dictyoptera) in sugar-cane fields on R�eunion Island.Acta Oecol. 29: 16–26.
BRAVARD, S., AND D. RIGHI. 1989. Geochemical differences in an Oxisol-Spod-osol toposequence of Amazonia, Brazil. Geoderma 44: 29–42.
BURNHAM, K. P., AND D. R. ANDERSON. 2002. Model selection and multimodelinference: A practical information-theoretic approach. Springer, Berlin.
CASTILHO, C. V., W. E. MAGNUSSON, R. N. O. ARAUJO, R. C. C. LUIZ~AO, F.J. LUIZ~AO, A. P. LIMA, AND N. HIGUCHI. 2006. Variation in above-ground tree life biomass in a central Amazonian forest: Effects ofsoil and topography. For. Ecol. Manage. 234: 85–96.
CHAUVEL, A., Y. LUCAS, AND R. BOULET. 1987. On genesis of the mantle of theregion of Manaus, Central Amazonia, Brazil. Experientia 43: 234–241.
CHEN, B., AND D. H. WISE. 1999. Bottom-up limitation of predaceousarthropods in a detritus-based terrestrial food web. Ecology 80: 761–772.
COLLINS, N. M. 1980. The distribution of soil macrofauna on the west ridgeof Gunung (Mount) Mulu, Sarawak. Oecologia 44: 263–275.
COLWELL, R. K., A. CHAO, N. GOTELLI, L. SHANG-YI, C. X. MAO, R. L. CHAZ-
DON, AND J. T. LONGINO. 2012. Models and estimators linking individ-ual-based and sample-based rarefaction, extrapolation and comparisonof assemblage. J. Plant. Ecol. 5: 3–21.
COSTA, F. R. C., J. L. GUILLAUMET, A. P. LIMA, AND O. S. PEREIRA. 2009. Gra-dients within gradients: The mesoscale distribution patterns of palmsin a central Amazonian forest. J. Veg. Sci. 20: 69–78.
COSTA, F. R. C., AND W. E. MAGNUSSON. 2010. The need for large-scale, inte-grated studies of biodiversity: The experience of the Program for Bio-diversity Research in Brazilian Amazon. Nat. Conservac�~ao 8: 3–12.
CREEL, S., AND D. CHRISTIANSON. 2008. Relationships between direct predationand risk effects. Trends Ecol. Evol. 23: 194–201.
DIAL, R., AND J. ROUGHGARDEN. 1995. Experimental removal of insectivoresfrom rain forest canopy: Direct and indirect effects. Ecology 76:1821–1834.
DYER, L. A., AND D. LETOURNEAU. 2003. Top-down and bottom-up diversitycascades in detrital vs. living food webs. Ecol. Lett. 6: 60–68.
ELLWOOD, M. D. F., AND W. A. FOSTER. 2004. Doubling the estimate of inver-tebrate biomass in a rainforest canopy. Nature 429: 549–551.
EMBRAPA. Centro Nacional de Pesquisa de Solos. 1997. Manual de m�etodosde an�alise de solo. 2ª ed. Rio de Janeiro, RJ. (EMBRAPA – CNPS,Documentos 1), p. 212. Available on: http://www.agencia.cnptia.emb-rapa.br/Repositorio/Manual+de+Meto-dos_000fzvhotqk02wx5ok0q43a0ram31wtr.pdf.
FITTKAU, E. J., AND H. KLINGE. 1973. On biomass and trophic structure ofthe central Amazonian rain forest ecosystem. Biotropica 5: 2–14.
GOTELLI, N. J., AND A. M. ELLISON. 2004. A primer of ecological statistics. Si-nauer, Sunderland, MA.
GRANDCOLAS, P., AND P. DELEPORTE. 1994. Escape from predation by armyants in Lanxoblatta cockroach larvae (Insecta, Blattaria, Zetoborinae).Biotropica 26: 469–472.
GRANDCOLAS, P., AND R. PELLENS. 2012. Blattaria. In J. A. Rafael, G. A. R.Melo, C. J. B. Carvalho, A. S. Casari, and R. Constantino (Eds.). Inse-tos do Brasil, pp. 333–346. Editora Holos, Ribeir~ao Preto.
GUILLAUMET, J. L. 1987. Some structural and floristic aspects of the forest.Experientia 43: 241–251.
HODNETT, M. G., I. VENDRAME, M. D. OYAMA, A. de O. MARQUES FILHO, AND
J. TOMASELLA. 1997. Soil water storage and groundwater behaviour ina catenary sequence beneath forest in central Amazonia. II: Floodplainwater table behaviour and implications for streamflow generation.Hydrol. Earth Syst. Sci. 1: 279–291.
IRMLER, U., AND K. FURCH. 1979. Production, energy and nutrient turnover ofthe cockroach Epilampra irmleri Rocha e Silva and Aguiar in a Central-Amazonian inundation forest. Amazoniana 6: 497–520.
JACQUEMIN, J., D. THOMAS, T. DELSINNE, Y. ROISIN, AND M. LEPONCE. 2012.Soil properties only weakly affect subterranean ant distribution at smallspatial scales. Appl. Soil Ecol. 62: 163–169.
KALKA, M. B., A. R. SMITH, AND E. K. V. KALKO. 2008. Bats limit arthropodsand herbivory in a tropical forest. Science 320: 71.
KASPARI, M. 1996. Testing resource-based models of patchiness in four Neo-tropical litter ant assemblages. Oikos 76: 443–454.
KASPARI, M., AND M. D. WEISER. 2000. Ant activity along moisture gradientsin a tropical forest. Biotropica 32: 703–711.
KASPARI, M., AND S. YANOVIAK. 2008. The biogeography of litter depth intropical forests: Evaluating the phosphorus growth rate hypothesis.Funct. Ecol. 22: 919–923.
KASPARI, M., AND S. YANOVIAK. 2009. Biogeochemistry and the structure oftropical brown food webs. Ecology 90: 3342–3351.
KING, J. R. 2010. Size-abundance relationships in Florida ant communitiesreveal how ants break the energetic equivalence rule. Ecol. Entomol.35: 287–298.
LEGENDRE, P., AND L. LEGENDRE. 2012. Numerical ecology. Elsevier Press,Amsterdam, the Netherlands.
Environmental Controls on Tropical Cockroaches 9

LEVINGS, S. C., AND D. M. WINDSOR. 1984. Litter moisture content as a deter-minant of litter arthropod distribution and abundance during the dryseason on Barro Colorado Island, Panama. Biotropica 16: 125–131.
MAGNUSSON, W. E., A. P. LIMA, R. LUIZ~AO, F. LUIZ~AO, F. R. C. COSTA, C. VCASTILHO, AND V. F. KINUPP. 2005. RAPELD: A modification of theGentry method for biodiversity surveys in long-term ecologicalresearch sites. Biota Neotrop. 5: 1–6.
MCGLYNN, T. P., R. R. DUNN, T. E. WOOD, D. LAWRENCE, AND D. A. CLARK.2007. Phosphorus limits tropical rain forest litter fauna. Biotropica 39:50–53.
MCGLYNN, T. P., R. M. FAWCETT, AND D. A. CLARK. 2009. Litter biomass andnutrient determinants of ant density, nest size, and growth in a CostaRican tropical wet forest. Biotropica 41: 234–240.
MCINTOSH, A. R., H. S. GREIG, S. A. MCMURTRIE, M. NYSTR€OM, AND M. J.WINTERBOURN. 2005. Top-down and bottom-up influences on popula-tions of a stream detritivore. Freshw. Biol. 50: 1206–1218.
MERTL, A. L., K. T. R. WILKIE, AND J. F. A. TRANIELLO. 2009. Impact offlooding on the species richness, density and composition ofAmazonian litter-nesting ants. Biotropica 41: 633–641.
MOMOSE, K., T. YUMOTO, T. NAGAMITSU, M. KATO, H. NAGAMASU, S. SAKAI, R.D. HARRISON, T. ITIOKA, A. A. HAMID, AND T. INOUE. 1998. Pollinationbiology in a lowland dipterocarp forest in Sarawak, Malaysia. I. Char-acteristics of the plant-pollinator community in a lowland dipterocarpforest. Am. J. Bot. 85: 1477–1501.
MORAES, J., E. FRANKLIN, J. W. MORAIS, AND J. L. P. SOUZA. 2011. Speciesdiversity of edaphic mites (Acari: Oribatida) and effects of topography,soil properties and litter gradients on their qualitative and quantitativecomposition in 64 km2 of forest in Amazonia. Exp. Appl. Acarol. 55:39–63.
NAGAMITSU, T., AND Y. INOUE. 1997. Cockroach pollination and breeding sys-tem of Uvaria elmeri (Annonaceae) in a lowland mixed-dipterocarp for-est in Sarawak. Am. J. Bot. 84: 208–213.
OLIVEIRA, A. H. C. 2013. Padr~oes temporais de diversidade: dinamica de as-sembleias de formigas de liteira (Hymenoptera: Formicidae) em
25 km2 de floresta Amazonica. Master’s thesis, Instituto Nacional dePesquisas da Amazonia, Manaus. Available on: http://w2.files.scire.net.br/atrio/inpa-ent_upl//THESIS/34/verso_final_adriano_2013.pdf.
OLIVEIRA, P. Y., J. L. P. SOUZA, F. B. BACCARO, AND E. FRANKLIN. 2009. Antspecies distribution along a topographic gradient in a “terra-firme”forest reserve in Central Amazonia. Pesqui. Agropecu. Bras. 44: 852–860.
OTIS, G. W., G. S. SANTANA, D. L. CRAWFORD, AND M. L. HIGGINS. 1986. Theeffect of foraging army ants on leaf-litter arthropods. Biotropica 18:56–61.
PONSARD, S., R. ARDITI, AND C. JOST. 2000. Assessing top-down and bottom-up control in a litter-based soil macroinvertebrate food chain. Oikos89: 524–540.
R Development Core Team. 2013. R: A language and environment for statis-tical computing. R Foundation for Statistical Computing, Vienna.http://www.R-project.org/.
RICHARDS, L. A., AND P. D. COLEY. 2007. Seasonal and habitat differencesaffect the impact of foodand predation on herbivores: A compari-son between gaps and understory of a tropical forest. Oikos 116:31–40.
SAYER, E. J. 2006. Using experimental manipulation to assess the roles of leaflitter in the functioning of forest ecosystems. Biol. Rev. 81: 1–31.
SAYER, E. J., L. M. SUTCLIFFE, R. I. C. ROSS, AND E. V. J. TANNER. 2010.Arthropod abundance and diversity in a lowland tropical forest floorin Panama: The role of habitat space vs. nutrient concentrations. Bio-tropica 42: 194–200.
SCHAL, C., AND W. L. BELL. 1986. Vertical community structure and resourceutilization in some Neotropical rain-forest cockroaches. Ecol. Ento-mol. 11: 411–423.
SCHAL, C., J.-Y. GAUTIER, AND W. J. BELL. 1984. Behavioural ecology of cock-roaches. Biol. Rev. 59: 209–254.
SINCLAIR, B. J., J. M. LORD, AND C. M. THOMPSON. 2001. Microhabitat selectionand seasonality of alpine invertebrates. Pedobiologia 45: 107–120.
10 Tarli et al.