Embed Size (px)
Citation preview

For submission to IEEE/ASME Transactions on Mechatronics, June 2007
1
Multiple Cooling Loops in Advanced Vehicle Thermal Management Systems
M. H. Salah†, T. H. Mitchell‡, J. R. Wagner, Ph.D., PE‡, and D. M. Dawson, Ph.D.†
Automotive Research Laboratory Departments of Mechanical‡ and Electrical/Computer† Engineering
Clemson University, Clemson, SC 29634–0921 (864) 656–7376, [email protected]
ABSTRACT The integration of computer controlled electro–mechanical components in ground vehicle cooling systems can improve coolant temperature regulation and servo–motor power consumption. Advanced thermal management systems for internal combustion engines can better regulate the combustion process by harmoniously controlling the cooling system’s multiple actuators to obtain desired thermal conditions in a power efficient manner. In this paper, a comprehensive nonlinear control architecture is proposed for transient temperature tracking in multiple cooling circuits. An experimental engine and transmission cooling system has been assembled which features a variable position smart thermostat valve, two variable speed electric pumps, variable speed electric radiator fan, engine block, transmission, radiator, steam–based heat exchanger, and sensors. Representative experimental results are discussed to demonstrate the functionality of the multi–loop thermal management system under normal and elevated ambient temperatures. The presented results clearly show that the proposed robust controller–based thermal management system can accurately track prescribed engine and transmission temperature profiles and minimize electrical power consumption.
1. INTRODUCTION
Advance automotive thermal management systems can effectively maintain the desired
temperature in internal combustion engines for enhanced performance (Melzer et al., 1999).
Automotive cooling systems can be upgraded to computer controlled servo–motor actuated
components rather than the conventional wax–based thermostat valve, mechanical water pump,
and viscous clutch radiator fan (Chalgren and Barron, 2003). The adjustment of thermal system
operation per driving condition can reduce the fuel consumption, parasitic losses, and tailpipe
emissions during transient and steady–state operation (Wambsganss, 1999). Geels et al. (2003)
reported that reductions of 5%, 20%, and 10% in engine fuel consumption and tail pipe
emissions for CO and HC can be achieved when transforming from mechanical to electrical
For submission to IEEE/ASME Transactions on Mechatronics, June 2007
2
cooling system components within the vehicle. The underhood powertrain components and cabin
environment must be maintained within desired temperature ranges. The main cooling loop
ensures that the engine block does not overheat leading to coolant boiling. Similarly, the
transmission oil is cooled by pumping the fluid through an auxiliary heat exchanger typically
located inside the radiator. Further, the compressed air exiting a turbocharger’s compressor may
be cooled before entering the engine’s cylinders using a charge–air–cooler. Finally, the heater
core conditions the passenger compartment air temperature for occupant specified comfort
levels.
A short literature review will be presented. Cho et al. (2004) investigated a controllable
electric water pump in a class–three medium duty diesel engine truck in terms of cooling circuit
thermal performance. Page et al. (2005) implemented an intelligent thermal management system
on a medium–sized tactical vehicle to study improvements in the engine’s peak fuel consumption
and thermal operating conditions. Redfield et al. (2006) examined potential energy savings for
engine cooling in class–eight tractors. They demonstrated ±3ºC temperature tracking for
prescribed set point values. Although advanced automotive thermal management systems offer
significant benefits, few researches have focused on secondary cooling loops (Chalgren and
Traczyk, 2005). Chalgren and Allen (2005) applied advanced thermal management systems
concepts to the transmission, EGR cooler, and charge–air–cooler for a light duty diesel truck.
They reported that temperature controllability was remarkably improved for the intake manifold
air, engine block, engine coolant, and engine oil as well as a greater heat rejection capability
while decreasing the cooling system parasitic losses. Note that the charge–air–cooler loop can
improve the fuel economy and combustion by decreasing the compressed inlet air temperature
(Taitt et al., 2006).

For submission to IEEE/ASME Transactions on Mechatronics, June 2007
3
A wide range of controller designs have been implemented to control the smart
components in advanced cooling systems. Wagner et al. (2002 and 2003) introduced real–time
thermal control algorithms for the synchronous regulation of the servo–motor driven thermostat
valve and water pump. Choukroun and Chanfreau (2001) modified the classic cooling loop by
using electro–mechanical components and a proportional integral (PI) control technique.
Cipollone and Villante (2004) proposed different cooling control schemes for a proportional
valve as a replacement to the traditional thermostat valve. Setlur et al. (2005) presented a suite of
mathematical models to describe the engine cooling loop thermal behavior and controllable
electro–mechanical multiple actuators. They developed nonlinear control algorithms for the
servo–motor cooling system actuators for temperature regulation. Salah et al. (2008) developed a
backstepping robust controller and a normal radiator operation using a lumped parameter model
to operate harmoniously the system actuators.
In this paper, a multiple (i.e., engine and transmission) loop advanced thermal
management system will be investigated and analyzed. Section 2 presents mathematical models
to describe the cooling system dynamics. Nonlinear tracking control strategies are introduced in
Section 3 to accommodate disturbances and uncertainties. Section 4 presents the experimental
test bench that features a smart thermostat valve, variable speed electric coolant and transmission
pumps, variable speed electric radiator fan, radiator, 6.0L engine block, automatic transmission,
and a multiple output steam–based heat exchanger to emulate the combustion and transmission
heating processes. In Section 5, representative experimental results are introduced for five test
cases (e.g., steady heat input for normal and elevated ambient temperature, variable set point
temperature, variable heat input with ram air disturbance, and controller design comparisons).
The summary is contained in Section 6. The Appendix presents a complete Nomenclature List.
For submission to IEEE/ASME Transactions on Mechatronics, June 2007
4
2. AUTOMOTIVE MULTI–LOOP COOLING SYSTEM BEHAVIOR
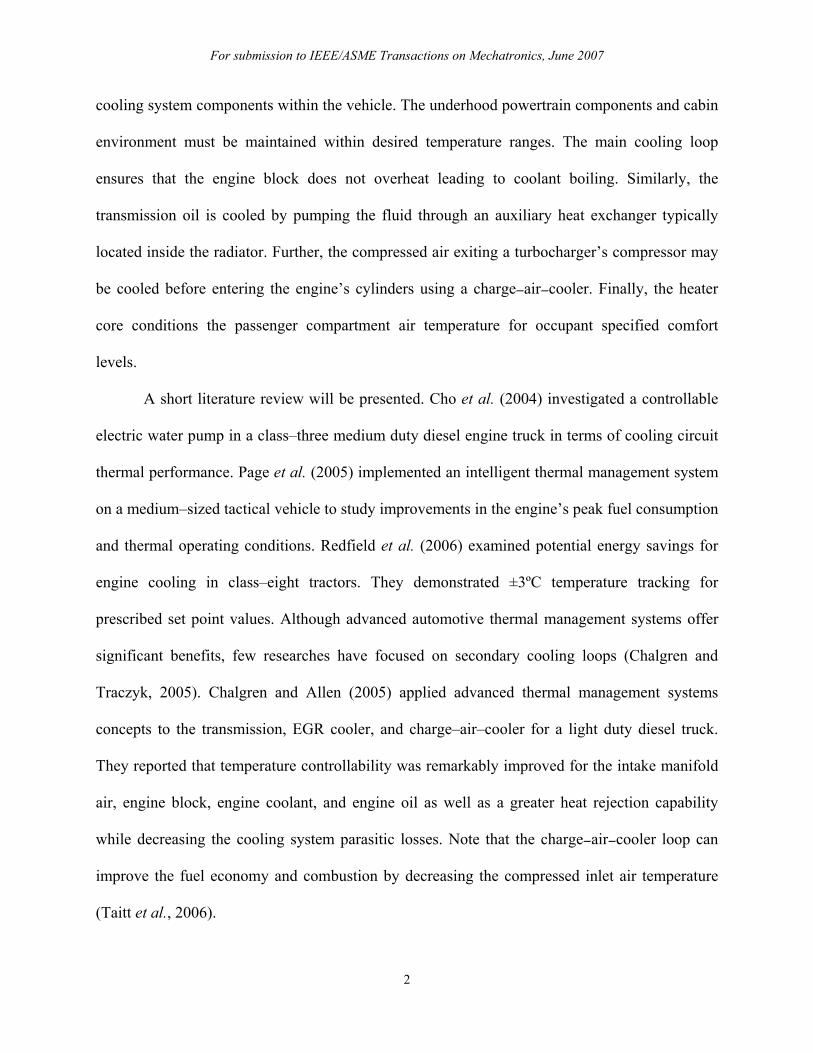
The thermal response of a multi–loop advanced cooling system can be represented by a
suite of lumped parameter mathematical descriptions. The automotive powertrain elements
included a 6.0L diesel engine, automatic transmission, and radiator as shown in Figure 1. The
engine’s thermal management system features a three–way smart valve, variable speed electric
coolant pump, and a variable speed electric radiator fan. The transmission loop features a
variable speed electric pump with a secondary radiator. Finally, the charge–air–cooler (air–to–
coolant heat exchanger) was a simple loop to reduce air temperature after compression with an
integrated coolant pump. A multiple output steam–based heat exchanger emulated the engine
combustion and transmission heat processes.
Transmission
Engine
Charge-Air-CoolerCooling Loop Pump EGR/Turbo Intake Air
SecondaryRadiator
MainRadidator
Radiator Fan
Three-WayValve
Charge-Air-Coolar
EngineCoolant Pump
TransmissionFluid Pump
Figure 1: Multi–loop advanced cooling system which features a three–way smart valve, two variable speed electric pumps, constant speed electric pump, a variable speed electric radiator fan, an engine block, a transmission, a radiator, a charge–air–cooler, and various sensors (temperature, mass flow rate, and power).

For submission to IEEE/ASME Transactions on Mechatronics, June 2007
5
A series of reduced–order thermal models describe the multi–loop cooling system’s
transient response to minimize the computational burden for in–vehicle implementation. The
thermal behavior of the engine, transmission, and radiator can be described as
( )e e e pc cr e reC T Q c m T T= − − (1)
( )t t t po ot t rtC T Q c m T T= − − (2)
( ) ( ) ( )r re a pc cr e re po ot t rt r pa ar eC T Q c m T T c m T T c m T Tε ∞= − + − + − − − . (3)
The variables ( ), ( ),e tQ t Q t and ( )aQ t represent the heat produced by the combustion process,
the transmission heat generated, and the radiator heat loss due to uncontrollable ram air flow. An
adjustable multiple output double pass steam–based heat exchanger delivered the virtual
combustion and transmission heat at a maximum of 56kW and 4kW, respectively. In an actual
vehicle, the heat generated by the engine combustion process is transferred to the coolant
through the block’s water jacket, while the heat generated by the transmission is transferred to
the oil by the transmission gears.
For a three way servo–driven thermostat valve, the radiator coolant mass flow rate (in the
engine loop), ( )crm t , is based on the coolant pump flow rate and normalized valve position so
that cr cem Hm= where 0 1H≤ ≤ . Note that ( ) 1(0)H t = corresponds to a fully closed (open)
valve position and coolant flow through the radiator (bypass) loop. The two–node lumped
parameter thermal model that describes the charge–air–cooler dynamic behavior may be
expressed as
( ) ( )a ao pa a ai ao cac pc csr co ciC T c m T T c m T Tε= − − − (4)
( ) ( )c co cac pa a ai ao pc csr co ciC T c m T T c m T Tε= − − − (5)
( )sr ci pc csr co ci srC T c m T T Q= − − . (6)
For submission to IEEE/ASME Transactions on Mechatronics, June 2007
6
The variable sr a rfQ Q Q= + represents the heat loss in the secondary radiator due to the ram air
flow, ( )aQ t , and the air blown by the primary radiator fan, ( )rfQ t . Since the heat generated in
the charge–air–cooler air–side, ( )pa a ao aic m T T− , is not totally transferred to the charge–air–
cooler coolant–side loop, it is multiplied by the effectiveness of the charge–air–cooler heat
exchanger, cacε , as shown in equation (5). The heat loss in the secondary radiator, ( )srQ t , can be
computed from ( )sr sr sr coQ A h T T∞= − where ( )srh ⋅ is a function of the air mass flow rate,
( )asrm t , through the secondary radiator.
3. CONTROL SYSTEM DESIGN FOR MULTIPLE THERMAL LOOPS
A Lyapunov–based nonlinear control algorithm will be developed to maintain a desired
engine block temperature, ( )edT t , and a desired transmission temperature, ( )tdT t , subject to
variable uncertainties in the described multi–loop cooling system model. The controller’s main
objective is to track the engine and transmission temperature prescribed set points while
compensating for the variable system uncertainties (i.e., combustion process input heat, ( )eQ t ,
heat generated in the transmission, ( )tQ t , and radiator heat loss, ( )aQ t ) by harmoniously
controlling the system’s electro–mechanical actuators. Although other linear and nonlinear
control algorithms may be formulated (Ap and Tarquis, 2005), Lyapunov–based nonlinear
control strategies demonstrate outstanding disturbance rejection qualities (Salah et al., 2008).
The system servo–actuators are a three–way smart valve, two coolant pumps, an oil pump, and a
radiator fan as shown in Figure 1. An important objective is to reduce the electric power
consumed by these actuators, ( )sysP t .
For submission to IEEE/ASME Transactions on Mechatronics, June 2007
7
To facilitate the controller design process, three assumptions are imposed.
A1: The signals ( ), ( )e tQ t Q t , and ( )aQ t always remain positive in equations (1)–(3) (i.e., ( ), ( ), ( ) 0e t aQ t Q t Q t ≥ ). Further, the signals ( )eQ t and ( )tQ t with their first two time
derivatives remain bounded at all time, such that ( ), ( ), ( ), ( ), ( ), ( )e t e t e tQ t Q t Q t Q t Q t Q t L∞∈ , as well as ( )aQ t to be bounded, such that ( )aQ t L∞∈ .
A2: The surrounding ambient temperature ( )T t∞ is uniform and satisfies the condition
1( ) ( )eT t T t ε∞− ≥ at all time where 1ε+∈ are constants.
A3: The coolant temperatures at the engine block and radiator outlets satisfy the condition
2( ) ( )e reT t T t ε− ≥ at all time where 2ε+∈ is a constant. Further, (0) (0)e reT T≥ to
facilitate the boundedness of signal argument. Assumption A3 allows the engine and radiator outlets’ coolant to have the same initial
temperature (e.g., cold start). The unlikely cases of (0) (0)e reT T< is not considered. It is
important to point out that in equations (1–3), the signals ( ), ( ), ( ), ( )e re t rtT t T t T t T t , and ( )T t∞ can
be measured by either thermocouples or thermistors, and the system parameters eC , tC , rC ,
pcc , poc , pac , and rε are assumed to be constant and fully known.
3.1 Control Objective for Multi–Loop Thermal System
The control objective ensures that the actual temperatures of the engine, ( )eT t , and
transmission, ( )tT t , track the desired trajectories ( )edT t and ( )tdT t , respectively such that
( ) ( ), ( ) ( )e ed t tdT t T t T t T t→ → as t →∞ (7)
while compensating for the system variable uncertainties ( ), ( ),e tQ t Q t and ( )aQ t . Another
assumption has been imposed to facilitate the boundedness of signal arguments.
A4: The engine, and transmission temperature profiles are always bounded and chosen such that their first three time derivatives remain bounded at all times (i.e.,
( ), ( ), ( ), ( ), ( ), ( ), ( ), ( )ed td ed td ed td ed tdT t T t T t T t T t T t T t T t L∞∈ ). Further, ( ) ( )edT t T t∞>> and ( ) ( )tdT t T t∞>> at all times.

For submission to IEEE/ASME Transactions on Mechatronics, June 2007
8
To facilitate the controller’s development and quantify the temperature tracking control
objective, the auxiliary signals ( ),es t and ( )ts t are defined as
,e e e e t t t ts sη α η η α η+ + (8)
where eα and tα are positive real constants, and the tracking error signals ( )e tη , and ( )t tη are
defined as e ed eT Tη − and t td tT Tη − .
Remark 1: Standard arguments (Dawson et al., 1998) can be applied to show that (i) if ( ), ( )e ts t s t L∞∈ , then ( ), ( ), ( ), ( )e t e tt t t t Lη η η η ∞∈ , and (ii) if the signals ( )es t and ( )ts t are asymptotically regulated, then the signals ( ), ( ), ( ), ( )e t e tt t t tη η η η are
asymptotically regulated. 3.2 Controller Formulation and Development
The multi–loop system, described by equations (1–3), can be written as
, ,e e e e t t t t r rt a rC T Q u C T Q u C T Q u= − = − = − + (9)
where the control laws ( ), ( ),e tu t u t and ( )ru t are defined as ( )e pc cr e reu c m T T− ,
( )t po ot t rtu c m T T− , and ( )r e t r pa ar eu u u c m T Tε ∞+ − − . To analyze the error system
dynamics, the time derivatives of the first two expressions in equation (9) are computed and then
both sides of the resulting equations are multiplied by eC and tC for the engine and transmission
dynamics, respectively. Thus, the first two thermal dynamics in equation (9) can be substituted
and then reformatted to realize
,e e e e e t t t t tC s N u C s N uη η= + − = + − (10)
where the auxiliary functions ( ), ,e e eN T T t and ( ), ,t t tN T T t are defined as
,e e ed e e e e e t t td t t t t tN C T Q C N C T Q Cα η η α η η− + + − + + . (11)
For submission to IEEE/ASME Transactions on Mechatronics, June 2007
9
The radiator may operate normally as a heat exchanger if the control law ( )ru t is set to
zero (Salah et al., 2008). The expression ( )e t r pa ar eu u c m T Tε ∞+ = − can be obtained by setting
the control law ( )ru t to zero.
Remark 2: The control inputs ( ), ( )cr om t m t , and ( )arm t are uni–polar. Hence, commutation strategies are designed to implement the bi–polar control laws ( )eu t and ( )tu t as
( )( )
( )( )
( )( )min
1 sgn 1 sgn 1 sgn, ,
2 22e e t t
cr ot ot arpc e re r pa epo t rt
u u u u F Fm m m m
c T T c T Tc T T εε ∞
+ + + +− −− +
(12)
where e tF u u+ , and ε +∈ is a constant that is selected arbitrary small to prevent any singularity condition. During the system warm–up, some heat is transferred to the transmission via the radiator since the engine heats up faster than the transmission. Thus, the condition ( ) ( )t rtT t T t< may occur. The control input,
( )arm t is obtained from the control laws ( )eu t and ( )tu t . It is clear from the expressions in equation (12) that by setting the control law 0ru = , the fan effort, denoted by ( )r pa ar ec m T Tε ∞− , is set to equal the summation of the coolant pump
effort in the engine loop, denoted by ( )pc cr e rec m T T− , and the oil pump effort in the
transmission loop, denoted by ( )po ot t rtc m T T− . Further, if ( ), ( )e tu t u t L∞∈ at all time, then ( ), ( ), ( )cr ot arm t m t m t L∞∈ at all time.
Remark 3: The commutation strategy of the uni–polar control input ( )crm t , introduced in
equation (12), is implemented utilizing the smart thermostat valve such that
( )min0,
, , 01,
e edcr ce ce ce
e ed
T T Tm Hm H m m if H
T T T< −∆
= ≥ −∆ (13)
where T∆ is the boundary layer about the desired engine temperature, ( )edT t . The boundary layer was introduced to reduce valve dithering. The proposed three–way valve operation ensures minimizing the warm–up and heating time during any operating condition (Mitchell et al., 2007).
Based on equations (10) and (11), the control objective described in equation (7) can be
accomplished by designing the control laws ( )eu t and ( )tu t introduced in equation (9) as
( )[ ] ( ) ( ) sgn( ( ))o
t
e e e e eo e e e e e et
u k k dα η η α α η τ ρ η τ τ = − + − − + + ∫ (14)

For submission to IEEE/ASME Transactions on Mechatronics, June 2007
10
( )[ ] ( ) ( ) sgn( ( ))o
t
t t t t to t t t t t tt
u k k dα η η α α η τ ρ η τ τ = − + − − + + ∫ (15)
where ek and tk are real positive control gains, and the signals eoη and toη are the signals ( )e tη
and ( )t tη evaluated at the initial time ot . The last terms, ( )sgne eρ η and ( )sgnt tρ η , in
equations (14) and (15) compensate for the variable unmeasurable quantities, ( )eQ t , and ( )tQ t .
Refer to Setlur et al. (2005) for more details on this robust control design method and
Lyapunov–based stability analysis. Knowledge of ( )eu t and ( )tu t , based on equations (14) and
(15), allows the commutation relationships of equation (12) to be calculated which provides
( ), ( )cr om t m t , and ( )arm t . Finally, the voltage signals for the pumps and fan are prescribed using
( ), ( )cr om t m t , ( )am t and a priori empirical relationships.
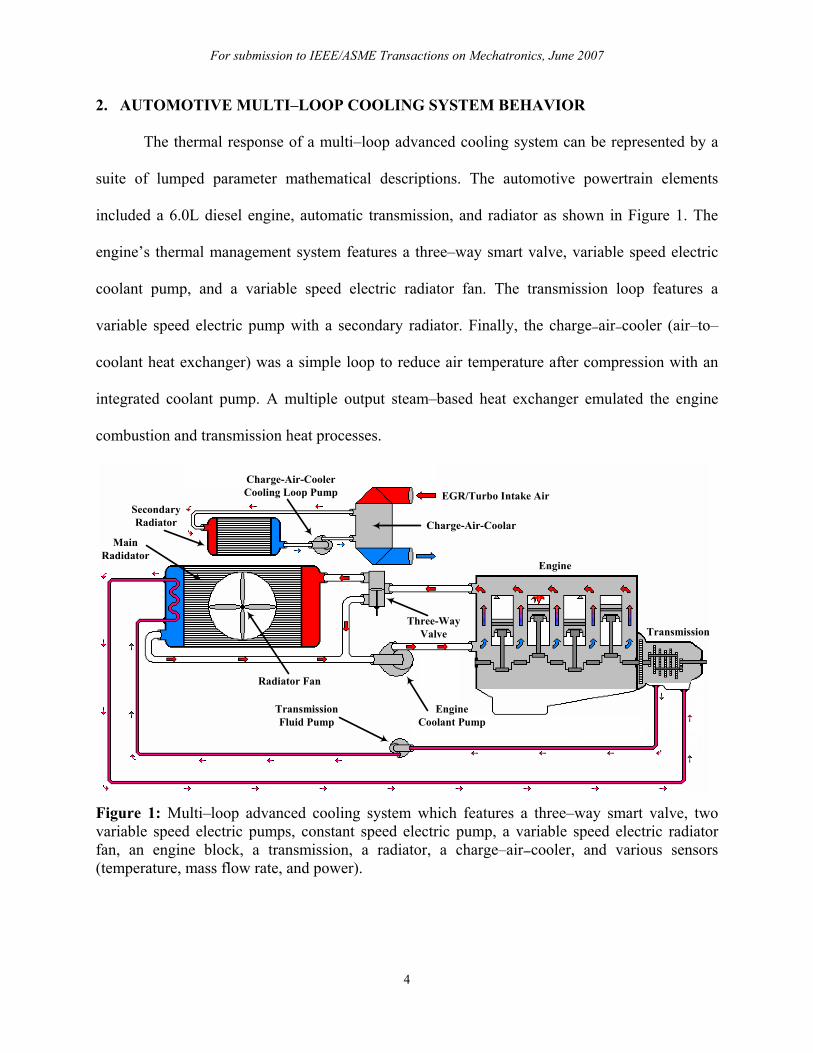
4. MULTI–LOOP THERMAL TEST BENCH AND TEST PROFILES
An experimental test bench was created to investigate advanced vehicle thermal
management systems for multiple cooling loops. The test environment offers a safe and
repeatable method to study the engine and transmission cooling loops. To rapidly heat fluids in
the engine and transmission, a two–pass shell multiple output steam–based heat exchanger was
utilized as shown in Figure 2. High pressure steam from Clemson University facilities has been
integrated into the bench. For the engine loop, heated coolant is routed through a 6.0L
International V–8 diesel engine block to emulate combustion. The engine block acts as a thermal
capacitance similar to actual operation. From the engine block, the coolant flows to a three–way
smart valve and then through the bypass and/or radiator before closing the loop with the coolant
pump. In the transmission loop, steam is routed directly to the automatic transmission pan. The

For submission to IEEE/ASME Transactions on Mechatronics, June 2007
11
transmission fluid in the pan is rapidly heated and then circulated via an electric pump through
the radiator’s transmission cooling tank.
Radiator (Qa)
ElectricRadiator Fan
Engine ElectricCoolant Pump
Flow Meter
Transmission ElectricFluid Pump
J-Type TC(Te)
K-Type TC(Tre)
K-Type TC(Trt)
J-Type TC(Tt)
Steam HeatExchanger (Qin)
Condensate Oulet
SteamSupply
Transmission (Qt)
Engine (Qe)
Three-WayValve
( )cm
( )otmTransmission Fluid Flow
Figure 2: Experimental thermal test bench (schematic and actual) that features a 6.0L diesel engine block, transmission, three–way smart valve, electric coolant pump, electric fluid pump, electric radiator fan, radiator, and multiple output steam–based heat exchanger.

For submission to IEEE/ASME Transactions on Mechatronics, June 2007
12
The heat applied to the engine block and transmission housing may be independently
adjusted by two steam control valves. Due to steam routing, a direct correlation exists between
the heat introduced in the main engine loop and secondary heat transferred to the transmission
(i.e., the transmission connects to the heat exchanger). To calculate the rate of system heat
transfer, in e tQ Q Q= + , condensed steam was collected and weighed from both the transmission
and main steam line. It has been assumed that the amount of condenser condensate is
proportional to the amount of heat transferred to the circulating coolant (Incropera and DeWitt,
2002). Overall, heat transfer rates exceeding 60 kW can be achieved with the current steam heat
exchanger and transmission circuit.
The system sensors include three J–type thermocouples ( eT = engine coolant outlet, tT =
transmission fluid outlet, T∞ = ambient air), two K–type thermocouples ( reT = radiator coolant
outlet, rtT = radiator fluid inlet), and main coolant mass flow meter, cm . The transmission fluid
and radiator air mass flow rates are determined using empirical models. Data acquisition was
performed by a Servo–to–Go board which utilizes eight analog–to–digital inputs and eight
digital–to–analog outputs. This board provides control signals for the smart valve, engine and
transmission variable speed electric pumps, and variable speed radiator fan. Due to equipment
limitation, the charged–air–cooler has not been experimentally studied.
Five tests have been implemented to investigate the multi–loop system dynamics and
controller’s performance on the experimental test bench as shown in Table 1. The first test
applies a constant input heat, inQ = 35kW, and ram air disturbance, to emulate a vehicle traveling
at ramV = 75km/h, with an ambient temperature of 294ºK (69.5ºF or 20.9ºC). The desired engine
and transmission temperatures were edT = 362ºK and tdT = 358ºK. For the second test, an

For submission to IEEE/ASME Transactions on Mechatronics, June 2007
13
elevated temperature of 325ºK (125.3ºF or 51.9ºC) was applied while maintaining the same input
heat and ram air disturbance as test one. The elevated temperature testing allowed significant
thermal loading which may be found in desert climates around the world. In the third test, the
desired engine and transmission temperatures were ( )363 sgn sin 0.002edT tπ π = + − and tdT =
356ºK. A constant input heat, inQ = 39kW, and ram air disturbance, to emulate a vehicle traveling
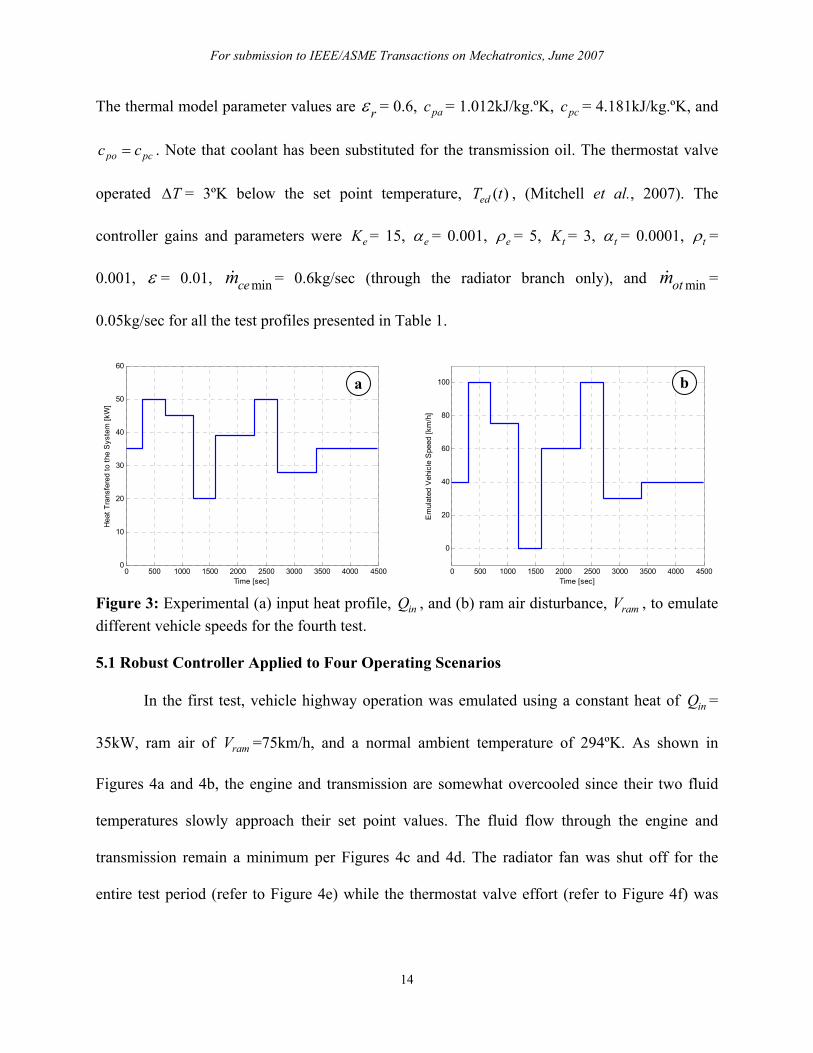
again at 75km/h, were applied with an ambient temperature of 292ºK. The fourth test varies both
the total input heat, in e tQ Q Q= + , and the ram air disturbance, ramV , as shown in Figure 3 with
an ambient temperature of 300ºK. The desired engine and transmission temperatures were set as
edT = 364ºK and tdT = 362ºK. Finally, a fifth test was conducted to evaluate two alternative
controllers that were designed for their overall performance when compared to the nonlinear
robust controller.
Test No. Test Description T∞ [ºK] Ted [ºK] Ttd [ºK] Qin [kW] Vram [km/h]
1 294 2 Steady heat and ram air disturbance 325 362 358 35 75
3 Square wave set point temperature 292 364 362 356 39 75
4 Variable heat and ram air disturbance 300 364 362 20–50 0–100
5 Comparison of controllers design 294 362 356 45 75
Table 1: Test profiles for the multi–loop thermal system. 5. EXPERIMENTAL RESULTS
In this section, representative experimental results will be presented to investigate the
proficiency of the real–time control algorithm and servo–motor driven actuators in regulating set
point temperatures and minimizing power consumption in multi–loop automotive cooling
systems. A set of five experimental tests (refer to Table 1) have been conducted on the steam–
based multi–loop thermal test bench which features the engine and transmission cooling loops.
For submission to IEEE/ASME Transactions on Mechatronics, June 2007
14
The thermal model parameter values are rε = 0.6, pac = 1.012kJ/kg.ºK, pcc = 4.181kJ/kg.ºK, and
po pcc c= . Note that coolant has been substituted for the transmission oil. The thermostat valve
operated T∆ = 3ºK below the set point temperature, ( )edT t , (Mitchell et al., 2007). The
controller gains and parameters were eK = 15, eα = 0.001, eρ = 5, tK = 3, tα = 0.0001, tρ =
0.001, ε = 0.01, mincem = 0.6kg/sec (through the radiator branch only), and minotm =
0.05kg/sec for all the test profiles presented in Table 1.
0 500 1000 1500 2000 2500 3000 3500 4000 45000
10
20
30
40
50
60
Time [sec]
Hea
t Tra
nsfe
red
to th
e S
yste
m [k
W]
0 500 1000 1500 2000 2500 3000 3500 4000 4500
0
20
40
60
80
100
Time [sec]
Em
ulat
ed V
ehic
le S
peed
[km
/h]
Figure 3: Experimental (a) input heat profile, inQ , and (b) ram air disturbance, ramV , to emulate different vehicle speeds for the fourth test. 5.1 Robust Controller Applied to Four Operating Scenarios
In the first test, vehicle highway operation was emulated using a constant heat of inQ =
35kW, ram air of ramV =75km/h, and a normal ambient temperature of 294ºK. As shown in
Figures 4a and 4b, the engine and transmission are somewhat overcooled since their two fluid
temperatures slowly approach their set point values. The fluid flow through the engine and
transmission remain a minimum per Figures 4c and 4d. The radiator fan was shut off for the
entire test period (refer to Figure 4e) while the thermostat valve effort (refer to Figure 4f) was
a b

For submission to IEEE/ASME Transactions on Mechatronics, June 2007
15
initially oscillatory and then settled to full radiator flow (remember that thermostat valve
operation per Remark 3 is either fully open or fully closed).
0 200 400 600 800 1000 1200 1400 1600 1800325
330
335
340
345
350
355
360
365
370
Time [sec]
Tem
pera
ture
s [ºK
]
Engine Temperature
Radiator Temperature
0 200 400 600 800 1000 1200 1400 1600 1800325
330
335
340
345
350
355
360
365
370
Time [sec]
Tem
pera
ture
s [ºK
]
Transmission Outlet Temperature
Transmission Inlet Temperature
0 200 400 600 800 1000 1200 1400 1600 18000
0.5
1
1.5
2
2.5
3
3.5
4
4.5
Time [sec]
Coo
lant
Mas
s Fl
ow R
ate
[kg/
sec]
0 200 400 600 800 1000 1200 1400 1600 18000
0.02
0.04
0.06
0.08
0.1
0.12
0.14
0.16
0.18
0.2
Time [sec]
Flui
d M
ass
Flow
Rat
e [k
g/se
c]
0 200 400 600 800 1000 1200 1400 1600 1800
0
0.5
1
1.5
Time [sec]
Air
Mas
s Fl
ow R
ate
[kg/
sec]
0 200 400 600 800 1000 1200 1400 1600 1800
0
20
40
60
80
100
Time [sec]
Nor
mal
ized
Val
ve P
ositi
on [%
Byp
ass]
Figure 4: First experimental test scenario for the robust controller with emulated vehicle speed of 75km/h, inQ = 35kW, and normal ambient temperature of T∞ = 294ºK; (a) Engine and radiator temperatures with a desired engine temperature of edT = 362ºK; (b) Transmission and radiator side tank temperatures with a desired transmission temperature of tdT = 358ºK; (c) Coolant mass flow rate through the engine pump; (d) Coolant mass flow rate through the transmission pump; (e) Air mass flow rate through the radiator fan; and (f) Normalized thermostat valve position.
a b
c d
e f

For submission to IEEE/ASME Transactions on Mechatronics, June 2007
16
In the second test, an elevated temperature of 325ºK (125.3ºF or 51.9ºC) was achieved
using a 165kBtu/h portable kerosene forced–air heater as shown in Figure 5.
The temperature tracking errors for the engine and transmission were 3ºK and 5ºK, respectively,
as shown in Figures 6a and 6b. The system actuators (i.e., pumps and fan) were saturated (refer
to Figures 6c, 6d, and 6e) and not able to readily reject the system heat. The fan effort increases
with the elevated temperature. This is clear from the fan commutation strategy introduced in
equation (12) where ( )arm t is affected by the difference ( ) ( )eT t T t∞− . The thermostat valve in
Figure 6f was wide open after t = 185sec. The elevated temperature demonstrated the need for a
larger radiator size based on the thermal loads. This test clearly illustrates the requirement for
cooling system sizing to meet environmental demands.
Figure 5: Portable kerosene forced–air heater exhaust stream used to elevate the ambient air temperature entering the cooling system for test two which challenged the cooling system’s heat rejection capabilities.
Remark 4: It was observed that allowing the coolant flow in the engine loop to exceed selected
thresholds would violate Assumption 3 since the radiator temperature would be greater than the engine temperature. This condition arises due to the lack of heat rejection at the radiator. The violated assumption (and based on the commutation strategy described in equation (12)) required the pump speed to oscillate continuously. To improve the thermal response under this condition, the maximum engine pump coolant mass flow rate was limited to 1.25kg/sec so the coolant through the radiate is given more time to cool down.

For submission to IEEE/ASME Transactions on Mechatronics, June 2007
17
0 200 400 600 800 1000 1200 1400 1600 1800
325
330
335
340
345
350
355
360
365
370
Time [sec]
Tem
pera
ture
s [ºK
]
Engine Temperature
Radiator Temperature
0 200 400 600 800 1000 1200 1400 1600 1800325
330
335
340
345
350
355
360
365
370
Time [sec]
Tem
pera
ture
s [ºK
]
Transmission Inlet Temperature
Transmission Outlet Temperature
0 200 400 600 800 1000 1200 1400 1600 18000
0.5
1
1.5
2
2.5
3
3.5
4
4.5
Time [sec]
Coo
lant
Mas
s Fl
ow R
ate
[kg/
sec]
0 200 400 600 800 1000 1200 1400 1600 18000
0.02
0.04
0.06
0.08
0.1
0.12
0.14
0.16
0.18
0.2
Time [sec]
Flui
d M
ass
Flow
Rat
e [k
g/se
c]
0 200 400 600 800 1000 1200 1400 1600 18000
0.5
1
1.5
Time [sec]
Air
Mas
s Fl
ow R
ate
[kg/
sec]
0 200 400 600 800 1000 1200 1400 1600 1800
0
20
40
60
80
100
Time [sec]
Nor
mal
ized
Val
ve P
ositi
on [%
Byp
ass]
Figure 6: Second experimental test scenario for the robust controller with emulated vehicle speed of 75km/h, inQ = 35kW, and elevated ambient temperature of T∞ = 325ºK; (a) Engine and radiator temperatures with a desired engine temperature of edT = 362ºK; (b) Transmission and radiator side tank temperatures with a desired transmission temperature of tdT = 358ºK; (c) Coolant mass flow rate through the engine pump; (d) Coolant mass flow rate through the transmission pump; (e) Air mass flow rate through the radiator fan; and (f) Normalized thermostat valve position.
a b
c d
e f
For submission to IEEE/ASME Transactions on Mechatronics, June 2007
18
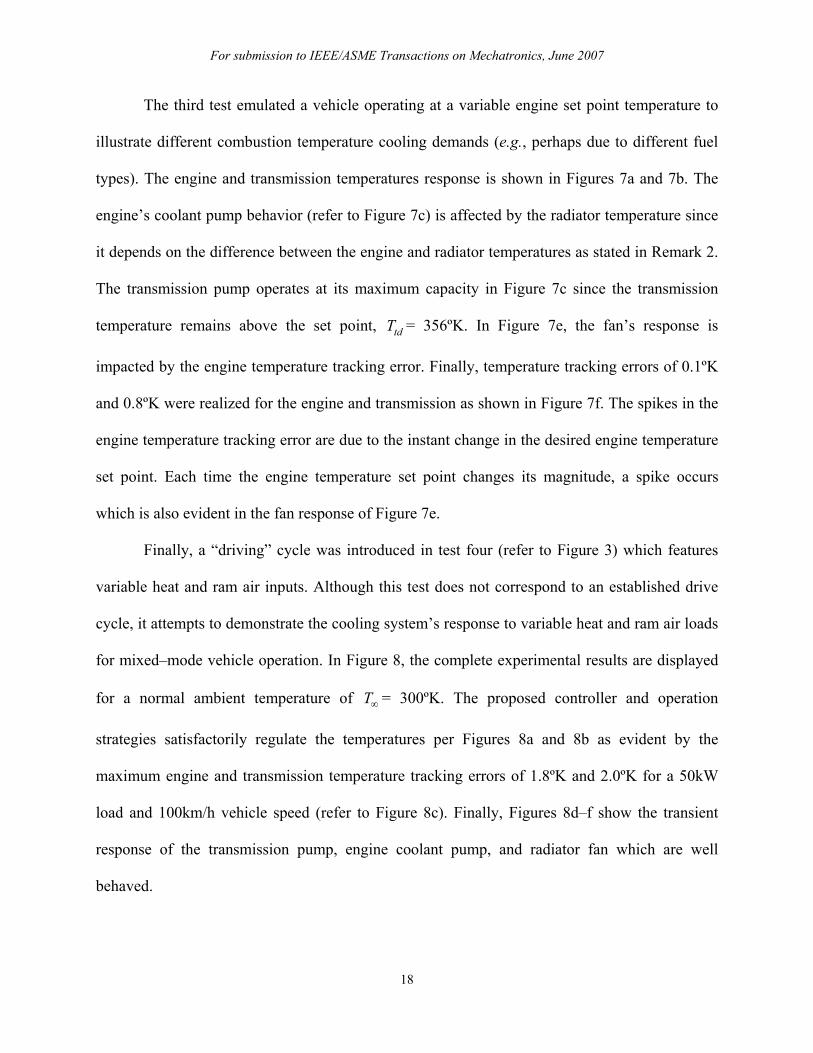
The third test emulated a vehicle operating at a variable engine set point temperature to
illustrate different combustion temperature cooling demands (e.g., perhaps due to different fuel
types). The engine and transmission temperatures response is shown in Figures 7a and 7b. The
engine’s coolant pump behavior (refer to Figure 7c) is affected by the radiator temperature since
it depends on the difference between the engine and radiator temperatures as stated in Remark 2.
The transmission pump operates at its maximum capacity in Figure 7c since the transmission
temperature remains above the set point, tdT = 356ºK. In Figure 7e, the fan’s response is
impacted by the engine temperature tracking error. Finally, temperature tracking errors of 0.1ºK
and 0.8ºK were realized for the engine and transmission as shown in Figure 7f. The spikes in the
engine temperature tracking error are due to the instant change in the desired engine temperature
set point. Each time the engine temperature set point changes its magnitude, a spike occurs
which is also evident in the fan response of Figure 7e.
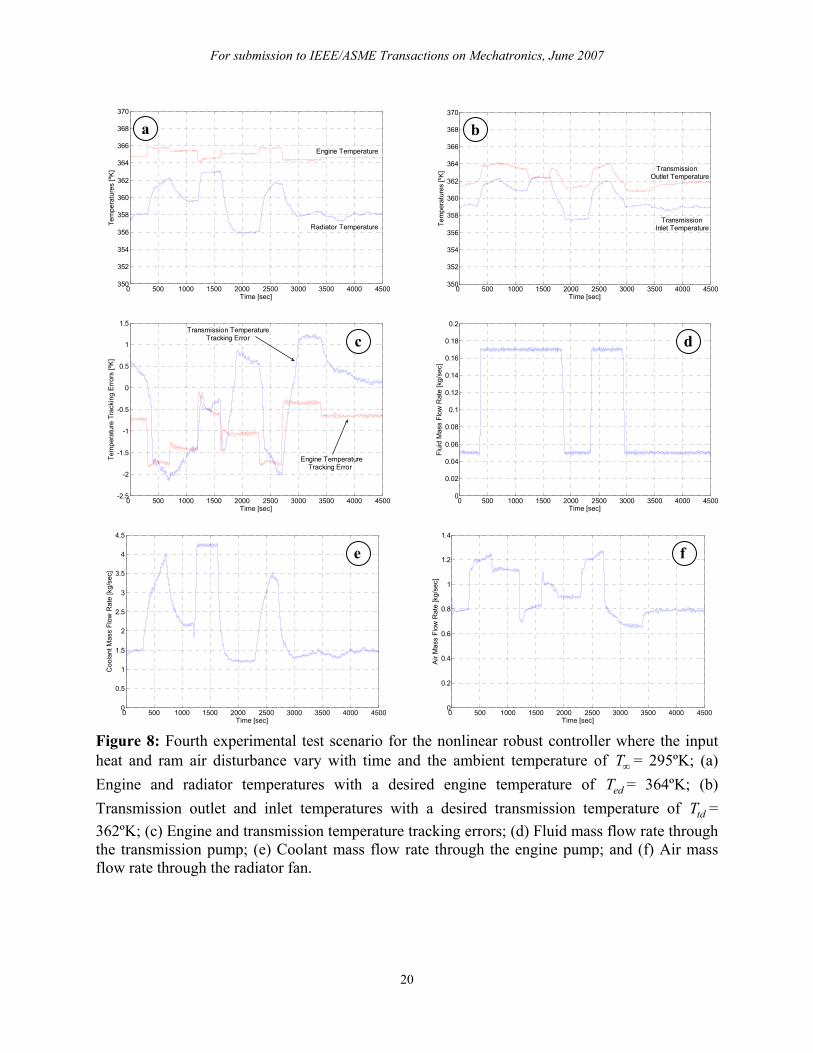
Finally, a “driving” cycle was introduced in test four (refer to Figure 3) which features
variable heat and ram air inputs. Although this test does not correspond to an established drive
cycle, it attempts to demonstrate the cooling system’s response to variable heat and ram air loads
for mixed–mode vehicle operation. In Figure 8, the complete experimental results are displayed
for a normal ambient temperature of T∞ = 300ºK. The proposed controller and operation
strategies satisfactorily regulate the temperatures per Figures 8a and 8b as evident by the
maximum engine and transmission temperature tracking errors of 1.8ºK and 2.0ºK for a 50kW
load and 100km/h vehicle speed (refer to Figure 8c). Finally, Figures 8d–f show the transient
response of the transmission pump, engine coolant pump, and radiator fan which are well
behaved.

For submission to IEEE/ASME Transactions on Mechatronics, June 2007
19
0 500 1000 1500 2000 2500 3000 3500 4000 4500
350
352
354
356
358
360
362
364
366
368
370
Time [sec]
Tem
pera
ture
s [ºK
]
Engine Temperature
Radiator Temperature
0 500 1000 1500 2000 2500 3000 3500 4000 4500
355
355.5
356
356.5
357
357.5
358
358.5
359
359.5
360
Time [sec]
Tem
pera
ture
s [ºK
]
TransmissionOutlet Temperature
TransmissionInlet Temperature
0 500 1000 1500 2000 2500 3000 3500 4000 45000
0.5
1
1.5
2
2.5
3
3.5
4
4.5
Time [sec]
Coo
lant
Mas
s Fl
ow R
ate
[kg/
sec]
0 500 1000 1500 2000 2500 3000 3500 4000 45000
0.02
0.04
0.06
0.08
0.1
0.12
0.14
0.16
0.18
0.2
Time [sec]
Flui
d M
ass
Flow
Rat
e [k
g/se
c]
0 500 1000 1500 2000 2500 3000 3500 4000 45000
0.5
1
1.5
Time [sec]
Air
Mas
s Fl
ow R
ate
[kg/
sec]
0 500 1000 1500 2000 2500 3000 3500 4000 4500
-3
-2
-1
0
1
2
3
4
Time [sec]
Tem
pera
ture
Tra
ckin
g E
rrors
[ºK
] Engine Temperature Tracking Error
Transmission Temperature Tracking Error
Figure 7: Third experimental test scenario for the robust controller with emulated vehicle speed of 75km/h, inQ = 39kW, and normal ambient temperature of T∞ = 292ºK; (a) Engine and radiator temperatures with a square wave desired engine temperature; (b) Transmission and radiator side tank temperatures with a desired transmission temperature of tdT = 356ºK; (c) Coolant mass flow rate through the engine pump; (d) Coolant mass flow rate through the transmission pump; (e) Air mass flow rate through the radiator fan; and (f) Engine and transmission temperature error.
a b
c
d
e f
For submission to IEEE/ASME Transactions on Mechatronics, June 2007
20
0 500 1000 1500 2000 2500 3000 3500 4000 4500
350
352
354
356
358
360
362
364
366
368
370
Time [sec]
Tem
pera
ture
s [ºK
]
Engine Temperature
Radiator Temperature
0 500 1000 1500 2000 2500 3000 3500 4000 4500
350
352
354
356
358
360
362
364
366
368
370
Time [sec]
Tem
pera
ture
s [ºK
] TransmissionOutlet Temperature
TransmissionInlet Temperature
0 500 1000 1500 2000 2500 3000 3500 4000 4500
-2.5
-2
-1.5
-1
-0.5
0
0.5
1
1.5
Time [sec]
Tem
pera
ture
Tra
ckin
g E
rrors
[ºK
]
Engine Temperature Tracking Error
Transmission Temperature Tracking Error
0 500 1000 1500 2000 2500 3000 3500 4000 4500
0
0.02
0.04
0.06
0.08
0.1
0.12
0.14
0.16
0.18
0.2
Time [sec]
Flui
d M
ass
Flow
Rat
e [k
g/se
c]
0 500 1000 1500 2000 2500 3000 3500 4000 45000
0.5
1
1.5
2
2.5
3
3.5
4
4.5
Time [sec]
Coo
lant
Mas
s Fl
ow R
ate
[kg/
sec]
0 500 1000 1500 2000 2500 3000 3500 4000 45000
0.2
0.4
0.6
0.8
1
1.2
1.4
Time [sec]
Air
Mas
s Fl
ow R
ate
[kg/
sec]
Figure 8: Fourth experimental test scenario for the nonlinear robust controller where the input heat and ram air disturbance vary with time and the ambient temperature of T∞ = 295ºK; (a) Engine and radiator temperatures with a desired engine temperature of edT = 364ºK; (b) Transmission outlet and inlet temperatures with a desired transmission temperature of tdT = 362ºK; (c) Engine and transmission temperature tracking errors; (d) Fluid mass flow rate through the transmission pump; (e) Coolant mass flow rate through the engine pump; and (f) Air mass flow rate through the radiator fan.
a b
c d
e f

For submission to IEEE/ASME Transactions on Mechatronics, June 2007
21
5.2 Comparison of Three Controllers for Steady Heating and Disturbance
For completeness, a comparison of three different control strategies was investigated for
test five. The ambient temperature, T∞ = 294ºK, and system initial conditions were maintained
for each controller study. A constant input heat, inQ = 45kW, and a ram air disturbance, ramV =
75km/h, were uniformly applied. The desired engine and transmission temperatures were edT =
362ºK and tdT = 356ºK. In Table 2, the proposed robust controller is compared with a traditional
factory thermostat valve operation and proportional integral (PI) control strategy. The traditional
factory operation strategy (Mitchell et al., 2007) describes the wax–based thermostat valve
dynamics (with mixing opportunities) as
0, ( )
, ( )
1, ( )
e L
e LL e H
H L
e H
T T bypass onlyT TH T T T mixingT T
T T radiator only
<
−= ≤ ≤ − >
. (16)
For the second operation strategy, two PI controllers were implemented (i.e., engine loop and
transmission loop) such that the control efforts (voltages) for the coolant pump, radiator fan, and
fluid pump becomes ( )( )0.7ep Pe e Ie eV K K dη η τ τ= + ∫ , ( )( )0.3rf Pe e Ie eV K K dη η τ τ= + ∫ , and
( )tp Pt t It tV K K dη η τ τ= + ∫ .
Operation Strategies Description |ηess| [ºK] |ηtss| [ºK] Psys [W] Rank
Robust Controller 0.13 0.65 19.82 1 PI Controller 0.12 2.35 48.14 2 Traditional Factory Control Method 2.00 N/A 257.28 3
Table 2: Experimental summary of three cooling system control strategies for an engine and a transmission configuration with steady heat and ram air disturbance (Test 5). For the traditional factory operation strategy, the temperature bounds are TL = 359ºK and TH = 365ºK. For the second operation strategy, two PI controllers were implemented (i.e., one for the engine loop and the other for the transmission loop). The controller’s gains for the engine loop were set as KPe = 0.5 and KIe = 0.01 with 70% and 30% control effort for the engine pump and radiator fan, respectively. The controller’s gains for the transmission loop were set as KPt = 3 and KIt = 0.001.
For submission to IEEE/ASME Transactions on Mechatronics, June 2007
22
The performance of the three control methods has been evaluated in terms of temperature
tracking error and power consumption. The system power, ( ), ,sys ce ot arp m m m , measures the
average power consumed by the system actuators over the time period T=25min. The power
measure was performed for the duration of the experimental test using empirical relationships for
the flow rate measurements and electrical input power. The power consumed by the smart valve
is considered to be quite small so it is neglected in the calculation. Overall, the proposed robust
control strategy was ranked first among the controllers (and operation strategies). The robust
controller achieved a steady–state absolute value engine and transmission temperature tracking
error of essη = 0.13ºK and tssη = 0.65ºK, respectively, with a system power consumption of sysP =
19.82W per Table 2. In this operation strategy, the controller was designed for the coupled
engine and transmission loops to harmoniously operate the cooling system actuators in an
efficient manner to obtain desired thermal condition.
On the contrary, the PI controller regulated the engine coolant and transmission fluid
temperatures separately. The radiator fan was operated to only dissipate and reject the heat
generated by the engine coolant regardless of the heat generated in the transmission housing.
This approach offers steady–state absolute temperature tracking errors of essη = 0.12ºK and tssη =
2.35ºK with a system power consumption of sysP = 48.14W. The traditional factory operation
strategy relies on the wax–based thermostat valve to regulate only the engine coolant
temperature, ( )eT t , regardless of the transmission temperature, ( )tT t . During the test, large
oscillations were observed in the coolant temperature magnitude due to the repeatable opening
and closing of the wax–based thermostat valve. As shown in Table 2, the reported steady–state
absolute engine temperature tracking error was essη = 2.00ºK. The transmission temperature is
For submission to IEEE/ASME Transactions on Mechatronics, June 2007
23
not actively controlled in most factory configurations. Further, the system power consumption
was the maximum compared to the other control methods due to the operating speeds of the
engine coolant pump and radiator fan.
6. CONCLUSION
An advanced automotive thermal management systems can positively influence the
coolant temperature regulation and associated power consumption. In this paper, a multiple loop
servo–motor based smart cooling system has been experimentally assembled and controlled
utilizing a Lyapunov–based nonlinear controller. The proposed control strategy successfully
maintained the engine coolant and transmission fluid temperatures to user–defined setpoint
values with small error percentages. Further, the power consumed by the cooling system
actuators was reduced through the synchronous control of the pumps and fan motors. The
occurrence of elevated ambient temperatures required the cooling components to operate at
maximum speeds for heat dissipation which increased power consumption. Overall, the research
findings demonstrated that setpoint temperatures can often be maintained while minimizing
power consumption which should assist in the quest for greater vehicle fuel economy.
ACKNOWLEDGEMENTS
The authors would like to thank the U.S. Army Tank–Automotive and Armaments Command (TACOM) and the Automotive Research Center (ARC), a university–based U.S. Army Center of Excellence, in Warren, Michigan, for funding this project.
REFERENCES
Ap, N., and Tarquis, M., “Innovative Engine Cooling Systems Comparison,” SAE technical paper No. 2005–01–1378, 2005.

For submission to IEEE/ASME Transactions on Mechatronics, June 2007
24
Chalgren, Jr, R., and Allen, D., “Light Duty Diesel Advanced Thermal Management,” SAE technical paper No. 2005–01–2020, 2005. Chalgren, Jr, R., and Barron, Jr, L., “Development and Verification of a Heavy Duty 42/14V Electric Powertrain Cooling System,” SAE technical paper No. 2003–01–3416, 2003. Chalgren, Jr, R., and Traczyk, T., “Advanced Secondary Cooling Systems for Light Trucks,” SAE technical paper No. 2005–01–1380, 2005. Cho, H., Jung, D., Filipi, Z., and Assanis, D., “Application of Controllable Electric Coolant Pump for Fuel Economy and Cooling Performance Improvement,” proceedings of the ASME IMECE, Advanced Energy Systems Division, vol. 44, pp. 43–50, Anaheim, CA, November 2004. Choukroun, A., and Chanfreau, M., “Automatic Control of Electric Actuators for an Optimized Engine Cooling Thermal Management,” SAE technical paper No. 2001–01–1758, 2001. Cipollone, R., and Villante, C., “Vehicle Thermal Management: A Model–Based Approach,” proceedings of the ASME Internal Combustion Engine Division, pp. 85–95, Long Beach, CA, October 2004. Geels, P., Gessier, B., Chanfreau, M., and Tarquis, M., “Advance Control Strategy for Modern Engine Cooling Thermal Systems, and Effect on CO2 and Pollutant Reduction,” proceedings of Vehicle Thermal Management Systems, VTMS 6, pp. 631–641, Brighton, United Kingdom, May 2003. Dawson, D., Hu, J., and Burg, T., “Nonlinear Control of Electric Machinery,” Marcel Dekker: New York, 1998. Incropera, F., DeWitt, D., and Bergman, T., “Fundamentals of Heat and Mass Transfer,” John Wiley & Sons Inc: New York, 2002. Melzer, F., Hesse, U., Rocklage, G., and Schmitt, M., “Thermomanagement,” SAE technical paper No. 1999–01–0238, 1999. Mitchell, T., Salah, M., Wagner, J., and Dawson, D., “Automotive Thermostat Valve Configurations for Enhanced Performance – Control and Testing,” Clemson University Control and Robotics Technical Report, CU/CRB/2/15/07/#1, http://www.ces.clemson.edu/ece/crb/publictn/tr.htm, February 2007. Page, R., Hnatczuk, W., and Kozierowski, J., “Thermal Management for the 21st Century – Improved Thermal Control & Fuel Economy in an Army Medium Tactical Vehicle,” SAE technical paper No. 2005–01–2068, 2005. Redfield, J., Surampudi, B., Ray, G., Montemayor, A., Mckee, H., Edwards, T., and Lasecki, M., “Accessory Electrification in Class 8 Tractors,” SAE technical paper No. 2006–01–0215, 2006.

For submission to IEEE/ASME Transactions on Mechatronics, June 2007
25
Salah, M., Mitchell, T., Wagner, J., and Dawson, D., “Nonlinear Control Strategy for Advanced Vehicle Thermal Management Systems," IEEE Transactions on Vehicular Technology, to appear, March 2008. Setlur, P., Wagner, J., Dawson, D., and Marotta, E., “An Advanced Engine Thermal Management System: Nonlinear Control and Test”, IEEE/ASME Transactions on Mechatronics, vol. 10, no. 2, pp. 210–220, April 2005. Taitt, D., Garner, C., Swain, E., Blundell, D., Pearson, R., and Turner, J., “An Automotive Engine Charge–Air Intake Conditioner System: Analysis of Fuel Economy Benefits in a Gasoline Engine Application,” Proceedings of the Institution of Mechanical Engineers, Part D, Journal of Automobile Engineering, vol. 220, no. 9, pp. 1293–1307, September 2006. Wagner, J., Ghone, M., Dawson, D., and Marotta, E., “Coolant Flow Control Strategies for Automotive Thermal Management Systems,” SAE technical paper No. 2002–01–0713, 2002. Wagner, J., Srinivasan, V., and Dawson, D., “Smart Thermostat and Coolant Pump Control for Engine Thermal Management Systems,” SAE technical paper No. 2003–01–0272, 2003. Wambsganss, M., “Thermal Management Concepts for Higher–Efficiency Heavy Vehicle,” SAE technical paper No. 1999–01–2240, 1999. APPENDIX: Nomenclature List
srA secondary radiator frontal area [m2]
pac air specific heat [kJ/kg.ºK]
pcc coolant specific heat [kJ/kg.ºK]
poc oil specific heat [kJ/kg.ºK]
aC charge–air–cooler air–side capacity [kJ/ºK]
cC charge–air–cooler coolant–side capacity [kJ/ºK]
eC engine block capacity [kJ/ºK]
rC radiator capacity [kJ/ºK]
srC secondary radiator capacity [kJ/ºK]
tC transmission capacity [kJ/ºK]
srh secondary radiator forced heat transfer coefficient [kW/m2.ºK]
H normalized valve position [%]
ek positive control gain
tk positive control gain
am charge–air–cooler air mass flow rate [kg/sec]
arm radiator fan air mass flow rate [kg/sec]
asrm secondary radiator air mass flow rate [kg/sec]
cem engine pump coolant mass flow rate [kg/sec]
crm radiator coolant mass flow rate [kg/sec]
csrm secondary radiator coolant flow rate [kg/sec]
otm transmission pump oil mass flow rate [kg/sec]
sysP cooling system average power consumption [W]
aQ uncontrollable air flow radiator heat loss [kW]
eQ combustion process heat energy [kW]
rfQ secondary radiator heat loss due to primary radiator fan [kW]
srQ secondary radiator heat loss due to radiator fan and uncontrollable air flow [kW]
tQ transmission heat energy [kW]
es auxiliary signal
ts auxiliary signal sgn standard signum function t current time [sec]
For submission to IEEE/ASME Transactions on Mechatronics, June 2007
26
ot initial time [sec]
aiT air temperature at charge–air–cooler intlet [ºK]
aoT air temperature at charge–air–cooler outlet [ºK]
ciT coolant temp. at charge–air–cooler intlet [ºK]
coT coolant temp. at charge–air–cooler outlet [ºK]
eT coolant temperature at the engine outlet [ºK]
edT desired engine temperature [ºK]
HT liquid wax temperature [ºK]
LT wax softening temperature [ºK]
reT coolant temperature at radiator outlet [ºK]
rtT oil temperature at radiator oil outlet [ºK]
tT oil temperature at transmission outlet [ºK]
tdT desired transmission temperature [ºK]
T∞ surrounding ambient temperature [ºK]
T∆ desired engine temperature boundary layer [ºK]
eu control law for the engine dynamics
ru control law for the radiator dynamics
tu control law for the transmission dynamics
epV engine coolant pump applied voltage
ramV ram air velocity
rfV radiator fan applied voltage
tpV transmission oil pump applied voltage
eα positive control gain
tα positive control gain
cacε charge–air–cooler effectiveness [%]
rε radiator fan effectiveness [%]
eη engine temperature error [ºK]
eoη initial engine temperature error [ºK]
essη engine temperature steady–state error [ºK]
tη transmission temperature error [ºK]
toη initial transmission temperature error [ºK]
t ssη transmission temp. steady–state error [ºK]
eρ positive control gain
tρ positive control gain