Embed Size (px)
Citation preview
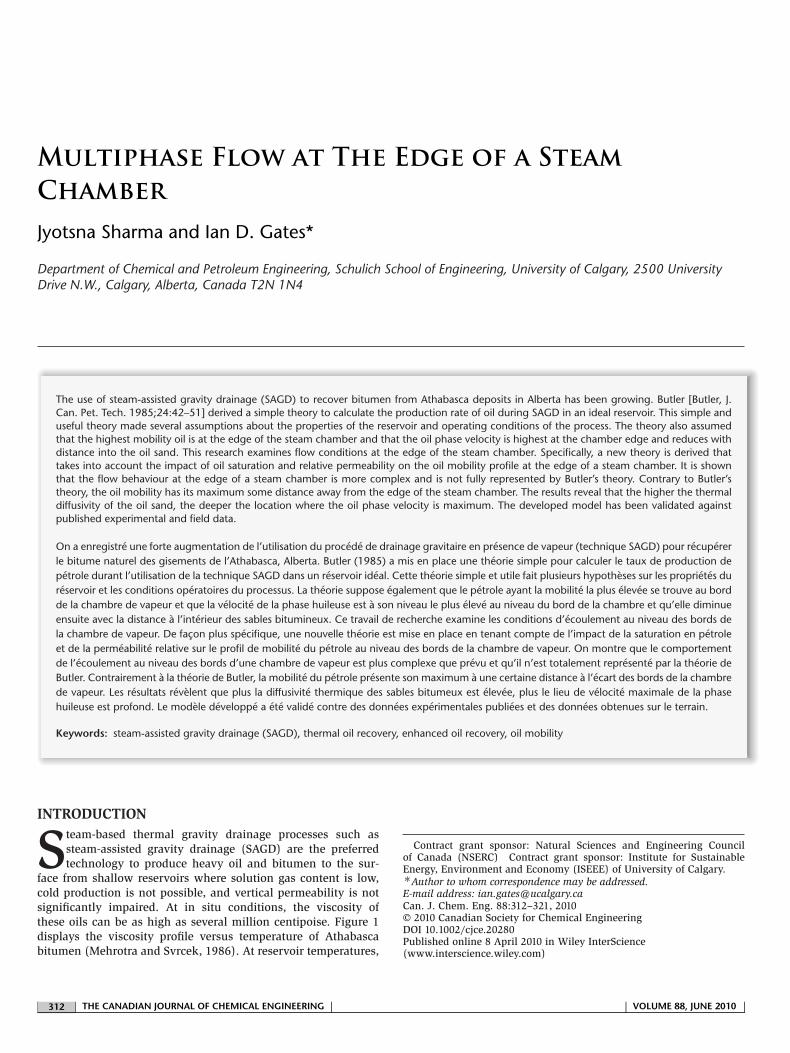
Multiphase Flow at The Edge of a SteamChamberJyotsna Sharma and Ian D. Gates*
Department of Chemical and Petroleum Engineering, Schulich School of Engineering, University of Calgary, 2500 UniversityDrive N.W., Calgary, Alberta, Canada T2N 1N4
The use of steam-assisted gravity drainage (SAGD) to recover bitumen from Athabasca deposits in Alberta has been growing. Butler [Butler, J.Can. Pet. Tech. 1985;24:42–51] derived a simple theory to calculate the production rate of oil during SAGD in an ideal reservoir. This simple anduseful theory made several assumptions about the properties of the reservoir and operating conditions of the process. The theory also assumedthat the highest mobility oil is at the edge of the steam chamber and that the oil phase velocity is highest at the chamber edge and reduces withdistance into the oil sand. This research examines flow conditions at the edge of the steam chamber. Specifically, a new theory is derived thattakes into account the impact of oil saturation and relative permeability on the oil mobility profile at the edge of a steam chamber. It is shownthat the flow behaviour at the edge of a steam chamber is more complex and is not fully represented by Butler’s theory. Contrary to Butler’stheory, the oil mobility has its maximum some distance away from the edge of the steam chamber. The results reveal that the higher the thermaldiffusivity of the oil sand, the deeper the location where the oil phase velocity is maximum. The developed model has been validated againstpublished experimental and field data.
On a enregistre une forte augmentation de l’utilisation du procede de drainage gravitaire en presence de vapeur (technique SAGD) pour recupererle bitume naturel des gisements de l’Athabasca, Alberta. Butler (1985) a mis en place une theorie simple pour calculer le taux de production depetrole durant l’utilisation de la technique SAGD dans un reservoir ideal. Cette theorie simple et utile fait plusieurs hypotheses sur les proprietes dureservoir et les conditions operatoires du processus. La theorie suppose egalement que le petrole ayant la mobilite la plus elevee se trouve au bordde la chambre de vapeur et que la velocite de la phase huileuse est a son niveau le plus eleve au niveau du bord de la chambre et qu’elle diminueensuite avec la distance a l’interieur des sables bitumineux. Ce travail de recherche examine les conditions d’ecoulement au niveau des bords dela chambre de vapeur. De facon plus specifique, une nouvelle theorie est mise en place en tenant compte de l’impact de la saturation en petroleet de la permeabilite relative sur le profil de mobilite du petrole au niveau des bords de la chambre de vapeur. On montre que le comportementde l’ecoulement au niveau des bords d’une chambre de vapeur est plus complexe que prevu et qu’il n’est totalement represente par la theorie deButler. Contrairement a la theorie de Butler, la mobilite du petrole presente son maximum a une certaine distance a l’ecart des bords de la chambrede vapeur. Les resultats revelent que plus la diffusivite thermique des sables bitumeux est elevee, plus le lieu de velocite maximale de la phasehuileuse est profond. Le modele developpe a ete valide contre des donnees experimentales publiees et des donnees obtenues sur le terrain.
Keywords: steam-assisted gravity drainage (SAGD), thermal oil recovery, enhanced oil recovery, oil mobility
INTRODUCTION
Steam-based thermal gravity drainage processes such assteam-assisted gravity drainage (SAGD) are the preferredtechnology to produce heavy oil and bitumen to the sur-
face from shallow reservoirs where solution gas content is low,cold production is not possible, and vertical permeability is notsignificantly impaired. At in situ conditions, the viscosity ofthese oils can be as high as several million centipoise. Figure 1displays the viscosity profile versus temperature of Athabascabitumen (Mehrotra and Svrcek, 1986). At reservoir temperatures,
Contract grant sponsor: Natural Sciences and Engineering Councilof Canada (NSERC) Contract grant sponsor: Institute for SustainableEnergy, Environment and Economy (ISEEE) of University of Calgary.∗Author to whom correspondence may be addressed.E-mail address: [email protected]. J. Chem. Eng. 88:312–321, 2010© 2010 Canadian Society for Chemical EngineeringDOI 10.1002/cjce.20280Published online 8 April 2010 in Wiley InterScience(www.interscience.wiley.com)
| 312 | THE CANADIAN JOURNAL OF CHEMICAL ENGINEERING | | VOLUME 88, JUNE 2010 |

1
10
100
1000
10000
100000
1000000
10000000
0 50 100 150 200 250 300
Temperature, deg C
Vis
cosi
tyµ,
cp
Figure 1. Effect of temperature on viscosity of Athabasca bitumen(Mehrotra and Svrcek, 1986).
usually between 7 and 15◦C, bitumen viscosity exceeds 1 mil-lion centipoise which means that it is practically immobile atoriginal reservoir conditions. However, upon heating bitumen toover 100◦C, its viscosity drops by several orders of magnitude andat higher temperatures above about 150◦C, it becomes mobileenough for sustained economic production under gravity drainageto a production wellbore. The two requirements of any thermalbitumen recovery technology are as follows: first, heat the oil sothat is sufficiently mobile and second, provide or allow a drivingforce to move the mobile oil into a production wellbore. For exam-ple, the driving force can be from an imposed pressure differenceor gravity drainage or solution–gas drive or combinations.SAGD was first conceptualised by Butler in Imperial Oil in the
late 1970s (Butler, 1985). In SAGD, two parallel wells, typicallybetween 500 and 1000m in length, are located in the reservoirone atop the other. The interwell vertical separation is typicallybetween 5 and 10m. Steam, injected into the topwell into a vapourchamber, convectively flows to cool oil sand at the edge of thechamber and releases its latent heat thus heating cool oil sands atthe edges of the chamber. The heated oil, now sufficiently mobile,flows together with steam condensate under the action of gravitydown the slope of the undisturbed oil sand towards the lower well.A liquid pool, a steam trap, surrounding and above the lower pro-duction well prevents injected steam from bypassing the reservoirand directly flowing out through the production well.The key physics of SAGD are relatively well established and sim-
ple theories to describe oil drainage rate and steam usage havebeen derived from first principles (Butler, 1985; Ferguson andButler, 1988; Reis, 1992, 1993; Butler, 1997; Akin, 2005). Thesetheories are similar and assume that the reservoir is homogeneousand that the steam depletion chamber is symmetric and two-dimensional (2D). Also, in these theories, the flow is essentiallyconsidered as a single oil phase at the edge of the steam chamber.Heat transfer ahead of a moving steam chamber is governed by
the convective-conduction heat transfer equation:
˛∂2T
∂�2− U ∂T
∂�= ∂T
∂t(1)
where � is the coordinate normal to the moving chamber edge;U, the interface velocity measured normal to the interface; ˛, thethermal diffusivity which is defined by ˛≡≡ kTH/�cP, where kTHand cP are the thermal conductivity and specific heat capacity ofthe oil sand, respectively. If the edge of a SAGD steam chamberis assumed to be in a quasi steady–state expansion, that is, it is
growing at constant rate in the direction normal to the chamberedge, and that heat transfer ahead of the edge is by conductiononly, then the temperature profile ahead of the interface is derivedfrom Equation (1) and is given by Butler (1997):
T − TrTs − Tr = e−((U�)/˛) (2)
where Ts and Tr are steam and initial reservoir temperatures,respectively. If we define a dimensionless temperature T* as:
T∗ = T − TrTs − Tr (3)
Equation (1) becomes:
T∗ = e−((U�)/˛) (4)
Butler’s analysis (1985) underlies all SAGD theories that havebeen published (Ferguson and Butler, 1988; Reis, 1992, 1993;Akin, 2005). Despite its simplicity, Butler’s theory identifies therelationship between oil production rate and reservoir and fluidphysical parameters such as permeability, mobile oil saturationrange, thermal diffusivity, oil viscosity dependence on tempera-ture, height of the reservoir, and density of the oil phase:
q = 2L
√2kg˛ �Soh
m�s(5)
where q is the bitumen production rate; L, the length of the pro-duction well; k, ˛, , �So, the permeability, thermal diffusivity,porosity, and mobile oil saturation range of the reservoir, respec-tively; m, constant used to reflect the dependence of viscosity ontemperature; and �s the kinematic viscosity of bitumen, definedas �/�, at the steam temperature. The dependence kinematic vis-cosity on temperature is given by the simple relation:
�s
�o=
(T − TsTs − Tr
)m
= (T∗)m (6)
The model was later revised by Butler and Stephens (1981) tomodel the chamber shape such that it remained attached to theproduction well. The oil production rate predicted by this revisedmodel, often referred to as the “Tandrain” model, is given by:
q = 2L
√1.5kg˛ �Soh
m�s(7)
For heavy crude oils and bitumen, the value of m is typicallybetween 3 and 4 (Butler, 1985). Butler’s model is based on a quasisteady–state approximation and treats the ideal homogeneousreservoir case where latent heat lost by steam occurs uniformlyalong a 2D, symmetric steam chamber–bitumen interface. Thequasi steady–state approximation assumes that the time-scaleof reservoir heating is similar to the time-scale of the steamchamber edge motion.In reality, the interface can be wavy across any cross-section of
the chamber perpendicular to the wellpair and also vary in shapeand size along the length of the wells due to reservoir hetero-geneity and non-uniform steam distribution along the injector andnon-uniform production of reservoir fluids along the productionwell. Other reasons that cause this departure from ideality are non-parallel wells, shale layers within the reservoir, and non-uniform
| VOLUME88, JUNE 2010 | | THE CANADIAN JOURNAL OF CHEMICAL ENGINEERING | 313 |

oil column thickness. Also, Butler’s theory does not encompassall of the physics of the flow at the interface. For example, it doesnot take relative permeability or geomechanics into account at thechamber edge. These missing physical phenomena, as well as theidealistic assumptions listed above such as homogeneous geolog-ical properties, limit the scope of physical understanding that canbe derived from these simple theories.Ferguson and Butler (1988) constructed a calculation proce-
dure to predict the impact of variable steam injection rates andpressures on SAGD. Their theory provides an improvement overButler’s theory because it could handle varying steam pressures.The resulting theory was developed in a numerical frameworkand required the solution of a differential equation that approx-imated heat transfer at the boundary of the steam chamber as aconstant temperature boundary layer at the edge of the chamber.Reis (1992) derived a steam-based gravity drainage theory
similar to Butler’s (1985) theory for horizontal wells. The steamchamber shape is assumed to be that of an inverted triangle.This shape has been observed in Hele–Shaw and sandpacklaboratory models (Chung and Butler, 1988) but thermocoupledata (Encana, 2007; CNRL, 2007; ConocoPhillips, 2008) fromfield operations and detailed simulations (Ito, 2001; Gates et al.,2005) suggests that the steam chamber is more elliptical incross-sectional shape. Reis (1992) derived a similar theory forsteam-based gravity drainage in radial geometry around verticalwells. The steam chamber is assumed to be an inverted cone andthe material and energy balance are used to determine a steamto oil ratio. Reis used his theory to demonstrate that vertical wellSAGD may have potential as a bitumen recovery process. The oildrainage rate predicted by Reis for a linear geometry is given by:
qbit = 2L
√kg˛ �Soh
2aR�sm(8)
where aR is an empirical constant equal to 0.4.Akin (2005) derived a steam-based gravity drainage theory
that accounted for steam distillation and asphaltene depositioneffects where the steam chamber shape is approximated as aninverted triangle. From his analysis, he concluded that at latetimes, steam–distillation and asphaltene deposition is the con-trolling feature of the process rather than steam chamber size andlateral heat transfer.In this research, multiphase flow at the boundary of a steam
drainage chamber is re-examined and a new theory is derivedwhich includes relative permeability effects. This new theory iscompared to Butler’s and other theories and its ability to predictdata from several existing SAGD operations.
SAGD TheoryEquations (1) and (3) can be combined to give the following rela-tionship between kinematic viscosity and distance beyond thesteam chamber:
�o = �s exp(mU�
˛
)(9)
For processes where heat transfer controls the viscosity of the oilphase, the key to understanding process dynamics results from anexamination of the viscosity profile that propagates beyond thechamber edge due to the temperature profile. Figure 2 displaysplots of the dimensionless temperature and dynamic viscosityprofiles calculated from Equations (1) and (9), respectively, for
0
0.1
0.2
0.3
0.4
0.5
0.6
0.7
0.8
0.9
1
0 2 4 6 8 10 12 14
Distance from Steam Chamber Edge, m
Dim
ensi
onle
ss T
empe
ratu
re, T
*
1
10
100
1000
10000
100000
1000000
10000000
Vis
cosi
tyµ,
cP
Figure 2. Temperature and bitumen viscosity profiles versus distancefrom the edge of the steam chamber.
Table 1. Typical parameters for Athabasca Reservoir (Ito, 2001)
Property Value
Tr (◦C) 10
Ts (◦C) 260
�o (kg/m3) 998
h (m) 20
L (m) 500
� 0.3
˛ (m2/s) 7 × 10⁻⁷
kabs (m2) 4 × 10⁻¹²
kro 0.20
Sio 0.84
Sor 0.14
Swc 0.16
�s (m2/s) 4.28 × 10⁻⁶
m 3
Dimensionless temperature coefficient (Reis), aR 0.4
Corey’s parameters
a 2
b 4
parameters typical of an Athabasca reservoir listed in Table 1.The results show that the heat transfer length scale over whichthe reservoir is significantly affected by heat conduction from thesteam chamber is about 8m which is similar to SAGD field dataand reservoir simulation data which suggests that the thermalboundary layer at the edge of a steam chamber is between 5 and10m thick (Ito, 1996; Birrell, 2001). At the edge of the chamber,the oil viscosity is low, less than 10 cP, whereas it rises to about10,000 cP at 8m distance from the chamber edge. This viscosity
| 314 | THE CANADIAN JOURNAL OF CHEMICAL ENGINEERING | | VOLUME 88, JUNE 2010 |

profile would suggest that the most mobile oil is that which is atthe chamber edge. However, this is not the case as shown in theOil Mobility Profile at the Edge of a Steam Chamber Section dueto relative permeability effects.
Oil Mobility Profile at the Edge of a Steam ChamberThe relative permeability of oil and water with respect to eachother can be determined from lab-based relative permeabilitymeasurements, which are often correlated in the form of theCorey’s equations:
krow = krocw(1 − SwD)a (10)
and
krw = krwro(SwD)b (11)
where krow is the relative permeability of oil with respect to water;krw, the relative permeability of water; and SwD, the normalisedwater saturation defined by:
SwD = Sw − Swc1 − Swc − Sor (12)
and krwro is the relative permeability of water at residual oil satu-ration and krocw is the oil phase relative permeability at irreduciblewater saturation. The exponents a and b are the Corey coefficientsand set the curvatures of the oil and water relative permeabil-ity curves, respectively. Typical values of Corey’s coefficients forAthabasca reservoirs are listed in Table 1.In steam-based gravity drainage processes, the controlling fac-
tor on oil phase movement in the reservoir is the oil phasemobility, �o, given by:
�o = krowk
�o�o(13)
The relative permeability, in turn, depends on the oil saturationwhich varies with the relative distance from the steam chamber.In the steam chamber, the oil saturation is low and approaches theresidual oil saturation, Sorw. In the flowing oil zone, it ranges fromthe residual oil saturation up to the original oil saturation of thereservoir. To first approximation, the oil saturation can be assumedto be linear with respect to temperature ahead of the steam cham-ber ranging from the residual oil saturation at the edge of thechamber to the initial reservoir oil saturation within the reser-voir. Thus, the oil saturation profile with respect to temperatureahead of the interface can be approximated as:
So = Sor + (Sio − Sor)(1 − T∗) (14)
By using Butler’s temperature–distance relationship ahead of thesteam chamber and assuming that conductive heat transfer dom-inates beyond the chamber edge, the saturation profile is thengiven by:
So = Sor + (Sio − Sor)(1 − e−(U/˛)�) (15)
Once the oil saturation is known, the oil relative permeabil-ity with respect to distance can be determined by substitutingEquation (15) in Corey’s equations:
krow = krocw(
So − Sor1 − Swc − Sor
)a
(1 − e−(U/˛)�)a (16)
0
5
10
15
20
25
30
35
0 2 4 6 8 10 12 14
Distance from Steam Chamber Edge, m
Oil
Phas
e M
obili
ty, m
D/c
P
Figure 3. Oil phase mobility profile versus distance from the edge of thesteam chamber.
The oil mobility as a function of distance is obtained by combiningEquations (13) and (16) to give:
�o = kkrocw
�o�s
(Sio − Sor
1 − Swc − Sor
)(1 − e−(U/˛)�)a(e−(U/˛)�)m (17)
The ratio of saturation differences in Equation (17) is equal tounity and can be removed from the equation (this will be done inthe derivations below). Figure 3 displays the oil mobility versusdistance for an Athabasca reservoir with properties listed in Table1. The plot reveals that the highest mobility does not occur at thesteam chamber edge but rather at a location beyond the edge ofthe steam chamber. The location for maximum oil mobility canbe found by differentiating Equation (17) with respect to distanceand setting the result equal to zero. The result is:
�max = ˛
Uln
(1 + a
m
)(18)
which reveals that the location of the highest oil phase mobilitydepends on the curvature of the oil phase relative permeabilitycurve, thermal diffusivity, viscosity coefficient m, and the lateralspreading speed of the steam chamber. Equation (18) implies thatthe faster the chamber growth, the shorter is the distance beyondthe chamber edge at which the maximum oil mobility is found.Figure 4 displays a surface plot demonstrating the affect of theviscosity parameter m and Corey coefficient a on the distance atwhich the oil mobility is maximum. The result shows that thelarger the viscosity coefficient and smaller the curvature of theoil relative permeability curve, the closer is the maximum to thesteam chamber edge. As shown by Butler (1985), the viscosityparameter m, is a measure of the change of the oil viscosity withrespect to temperature. The higher the value of m, the higherthe rate of change of the viscosity with respect to temperature atsteam temperature. Thus, Equation (18) reveals that the slowerthe ability of the oil viscosity to fall with heating, the farther thelocation of the maximum oil mobility is with respect to the edgeof the chamber.
Oil Flow Rate at the Edge of a Steam ChamberFollowing Butler, the flow of oil is determined by examining thematerial balance about a differential element located at the cham-ber interface as shown in Figure 5. The drainage rate of oil in thesmall element of thickness d� and length dz is given by Darcy’s
| VOLUME88, JUNE 2010 | | THE CANADIAN JOURNAL OF CHEMICAL ENGINEERING | 315 |

1 1.5 2 2.5 3 3.5 4 4.51
2
3
4
0
0.5
1
1.5
2
2.5L
ocat
ion
of M
axim
um O
il M
obili
ty, m
m
a
Figure 4. Surface plot of location of maximum oil mobility versusviscosity parameter m and Corey coefficient a.
law for gravity flow, that is:
d2q = −ko��gsin ��o
d�dz (19)
where g is the acceleration due to gravity and � is the local inclina-tion of the interface. Because �steam �o,��∼ �o. The oil mobilityis given by Equation (17), so then the oil phase velocity given bythe flow rate per unit area is then:
uoil = d2q
d�dz= kkrocwgsin �
�o�s(1 − e(−U/˛)�)a(e−(U/˛)�)m (20)
Figure 6 plots the oil flux versus distance which reveals that theflow behaviour at the edge of a steam chamber is complex and isnot simply a monotonic function with its maximum at the edgeof the steam chamber. It is clear that the oil flux profile resultingfrom Equation (20) exhibits zero oil phase velocity at the chamberedge where the oil saturation is at the residual saturation whichrises to a maximum at the location of maximum oil mobility andthen declines further into the oil sands because the oil viscosityis rising due to cooler temperature.
0.0
0.5
1.0
1.5
2.0
2.5
3.0
0 2 4 6 8 10 12 14
Distance from Steam Chamber Edge, m
Vol
umet
ric
Oil
Flux
, cm
/day
Figure 6. Volumetric oil flux versus distance from the edge of the steamchamber.
From a material balance around the differential element dis-played in Figure 5, the amount of oil flowing into the elementis equal to the sum of oil flowing out of the element and theaccumulation of oil volume within the element in time dt. If oildensity does not vary significantly, the mass balance around thedifferential slice becomes:
qz,�+d�dt = qz,�dt + (V |t+dt − V |t) (21)
where � corresponds to the direction tangential to the flow direc-tion along the chamber interface. The volume of bitumen inelement is given by:
V = �So�d�dz (22)
Substituting Equation (22) into Equation (21) and re-arranginggives:
∂qz
∂�= �So ∂�
∂tdz (23)
After substituting the values of effective permeability and viscos-ity into Equation (19), the result is:
d2q = kkrocwgsin ��s
(1 − e(−U/˛)�)a(e(−U/˛)�)md�dz (24)
Udt
Steam zone interface at time t
dy
Oil Flow
ξ
y
x dξ
Production Well
Steam / solvent chamber
Native bitumen
Bitumen flow zone
Injection Well
Steam zone interface at time t+dt
Figure 5. Cross-sectional view of the steam-assisted gravity drainage (SAGD) process and expanded view of section of steam chamber interfacecontaining differential element of the edge of the steam chamber.
| 316 | THE CANADIAN JOURNAL OF CHEMICAL ENGINEERING | | VOLUME 88, JUNE 2010 |

Integrating Equation (24) yields the flow rate across a 2D cross-section in the � direction:
q =L∫
z=0
kkrocw˛gsin ��sU
�(m)�(a + 1)�(m + a + 1)
dz (25)
where �(·) is the gamma function. From geometry considera-tions, U= ∂�/∂t= cos � ∂y/∂t= sin � ∂x/∂t and d�= dx/cos�. Aftersubstituting these relations into Equation (23), the result is:
U = cos � �So∂z
∂q
∂x(26)
which can be re-arranged to give:
U
sin �= cot � �So∂z
∂q
∂x= ∂q/∂y
�So∂z(27)
Substituting Equation (28) in Equation (26) gives:
q =L∫
z=0
˛kkrocwg �So
�s
�(m)�(a + 1)�(m + a + 1)
dydzdq
dz (28)
which can be integrated over the height of the chamber to give thetotal oil rate that flows down the side of the chamber of height, h:
q = 2L
√2˛kkrocwg �Soh�(m)�(a + 1)
�s�(m + a + 1)(29)
Equation (29) reveals that the volumetric oil flow rate as predictedby this new equation is different from Butler’s equation by a factorequal to:
√�(m + 1)�(a + 1)�(m + a + 1)
which is plotted in Figure 7 versus a and m for reservoir param-eters listed in Table 1. The results show that the factor can besignificantly less than unity for a wide range of the viscosityparameter m and Corey parameter a. This implies that Butler’sequation provides an optimistic estimate of the oil productionrate from SAGD. For typical Athabasca reservoirs, the viscosity
Figure 7. Surface plot of√
(�(m + 1)�(a + 1))/(�(m + a + 1)) (factorthat differentiates Butler’s theory and the theory derived here) versusviscosity parameter m and Corey coefficient a.
0
200
400
600
800
1000
1200
1400
0 2 4 6 8 10 12 14
Distance from Steam Chamber Edge, m
Oil
Phas
e M
obili
ty, m
D/c
P
Butler's model
Current work
Figure 8. Comparison of oil phase mobility values from Butler’s modeland current theory versus distance from the edge of the steam chamber.
0
10
20
30
40
50
60
70
80
90
0 2 4 6 8 10 12 14Distance from Steam Chamber Edge, m
Vol
umet
ric
Oil
Flux
, cm
/day
Butler's model
Current work
Figure 9. Comparison of volumetric oil flux values from Butler’s modeland current theory versus distance from the edge of the steam chamber.
parameter has value equal to about 4 and the Corey coefficientis typically between 3 and 4. The results in Figure 7 demonstratethat the oil production rate can be as low as 20% of that predictedfrom Butler’s formula.Figures 8 and 9 compare the oil phase mobility and oil flux ver-
sus distance for the new model and Butler’s formula, respectively.The results show that the oil mobility and oil flux profiles obtainedfrom the model derived here are significantly lower than that cal-culated from Butler’s model.From Equations (27) and (29), thehorizontal steam chamber speed is given by:
Ux = ∂x
∂t
∣∣∣∣y
=√�(m + 1)�(a + 1)�(m + a + 1)
√˛kkrocwg
2 �S�smh(30)
which is same as that calculated by Butler (1997) except thatit is discounted by the factor displayed in Figure 7. Thus, thelateral spreading rate of the steam chamber predicted by the the-ory derived here is significantly lower than that given by Butler’stheory.
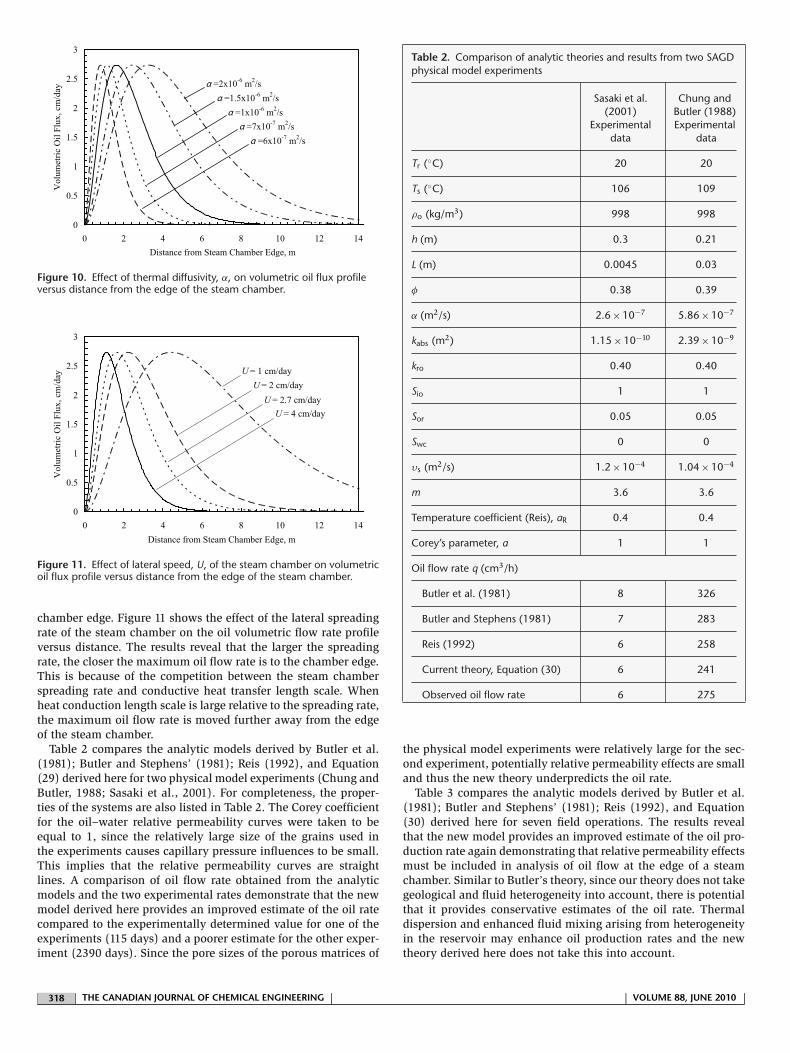
DISCUSSIONFigure 10 displays the oil volumetric flow rate profile versus dis-tance beyond the edge of the steam chamber at several thermaldiffusivities. The results show that the larger the thermal diffu-sivity, the further the peak value of the oil flow rate is from the
| VOLUME88, JUNE 2010 | | THE CANADIAN JOURNAL OF CHEMICAL ENGINEERING | 317 |
0
0.5
1
1.5
2
2.5
3
0 2 4 6 8 10 12 14
Distance from Steam Chamber Edge, m
Vol
umet
ric
Oil
Flux
, cm
/day
α =2x10⁻⁶ m2/s
α =1.5x10⁻⁶ m2/s
α =1x10⁻⁶ m2/s
α =7x10⁻⁷ m2/s
α =6x10⁻⁷ m2/s
Figure 10. Effect of thermal diffusivity, ˛, on volumetric oil flux profileversus distance from the edge of the steam chamber.
0
0.5
1
1.5
2
2.5
3
0 2 4 6 8 10 12 14
Distance from Steam Chamber Edge, m
Vol
umet
ric
Oil
Flux
, cm
/day
U = 1 cm/day
U = 2 cm/day
U = 2.7 cm/day
U = 4 cm/day
Figure 11. Effect of lateral speed, U, of the steam chamber on volumetricoil flux profile versus distance from the edge of the steam chamber.
chamber edge. Figure 11 shows the effect of the lateral spreadingrate of the steam chamber on the oil volumetric flow rate profileversus distance. The results reveal that the larger the spreadingrate, the closer the maximum oil flow rate is to the chamber edge.This is because of the competition between the steam chamberspreading rate and conductive heat transfer length scale. Whenheat conduction length scale is large relative to the spreading rate,the maximum oil flow rate is moved further away from the edgeof the steam chamber.Table 2 compares the analytic models derived by Butler et al.
(1981); Butler and Stephens’ (1981); Reis (1992), and Equation(29) derived here for two physical model experiments (Chung andButler, 1988; Sasaki et al., 2001). For completeness, the proper-ties of the systems are also listed in Table 2. The Corey coefficientfor the oil–water relative permeability curves were taken to beequal to 1, since the relatively large size of the grains used inthe experiments causes capillary pressure influences to be small.This implies that the relative permeability curves are straightlines. A comparison of oil flow rate obtained from the analyticmodels and the two experimental rates demonstrate that the newmodel derived here provides an improved estimate of the oil ratecompared to the experimentally determined value for one of theexperiments (115 days) and a poorer estimate for the other exper-iment (2390 days). Since the pore sizes of the porous matrices of
Table 2. Comparison of analytic theories and results from two SAGDphysical model experiments
Sasaki et al. Chung and(2001) Butler (1988)
Experimental Experimentaldata data
Tr (◦C) 20 20
Ts (◦C) 106 109
�o (kg/m3) 998 998
h (m) 0.3 0.21
L (m) 0.0045 0.03
� 0.38 0.39
˛ (m2/s) 2.6 × 10⁻⁷ 5.86 × 10⁻⁷
kabs (m2) 1.15 × 10⁻¹⁰ 2.39 × 10⁻⁹
kro 0.40 0.40
Sio 1 1
Sor 0.05 0.05
Swc 0 0
�s (m2/s) 1.2 × 10⁻⁴ 1.04 × 10⁻⁴
m 3.6 3.6
Temperature coefficient (Reis), aR 0.4 0.4
Corey’s parameter, a 1 1
Oil flow rate q (cm3/h)
Butler et al. (1981) 8 326
Butler and Stephens (1981) 7 283
Reis (1992) 6 258
Current theory, Equation (30) 6 241
Observed oil flow rate 6 275
the physical model experiments were relatively large for the sec-ond experiment, potentially relative permeability effects are smalland thus the new theory underpredicts the oil rate.Table 3 compares the analytic models derived by Butler et al.
(1981); Butler and Stephens’ (1981); Reis (1992), and Equation(30) derived here for seven field operations. The results revealthat the new model provides an improved estimate of the oil pro-duction rate again demonstrating that relative permeability effectsmust be included in analysis of oil flow at the edge of a steamchamber. Similar to Butler’s theory, since our theory does not takegeological and fluid heterogeneity into account, there is potentialthat it provides conservative estimates of the oil rate. Thermaldispersion and enhanced fluid mixing arising from heterogeneityin the reservoir may enhance oil production rates and the newtheory derived here does not take this into account.
| 318 | THE CANADIAN JOURNAL OF CHEMICAL ENGINEERING | | VOLUME 88, JUNE 2010 |
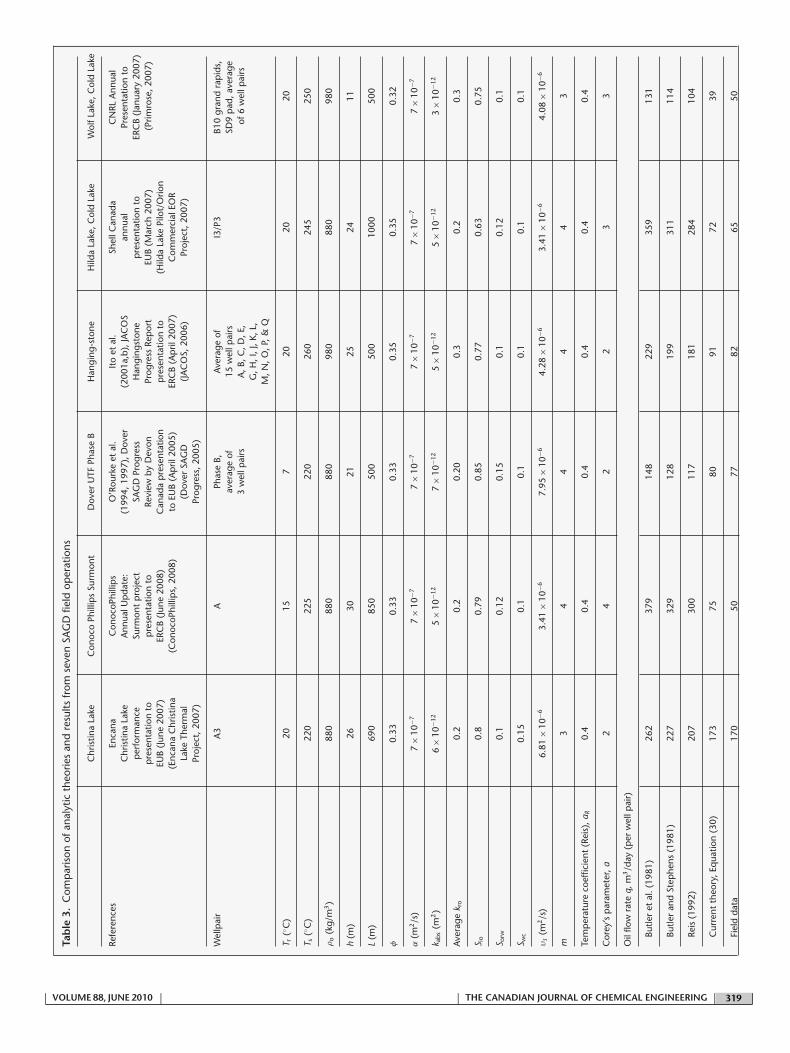
Table3.
Com
par
ison
ofan
alyt
icth
eorie
san
dre
sults
from
seve
nSA
GD
field
oper
atio
ns
Chr
istin
aLa
keC
onoc
oPh
illip
sSu
rmon
tD
over
UTF
Phas
eB
Han
ging
-sto
neH
ilda
Lake
,Col
dLa
keW
olfL
ake,
Col
dLa
ke
Refe
renc
esEn
cana
Con
ocoP
hilli
ps
O’R
ourk
eet
al.
Ito
etal
.Sh
ellC
anad
aC
NRL
Ann
ual
Chr
istin
aLa
keA
nnua
lUp
date
:(1
994,
1997
),D
over
(200
1a,b
),JA
CO
San
nual
Pres
enta
tion
top
erfo
rman
ceSu
rmon
tp
roje
ctSA
GD
Prog
ress
Han
ging
ston
ep
rese
ntat
ion
toER
CB
(Jan
uary
2007
)p
rese
ntat
ion
top
rese
ntat
ion
toRe
view
byD
evon
Prog
ress
Rep
ort
EUB
(Mar
ch20
07)
(Prim
rose
,200
7)EU
B(J
une
2007
)ER
CB
(Jun
e20
08)
Can
ada
pre
sent
atio
np
rese
ntat
ion
to(H
ilda
Lake
Pilo
t/O
rion
(Enc
ana
Chr
istin
a(C
onoc
oPhi
llip
s,20
08)
toEU
B(A
pril
2005
)ER
CB
(Ap
ril20
07)
Com
mer
cial
EOR
Lake
Ther
mal
(Dov
erSA
GD
(JA
CO
S,20
06)
Proj
ect,
2007
)Pr
ojec
t,20
07)
Prog
ress
,200
5)
Wel
lpai
rA
3A
Phas
eB,
Aver
age
ofI3
/P3
B10
gran
dra
pid
s,av
erag
eof
15w
ellp
airs
SD9
pad
,ave
rage
3w
ellp
airs
A,B
,C,D
,E,
of6
wel
lpai
rsG
,H,I
,J,K
,L,
M,N
,O,P
,&Q
T r(◦ C
)20
157
2020
20
T s(◦ C
)22
022
522
026
024
525
0
�o
(kg/
m3)
880
880
880
980
880
980
h(m
)26
3021
2524
11
L(m
)69
085
050
050
010
0050
0
�0.
330.
330.
330.
350.
350.
32
˛(m
2/s
)7
×10
−77
×10
−77
×10
−77
×10
−77
×10
−77
×10
−7
k abs
(m2)
6×
10−1
25
×10
−12
7×
10−1
25
×10
−12
5×
10−1
23
×10
−12
Aver
agek r
o0.
20.
20.
200.
30.
20.
3
S io
0.8
0.79
0.85
0.77
0.63
0.75
S orw
0.1
0.12
0.15
0.1
0.12
0.1
S wc
0.15
0.1
0.1
0.1
0.1
0.1
�s
(m2/s
)6.
81×
10−6
3.41
×10
−67.
95×
10−6
4.28
×10
−63.
41×
10−6
4.08
×10
−6
m3
44
44
3
Tem
per
atur
eco
effic
ient
(Rei
s),a
R0.
40.
40.
40.
40.
40.
4
Cor
ey’s
par
amet
er,a
24
22
33
Oil
flow
rateq,
m3/d
ay(p
erw
ellp
air)
Butle
ret
al.(
1981
)26
237
914
822
935
913
1
Butle
ran
dSt
ephe
ns(1
981)
227
329
128
199
311
114
Reis
(199
2)20
730
011
718
128
410
4
Cur
rent
theo
ry,E
qua
tion
(30)
173
7580
9172
39
Fiel
dda
ta17
050
7782
6550
| VOLUME88, JUNE 2010 | | THE CANADIAN JOURNAL OF CHEMICAL ENGINEERING | 319 |
CONCLUSIONSA newmodel for gravity drainage of mobilised bitumen at the edgeof a steam chamber is derived that includes relative permeabilityeffects. These effects are important but are missing from exist-ing analytical models based on Butler’s theory (1985). The newmodel reveals that the highest oil velocity is not at the steam–oilinterface but rather at some distance away from the interface,which depends on the curvature of the oil relative permeabilitycurve with respect to water and the rate of change of oil viscos-ity with temperature. The theory shows that the larger the lateralspreading rate of the steam chamber, the closer is the location ofthe maximum oil mobility and flow rate to the edge of the cham-ber. Also, the larger the thermal diffusivity, the further away thelocation of the maximum oil mobility and flow rate is from thesteam chamber edge. The theory reveals that the location of themaximum mobility is set by the balance between the spreadingrate and the conductive heat transfer into the oil sand at the edgeof the chamber. A comparison of the oil drainage theory derivedhere that includes relative permeability effects to Butler’s equationfor seven SAGD field operations reveals that relative permeabilityeffects should be included in the analysis. On the other hand, acomparison of the oil drainage theory that includes relative per-meability effects and Butler’s theory for two SAGD physical modelexperiments reveals that it provides improved oil rate estimates forone experiment but poorer for the other one. A potential reason forthis is because the pore sizes for the second experiment are largeimplying low relative permeability effects and thus the theoryunderestimates the oil rate. In summary, the results demonstratethat for actual oil sands (permeabilities between 3 and 7 days), thenew theory provides improved estimates of the oil rate which inturn implies that relative permeability effects must be accountedin oil sands gravity drainage theories.
NOMENCLATUREA area of the differential element in Figure 2 (m2)a, b Corey coefficients (dimensionless)aR temperature coefficient by Reis (dimensionless)cP volumetric heat capacity of oil sands (J/m3–◦C)g acceleration due to gravity (m/s2)h reservoir thickness (m)k absolute permeability of the reservoir (m2)kTH thermal conductivity (J/sm–◦C)krow relative permeability of oil with respect to water (dimen-
sionless)krocw relative permeability of oil at connate water saturation
(dimensionless)krw relative permeability of water (dimensionless)L length of the production well (m)m temperature viscosity parameter (dimensionless)q volumetric oil flow rate (m3/s)�So change in oil saturation from initial condition (dimension-
less)Swc connate water saturation (dimensionless)SwD normalised water saturation (dimensionless)So oil saturation (dimensionless)Sor residual oil saturation (dimensionless)Sio initial oil saturation (dimensionless)T temperature (◦C)Ts steam temperature (◦C)Tr initial reservoir temperature (◦C)T* dimensionless temperature (dimensionless)
t time (s)U chamber interface velocity measured normal to the cham-
ber edge (m/s)Ux interface velocity measured in the horizontal direction
(m/s)uoil volumetric oil flux at the chamber edge (m2/s)x distance measured in the horizontal direction (m)y distance measured in the vertical direction (m)z distance measured parallel to the well direction (m)
Greek Symbols˛ thermal diffusivity (m2/s) porosity (dimensionless)� distance measured parallel to the steam chamber interface,
L, m�o oil mobility (m3s/kg)�o dynamic viscosity of oil (kg/m s)�o kinematic viscosity of oil (m2/s)�s kinematic viscosity of oil at steam temperature (m2/s)� angle between the steam chamber edge and the horizontal
axis (degrees)�o density of oil at steam temperature (kg/m3)�steam density of steam (kg/m3)� distance measured from the steam edge in the direction
normal to it (m)�max distance to the location of maximum oil mobility from
chamber edge (m)
ACKNOWLEDGEMENTSThe author wishes to acknowledge the financial support from theNatural Sciences and Engineering Council of Canada (NSERC) andthe Institute for Sustainable Energy, Environment and Economy(ISEEE) of University of Calgary.
REFERENCESAkin, S., “Mathematical Modeling of Steam-Assisted Gravity
Drainage,” SPEREE 8(5), 372–376 (2005).Birrell, G. E., “Heat Transfer Ahead of SAGD Steam-Chamber, A
Study of Thermocouple Data From Phase B of theUnderground Test Facility (Dover Project),” Paper SPE 71503presented at the SPE Ann. Tech. Conf. and Exhib., NewOrleans, USA, September 30–October 3 (2001).
Butler, R. M., “A New Approach to the Modeling ofSteam-Assisted Gravity Drainage,” J. Can. Pet. Tech. 24(3),42–51 (1985).
Butler, R. M., “Thermal Recovery of Oil and Bitumen,”GravDrain Inc, Calgary, AB. (1997), ISBN 0-9682563-0-9.
Butler, R. M. and D. J. Stephens, “The Gravity Drainage ofSteam-heated Heavy Oil to Parallel Horizontal Wells,” J. Can.Pet. Tech. 20(2), 90–96 (1981).
Butler, R. M., G. S. McNab and H. Y. Lo, “Theoretical Studies onthe Gravity of Heavy Oil During Steam Heating,” Can. J.Chem. Eng. 59(4), 455–460 (1981).
Chung, K. H. and R. M. Butler, “Geometric Effect of SteamInjection on the Formation of Emulsions in theSteam-Assisted Gravity Drainage Process,” J. Can. Pet. Tech.27(1), 36–42 (1988).
ConocoPhillips Surmont SAGD9426 & 9460, “2007 In SiteProgress Reports—Performance Presentation to the ERCB,”Available at Website: www.ercb.ca, April (2008).
| 320 | THE CANADIAN JOURNAL OF CHEMICAL ENGINEERING | | VOLUME 88, JUNE 2010 |

Dover SAGD Progress, “Review by Devon Canada CorporationPresentation to ERCB,” April 28 (2005).
Encana Christina Lake Thermal Project, “2005 In-Situ Update,”Available at ERCB Website: www.ercb.ca (2007).
Ferguson, F. R. S. and R. M. Butler, “Steam Assisted GravityDrainage Model Incorporating Energy Recovery From aCooling Steam Chamber,” J. Can. Pet. Tech. 27(5), 75–83(1988).
Gates, I. D., J. Kenny, I. L. Hernandez-Hdez and G. L. Bunio,“Steam Injection Strategy and Energetics of Steam-AssistedGravity Drainage,” Paper SPE 97742 presented at the SPEInternational Thermal Operations and Heavy Oil Symposium,Calgary, AB, November 1–3 (2005).
Hilda Lake Pilot/Orion Commercial EOR Project, “Shell CanadaEnergy 2006 Annual Performance Review Presentation givento EUB,” March (2007).
Ito, Y. and S. Suzuki, “Numerical Simulation of the SAGDProcess in the Hangingstone Oil Sands Reservoir,” J. Can. Pet.Tech. 38(9), 27–35 (1996).
Ito, Y., M. Ichikawa and T. Hirata, “The Growth of the SteamChamber During the Early Period of the UTF Phase B andPhase I Projects,” J. Can. Pet. Tech. 40(9), 29–36 (2001a).
Ito, Y., T. Hirata and M. Ichikawa, “The Effect of OperatingPressure on the Growth of the Steam Chamber Detected at theHangingstone SAGD Project,” J. Can. Pet. Tech. 4(1), 47–53(2001b).
Athabasca JACOS Hangingstone SAGD 8788, “2006 In SituProgress Reports—Performance Presentation to the AlbertaEnergy Resources Conservation Board (ERCB),” Available atWebsite: www.ercb.ca, March (2006).
Mehrotra, A. K. and W. Y. Svrcek, “Viscosity of CompressedAthabasca Bitumen,” Can. J. Chem. Eng. 64(5), 844–847(1986).
O’Rourke, J. C., A. G. Begley, H. A. Boyle, C. T. Yee, J. I.Chambers and R. W. Luhning, “UTF Project Status UpdateMay1997,” 48th CIM SPE ATCE, Calgary, AB, 8–11 June(1997).
O’Rourke, J. C., J. I. Chambers, J. C. Suggett and W. K. Good,“UTF [Underground Test Facility] Project Status andCommercial Potential—An Update,” May 1994. 45th Ann.CIM SPE ATCE Technology Meeting, Calgary, AB, 12–15 JuneCIM/AOSTRA 94-40S1994 (1994).
Primrose, “Wolf Lake and Burnt Lake: Annual Presentation tothe EUB by Canadian Natural Resource Limited (CNRL)January 9 and 10 addenda,” (2007).
Reis, J. C., “A steam-Assisted Gravity Drainage Model for TarSands: Linear Geometry,” J. Can. Pet. Tech. 31(10), 14–20(1992).
Reis, J. C., “A Steam-Assisted Gravity Drainage Model for TarSands: Radial Geometry,” J. Can. Pet. Tech. 32(8), 43–48(1993).
Sasaki, K., S. Akibayashi, N. Yazawa, Q. T. Doan and S. M.Farouq Ali, “Experimental Modeling of the SAGDProcess-Enhancing SAGD Performance With PeriodicStimulation of the Horizontal Producer,” SPEJ 6(1), 89–97(2001).
Manuscript received January 21, 2009; revised manuscriptreceived October 8, 2009; accepted for publication October 13,2009.
| VOLUME88, JUNE 2010 | | THE CANADIAN JOURNAL OF CHEMICAL ENGINEERING | 321 |