Embed Size (px)
Citation preview

Multiobjective Optimization of an Industrial Ethylene ReactorUsing a Nondominated Sorting Genetic Algorithm
Abhijit Tarafder, Bennett C. S. Lee, Ajay K. Ray, and G. P. Rangaiah*
Department of Chemical and Biomolecular Engineering, National University of Singapore,10 Kent Ridge Crescent, Singapore 119206, Singapore
Ethylene is produced in the largest volume among the monomers, and hence, any improvementin its production process can bring important benefits to both industry and consumers. In thepresent paper, an industrial ethylene reactor has been studied with a multiobjective optimizationtechnique to find a scope for further improvements and to detect a range of optimal solutions.An industrial reactor unit using ethane as the feedstock was modeled, assuming a detailed free-radical mechanism for the reaction kinetics coupled with material, energy, and momentumbalances of the reactant-product flow along the reactor. To carry out the multiobjectiveoptimization for two and three objectives, the elitist nondominated sorting genetic algorithm,or NSGA-II, was chosen. Instead of a single optimum as in traditional optimization, a broadrange of optimal design and operating conditions depicting tradeoffs of key performanceparameters such as conversion, selectivity and ethylene flow rate was successfully obtained.The effects of design and operating variables on the optimal solutions are discussed in detail,and the generated results are compared with industrial data.
1. Introduction
Ethylene monomer is one of the base petrochemicalsthat form the building blocks of the petrochemicalindustry and is produced in the largest volume amongthem. In 2001, the global production of ethyleneamounted to 90.4 million metric tons, valued at anestimated $60 billion (in U.S. dollars),1 and by 2005, theannual global production will reach 104 million metrictons, with an estimated growth rate of 4% per year.2The bulk of ethylene produced is used in the productionof plastics, primarily polyethylene. Moreover, it is anideal base material for many other petrochemicals, asit is readily available at low cost and high purity andusually reacts with other low-cost materials, such asoxygen and water. From the above data, it can beperceived that even a small improvement in the pro-cessing of ethylene has the potential of bringing a high-dividend to the petrochemical industry. This paperpresents a multiobjective optimization study carried outto find a range of better operating conditions forimproving the performance of ethylene production unitsbased on ethane feed. This is perhaps the first studyon multiobjective optimization of an ethylene reactor.The rest of this section briefly reviews ethylene produc-tion; modeling of an ethylene reactor; and multiobjectiveoptimization, including the methods used in this study.
Ethylene Production. Ethylene is usually producedthrough the steam cracking of feedstocks such asethane, naphtha, or gas oil.3 The choice of feedstock isan important economic decision as it influences othercosts as well. Subject to availability, ethane is probablythe best feedstock, as it has higher yield and selectivityof ethylene than heavier feedstocks and its processingis relatively simple, involving lower capital costs. Steamcracking is an endothermic process leading to thebreaking up of large molecules into smaller ones. The
cracking process is carried out in long tubular reactors,known as radiant tubes, which are placed vertically ina large, rectangular gas-fired furnace.4 The furnaceconsists of convection and radiation sections (Figure 1),where the feedstock first enters the convection sectionso that the hot stack gas preheats the feed before itenters the radiation section. Typical inlet temperaturesto the radiant tube range from 500 to 800 °C.4 At anintermediate point in the convection section, steam isintroduced and is preheated together with the feedstock.Steam lowers the partial pressure of high-molecular-mass aromatics, reducing condensation reactions; inaddition, it contributes to the partial removal of cokein the tubes. The radiant coil is directly heated by theburners, leading the process gas to the cracking tem-perature, which ranges from 700 to 900 °C. The tem-perature at the outlet of the radiant coil typically rangesfrom 775 to 885 °C.3 The reactor effluent is quicklyquenched to prevent further reaction; compressed; andsent to a separation unit for the recovery of ethyleneand other products such as methane, ethane, propane,propylene, butylenes, and pyrolysis gasoline.
* To whom correspondence should be addressed. Tel.: (65)68742187. Fax: (65) 67791936. E-mail: [email protected].
Figure 1. Simplified sketch of a typical furnace for the steamcracking of hydrocarbons.
124 Ind. Eng. Chem. Res. 2005, 44, 124-141
10.1021/ie049953m CCC: $30.25 © 2005 American Chemical SocietyPublished on Web 12/03/2004
Reaction Mechanism and Modeling of SteamCracker. The reaction mechanism of steam crackingof hydrocarbons to form ethylene can be formulated indifferent ways, namely, according to overall, molecular,and free-radical mechanisms, of which the last is themost detailed and perhaps the most accurate.4 Fromentet al.5,6 proposed molecular schemes approximating thefree-radical nature of ethane cracking, where kineticparameters were estimated on the basis of pilot-plantdata. These models are easier to solve because they leadto a set of nonstiff differential equations, whereas thefree-radical mechanism leads to stiff differential equa-tions that are difficult to solve.7 Sundaram and Fro-ment8 developed a free-radical scheme for ethane crack-ing, where 49 reactions were proposed and productsheavier than C5H10, whose yields are usually very small,were lumped together as the single component C5+ tosimplify the reaction scheme. Kinetic parameters weremainly obtained through trial and error and by fittingpilot-plant data. Other free-radical schemes have alsobeen proposed by several authors, using fewer reac-tions.9,10 Rangaiah et al.11 evaluated several reactionschemes for ethane cracking, including the molecular6
and the free-radical schemes8 by Froment and his group,and concluded that the free-radical mechanism ofSundaram and Froment8 provides more accurate pre-dictions.
Modeling the ethylene reactor, including the steamcracking reactions, can be very complex; however,certain assumptions simplify the task. The mass flowinside the reactor, which has a large length-to-diameterratio and a high fluid velocity,12 can be taken as plugflow. The heat transfer from the furnace gases to thecracking reactor can be represented by a heat-fluxprofile, thus uncoupling the reactions and thermalphenomena occurring inside the tubes from those oc-curring outside. Froment et al.5 successfully simulateda steam cracker to study the cracking of ethane andethane-propane mixtures. By using an independentlysimulated heat-flux profile, a good agreement withindustrial data was achieved. A one-dimensional modelwas used for the mass, momentum, and heat-transferequations, as high turbulence in the reactor tubes wouldeffectively cancel out any flow profile over the crosssection.13 The external heat-flux profile is an importantfactor in the cracking reaction, and there are successfulmodels of the mechanism14,15 investigating the effectsof different firing patterns on the reaction temperatureand product distribution. However, it was argued that,to predict solely the effluent yield, an accurate heat-flux profile is not crucial.16
Multiobjective Optimization. The real-life optimi-zation problems faced in industry usually deal withmore than one competing objective. Traditionally, solv-ing such problems involves taking a weighted averageof all of the objectives and treating it as a single-objective optimization problem. However, the solutionthen depends on the chosen weights, which, in turn, aresubject to individual perception and knowledge of theprocess. This is quite arbitrary, and a deficiency isalways inherent in this method.17 The best way to solveand represent the solution of a multiobjective optimiza-tion problem is through the generation of a Pareto-optimal set,18 which provides a spectrum of tradeoffs ofthe competing objectives. All of the solutions in a Pareto-optimal set are equally good, i.e., none of them is betterthan the others in the set unless another criterion is
supplied to compare them. A Pareto-optimal set providesa wide range of design and operational options todesigners and practitioners and, hence, enhances thepossibility of finding more efficient processes. Popula-tion-based algorithms, such as genetic algorithms (GAs),have the capability of finding a Pareto-optimal set in asingle run with only a marginal increase in the com-putational time.
GA is a search technique based on the workingprinciples of genetics and natural selection; it employsa population-based approach whereby the search for asolution is performed with a group of estimated solu-tions rather than a single one. Starting with a set ofrandomly generated initial estimates of independentvariables, also called decision variables, GA tries toreach the solution with the help of special operators.Each iteration is called a generation in which new valuesof independent variables are found through specialoperations, namely, reproduction, crossover, and muta-tion, on their old values. This is done in an attempt toproduce more desirable objective values until a preas-signed number of generations is computed. Based on thefundamentals of GA, Srinivas and Deb18 developed thenondominated sorting genetic algorithm (NSGA) to findthe Pareto-optimal set of solutions for solving multiob-jective optimization problems. Nondomination refers toa solution being better in at least one objective than anyother solution in the population. The concept of non-domination, first introduced by Goldberg,19 is necessaryto assign a fitness value to each solution that ultimatelydetermines its place in the Pareto-optimal set.
Although NSGA has been successfully applied tomany multiobjective optimization problems,20-23 Deb etal.24 reported that its computational complexity can bedramatically reduced, and by applying elitism, a methodof preserving good solutions, its performance can be stillincreased. This revision in NSGA resulted in anotheralgorithm, which they named elitist NSGA or NSGA-II. Deb et al.24 showed that NSGA-II is able to achievebetter convergence near the true Pareto-optimal frontand find a much better spread of Pareto-optimal solu-tions. GA operators, designed to be applied to binarynumbers, require binary coding for the real values ofdecision variables. However, it was noted25 that repre-senting real numbers with binary coding leads to anumber of difficulties such as the finite-length binarystrings are unable to achieve high precision in thedecision variables. Moreover, in some strings, a transi-tion to a neighboring point requires the alteration ofmany bits, which, in turn, hinders the gradual searchin the continuous search space. This is also known asthe Hamming cliff problem. To counter these problems,genetic operators that are capable of operating directlyon real numbers have been proposed. The simulatedbinary crossover (SBX) operator proposed by Deb andAgrawal25 is a successful example. The present authorsnoted that the SBX operator, which actually mimics theoperation of binary crossover, is able to perform as goodas or even better than binary-coded GAs.26 This real-coded operator was also incorporated in NSGA-II.24
Although binary-coded NSGA-II has been satisfactorilyused by other workers in optimizing chemical pro-cesses,27,28 the present study employs real-coded NSGA-II (with the SBX operator) for better results. Theauthors could find only one contemporary work employ-ing real-coded NSGA-II for a multiobjective optimizationstudy on an epoxy polymerization reactor;29 better
Ind. Eng. Chem. Res., Vol. 44, No. 1, 2005 125
results were also obtained in this case with real-codedover binary-coded NSGA-II.
2. Modeling and Sensitivity Analysis of theSteam Cracker
In the present study, the industrial steam crackerdescribed by Froment et al.5 is used as the basis forsimulation and optimization of an ethylene reactor formultiple objectives. A multiobjective optimization studywith NSGA-II requires execution of the steam crackermodel for each member of its population over a certainnumber of generations. Because the number of popula-tion typically ranges from 50 to 100 and the number ofgenerations needed to find a reasonably good Pareto canbe more than 200, a typical study involves computationof the steam cracker model 10 000-20 000 times. Sucha huge computational load makes the molecular schemeof cracking reactions look more attractive, as it resultsin nonstiff differential equations and hence requireslower computational times, although obtained in atradeoff with prediction accuracy. For the current study,however, the free-radical mechanism proposed bySundaram and Froment8 was ultimately chosen forreactor modeling. It was perceived that, with the presentpowerful personal computers, the time penalty can bebrought down to a more acceptable level rather thansettling for a lower accuracy. The selected free-radicalmechanism for ethane cracking consists of 49 reactionswith 11 molecular species and 9 free radicals. Detailsof this scheme can be obtained from the literature,8where it was assumed that the reactions are elementaryand therefore the order of each reaction corresponds toits molecularity. The molecular and free-radical speciesand the governing equations of the steam cracker model,including the material, energy, and momentum bal-ances, are listed in Appendix A. The model was vali-dated by comparison with industrial data, as shown inTable A3.
Sensitivity Analysis of the Steam Cracker. Asensitivity analysis was performed with the steamcracker model to note the effects of some key variables,which were identified as the decision variables in thesubsequent optimization study on the reactor perfor-mance. The variables are the temperature (Tin) andpressure (Pin) of the ethane-steam mixture at the inletto the radiation section; the coefficients of the heat-fluxprofile, R, â, and γ in eq A13, that control the rate ofheat input to the cracking reactions; the steam-to-ethane (mass) ratio (SR); the ethane flow rate (Fin) tothe reactor; the number of tubes (ntubes) defining thereactor length; and the inner diameter of the reactortubes (din). The values of each of these variables werevaried within a preassigned domain, while the otherswere kept constant, to note the effects of variation onsome calculated quantities that show the reactor per-formance. These quantities are the conversion (X) ofethane, the selectivity of ethylene (SC2H4), and the massflow rate of ethylene (fC2H4) at the reactor exit, whichtogether define the extent and the quality of reactionprocess. The ethane conversion and ethylene selectivitywere defined as
It is known that any reaction is ultimately controlledby the residence time, temperature, and pressure in thereactor. Hence, the three additional variables residencetime, average reaction temperature, and average reac-tion pressure were calculated along with the perfor-mance variables to develop a clearer understanding ofthe effects of the decision variables. These three vari-ables were calculated in the following way
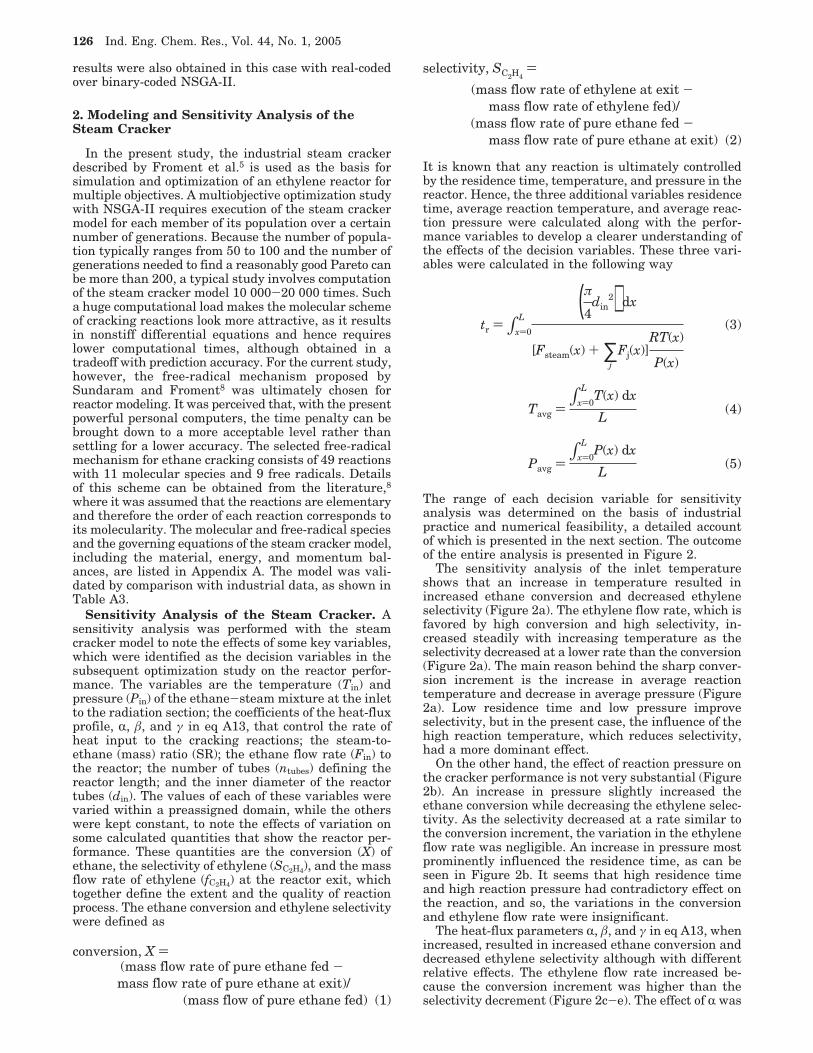
The range of each decision variable for sensitivityanalysis was determined on the basis of industrialpractice and numerical feasibility, a detailed accountof which is presented in the next section. The outcomeof the entire analysis is presented in Figure 2.
The sensitivity analysis of the inlet temperatureshows that an increase in temperature resulted inincreased ethane conversion and decreased ethyleneselectivity (Figure 2a). The ethylene flow rate, which isfavored by high conversion and high selectivity, in-creased steadily with increasing temperature as theselectivity decreased at a lower rate than the conversion(Figure 2a). The main reason behind the sharp conver-sion increment is the increase in average reactiontemperature and decrease in average pressure (Figure2a). Low residence time and low pressure improveselectivity, but in the present case, the influence of thehigh reaction temperature, which reduces selectivity,had a more dominant effect.
On the other hand, the effect of reaction pressure onthe cracker performance is not very substantial (Figure2b). An increase in pressure slightly increased theethane conversion while decreasing the ethylene selec-tivity. As the selectivity decreased at a rate similar tothe conversion increment, the variation in the ethyleneflow rate was negligible. An increase in pressure mostprominently influenced the residence time, as can beseen in Figure 2b. It seems that high residence timeand high reaction pressure had contradictory effect onthe reaction, and so, the variations in the conversionand ethylene flow rate were insignificant.
The heat-flux parameters R, â, and γ in eq A13, whenincreased, resulted in increased ethane conversion anddecreased ethylene selectivity although with differentrelative effects. The ethylene flow rate increased be-cause the conversion increment was higher than theselectivity decrement (Figure 2c-e). The effect of R was
conversion, X )(mass flow rate of pure ethane fed -mass flow rate of pure ethane at exit)/
(mass flow of pure ethane fed) (1)
selectivity, SC2H4)
(mass flow rate of ethylene at exit -mass flow rate of ethylene fed)/
(mass flow rate of pure ethane fed -mass flow rate of pure ethane at exit) (2)
tr ) ∫x)0
L(π
4din
2) dx
[Fsteam(x) + ∑j
Fj(x)]RT(x)
P(x)
(3)
Tavg )∫x)0
LT(x) dx
L(4)
Pavg )∫x)0
LP(x) dx
L(5)
126 Ind. Eng. Chem. Res., Vol. 44, No. 1, 2005
the most prominent among the three parameters. As Rincreased, the reaction temperature increased sharply,and the residence time decreased. However, as theinfluence of reaction temperature increment was moredominant than that of the residence time decrement,the net conversion increased substantially.
Steam reduces the reaction pressure in two ways: byacting as a diluent, it decreases the partial pressuresof the reactants, and by increasing the overall flow ratethrough the reactor, it increases the total pressure dropas well. Consequently, as the SR increased, the conver-sion decreased, and the selectivity increased slightly(Figure 2f), resulting in a marginal decrease of theethylene flow rate. The net residence time decreased,as the net flow rate through the reactor increased andthe reactor dimensions remained the same. Decreasesin the residence time and the reaction pressure coun-
teracted each other and resulted in little or insignificantvariation of the conversion and ethylene flow ratevalues.
Increasing the ethane feed rate sharply decreased theconversion (Figure 2g) while increasing the selectivity.The main reason for the former is the sharp decreasein residence time as flow rate increased. The rise inselectivity resulted from the decreased reaction tem-perature, reaction pressure, and residence time. Theethylene flow rate increased initially because of theinitial sharp rise of selectivity; however, it graduallystopped increasing and ultimately decreased because ofthe sharp fall in ethane conversion.
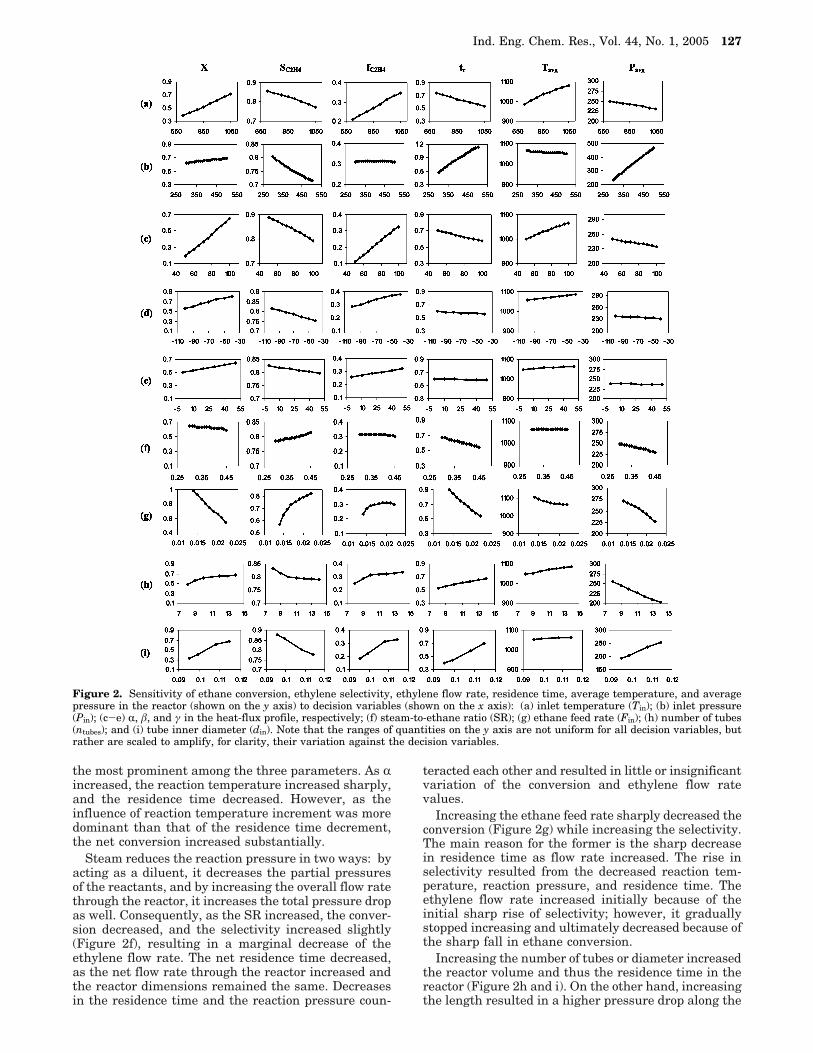
Increasing the number of tubes or diameter increasedthe reactor volume and thus the residence time in thereactor (Figure 2h and i). On the other hand, increasingthe length resulted in a higher pressure drop along the
Figure 2. Sensitivity of ethane conversion, ethylene selectivity, ethylene flow rate, residence time, average temperature, and averagepressure in the reactor (shown on the y axis) to decision variables (shown on the x axis): (a) inlet temperature (Tin); (b) inlet pressure(Pin); (c-e) R, â, and γ in the heat-flux profile, respectively; (f) steam-to-ethane ratio (SR); (g) ethane feed rate (Fin); (h) number of tubes(ntubes); and (i) tube inner diameter (din). Note that the ranges of quantities on the y axis are not uniform for all decision variables, butrather are scaled to amplify, for clarity, their variation against the decision variables.
Ind. Eng. Chem. Res., Vol. 44, No. 1, 2005 127
reactor, whereas increasing the diameter resulted in alower pressure drop. The reaction temperature stayedalmost invariant when the diameter was increased,whereas it increased when the number of tubes wasincreased, mainly because of the higher increase in theheat-transfer area. As the number of tubes and diameterincreased, higher conversion and lower selectivity valueswere noted because of the increased residence time andreaction temperature. However, the decrease in pres-sure as the number of tubes was increased moderatedthe rate of change of the conversion and selectivity,whereas for the diameter increase, the variations ofconversion and selectivity were monotonic.
3. Formulation of the Optimization Problem
For the optimization study of an ethane cracker unit,the objectives depend on production preferences, whichare often based on profit. As the profit calculationencompasses several factors, viz., demand and pricesthat fluctuate with time and location, downstreamprocessing costs, etc., this study selected objectives thatincrease the scope of making profit rather than maxi-mizing the profit itself. From the reaction point of view,the most pertinent objectives are to maximize theethylene production and minimize the production of sideproducts. Therefore, the conversion of ethane, selectivityof ethylene, and flow rate of ethylene were chosen asthe objectives. In the sensitivity analysis section, it wasobserved that the conversion and selectivity vary inopposite directions, whereas the ethylene flow ratedepends on conversion and selectivity. Hence, initially,the conversion of ethane and selectivity of ethylene werechosen as the objectives, so that a nondominated set ofsolutions could be obtained from a multiobjective opti-mization. Subsequently, other objectives were consid-ered.
Accordingly, the optimization problem was formulatedto maximize
and
The variables, which prominently affect the reactorperformance and can be adjusted in an industrialreactor system, were chosen as the decision variables.In the sensitivity analysis section, the effects of thesevariables on the objectives are discussed in detail.Following are the decision variables and the ranges used
Among the decision variables, the first seven arecontinuous, whereas the last two (number of tubes andtube inner diameter) are discrete. For representationof the former, real coding option in NSGA-II was used,whereas for the two discrete variables, binary codingoption with 3- and 2-bit sizes, respectively, was em-ployed.
Bounds on the inlet temperature were selected ac-cording to industrial practice. A low inlet temperatureindicates inefficiency in the convection section of thefirebox, leaving the heating of reactants to reactiontemperature to the radiation section. On the other hand,a high inlet temperature can result the designed reac-tion temperature in the radiation section being exceededcausing failure of the radiant coils. The upper limit onpressure depends on the upper limit on temperature andthe degree of degradation of the cracking pattern causedby increasing pressure.3 A higher pressure tends todecrease the yield of ethylene and also increases the rateof coking, both of which are undesirable. The lowerbound, on the other hand, is limited by the suctionpressure of the cracked-gas compressor after the quench-ing section, which should not fall below atmosphericpressure to avoid any oxygen in-leak.3 Bounds on theheat-flux parameters (in eq A13) were chosen to allowmaximum flexibility in the heat-flux profile. R is basi-cally the heat flux at the beginning of the coil, and itslimits were determined by the usual range of heat fluxin a firebox, which is 54-96 kW/m2,7 whereas thebounds on â were chosen to complement R, and thebounds on γ were chosen to complement â. The valuesof â and γ were chosen to form a monotonically decreas-ing function. For the steam-to-ethane ratio (SR) and theethane feed flow rate, the industrially employed valueswere used as the means for their ranges.
A typical ethylene reactor is formed of several straighttubes connected in series with suitable bends to form along coil. In the present study, one tube in ntubes includesa straight portion and a bend to facilitate a realisticenhancement of the reactor length. The length of eachsuch tube (including bend) was taken as 9.5 m, and thenumber of tubes was varied from 8 to 15 in theoptimization. The reactor length was thus varied from76.0 to 142.5 m in steps of 9.5 m. The inside diameterwas also varied discretely as only tubes of specificdiameters are commercially available. In the presentstudy, diameters of 0.0953, 0.0991, 0.1080, and 0.1143m were taken as the options. Limiting values of boththe number and the diameter of tubes were framedfollowing industrial practice.7
Realistic constraints should be included in any opti-mization study. The following constraints were used inthe present study
The constraints were formulated in accordance with
J1 ) X (6)
J2 ) SC2H4(7)
700 e Tin e 1100 K (8)
290 e Pin e 500 kPa (9)
50 e R e 100 kW/m2 (10)
-100 e â e 0 kW/m2 (11)
0 e γ e 50 kW/m2 (12)
0.3 e SR e 0.5 (13)
0.01 e Fin e 0.025 kmol/s (14)
ntubes ) 8, 9, 10, ..., 15 (15)
din ) 0.0953, 0.0991, 0.1080, and 0.1143 m (16)
T e 1300 K (17)P g 120 kPa (18)
2γ e -â (19)
q g 40 kW/m2 (20)
128 Ind. Eng. Chem. Res., Vol. 44, No. 1, 2005
industrial practice. The upper limit of the reactiontemperature is bound by the metallurgy of the radiantcoil, which is designed to operate at 1250-1300 K wheninternally clean. If the temperature exceeds 1300 K, thecoil can rupture without warning, so the upper limit oftemperature at any point along the reactor length wasfixed at 1300 K. The outlet pressure constraint wasguided by the suction pressure of the cracked-gascompressor. Because the cracked gas has to go througha transfer line exchanger (TLE) for quenching aftercoming out of the reactor, which involves an additionalpressure drop, the outlet pressure of the reactor waslimited to 120 kPa. As mentioned earlier, the heat-fluxprofile is closely linked to the rate of coking, and theprofile should be a decreasing function so that the heatinput does not increase near the end of the coil andaccelerate coking. The relation between â and γ in eq19 ensures a heat flux that decreases with length. Thebound on the lowest heat flux to the radiant coil (eq 20)was made to generate a realistic heat flux in theradiation section. The NSGA-II algorithm used in thepresent study employs a tournament-selection-basedconstrained nondominated sorting method for handlingconstraints.
Input Data for NSGA-II. The selected optimizationroutine, NSGA-II, for the multiobjective optimization isbased on solving a minimization problem. Because thepresent purpose was to maximize the objective func-tions, the maximization problem was transformed to aminimization one as follows
and
The constraints were normalized as well, to keep theconstraint violations within the range [-1, 0], for afairer comparison of constraint violations for the indi-vidual objectives. The normalized constraints are asfollows
As with many optimization methods, NSGA-II requiresa set of parameters to carry out the optimization. A seedfor random number generations (Rs) is required, asNSGA-II is a stochastic process. A crossover probability(pc) and a mutation probability (pm or pm,b), whichdetermine whether the crossover and mutation opera-tion will be performed, are two other parameters thathave to be supplied. The real-coded NSGA-II requirestwo more parameters, the distribution index for thesimulated crossover operation (ηc) and the distributionindex for the simulated mutation operation (ηm). Bothof these values are used to define probability distribu-tions, which ultimately determine the location of the
resulting or child solution with respect to the parentsolutions. Detailed descriptions of all of these param-eters and real-coded NSGA-II are available in ref 25.All optimization studies were carried out with a popula-tion size of 50 and for 200 generations. The averagecomputational time taken for each study was 3 h and40 min, on a 2.4-GHz P4 computer with 512 MB ofSDRAM.
4. Results and Discussion
In the preceding section, the objectives, decisionvariables, and constraints used in the optimizationstudy were discussed in detail. In the current section,the results generated from the study are presentedalong with a critical analysis of the same. The objectiveand decision variable values were plotted suitably andwere compared with the corresponding industrial datapredicted by providing the industrial design and operat-ing conditions (Table A2) to the same simulationprogram as was used for optimization. The predicteddata, although different from the measured data, wereused for comparing optimal solutions to avoid any biasarising from model limitations. The primary outcomeof multiobjective optimization is the Pareto-optimal setof solutions depicting tradeoffs between the competingobjectives. In addition, values of the decision variablesand the trends of variation of these variables withrespect to the objectives are important as well. For eachmultiobjective optimization study, Paretos were gener-ated with different initial populations and variouscombinations of the NSGA-II parameters. The bestresults obtained from these studies are presented anddiscussed in this section.
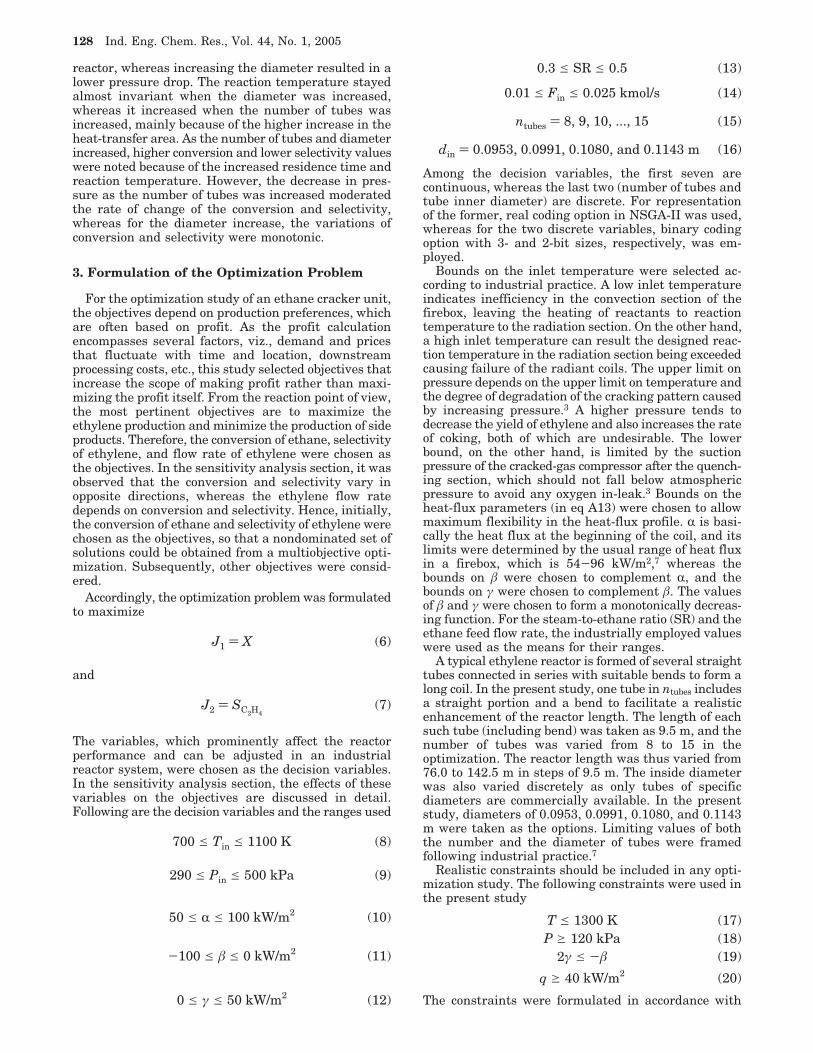
Maximizing Ethane Conversion and EthyleneSelectivity. The Pareto-optimal set obtained by maxi-mizing the ethane conversion and the ethylene selectiv-ity is presented in Figure 3, which shows that the Paretoset generated by NSGA-II was smooth and well distrib-uted over a wide range. Of the solutions in the initialpopulation, 24 were infeasible, but the constrainednondominated sorting method brought the entire popu-lation into the feasible region by the fourth generation.Figure 3 shows only the feasible solutions of the initialpopulation. It can be noted that the feasible solutionsare not far from the final Pareto set, from the initial
Figure 3. Pareto-optimal set obtained from the simultaneousmaximization of ethylene selectivity and ethane conversion. Onlythe feasible points of the initial population are plotted. Alsoincluded is the Pareto of simultaneous minimization of selectivityand conversion, which represents the lower boundary of thefeasible selectivity-conversion points. Industrial data point isshown by 2.
I1 ) 1/(J1 + 1) (21)
I2 ) 1/(J2 + 1) (22)
1.0 - T1300
g 0 (23)
P120
- 1.0 g 0 (24)
- â2γ
- 1.0 g 0 (25)
q40
- 1.0 g 0 (26)
Ind. Eng. Chem. Res., Vol. 44, No. 1, 2005 129
population itself. This is because of the starkly contra-dictory nature of the objectives, for which simultaneousdecreasing of both objectives is not possible below acertain limit. This limit, the Pareto of simultaneousminimization of selectivity and conversion, is alsopresented in Figure 3. The final Pareto set found bymaximizing the objectives was identified as early as the165th generation, after which only minor variationswere noted.
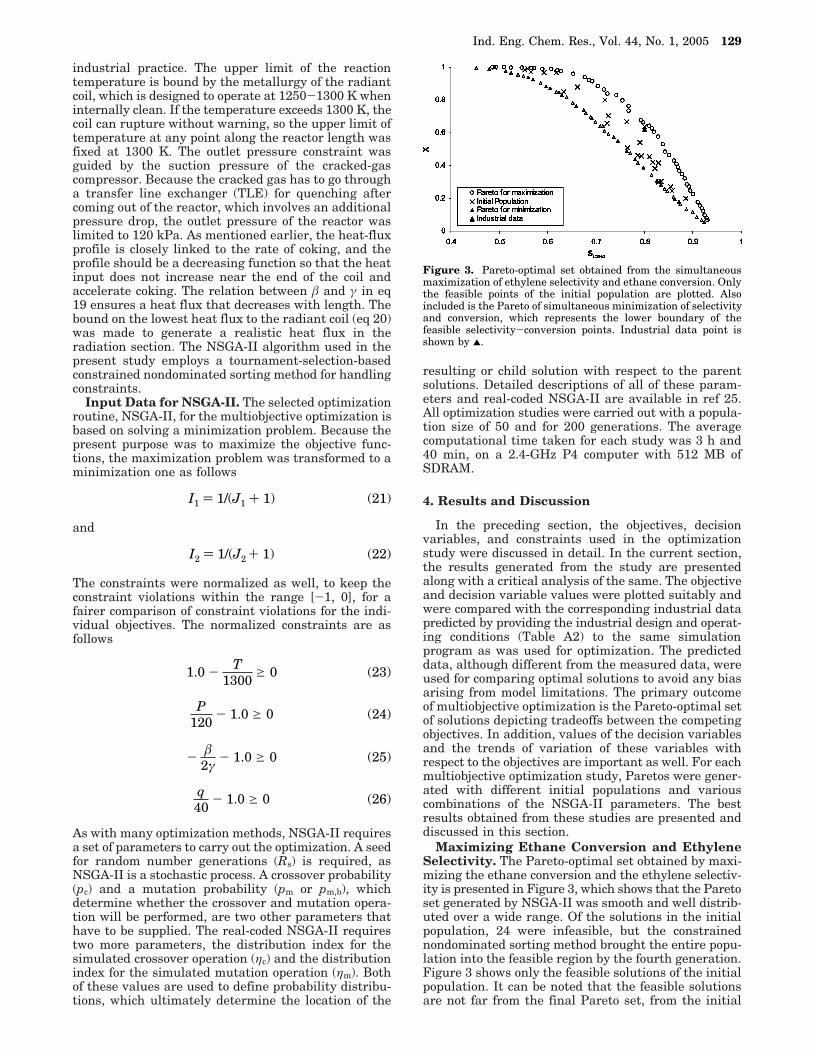
The Pareto presented in Figure 3 was the best-obtained from experimentation with different combina-tions of NSGA-II parameters. The Paretos obtained fromall of these studies ultimately reached the same front,albeit with minor variations mainly in Pareto ranges.Some of these Paretos are plotted in Figure 4, and theparameters of NSGA-II used for generating them arelisted in Table 1. To further verify the fidelity of thesePareto fronts, the conversion and selectivity wereoptimized individually. The maximum selectivity andconversion obtained from these single-objective optimi-zation studies perfectly lie on the two extremes of thePareto fronts (Figure 4). An ε-constraint method wasalso applied to verify the true extent of the Paretobetween the extreme values of conversion and selectiv-ity. It was done by considering one of the objectives asa constraint and putting a lower bound on its valuewhile maximizing the other. The study with ε-constraintmethod was carried out with both objectives, and theobtained solutions were found to be perfectly lying onthe Paretos obtained by NSGA-II (Figure 4).
Among the Paretos in Figure 4, the one representingset 5 was found to be the widest and was plotted inFigure 3. It shows that, whereas the maximum ethaneconversion had reached very close to 1.0, the maximum
achievable selectivity was about 0.93. It can also beobserved in Figure 3 that, whereas high conversion wasachieved with moderate sacrifice in selectivity, achiev-ing high selectivity needed a much higher sacrifice inconversion. For a continuous process, the unreactedethane can be separated and recycled back, but if ethaneis converted to any undesirable product, a loss isincurred. Thus, lower conversion is perhaps more ac-ceptable than lower selectivity. On the other hand, ifthe process can be designed to recover side products,such as propylene and butadiene, that are higher-valueproducts, even high conversion might become a profit-able option. The best operating point can thus bedetermined after additional information, viz., the valueof byproducts, the capital and operating costs, thecontrollability of the process variables, the results ofhazard and safety analyses, etc., is made available andanalyzed in a comprehensive way. The Pareto (Figure3), however, brought out the intended outcome ofmultiobjective optimization, i.e., a wide range of com-peting options for design and/or operation.
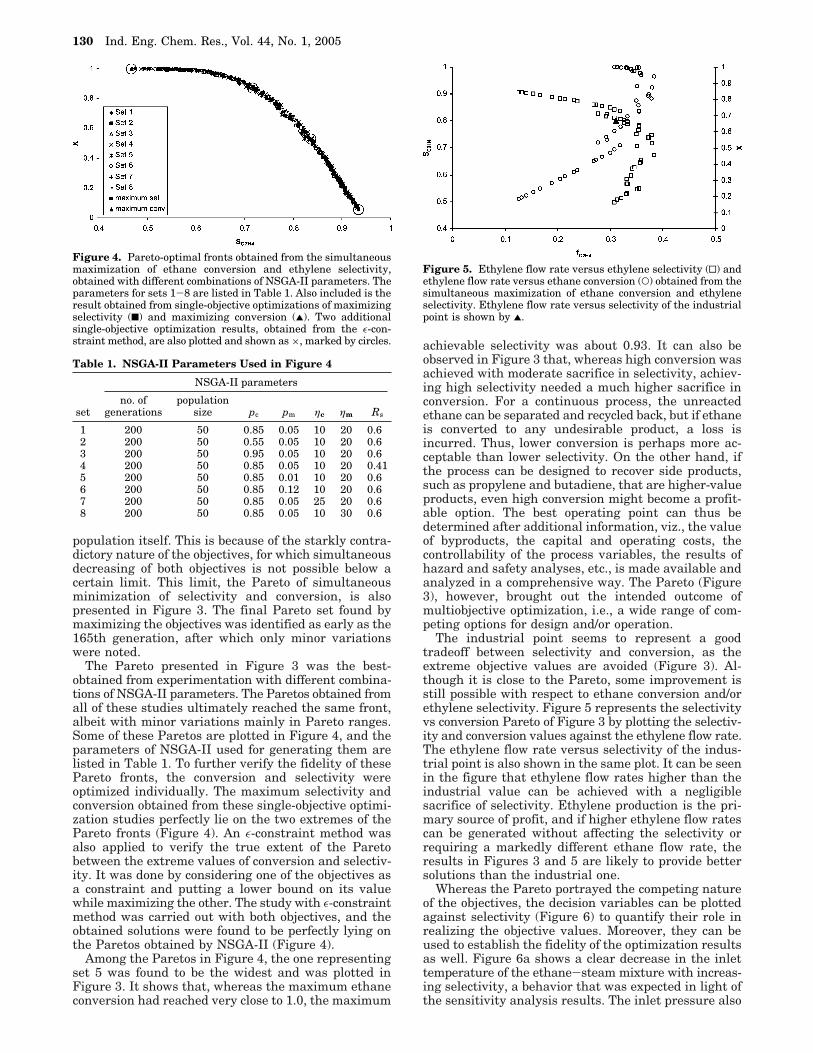
The industrial point seems to represent a goodtradeoff between selectivity and conversion, as theextreme objective values are avoided (Figure 3). Al-though it is close to the Pareto, some improvement isstill possible with respect to ethane conversion and/orethylene selectivity. Figure 5 represents the selectivityvs conversion Pareto of Figure 3 by plotting the selectiv-ity and conversion values against the ethylene flow rate.The ethylene flow rate versus selectivity of the indus-trial point is also shown in the same plot. It can be seenin the figure that ethylene flow rates higher than theindustrial value can be achieved with a negligiblesacrifice of selectivity. Ethylene production is the pri-mary source of profit, and if higher ethylene flow ratescan be generated without affecting the selectivity orrequiring a markedly different ethane flow rate, theresults in Figures 3 and 5 are likely to provide bettersolutions than the industrial one.
Whereas the Pareto portrayed the competing natureof the objectives, the decision variables can be plottedagainst selectivity (Figure 6) to quantify their role inrealizing the objective values. Moreover, they can beused to establish the fidelity of the optimization resultsas well. Figure 6a shows a clear decrease in the inlettemperature of the ethane-steam mixture with increas-ing selectivity, a behavior that was expected in light ofthe sensitivity analysis results. The inlet pressure also
Figure 4. Pareto-optimal fronts obtained from the simultaneousmaximization of ethane conversion and ethylene selectivity,obtained with different combinations of NSGA-II parameters. Theparameters for sets 1-8 are listed in Table 1. Also included is theresult obtained from single-objective optimizations of maximizingselectivity (9) and maximizing conversion (2). Two additionalsingle-objective optimization results, obtained from the ε-con-straint method, are also plotted and shown as ×, marked by circles.
Table 1. NSGA-II Parameters Used in Figure 4
NSGA-II parameters
setno. of
generationspopulation
size pc pm ηc ηm Rs
1 200 50 0.85 0.05 10 20 0.62 200 50 0.55 0.05 10 20 0.63 200 50 0.95 0.05 10 20 0.64 200 50 0.85 0.05 10 20 0.415 200 50 0.85 0.01 10 20 0.66 200 50 0.85 0.12 10 20 0.67 200 50 0.85 0.05 25 20 0.68 200 50 0.85 0.05 10 30 0.6
Figure 5. Ethylene flow rate versus ethylene selectivity (0) andethylene flow rate versus ethane conversion (O) obtained from thesimultaneous maximization of ethane conversion and ethyleneselectivity. Ethylene flow rate versus selectivity of the industrialpoint is shown by 2.
130 Ind. Eng. Chem. Res., Vol. 44, No. 1, 2005
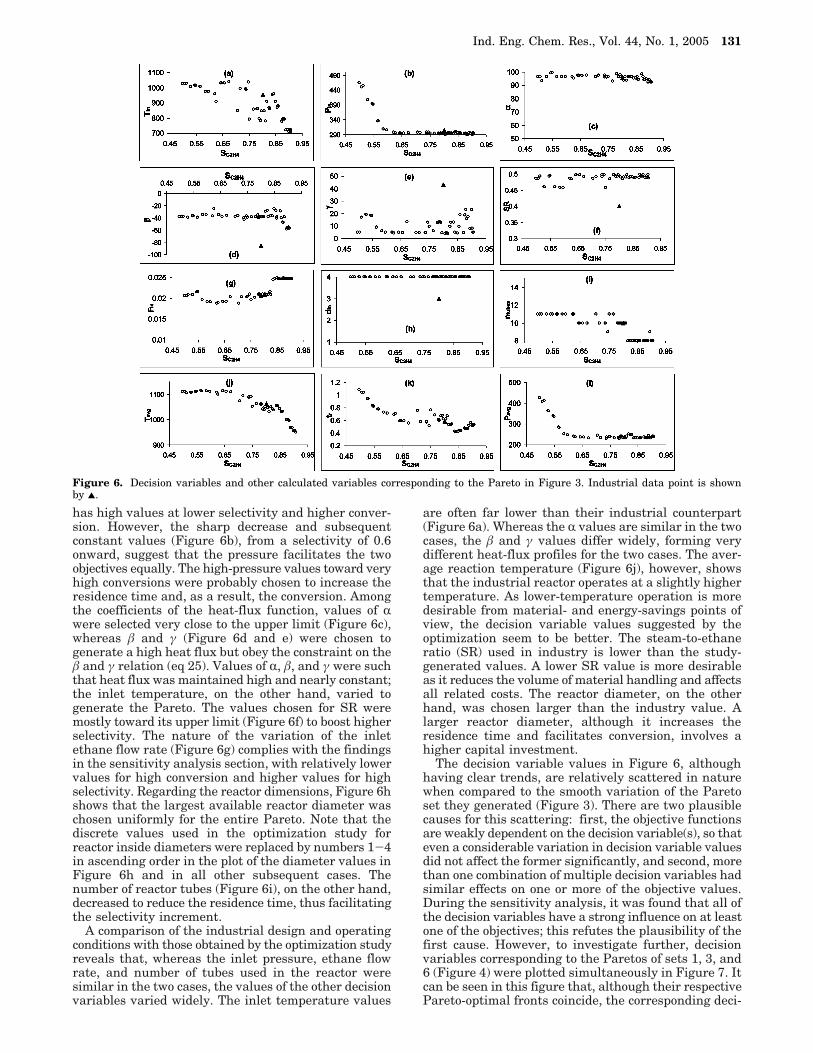
has high values at lower selectivity and higher conver-sion. However, the sharp decrease and subsequentconstant values (Figure 6b), from a selectivity of 0.6onward, suggest that the pressure facilitates the twoobjectives equally. The high-pressure values toward veryhigh conversions were probably chosen to increase theresidence time and, as a result, the conversion. Amongthe coefficients of the heat-flux function, values of Rwere selected very close to the upper limit (Figure 6c),whereas â and γ (Figure 6d and e) were chosen togenerate a high heat flux but obey the constraint on theâ and γ relation (eq 25). Values of R, â, and γ were suchthat heat flux was maintained high and nearly constant;the inlet temperature, on the other hand, varied togenerate the Pareto. The values chosen for SR weremostly toward its upper limit (Figure 6f) to boost higherselectivity. The nature of the variation of the inletethane flow rate (Figure 6g) complies with the findingsin the sensitivity analysis section, with relatively lowervalues for high conversion and higher values for highselectivity. Regarding the reactor dimensions, Figure 6hshows that the largest available reactor diameter waschosen uniformly for the entire Pareto. Note that thediscrete values used in the optimization study forreactor inside diameters were replaced by numbers 1-4in ascending order in the plot of the diameter values inFigure 6h and in all other subsequent cases. Thenumber of reactor tubes (Figure 6i), on the other hand,decreased to reduce the residence time, thus facilitatingthe selectivity increment.
A comparison of the industrial design and operatingconditions with those obtained by the optimization studyreveals that, whereas the inlet pressure, ethane flowrate, and number of tubes used in the reactor weresimilar in the two cases, the values of the other decisionvariables varied widely. The inlet temperature values
are often far lower than their industrial counterpart(Figure 6a). Whereas the R values are similar in the twocases, the â and γ values differ widely, forming verydifferent heat-flux profiles for the two cases. The aver-age reaction temperature (Figure 6j), however, showsthat the industrial reactor operates at a slightly highertemperature. As lower-temperature operation is moredesirable from material- and energy-savings points ofview, the decision variable values suggested by theoptimization seem to be better. The steam-to-ethaneratio (SR) used in industry is lower than the study-generated values. A lower SR value is more desirableas it reduces the volume of material handling and affectsall related costs. The reactor diameter, on the otherhand, was chosen larger than the industry value. Alarger reactor diameter, although it increases theresidence time and facilitates conversion, involves ahigher capital investment.
The decision variable values in Figure 6, althoughhaving clear trends, are relatively scattered in naturewhen compared to the smooth variation of the Paretoset they generated (Figure 3). There are two plausiblecauses for this scattering: first, the objective functionsare weakly dependent on the decision variable(s), so thateven a considerable variation in decision variable valuesdid not affect the former significantly, and second, morethan one combination of multiple decision variables hadsimilar effects on one or more of the objective values.During the sensitivity analysis, it was found that all ofthe decision variables have a strong influence on at leastone of the objectives; this refutes the plausibility of thefirst cause. However, to investigate further, decisionvariables corresponding to the Paretos of sets 1, 3, and6 (Figure 4) were plotted simultaneously in Figure 7. Itcan be seen in this figure that, although their respectivePareto-optimal fronts coincide, the corresponding deci-
Figure 6. Decision variables and other calculated variables corresponding to the Pareto in Figure 3. Industrial data point is shownby 2.
Ind. Eng. Chem. Res., Vol. 44, No. 1, 2005 131
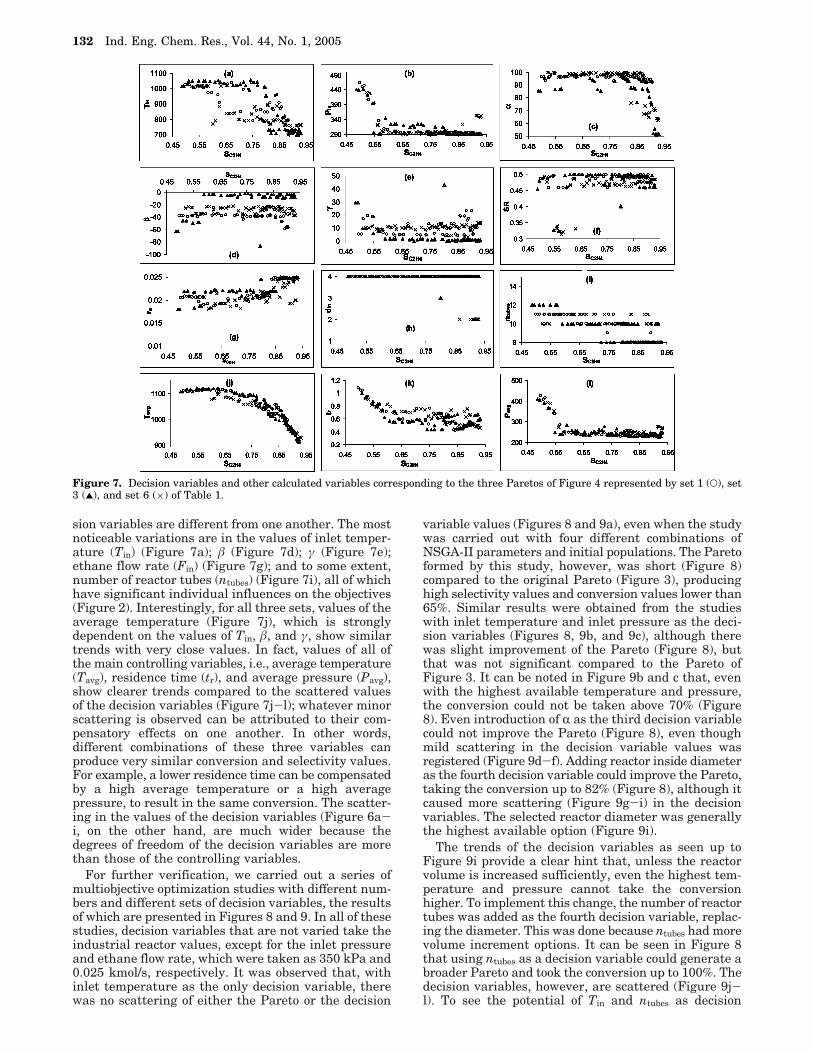
sion variables are different from one another. The mostnoticeable variations are in the values of inlet temper-ature (Tin) (Figure 7a); â (Figure 7d); γ (Figure 7e);ethane flow rate (Fin) (Figure 7g); and to some extent,number of reactor tubes (ntubes) (Figure 7i), all of whichhave significant individual influences on the objectives(Figure 2). Interestingly, for all three sets, values of theaverage temperature (Figure 7j), which is stronglydependent on the values of Tin, â, and γ, show similartrends with very close values. In fact, values of all ofthe main controlling variables, i.e., average temperature(Tavg), residence time (tr), and average pressure (Pavg),show clearer trends compared to the scattered valuesof the decision variables (Figure 7j-l); whatever minorscattering is observed can be attributed to their com-pensatory effects on one another. In other words,different combinations of these three variables canproduce very similar conversion and selectivity values.For example, a lower residence time can be compensatedby a high average temperature or a high averagepressure, to result in the same conversion. The scatter-ing in the values of the decision variables (Figure 6a-i, on the other hand, are much wider because thedegrees of freedom of the decision variables are morethan those of the controlling variables.
For further verification, we carried out a series ofmultiobjective optimization studies with different num-bers and different sets of decision variables, the resultsof which are presented in Figures 8 and 9. In all of thesestudies, decision variables that are not varied take theindustrial reactor values, except for the inlet pressureand ethane flow rate, which were taken as 350 kPa and0.025 kmol/s, respectively. It was observed that, withinlet temperature as the only decision variable, therewas no scattering of either the Pareto or the decision
variable values (Figures 8 and 9a), even when the studywas carried out with four different combinations ofNSGA-II parameters and initial populations. The Paretoformed by this study, however, was short (Figure 8)compared to the original Pareto (Figure 3), producinghigh selectivity values and conversion values lower than65%. Similar results were obtained from the studieswith inlet temperature and inlet pressure as the deci-sion variables (Figures 8, 9b, and 9c), although therewas slight improvement of the Pareto (Figure 8), butthat was not significant compared to the Pareto ofFigure 3. It can be noted in Figure 9b and c that, evenwith the highest available temperature and pressure,the conversion could not be taken above 70% (Figure8). Even introduction of R as the third decision variablecould not improve the Pareto (Figure 8), even thoughmild scattering in the decision variable values wasregistered (Figure 9d-f). Adding reactor inside diameteras the fourth decision variable could improve the Pareto,taking the conversion up to 82% (Figure 8), although itcaused more scattering (Figure 9g-i) in the decisionvariables. The selected reactor diameter was generallythe highest available option (Figure 9i).
The trends of the decision variables as seen up toFigure 9i provide a clear hint that, unless the reactorvolume is increased sufficiently, even the highest tem-perature and pressure cannot take the conversionhigher. To implement this change, the number of reactortubes was added as the fourth decision variable, replac-ing the diameter. This was done because ntubes had morevolume increment options. It can be seen in Figure 8that using ntubes as a decision variable could generate abroader Pareto and took the conversion up to 100%. Thedecision variables, however, are scattered (Figure 9j-l). To see the potential of Tin and ntubes as decision
Figure 7. Decision variables and other calculated variables corresponding to the three Paretos of Figure 4 represented by set 1 (O), set3 (2), and set 6 (×) of Table 1.
132 Ind. Eng. Chem. Res., Vol. 44, No. 1, 2005
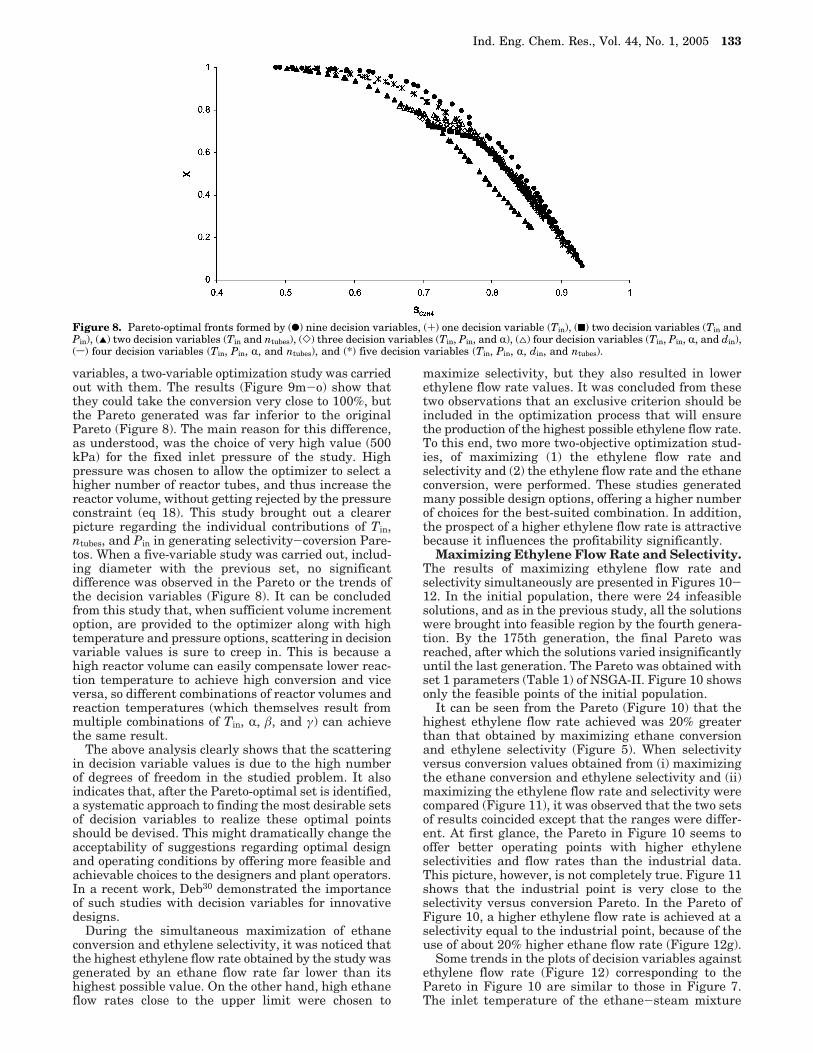
variables, a two-variable optimization study was carriedout with them. The results (Figure 9m-o) show thatthey could take the conversion very close to 100%, butthe Pareto generated was far inferior to the originalPareto (Figure 8). The main reason for this difference,as understood, was the choice of very high value (500kPa) for the fixed inlet pressure of the study. Highpressure was chosen to allow the optimizer to select ahigher number of reactor tubes, and thus increase thereactor volume, without getting rejected by the pressureconstraint (eq 18). This study brought out a clearerpicture regarding the individual contributions of Tin,ntubes, and Pin in generating selectivity-coversion Pare-tos. When a five-variable study was carried out, includ-ing diameter with the previous set, no significantdifference was observed in the Pareto or the trends ofthe decision variables (Figure 8). It can be concludedfrom this study that, when sufficient volume incrementoption, are provided to the optimizer along with hightemperature and pressure options, scattering in decisionvariable values is sure to creep in. This is because ahigh reactor volume can easily compensate lower reac-tion temperature to achieve high conversion and viceversa, so different combinations of reactor volumes andreaction temperatures (which themselves result frommultiple combinations of Tin, R, â, and γ) can achievethe same result.
The above analysis clearly shows that the scatteringin decision variable values is due to the high numberof degrees of freedom in the studied problem. It alsoindicates that, after the Pareto-optimal set is identified,a systematic approach to finding the most desirable setsof decision variables to realize these optimal pointsshould be devised. This might dramatically change theacceptability of suggestions regarding optimal designand operating conditions by offering more feasible andachievable choices to the designers and plant operators.In a recent work, Deb30 demonstrated the importanceof such studies with decision variables for innovativedesigns.
During the simultaneous maximization of ethaneconversion and ethylene selectivity, it was noticed thatthe highest ethylene flow rate obtained by the study wasgenerated by an ethane flow rate far lower than itshighest possible value. On the other hand, high ethaneflow rates close to the upper limit were chosen to
maximize selectivity, but they also resulted in lowerethylene flow rate values. It was concluded from thesetwo observations that an exclusive criterion should beincluded in the optimization process that will ensurethe production of the highest possible ethylene flow rate.To this end, two more two-objective optimization stud-ies, of maximizing (1) the ethylene flow rate andselectivity and (2) the ethylene flow rate and the ethaneconversion, were performed. These studies generatedmany possible design options, offering a higher numberof choices for the best-suited combination. In addition,the prospect of a higher ethylene flow rate is attractivebecause it influences the profitability significantly.
Maximizing Ethylene Flow Rate and Selectivity.The results of maximizing ethylene flow rate andselectivity simultaneously are presented in Figures 10-12. In the initial population, there were 24 infeasiblesolutions, and as in the previous study, all the solutionswere brought into feasible region by the fourth genera-tion. By the 175th generation, the final Pareto wasreached, after which the solutions varied insignificantlyuntil the last generation. The Pareto was obtained withset 1 parameters (Table 1) of NSGA-II. Figure 10 showsonly the feasible points of the initial population.
It can be seen from the Pareto (Figure 10) that thehighest ethylene flow rate achieved was 20% greaterthan that obtained by maximizing ethane conversionand ethylene selectivity (Figure 5). When selectivityversus conversion values obtained from (i) maximizingthe ethane conversion and ethylene selectivity and (ii)maximizing the ethylene flow rate and selectivity werecompared (Figure 11), it was observed that the two setsof results coincided except that the ranges were differ-ent. At first glance, the Pareto in Figure 10 seems tooffer better operating points with higher ethyleneselectivities and flow rates than the industrial data.This picture, however, is not completely true. Figure 11shows that the industrial point is very close to theselectivity versus conversion Pareto. In the Pareto ofFigure 10, a higher ethylene flow rate is achieved at aselectivity equal to the industrial point, because of theuse of about 20% higher ethane flow rate (Figure 12g).
Some trends in the plots of decision variables againstethylene flow rate (Figure 12) corresponding to thePareto in Figure 10 are similar to those in Figure 7.The inlet temperature of the ethane-steam mixture
Figure 8. Pareto-optimal fronts formed by (b) nine decision variables, (+) one decision variable (Tin), (9) two decision variables (Tin andPin), (2) two decision variables (Tin and ntubes), (]) three decision variables (Tin, Pin, and R), (4) four decision variables (Tin, Pin, R, and din),(s) four decision variables (Tin, Pin, R, and ntubes), and (*) five decision variables (Tin, Pin, R, din, and ntubes).
Ind. Eng. Chem. Res., Vol. 44, No. 1, 2005 133
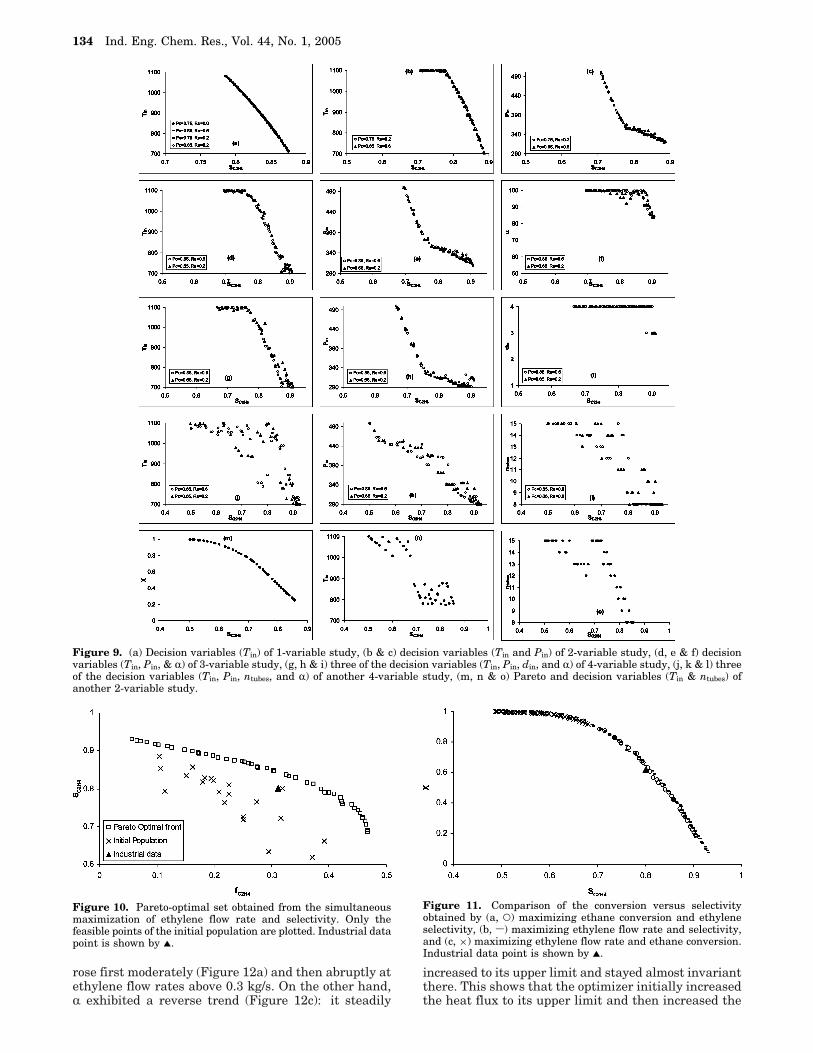
rose first moderately (Figure 12a) and then abruptly atethylene flow rates above 0.3 kg/s. On the other hand,R exhibited a reverse trend (Figure 12c): it steadily
increased to its upper limit and stayed almost invariantthere. This shows that the optimizer initially increasedthe heat flux to its upper limit and then increased the
Figure 9. (a) Decision variables (Tin) of 1-variable study, (b & c) decision variables (Tin and Pin) of 2-variable study, (d, e & f) decisionvariables (Tin, Pin, & R) of 3-variable study, (g, h & i) three of the decision variables (Tin, Pin, din, and R) of 4-variable study, (j, k & l) threeof the decision variables (Tin, Pin, ntubes, and R) of another 4-variable study, (m, n & o) Pareto and decision variables (Tin & ntubes) ofanother 2-variable study.
Figure 10. Pareto-optimal set obtained from the simultaneousmaximization of ethylene flow rate and selectivity. Only thefeasible points of the initial population are plotted. Industrial datapoint is shown by 2.
Figure 11. Comparison of the conversion versus selectivityobtained by (a, O) maximizing ethane conversion and ethyleneselectivity, (b, s) maximizing ethylene flow rate and selectivity,and (c, ×) maximizing ethylene flow rate and ethane conversion.Industrial data point is shown by 2.
134 Ind. Eng. Chem. Res., Vol. 44, No. 1, 2005
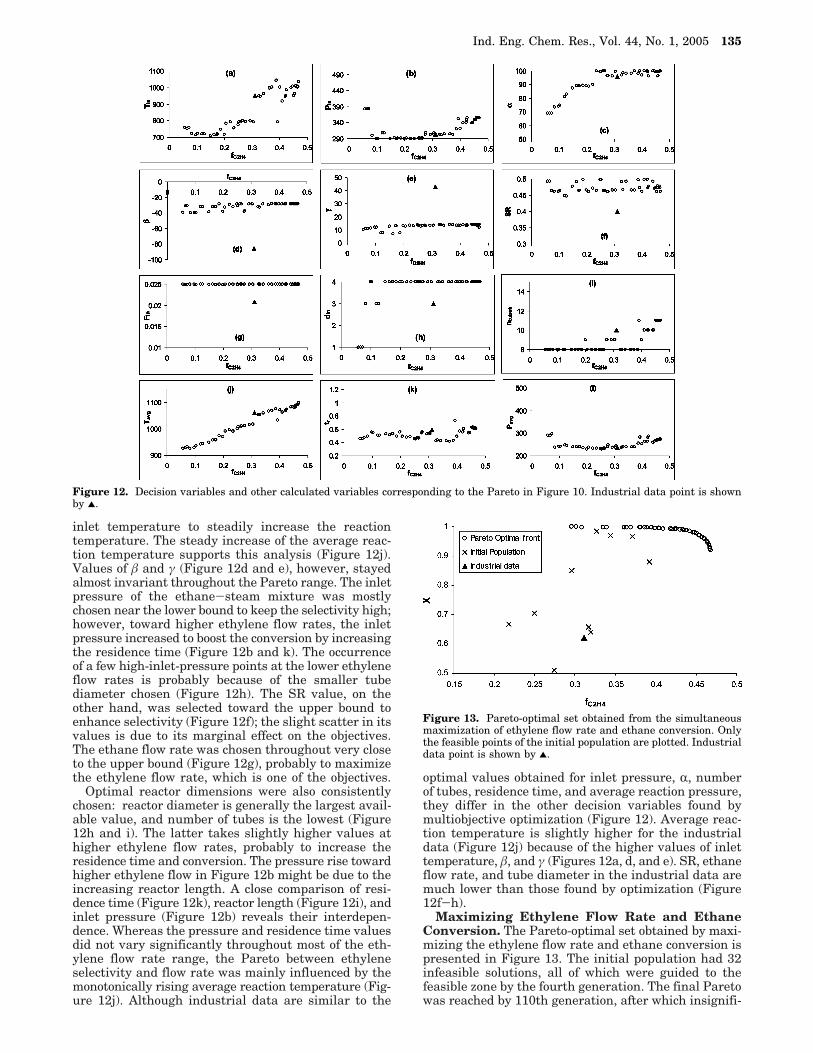
inlet temperature to steadily increase the reactiontemperature. The steady increase of the average reac-tion temperature supports this analysis (Figure 12j).Values of â and γ (Figure 12d and e), however, stayedalmost invariant throughout the Pareto range. The inletpressure of the ethane-steam mixture was mostlychosen near the lower bound to keep the selectivity high;however, toward higher ethylene flow rates, the inletpressure increased to boost the conversion by increasingthe residence time (Figure 12b and k). The occurrenceof a few high-inlet-pressure points at the lower ethyleneflow rates is probably because of the smaller tubediameter chosen (Figure 12h). The SR value, on theother hand, was selected toward the upper bound toenhance selectivity (Figure 12f); the slight scatter in itsvalues is due to its marginal effect on the objectives.The ethane flow rate was chosen throughout very closeto the upper bound (Figure 12g), probably to maximizethe ethylene flow rate, which is one of the objectives.
Optimal reactor dimensions were also consistentlychosen: reactor diameter is generally the largest avail-able value, and number of tubes is the lowest (Figure12h and i). The latter takes slightly higher values athigher ethylene flow rates, probably to increase theresidence time and conversion. The pressure rise towardhigher ethylene flow in Figure 12b might be due to theincreasing reactor length. A close comparison of resi-dence time (Figure 12k), reactor length (Figure 12i), andinlet pressure (Figure 12b) reveals their interdepen-dence. Whereas the pressure and residence time valuesdid not vary significantly throughout most of the eth-ylene flow rate range, the Pareto between ethyleneselectivity and flow rate was mainly influenced by themonotonically rising average reaction temperature (Fig-ure 12j). Although industrial data are similar to the
optimal values obtained for inlet pressure, R, numberof tubes, residence time, and average reaction pressure,they differ in the other decision variables found bymultiobjective optimization (Figure 12). Average reac-tion temperature is slightly higher for the industrialdata (Figure 12j) because of the higher values of inlettemperature, â, and γ (Figures 12a, d, and e). SR, ethaneflow rate, and tube diameter in the industrial data aremuch lower than those found by optimization (Figure12f-h).
Maximizing Ethylene Flow Rate and EthaneConversion. The Pareto-optimal set obtained by maxi-mizing the ethylene flow rate and ethane conversion ispresented in Figure 13. The initial population had 32infeasible solutions, all of which were guided to thefeasible zone by the fourth generation. The final Paretowas reached by 110th generation, after which insignifi-
Figure 12. Decision variables and other calculated variables corresponding to the Pareto in Figure 10. Industrial data point is shownby 2.
Figure 13. Pareto-optimal set obtained from the simultaneousmaximization of ethylene flow rate and ethane conversion. Onlythe feasible points of the initial population are plotted. Industrialdata point is shown by 2.
Ind. Eng. Chem. Res., Vol. 44, No. 1, 2005 135
cant variations were noted. Set 1 parameters (Table 1)of NSGA-II were used for generating this Pareto.
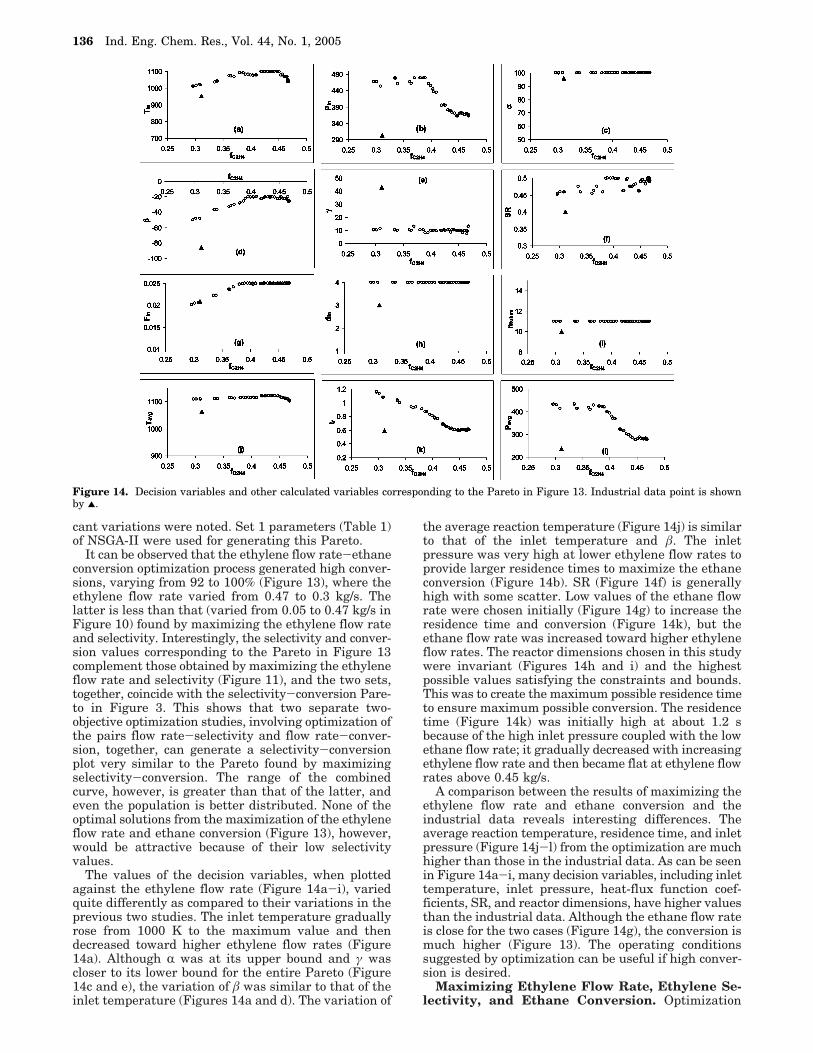
It can be observed that the ethylene flow rate-ethaneconversion optimization process generated high conver-sions, varying from 92 to 100% (Figure 13), where theethylene flow rate varied from 0.47 to 0.3 kg/s. Thelatter is less than that (varied from 0.05 to 0.47 kg/s inFigure 10) found by maximizing the ethylene flow rateand selectivity. Interestingly, the selectivity and conver-sion values corresponding to the Pareto in Figure 13complement those obtained by maximizing the ethyleneflow rate and selectivity (Figure 11), and the two sets,together, coincide with the selectivity-conversion Pare-to in Figure 3. This shows that two separate two-objective optimization studies, involving optimization ofthe pairs flow rate-selectivity and flow rate-conver-sion, together, can generate a selectivity-conversionplot very similar to the Pareto found by maximizingselectivity-conversion. The range of the combinedcurve, however, is greater than that of the latter, andeven the population is better distributed. None of theoptimal solutions from the maximization of the ethyleneflow rate and ethane conversion (Figure 13), however,would be attractive because of their low selectivityvalues.
The values of the decision variables, when plottedagainst the ethylene flow rate (Figure 14a-i), variedquite differently as compared to their variations in theprevious two studies. The inlet temperature graduallyrose from 1000 K to the maximum value and thendecreased toward higher ethylene flow rates (Figure14a). Although R was at its upper bound and γ wascloser to its lower bound for the entire Pareto (Figure14c and e), the variation of â was similar to that of theinlet temperature (Figures 14a and d). The variation of
the average reaction temperature (Figure 14j) is similarto that of the inlet temperature and â. The inletpressure was very high at lower ethylene flow rates toprovide larger residence times to maximize the ethaneconversion (Figure 14b). SR (Figure 14f) is generallyhigh with some scatter. Low values of the ethane flowrate were chosen initially (Figure 14g) to increase theresidence time and conversion (Figure 14k), but theethane flow rate was increased toward higher ethyleneflow rates. The reactor dimensions chosen in this studywere invariant (Figures 14h and i) and the highestpossible values satisfying the constraints and bounds.This was to create the maximum possible residence timeto ensure maximum possible conversion. The residencetime (Figure 14k) was initially high at about 1.2 sbecause of the high inlet pressure coupled with the lowethane flow rate; it gradually decreased with increasingethylene flow rate and then became flat at ethylene flowrates above 0.45 kg/s.
A comparison between the results of maximizing theethylene flow rate and ethane conversion and theindustrial data reveals interesting differences. Theaverage reaction temperature, residence time, and inletpressure (Figure 14j-l) from the optimization are muchhigher than those in the industrial data. As can be seenin Figure 14a-i, many decision variables, including inlettemperature, inlet pressure, heat-flux function coef-ficients, SR, and reactor dimensions, have higher valuesthan the industrial data. Although the ethane flow rateis close for the two cases (Figure 14g), the conversion ismuch higher (Figure 13). The operating conditionssuggested by optimization can be useful if high conver-sion is desired.
Maximizing Ethylene Flow Rate, Ethylene Se-lectivity, and Ethane Conversion. Optimization
Figure 14. Decision variables and other calculated variables corresponding to the Pareto in Figure 13. Industrial data point is shownby 2.
136 Ind. Eng. Chem. Res., Vol. 44, No. 1, 2005
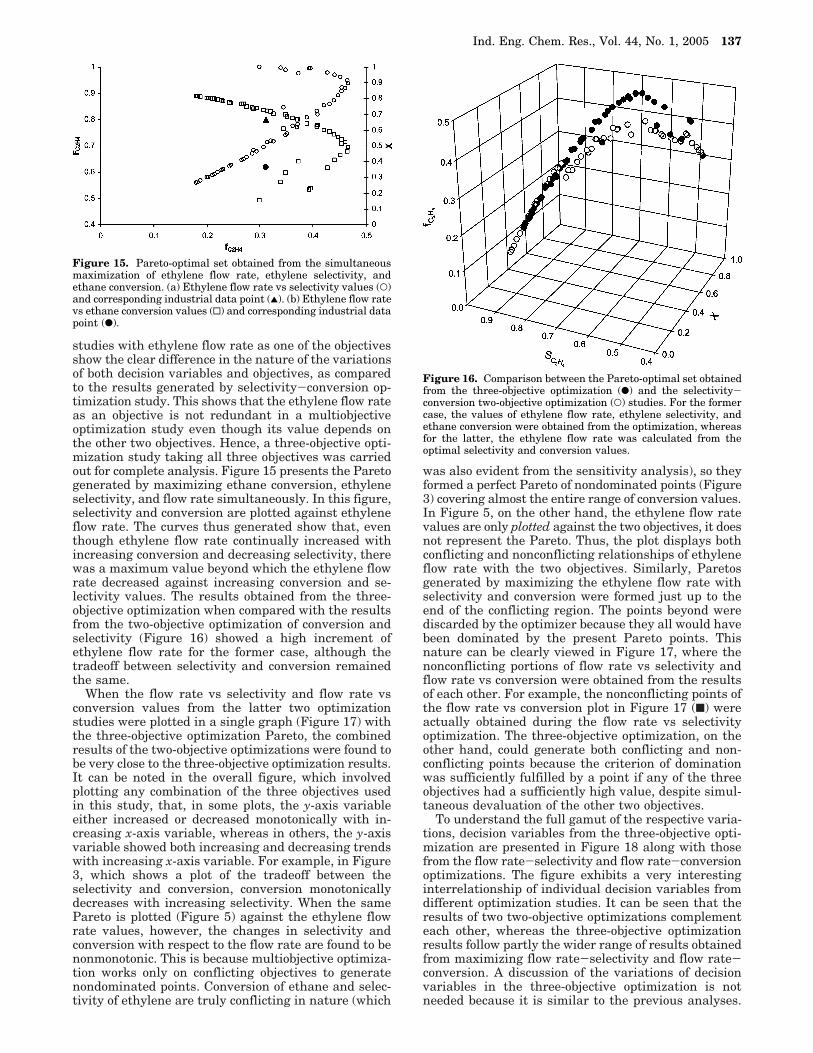
studies with ethylene flow rate as one of the objectivesshow the clear difference in the nature of the variationsof both decision variables and objectives, as comparedto the results generated by selectivity-conversion op-timization study. This shows that the ethylene flow rateas an objective is not redundant in a multiobjectiveoptimization study even though its value depends onthe other two objectives. Hence, a three-objective opti-mization study taking all three objectives was carriedout for complete analysis. Figure 15 presents the Paretogenerated by maximizing ethane conversion, ethyleneselectivity, and flow rate simultaneously. In this figure,selectivity and conversion are plotted against ethyleneflow rate. The curves thus generated show that, eventhough ethylene flow rate continually increased withincreasing conversion and decreasing selectivity, therewas a maximum value beyond which the ethylene flowrate decreased against increasing conversion and se-lectivity values. The results obtained from the three-objective optimization when compared with the resultsfrom the two-objective optimization of conversion andselectivity (Figure 16) showed a high increment ofethylene flow rate for the former case, although thetradeoff between selectivity and conversion remainedthe same.
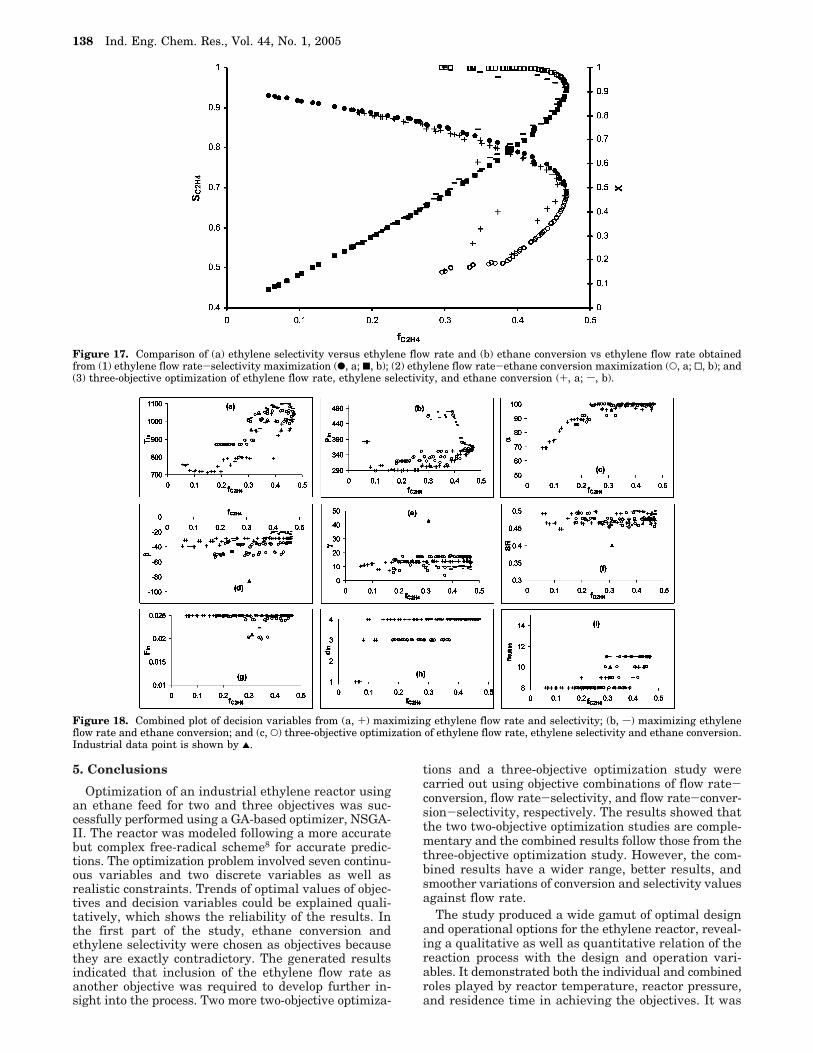
When the flow rate vs selectivity and flow rate vsconversion values from the latter two optimizationstudies were plotted in a single graph (Figure 17) withthe three-objective optimization Pareto, the combinedresults of the two-objective optimizations were found tobe very close to the three-objective optimization results.It can be noted in the overall figure, which involvedplotting any combination of the three objectives usedin this study, that, in some plots, the y-axis variableeither increased or decreased monotonically with in-creasing x-axis variable, whereas in others, the y-axisvariable showed both increasing and decreasing trendswith increasing x-axis variable. For example, in Figure3, which shows a plot of the tradeoff between theselectivity and conversion, conversion monotonicallydecreases with increasing selectivity. When the samePareto is plotted (Figure 5) against the ethylene flowrate values, however, the changes in selectivity andconversion with respect to the flow rate are found to benonmonotonic. This is because multiobjective optimiza-tion works only on conflicting objectives to generatenondominated points. Conversion of ethane and selec-tivity of ethylene are truly conflicting in nature (which
was also evident from the sensitivity analysis), so theyformed a perfect Pareto of nondominated points (Figure3) covering almost the entire range of conversion values.In Figure 5, on the other hand, the ethylene flow ratevalues are only plotted against the two objectives, it doesnot represent the Pareto. Thus, the plot displays bothconflicting and nonconflicting relationships of ethyleneflow rate with the two objectives. Similarly, Paretosgenerated by maximizing the ethylene flow rate withselectivity and conversion were formed just up to theend of the conflicting region. The points beyond werediscarded by the optimizer because they all would havebeen dominated by the present Pareto points. Thisnature can be clearly viewed in Figure 17, where thenonconflicting portions of flow rate vs selectivity andflow rate vs conversion were obtained from the resultsof each other. For example, the nonconflicting points ofthe flow rate vs conversion plot in Figure 17 (9) wereactually obtained during the flow rate vs selectivityoptimization. The three-objective optimization, on theother hand, could generate both conflicting and non-conflicting points because the criterion of dominationwas sufficiently fulfilled by a point if any of the threeobjectives had a sufficiently high value, despite simul-taneous devaluation of the other two objectives.
To understand the full gamut of the respective varia-tions, decision variables from the three-objective opti-mization are presented in Figure 18 along with thosefrom the flow rate-selectivity and flow rate-conversionoptimizations. The figure exhibits a very interestinginterrelationship of individual decision variables fromdifferent optimization studies. It can be seen that theresults of two two-objective optimizations complementeach other, whereas the three-objective optimizationresults follow partly the wider range of results obtainedfrom maximizing flow rate-selectivity and flow rate-conversion. A discussion of the variations of decisionvariables in the three-objective optimization is notneeded because it is similar to the previous analyses.
Figure 15. Pareto-optimal set obtained from the simultaneousmaximization of ethylene flow rate, ethylene selectivity, andethane conversion. (a) Ethylene flow rate vs selectivity values (O)and corresponding industrial data point (2). (b) Ethylene flow ratevs ethane conversion values (0) and corresponding industrial datapoint (b).
Figure 16. Comparison between the Pareto-optimal set obtainedfrom the three-objective optimization (b) and the selectivity-conversion two-objective optimization (O) studies. For the formercase, the values of ethylene flow rate, ethylene selectivity, andethane conversion were obtained from the optimization, whereasfor the latter, the ethylene flow rate was calculated from theoptimal selectivity and conversion values.
Ind. Eng. Chem. Res., Vol. 44, No. 1, 2005 137
5. Conclusions
Optimization of an industrial ethylene reactor usingan ethane feed for two and three objectives was suc-cessfully performed using a GA-based optimizer, NSGA-II. The reactor was modeled following a more accuratebut complex free-radical scheme8 for accurate predic-tions. The optimization problem involved seven continu-ous variables and two discrete variables as well asrealistic constraints. Trends of optimal values of objec-tives and decision variables could be explained quali-tatively, which shows the reliability of the results. Inthe first part of the study, ethane conversion andethylene selectivity were chosen as objectives becausethey are exactly contradictory. The generated resultsindicated that inclusion of the ethylene flow rate asanother objective was required to develop further in-sight into the process. Two more two-objective optimiza-
tions and a three-objective optimization study werecarried out using objective combinations of flow rate-conversion, flow rate-selectivity, and flow rate-conver-sion-selectivity, respectively. The results showed thatthe two two-objective optimization studies are comple-mentary and the combined results follow those from thethree-objective optimization study. However, the com-bined results have a wider range, better results, andsmoother variations of conversion and selectivity valuesagainst flow rate.
The study produced a wide gamut of optimal designand operational options for the ethylene reactor, reveal-ing a qualitative as well as quantitative relation of thereaction process with the design and operation vari-ables. It demonstrated both the individual and combinedroles played by reactor temperature, reactor pressure,and residence time in achieving the objectives. It was
Figure 17. Comparison of (a) ethylene selectivity versus ethylene flow rate and (b) ethane conversion vs ethylene flow rate obtainedfrom (1) ethylene flow rate-selectivity maximization (b, a; 9, b); (2) ethylene flow rate-ethane conversion maximization (O, a; 0, b); and(3) three-objective optimization of ethylene flow rate, ethylene selectivity, and ethane conversion (+, a; s, b).
Figure 18. Combined plot of decision variables from (a, +) maximizing ethylene flow rate and selectivity; (b, s) maximizing ethyleneflow rate and ethane conversion; and (c, O) three-objective optimization of ethylene flow rate, ethylene selectivity and ethane conversion.Industrial data point is shown by 2.
138 Ind. Eng. Chem. Res., Vol. 44, No. 1, 2005
found that a larger reactor volume is necessary forhigher conversion, whereas the reverse is true for higherselectivity. To vary the reactor volume, the optimizeralmost always varied the number of reactor tubes whilekeeping the reactor inside diameter constant at theupper limit. The reasons for this result are that (a) thehighest reactor diameter was selected throughout toreduce the reactor pressure drop and thus avoid anyrejection of a good solution because of a violation of theoutlet pressure constraint (eq 18) and (b) the optimizerhad the maximum flexibility of changing the reactorvolume, and thereby the residence time, by changingthe reactor length. High inlet temperatures were chosento achieve high conversions, whereas lower tempera-tures were chosen for high selectivity. The study showedthat, although lower inlet pressure is beneficial for allof the tradeoffs, higher pressures should be chosentoward very high conversions. This is mainly to accom-modate the pressure drop caused by the choice of ahigher number of tubes to boost conversion.
It was observed that the most important decisionvariables used in this study were the reactor inlettemperature and the length of the reactor (representedby the number of reactor tubes). This is because, bymanipulating the values of these two variables only, aPareto ranging from ∼100% conversion to over 85%selectivity could be produced. However, it was alsoobserved that, unless the values of the other decisionvariables are properly controlled, the reactor perfor-mance cannot achieve the best conversion-selectivitytradeoffs. In other words, to achieve a particular conver-sion with the best compromise in selectivity (or viceversa), one has to manipulate mainly the reactor inlettemperature and the number of reactor tubes. Valuesof other variables can be micromanaged to reach thedesired tradeoff point.
In general, a multiobjective optimization study isbeneficial for understanding the performance tradeoffof conflicting objectives and decision variables and forproducing a wide range of optimal solutions.
Appendix A
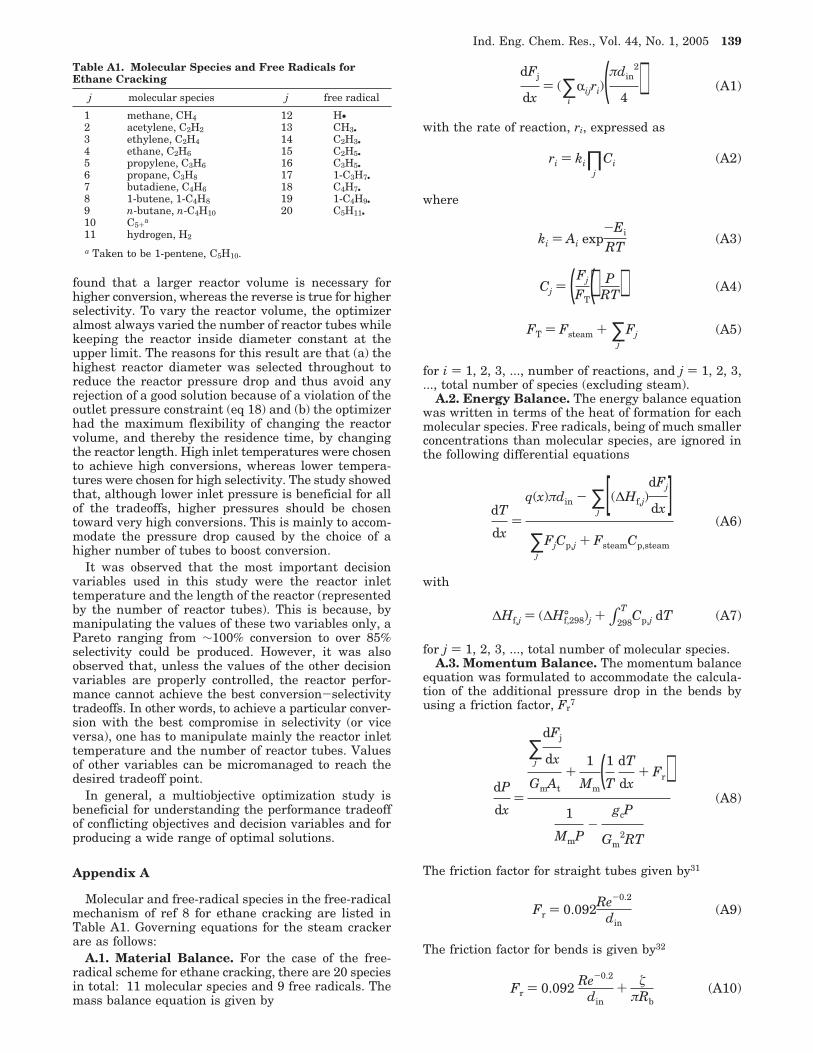
Molecular and free-radical species in the free-radicalmechanism of ref 8 for ethane cracking are listed inTable A1. Governing equations for the steam crackerare as follows:
A.1. Material Balance. For the case of the free-radical scheme for ethane cracking, there are 20 speciesin total: 11 molecular species and 9 free radicals. Themass balance equation is given by
with the rate of reaction, ri, expressed as
where
for i ) 1, 2, 3, ..., number of reactions, and j ) 1, 2, 3,..., total number of species (excluding steam).
A.2. Energy Balance. The energy balance equationwas written in terms of the heat of formation for eachmolecular species. Free radicals, being of much smallerconcentrations than molecular species, are ignored inthe following differential equations
with
for j ) 1, 2, 3, ..., total number of molecular species.A.3. Momentum Balance. The momentum balance
equation was formulated to accommodate the calcula-tion of the additional pressure drop in the bends byusing a friction factor, Fr
7
The friction factor for straight tubes given by31
The friction factor for bends is given by32
Table A1. Molecular Species and Free Radicals forEthane Cracking
j molecular species j free radical
1 methane, CH4 12 H•2 acetylene, C2H2 13 CH3•3 ethylene, C2H4 14 C2H3•4 ethane, C2H6 15 C2H5•5 propylene, C3H6 16 C3H5•6 propane, C3H8 17 1-C3H7•7 butadiene, C4H6 18 C4H7•8 1-butene, 1-C4H8 19 1-C4H9•9 n-butane, n-C4H10 20 C5H11•10 C5+
a
11 hydrogen, H2
a Taken to be 1-pentene, C5H10.
dFj
dx) (∑
i
Rijri)(πdin2
4 ) (A1)
ri ) ki∏j
Ci (A2)
ki ) Ai exp-Ei
RT(A3)
Cj ) (Fj
FT)( P
RT) (A4)
FT ) Fsteam + ∑j
Fj (A5)
dT
dx)
q(x)πdin - ∑j
[(∆Hf,j)dFj
dx ]∑
j
FjCp,j + FsteamCp,steam
(A6)
∆Hf,j ) (∆H°f,298)j + ∫298
TCp,j dT (A7)
dP
dx)
∑j
dFj
dx
GmAt
+1
Mm(1
T
dT
dx+ Fr)
1
MmP-
gcP
Gm2RT
(A8)
Fr ) 0.092Re-0.2
din(A9)
Fr ) 0.092 Re-0.2
din+ ú
πRb(A10)
Ind. Eng. Chem. Res., Vol. 44, No. 1, 2005 139
where
and
The heat-flux profile in the radiation section of thereaction system was represented by a quadratic expres-sion that is a function of a fraction of the total length ofthe reactor, L
where R, â, and γ are suitable coefficients. Design andoperating conditions of the industrial ethylene reactortaken from ref 5 are listed in Table A2. The coefficientsin eq A13 are R ) 96, â ) -85.91, and γ ) 42.955, allin kW/m2, which provide a heat-flux profile matchingthe per-tube heat-flux values given in ref 5. Predictionsof the reactor exit conditions by the model are comparedwith the industrial data in Table A3, which shows thatthe model based on the free-radical mechanism is quiteaccurate.
Nomenclature
A ) frequency factor, s-1 or m3 kmol-1 s-1
At ) tube cross-sectional area, m2
Cj ) concentration of species j in gas mixture, kmol/m3
Cp,j ) specific heat capacity of species j, kJ kmol-1 K-1
din ) tube internal diameter, mE ) activation energy, kcal/kmolF ) total molar flow rate of all species other than steam,
kmol/sFsteam ) molar flow rate of steam, kmol/sFT ) total molar flow rate of gas mixture including steam,
kmol/sFr ) friction factor, m-1
f ) mass flow rate, kg/sgc ) Newton’s conversion factor, 1000 kg m kN-1 s-2
Gm ) mass flux of the gas mixture, kg m-2 s-1
I ) minimization functionJ ) maximization functionki ) kinetic parameter for reaction i, s-1 or m3 kmol-1 s-1
L ) reactor lengthMj ) molecular weight of species j, kg/kmolMm ) molecular weight of gas mixture, kg/kmolntubes ) number of tubes in a radiant coilP ) pressure, kPapm ) probability of mutation for real-coded variablespm,b ) probability of mutation for binary-coded variablespc ) probability of crossoverq(x) ) heat flux at length x of the reactor, kW/m2
R ) ideal gas constant, 8.314 51 J mol-1 K-1
Rb ) bend radius, mRs ) seed for random number generatorRe ) Reynolds numberri ) rate of reaction i, kmol m-3 s-1
S ) selectivitySR ) steam-to-ethane mass ratioT ) temperature, Ktr ) residence time, sX ) conversion of ethanexi ) mole fraction of species i
Greek Symbols
∆Hf,j ) heat of formation of species j, kJ/kmol∆H°f,j ) heat of formation of species j at the reference
temperature, 298 K, kJ/kmolΛ ) angle described by the bend, taken to be 180° hereR ) heat-flux parameter, kW/m2
Rij ) stoichiometric coefficient of species j in reaction iâ ) heat-flux parameter, kW/m2
γ ) heat-flux parameter, kW/m2
ηc ) distribution index for the simulated crossover opera-tion
ηm ) distribution index for the simulated mutation opera-tion
µ ) viscosity of gas, kg m-1 s-1
µm ) viscosity of gas mixture, kg m-1 s-1
Subscripts
avg ) averageC2H4 ) ethylenei ) reaction iin ) inletj ) species jkg ) massref ) referencex ) distance from reactor entrance, m
Literature Cited
(1) Lacson, J.; Wong, S. CEH Report: Ethylene. In ChemicalEconomics Handbook; SRI Consulting: Menlo Park, CA, 2002(accessed at http://ceh.sric.sri.com/Public/Reports/432.0000, Oct2003).
(2) Ethylene Industry Outlook 220. In Process EconomicsProgram Report 220; SRI Consulting: Menlo Park, CA (accessedat http://pep.sric.sri.com/Public/Reports/Phase_96/RP220/RP220.html, Oct 2003).
(3) Ethylene. In Encyclopaedia of Chemical Processing andDesign; McKetta, J., Wesmantel, G. E., Eds.; John Wiley andSons: New York, 1982; p 46.
(4) Ethylene. In Ullmann’s Encyclopedia of Industrial Chem-istry; Elvers, B., Hawkin, S., Russey, W., Eds.; John Wiley andSons: New York, 1992.
(5) Froment, G. F.; Van de Steene, B. O.; Van Damme, P. S.;Narayanan, S.; Goossens, A. G. Thermal Cracking of Ethane andEthane-Propane Mixtures. Ind. Eng. Chem. Process Des. Dev.1976, 15, 495.
(6) Sundaram, K. M.; Froment, G. F. Modeling of ThermalCracking Kinetics. 1. Thermal Cracking of Ethane, Propane andTheir Mixtures. Chem. Eng. Sci. 1977, 32, 601.
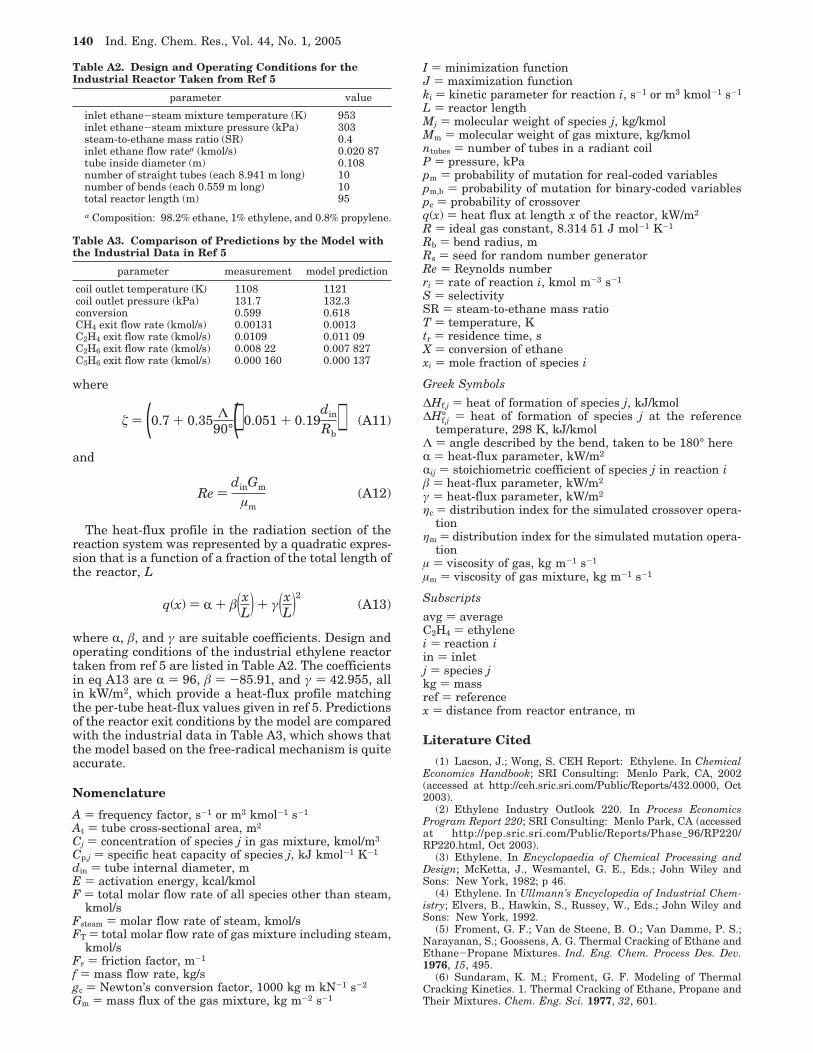
Table A2. Design and Operating Conditions for theIndustrial Reactor Taken from Ref 5
parameter value
inlet ethane-steam mixture temperature (K) 953inlet ethane-steam mixture pressure (kPa) 303steam-to-ethane mass ratio (SR) 0.4inlet ethane flow ratea (kmol/s) 0.020 87tube inside diameter (m) 0.108number of straight tubes (each 8.941 m long) 10number of bends (each 0.559 m long) 10total reactor length (m) 95a Composition: 98.2% ethane, 1% ethylene, and 0.8% propylene.
Table A3. Comparison of Predictions by the Model withthe Industrial Data in Ref 5
parameter measurement model prediction
coil outlet temperature (K) 1108 1121coil outlet pressure (kPa) 131.7 132.3conversion 0.599 0.618CH4 exit flow rate (kmol/s) 0.00131 0.0013C2H4 exit flow rate (kmol/s) 0.0109 0.011 09C2H6 exit flow rate (kmol/s) 0.008 22 0.007 827C3H6 exit flow rate (kmol/s) 0.000 160 0.000 137
ú ) (0.7 + 0.35 Λ90°)(0.051 + 0.19
din
Rb) (A11)
Re )dinGm
µm(A12)
q(x) ) R + â(xL) + γ(xL)2(A13)
140 Ind. Eng. Chem. Res., Vol. 44, No. 1, 2005
(7) Froment, G. F.; Bischoff, K. B. Chemical Reactor Analysisand Design; John Wiley & Sons: New York, 1990.
(8) Sundaram, K. M.; Froment, G. F. Modeling of ThermalCracking Kinetics. 3. Radical Mechanisms for the Pyrolysis ofSimple Paraffins, Olefins, and Their Mixtures. Ind. Eng. Chem.Fundam. 1978, 17, 174.
(9) Pacey, P. D.; Purnell, J. H. Ind. Eng. Chem. Fundam. 1972,11, 233.
(10) Siklos, P.; Balint, A.; Albright, L. F. Acta Chim.-Hung.1983, 114, 79.
(11) Rangaiah, G. P.; Pang, N. S.; Tay, V. L. T. A Study ofKinetic Models for Simulating Industrial Ethane Cracking Reac-tors. Proceedings of the 4th Asian Pacific Confederation of Chemi-cal Engineering (APCChE), Singapore, 1987.
(12) Froment, G. F.; Kinetics and Reactor Design in theThermal Cracking for Olefins Production. Chem. Eng. Sci. 1992,47, 2163.
(13) Heynderickx, G. J.; Froment, G. F. Simulation and Com-parison of the Run Length of an Ethane Cracking Furnace withReactor Tubes of Circular and Elliptical Cross Sections. Ind. Eng.Chem. Res. 1998, 37 (3), 914.
(14) Rao, M. V. R.; Plehiers, P. M.; Froment, G. F. The CoupledSimulation of Heat Transfer and Reaction in a Pyrolysis Furnace.Chem. Eng. Sci. 1988, 43, 1223.
(15) Plehiers, P. M.; Froment, G. F. Firebox Simulation of OlefinUnits. Chem. Eng. Commun. 1989, 80, 81.
(16) Dente, M.; Pierucci, S.; Ranzi, E. New Improvements inModelling Kinetic Schemes for Hydrocarbons Pyrolysis Reactors.Chem. Eng. Sci. 1992, 47, 2629.
(17) Silva, C M.; Biscaia Jr, E. C. Genetic algorithm develop-ment for multi-objective optimization of batch free-radical polym-erization reactors. Comput. Chem. Eng. 2003, 27, 1329.
(18) Srinivas, N.; Deb, K. Multi-Objective Function Optimiza-tion Using Non-Dominated Sorting Genetic Algorithms. Evol.Comput. 1995, 2, 221.
(19) Goldberg, D. E. Genetic Algorithms in Search, Optimizationand Machine Learning; Addison-Wesley: New York, 1989.
(20) Mitra, K.; Deb, K.; Gupta, S. K. Multi-Objective DynamicOptimization of an Industrial Nylon-6 Semi-batch Reactor UsingGenetic Algorithm, J. Appl. Polym. Sci. 1998, 69, 69.
(21) Rajesh, J. K.; Gupta, S. K.; Rangaiah, G. P.; Ray, A. K.Multi-Objective Optimization of Industrial Hydrogen Plants.Chem. Eng. Sci. 2001, 56, 999.
(22) Deb, K.; Gulati, S. Design of truss-structures for minimumweight using genetic algorithms. J. Finite Elements Anal. Des.2001, 37, 447.
(23) Yee, A. K. Y.; Ray, A. K.; Rangaiah, G. P. Multi-objectiveoptimization of an industrial styrene reactor. Comput. Chem. Eng.2003, 27, 111.
(24) Deb, K.; Pratap, A.; Agarwal, S.; Meyarivan, T. A Fast andElitist Multi-Objective Genetic Algorithm: NSGA-II. IEEE Trans.Evol. Comput. 2002, 6, 182.
(25) Deb, K.; Agrawal, R. B. Simulated Binary Crossover forContinuous Search Space. Complex Syst. 1995, 9, 115.
(26) Tarafder, A.; Ray, A. K.; Rangaiah, G. P. Application ofNondominated Sorting Genetic Algorithms for Multi-objectiveOptimization of an Industrial Styrene Reactor. Proceedings of the2nd International Conference on Computational Intelligence,Robotics and Autonomous Systems, Singapore, Dec 15-18, 2003.
(27) Kasat, R. B.; Kunzru, D.; Saraf, D. N.; Gupta, S. K.Multiobjective optimization of industrial FCC unit using elitistnondominated sorting genetic algorithm. Ind. Eng. Chem. Res.2002, 41, 4765.
(28) Nandasana, A.; Ray, A. K.; Gupta, S. K. Dynamic modelof an industrial steam reformer and its use for multiobjectiveoptimization. Ind. Eng. Chem. Res. 2003, 42, 4028.
(29) Deb, K.; Mitra, K.; Dewri, R.; Majumdar, S. Towards aBetter Understanding of the Epoxy Polymerisation Process UsingMulti-objective Evolutionary Computation; KanGAL Report No.2004001; Kanpur Genetic Algorithm Laboratory: Kanpur, India,2004 (available at http://www.iitk.ac.in/kangal/pub.htm).
(30) Deb, K. Unveiling innovative design principles by meansof multiple conflicting objectives. Eng. Optim. 2003, 35, 445.
(31) Knudsen, J. G.; Katz, D. L. Fluid Dynamics and HeatTransfer; McGraw-Hill: New York, 1958.
(32) Nekrasov, B. B. Hydraulics; Peace Publishers: Moscow,USSR, 1969.
Received for review January 13, 2004Revised manuscript received October 20, 2004
Accepted October 20, 2004
IE049953M
Ind. Eng. Chem. Res., Vol. 44, No. 1, 2005 141