Embed Size (px)
Citation preview

CollaboratiKnow
Faculty & Research
ve Netwoledge Di
J. S
2004
W
rks as Determinants of ffusion Patterns
by ingh
/74/SM
orking Paper Series

Collaborative Networks as Determinants of Knowledge Diffusion Patterns
Jasjit Singh Harvard Business School, Soldiers Field, Boston, MA 02163, USA
617 495 6041
http://www.jasjitsingh.com
May 04, 2004
I would like to thank Ajay Agrawal, Juan Alcacer, Bharat Anand, Pierre Azoulay, Richard Caves, Iain
Cockburn, Ken Corts, Lee Fleming, Robert Gibbons, Heather Haveman, Tarun Khanna, Steven Klepper, Josh
Lerner, Jordan Siegel, Olav Sorenson, Michael Stolpe, Toby Stuart, Peter Thompson, Dennis Yao and seminar
participants at CMU, Columbia, Emory, GWU, Harvard, HEC, IESE, INSEAD, Instituto de Empresa, LBS,
Maryland, Minnesota, MIT, NBER, NUS, NYU, Rutgers, SMU, UNC, Vanderbilt and Wharton for helpful
comments. I also thank Division of Research at HBS for funding. Errors remain my own.

Abstract
This paper examines if collaborative networks among individuals help explain two widely
documented empirical patterns of knowledge diffusion: (1) geographic localization of knowledge
flows, and (2) easier transmission of knowledge within firms than between firms. A novel
regression framework using choice-based sampling is applied in order to estimate the probability
of micro-level knowledge flow between individuals. Knowledge flows are measured using
citations made by U.S. patents originating between 1986 and 1995 from around 3,000 firms.
Collaborative links among individuals are inferred using a “social proximity graph” constructed
using patent collaboration data for more than one million inventors from 1975 onwards. The
existence of a direct or indirect collaborative tie is found to be associated with a greater probability
of knowledge flow, with the probability increasing with the directness of the tie. Even more
interestingly, controlling for collaborative ties significantly reduces the estimated impact of
geographic co-location and firm boundaries on the probability of knowledge flow. In fact,
conditional on the existence of close collaborative ties, geographical co-location and firm
boundaries have no additional effect on the probability of knowledge flow.
Keywords: Knowledge spillovers, Technology diffusion, Social networks, Collaborative ties, Innovation
JEL Codes: F2, O3, R1, L0, M2
1
1. Introduction
The ease with which knowledge diffuses has important implications for innovation and
growth (Grossman and Helpman, 1991). However, even though ideas are intangible in nature,
empirical evidence shows that they do not flow freely across regional and firm boundaries. Two
patterns of knowledge diffusion have been identified. First, knowledge flows are geographically
localized (Jaffe, Trajtenberg and Henderson, 1993). Second, knowledge flow is easier within firm
boundaries than between firms (Kogut and Zander, 1992). This paper studies collaborative networks
among individuals as the mechanism driving both these patterns of knowledge diffusion.
Numerous factors, including informal networks, institutions, norms, language, culture,
incentives, and other formal and informal mechanisms might also affect the ease with which
knowledge diffuses. However, this paper studies the extent to which the observed knowledge
diffusion patterns can be accounted for simply by the fact that people within the same region or firm
have close collaborative links that might facilitate flow of complex knowledge. In particular, I analyze
the extent to which direct and indirect collaborative ties between inventors help account for the effect
of geographic co-location and firm boundaries on the probability of knowledge flow between
individual inventors of U.S. patents. Following previous research, I use patent citations to measure
these micro-level knowledge flows. The probability of knowledge flow is estimated using a novel
regression framework based on choice-based sampling (Manski and Lerman, 1977). This approach
helps address some methodological concerns regarding existing use of citations for measuring
knowledge diffusion (Thompson and Fox-Kean, 2004).
A rich literature in sociology studies information flow through interpersonal networks (Ryan
and Gross, 1943; Coleman, Katz and Mendel, 1966; Granovetter, 1973; Burt, 1992; Rogers, 1995).
However, different kinds of networks might be effective for transmitting different kinds of
information. For example, in their study of transmission of complex technical knowledge from
publicly funded research to private pharmaceutical firms, Cockburn and Henderson (1998) conclude:
“It is important that these researchers [of private firms] be active collaborators with public sector
researchers. Reading the journals, attending conferences, even being an active player on the informal
2

network of information transfer within the industry are insufficient” (p. 163). Motivated by their
findings, I rigorously examine a large dataset to investigate the extent to which diffusion of complex
technical knowledge can be explained by collaborative ties between individuals. My analysis allows
the possibility that direct and indirect ties could matter to a different extent. For example, if an
individual X has a direct collaborative relationship with individual Y, and Y has a direct tie with Z, Z
might learn indirectly about X’s work through his tie with Y. To measure the directness of
collaborative ties among over a million inventors in the U.S. patent database, I construct a “social
proximity graph” based on information about the team of inventors for each individual patent. This
graph allows me to derive a measure of “social distance” between inventors.
Three recent papers are particularly related to this study. Stolpe (2001) uses patent data to test
if direct collaborative links between individuals lead to knowledge diffusion, but does not find
empirical support for this in the specific setting of liquid crystal display technology. Agrawal,
Cockburn and McHale (2003) show that patents by inventors who move from one geographic region
to another continue to be cited by former collaborators from their original region, reflecting that direct
ties resulting from past collaborations can continue to be a mechanism for knowledge flow even
across regions. Breschi and Lissoni (2002) find the association between patent citations and
geographic co-location in Italy to be greater for socially connected patent teams, suggesting that there
might be important interaction effects between geographic co-location and collaborative links. I build
upon this stream of research by using a much larger dataset and improved methodology to study the
impact of both direct and indirect collaborative ties on micro-level knowledge flows, and by further
extending the analysis to study if these collaborative ties help explain observed patterns of intra-
regional and intra-firm knowledge flow.
My analysis reveals that collaborative networks have a strong influence on knowledge
diffusion, with direct collaborative ties being more effective than indirect ties. Further, the effect of
being in the same region or the same firm on probability of knowledge flow falls significantly once
collaborative networks have been accounted for. In fact, conditional on having close collaborative
ties, geographical co-location and firm boundaries have little effect on probability of knowledge flow.
In contrast, for patent pairs with only indirect collaborative ties or no collaborative ties at all,
3

geographic co-location and firm boundaries continue to be associated with greater probability of
knowledge flow, possibly because of other kinds of formal and informal mechanisms influencing
intra-regional and intra-firm knowledge flow.
The paper is organized as follows. Section 2 motivates my formal hypotheses. Section 3
describes the patent citation data as well as the data on inventors. Section 4 introduces my citation-
level regression framework for estimating probability of knowledge flow, and also describes how I
measure collaborative ties using a “social proximity graph”. Section 5 reports the empirical findings.
Section 6 discusses limitations of this study. Section 7 offers implications and concluding thoughts.
2. Hypotheses
This analysis in this paper is comprised of three main parts, as summarized in Figure 1 and
detailed in the formal hypotheses appearing in this section. The first part is to formally establish the
“fact” that intra-regional and intra-firm knowledge flow is more intense than that across regions and
firms. The second part is to test the extent to which existence and directness of collaborative links
between individuals determines the probability of knowledge flow between them. The third part,
which forms the crux of this paper, is to combine the results from the first two parts in order to
examine the extent to which collaborative networks explain the more intense knowledge flow within
regions and firms.
While previous work has found empirical support for geographic localization of knowledge
flows (e.g., Jaffe, Trajtenberg and Henderson, 1993), recent work raises methodological concerns that
could have led to over-estimation of this phenomenon in existing research (Thompson and Fox-Kean,
2004). Therefore, before trying to explain intra-regional knowledge flows, I first test if the result does
hold even when using a new approach (explained later) that addresses some of these concerns.
Hypothesis 1. The probability of knowledge flow within a region exceeds that between different
regions, even after controlling for technological specialization of regions.
The second pattern of knowledge diffusion that I study is that firms transmit knowledge more
effectively than would be possible through a market-mediated mechanism (Kogut and Zander, 1992).
4

Before examining collaborative networks as a possible driver for this, I formally reproduce this result
by testing the following hypothesis:
Hypothesis 2. The probability of knowledge flow within a firm exceeds that between different firms,
even after controlling for technological specialization of firms.
Mobility of individuals has been shown to be one mechanism through which knowledge gets
acquired by existing firms (Saxenian, 1994; Almeida and Kogut, 1999; Rosenkopf and Almeida,
2003) as well as start-ups (Klepper, 2001; Gompers, Lerner and Scharfstein, 2002). However, even in
the absence of direct mobility of individuals, information and knowledge can diffuse through
interpersonal networks (Zander and Kogut, 1995; Zucker, Darby and Brewer, 1998; Shane and Cable,
2002; Stuart and Sorenson, 2003; Uzzi and Lancaster, 2003). This paper focuses specifically on
interpersonal ties that arise either from direct collaboration between inventors or indirect links
between them through other inventors they both have links with. The next hypothesis is that such
links do indeed matter for transmission of knowledge.
Hypothesis 3. The probability of knowledge flow is greater between inventors with a direct or
indirect collaborative tie than between inventors that are not connected in the collaborative network.
Direct and indirect ties might have different implications for transmitting knowledge.
Granovetter (1973) emphasizes that ties providing access to non-redundant information might be
more valuable. While indirect ties provide non-redundancy, and hence might be more efficient for
transmission of simple codifiable information, direct ties are potentially more useful for transferring
knowledge that is complex and not easily codified (Ghoshal, Korine and Szulanski, 1994; Uzzi, 1996;
Hansen, 1999). The codified part of such knowledge (e.g., the subset of knowledge behind an
innovation that gets codified as a patent description) may represent just the “tip of the iceberg”, with
the remaining knowledge being “tacit” (Polanyi, 1966; Nelson and Winter, 1982; Kogut and Zander,
1992). Transmission of such knowledge may need close interaction between individuals (Allen, 1977;
Nonaka, 1994; Szulanski, 1996). In addition, direct relationships might also induce more trust,
improving willingness of individuals to share knowledge (Tsai and Ghoshal, 1998; Levin and Cross,
2003). Transmission of complex technical knowledge should therefore become more difficult as the
5

“social distance”, or the number of intermediaries needed to pass knowledge from the source to the
destination, increases. This suggests the following hypothesis:
Hypothesis 4. The probability of knowledge flow between individuals is a decreasing function of the
social distance between them.
Now I come to the main hypotheses of interest, which is to study the extent to which the
results from Hypotheses 1 and 2 can be explained by the collaborative networks from Hypotheses 3
and 4. Sorenson and Stuart (2001) show that geographical localization of venture capital investments
is a result of localized flow of information regarding investment opportunities, which in turn results
from localized interpersonal ties in the venture capital community. Analogously, I test if the
correlation between geographic co-location and knowledge flow can be explained by the fact that
collaborative networks are more likely to exist between people from the same region, as given by the
following formal hypothesis:
Hypothesis 5. Controlling for collaborative networks leads to a significant drop in the effect of
geographic co-location of inventor teams on the probability of knowledge flow between them.
The alternate hypothesis is that geographic concentration of knowledge flows is driven not by
collaborative networks but by other mechanisms such as informal interaction (“ideas in the air”) or
region-specific factors like local infrastructure, institutions, regional publications, communication
channels, norms, culture and government policies.
Analogous to studying why intra-regional knowledge flows are strong is the question of why
knowledge flows are stronger within firms than between firms. Like Simon (1991) and Grant (1996), I
take individuals as the unit of analysis for studying knowledge flows even within organizations.
Kogut and Zander (1992) describe firms as “social communities in which individual and social
expertise is transformed into economically useful products and services by the application of a set of
higher-order organizing principles” (p. 384). However, applying a unified network framework to both
inter-firm and intra-firm knowledge flows implies that studying “higher-order organizing principles”
is beyond the scope of this paper. However, I do explore how much of a firm’s ability to transfer
knowledge between its employees can be explained simply by the fact that it is a tightly knit “social
6

community” in the specific sense of having a dense collaborative network. This gives my final
hypothesis:
Hypothesis 6. Controlling for collaborative networks leads to a significant drop in the effect of firm
boundaries on the probability of knowledge flow between two teams of inventors.
The alternate hypothesis here might be that intra-firm knowledge flows are driven not by
collaborative networks of individuals but by other mechanisms such as informal interactions within
organizations, organizational learning routines, confidentiality-related barriers, legal obstacles or
incentive issues associated with firm boundaries.
3. Patent Data
3.1. Patent Citations as Measure of Knowledge Flow
My dataset on US patents was constructed by merging data from the US Patent Office
(USPTO) with an enhanced version made available by Jaffe and Trajtenberg (2002). Despite several
challenges, patents are perhaps the best available measure of innovation for large-sample research
(Griliches, 1990). A major issue with using patent data is that only some of the innovations are
patented (Levin, Klevorick, Nelson and Winter, 1987). Since this makes counts of patents and patent
citations misleading as raw measures, I only estimate the probability of knowledge flow between two
innovations that do end up as patents, without claiming that these comprise all the innovations.
Patent citations leave behind a trail of how a new innovation potentially builds upon existing
knowledge. An inventor is legally bound to report relevant “prior art”, with the patent examiner
serving as an objective check. Unlike academic papers, there is usually an incentive not to include
superfluous citations, as that might reduce the scope of one’s own patent. There are, however, two
factors that add noise to citations as a measure of knowledge flow. First, citations might be included
by the inventor for strategic reasons (e.g., to avoid litigation). Second, a patent examiner might add
citations to patents that the original inventor knew nothing about. Recent studies comparing citation
data with inventor surveys show that the correlation between patent citations and actual knowledge
flow is indeed high, but not perfect (Jaffe and Trajtenberg, 2002; Duguet and MacGarvie, 2002). The
7

defense given for the common use of patent citations for research is that use of citations should be
appropriate in large-sample studies as long as the noise does not bias the results of interest. Note that
viewing patent citations as being correlated with knowledge flows is not the same as claiming that
patents themselves are the mechanism behind these knowledge flows. Consider the analogy that a
PhD student may cite research papers of his advisor, even though knowledge gained by working
closely with the advisor could be much more than what could be captured in the advisor’s papers.
Since I would like to distinguish between knowledge flows within and between firms, the data
had to be cleaned to correctly identify the firm associated with each patent. This was a non-trivial
exercise because a firm’s patents may be listed under the name of one of its subsidiaries. Through a
process described in Singh (2004) in detail, I performed parent firm identification using a combination
of available Compustat-based parent firm identifiers, Stopford’s Directory of Multinationals, Dun and
Bradstreet’s Who Owns Whom directories and Internet sources. About 3,000 major firms were
identified in the process, and this paper studies patents filed by these firms during 1986-95.1
To study the effect of geographic co-location on probability of knowledge flow, a “region”
was defined as one of the states in the U.S. While I would have liked to study knowledge flows at an
even finer geographic unit of analysis, data constraints allowed me to study localization of knowledge
flows only at the level of the state. Also, I focus only on innovations arising in the U.S. because my
dataset does not have clean state-level information for other countries.
3.2. Inventors
Each patent includes the name and address of each of its individual inventors. A challenge
in using this data, however, is correctly identifying when two different records refer to the same
person. To this end, I use information on the first, middle and last names of inventors, and on the
technological characteristics of their patents. I experimented with several methods to avoid too
1 I restricted the sample to 1986-95 since the parent-subsidiary match used data sources from around 1990. The
3,000 firms account for about half of all patents. The rest are scattered among individuals and 165,000 firm and
non-firm organizations. Non-firm entities were not included to keep the inter-firm vs. intra-firm comparison
clean.
8

many “false positives” (different individuals being incorrectly identified as being the same) and
too many “false negatives” (different records of the same inventor being incorrectly identified as
having two different inventors). As a reasonable compromise, I finally arrived at an algorithm that
identified two records as having the same inventor if and only if the following three conditions
held:
1. The first and last names matched exactly.
2. The middle initials, if available, were the same.
3. When the middle initial field was blank in at least one of the two records, the records also
overlapped on at least one of their technology "subcategories".
The “subcategory” definition in the last condition is taken from Jaffe and Trajtenberg (2002),
who divide the 418 US patent classes into 38 different subcategories. Using only the first two
conditions would have identified around 1.3 million distinct inventors. The third condition makes
the matching criteria more stringent, leading to around 1.7 million inventors. I tried to rule out
more “false positives” by requiring the finer patent class itself to overlap, or looking for an overlap
of patent citations across patents. However, using either of these extra conditions led to too many
"false negatives", since the overlap across records of the same inventor turned out to be lower than
I had expected. I also considered requiring an additional match for street address and/or assignee
firm, as used by Fleming, Colfer, Marin and McPhie (2004). However, I decided against it because
interaction of collaborative links with geography and firm boundaries is a central focus of this
paper, so using geography or firm identity for matching might bias these results. Also, as Fleming,
Colfer, Marin and McPhie (2003) find, forcing these requirements would make the match too
conservative, an issue they handle by not requiring the requirements for uncommon last names.
There would, irrespective of the algorithm used, definitely be some errors in any matching
process. However, unless there is a reason to believe that the matching is producing systematic
errors, it should lead to an attenuation bias that only understates the effect of collaborative
networks on probability of knowledge diffusion. Therefore, any effect I find for collaborative
networks could be interpreted as a lower bound for its real effect.
9

4. Empirical Methodology
Imagine that the probability that a patent K cites a patent k is given by a “citation function”
P(K, k). Our interest lies in estimating what drives this probability.
4.1. Choice-Based Sampling
Since the number of potentially citing and cited patents can be of the order of a million, the
number of all possible dyads (K, k) can be of the order of a trillion. In principle, one could take a
random sample of patent dyads from the population of all possible dyads. One could then define a
binary variable y that equals 1 if the citation actually takes place, and 0 otherwise, and estimate the
citation function by assuming that it can be approximated using a logistic functional form. In other
words, the dichotomous dependent variable y would be taken as a Bernoulli outcome that takes a
value 1 for observation i with the probability
ββixii e
xxxy −+=Λ===
11)()|1Pr(
where xi is the vector of covariates and β is the vector of parameters to be estimated.
However, an estimation approach based on random sampling of patent pairs is not practical because
citations between random pairs of patents are very rare: there are only about seven actual citations for
every one million potential citations, making estimation impossible even with very large samples.
From an informational point of view, it would be desirable to have a higher fraction of
observations with y = 1 in the sample. This can be achieved by a “choice-based” sampling procedure
that deliberately oversamples the patent pairs with y = 1.2 In this approach, the sample is formed by
taking a fraction α of the population’s dyads with y = 0, and a fraction γ of the dyads with y = 1, α
being much smaller than γ. However, since this stratification is done on the dependent variable, using
the usual logistic estimates would lead to a selection bias. A technique that overcomes this problem is
the weighted exogenous sampling maximum likelihood (WESML) estimator suggested by Manski and
2 The online appendix accompanying this paper gives technical details of my methodology. For a general
discussion on choice-based sampling, please see Amemiya (1985, pp. 319-338), Greene (2003, p. 673) or King
and Zeng (2001). Sorenson and Fleming (2001) have also used this technique for predicting patent citations.
10

Lerman (1977). The central idea is to explicitly recognize the difference in the sampling rates for the
zeroes and the ones by weighting each observation in the log likelihood function by the inverse of the
ex ante probability of inclusion of the corresponding observation in the sample. In other words, each
sample observation is weighted by the number of elements it represents from the overall population in
order to make the choice-based sample “simulate” a random exogenous sample. The WESML
estimator is obtained by maximizing the following weighted “pseudo-likelihood” function:
{ } { }∑∑∑=
−
==
+−=Λ−+Λ=n
i
xyi
yi
yiw
ii
ii
ewL1
)21(
01
)1ln()1ln(1)ln(1ln β
αγ
)1)(/1()/1( iii yyw −+=
where αγ . In addition, the appropriate estimator of the asymptotic
covariance matrix is White’s robust “sandwich” estimator used for pseudo-maximum likelihood
estimation. Further, since the same citing patent can occur in multiple observations, the standard
errors should be calculated without assuming independence across these observations.
4.2. Sample Construction
The basic WESML approach described above samples all y = 0 observations with equal
probability α, irrespective of their “relevance.” Since technological similarity of two patents is a
strong determinant of the probability of citation, estimation efficiency can be improved by matching
each citing pair in the sample with a set of “control pairs” such that the citing and cited patent in each
control pair belong to the same respective technology class as those in the original citing pair.3 As the
online appendix accompanying this paper shows, the WESML approach can now be generalized by
defining the weight attached to a y = 0 observation to be the reciprocal of the ex ante probability of a
y = 0 population pair with the same technological characteristics being selected into the sample. In
addition, I assigned each actual citation (i.e., y = 1 observation) a weight of one since all actual
citations were included in the sample. This procedure led to a sample with over 2.5 million
observations.
3 Sorenson and Stuart (2001) use a similar research design for estimating probability of venture capital funding.
11

4.3. Control Variables for Probability of Citation
As the time lag between the citing and cited patents increases, the citation probability is
known to increase initially and then fall (Jaffe and Trajtenberg, 2002). To control for this, my
regressions use fixed effects for the difference between the application years of the patents. In
addition, I also use fixed effects to capture systematic differences in citation rates over time.
Further, I include fixed effects for the technological category of the citing patent to capture cross-
sector differences in citation rates.
Another key concern is that technologically similar patents have a greater probability of
citation. Existing patent citation literature typically compares the 3-digit technological class of the
citing and cited patents to control for this. However, this can lead to biased estimates, since there
can be large heterogeneity in technology even within a 3-digit class. For example, the 3-digit class
“Aeronautics” includes 9-digit subclasses as diverse as “Spaceship control” and “Aircraft seat
belts” (Thompson and Fox-Kean, 2004). To take this into account, I define dummy variables for
the same broad technological category (1 out of 6), the same technological subcategory (1 out of
36), the same 3-digit primary class (1 out of 418) and the same 9-digit primary class (1 out of
150,000). Further, since the designation of a subclass as “primary” can sometimes be ad hoc, I also
include a dummy variable that captures whether at least one of the secondary subclasses of a patent
is the same as one of the primary or secondary subclasses for the other patent. While there is a
chance that even these technology controls are not perfect, these are the most fine-grained level
possible with USPTO data, and are much more detailed than the coarse controls used in most
existing studies.4
4 Some regression-based studies use the number of citations as the dependent variable (e.g., Jaffe and
Trajtenberg, 2002). These models include a measure of “average technological distance” between citing and
cited sets of patents using only a 2 or 3-digit technology classification. So the issue of bias remains: sets with a
greater fraction of patent pairs with the same 9-digit technology have a greater probability of citations, and also
more co-location of patents.
12
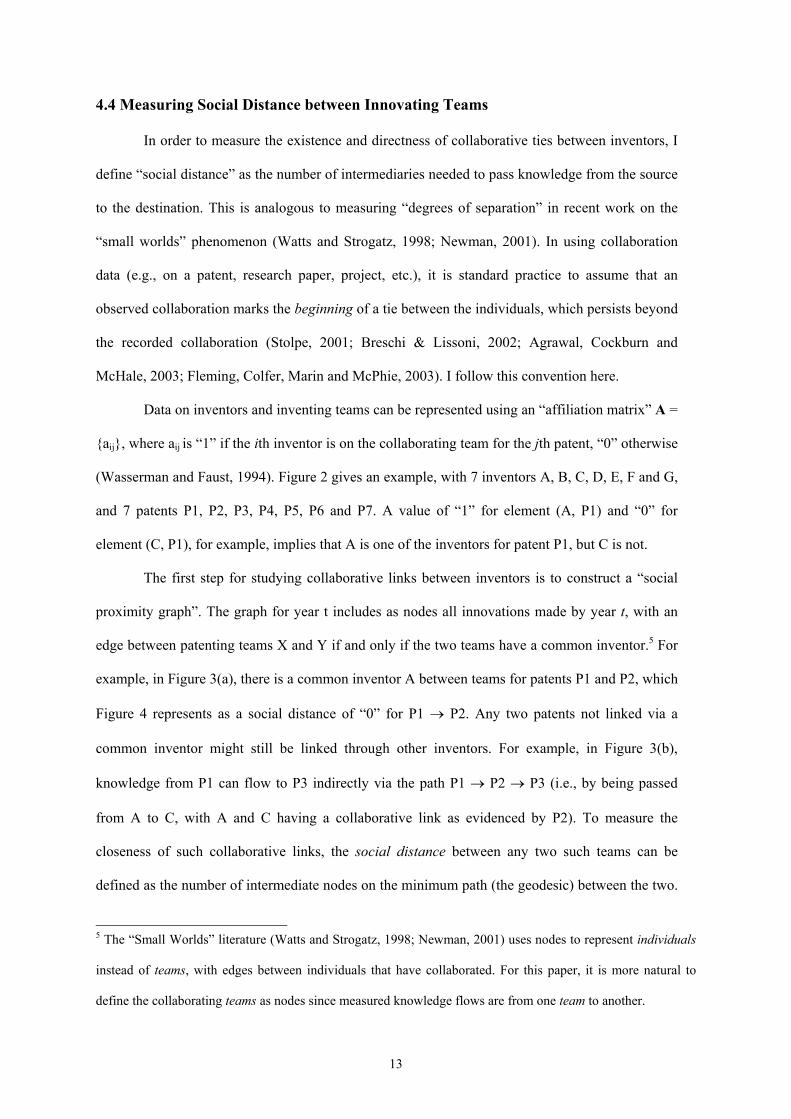
4.4 Measuring Social Distance between Innovating Teams
In order to measure the existence and directness of collaborative ties between inventors, I
define “social distance” as the number of intermediaries needed to pass knowledge from the source
to the destination. This is analogous to measuring “degrees of separation” in recent work on the
“small worlds” phenomenon (Watts and Strogatz, 1998; Newman, 2001). In using collaboration
data (e.g., on a patent, research paper, project, etc.), it is standard practice to assume that an
observed collaboration marks the beginning of a tie between the individuals, which persists beyond
the recorded collaboration (Stolpe, 2001; Breschi & Lissoni, 2002; Agrawal, Cockburn and
McHale, 2003; Fleming, Colfer, Marin and McPhie, 2003). I follow this convention here.
Data on inventors and inventing teams can be represented using an “affiliation matrix” A =
{aij}, where aij is “1” if the ith inventor is on the collaborating team for the jth patent, “0” otherwise
(Wasserman and Faust, 1994). Figure 2 gives an example, with 7 inventors A, B, C, D, E, F and G,
and 7 patents P1, P2, P3, P4, P5, P6 and P7. A value of “1” for element (A, P1) and “0” for
element (C, P1), for example, implies that A is one of the inventors for patent P1, but C is not.
The first step for studying collaborative links between inventors is to construct a “social
proximity graph”. The graph for year t includes as nodes all innovations made by year t, with an
edge between patenting teams X and Y if and only if the two teams have a common inventor.5 For
example, in Figure 3(a), there is a common inventor A between teams for patents P1 and P2, which
Figure 4 represents as a social distance of “0” for P1 → P2. Any two patents not linked via a
common inventor might still be linked through other inventors. For example, in Figure 3(b),
knowledge from P1 can flow to P3 indirectly via the path P1 → P2 → P3 (i.e., by being passed
from A to C, with A and C having a collaborative link as evidenced by P2). To measure the
closeness of such collaborative links, the social distance between any two such teams can be
defined as the number of intermediate nodes on the minimum path (the geodesic) between the two.
5 The “Small Worlds” literature (Watts and Strogatz, 1998; Newman, 2001) uses nodes to represent individuals
instead of teams, with edges between individuals that have collaborated. For this paper, it is more natural to
define the collaborating teams as nodes since measured knowledge flows are from one team to another.
13

Thus the social distance is “1” for P1 → P3. Since knowledge flows are meaningful only from an
innovation that happens earlier to one that happens later, social distance need not be defined for P2
→ P1, P1 → P1, P2 → P2, etc., as indicated in Figure 4.
Now consider Figure 3(c). The above definition suggests a social distance of “1” for P2 →
P4, since there is a path P2 → P1 → P4. Does this make sense even though P1 precedes P2 in
time? If the year of their recorded collaboration were literally the only time when knowledge
passed between the inventors, the application year of every intermediate patent on the minimum
path would have to exceed that of the one preceding it, and there would be no path of knowledge
flows from P2 to P4. However, as discussed earlier, since a recorded collaboration between A and
B is interpreted as the beginning of a collaborative tie between the two, B (who is the inventor for
P4) can build upon knowledge of P2 that she may gain through her ties with A. Thus knowledge
can flow “backwards” along the link P1 → P2, and then on to the link P2 → P4. Likewise,
knowledge from P3 could be passed by C to A, and then further from A to B through the chain of
ties P3 → P2 → P1 → P4, making the social distance P3 → P4 to be “2”.
The social proximity graph changes over time. I use separate social proximity graphs for
t=1986 through t=1995 to cover all the years for which I analyze knowledge flows. To measure
social distances for innovating teams from year t, we need to use a graph of collaborative ties
already in place by t. For example, the correct value of social distance from P3 to P6 is infinity
(since P6 took place in 1989, and P3 and P6 are not even in the same connected component in
1989) and not “2” (as an incorrect interpretation of the 1990 graph might suggest).6
There are two practical issues in using the social distance measure as defined above. First,
it imposes a rigid functional form assumption and potentially mixes “apples and oranges” into a
single cardinal measure (e.g., the common inventor case with distance=0 and the past collaboration
6 I construct the graph for year t using all collaborations from the first year in my data (1975) until year t. Since
the social distance measure might not be comparable across years, I use year fixed effects. An alternate
approach could be to use a rolling time window, e.g., use collaborations from year t-7 to t in defining the graph
for year t.
14

case with distance=1). Second, because of the large graph size, computing exact pair-wise social
distances is practically impossible.7 Fortunately, it is still practical to classify all observations into
five mutually exclusive and exhaustive categories based on whether the social distance is 0, 1, 2,
any finite value greater 2, or infinity (i.e., no social links).8 As Table 1 shows, I capture the first
four cases as categorical variables common inventor, past collaboration, common past
collaborator and indirect social link, with the no social link case being the reference category in all
regressions.
5. Results
5.1. Intra-region and intra-firm knowledge flows
Table 1 gives a summary of variables used in the regressions. Table 2 formally tests
Hypotheses 1 and 2 (i.e., that knowledge flows are particularly strong within the same region or
the same firm). The weighted logit framework described above is used to estimate the probability
of citation between patents, with the dependent variable being 1 when a patent pair has a citation, 0
otherwise. Column (1) finds positive and significant estimates for within same region and within
same firm. However, this could result simply from technological specialization of regions and
firms (Jaffe, Trajtenberg and Henderson, 1993). As column (2) shows, including controls for
technological relatedness (at the level of 3-digit technological class) between patents reduces the
estimated coefficients for within same region and within same firm. However, Thompson and Fox-
Kean (2004) have shown that even the 3-digit technological controls, though extensively used in
7 Wasserman and Faust (1994) suggest computing pair-wise distances by defining element xij of a matrix X as 1
if there is an edge between nodes i and j, 0 otherwise. The distance between i and j is then the smallest number p
such that the pth power matrix of X (i.e., p-1 multiplications of X into itself) has a non-zero entry (i, j).
Unfortunately, this and other similar approaches become impractical for very large graphs (Cormen, Leiserson
and Rivest, 1990).
15

existing literature, are insufficient. To address this, column (3) uses additional controls based on a
detailed 9-digit primary and secondary technological classification of patents. The estimates for
within same region and within same firm fall further, but still remain significant. Since statistical
significance is not a surprise given the large sample size, I now turn to the magnitude of these
effects.
The marginal effects for the weighted logit model are shown in square brackets in column
(3) of Table 2, after being multiplied by a million for readability.9 The predicted citation rate
between two random patents turned out to be about 12 in a million. Therefore, the reported
marginal effect of 9.58 for within same region implies that patents from the same region are 80%
more likely to have a citation than are otherwise similar patents from different regions. Similarly,
the marginal effect of 26.6 for within same firm implies that patents from the same firm are over 3
times as likely to have a citation than are patents from different firms.
5.2. Effect of social distance on knowledge flows
As discussed earlier, Table 1 defines common inventor, past collaboration, common past
collaborator and indirect social link as dummy variables to capture a social distance of 0, 1, 2 and > 2
(but finite). If two patents belong to the same connected component in the social proximity graph,
exactly one of these dummy variables is 1. Table 3 reports summary statistics for these variables. For
the entire sample, the fraction of pairs belonging to the same connected component is 64.7% for pairs
with citations, and only 48.9% for pairs with no citation, consistent with the hypothesis that
connectedness leads to greater probability of citation. The inequality continues to hold true for the
sub-sample without self-citations by firms, where the fraction of pairs belonging to the same
connected component is 54.3% for pairs with citations, and only 47.9% for pairs with no citation.
8 I explicitly find out all pairs with a social distance of 0, 1 or 2 by calculating the first three power matrices
mentioned above, since these matrices are sparse and computationally manageable. I then distinguish between
having a more indirect social link and no social link by identifying all connected components of a graph.
9 For logit, the marginal effect of a variable j can be shown to be βj Λ(xβ)[1-Λ(xβ)]. I substitute the mean
predicted probability for Λ(xβ) into this expression in order to get an estimate of the marginal effect.
16

Table 4 reports regression analysis to test Hypotheses 3 and 4 (i.e., the impact of collaborative
links on probability of patent citation). As a comparison of columns (1) and (2) shows, controlling for
technological relatedness of patents is again important since teams with collaborative links are also
more likely to be technologically related. Therefore, column (2) represents the regression
specification of choice. The joint hypothesis that the social distance measures do not matter is easily
rejected even at the 1% significance level, with a χ2(4) statistic of 8351.1. Consistent with Hypothesis
3, collaborative links seem to matter since estimates for common inventor, past collaboration,
common past collaborator and indirect social link are all positive and significant. Note that the
reference group for comparison is patent pairs that are not connected at all.
Since statistical significance could again result from large sample sizes, I now show that these
effects are also large in magnitude. The marginal effects for column (2) can be interpreted as follows:
If two patents are trivially related via a common inventor (social distance = 0), the probability of
citation is about 5 times as much as that for unrelated patents. More interestingly, if they are related
via a past collaboration (social distance = 1), the probability of citation is still about 3.8 times as
much. Similarly, if they are related only via a common past collaborator (social distance = 2), the
probability of citation is about 3.2 times. Finally, if none of these cases occur but there still exists an
indirect collaborative link between two patents, the probability of citation is about 15% greater than
for unrelated patents. A statistical test of equality of estimates of different social measures was easily
rejected. Thus, consistent with Hypothesis 4, the probability of citation falls as the social distance for
a pair of patents increases.
5.3. Collaborative Networks and Patterns of Knowledge Flows
In this section, I test Hypotheses 5 and 6 (i.e., that knowledge flows are more intense within
the same region and the same firm because social distances are smaller). In other words, I explore the
extent to which denser collaborative networks can be seen as the mechanism driving more intense
knowledge flows within regions and firms.
The analysis appears in Table 5. For easy comparison, column (1) reproduces the intra-region
and intra-firm results from column (3) of Table 1. Column (2) adds the social distance measures to the
17

econometric model. Upon doing so, the coefficient estimate for within same region drops from 0.798
to 0.603, with its marginal effect falling from 9.58 in a million to 7.24 in a million. In other words,
once social distance has been controlled for, the incremental effect of geographic co-location on
probability of citation falls from 79.8% to 60.3%.10 Likewise, the coefficient estimate for within same
firm drops from 2.217 to 1.809, with the marginal effect falling from 26.6 in a million to 21.7 in a
million. Put differently, once social distance has been controlled for, the incremental effect of being in
the same firm on probability of citation falls from 222% to 181%. To summarize, controlling for
collaborative ties diminishes the result of localized knowledge flows as well as intra-firm knowledge
flows. Not only is the decrease non-trivial in magnitude for both cases, it is also found to be
statistically significant.11
Recall that a social distance of 0 represents the case of a common inventor between the cited
and the citing teams. To verify that the results are not driven just by this case, analysis not reported
here dropped all patent pairs with a social distance of 0 from the sample. The findings continued to
hold. In other words, knowledge flows were still strong within the same region or the same firm, and
introducing control variables for social distance of 1, 2 and >2 (but finite) still led to a large and
statistically significant drop in estimates for within same region and within same firm.
To investigate the effect of collaborative ties further, I now consider the possibility that direct
and indirect ties need not operate similarly for transferring knowledge. In other words, there might be
interaction effects between social distance and geographic co-location as well as between social
distance and firm boundaries. Since column (3) includes both these sets of interaction variables, the
“main effects” for within same region and within same firm now have to be interpreted as the effects
10 Normally, in non-linear models, one should only compare marginal effects and not coefficient estimates
across models. However, for rare events, the marginal effect βj Λ(xβ)[1-Λ(xβ)] can be approximated as βj
Λ(xβ), making βj directly interpretable as the fractional change in probability of citation when binary variable j
goes from 0 to 1.
11 To test statistical significance, the coefficients of within same region in columns (1) and (2) were interpreted
as means of samples drawn from normally distributed populations. A t-test was then used to test the hypothesis
that the two means could arise from the same population. An analogous test was done for within same firm.
18

for the case when the citing and cited patents are not connected at all. Interestingly, the interaction
effects for within same region with common inventor, past collaboration or common collaborator are
all almost equal in magnitude but opposite in sign to the main effect, so the two almost cancel out. In
other words, conditional on the social distance being small (i.e., 0, 1 or 2), geographical co-location
has almost no effect on citation probability. In fact, a formal hypothesis that these effects are 0 could
not be rejected. On the other hand, for patents that are connected only with larger social distances or
not connected at all, geographic co-location continues to affect citation probability significantly. An
explanation might be that, for teams with no close ties apparent from collaboration data on patents,
there might still exists other ties that are both geographically concentrated and beneficial for
knowledge flow. These could, for example, be collaborations that did not lead to patents, and hence
did not get captured in patent data. These could also be fundamentally different kinds of professional
and social interaction, such as meeting at conferences and professional get-togethers, or even at golf
clubs and coffee shops.
Analogously, the interaction effects for within same firm with common inventor, past
collaboration or common collaborator are all comparable in magnitude and opposite in sign to the
main effect for within same firm. In other words, conditional on the social distance being small (i.e., 0,
1 or 2), being in the same firm also has very small net effect on citation probability. Once more, a
formal hypothesis that the effect is 0 for the case of social distance of 0 or 1 could not be rejected.
Although the hypothesis that being within the same firm matters even at a social distance of 2 could
not be rejected, the net magnitude (0.332) is much smaller than the net magnitude (1.801) for social
distance greater than 2 or that (2.079) for unrelated teams. In other words, once social distance has
been controlled for, being in the same firm matters only when the social distance is not small. Once
more, this might simply be a result of collaborations not captured in patent data, or of alternate
mechanisms for intra-firm information flow.
19

6. Limitations
This paper studies knowledge diffusion through a collaborative network of individual
inventors, and explores direct and indirect collaborative ties as a mechanism behind knowledge flows
usually associated with geographic co-location and firm boundaries. By including all inventor teams
that have patented since 1975, the boundary specification and network sampling issues that plague
smaller-scale studies on networks are avoided. Also, analyzing knowledge flows among a far larger
sample than any similar study helps make the findings more generalizable. All this, however, is not
without cost.
The first issue is the usual concern of patents being imperfect as a measure of innovation, and
patent citations being imperfect as a measure of knowledge flow. Also, only a subset of collaborative
links between people gets captured in a patent-based network. In this paper, I have tried to address or
at least discuss these concerns to the extent possible. However, I acknowledge that there might still be
unresolved issues, and that there would be value in replicating such a study using other data sources
like surveys or firm archives. However, collecting alternate data that give the ability of conducting
studies of this scale is a big challenge.
A computational cost of working with a large-scale network is the difficulty of using more
sophisticated network-related measures. For example, while I study directness of links using my
“social distance” measure, I do not consider frequency of interaction, decay of social links over time,
and team size and characteristics. Also, though I make the distinction between direct and indirect ties
in knowledge diffusion, I do not study the role of “structural holes” (Burt, 1992; Ahuja, 2000).
Another methodological issue, which applies to most papers that take network ties as given, is that
network ties might actually arise endogenously as a result of deliberate investment in tie formation by
rational actors (Coleman, 1988; Glaeser, Laibson and Sacerdote, 2002). If people have a higher
likelihood of deliberately cultivating collaborative links in exactly those settings where they expect
more knowledge flows, regression estimates might overstate the true influence of collaborative links
on knowledge flows.
20
An emphasis in this paper is that collaborative networks are important for transfer of know-
how both within firms (Kogut and Zander, 1992) and between firms (von Hippel, 1988). Adopting a
network perspective at the individual level allows me to study both of these in a single framework.
However, this does not do full justice to a more sophisticated view of “organizational knowledge”
(Levitt and March, 1988; Huber, 1991; Kogut and Zander, 1992; Nonaka, 1994). Also, patent
citations could be more common within firms partly because a firm does not lose anything by making
superfluous citations to its own patents. The most conservative interpretation of my results would
therefore be to view the within same firm dummy merely as a control variable, and to read this paper
as only studying intra-regional knowledge flows. In results not reported here, all results regarding
collaborative networks and intra-regional knowledge flows continue to hold even if within-firm data
points are simply dropped.
7. Conclusion
This paper shows that collaborative networks have an important influence on knowledge
diffusion, and that the probability of knowledge diffusion increases with the directness of
collaborative ties between individuals. Even more interestingly, collaborative networks are found to
be an important mechanism behind two knowledge diffusion patterns: geographic localization of
knowledge flows and stronger intra-firm knowledge flows.
The analysis in this paper has important implications for knowledge management. It shows
that interpersonal networks remain key to management of complex knowledge, despite the growing
emphasis on formal knowledge management systems. Further, consistent with Cockburn and
Henderson (1998), it shows the importance of a specific kind of interpersonal links – those arising
from close collaborations between individuals rather than only casual interaction between them. A
caveat for acquiring knowledge from outside the firm is that collaborative links with outsiders can
lead to not just knowledge inflows but also knowledge outflows from a firm, so the net effect might
differ in different situations (Singh, 2004).
21

The specific finding that geographic co-location has little extra effect in cases of direct
collaborative ties suggests that geographic constraints on flow of knowledge can be overcome by
fostering collaborative links across regions. A firm might gain more knowledge from collaborative
links with people even in different regions than by just locating in a high-tech region per se without
developing such links. Similarly, from the point of view of a policy-maker, enticing the most
advanced firms to open a local division may not be enough for knowledge spillovers to local firms if
collaborative networks between the two do not get established. Again, there might be much to be
gained through explicit cultivation of collaborative networks, for example, through joint projects.
The findings on intra-firm knowledge flows have important implications as well. For
example, firm boundaries per se need not constrain knowledge flow if strong collaborative links can
be established with outsiders. Even mergers or acquisitions might not be sufficient for knowledge to
flow if the employees of the two former firms cannot be made to work closely. On the other hand, not
going to that extreme and just relying on alliances and joint ventures for knowledge transfer might be
enough as long as they can be managed to result in close collaborative ties between key people from
the two sides, an argument consistent with findings of Mowery, Oxley and Silverman (1996),
Rosenkopf and Almeida (2003), and Gomes-Casseres, Jaffe and Hagedoorn (2003).
The result that collaborative networks can help overcome geographic distances is particularly
important for developing countries. These countries could take an active approach towards learning
from others by tapping into foreign collaborative networks. In particular, overseas movement of
people (“brain drain”) need not always be bad. Consistent with Saxenian (2002), governments could
actively set up incentives and mechanisms for their well-trained emigrants to continue to maintain
close professional links with the professionals back home. Likewise, overseas location of R&D
facilities by local companies might not be all that bad if they can serve as “bridges” to get access to
the most advanced knowledge available internationally.
22

References Agrawal, A., I. Cockburn and J. McHale (2003), “Gone But Not Forgotten: Labor Flows, Knowledge
Spillovers, and Enduring Social Capital.” NBER Working Paper No. 9950 Ahuja, G. (2000), “Collaboration Networks, Structural Holes, and Innovation: A Longitudinal Study,”
Administrative Science Quarterly, 45(2000): 425-455. Allen, T.J. (1977). Managing the Flow of Technology. Cambridge, MA: MIT Press. Almeida, P. and B. Kogut (1999), “The Localization of Knowledge and the Mobility of Engineers in
Regional Networks,” Management Science, Vol. 45(7), 905-917. Amemiya, T. (1985) Advanced Econometrics. Harvard University Press, Cambridge. Breschi, S. and F. Lissoni (2002), “Mobility and Social Networks: Localised Knowledge Spillovers
Revisited.” Mimeo. Burt, R.S. (1992) Structural Holes: The Social Structure of Competition. Harvard University Press:
Cambridge, MA. Cockburn, I.M. and R.M. Henderson (1998), “Absorptive Capacity, Coauthoring Behavior, and the
organization of Research in Drug Discovery,” Journal of Industrial Economics, 46(2): 157-182. Coleman, J.S., E. Katz and H. Menzel (1966). Medical Innovation. New York: Bobbs-Merrill. Coleman, J.S. (1988),“Social Capital in the Creation of Human Capital” The American Journal of
Sociology, Vol. 94 Supplement, pp. S95-S120. Cormen, T.H., C.E. Leiserson and R. L. Rivest (1990). Introduction to Algorithms. MIT Press,
Cambridge, MA. Duget, E. and M. MacGarvie (2002), “How Well Do Patent Citations Measure Knowledge
Spillovers?” Working paper. Fleming, L., L. Colfer, A. Marin, J. McPhie (2003), “Why the Valley Went First: Agglomeration and
Emergence in Regional Inventor Networks,” Mimeo. Ghoshal, S., H. Korine and G. Szulanski (1994), “Interunit communication in multinational
corporations,” Management Science 40: 96-110. Glaeser, E.L, D. Laibson, and B. Sacerdote (2002),“The Economic Approach to Social Capital,”
Economic Journal. Gomes-Casseres, B., A.B. Jaffe and J. Hagedoorn (2003), “Do Alliances Promote Knowledge
Flows?” Mimeo. Gompers, P., J. Lerner and D. Scharfstein (2002), “Entrepreneurial Spawning: Public Corporations
and the Genesis of New Ventures, 1986-1999.” Mimeo. Granovetter, M.S. (1973),“The Strength of Weak Ties,” American Journal of Sociology. 78: 1360-
1380.
23

Grant, R.M. (1996), “Toward a Knowledge-Based Theory of the Firm,” Strategic Management Journal, 17: 109-122.
Greene, W. (2003) Econometric Analysis. Prentice Hall, 5th Edition. Griliches, Z. (1990), “Patent statistics as economic indicators: A survey” Journal of Economic
Literature 28: 1661-1797. Grossman, G., and E. Helpman (1991), Innovation and Growth in the World Economy, Cambridge,
MA: MIT Press. Jaffe, A.B., M. Trajtenberg and R. Henderson (1993), “Geographic localization of knowledge
spillovers as evidenced by patent citations” Quarterly Journal of Economics 434: 578-598. Jaffe, A.B. and M. Trajtenberg (2002). Patents, Citations & Innovations: A window on the knowledge
economy. MIT Press, Cambridge, MA. Hansen, M.T. (1999), “The Search-Transfer Problem: The Role of Weak Ties in Sharing Knowledge
across Organization Subunits,” Administrative Science Quarterly, 44: 82-111. Hellmann, T. (2002), “When do Employees become Entrepreneurs?” Working Paper 1770, Graduate
School of Business, Stanford University. Huber, G.P. (1991), “Organizational Learning: The Contributing Processes and the Literatures,”
Organization Science, 2(1): 88-115. King, G. and L. Zeng (2001), “Logistic Regression in Rare Events Data”, Political Analysis 9(2): 137-
163 Klepper, S. (2001), “Employee Startups in High-Tech Industries,” Industrial and Corporate Change,
10:639-674. Kogut, B. and U. Zander (1992), “Knowledge of the Firm, Combinative Capabilities, and the
Replication of Technology.” Organization Science. 3 (3): 383-397. Levin, D. and R. Cross (2003), “The Strength of Weak Ties You can Trust: The Mediating Role of
Trust in Effective Knowledge Transfer,” Management Science, Forthcoming. Levin, R., A. Klevorick, R. Nelson and S. Winter (1987), “Appropriating the returns from industrial
research and development.” Brookings Papers on Economic Activity 3: 783-820. Levitt, V. and J.G. March (1988), “Organizational Learning,” Annual Review of Sociology. 14: 319-
340. Manski, C.F. and S.R. Lerman (1977), “The Estimation of Choice Probabilities from Choice Based
Samples.” Econometrica 45(8): 1977-88. Mowery, D.C., J.E. Oxley and B.S. Silverman (1996), “Strategic Alliances and Inter-firm Knowledge
Transfer,” Strategic Management Journal, 17: 77-91. Nelson, R. and S. Winter (1982). An Evolutionary Theory of Economic Change. Harvard University
Press: Cambridge, MA. Newman, M.E.J. (2001), “The Structure of Scientific Collaboration Networks.” Proceedings of
National Academy of Science, USA. 98: 404-409.
24

Nonaka, I. (1994), “A Dynamic Theory of Organizational Knowledge Creation,” Organization
Science, 5(1): 14-37. Polanyi, M. (1966). The Tacit Dimension. London: Routledge & Kegan Paul. Rogers, E.M. (1985). Diffusion of Innovations. New York: Free Press. Rosenkopf, L. and P. Almeida (2003), “Overcoming Local Search through Alliances and Mobility.”
Management Science. 49(6). 0751-0766. Ryan, B. and N. Gross (1943), “The diffusion of hybrid seed corn in two Iowa communities.” Rural
Sociology, 8(1): 15-24. Saxenian, A.L. (1994). Regional Advantage: Culture and Competition in Silicon Valley and Route
128. Cambridge: Harvard University press. Saxenian, A.L. (2002), “Transnational Communities and the Evolution of Global Production
Networks: The Cases of Taiwan, China and India.” Industry and Innovation, 9(3): 183-202. Shane, S. and D. Cable (2002), “Network Ties, Reputation, and the Financing of New Ventures,”
Management Science. 48 (3): 364-381. Simon, H.A. (1991), “Bounded Rationality and Organizational Learning,” Organization Science, 2:
125-134. Singh, J. (2004), “Multinational Firms and Knowledge Diffusion: Evidence using Patent Citation
Data.” Mimeo. See http://www.jasjitsingh.com/academic/papers.html Sorenson, O. and T.E. Stuart (2001), “Syndication Networks and the Spatial Distribution of Venture
Capital Investments,” American Journal of Sociology, 106(6): 1546-88. Sorenson, O. and L. Fleming (2001), “Science and the Diffusion of Knowledge.” Working paper 02-
095, Harvard Business School. Stolpe, M. (2001), “Mobility of Research Workers and Knowledge Diffusion as Evidenced in Patent
Data The Case of Liquid Crystal Display Technology” Kiel Working Paper No. 1038. Stuart, T. and O. Sorenson (2003), “The Geography of Opportunity: Spatial Heterogeneity in
Founding Rates and the Performance of Biotechnology firms.” Research Policy 32: 229-253. Szulanski, G. (1996), “Exploring internal stickiness: Impediments to the transfer of best practice
within the firm,” Strategic Management Journal, 17: 27-43. Thompson, P. and M. Fox-Kean (2004), “Patent Citations and the Geography of Knowledge
Spillovers: A Reassessment.” American Economic Review, forthcoming. Tsai, W. and S. Ghoshal (1998), “Social capital and value creation: The role of intrafirm networks,”
Academy of Management Journal, 41: 464-476. Uzzi, B. (1996), “The sources and consequences of embeddedness for the economic performance of
organizations: The network effect,” American Sociological Review, 61: 674-698. Uzzi, B., and R. Lancaster (2003), “Relational embeddedness and learning: The case of bank loan
managers and their clients,” Management Science, 49: 383-399.
25

Von Hippel, Eric (1988), The Sources of Innovation, Cambridge: MIT Press. Wasserman, S. and K. Faust (1994). Social Network Analysis: Methods and Applications. Cambridge
University Press. Watts, D.J. and S. Strogatz (1998), “Collective Dynamics of Small World Networks.” Nature. 393:
440-442. Zander, U. and B. Kogut (1995), “Knowledge and the speed of the transfer and imitation of
organizational capabilities: An empirical test,” Organization Science, 6: 76-91. Zucker, L.G., M.R. Darby and M.B. Brewer (1998), “Intellectual Human Capital and the Birth of U.S.
Biotechnology Enterprises” American Economic Review 88 (1): 290-306.
26

Table 1: Definition of variables
Within same region Indicator variable that is 1 if the citing and cited patents originate from inventors located in the same region, i.e., the same state within US
Within same firm Indicator variable that is 1 if the citing and cited patents are owned by the same parent firm
Same tech category Indicator variable that is 1 if both the citing and the potentially cited patent belong to the same broad industry category (one of 6) as defined in the Jaffe and Trajtenberg (2002) database
Same tech subcategory Indicator variable that is 1 if both the citing and the potentially cited patent belong to the same broad technical subcategory (one of 36) as defined in the Jaffe and Trajtenberg (2002) database
Same primary tech class Indicator variable that is 1 if both the citing and the potentially cited patent belong to the same 3-digit primary technology class (one of about 450) as defined in the US Patent classification system
Same primary subclass Indicator variable that is 1 if both the citing and the potentially cited patent belong to the same 9-digit primary technology subclass (one of about 150,000) as defined in the US Patent classification system
Secondary subclass overlap Indicator variable that is 1 if at least one of the secondary 9-digit subclasses of one patent is the same as a primary or secondary subclass of the other patent in the dyad
Common inventor Indicator variable that is 1 if there is at least one common inventor between the citing and the cited patents. This corresponds to social distance of 0.
Past collaboration Indicator variable that is 1 if there is no common inventor between the two patents, but at least one inventor of the citing patent has collaborated with an inventor of the cited patent in the past. This corresponds to social distance of 1.
Common past collaborator Indicator variable that is 1 if neither of the above two hold, but there is a common collaborator who has worked with an inventor of the citing patent and an inventor of the cited patent in the past. This corresponds to social distance of 2.
Indirect network link Indicator variable that is 1 if none of the above three cases hold, but the two patents still belong to the same connected component of the social proximity graph. This corresponds to social distance of >2 but finite.
27
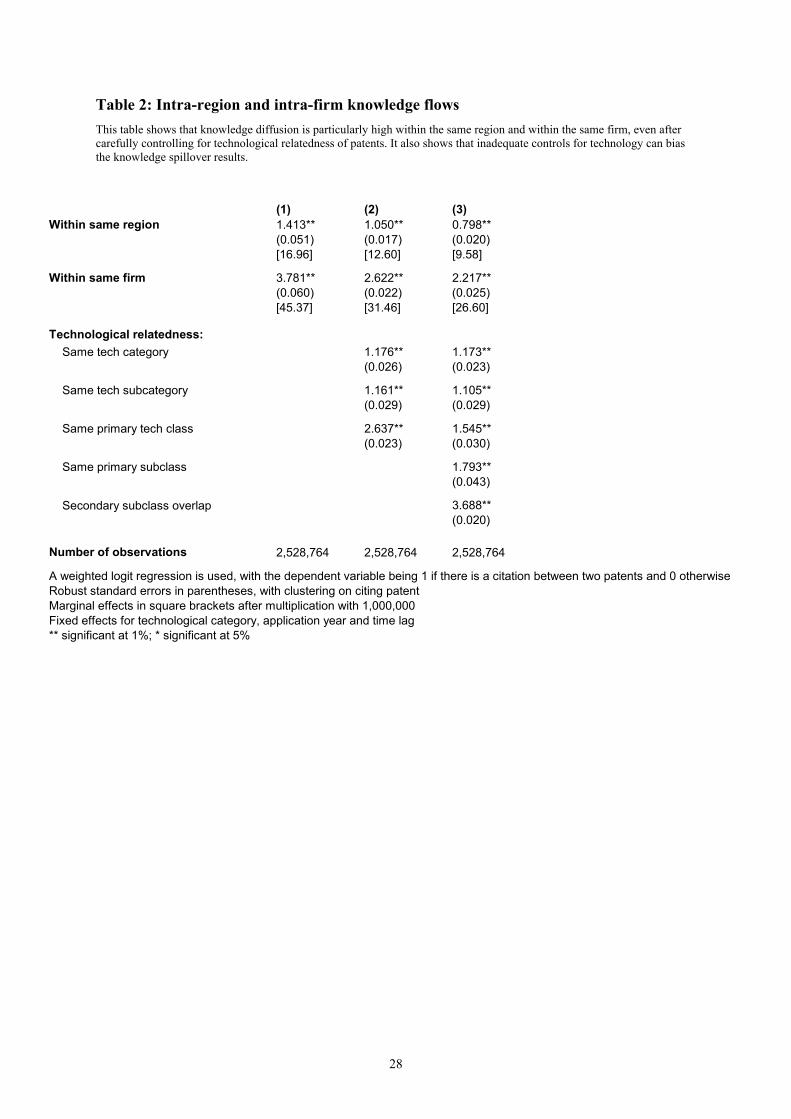
Table 2: Intra-region and intra-firm knowledge flows This table shows that knowledge diffusion is particularly high within the same region and within the same firm, even after carefully controlling for technological relatedness of patents. It also shows that inadequate controls for technology can bias the knowledge spillover results.
(1) (2) (3)Within same region 1.413** 1.050** 0.798**
(0.051) (0.017) (0.020)[16.96] [12.60] [9.58]
Within same firm 3.781** 2.622** 2.217**(0.060) (0.022) (0.025)[45.37] [31.46] [26.60]
Technological relatedness: Same tech category 1.176** 1.173**
(0.026) (0.023)
Same tech subcategory 1.161** 1.105**(0.029) (0.029)
Same primary tech class 2.637** 1.545**(0.023) (0.030)
Same primary subclass 1.793**(0.043)
Secondary subclass overlap 3.688**(0.020)
Number of observations 2,528,764 2,528,764 2,528,764
A weighted logit regression is used, with the dependent variable being 1 if there is a citation between two patents and 0 otherwiseRobust standard errors in parentheses, with clustering on citing patentMarginal effects in square brackets after multiplication with 1,000,000Fixed effects for technological category, application year and time lag ** significant at 1%; * significant at 5%
28

Table 3: Summary statistics An entry in this table represents mean value of the variable for the corresponding row in the subset of the population as indicated in the corresponding column.
Entire sample No self-citations by firmsCitations Controls Citations Controls(N=552,427) (N=1,976,337) (N=349,251) (N=1,881,299)
Common inventor 0.1512 0.0033 0.0132 0.0001(Social distance = 0)
Past collaboration 0.0593 0.0036 0.0079 0.0004(Social distance = 1)
Common past collaborator 0.0343 0.0052 0.0085 0.0011(Social distance = 2)
Indirect social link 0.4024 0.4767 0.5133 0.4775(Social distance > 2 but finite)
Any social link 0.6472 0.4888 0.5429 0.4791
29

Table 4: Effect of social distance on probability of citation between patents This table shows that probability of knowledge diffusion increases as social distance between two teams of inventors decreases, even after technological closeness of teams that are close is accounted for.
(1) (2)
Common inventor 8.820** 4.002**(Social distance = 0) (0.078) (0.060)
[105.84] [48.02]
Past collaboration 6.741** 2.859**(Social distance = 1) (0.162) (0.055)
[80.89] [34.31]
Common past collaborator 5.210** 2.228**(Social distance = 2) (0.089) (0.054)
[62.52] [26.74]
Indirect social link 0.212** 0.151**(Social distance > 2 but finite) (0.019) (0.012)
[2.54] [1.81]
Technological relatedness: Same tech category 1.260**
(0.021)
Same tech subcategory 1.172**(0.026)
Same primary tech class 1.660**(0.027)
Same primary subclass 1.638**(0.048)
Secondary subclass overlap 3.653**(0.021)
Number of observations 2,528,764 2,528,764
A weighted logit regression is used, with the dependent variable being 1 if there is a citation between two patents and 0 otherwiseRobust standard errors in parentheses, with clustering on citing patentMarginal effects in square brackets after multiplication with 1,000,000Fixed effects for technological category, application year and time lag** significant at 1%; * significant at 5%
30

Table 5: Does social distance explain intra-region and intra-firm knowledge flows? This table studies if controlling for social distance helps explain greater intra-region and intra-firm knowledge flows noted in table (3). Column (2) shows that controlling for social distance reduces the within same region and within same firm estimates for probability of patent citation. Column (3) shows that there are important interaction effects, as discussed in the text.
(1) (2) (3)Within same region 0.798** 0.603** 0.697**
(0.020) (0.022) (0.033)[9.58] [7.24] [8.36]
Within same firm 2.217** 1.809** 2.079**(0.025) (0.027) (0.049)[26.60] [21.71] [24.95]
Common inventor 2.096** 4.509**(Social distance = 0) (0.065) (0.245)
Past collaboration 1.017** 2.998**(Social distance = 1) (0.062) (0.177)
Common past collaborator 0.469** 2.382**(Social distance = 2) (0.065) (0.101)
Indirect social link 0.098** 0.147**(Social distance > 2 but finite) (0.013) (0.013)
Within same region * Common inventor -0.714**(0.197)
Within same region * Past collaboration -0.686**(0.124)
Within same region * Common past collaborator -0.700**(0.102)
Within same region * Indirect social link -0.030(0.043)
Within same firm * Common inventor -2.115**(0.199)
Within same firm * Past collaboration -1.748**(0.182)
Within same firm * Common past collaborator -1.747**(0.121)
Within same firm * Indirect social link -0.278**(0.056)
Technological relatedness Y Y Y
Number of observations 2,528,764 2,528,764 2,528,764
A weighted logit regression is used, with the dependent variable being 1 if there is a citation between two patents and 0 otherwiseRobust standard errors in parentheses, with clustering on citing patentMarginal effects in square brackets after multiplication with 1,000,000Fixed effects for technological category, application year and time lag between patents ** significant at 1%; * significant at 5%
Figure 1: Summary of hypotheses (a) Hypotheses 1 and 2:
31

Same region Greater probability of knowledge flow
Same firm
(b) Hypotheses 3 and 4:
Close collaborative links between indivduals
Greater probability of knowledge flow
(c) Hypotheses 5 and 6:
Same regionClose collaborative links between indivduals
Greater probability of knowledge flow
Same firm
Figure 2: An affiliation network
Innovating Team (Patent)Inventor P1 P2 P3 P4 P5 P6 P7
A 1 1 0 0 0 0 0B 1 0 0 1 0 0 0C 0 1 1 0 0 0 0D 0 0 1 0 1 0 0E 0 0 0 0 1 0 1F 0 0 0 0 1 0 0G 0 0 0 0 0 1 1
Year 1986 1987 1988 1989 1989 1989 1990
32
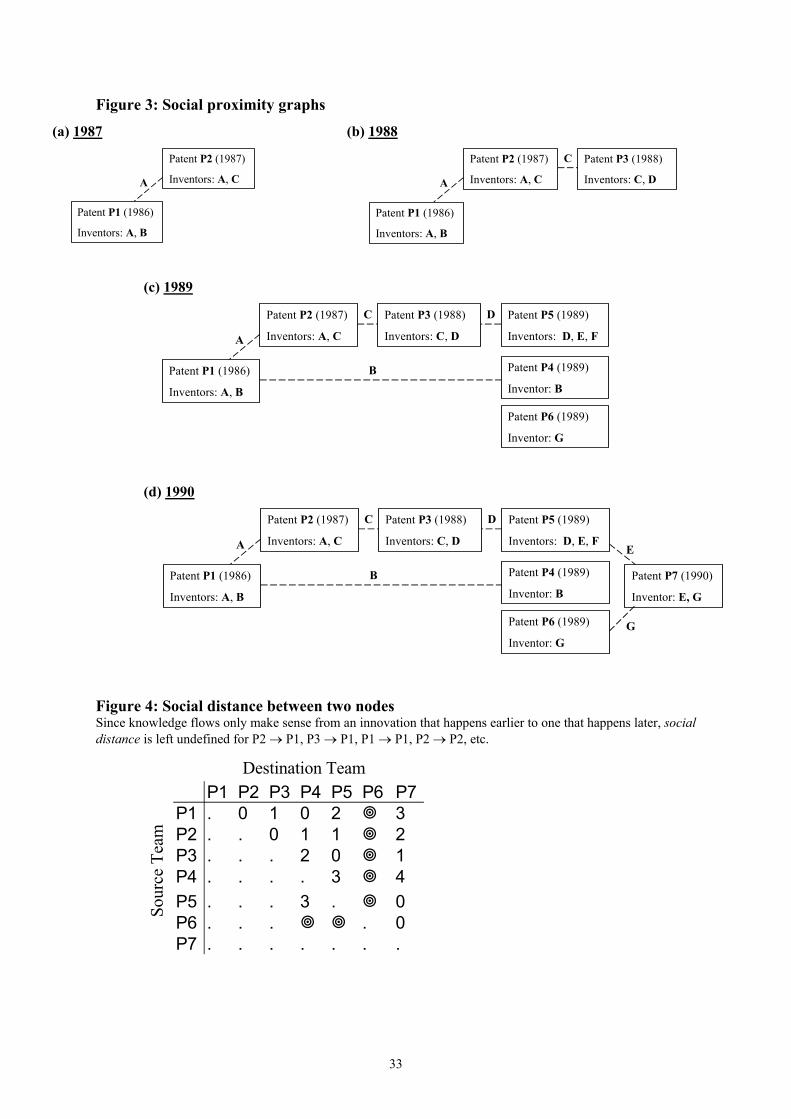
Figure 3: Social proximity graphs
(a) 1987
Patent P2 (1987)
Inventors: A, CA
Patent P1 (1986)
Inventors: A, B
(b) 1988
Patent P2 (1987)
Inventors: A, CA
Patent P1 (1986)
Inventors: A, B
Patent P3 (1988)
Inventors: C, D
C
(c) 1989
Patent P2 (1987)
Inventors: A, CA
Patent P1 (1986)
Inventors: A, B
Patent P3 (1988)
Inventors: C, D
C
Patent P4 (1989)
Inventor: B
Patent P5 (1989)
Inventors: D, E, F
Patent P6 (1989)
Inventor: G
B
D
(d) 1990
Patent P2 (1987)
Inventors: A, CA
Patent P1 (1986)
Inventors: A, B
Patent P3 (1988)
Inventors: C, D
C
Patent P4 (1989)
Inventor: B
Patent P5 (1989)
Inventors: D, E, F
Patent P6 (1989)
Inventor: G
B
D
Patent P7 (1990)
Inventor: E, G
E
G
Figure 4: Social distance between two nodes Since knowledge flows only make sense from an innovation that happens earlier to one that happens later, social distance is left undefined for P2 → P1, P3 → P1, P1 → P1, P2 → P2, etc.
Sour
ce T
eam
Destination TeamP1 P2 P3 P4 P5 P6 P7
P1 . 0 1 0 2 3P2 . . 0 1 1 2P3 . . . 2 0 1P4 . . . . 3 4P5 . . . 3 . 0P6 . . . . 0P7 . . . . . . .
33